


Abstract
Effect-size estimation for Mood’s median test has received relatively little methodological attention despite the test’s widespread use in robust and nonparametric analysis. This study evaluates four candidate effect-size estimators: the median absolute deviation-based estimator (Delta–MAD), the probability of superiority (PS), Cramér’s V, and a newly proposed bootstrap-standardized median difference (Delta-Boot) across simulation settings involving normal data with equal variances, log-normal skewness, and heteroscedasticity with a twofold variance difference. Under equal variances, PS achieved the highest classification accuracy for moderate and large effects, with Delta–MAD and Delta–Boot close behind and Cramér’s V performing worst. Performance under log-normal skewness was nearly unchanged, demonstrating the robustness of median- and rank-based methods to heavy right-tailed distributions. Notably, Delta–Boot began to show improved performance for moderate effect sizes in the log-normal setting. Under heteroscedasticity, estimator behaviour diverged sharply: PS remained highly effective for distinguishing no and large effects but showed reduced accuracy for moderate effects due to its sensitivity to spread differences; Cramér’s V degraded substantially across all effect sizes; and the two median-standardized estimators—especially Delta–Boot—were more resilient, stabilizing more rapidly with increasing sample size and achieving the highest accuracy for moderate and large shifts at larger n. These patterns indicate that PS (or Delta–MAD) is most appropriate when variances are equal or nearly so, whereas Delta–Boot provides the most reliable performance in settings where variance imbalance is likely. Finally, a real-world application to fasting glucose data from the 2024 WHO STEPS survey in Trinidad and Tobago illustrates the practical utility of these approaches.
Keywords:
Mood’s median test; effect-size estimation; probability of superiority; Cramer’s V; median absolute deviation (MAD); bootstrap standardization MSC:
62G10
1. Introduction
Effect size serves as a critical quantitative measure that reflects the magnitude of an experimental effect or the strength of a relationship between variables. While p-values indicate whether an observed difference is likely due to chance, they are heavily influenced by sample size and do not communicate the practical significance of the findings [1]. In contrast, effect size provides a standardized metric that allows researchers to assess the clinical or practical importance of their results, facilitating a clearer interpretation of data beyond simple statistical significance [2,3].
The importance of reporting effect sizes in academic research cannot be overstated. It enables the comparison of results across different studies, supporting the synthesis of evidence in meta-analyses and ensuring that findings are transferable across various contexts [4]. Within the framework of nonparametric analysis, reporting effect sizes alongside significance testing provides a more complete picture of the data’s impact, which is particularly vital in fields where small but statistically significant differences may have negligible real-world consequences [5].
In addition to these general considerations, the broader landscape of contemporary applied research increasingly involves data structures that are complex, heterogeneous, and often far from normally distributed. Recent developments across biomedical, engineering, and machine learning applications have highlighted the growing importance of robust, distribution-free statistical methods [6].
In the contemporary applied research, complex and non-normally distributed and high-dimensional statistical analyses are taking on increased importance due to the biomedical, engineering, and artificial-intelligence applications. Recent studies on clinical pharmacology have emphasized the role of strict statistical inference and equivalence trials in biosimilar trials, in which accurate quantification of the effects is necessary during both regulatory and medical decision-making [7]. Likewise, computational biomechanics research shows that the complex models of traumatic brain injury demand strong statistical software that could process heterogeneous data of the in vivo and in silico experiments [8]. Simultaneously, the accelerated growth of modern distribution-free methods of learning, including multiple-output quantile regression neural networks, also indicates the increased movement towards robust and nonparametric statistical modelling [6]. All these developments together point to the increasing need to ensure the demand of strong and interpretable measures of effect sizes which can be depended on even when classical parametric assumptions are not met.
Furthermore, effect size is an essential component in conducting power analyses, as it assists researchers in determining the minimum sample size required to detect a meaningful effect [9]. However, researchers must exercise caution when applying standard measures like Cohen’s d to non-normal or heteroscedastic data, as the relationship between the effect size and the actual overlap of distributions can become unreliable under these conditions [3]. In such cases, nonparametric estimates of effect size offer a more robust alternative, as they do not rely on stringent distributional assumptions and are often more descriptive of the underlying data behaviour [10].
While effect-size approaches have been extensively developed for several parametric methods, such as t-tests and ANOVA, there remains a notable paucity of the literature regarding standardized effect-size reporting for many nonparametric procedures [5]. This paper aims to address this gap by specifically studying effect-size estimation for Mood’s median test.
Introduced by Mood [11], the median test is a nonparametric procedure designed to test the null hypothesis that two or more independent samples are drawn from populations with identical medians. By dichotomizing data based on a pooled median and utilizing a contingency table framework to analyse the distribution of observations above and below that value, it provides a robust alternative to parametric tests, particularly when data are skewed or contain outliers. The methodology was expanded by Brown and Mood [12] to accommodate linear hypotheses. While early work by Mood [13] focused on the theoretical underpinnings of the test, specifically its asymptotic efficiency in two-sample contexts, subsequent developments sought to relax the rigid assumptions inherent in classical nonparametric procedures.
A significant departure from the standard approach was provided by Fligner and Rust [14], who modified the test to allow for the comparison of medians without the restrictive assumption of identical population shapes. This modification addressed the generalized Behrens–Fisher problem, marking a shift toward greater robusticity in nonparametric estimation. In contrast to these focus areas on distribution shapes, Chen [15] extended the test’s utility into the temporal domain by developing an application for survival data. Further syntheses by Cramer [16] and Desu and Raghavarao [17] have since standardized the test for applied social research and the analysis of censored data.
The most recent stage of development involves the integration of neutrosophic logic [18] to overcome the limitations of classical statistics in the presence of uncertainty. Recognizing that experimenters often encounter indeterminate data that classical tests cannot process, Al Aita et al. [19] introduced the neutrosophic Mood median test. This generalization utilizes neutrosophic statistics to define hypotheses and decision rules for imprecise data, providing a more informative and flexible analytical framework than previous determinate models.
Ricca and Blaine [10] proposed an alternative effect-size measure designed to function as a robust analogue to Cohen’s d, utilizing median absolute deviation (MAD) rather than standard deviation. Although this metric was not originally developed specifically for Mood’s median test, its reliance on the difference between group medians makes it highly compatible with the test’s underlying logic. Recognizing this alignment, Mangiafico [20] utilized this approach in the computation of effect sizes for Mood’s median test, providing a practical method for quantifying differences in central tendency that remains resilient to the influence of outliers and non-normal distributions.
Building on the established need for robust nonparametric measures, another compelling candidate for estimating effect size in Mood’s median test is the probability of superiority, as discussed by Peres [5]. This metric is traditionally utilized following the Mann–Whitney U test to quantify the likelihood that a randomly selected value from one group will be greater than a randomly selected value from another. Given that Mood’s median test is fundamentally based on a contingency table and the chi-squared test of independence, Cramer’s V emerges as a natural candidate for an effect-size measure. By transforming the statistic into a standardized value between 0 and 1, Cramer’s V provides a metric for the strength of the association between the grouping variable and the distribution of observations around the pooled median.
Taken together, the existing literature demonstrates substantial progress in extending Mood’s median test and in developing robust nonparametric approaches to inference. However, much of this prior work has focused on hypothesis testing rather than on quantifying the magnitude of group differences. In particular, although effect-size measures such as Cramer’s V, the probability of superiority, and MAD-standardized median differences appear in related contexts, their performance has not been systematically compared under conditions aligned with Mood’s median test. This gap is especially important in modern applications where violations of normality and homoscedasticity are common, and robust measures of practical significance are needed.
To our knowledge, no study has specifically focused on the estimation of effect size following Mood’s median test, nor has a simulation study been performed to compare these potential candidate measures. Although Ricca and Blaine [10] evaluated their proposed median-based estimator under non-normal data conditions, their study did not investigate performance under heteroscedasticity, a setting in which even robust estimators may behave differently due to variance imbalance. This paper seeks to fill this methodological gap by conducting a rigorous simulation study to evaluate the performance of the aforementioned estimators.
Furthermore, we propose a novel effect-size estimation method that builds upon the framework of the median absolute deviation-based approach of Ricca and Blaine [10]. While the traditional MAD-based metric is resilient to outliers, our proposed measure incorporates a standard deviation derived from bootstrapping.
The rest of the paper is organized as follows. Section 2 presents the methodological framework, including a review of Mood’s median test and the four effect-size estimators considered, as well as the proposed Delta–Boot estimator. Section 3 describes the simulation design, scenarios, and evaluation criteria and reports the results across normal, log-normal, and heteroscedastic settings. Section 4 applies the estimators to empirical data from the 2024 WHO STEPS survey in Trinidad and Tobago. Section 4 also discusses the implications of the findings, and Section 5 concludes with recommendations and directions for future research.
2. Materials and Methods
2.1. Mood’s Median Test
Mood’s median test is a nonparametric procedure for assessing whether two (or more) independent samples share a common population median. Consider two independent random samples
drawn from continuous populations with medians and , respectively. Let be the total sample size. We test the null hypothesis
Let denote the grand median of the pooled sample Classify each observation as “above” or “at/below” . This yields the table
where and .
Under (equal medians and continuity), membership in “above” vs. “at/below” is independent of sample label. Consequently, the number of Sample 1 observations above the grand median, follows a hypergeometric distribution with
For large with , is asymptotically normal and the standardized statistic
is approximately standard normal.
Equivalently, one may test using the Pearson chi-square statistic for the table:
which, for a table, is algebraically equal to the compact determinant-based expression
Under , (one degree of freedom).
The grand median is computed from the pooled sample; ties at can be handled by assigning them to the “at/below” cell (default) or by splitting them evenly, with negligible impact asymptotically. The chi-square formulation is the standard implementation used by statistical software and is numerically equivalent to the large-sample Z test derived from the hypergeometric model. Extensions to more than two groups proceed analogously by forming a table and using a test.
2.2. Effect Size for Mood’s Median Test
2.2.1. Cramer’s V
Because Mood’s median test is operationally equivalent to performing a Pearson test on a contingency table formed by classifying observations as “above” or “at/below” the pooled median, a natural and widely accepted effect-size measure for this test is Cramér’s V. Cramér’s V is a normalized measure of association between two nominal variables and is based directly on the Pearson statistic produced by the test [21]. It is defined for any contingency table and takes values in the interval , where 0 indicates no association and 1 indicates perfect association.
For a contingency table with r rows and k columns, Cramér’s V is defined as
where is the Pearson chi-square statistic from the table. N is the total sample size, and is the appropriate normalizing factor.
In the special case of a table, which is the structure generated by Mood’s median test, and Cramér’s V reduces to the absolute value of the coefficient:
Because Mood’s median test categorizes observations relative to the pooled median, Cramér’s V here quantifies the strength of the association between group membership and being above (or below) the pooled median. Thus, it is an effect size reflecting how strongly the distributional shift between groups is concentrated around the median. Values near 0 indicate that the proportions of observations above the median are similar across groups, whereas values closer to 1 indicate a stronger divergence in these proportions.
Standard heuristic guidelines for classifying effect size [2] from Cramer’s V for a table are
These should be interpreted as rough conventions rather than absolute thresholds, and context is critical when judging practical significance.
Although Cramer’s V is a natural candidate for Mood’s median test because it is derived directly from the Pearson statistic of the associated contingency table, it is important to emphasize that Cramer’s V measures association rather than a shift in central tendency. Unlike the median-based estimators considered in this study, Cramer’s V does not quantify the magnitude of a median difference; instead, it reflects the strength of association between group membership and being above or below the pooled median.
2.2.2. Probability of Superiority (PS)
A widely used nonparametric measure of effect size is the PS, also known as the common language effect size. In the two-sample setting, it is defined as the probability that a randomly selected observation from group 1 exceeds a randomly selected observation from group 2. Formally,
a formulation that appears as the effect size is associated with the Mann–Whitney U test and is standardized through the Vargha–Delaney A statistic.
The Mann–Whitney effect size is computed directly from the U statistic:
where is the total number of pairwise comparisons between the two independent samples. The interpretation is straightforward:
after ties are handled by assigning half-weight. Thus, A provides a simple probability-based measure indicating how often group 1 produces larger values than group 2. Values near indicate minimal difference; values above indicate that group 1 tends to produce larger observations; and values below indicate the reverse. The suggested thresholds [5] for this estimator are
Although Mood’s median test does not use the full rank information incorporated into the Mann–Whitney U statistic, the conceptual interpretation underlying the probability of superiority remains highly relevant [20].
2.2.3. Median-Based Effect Size
A third approach to quantifying effect magnitude following Mood’s median test is to consider a median-centred analogue of the standardized mean difference. This idea originates from the broader nonparametric literature on robust effect-size estimation, where the difference in medians, rather than means, serves as the core measure of location shift. Ricca and Blaine [10] proposed a compelling nonparametric estimator of effect size that replaces the standard deviation, which is highly sensitive to non-normality and outliers, with the median absolute deviation, a robust dispersion statistic with a breakdown point of 0.5 [10]. Because Mood’s median test explicitly targets differences in median rather than mean, an MAD-standardized median difference aligns naturally with the logic of the test.
In the Ricca–Blaine framework, the effect size is defined as
where the pooled MAD is computed as
Henceforth, we shall refer to this estimator as Delta-MAD. This effect size behaves analogously to Cohen’s d [10], but with two crucial advantages. The numerator (the median difference) and the denominator (the MAD) are robust to distributional irregularities, including skewness and outliers. As Ricca and Blaine [10] demonstrate through extensive simulations, Delta-MAD is markedly less biased than Cohen’s d under contamination and performs consistently well even when classical assumption of normality fails.
2.2.4. Proposed Estimator: Delta-Boot
The MAD-based estimator discussed above offers a robust, distribution-free alternative to Cohen’s d by standardizing the median difference using a dispersion measure with a high breakdown point. However, one natural limitation of Delta-MAD is that it treats the median absolute deviation as the analogue of the standard deviation, even though the two quantities measure dispersion in fundamentally different ways. Although this distinction is conceptually appropriate from a nonparametric perspective, there are situations, particularly when distributions differ moderately from symmetry, where a standard deviation-like quantity may provide an intuitive interpretation for practitioners familiar with Cohen’s d.
To address this, we propose a new effect-size estimator that retains the median-based numerator of but replaces the MAD denominator with a bootstrapped standard deviation computed from the pooled sample. Specifically, let
denote the absolute median difference. We generate B bootstrap resamples from the pooled sample , compute the standard deviation for each resample, and let
denote the average of these bootstrapped standard deviations. Our proposed effect size is then
The logic behind this formulation closely parallels the motivation of the Ricca and Blaine [10] nonparametric estimator. By retaining the median as the measure of location shift, the numerator remains robust to skewness and outliers, addressing precisely the challenges identified in the Mood’s median test literature [13]. At the same time, the denominator uses a bootstrapped estimate of standard deviation from the pooled sample, providing a stable and distribution-flexible estimate of variability without relying on parametric assumptions such as normality or homoscedasticity.
Conceptually, the interpretation of Delta-Boot mirrors that of Cohen’s d. It expresses the magnitude of the difference in central location in standard deviation units. Thresholds similar to Cohen’s may therefore be used as rough guidelines, though simulation work remains necessary to refine these conventions and evaluate small-sample behaviour.
Mood’s median test is a nonparametric test specifically designed for situations where the assumptions required for parametric analysis are not met. To determine the most appropriate analytical framework, two basic diagnostic tests are reviewed below.
2.2.5. Diagnostic Evaluation of Statistical Assumptions
The Shapiro–Wilk Test for Normality
The Shapiro–Wilk test is used to evaluate the distributional shape of the data. It tests the null hypothesis that a sample comes from a normally distributed population. In many research contexts, data may be skewed or influenced by outliers, causing it to deviate from the traditional “bell curve.” Since parametric tests rely on the symmetry of the normal distribution to produce accurate results, identifying significant departures from this shape is a critical step in selecting a robust alternative that can handle non-normal data without losing validity.
Levene’s Test for Homogeneity of Variance
Levene’s test is employed to assess whether different study groups possess an equal level of internal variation or “spread.” This property, known as homogeneity of variance, is a common requirement for comparing group centres. By utilizing a version of the test centred at the median, the analysis remains resilient against the influence of extreme values. This ensures that any observed differences between groups are reflective of their central tendencies rather than simply a byproduct of unequal variability between the samples.
In both diagnostic tests, a small p-value (typically ) results in the rejection of the null hypothesis, indicating that the data is either significantly non-normal or characterized by unequal variances, thereby necessitating the use of more robust nonparametric methods.
3. Results
3.1. Simulation Study
A simulation study was conducted to evaluate the performance of the candidate effect-size measures for Mood’s median test. In the simulation scenarios which follow, the four effect-size estimators—Delta-MAD, PS, Delta-Boot, and Cramer’s V—were computed, and their ability to correctly classify the true underlying effect was recorded. The sample sizes () were used and we conducted 1000 Monte Carlo iterations.
3.1.1. Scenario A
In this scenario, we examined the effect-size estimators behaviour under ideal parametric conditions, namely, when the data satisfied both normality and homoscedasticity. Two independent populations were specified with a fixed standard deviation and systematically varied mean shifts to generate predefined effect magnitudes. The simulation design was as follows. The control group was generated from
and the treatment group from
Here, X denotes the control group and Y denotes the treatment group. The objective of this component of the study was to estimate the proportion of simulation replicates in which each effect-size estimator correctly classified the underlying effect magnitude. To represent no, moderate, and large effects, the parameter was set to 0, 1.2, and 2, respectively. Here, denotes the mean shift between groups and is directly interpretable as the standardized mean difference, making it equivalent to Cohen’s d under these distributional conditions.
3.1.2. Scenario B
To assess robustness under deviations from normality, a second simulation scenario was constructed in which data were sampled from log-normal distributions. This setting introduces substantial right skewness and heavier tails, thereby functioning as a stress test for the candidate effect-size estimators. Such conditions are known to degrade the performance of traditional mean-based measures, most notably Cohen’s d, because the mean is no longer representative of central tendency, and the standard deviation becomes highly sensitive to skewness and extreme values. The populations were defined on the log scale with matched dispersion parameters and systematic shifts in the location parameter to encode increasing effect magnitudes. Specifically, the control group was sampled from
while the treatment group was sampled from
The log-scale shifts were assigned as follows:
- None: =
- Moderate: =
- Large: =
corresponding to no, moderate, and large effects, respectively, consistent with the definitions used in the preceding scenarios.
This scenario enables an explicit evaluation of how well each estimator maintains classification accuracy when confronted with strong distributional asymmetry, conditions under which Mood’s median test is particularly appealing due to its median-based logic and resistance to the influence of outliers.
3.1.3. Scenario C
To further evaluate the resilience of the candidate effect-size estimators, a third simulation scenario examined their performance under heteroscedasticity, a common violation of classical parametric assumptions in applied research. While Scenarios A and B focused on ideal conditions and distributional skewness, respectively, this scenario introduces unequal variances across groups to assess how robust each estimator remains when dispersion differs substantially between the control and treatment populations.
Data were sampled from normal distributions with unequal variances (1:2 variance ratio) as follows:
The effect magnitude was encoded by shifting the treatment mean by
corresponding to no, moderate, and large effects, respectively, consistent with the definitions used in the preceding scenarios.
All statistical simulations and data analyses were conducted in the R (version 4.4.3) programming environment. For the bootstrap procedure, we used resamples, a value selected on the basis of a convergence assessment demonstrating that the bootstrap standard deviation stabilized well before this threshold. A custom R function was written to perform each simulation scenario.
3.1.4. Effect-Size Thresholds and Classification Procedure
For comparability across estimators, each simulation scenario was evaluated using the same categorical thresholds for defining no, moderate, and large effects as those introduced in the preceding section. Specifically, each scenario was generated with a known underlying effect magnitude corresponding to one of these three categories.
To assess estimator performance, we classified each simulated estimate according to its position relative to the appropriate threshold system for that estimator. For example, PS uses the conventional cut points of 0.56 (small), 0.64 (moderate), and 0.71 (large), whereas the Delta-MAD and Delta-Boot estimators follow Cohen-style standardized difference thresholds. Cramer’s V was evaluated using the commonly applied 0.10, 0.30, and 0.50 breakpoints.
For each estimator, a correct classification was recorded whenever the estimated effect size fell within the threshold category that matched the true effect size used to generate the data in that simulation run. The proportion of correct classifications reported in Table 1 and Table 2 therefore represents the percentage of Monte Carlo iterations (out of 1000) in which an estimator correctly identified the effect as none, moderate, or large under the known simulation condition.
Table 1.
Simulation results: Estimator performance under normal and log-normal distributions.
For each estimator, effect-size classification was based on fixed, pre-specified thresholds consistent with those recommended in the literature. In particular, PS used the thresholds proposed by Peres [5], while the Delta-MAD and Delta-Boot estimators used Cohen-style cut points, and Cramer’s V used conventional association thresholds [2]. For PS, the classification rule is asymmetric because the probability scale is bounded below by 0.5, and departures from 0.5 occur in only one direction. Ties were handled using the default behaviour of the wilcox.test() function in R, version 4.4.3 which assigns half weight to tied comparisons. Thresholds were established in advance and were not data-driven.
Table 2.
Simulation results: Estimator performance under heteroscedastic variances.
To ensure reproducibility, we explicitly describe the computational steps used to obtain the proposed estimator. For each simulation replicate, we generated bootstrap resamples drawn with replacement from the pooled sample containing both groups. For each resample, a dispersion estimate was computed, and the denominator of was then defined as the mean of these B bootstrap dispersion values. No bias correction was applied to the bootstrap distribution.
3.1.5. Stability Estimation
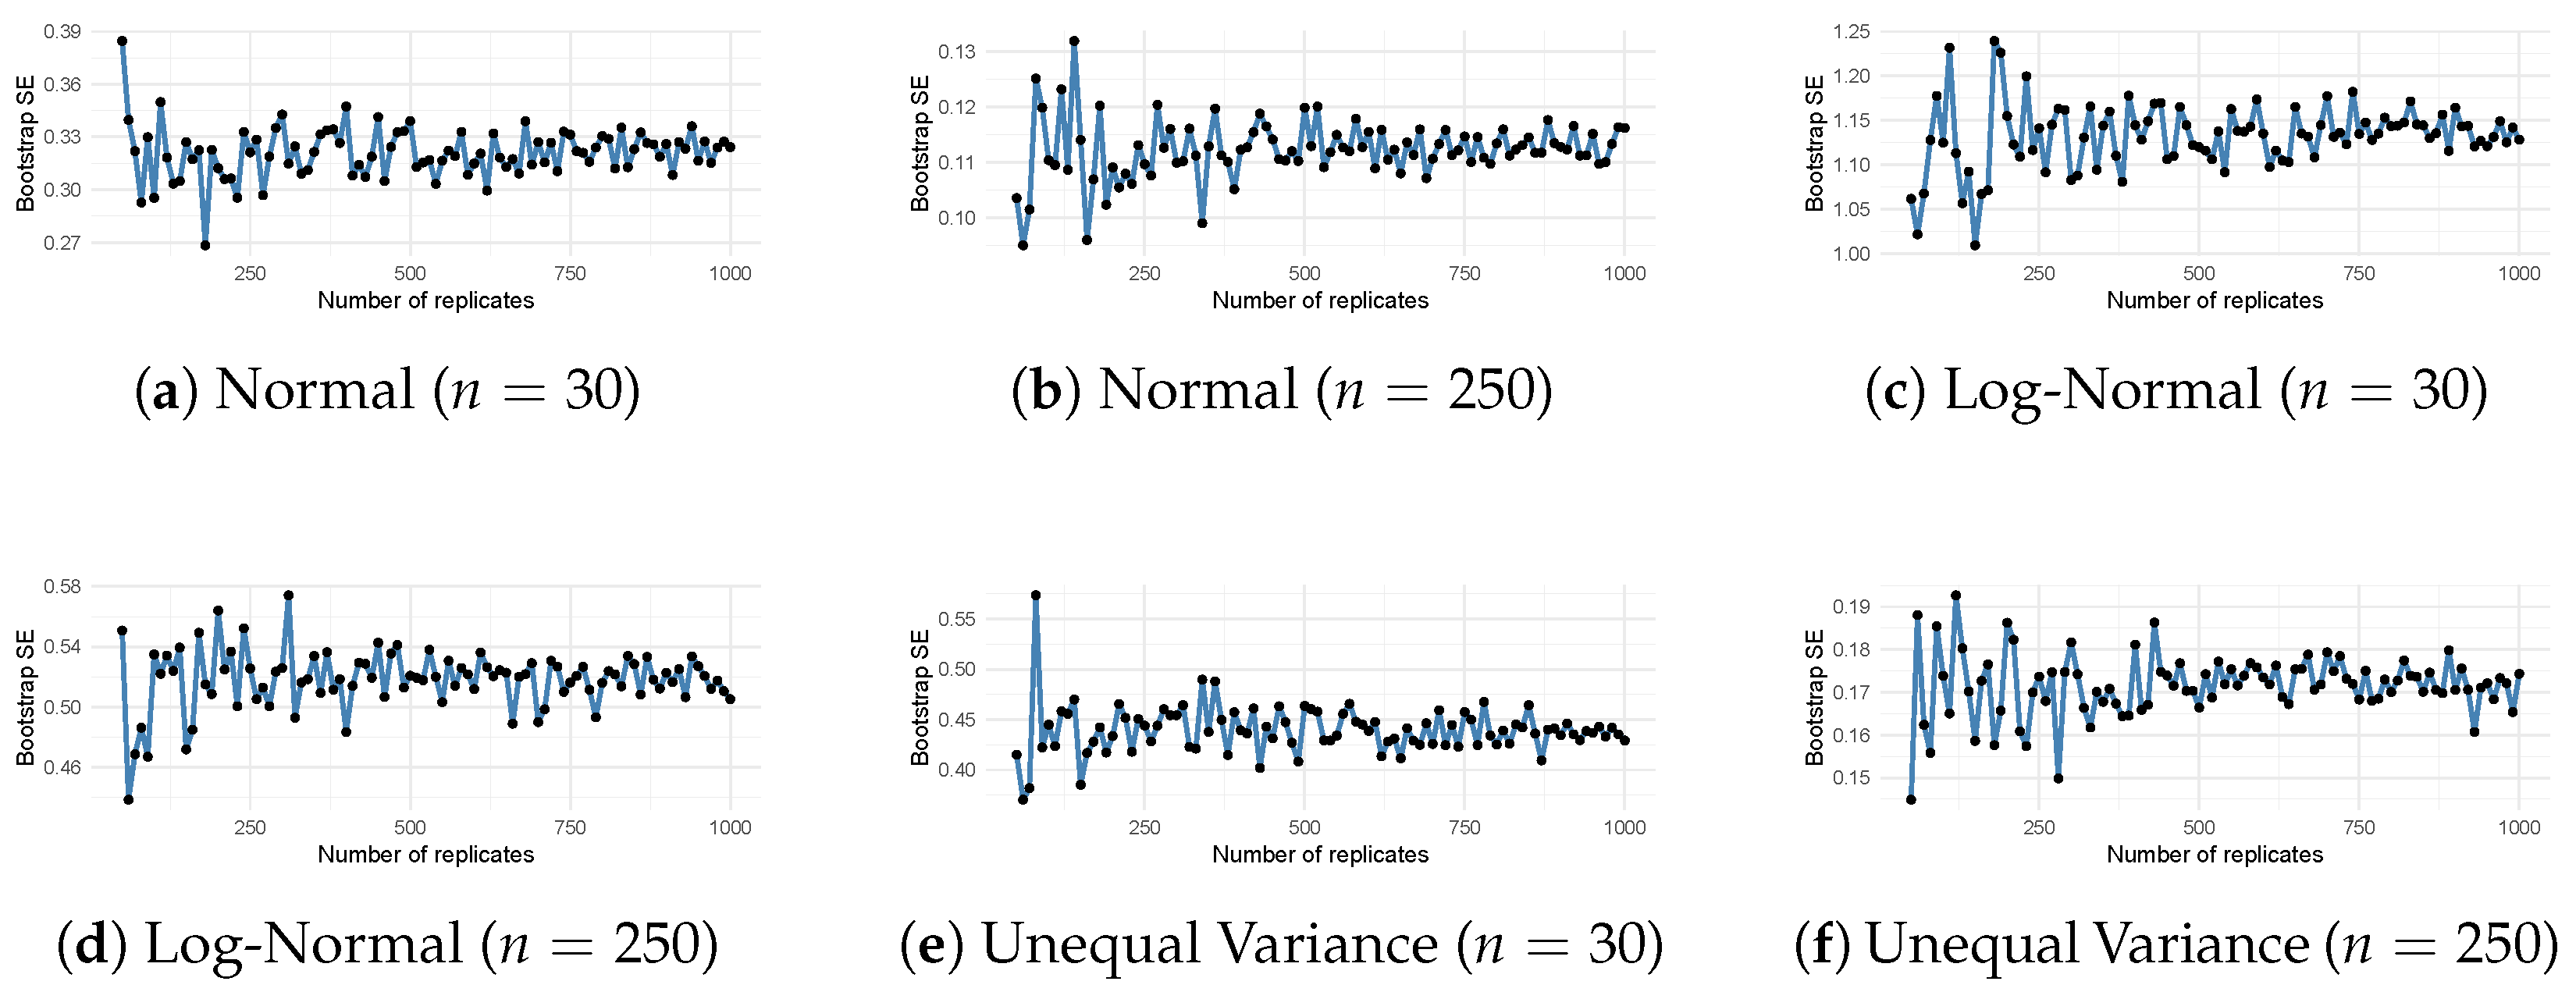
To ensure the reliability of the proposed Mood’s median bootstrap approach, we conducted a preliminary convergence and sensitivity study across six distinct data environments (Figure 1). We evaluated the stability of the bootstrap standard error under conditions of small sample size (), heavy skewness (log-normal distribution), and heteroscedasticity (1:4 variance ratio). Across all scenarios, the bootstrap estimates reached a stable convergence threshold between and . To ensure maximum precision and minimize Monte Carlo error in the main simulation study, we conservatively adopted replicates with replacement.
Figure 1.
Bootstrap convergence analysis of the standard deviation for Mood’s median test. Each panel illustrates the stability of the estimate as the number of bootstrap replicate (B) increases under varying conditions of sample size, skewness, and variance.
Across Scenarios A (normal) and B (lognormal), estimator performance improved monotonically with sample size, and the dispersion of estimates (SD) decreased accordingly (Table 1). Under equal variances, in the normal case, both median-standardized estimators and the rank-based PS exhibited high classification accuracy for large effects, while Cramer’s V lagged in the moderate-effect regime. For the large effect, accuracy increased sharply with n for all estimators. At , PS achieved the highest classification accuracy (), followed by Delta-MAD (), Delta-Boot (), and Cramer’s V (). At , the ordering persisted (PS > Delta-MAD > Delta-Boot > Cramer’s V ); at , all methods remained informative but with reduced accuracy (PS , Delta-MAD , Delta-Boot , Cramer’s V ). For the moderate effect at , PS again led (), with Delta-Boot () and Delta-MAD () close behind, and Cramer’s V lower (). For the none condition, correct “none” classification was near-ceiling at for PS () and Cramer’s V (), with strong performance for Delta-MAD () and Delta-Boot () as well.
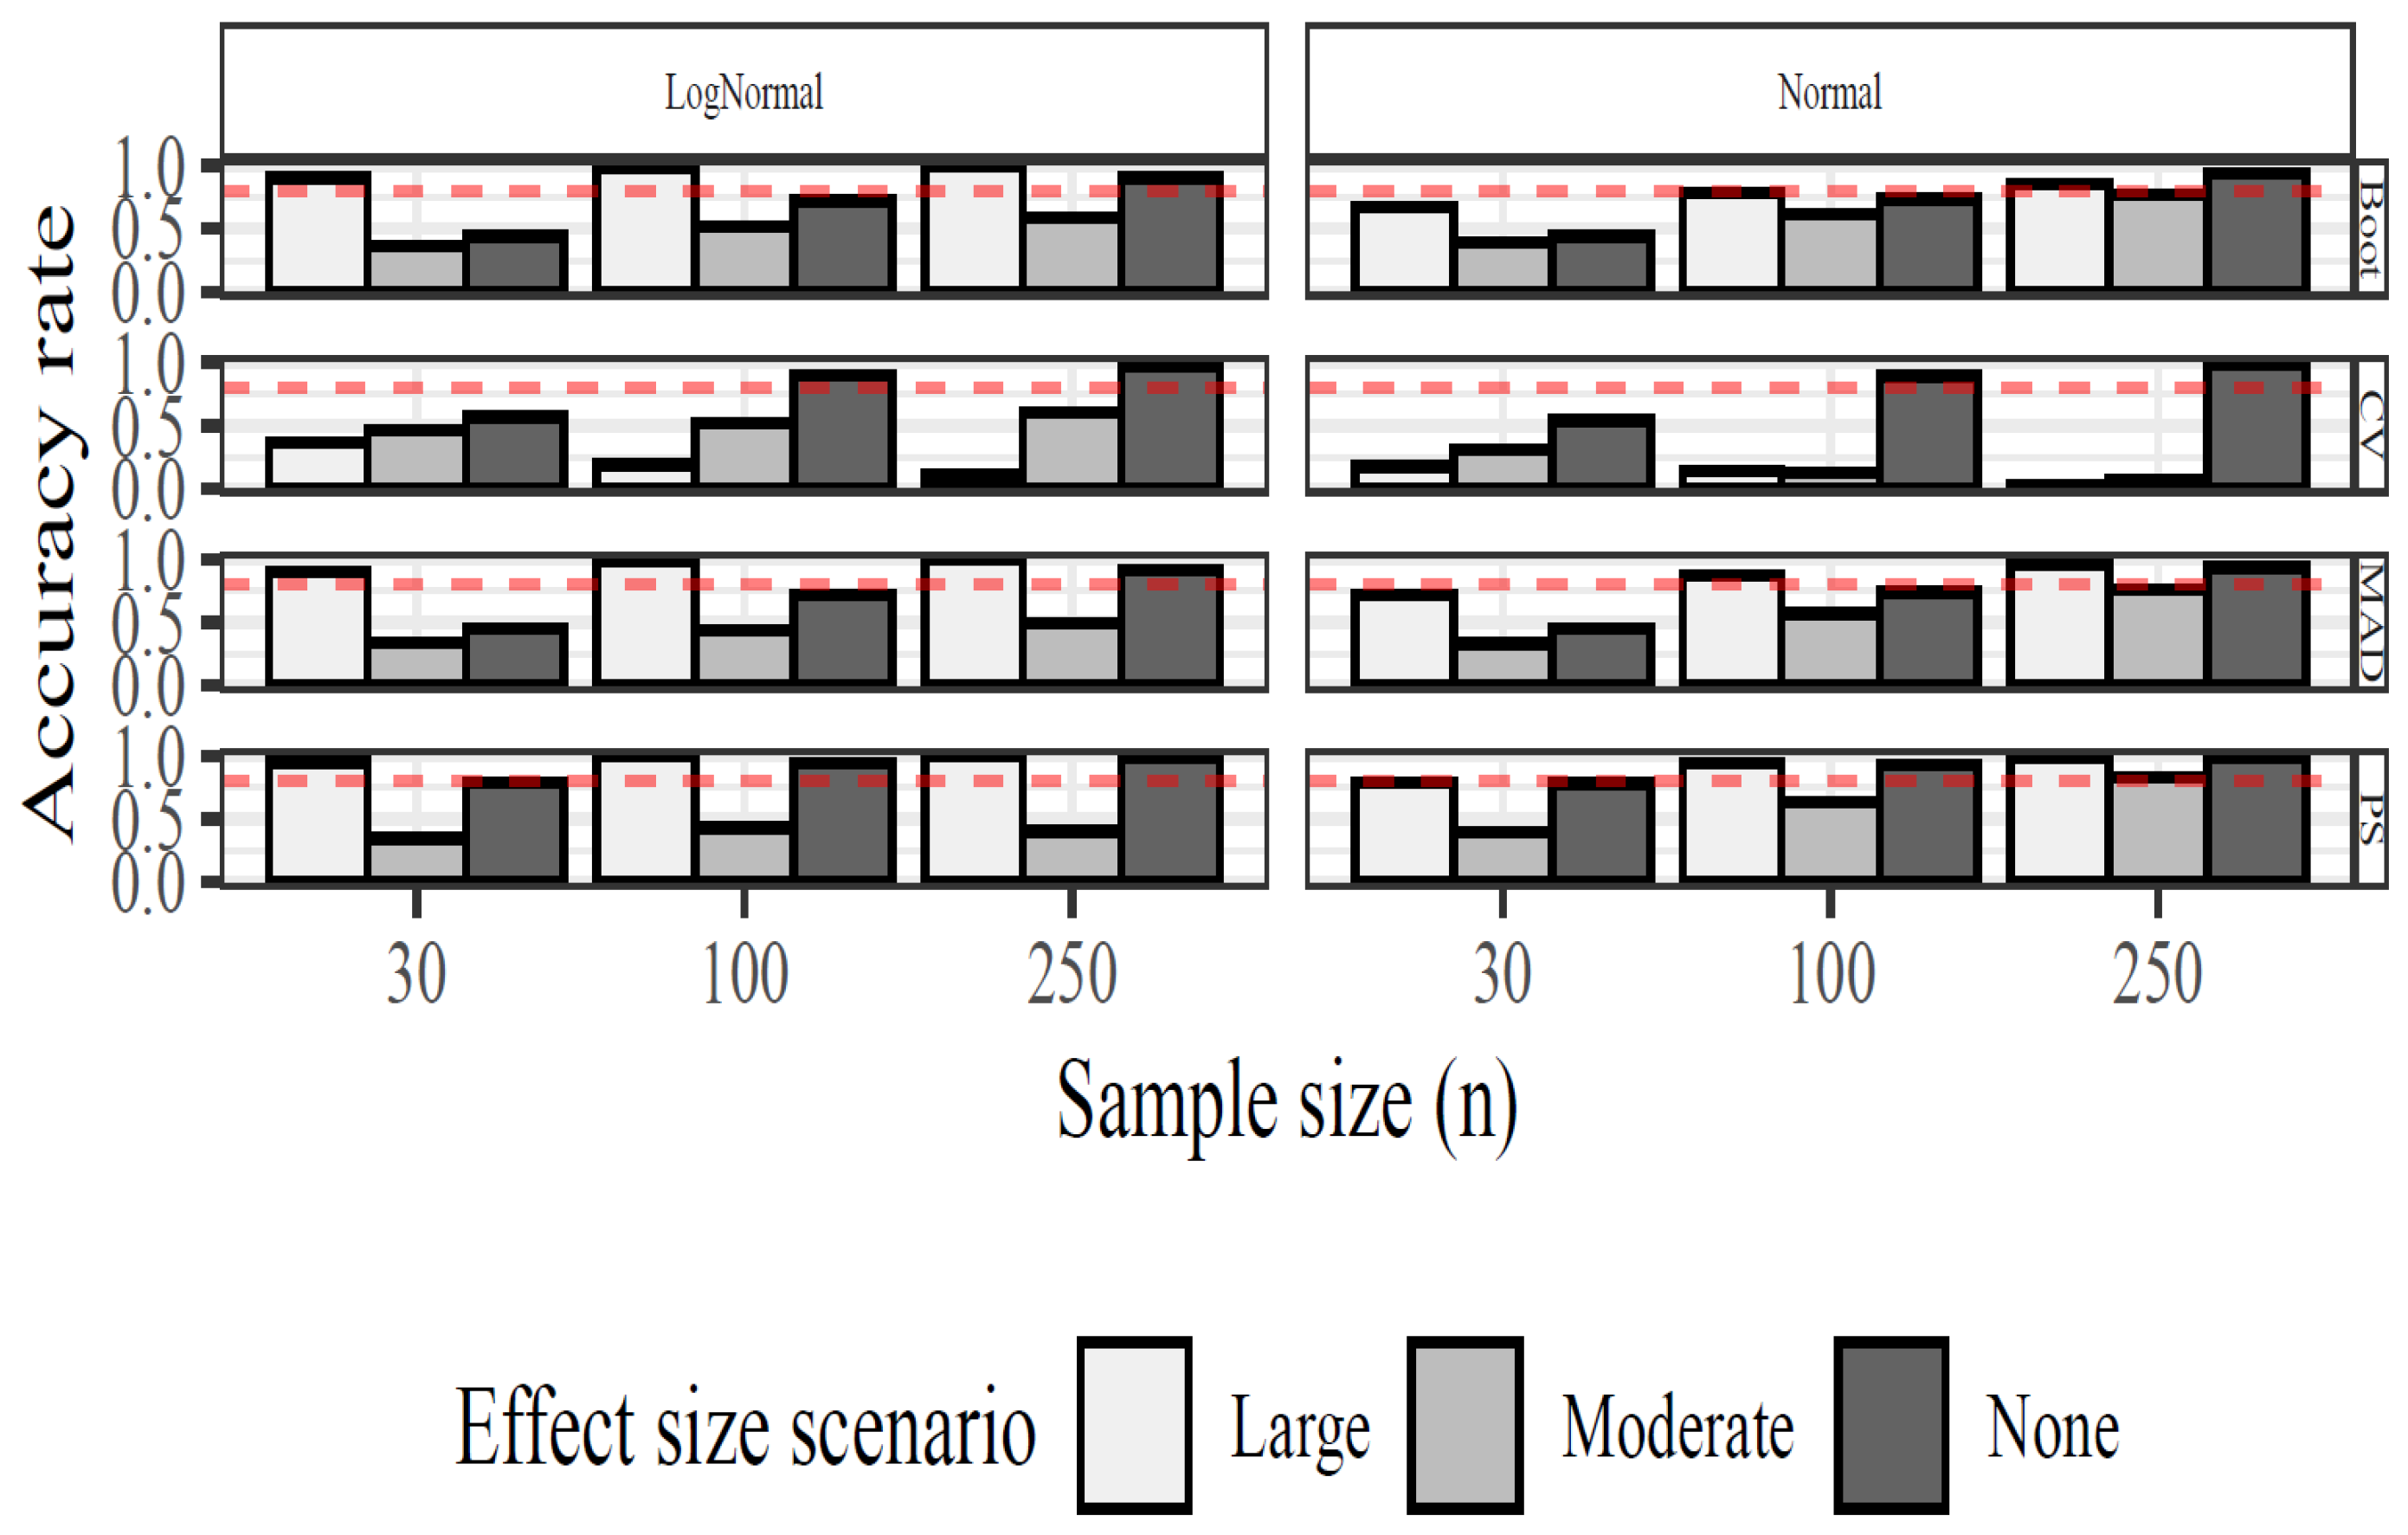
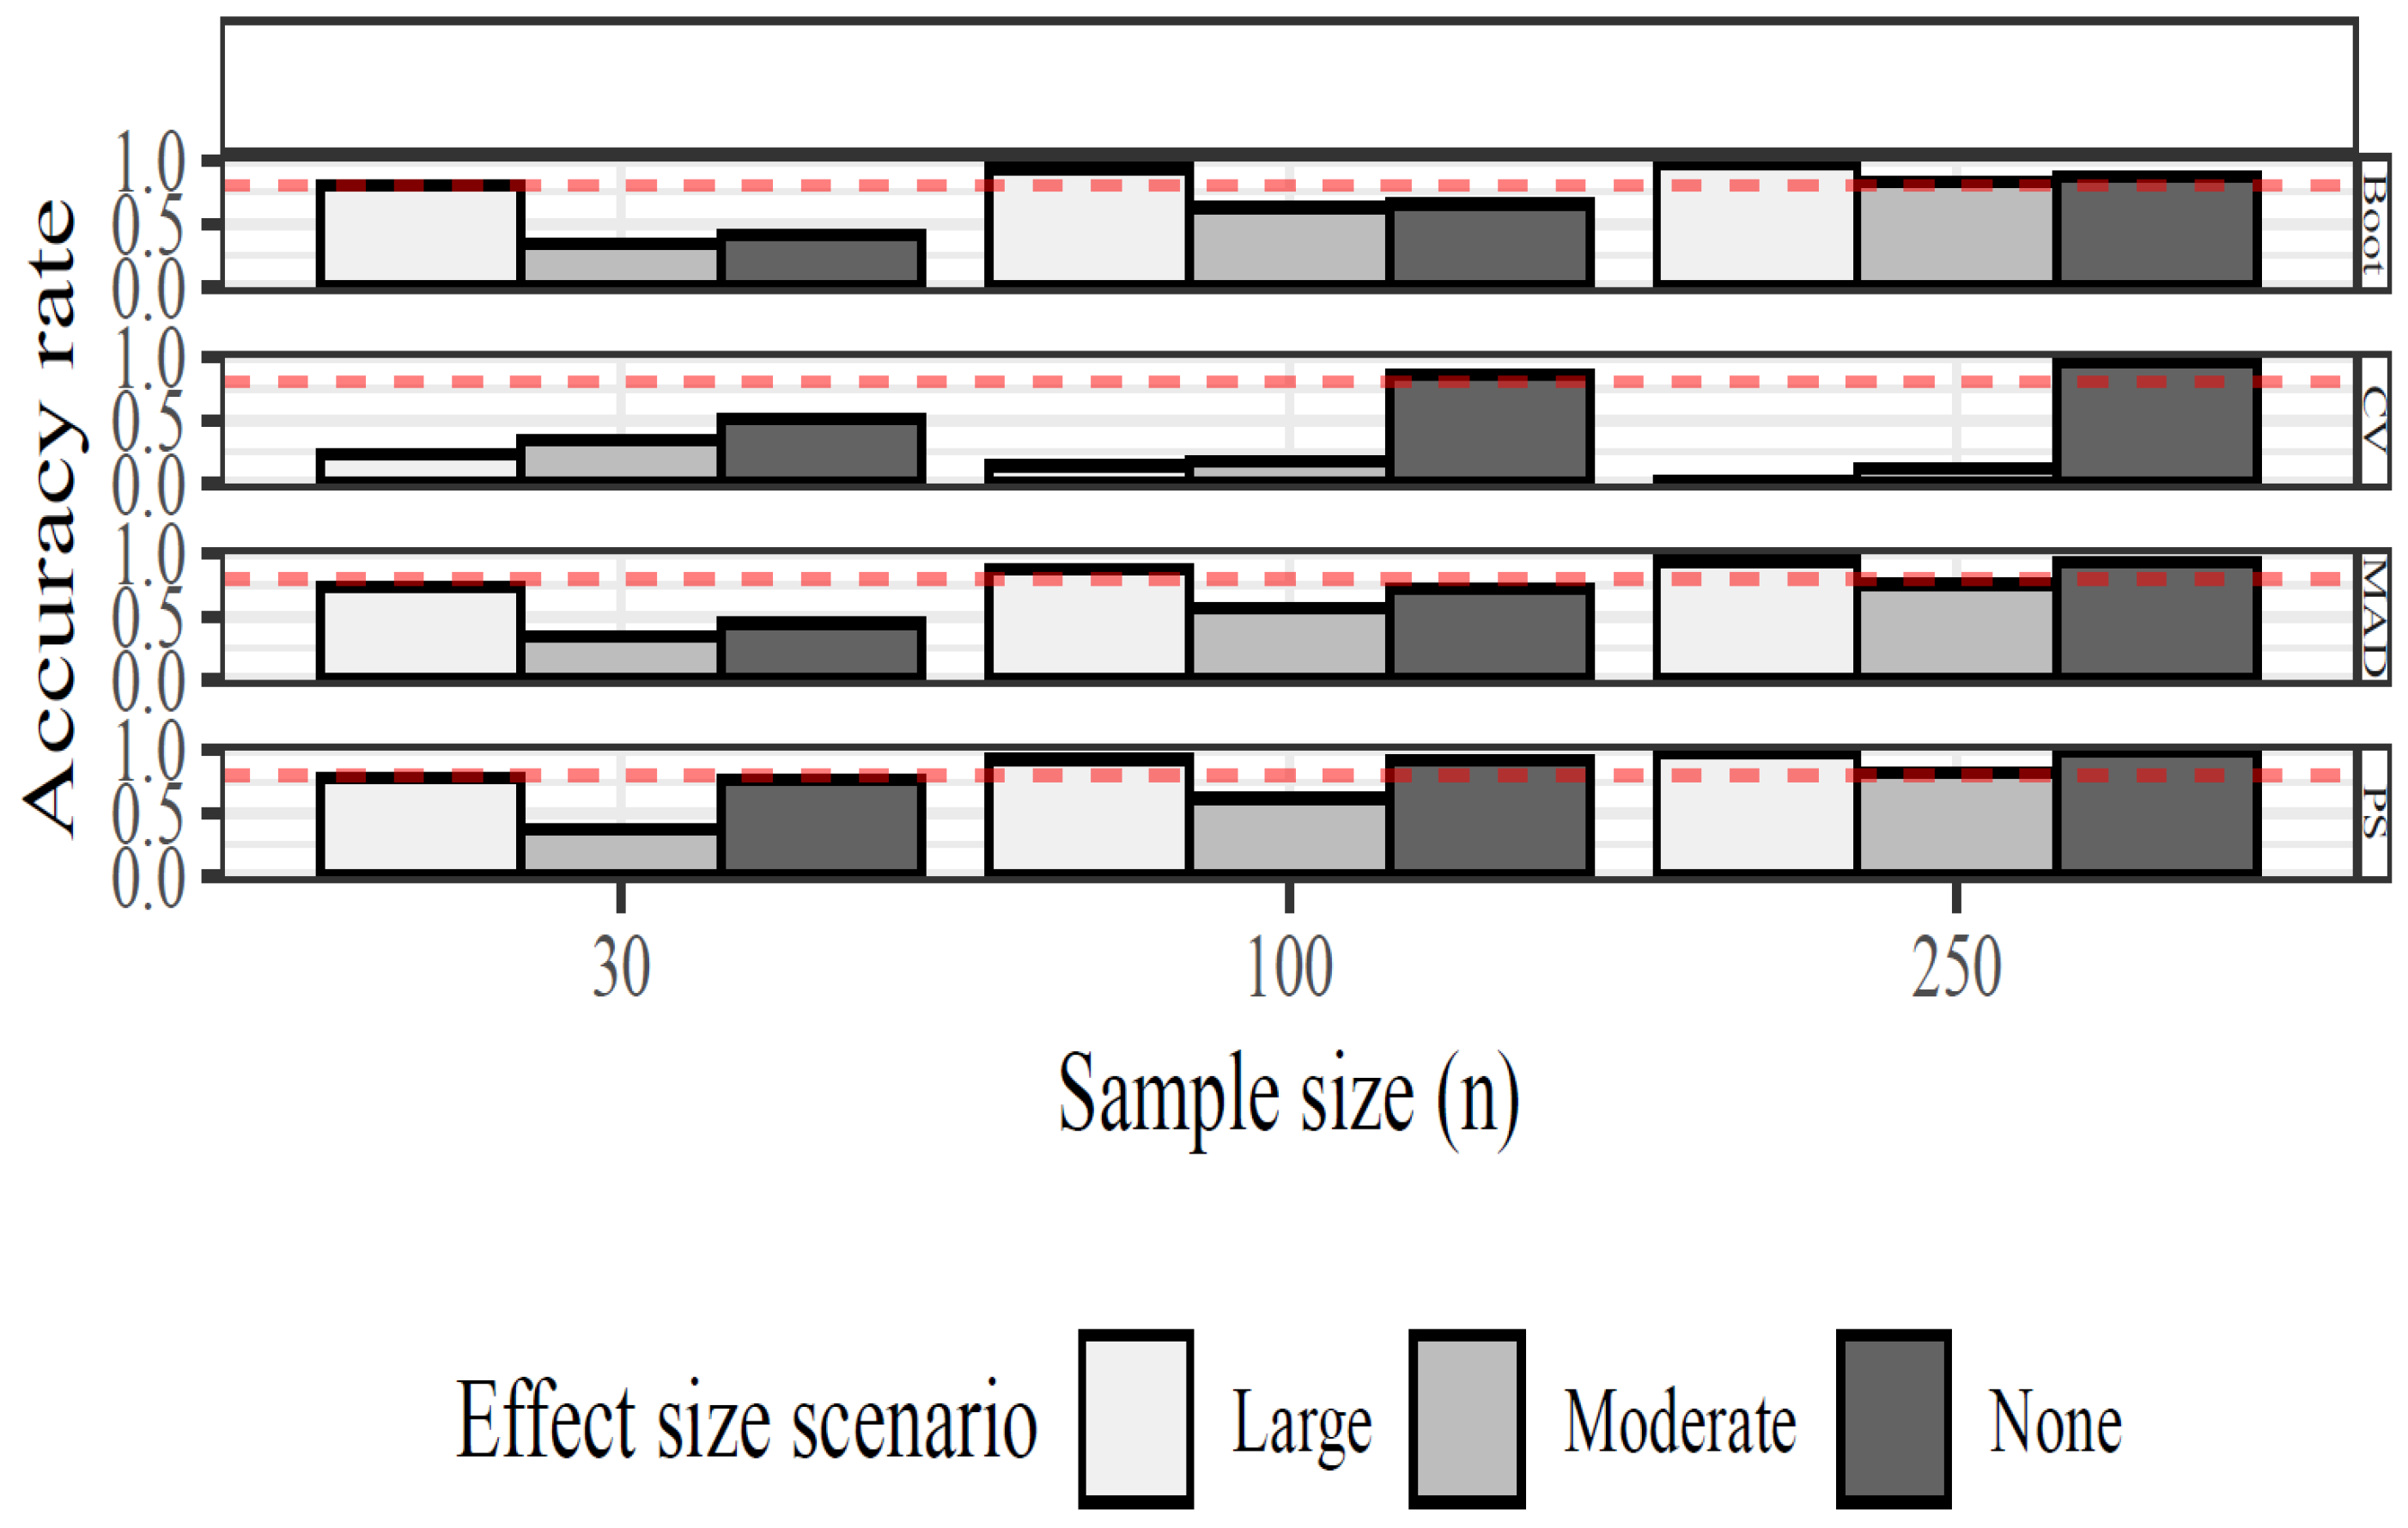
The patterns observed in Table 1 are clearly reflected in Figure 2. When the data follow a normal distribution, the three estimators based on median differences or pairwise ordering (Delta-Boot, Delta-MAD, and PS) exhibit broadly similar accuracy profiles across sample sizes, with all three methods improving steadily as n increases and achieving high accuracy for large effects. The only exception is Cramér’s V, which remains less accurate—particularly for moderate effects—because its dichotomization at the pooled median loses information relative to the other estimators. Delta-Boot shows a slight advantage in the moderate-effect condition, where its combination of a robust median numerator and a bootstrapped dispersion estimate allows it to separate effect categories more effectively at small and moderate sample sizes.
Under log-normal skew, performance profiles closely mirrored the normal case, indicating robustness of the median-based and rank-based procedures to distributional asymmetry. For the large effect at , PS again attained near-ceiling accuracy (), with Delta-MAD () and Delta-Boot () performing similarly; Cramer’s V remained notably lower (). In the moderate effect at , PS () was slightly lower than Delta-Boot () and Delta-MAD (), while Cramer’s V was moderately accurate (). For the none condition at , all methods were highly accurate (PS , Delta-MAD , Delta-Boot , Cramer’s V ). Mean effect estimates for the large effect at also tracked the expected ordering in both distributions (normal: MAD_M , PS_M , Boot_M , CV_M ; log-normal: MAD_M , PS_M , Boot_M , CV_M ). This same information from Table 1 is summarized in Figure 2. Across both distributional settings, the red horizontal line at 0.80 highlights the threshold above which classification accuracy becomes practically reliable; Delta-Boot, Delta-MAD, and PS all cross this threshold for large effects at moderate sample sizes, whereas Cramér’s V does so only at the largest n.
When the treatment variance doubled relative to the control, a more nuanced performance pattern emerged, as shown in Table 2. Under heteroscedasticity, no single estimator dominated across all effect sizes. For the large effect, PS achieved the highest accuracy at each sample size (0.783, 0.925, 0.981 for ), closely followed by Delta-Boot (0.808, 0.938, 0.979) and Delta-MAD (0.732, 0.872, 0.938), while Cramér’s V deteriorated sharply (0.230, 0.138, 0.017). For the moderate effect, Delta-Boot and PS were comparable (0.341 vs. 0.375 at ; 0.626 vs. 0.618 at ; 0.828 vs. 0.822 at ), with Delta-MAD slightly lower (0.341, 0.566, 0.757) and Cramér’s V lowest (0.345, 0.173, 0.120). For the none condition, PS remained the most accurate across sample sizes (0.766, 0.916, 0.989), while Delta-MAD and Delta-Boot showed moderate accuracy at smaller n and improved with increasing sample size; Cramér’s V again performed worst. These patterns indicate that PS remains highly effective for distinguishing both no and large effects even under variance imbalance, whereas Delta-Boot shows particular strength for moderate and large shifts at larger sample sizes. In contrast, Cramér’s V is consistently the least reliable estimator under heteroscedasticity.
Figure 2.
Accuracy across distribution, sample size, and effect scenario. The horizontal red line marks an accuracy threshold of 0.80.
Importantly, the heteroscedastic setting also produced noticeably larger standard deviations for the moderate and large effects, especially at , reflecting greater estimator variability when group spreads differ. For example, Delta-Boot exhibited SDs of 0.293 (moderate) and 0.256 (large) at , which decreased to 0.108 and 0.087 by . Similar monotonic reductions were observed for Delta-MAD (from 0.337 and 0.392 down to 0.116 and 0.124). PS and Cramér’s V showed smaller SDs overall but did not translate this lower variability into higher accuracy under imbalance; instead, their SDs shrank around biased or attenuated accuracy targets. These patterns confirm that heteroscedasticity increases both classification difficulty and estimator dispersion at small n, while Delta-Boot and Delta-MAD stabilize more rapidly with increasing sample size. Overall, PS remains highly effective for distinguishing no and large effects even under imbalance, whereas Delta-Boot exhibits particular strength for moderate and large effects at larger sample sizes. Cramér’s V is the least reliable across all conditions.
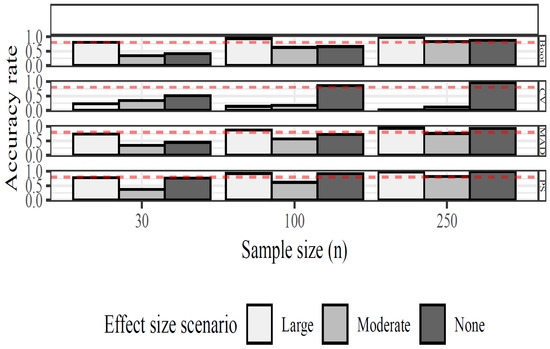
Figure 3 visualizes the impact of heteroscedasticity on estimator performance across sample sizes and effect scenarios. When the treatment variance is doubled relative to the control, all estimators exhibit reduced accuracy at , especially for moderate effects, but the degree of degradation varies markedly by method. Delta-Boot and PS remain comparatively stable for both the no- and large-effect conditions, with accuracy increasing sharply as n grows, and both estimators exceeding the 0.80 threshold for large effects by . Delta-MAD shows a similar upward trend with sample size but remains slightly weaker than Delta-Boot and PS for moderate effects. Cramér’s V performs poorest across all effect sizes, with its accuracy declining especially sharply for large effects under variance imbalance. By , Delta-Boot achieves the highest accuracy for moderate and large effects, while PS retains strong performance for the no- and large-effect scenarios. Overall, the plot highlights that variance imbalance disproportionately affects Cramér’s V and, to a lesser extent, PS in the moderate-effect case, whereas median-standardized estimators—particularly Delta-Boot—adapt more reliably as sample size increases.
Figure 3.
Accuracy across distribution, sample size, and effect scenario for the case of unequal variances. he horizontal red line marks an accuracy threshold of 0.80.
3.2. Empirical Application
We applied the candidate effect-size estimators to empirical data from the 2024 World Health Organization (WHO) STEPwise Approach to Surveillance (STEPS) for Trinidad and Tobago. The STEPS survey provides nationally representative data on behavioural and biological non-communicable disease (NCD) risk factors.
Our analysis examined the association between physical activity (treatment) and fasting blood glucose (outcome variable b5). Physical activity in STEPS includes work-related (p1), travel-related (p7), and recreational (p10) activity domains. For a two-group comparison, participants were classified as follows:
- Exercise = yes: reported vigorous or moderate activity in any domain.
- Exercise = no: reported no activity in all domains.
After excluding participants with missing glucose values, the final analytic sample consisted of individuals (, ) (see Table 3).
Table 3.
Tests of normality (Shapiro–Wilk) and homoscedasticity (Levene’s test).
Preliminary diagnostics indicated substantial right skewness in fasting glucose for both groups (Shapiro–Wilk ), and no evidence of heteroscedasticity based on Levene’s test (), thereby motivating the use of nonparametric methods. Table 4 and Table 5 summarize the results from the three comparative tests and the corresponding effect-size estimates.
The effect-size estimators were then computed from the observed median difference and the corresponding dispersion measures. The proposed bootstrap-standardized median difference yielded , and the PS effect size is 0.45. All estimators yielded the same classification (none) of the effect size.
Table 4.
Comparison of fasting blood glucose (b5) by exercise status.
Table 5.
Effect-size estimates for the comparison of fasting glucose by exercise status.
4. Discussion
The comparability of results between normal and log-normal settings highlights an important design feature of the candidate estimators: the two median-standardized measures (Delta-MAD and Delta-Boot) share the same median-difference numerator, which remains stable under skewness and outliers, whereas PS is based on Mann–Whitney ordering probabilities and Cramér’s V on a association measure. In both Scenarios A and B, classification accuracy for Delta-MAD, Delta-Boot, and PS improved monotonically with sample size, and the corresponding estimator standard deviations decreased in parallel. These patterns confirm that median-based and order-based effect-size estimators inherit the robustness of Mood’s median test itself, yielding nearly indistinguishable performance under normal and log-normal sampling for both moderate and large effects, especially at .
Scenario C (heteroscedasticity) produced a more complex pattern. Variance imbalance increases the overlap between groups, inflates the lower tail of the higher-variance distribution, and alters the behaviour of each estimator in distinct ways. Across effect sizes, PS remained the most accurate for both the none and large conditions. Cramér’s V, which dichotomizes observations at the pooled median, was consistently the least accurate across all conditions, with its performance degrading sharply under heteroscedasticity, particularly for large effects. For moderate effects, Delta-Boot and PS performed similarly across the sample sizes. For the none condition, Delta-MAD and Delta-Boot showed moderate accuracy at small n but improved markedly by .
The behaviour of the estimator standard deviations in Scenario C further clarifies these differences. Under variance imbalance, all estimators exhibited substantially larger SDs at for both moderate and large effects, reflecting heightened instability when group spreads differ. These SDs decreased steadily with an increasing sample size, reaching much smaller values by . PS and Cramér’s V showed smaller SDs overall, but these smaller SDs reflected convergence toward attenuated or biased classification targets rather than true robustness. In other words, heteroscedasticity does not simply inflate variability; it pulls PS and Cramér’s V toward misclassifying moderate and large effects, and larger n tightens this bias rather than correcting it.
Across the three simulation scenarios, the emerging hierarchy of estimators is intuitive in light of their underlying mechanics. Under equal variances (Scenario A), PS provides the strongest classification for moderate and large median shifts, with Delta-MAD and Delta-Boot close behind, and Cramér’s V being least reliable for moderate effects. Under skewness (Scenario B), this hierarchy persists, confirming the robustness of median and rank-based estimators to asymmetric distributions. Under heteroscedasticity (Scenario C), however, the ranking becomes effect-size-specific: PS remains most effective for detecting no and large effects, whereas Delta-Boot shows particular strength for moderate and large effects at larger sample sizes. Delta-MAD performs intermediately across all settings, and Cramér’s V remains the least robust estimator when variances differ.
The empirical application reinforces the distinction between statistical significance and practical effect magnitude. Although the Wilcoxon rank-sum test detected a statistically significant difference in glucose distributions between activity groups, both Mood’s median test and Welch’s t-test did not, illustrating how rank-based tests can detect subtle shifts in distributional shape at large sample sizes. More importantly, the effect-size estimates—Delta-Boot () and probability of superiority ()—indicated a negligible practical effect. Consistent with our simulation findings, these median-based and rank-based effect-size measures prevent overinterpretation of statistically significant differences in large, skewed epidemiological datasets.
5. Conclusions
This simulation study compared four effect-size estimators aligned with the logic of Mood’s median test across three data-generating conditions: (i) normal with equal variances, (ii) log-normal with right skewness, and (iii) normal with heteroscedasticity (variance ratio 1:2). Under equal variances, the probability of superiority (PS) provided the highest classification accuracy for moderate and large shifts, with Delta-MAD and Delta-Boot performing similarly well and Cramér’s V consistently being the least accurate for moderate effects. Under log-normal skewness, this hierarchy remained slightly changed with Delta-Boot classifying moderate effects better than PS. This behaviour persisted even in the unequal variances case. Classification accuracy and estimator variability improved monotonically with sample size under both normal and log-normal sampling, reinforcing the stability of these estimators in ideal and skewed settings.
Under heteroscedasticity, however, estimator behaviour differed qualitatively. Because PS is derived from the Mann–Whitney U statistic, it depends on the full pairwise ordering of observations and is therefore sensitive to differences in spread as well as location. This sensitivity reduced its accuracy for moderate effects and produced attenuated performance even for large effects at smaller sample sizes. Cramér’s V was the most adversely affected estimator across all settings, with accuracy decreasing sharply as variance imbalance increased. In contrast, the two median-standardized estimators—Delta-MAD and Delta-Boot—displayed greater stability, despite increased estimator dispersion at . Delta-Boot achieved the highest accuracy for moderate and large effects at , and Delta-MAD performed reliably across all effect sizes. These patterns highlight the challenge that variance imbalance poses for purely rank-based or contingency table-based effect sizes and underscore the relative robustness of median standardized approaches.
Taken together, the findings support using PS (or Delta-MAD) when homoscedasticity is plausible or approximately satisfied and preferring Delta-Boot when heteroscedasticity is suspected or cannot be ruled out. Delta-Boot also offers a conceptually intuitive interpretation, expressing median differences in bootstrapped standard deviation units while retaining robustness that classical parametric standardization lacks.
This study has several limitations. First, although classification accuracy provides a practical criterion for comparing estimators, the simulations did not directly evaluate the estimators’ performance as estimatorsof effect magnitude (e.g., bias, variance, mean-squared error). A dedicated investigation of purely estimation-focused properties is warranted, particularly for Delta-Boot, whose bootstrap denominator introduces additional sampling variability. Second, the simulation scenarios were restricted to equal sample sizes across groups. Unequal sample sizes are common in applied research, and may interact with variance imbalance, skewness, or the median-based construction of these estimators in nontrivial ways. Extending the present design to systematically study unequal sample sizes represents an important direction for future work.
Another limitation of the proposed estimator is that its justification is currently heuristic, supported by empirical performance rather than formal theory. Future work should investigate its asymptotic properties, bias, and variance under a wider range of data-generating conditions.
Future research should investigate scenarios in which skewness and heteroscedasticity occur simultaneously, extend the estimators to multi-group versions of Mood’s median test, and develop a comprehensive framework for both classification and estimation accuracy under a wider range of practical data conditions.
Finally, because commonly used heuristic thresholds for defining “small,” “medium,” and “large” effect sizes are not theoretically anchored, interpretation of magnitude categories should be made cautiously; future work may explore alternative calibration strategies and investigate bias-correction strategies for the bootstrap component of the proposed estimator, particularly under small-sample or strongly heteroscedastic conditions, where bootstrap-based scale estimates may exhibit finite sample bias.
Author Contributions
Conceptualization, S.V.; methodology, S.V. and S.C.S.; software, T.D.; validation, S.V.M.; writing—original draft preparation, S.V.; writing—review and editing, S.C.S. and S.V.M. All authors have read and agreed to the published version of the manuscript.
Funding
This research received no external funding.
Data Availability Statement
No new data were created or analyzed in this study.
Conflicts of Interest
The authors declare no conflicts of interest.
References
- Sullivan, G.M.; Feinn, R. Using effect size—Or why the P value is not enough. J. Grad. Med. Educ. 2012, 4, 279–282. [Google Scholar] [CrossRef] [Scilit] [PubMed]
- Cohen, J. Statistical Power Analysis for the Behavioral Sciences; Routledge: New York, NY, USA, 2013. [Google Scholar]
- Hedges, L.V. Interpretation of the standardized mean difference effect size when distributions are not normal or homoscedastic. Educ. Psychol. Meas. 2025, 85, 245–257. [Google Scholar] [PubMed]
- Grissom, R.J.; Kim, J.J. Effect Sizes for Research: Univariate and Multivariate Applications; Routledge: New York, NY, USA, 2012. [Google Scholar]
- Peres, F.F. Effect sizes for nonparametric tests. Biochem. Medica 2025, 36, 010101. [Google Scholar]
- Hao, R.; Yang, X. Multiple-output quantile regression neural network. Stat. Comput. 2024, 34, 89. [Google Scholar] [CrossRef] [Scilit]
- Lin, S.; Lou, Y.; Hao, R.; Shao, Y.; Yu, J.; Fang, L.; Bao, M.; Yi, W.; Zhang, Y. A single-dose, randomized, open-label, four-period, crossover equivalence trial comparing the clinical similarity of the proposed biosimilar rupatadine fumarate to reference Wystamm® in healthy Chinese subjects. Front. Pharmacol. 2024, 15, 1328142. [Google Scholar] [CrossRef] [Scilit] [PubMed]
- Zhan, X.; Zhou, Z.; Liu, Y.; Cecchi, N.J.; Hajiahamemar, M.; Zeineh, M.M.; Grant, G.A.; Camarillo, D. Differences between two maximal principal strain rate calculation schemes in traumatic brain analysis with in-vivo and in-silico datasets. J. Biomech. 2025, 179, 112456. [Google Scholar] [CrossRef] [Scilit] [PubMed]
- Kelley, K.; Preacher, K.J. On effect size. Psychol. Methods 2012, 17, 137. [Google Scholar] [CrossRef] [Scilit] [PubMed]
- Ricca, B.P.; Blaine, B.E. Brief research report: Notes on a nonparametric estimate of effect size. J. Exp. Educ. 2022, 90, 249–258. [Google Scholar] [CrossRef] [Scilit]
- Mood, A.M. Introduction to the Theory of Statistics; McGraw-Hill: Columbus, OH, USA, 1950. [Google Scholar]
- Brown, G.W.; Mood, A.M. On median tests for linear hypotheses. In Proceedings of the Second Berkeley Symposium on Mathematical Statistics and Probability; University of California Press: Oakland, CA, USA, 1951; Volume 2, pp. 159–167. [Google Scholar]
- Mood, A.M. On the asymptotic efficiency of certain nonparametric two-sample tests. Ann. Math. Stat. 1954, 25, 514–522. [Google Scholar] [CrossRef] [Scilit]
- Fligner, M.A.; Rust, S.W. A modification of Mood’s median test for the generalized Behrens-Fisher problem. Biometrika 1982, 69, 221–226. [Google Scholar]
- Chen, Z. Extension of Mood’s median test for survival data. Stat. Probab. Lett. 2014, 95, 77–84. [Google Scholar] [CrossRef] [Scilit]
- Cramer, D. Fundamental Statistics for Social Research: Step-by-Step Calculations and Computer Techniques Using SPSS for Windows; Routledge: New York, NY, USA, 2003. [Google Scholar]
- Desu, M.; Raghavarao, D. Nonparametric Statistical Methods for Complete and Censored Data; Chapman and Hall/CRC: Boca Raton, FL, USA, 2003. [Google Scholar]
- Smarandache, F. Introduction to Neutrosophic Sociology (Neutrosociology); Infinite Study: Paris, France, 2019. [Google Scholar]
- Al Aita, A.; Aslam, M.; Smarandache, F. A New Mood’s Median Test for Imprecise Data; Infinite Study: Paris, France, 2024. [Google Scholar]
- Mangiafico, S. Summary and Analysis of Extension. Program Evaluation R Version, 2016. Available online: https://rcompanion.org/handbook/F_05.html (accessed on 24 March 2026).
- Cramér, H. Mathematical Methods of Statistics; Princeton University Press: Princeton, NJ, USA, 1999; Volume 9. [Google Scholar]

Disclaimer/Publisher’s Note: The statements, opinions and data contained in all publications are solely those of the individual author(s) and contributor(s) and not of MDPI and/or the editor(s). MDPI and/or the editor(s) disclaim responsibility for any injury to people or property resulting from any ideas, methods, instructions or products referred to in the content. |
© 2026 by the authors. Licensee MDPI, Basel, Switzerland. This article is an open access article distributed under the terms and conditions of the Creative Commons Attribution (CC BY) license.