


Abstract
Topological graph theory provides a quantitative approach to understanding the structural complexities of sulfonamide compounds, which are prominent for their therapeutic importance in cancer treatment. A new computational scheme to predict the physicochemical and biological functions of sulfonamide derivatives, based on connection numbers and connection-based topological indices as alternatives to the theoretically overt degree-based index, is proposed. A set of structurally diverse sulfonamide compounds as chemical graphs is considered, and the relevant graph descriptors are computed using different connection numbers. Due to the complexity of the calculations involved in connectivity and other such indices, algorithms were developed in Python 3.12.12 to automate the extraction and calculation of these indices. QSPR analysis, with the help of supervised machine learning models like linear regression, among others, and various statistical techniques, was employed to obtain insight into the relationships existing between the structural properties and the molecular properties measured, such as melting point, molecular weight, etc. These results demonstrate the great predictive capability of connection-based indices in assessing pharmacologic efficacy or molecular behavior. The holistic setting thus links topological modeling to data-driven prediction and provides a window into the rational design and optimization of sulfonamide-based cancer therapeutics.
MSC:
05C90; 05C92; 05C09; 68T05; 62J05; 62H20
1. Introduction
The sulfonamide compounds exhibited an important contribution in early antimicrobial synthetic sources since they contain the sulfonamide () functional group of compounds. They have been used in therapy since the 1930s. Besides their primordial importance in the treatment of bacterial infections, they have also been proven to have broad potential in other pharmacotherapeutic applications, namely protozoal diseases, urinary and respiratory infections, meningitis, and even more complicated conditions such as cancer, epilepsy, and failure of the heart. Also, some sulfonamide derivatives serve as enzyme inhibitors and possess anti-inflammatory, diuretic, and anti-cancer activities, thus proving their role in drug design.
Structural characteristics of sulfonamide drugs provide a good option for optimization through graph-theoretical approaches, especially by utilizing topological indices. By convention, degree-based TIs have been used for estimating structural properties of compounds by evaluating connectivity in atoms. These indices have boosted the Quantitative Structure–Property Relationships (QSPRs) and Quantitative Structure–Activity Relationships (QSARs) with knowledge regarding molecular behavior, assisting in drug discovery and design.
Recently, computational advances have brought in mathematical modeling, topological descriptors, and supervised machine learning to assist conventional drug evaluation frameworks with predictions. This study, however, takes a turn and considers connection-based topological indices, which constitute a refined alternative concentrating on atomic connectivity patterns in a more generalized manner rather than mere assessments of degrees. These indices are expected to capture structure–activity relationships with more subtlety and convey relevant information about pharmacological behavior. To investigate these possibilities, the present work investigates a group of sulfonamide derivative compounds through the building of molecular graphs, calculation of connection-based topological indices, and running Python-governed algorithms for enabling descriptor generation. QSPR models, created using machine learning models like linear regression, are employed to map topological descriptors to key physicochemical properties such as melting point and molecular weight. This integrated strategy provides a new and effective route to understanding, forecasting, and optimizing the therapeutic applications of sulfonamide compounds in the process of contemporary drug discovery.
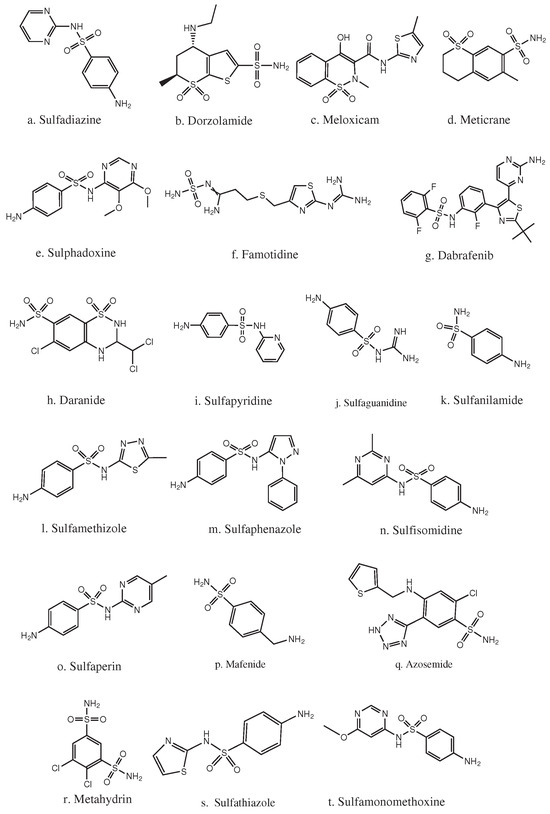
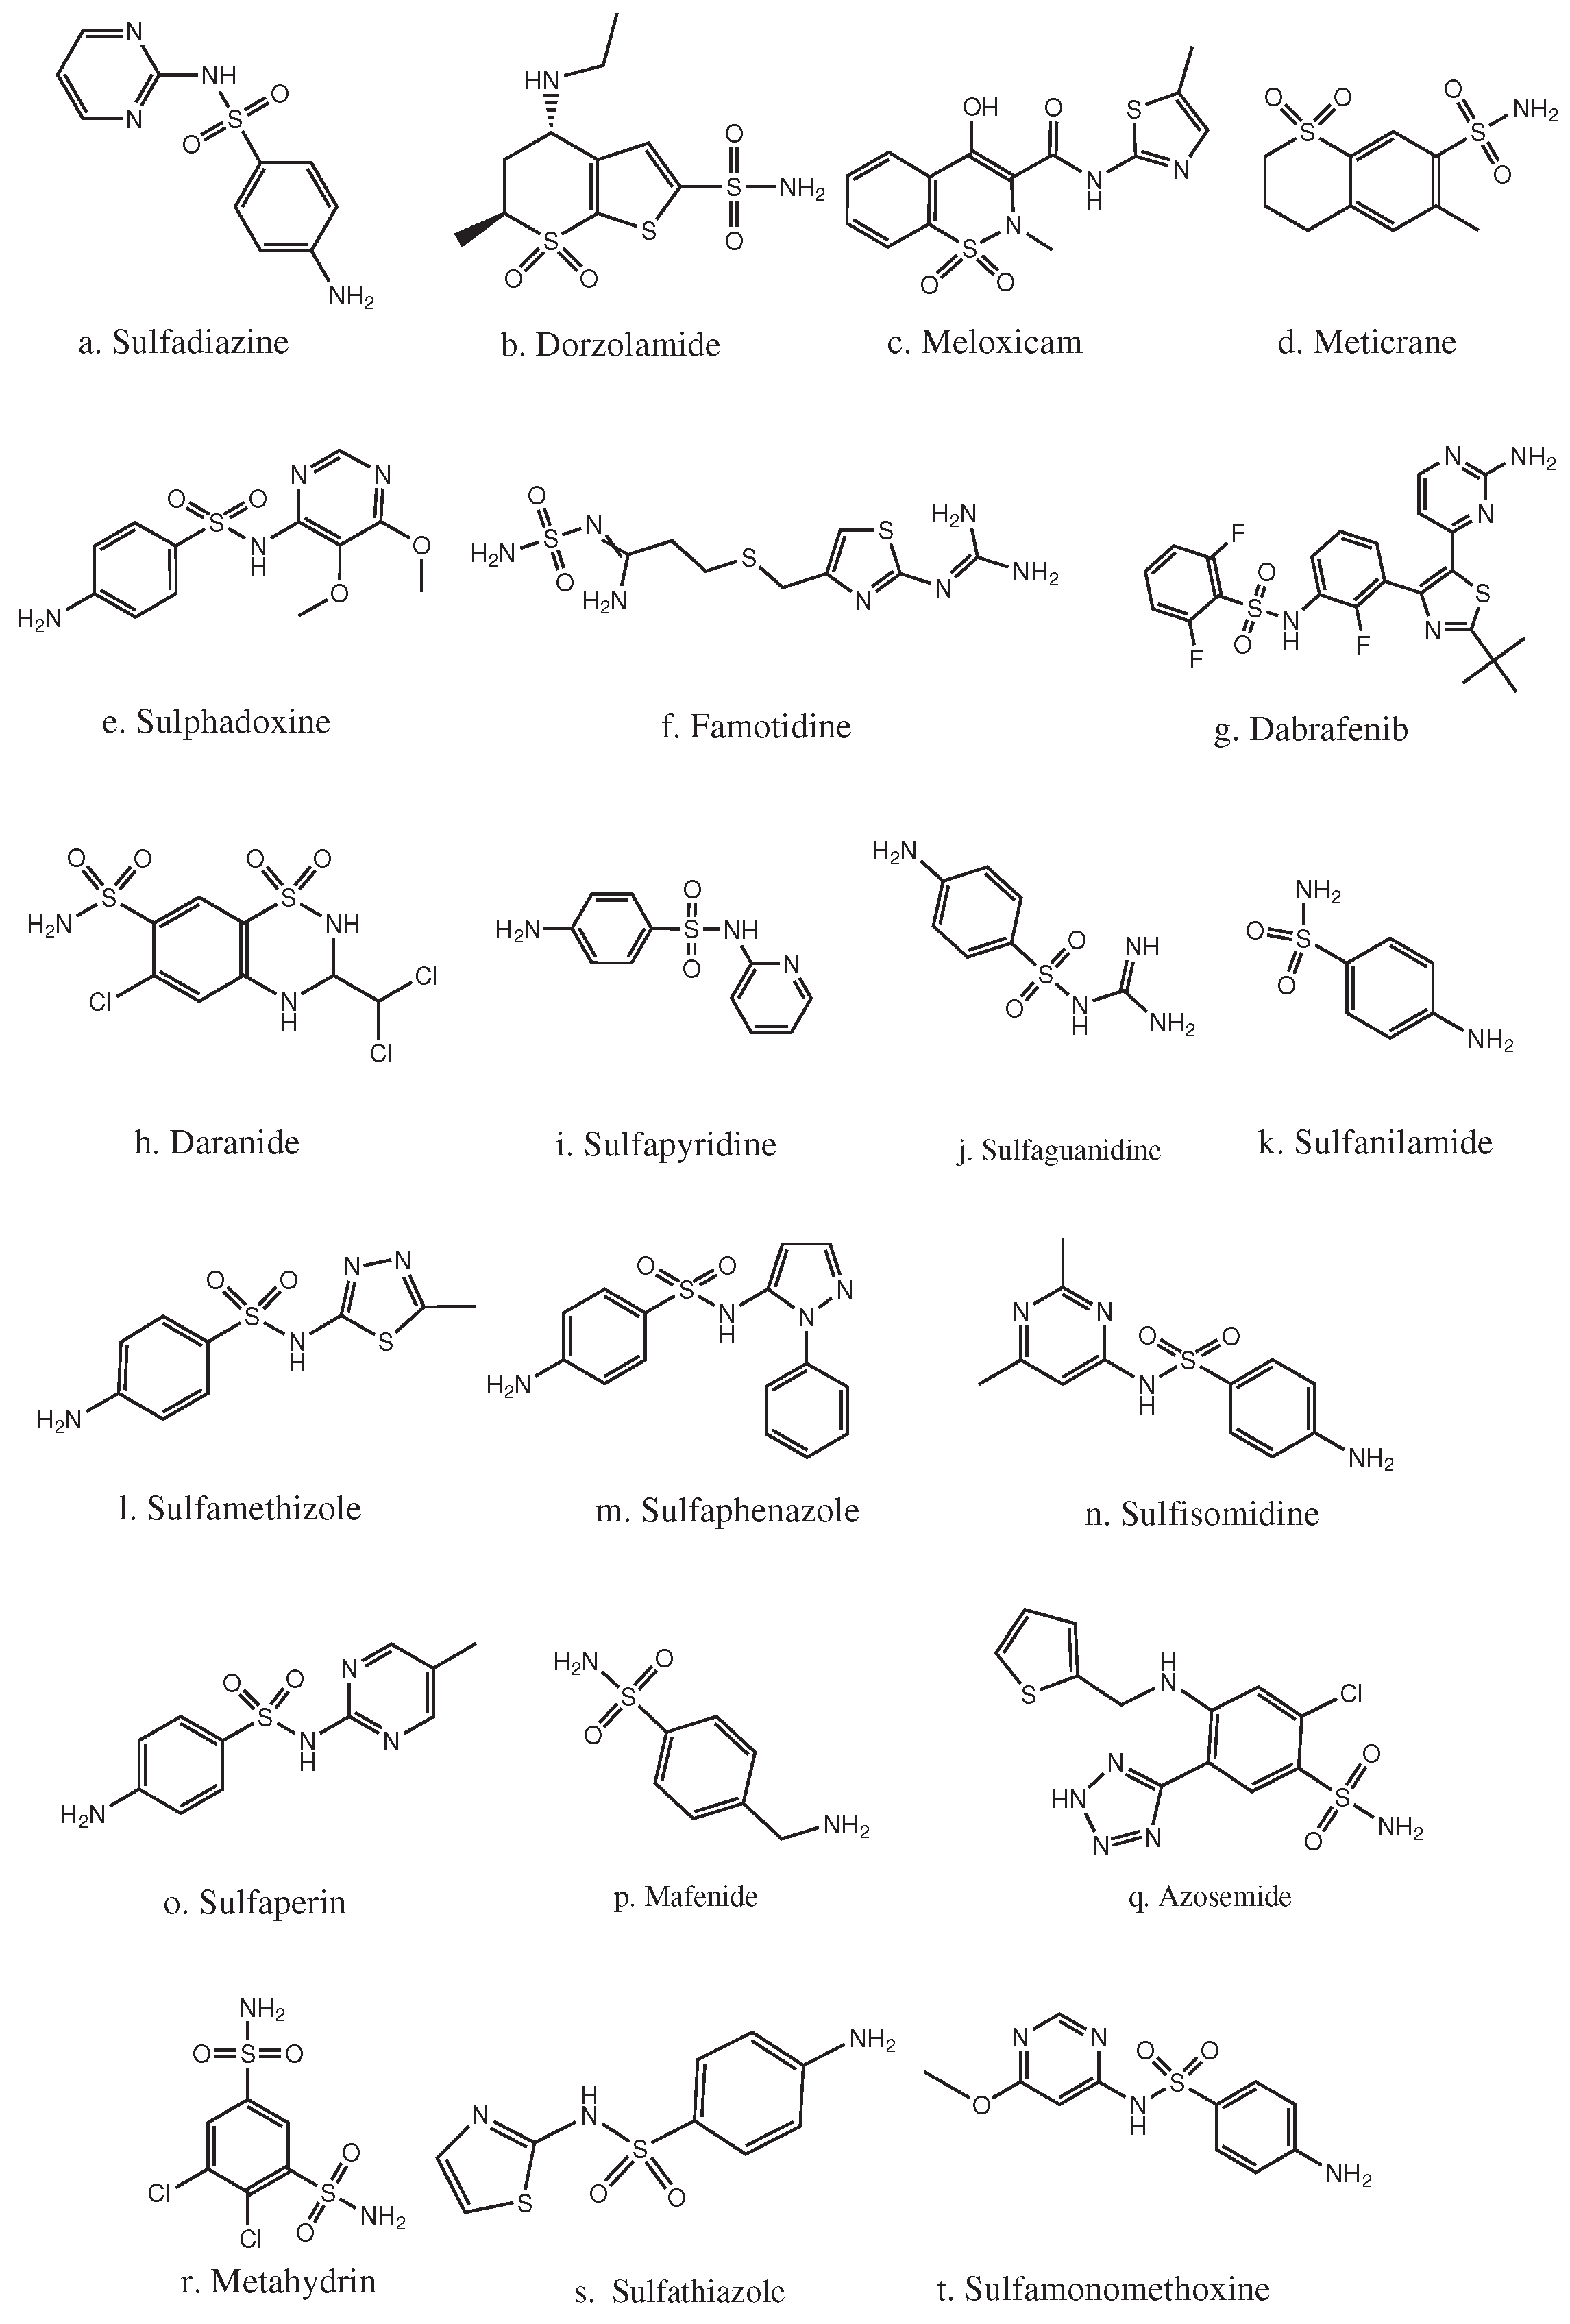
Sulfonamide drugs have a very long medical history due to their diverse biological properties. Zhong et al. [1] in 2004 demonstrated enzyme inhibitors from sulfonamide scaffolds, especially against carbonic anhydrase and proteases. Das et al. [2], in the same year, recommended efficient synthesis procedures via sulfonamide esters, making them more chemically available. Winum et al. [3] in 2006 highlighted the prospective future of sulfamides as enzyme inhibitors in therapeutic drugs, validating their role in medicinal chemistry. Cheng et al. [4] in 2008 stressed the significance of the sulfonamide moiety in designing matrix metalloproteinase inhibitors, which are essential in cancer and inflammation studies. Penning et al. [5] synthesized celecoxib, a sulfonamide derivative, in the year 1997, and it is known as a COX-2 selective inhibitor possessing anti-inflammatory activity. Subsequently, Talley et al. [6] in the year 2000 reported valdecoxib, a strong COX-2 selective inhibitor. Burger and Abraham [7] in the year 2003 described an enormous variety of applications of sulfonamides in diuretics and hypoglycemic agents. Markgren et al. [8] used sulfonamide-derived compounds in 2002 as HIV-1 protease inhibitors, with a focus on structure–activity relationships, while Rotella [9] studied sulfonamide derivatives as phosphodiesterase-5 inhibitors for the treatment of cardiovascular diseases. Crespo et al. [10] in 2010 established the antitumor activity of N-glycosyl sulfonamides, indicating their in vitro activity. Boufas et al. [11] in 2014 examined the antibacterial activity of sulfonamides using synthesis and DFT-based studies. Danish et al. [12,13,14,15] have extensively studied sulfonamide derivatives over the years. In 2015, they published the crystal structures of 4-[(naphthalene-2-sulfonamido)methyl]cyclohexane-1-carboxylic acid and (2S)-3-methyl-2-(naphthalene-1-sulfonamido)-butanoic acid. In 2019, they synthesized sulfonamide-based esters and compared their antiradical and antimicrobial activities using DFT and X-ray crystallography. Most recently, in 2021, they characterized new sulfonamides, analyzing their spectral and structural properties, thereby contributing valuable insights to the field of sulfonamide drugs (Figure 1).
Figure 1.
Chemical structure of drugs.
In recent decades, a fresh class of topological indices known as connection number-based indices gained widespread acceptance in mathematical chemistry. The indices have increasingly been used to investigate the molecular and chemical graph structure owing to the consideration that they are capable of presenting precise information about connectivity and complexity of networks. Tang et al. [16] and Ali et al. [17] were among the early researchers in this field, where they calculated Zagreb indices in terms of connection number along with their modified Zagreb indices for different operations of a graph, like subdivision and T-sum graphs. These early efforts opened the gates to the use of connection indices in higher structures. Then, Cao et al. [18] deduced product-associated upper bounds of connection-based Zagreb indices, extending the theory further. Ahmad et al. [19] generalized this further to Backbone DNA Networks, where exact values of the connection indices were computed and thereby establishing the biological significance. The application continued to grow, with Liu et al. [20] researching Zagreb connection numbers of cellular neural networks, while Javaid et al. [21] researched wheel-type graphs, developing new expressions. Likewise, Ullah et al. [22] researched triangular chain compounds, demonstrating the utility of connection indices in structural property modeling of extended molecular skeletons. Recently, Koam et al. [23] applied these descriptors to anti-cancer agents in skin cancer and found a promising lead for pharmaceutical and medical graph-based research. In 2022, Sattar et al. [24]applied connection-based topological indices, including Zagreb connection indices and their multiplicative forms, to dendrimers, demonstrating their effectiveness in characterizing molecular structures and comparing different descriptors for structural analysis. Recently, in 2024 and 2025, Ahmed et al. [25,26] have applied topological and entropy-based graph-theoretical descriptors to study sulfonamide and sulfur-based drugs. Their work utilized QSPR models, including linear regression and supervised machine learning, to correlate molecular structural features with physicochemical and pharmacological properties, providing valuable insights into drug design and optimization.
The biological activities of medications like Sulfadiazine (D1), Dorzolamide (D2), Meloxicam (D3), Sulphadoxine (D4), Meticrane (D5), Famotidine (D6), Dabrafenib (D7), Daranide (D8), Metahydrin (D9), Sulfapyridine (D10), Sulfanilamide (D11), Sulfathiazole (D12), Sulfaguanidine (D13), Sulfamethizole (D14), Sulfaphenazole (D15), Sulfisomidine (D16), Sulfamonomethoxine (D17), Sulfaperin (D18), Mafenide (D19), and Azosemide (D20) are correlated with computed molecular descriptors using supervised machine learning models. This work provides a systematic overview of important mathematical indices, with a further focus on computational efficiency and constraints when applied to various chemical network geometries. This research has robust quantitative findings on topological indices as indicated in Table 1.
Table 1.
Connection-based indices.
2. Materials and Methods
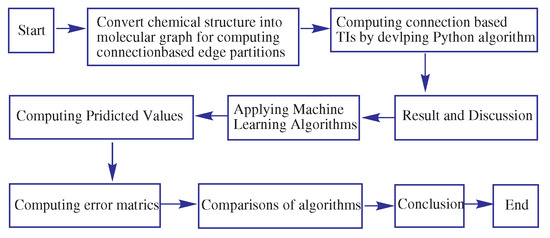
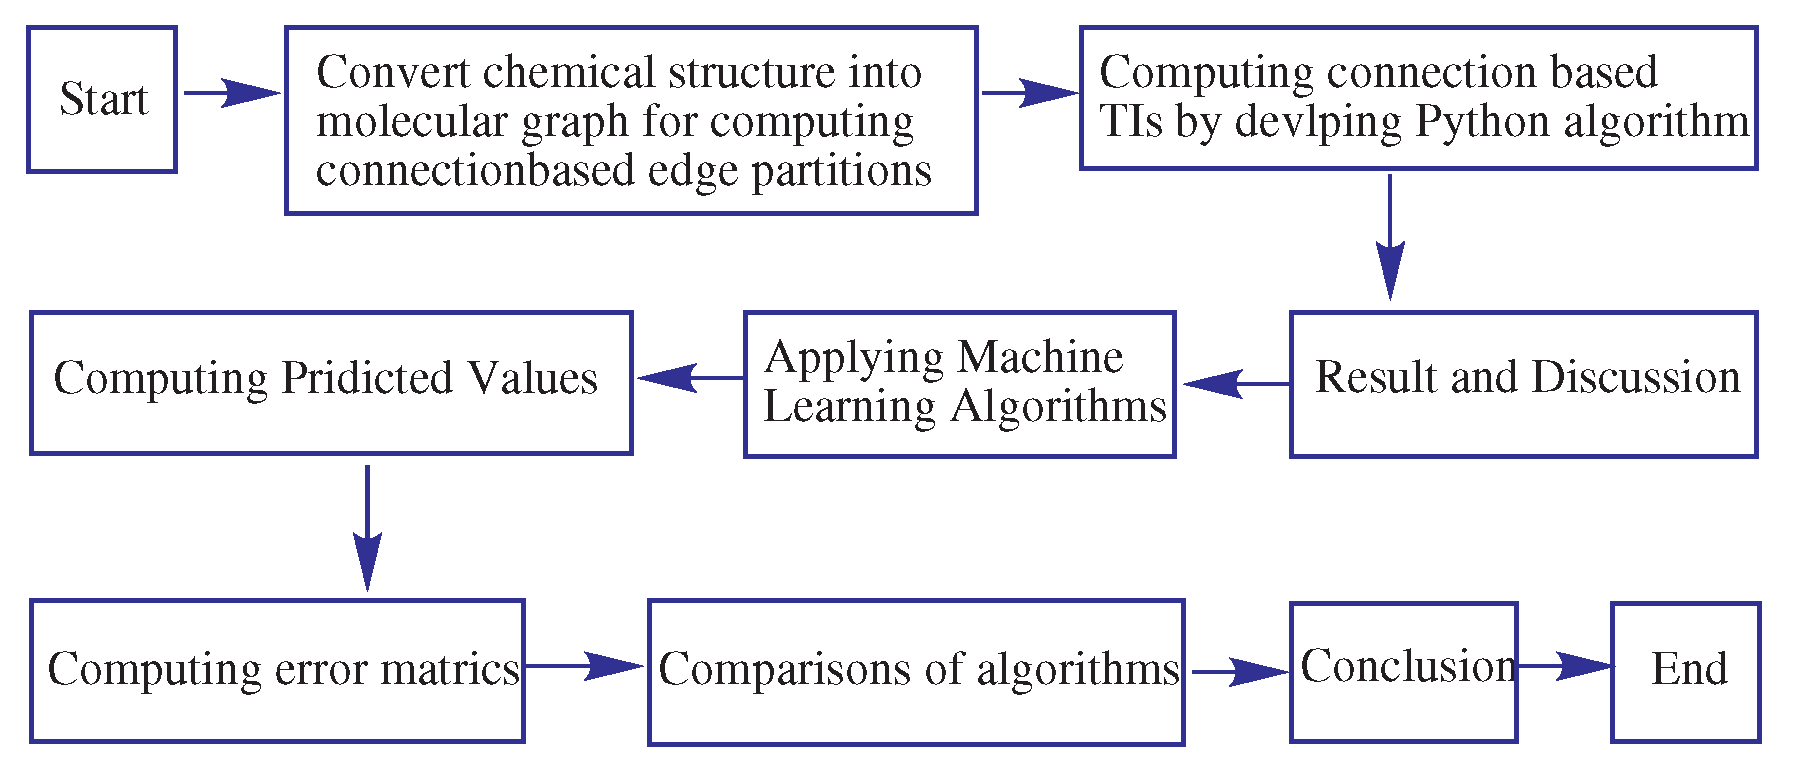
We use a number of methodical steps in our analysis and prediction of molecular behavior. First, molecular graphs, diagrammatic representations of molecular connectivity, were used to depict the chemical structure. The computation of edge partitioning, which highlights graph connectivity or node relationships, was then carried out in these graphs. The graph’s node connection number (number of two-distance vertices) distribution was then used to compute connection-based topological indices. A Python algorithm is used to automate this. Lastly, a different Python program uses machine learning algorithms to assess the developed indices’ ability to predict molecular behavior. To achieve reliable and objective results, a 5-fold cross-validation approach was used. Each compound was used in a separate fold, employing a training or testing instance as an internal validation technique to maximize available data and minimize variance caused by random partitioning. All input features and target variables were normalized prior to model training. Z-Score normalization was used to normalize the features, resulting in a standard deviation of one and a center around zero. However, all features were scaled between 0 and 1 when the target variables were normalized using Min–Max scaling.
The accuracy and dependability of the predicted properties were compared to the actual properties of the molecules using , , and in order to evaluate the models. Figure 2, which provides a thorough flowchart of the research process, depicts the entire study workflow. The definitions of , , and are
where n is the number of data points, is the actual value, and is the forecast value.
Figure 2.
A flow chart.
Lastly, in order to investigate the relationships between the studied descriptors, Pearson correlation analysis was carried out. At the same time, the variance inflation factor (VIF) was calculated to check for the presence of multicollinearity among the descriptors. If the value of VIF is greater than 10, it indicates a high level of multicollinearity. The above studies can be useful for checking for redundancy among the descriptors used for the development of the QSPR models.
3. Results
We compute the connection-based topological indices and, through systematic distance-2 edge partitioning, with rigorous validation implemented via Python algorithms. All analytical results are derived directly from the structural data presented in Table 1. The connection-based edge partition is computed by using the Python algorithm for all anti-cancer drugs and placed in Table 2.
Table 2.
Connection-based edge partitions of drugs.
By using Table 1 and Table 2, we estimated the topological indices of Sulfadiazine (D1), Dorzolamide (D2), Meloxicam (D3), Sulphadoxine (D4), Meticrane (D5), Famotidine (D6), Dabrafenib (D7), Daranide (D8), Metahydrin (D9), Sulfapyridine (D10), Sulfanilamide (D11), Sulfathiazole (D12), Sulfaguanidine (D13), Sulfamethizole (D14), Sulfaphenazole (D15), Sulfisomidine (D16), Sulfamonomethoxine (D17), Sulfaperin (D18), Mafenide (D19), and Azosemide (D20), and presented the results in Table 3.
Table 3.
Connection-based indices of drugs.
The corresponding physicochemical properties are summarized in Table 4. The relevant data were obtained from the PubChem and ChemSpider databases.
Table 4.
The properties of drugs related to their physicochemical characteristics.
3.1. Supervised Machine Learning (ML) Framework
A subfield of machine learning called supervised learning uses example input–output pairs to map inputs to outputs in order to find the best estimators. It operates on the assumption of an underlying function derived from labeled training data, which consists of predefined examples. These algorithms rely on external guidance in the form of labeled datasets and typically involve dividing the input data into training and testing subsets. The training dataset contains the dependent (output) variable, which is used for prediction or classification. During the learning process, the algorithm identifies patterns within the training data and applies these learned relationships to the test data for performance evaluation. We discuss the most popular supervised machine learning algorithms in this section.
3.1.1. Random Forest (RF) Algorithm
An established ensemble learning technique that works well for both classification and regression tasks in machine learning is the RF algorithm. It is a reliable and adaptable technique that frequently acts as a solid baseline model for a range of predictive applications.
| Hyperparameter | Typical Range |
| n_estimators | 100–1000 |
| max_depth | 5–30 |
| min_samples_split | 2–10 |
| min_samples_leaf | 1–5 |
| max_features | sqrt, log2 |
| random_state | 42 |
| Leave-One-Out Cross-Validation (LOOCV) | cv, LeaveOneOut() |
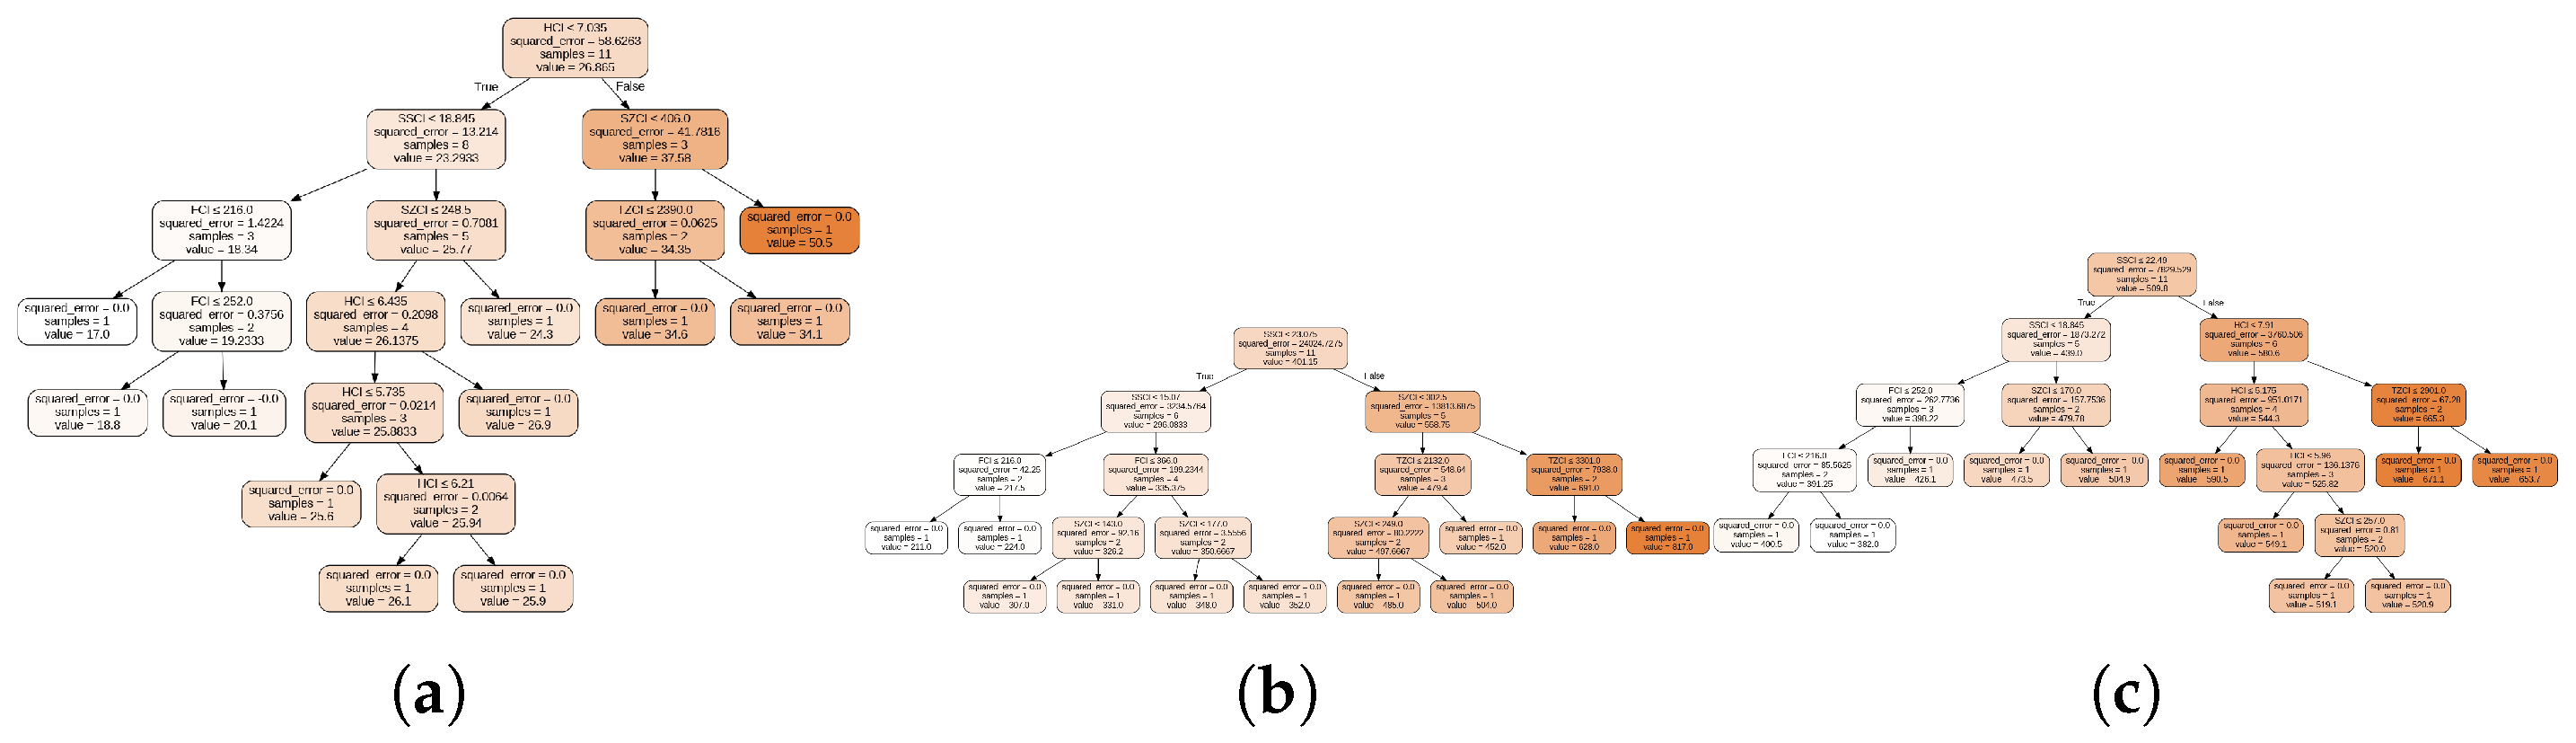
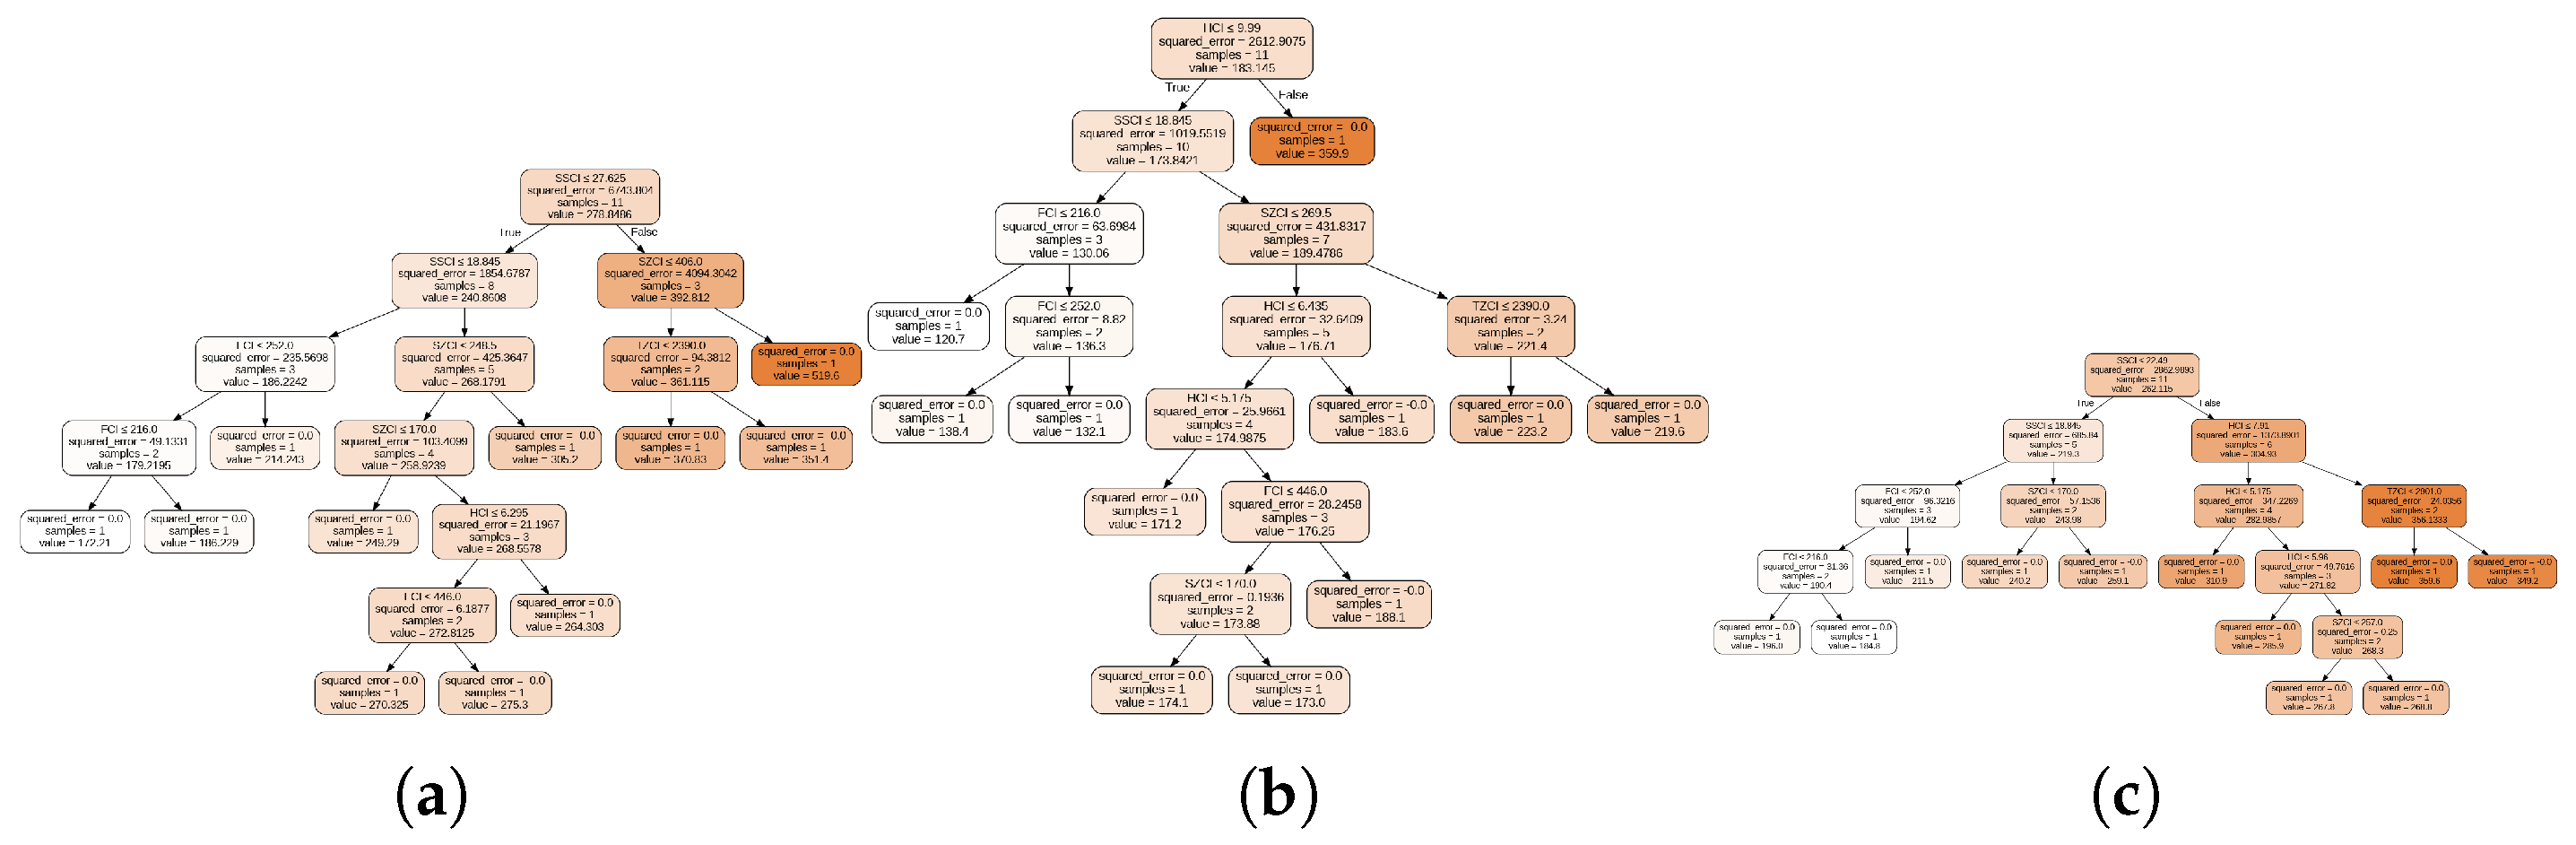
During training, the algorithm creates several decision trees. The decision trees of polarizability, complexity, boiling point, molecular weight, molar volume, and flash point are given in Figure 3 and Figure 4. An RF-regression model’s ultimate output can be expressed as follows:
where is the total number of trees in the forest; its output is shown in Table 5 and Table 6, which show , , , and .
Figure 3.
Decision tree for (a) polarizability, (b) complexity, (c) and boiling point.
Figure 4.
Decision tree for (a) molecular weight, (b) molar volume, (c) and flash point.
Table 5.
Random Forest-based prediction of molecular-structure properties.
Table 6.
Error metrics for Random Forest and LOOCV.
3.1.2. Linear Regression
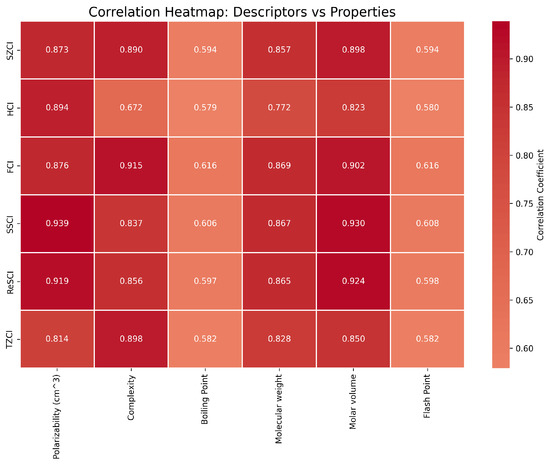
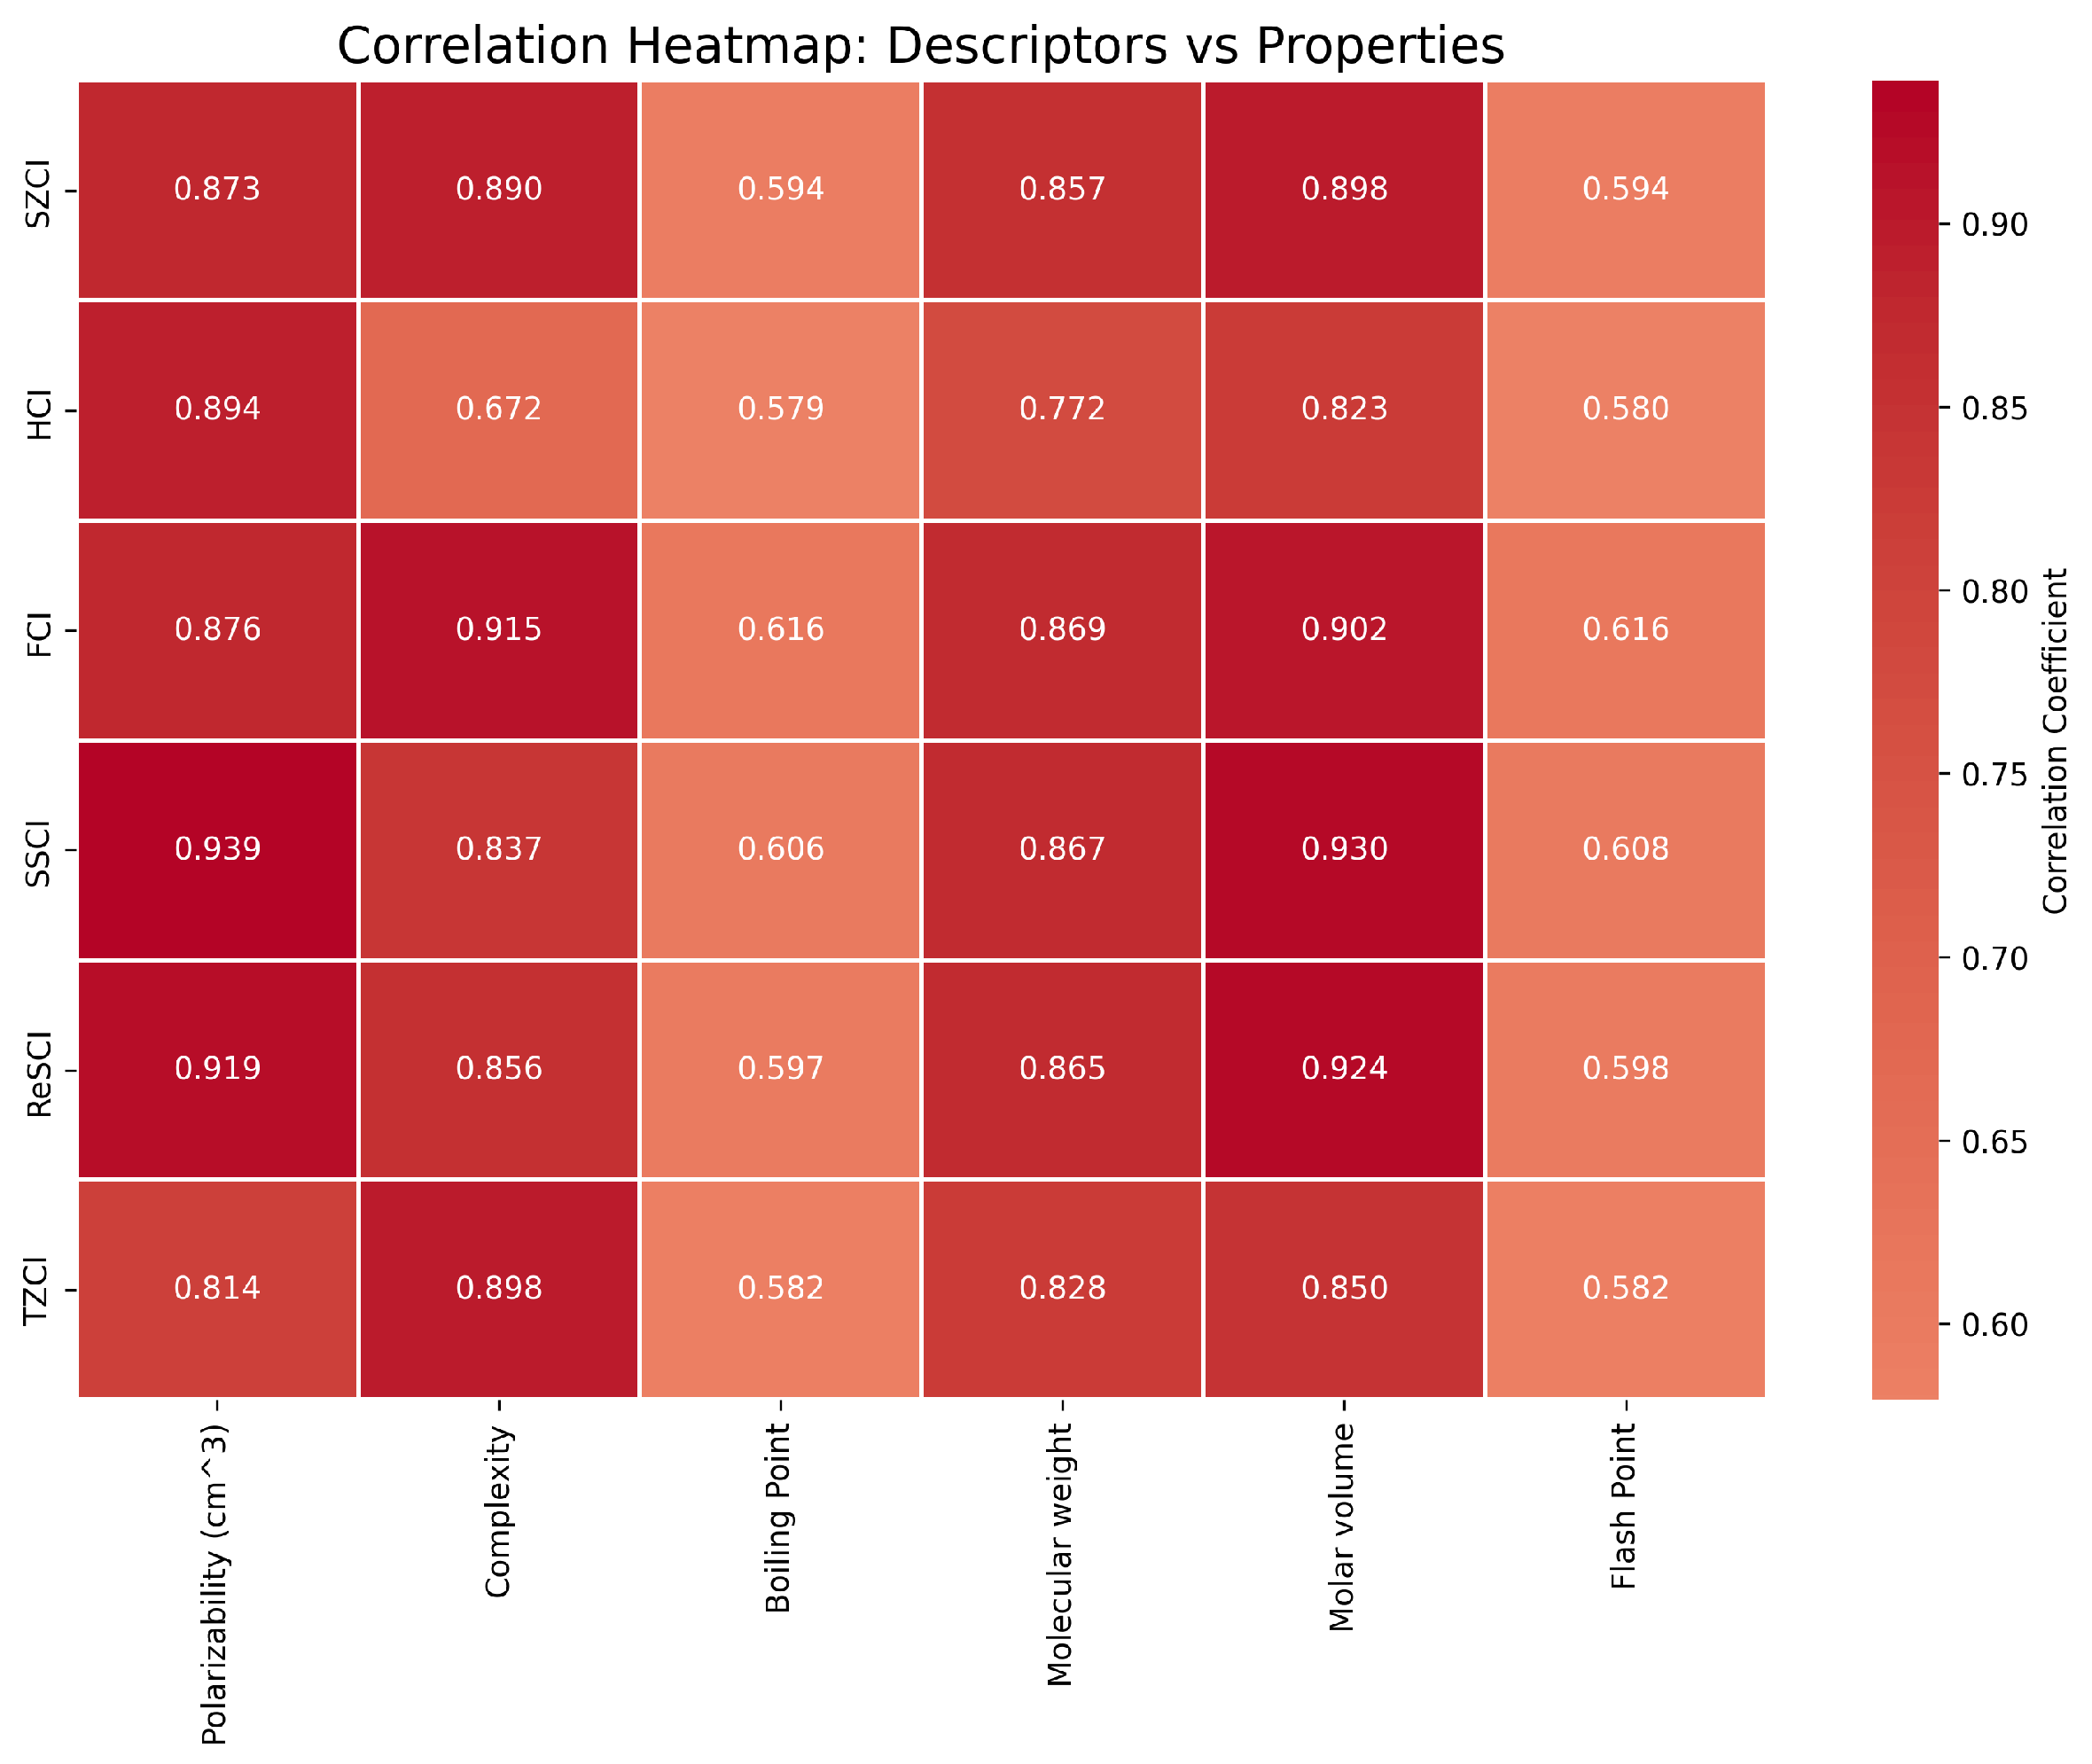
Linear regression is a supervised learning method that estimates and predicts the association between a response variable and one or more explanatory variables by fitting an optimal linear model to the observed data. The general form of the model is , where Y represents the dependent variable, X the independent variable, B the slope, and A the intercept. The model aims to minimize the residual sum of squares, the difference between observed and predicted values. Owing to its simplicity and interpretability, linear regression serves as a fundamental tool for analyzing relationships among molecular parameters and evaluating the potential efficacy of anti-cancer drugs. We have computed several linear regression models with respect to TIs presented in Table 3 and placed them in Table 7. Figure 5 provides a visual comparison of the correlation coefficients, whereas Figure 6 displays an RF-based distribution plot highlighting the relationship between the observed and predicted values.
Table 7.
Linear regression corresponding to ndices and properties of drugs.
Figure 5.
Correlation coefficients comparison.
Figure 6.
Random Forest algorithm-based distribution plot.
3.1.3. Extreme Gradient-Boosting Algorithm
The Extreme Gradient-Boosting (XGBoost) algorithm was implemented to develop a regression model for the given dataset. Initially, the essential Python libraries, including pandas, numpy, XGboost, and matplotlib, were installed to support data processing, model training, and visualization. The dataset was defined as a dictionary comprising the names of various drugs along with their respective characteristics and the target variable associated with each drug. This dictionary was then converted into a pandas Data Frame to facilitate data manipulation and analysis, after which the relevant details of the Data Frame were displayed for verification. Subsequently, the features and the target variable were separated to prepare the data for model training.
The XGBoost Regressor class was then employed to train the Extreme Gradient Boosting regression model on the defined features and target variable. Once the model was trained, it was utilized to predict the target variable values. To assess the performance of the model, the predicted values were compared with the actual values using a scatter plot. Finally, the expected and predicted results were summarized and presented in tabular form for clear interpretation and evaluation.
| Hyperparameter | Typical Range |
| n_estimators | 100–1000 |
| max_depth | 6–30 |
| learning_rate (eta) | 0.1 |
| random_state | 42 |
| objective | reg:squarederror |
| Train/Test Split | (n − 1)/1 |
| Leave-One-Out Cross-Validation (LOOCV) | cv, LeaveOneOut() |
| reg_lambda | 1 |
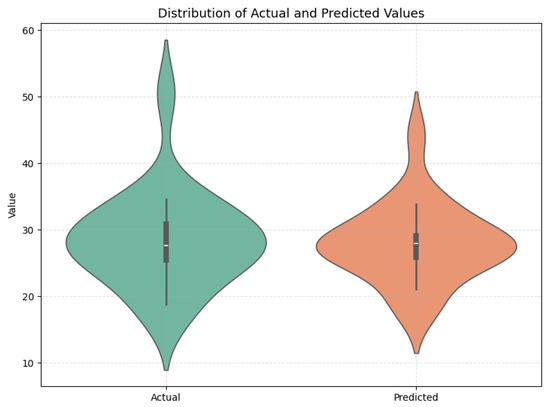
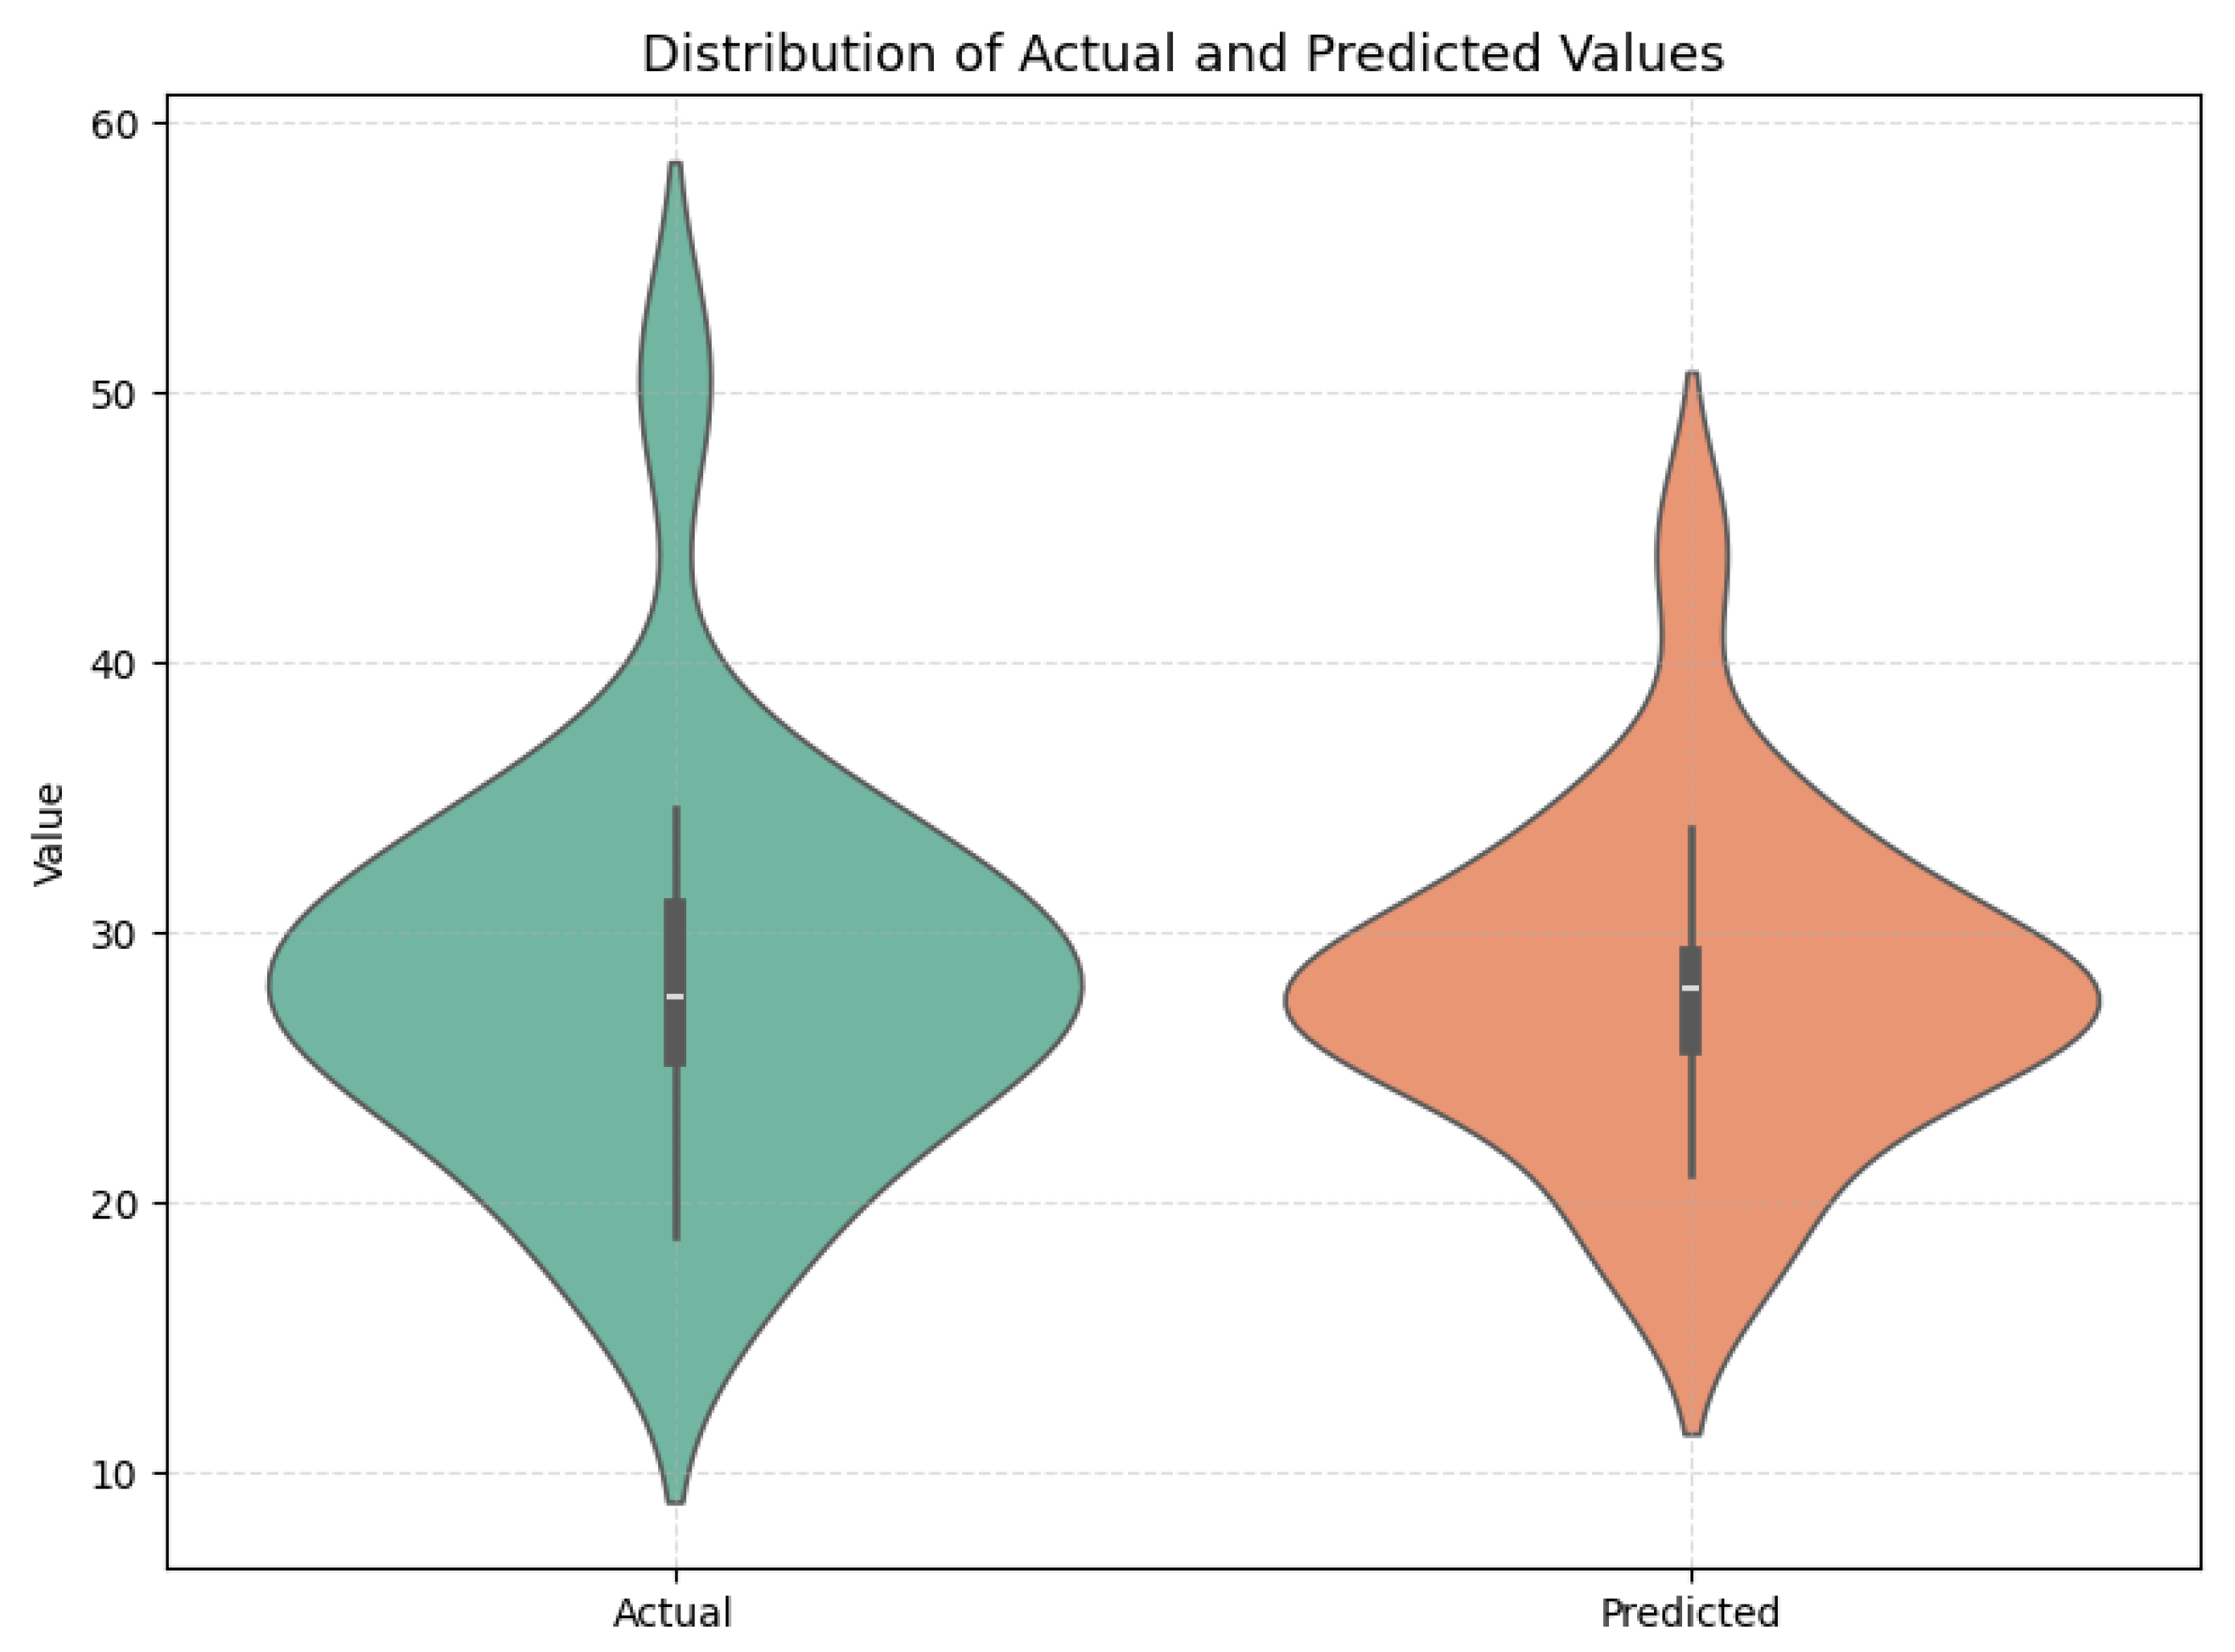
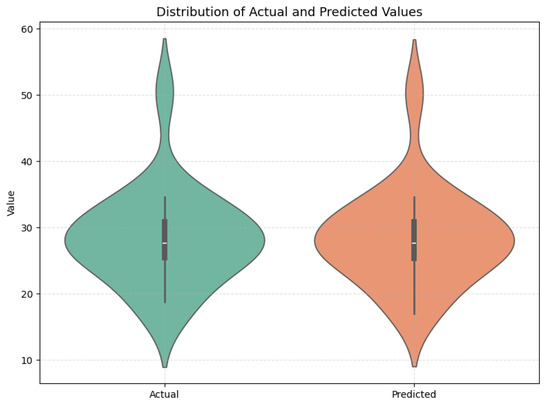
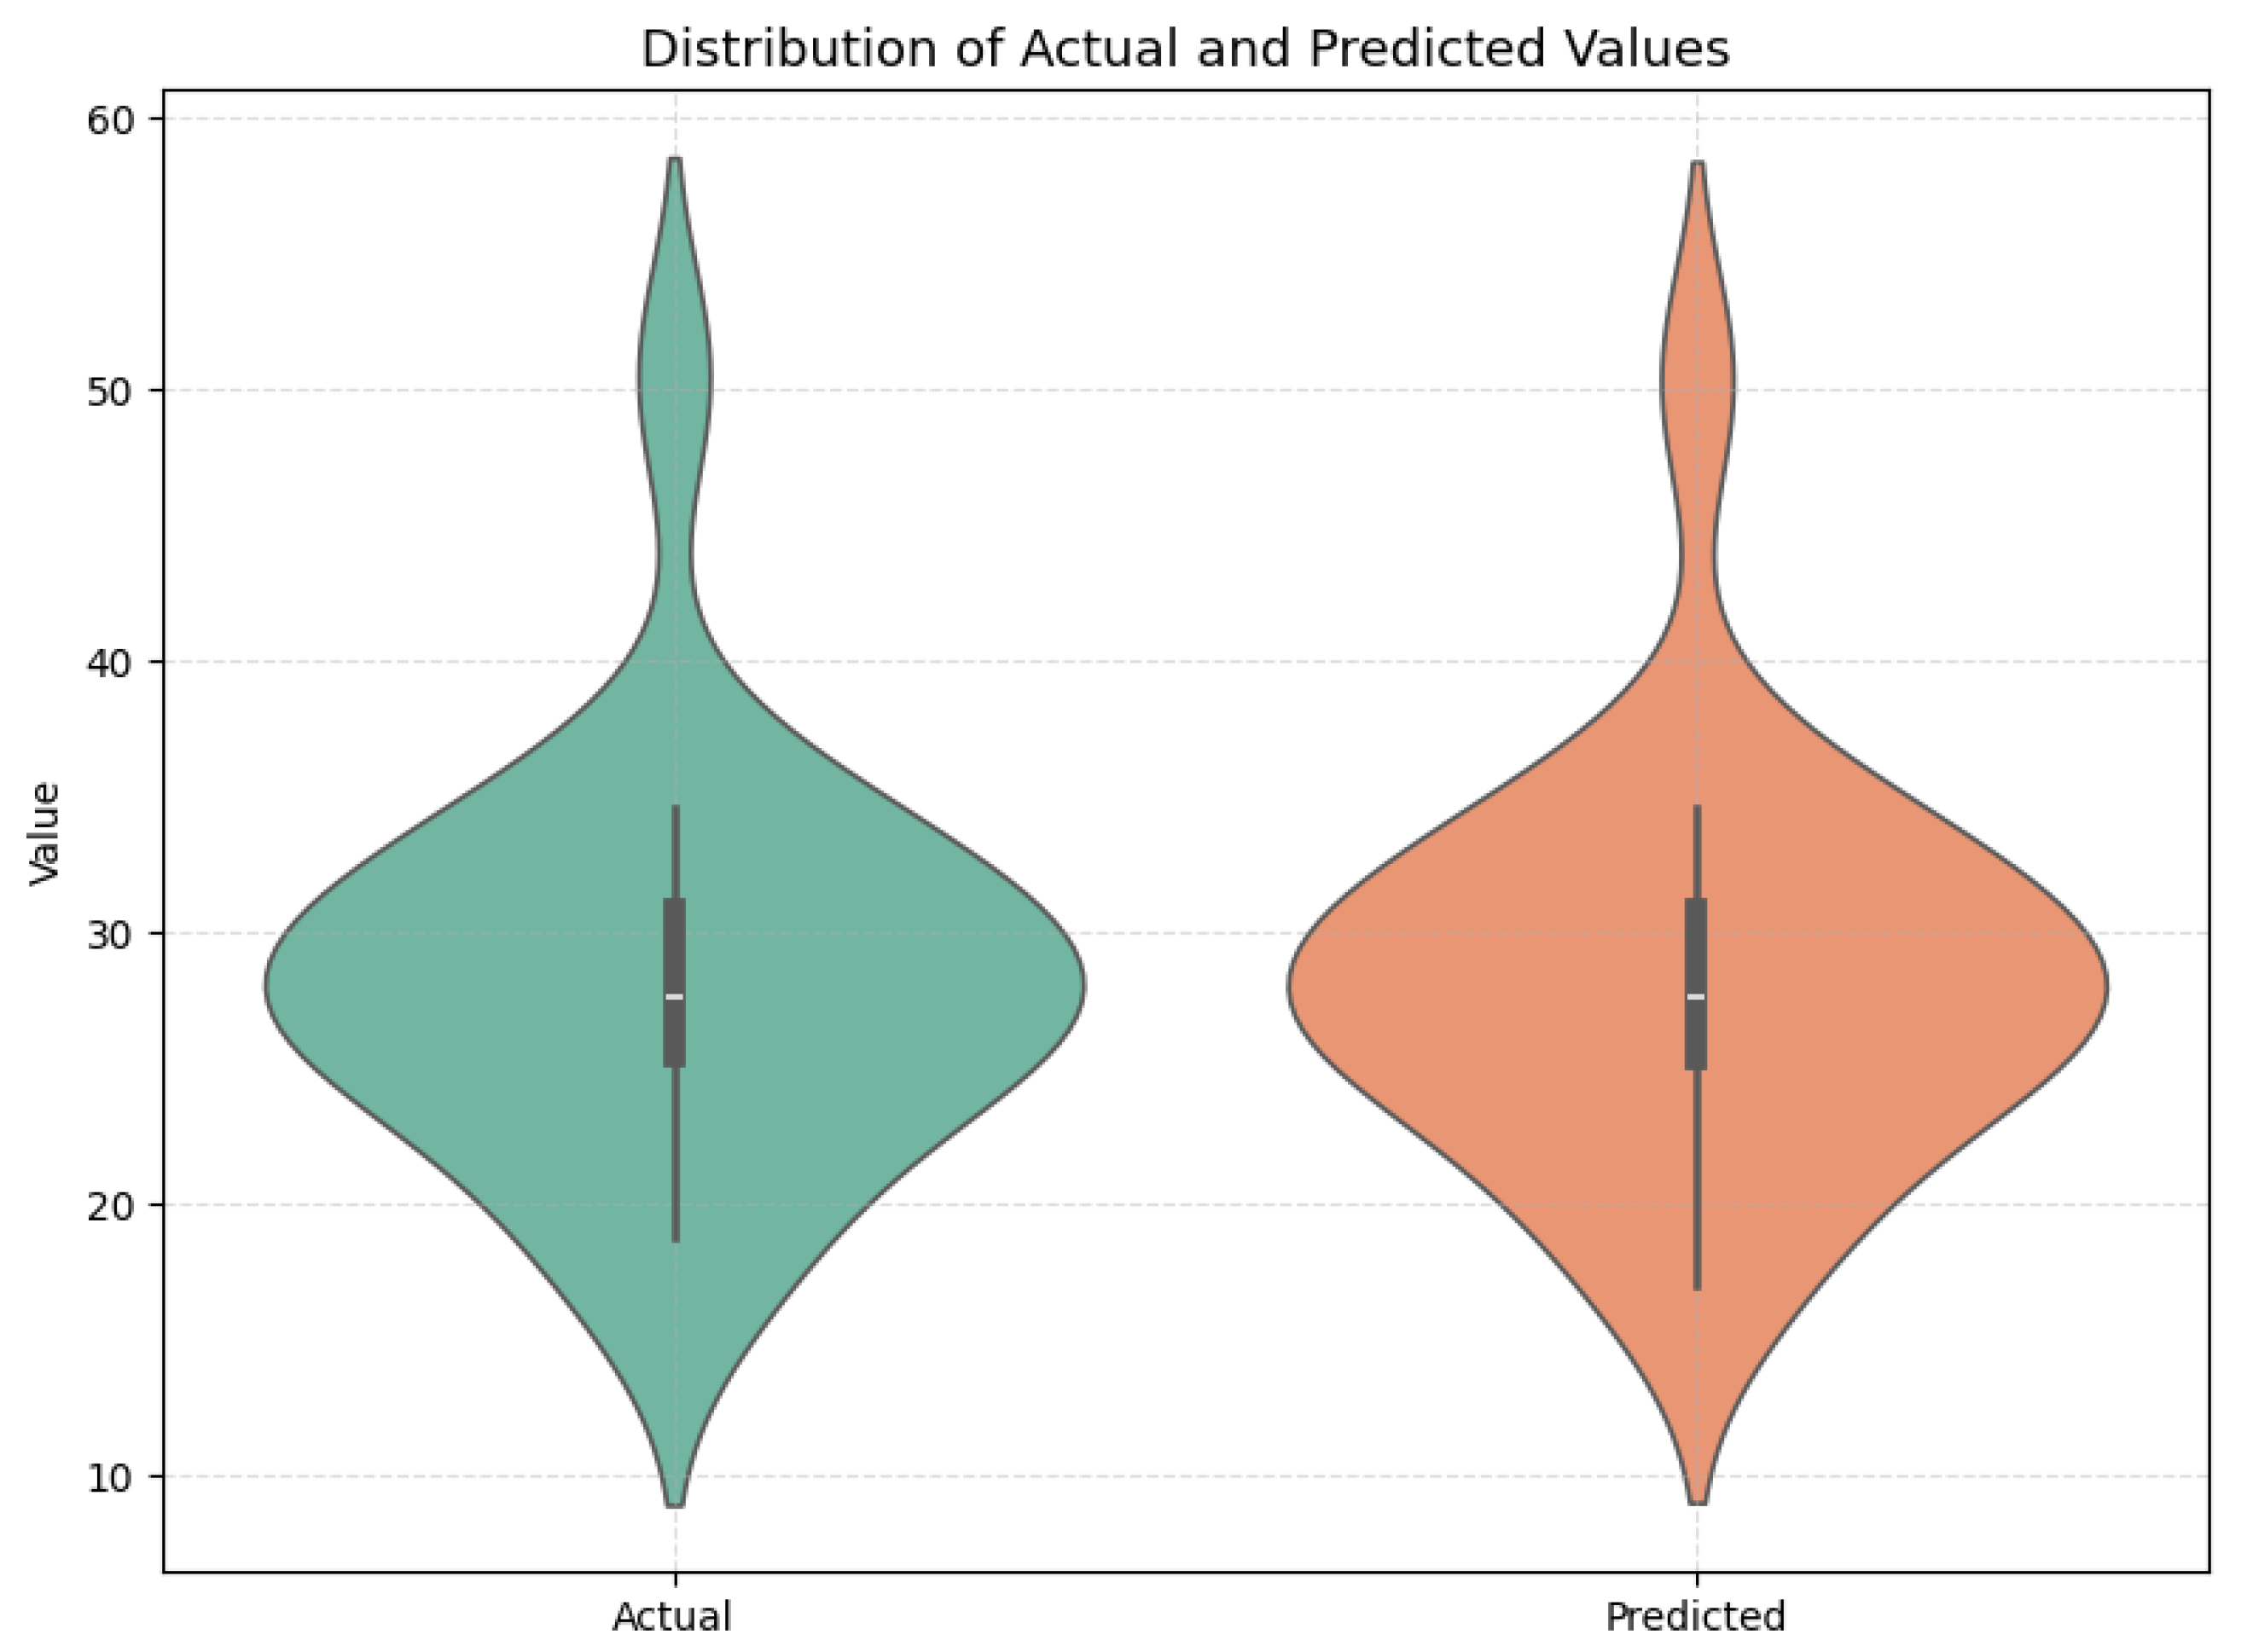
Table 8 shows the predicted porperties of molecular strutures and Table 9 represents , , , and , while the XGBoost-based distribution plot shown in Figure 7 illustrates the comparison between the actual and predicted values.
Table 8.
XGBoost algorithm-based prediction of molecular-structure properties.
Table 9.
Error metrics for XGBoost and LOOCV.
Figure 7.
XGBoost algorithm-based distribution plot.
3.1.4. Multicollinearity and Descriptor Redundancy Analysis
The inter-correlation of the above molecular descriptors was checked using the Pearson correlation matrix and the variance inflation factor (VIF) method. According to the results of the correlation analysis, high correlations between the molecular descriptors were observed. This is expected because many topological indices have similar origins in the structural properties of the molecular graphs. Specifically, high values of correlation between the SZCI, ReSZCI, and TZCI molecular descriptors (r = 0.993, r = 0.991, and r = 0.993, respectively) were observed (Table 10). Moreover, the values of the VIF method, which were significantly higher than the threshold (VIF > 10), confirmed the existence of multicollinearity between the molecular descriptors (Table 11). However, such results are expected in the case of the molecular descriptors of the molecular structures studied in the present paper, because many of the topological indices used have similar origins in the structural properties of the molecular structures. Among the studied molecular descriptors, the H index presented the lowest values of correlation compared to the other indices.
Table 10.
Pearson correlation matrix of the considered molecular descriptors.
Table 11.
Variance inflation factor (VIF) values for the considered molecular descriptors.
4. Discussion
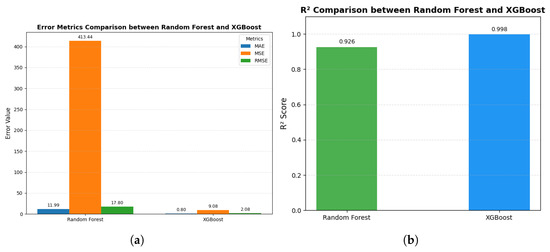
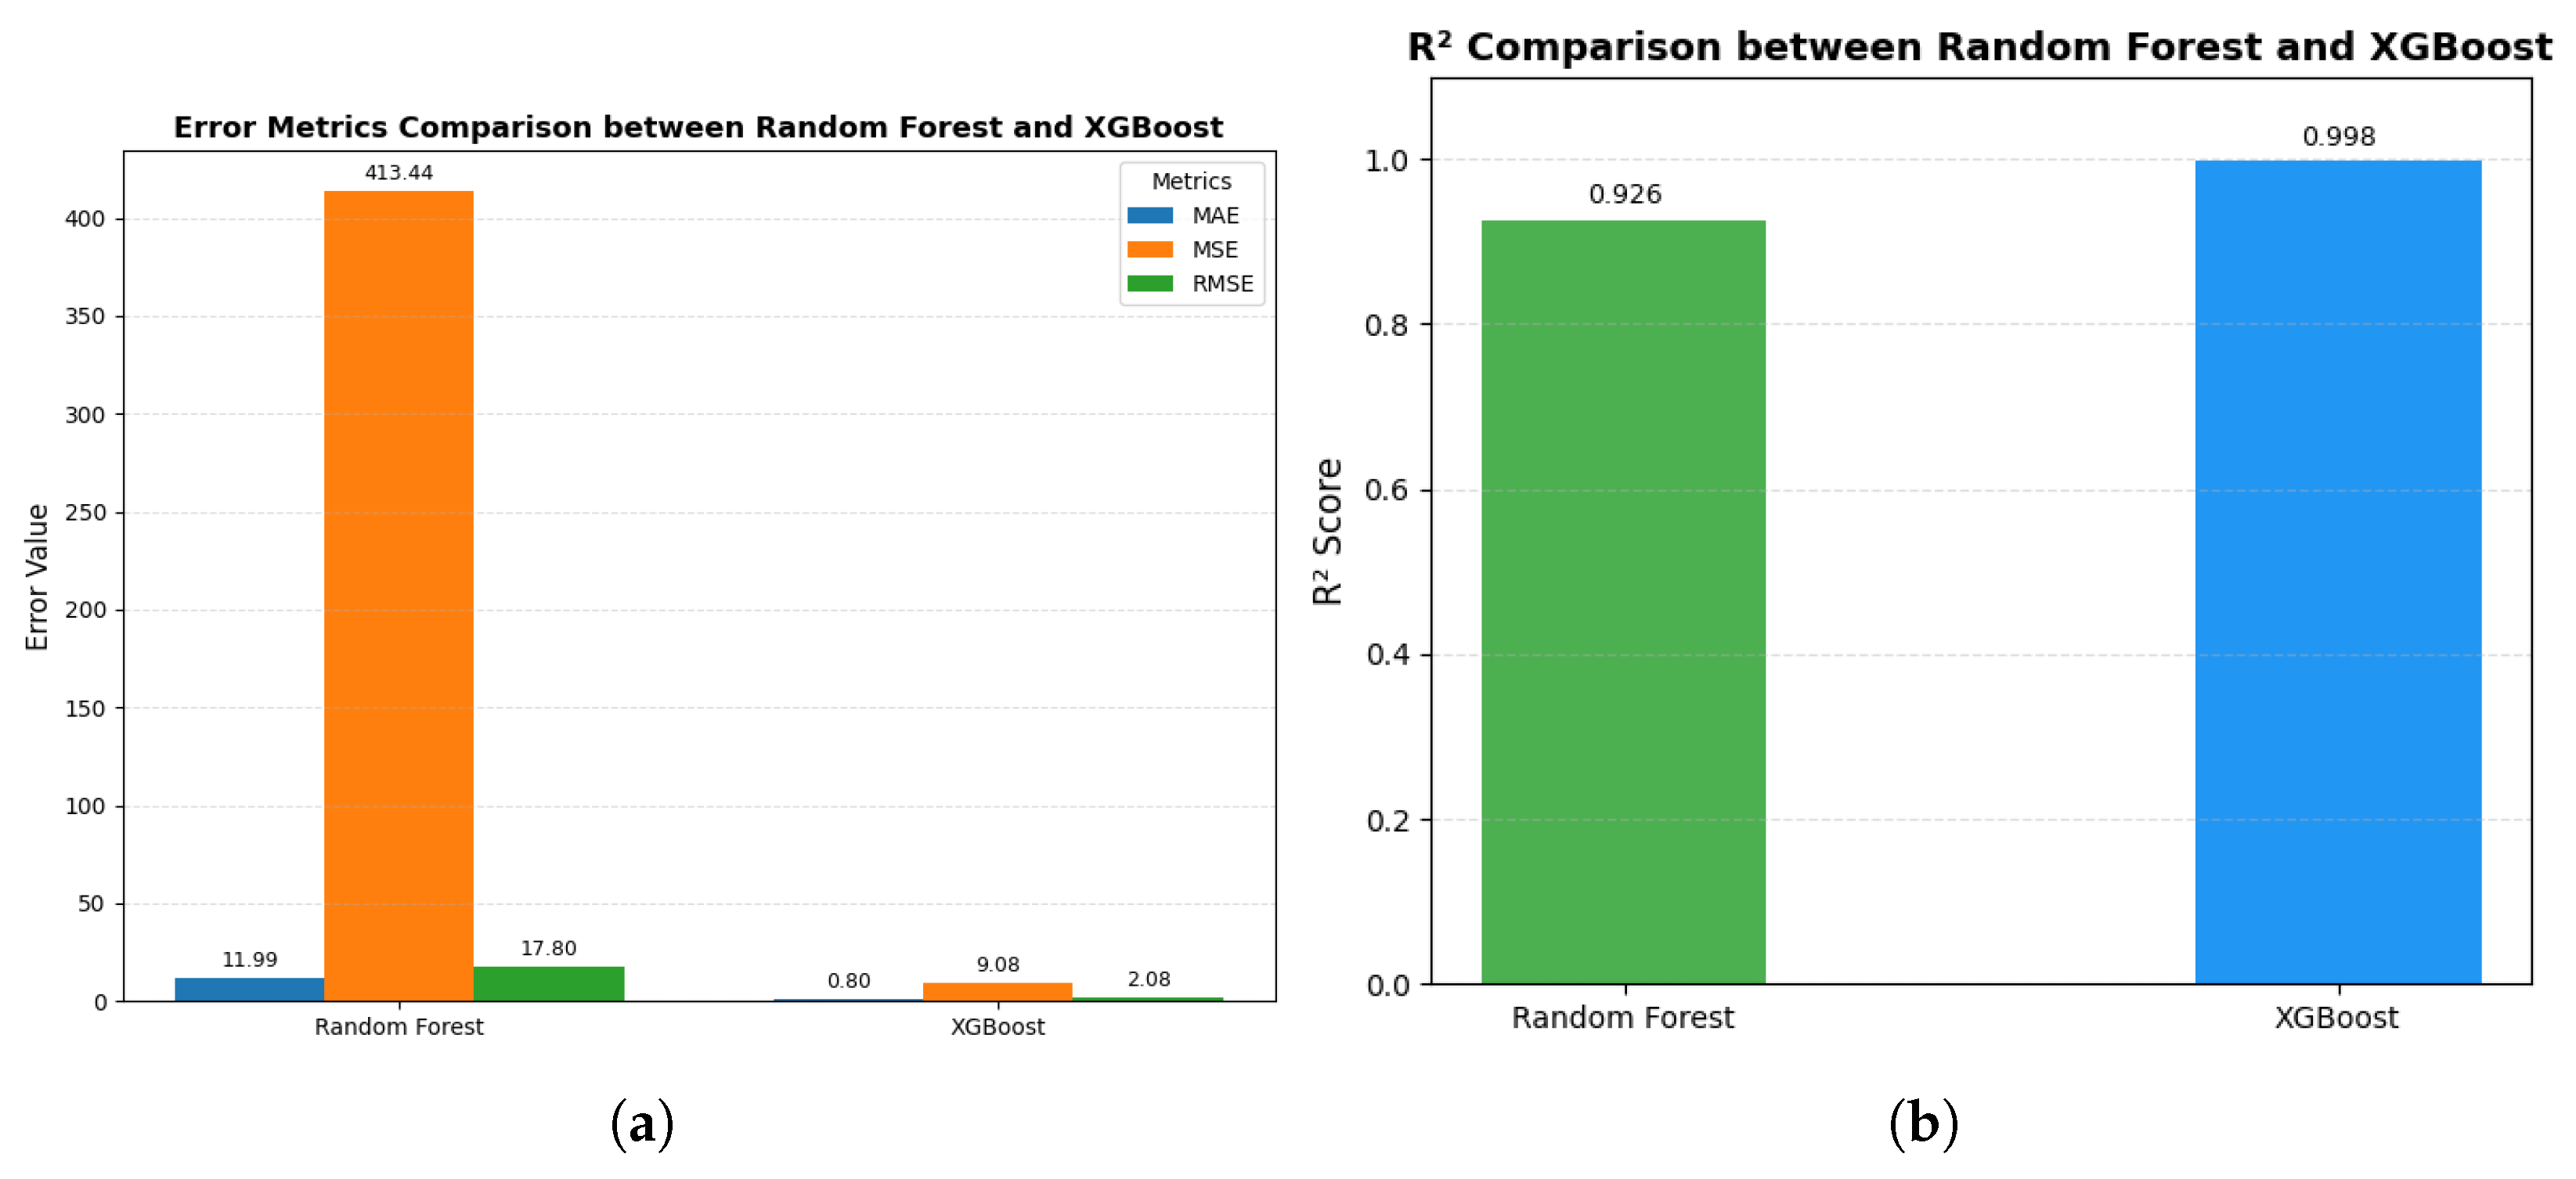
Figure 8a,b present the error metrics used to evaluate the performance of predictive models, namely , , , and , for Random Forest and Extreme Gradient Boosting. The bar charts show a clear comparison of the predictive accuracy of the models. Reviewing the results from the above will show that the XGBoost model performs better in prediction, since it has lower MAE, MSE, and RMSE values with a high value of the R2 score. These confirmations prove that XGBoost gives better results with minimum errors while predicting, and it is one of the robust algorithms for performing any predictive modeling task.
Figure 8.
Matrices comparison of (a) MAE, MSE, and RMSE. (b) values.
This baseline mean predictor is shown to exhibit large errors in all properties, thereby confirming that a trivial prediction is not enough. The Random Forest and XGBoost predictors show a significant improvement in the accuracy of prediction. XGBoost is found to perform better than RF for all properties, as it exhibits extremely low MAE, MSE, and RMSE, as well as very high R2 values (Table 12).
Table 12.
Baseline model performance.
5. Conclusions
In this work, supervised machine learning techniques were employed to model the relationship between sulfonamide drugs and their associated topological indices (TIs). Two ensemble learning algorithms, Random Forest (RF) and Extreme Gradient Boosting (XGBoost), were implemented and evaluated using several statistical performance metrics, including mean absolute error (MAE), mean squared error (MSE), root mean square error (RMSE), and the coefficient of determination (R2).
Prior to model development, the interdependence among the molecular descriptors was examined through Pearson correlation analysis and variance inflation factor (VIF) evaluation to assess potential descriptor redundancy and multicollinearity. The results indicated strong correlations among several indices, which is expected for graph-based descriptors derived from similar structural characteristics of molecular graphs.
Comparative analysis of the predictive models revealed that the XGBoost algorithm achieved superior performance relative to the Random Forest model. In particular, XGBoost produced lower error values (MAE, MSE, and RMSE) and a higher coefficient of determination (R2 = 0.99), indicating a more accurate and reliable predictive capability. Visual inspection through violin plots further confirmed the improved distributional fit of the predictions generated by the XGBoost model.
Overall, the results demonstrate that XGBoost provides an efficient and robust approach for modeling the relationship between topological indices and the properties of sulfonamide drugs. The findings suggest that machine learning techniques based on graph-theoretic descriptors can serve as valuable tools for predictive analysis in computational chemistry and drug design, potentially assisting in the development and optimization of sulfonamide-based medicinal compounds.
Author Contributions
Conceptualization, H.A.; Methodology, H.A.; Software, H.A.; Validation, H.A.; Formal analysis, H.A.; Writing—original draft, H.A.; Writing—review and editing, A.A.; Visualization, A.A.; Supervision, A.A.; Project administration, A.A.; Funding acquisition, A.A. All authors have read and agreed to the published version of the manuscript.
Funding
This project was funded by the Deanship of Scientific Research (DSR) at King Abdulaziz University, Jeddah, Saudi Arabia, under grant no. (IPP: 300-247-2025). The authors therefore acknowledge, with thanks, DSR for technical and financial support.
Data Availability Statement
The original contributions presented in this study are included in the article. Further inquiries can be directed to the corresponding author.
Conflicts of Interest
The authors declare no conflicts of interest.
Abbreviations
The following abbreviations are used in this manuscript:
| QSPR | Quantitative Structure–Property Relationship |
| Sulfadiazine | |
| Dorzolamide | |
| Meloxicam | |
| Sulphadoxine | |
| Meticrane | |
| Famotidine | |
| Dabrafenib | |
| Daranide | |
| Metahydrin | |
| Sulfapyridine | |
| Sulfanilamide | |
| Sulfathiazole | |
| Sulfaguanidine | |
| Sulfamethizole | |
| Sulfaphenazole | |
| Sulfisomidine | |
| Sulfamonomethoxine | |
| Sulfaperin | |
| Mafenide | |
| Azosemide | |
| Machine Learning | |
| Random Forest | |
| Root Mean Squared Error | |
| Mean Squared Error | |
| Mean Absolute Error | |
| Root Square Error | |
| VIF | Variance Inflation Factor |
References
- Zhong, J.; Gan, X.; Alliston, K.R.; Lai, Z.; Yu, H.; Groutas, C.S.; Wong, T.; Groutas, W.C. Potential protease inhibitors based on a functionalized cyclic sulfamide scaffold. J. Comb. Chem. 2004, 6, 556–563. [Google Scholar] [CrossRef] [Scilit] [PubMed]
- Das, B.; Reddy, V.S.; Reddy, M.R. An efficient and selective tosylation of alcohols with p-toluenesulfonic acid. Tetrahedron Lett. 2004, 45, 6717–6719. [Google Scholar] [CrossRef] [Scilit]
- Winum, J.Y.; Scozzafava, A.; Montero, J.L.; Supuran, C.T. Therapeutic potential of sulfamides as enzyme inhibitors. Med. Res. Rev. 2006, 26, 767–792. [Google Scholar] [CrossRef] [Scilit]
- Cheng, X.-C.; Wang, Q.; Fang, H.; Xu, W.F. Role of sulfonamide group in matrix metalloproteinase inhibitors. Curr. Med. Chem. 2008, 15, 368–373. [Google Scholar] [CrossRef] [Scilit] [PubMed]
- Penning, T.D.; Talley, J.J.; Bertenshaw, S.R.; Carter, J.S.; Collins, P.W.; Docter, S.; Graneto, M.J.; Lee, L.F.; Malecha, J.W.; Miyashiro, J.M.; et al. Synthesis and biological evaluation of the 1,5-diarylpyrazole class of cyclooxygenase-2 inhibitors: Identification of SC-58635 (celecoxib). J. Med. Chem. 1997, 40, 1347–1365. [Google Scholar] [CrossRef] [Scilit]
- Talley, J.J.; Brown, D.L.; Carter, J.S.; Graneto, M.J.; Koboldt, C.M.; Masferrer, J.L.; Perkins, W.E.; Rogers, R.S.; Shaffer, A.F.; Zhang, Y.Y.; et al. Valdecoxib: A potent and selective inhibitor of COX-2. J. Med. Chem. 2000, 43, 775–777. [Google Scholar] [CrossRef] [Scilit] [PubMed]
- Burger, A.; Abraham, D.J. Burger’s Medicinal Chemistry and Drug Discovery; Wiley: Hoboken, NJ, USA, 2003. [Google Scholar]
- Markgren, P.-O.; Schaal, W.; Hämäläinen, M.; Karlén, A.; Hallberg, A.; Samuelsson, B.; Danielson, U.H. Relationships between structure and interaction kinetics for HIV-1 protease inhibitors. J. Med. Chem. 2002, 45, 5430–5439. [Google Scholar] [CrossRef] [Scilit]
- Rotella, D.P. Phosphodiesterase 5 inhibitors: Current status and potential applications. Nat. Rev. Drug Discov. 2002, 1, 674–682. [Google Scholar] [CrossRef] [Scilit]
- Crespo, R.; de Bravo, M.G.; Colinas, P.A.; Bravo, R.D. In vitro antitumor activity of N-glycosyl sulfonamides. Bioorg. Med. Chem. Lett. 2010, 20, 6469–6471. [Google Scholar] [CrossRef] [Scilit]
- Boufas, W.; Dupont, N.; Berredjem, M.; Berrezag, K.; Becheker, I.; Berredjem, H.; Aouf, N.E. Synthesis and antibacterial activity of sulfonamides: SAR and DFT studies. J. Mol. Struct. 2014, 1074, 180–185. [Google Scholar] [CrossRef] [Scilit]
- Danish, M.; Tahir, M.N.; Hussain, A.; Ashfaq, M.; Sadiq, M.N. Crystal structure of 4-{[(naphthalen-2-yl)sulfonylamino]methyl} cyclohexanecarboxylic acid. Acta Crystallogr. Sect. E 2015, 71, o145. [Google Scholar] [CrossRef] [Scilit] [PubMed]
- Danish, M.; Tahir, M.N.; Jabeen, N.; Raza, M.A. Crystal structure of (2S)-3-methyl-2-[(naphthalen-1-ylsulfonyl)amino]butanoic acid. Acta Crystallogr. Sect. E 2015, 71, o308. [Google Scholar] [CrossRef] [Scilit] [PubMed]
- Danish, M.; Bibi, A.; Gilani, K.; Raza, M.A.; Ashfaq, M.; Arshad, M.N.; Asiri, A.M.; Ayub, K. Antiradical, antimicrobial and enzyme inhibition evaluation of sulfonamide-derived esters: Synthesis, X-ray analysis and DFT studies. J. Mol. Struct. 2019, 1175, 379–388. [Google Scholar] [CrossRef] [Scilit]
- Danish, M.; Akhtar, A.; Ashfaq, M.; Arshad, M.N.; Asiri, A.M. Synthesis, crystal structure, and spectral properties of new sulfonamides. J. Chem. Crystallogr. 2021, 51, 543–552. [Google Scholar] [CrossRef] [Scilit]
- Tang, J.-H.; Ali, U.; Javaid, M.; Shabbir, K. Zagreb connection indices of subdivision and semi-total point operations on graphs. J. Chem. 2019, 2019, 9846913. [Google Scholar] [CrossRef] [Scilit]
- Ali, U.; Javaid, M.; Kashif, A. Modified Zagreb connection indices of the T-sum graphs. Main Group Metal Chem. 2020, 43, 43–55. [Google Scholar] [CrossRef] [Scilit]
- Cao, J.; Ali, U.; Javaid, M.; Huang, C. Zagreb connection indices of molecular graphs based on operations. Complexity 2020, 2020, 7385682. [Google Scholar] [CrossRef] [Scilit]
- Ahmad, A.; Koam, N.A.; Masmali, I.; Azeem, M.; Ghazwani, H. Connection number topological aspect for backbone DNA networks. Eur. Phys. J. E 2023, 46, 120. [Google Scholar] [CrossRef] [Scilit]
- Liu, J.-B.; Raza, Z.; Javaid, M. Zagreb connection numbers for cellular neural networks. Discrete Dyn. Nat. Soc. 2020, 2020, 8038304. [Google Scholar] [CrossRef] [Scilit]
- Javaid, M.; Ali, U.; Siddiqui, K. Novel connection based Zagreb indices of several wheel-related graphs. Comput. J. Comb. Math. 2021, 1, 1–28. [Google Scholar]
- Ullah, A.; Shamsudin, Z.; Hamraz, A. Zagreb connection topological descriptors and structural property of the triangular chain structures. Phys. Scr. 2023, 98, 025009. [Google Scholar] [CrossRef] [Scilit]
- Koam, N.A.; Azeem, M.; Ahmad, A.; Masmali, I. Connection number-based molecular descriptors of skin cancer drugs. Ain Shams Eng. J. 2024, 15, 102750. [Google Scholar] [CrossRef] [Scilit]
- Sattar, A.; Javaid, M.; Bonyah, E. On the studies of dendrimers via connection-based molecular descriptors. Math. Probl. Eng. 2022, 2022, 1–13. [Google Scholar] [CrossRef] [Scilit]
- Ahmed, W.; Ali, K.; Zaman, S.; Agama, F.T. A python based algorithmic approach to optimize sulfonamide drugs via mathematical modeling. Sci. Rep. 2024, 14, 12264. [Google Scholar] [CrossRef] [Scilit] [PubMed]
- Ahmed, W.; Ashraf, T.; Zaman, S.; Ali, K.; Hussain, A.; Belay, M.B. Molecular graphs and entropy based QSPR analysis of drugs by using machine learning. Discov. Comput. 2025, 28, 78. [Google Scholar] [CrossRef] [Scilit]

Disclaimer/Publisher’s Note: The statements, opinions and data contained in all publications are solely those of the individual author(s) and contributor(s) and not of MDPI and/or the editor(s). MDPI and/or the editor(s) disclaim responsibility for any injury to people or property resulting from any ideas, methods, instructions or products referred to in the content. |
© 2026 by the authors. Licensee MDPI, Basel, Switzerland. This article is an open access article distributed under the terms and conditions of the Creative Commons Attribution (CC BY) license.