Abstract
Thermal runaway accidents in lithium batteries necessitate effective thermal management. This study proposes a liquid cooling plate with internal spiral-array fins and investigates its performance under electrochemically coupled temperature-dependent heat generation conditions. A pseudo-two-dimensional (P2D) electrochemical model simulates battery discharge at 0.5C–2C rates to obtain heat generation characteristics, which serve as inputs for a fluid–solid coupled heat transfer model. The effects of spiral fin parameters—pitch (S) and height (h)—are systematically analyzed. Three main contributions are presented: spiral fins induce secondary flow that disrupts thermal boundary layer development and enhances fluid mixing, with smaller pitch extending the flow path and increasing radial velocity; a performance evaluation criterion (PEC)-based analysis identifies the optimal parameter range that balances heat transfer enhancement and pressure drop penalty; and increasing the fin height raises the finned area proportion and swirl intensity, suppressing bypass flow and strengthening heat transfer, with effects more pronounced at higher discharge rates. Key quantitative findings show that at 2C discharge, the optimized configuration (S = 3 mm, h = 0.5 mm) achieves a comprehensive performance index of 2.19 and reduces the maximum temperature by 25.32% compared to smooth channels. This work integrates electrochemical and thermal models to provide a new approach for optimizing spiral fin microchannels tailored to lithium battery operation.
Keywords:
lithium battery; heat generation characteristics; thermal management; electrochemical model; microchannel liquid cooling plate MSC:
80-10
1. Introduction
Currently, lithium batteries have become one of the key energy carriers for new energy power equipment owing to their high energy density and long lifespan [1,2]. However, the combined effects of ohmic resistance and electrochemical reactions cause lithium-ion batteries to generate significant heat during charging and discharging, leading to a nonlinear rise in cell temperature [3]. When operating temperatures exceed 50 °C, thickening of the SEI (solid electrolyte interphase) film and distortion of the cathode structure further reduce lithium-ion migration rates, diminishing charge/discharge efficiency. Moreover, high-temperature environments trigger exponential capacity decay and may even cause thermal abuse and thermal runaway [4,5,6]. In most spontaneous combustion incidents involving lithium-ion vehicles and in the May 2024 fire at a California lithium battery energy storage facility, the primary cause was thermal runaway triggered by sustained high temperatures and its chain reaction. Thus, lithium battery thermal safety cannot be overlooked. The optimal operating temperature range for lithium batteries is between 20 °C and 40 °C, with module temperature differentials ideally kept below 5 °C [7]. Liquid cooling plates represent a critical thermal management technique for lithium batteries and are currently a research hotspot in lithium battery thermal safety.
In current liquid cooling plate designs, heat sources are often simplified to time-invariant averages or empirical formulas. However, this approach fails to accurately reflect the dynamic heat generation characteristics of batteries during operation. By contrast, simulating the charging and discharging processes using electrochemical models to calculate the time-varying volumetric heat generation rate of lithium batteries better represents the actual heat generation behavior. Based on complexity, electrochemical models can be categorized into single-particle models [8,9], porous electrode models [10], and pseudo-two-dimensional (P2D) models [11,12,13]. Among these, the P2D model, based on electrochemical mechanisms, describes lithium-ion diffusion in electrodes, mass transfer in electrolytes, charge conservation (potential distribution), and reaction kinetics. It enables the investigation of performance impacts under varying operating conditions (rate and temperature) and provides more accurate heat generation simulations [14,15,16].
Current primary lithium-ion battery thermal management cooling methods include air cooling, phase change material (PCM) cooling, and liquid cooling [17,18]. Air cooling features simple structure and low cost, being the earliest applied thermal management approach [19,20,21]. However, its low specific heat capacity results in significant temperature gradients along the airflow direction and reduced thermal conductivity, limiting its effectiveness under high-capacity battery demands or in high-temperature environments. Phase change cooling maintains stable battery temperatures by absorbing heat during phase transitions [22,23]. However, it struggles to adapt to varying operating conditions and may fail when materials fully melt.
Liquid cooling has become the most widely adopted cooling method owing to its high cooling efficiency and ease of pump power regulation [24,25,26]. Beyond conventional cold plate designs, emerging research explores direct immersion cooling and surface modifications, such as using laser-induced graphene (LIG) on battery casings to enhance boiling heat transfer, which has shown remarkable temperature suppression under extreme discharge rates [27]. Based on battery heat generation models, designing efficient liquid cooling plate structures for rapid heat extraction is critical. Microchannel liquid cooling plates have gained widespread application and attention in research owing to their high heat dissipation capacity and lightweight advantages. In 1981, Tuckerman and Pease [28] first proposed the concept of microchannel heat sinks, which garnered significant attention for their compact size, rapid heat dissipation, and light weight. As research progressed, it was discovered that in conventional straight-channel flow paths, the thermal boundary layer continuously expands while high-temperature fluid accumulates on the microchannel inner walls. Researchers attempted to disrupt this thermal boundary layer by modifying microchannel geometric parameters or altering the inner wall structure, thereby enhancing heat transfer performance [29,30,31,32]. Lu et al. [33,34] designed a single-sided rectangular internal rib array microchannel, achieving a 13.3% improvement in temperature gradient uniformity on the heat sink compared to rib-free microchannel heat sinks. Chen et al. [35] investigated the flow and heat transfer characteristics of microchannels with staggered internal fins. By comparing the thermal performance of microchannels with different fin structures and smooth rectangular microchannels, they found that the Nusselt numbers of finned microchannels were consistently higher than those of smooth rectangular microchannels, demonstrating significant heat transfer enhancement. While existing studies have explored various fin structures, such as rectangular ribs and staggered fins, they primarily rely on discontinuous or discrete rib arrangements that disrupt the boundary layer locally but do not continuously guide the flow along curved paths. By contrast, the spiral-array fins proposed in this study introduce a curved, continuous fin geometry that induces sustained secondary flow and swirl throughout the channel. This design innovation enables more effective disruption of thermal boundary layer development and promotes enhanced fluid mixing compared to conventional straight or staggered rib configurations. While these studies have explored various fin structures (e.g., rectangular ribs and staggered fins), spiral-array fins—a configuration that induces secondary flow through curved paths—have not yet been investigated in battery liquid cooling plates. Recent advances in liquid cooling plates for specific battery formats, such as the multibranch-converging channels designed for blade batteries, have demonstrated that optimizing flow paths can significantly enhance temperature uniformity and reduce energy consumption in battery packs [36]. This further motivates the exploration of novel fin architectures, like the spiral array, to achieve similar or better thermal performance in prismatic cell applications. Moreover, previous fin-enhanced microchannel studies predominantly employed simplified constant heat flux boundaries, whereas the present study couples the fin structure with a P2D electrochemical model that accounts for temperature-dependent heat generation during battery discharge. Although the introduction of fins can effectively enhance the heat exchange efficiency of cooling plates, how to balance their heat transfer capacity and flow resistance in the optimized design of the novel spiral-array fin structure to obtain the optimal structural design solution remains to be further investigated.
To address this gap, this paper employs numerical simulation methods, utilizing a P2D electrochemical model to simulate the discharge process of high-capacity lithium batteries at 0.5C, 1C, 1.5C, and 2C discharge rates. This yields the battery’s heat generation characteristics under different discharge rates. Based on the characteristic geometric dimensions of lithium batteries, two structural prototypes of spiral-array fin microchannel liquid cooling plates are proposed. The study investigates the impact of variations in the geometric parameters of the fin structure on its heat dissipation performance.
This work makes the following specific contributions: (i) it reveals the flow mechanism induced by spiral-array fins, demonstrating how the curved fin geometry generates secondary flow that disrupts thermal boundary layer development and enhances fluid mixing, thereby improving temperature uniformity; (ii) it establishes a target optimization regime based on the performance evaluation criterion (PEC), identifying the optimal geometric parameter range that balances heat transfer enhancement and pressure drop penalty; and (iii) it elucidates the influence of spiral fin geometric parameters on cooling performance under electrochemically coupled temperature-dependent heat generation conditions, revealing the dominant factors affecting heat transfer and flow characteristics in this novel configuration.
2. Mathematical Model
2.1. Electrochemical Model
The battery studied in this paper is a 280 Ah lithium iron phosphate battery (LiFePO4), with dimensions of 204 mm (width) × 174 mm (height) × 72 mm (thickness). All numerical simulations in this study were performed using COMSOL Multiphysics version 6.0 (COMSOL AB, Stockholm, Sweden). The model incorporated the Electrochemistry, Laminar Flow, and Heat Transfer interfaces, with coupled multiphysics interactions.
The structural unit of the battery comprises five components: the positive electrode sheet, positive current collector, separator, negative current collector, and negative electrode sheet.
Based on the P2D model [37,38], sources are incorporated into the heat transfer model.
The following assumptions are made for the lithium battery in this paper:
- (1)
- The battery is modeled as a uniform heat source, assuming that heat is generated uniformly across the entire battery volume;
- (2)
- Side reactions occurring at the battery anode are disregarded;
- (3)
- Volume changes caused by lithium-ion deintercalation/intercalation reactions at the electrodes are neglected;
- (4)
- Within the plane of the electrode sheet, ion and electron transport rates are assumed to be constant, considering only variations in the thickness direction;
It should be noted that the uniform heat source assumption in item (1) represents a simplification. While this assumption is commonly adopted in macroscopic battery thermal modeling, it is important to acknowledge its limitation, as heat generation may not be spatially uniform in practice, particularly for large-format batteries.
The electrochemical reaction process within lithium batteries involves the transport and diffusion of lithium ions in both solid and liquid phases.
The lithium diffusion equation in the solid phase is expressed as follows [1,38]:
where is the solid-phase lithium-ion concentration, mol/L; is the solid-phase lithium-ion diffusion coefficient; and is the lithium-ion particle radius, m.
The lithium transport equation in the liquid phase is expressed as follows [1,38]:
In the equation, represents the lithium-ion concentration in the electrolyte, mol/L; denotes the liquid-phase diffusion coefficient of lithium ions; indicates the local current density at the electrolyte interface, A/m2; signifies the mobility of lithium ions in the electrolyte; and represents the volume fraction of the electrolyte.
Simultaneously, the motion of electrons in both solid and liquid phases follows the charge conservation equation.
The charge conservation equation for the solid phase is expressed as follows [1,38]:
The charge conservation equation for the liquid phase is expressed as follows [1,38]:
where denotes the liquid-phase lithium-ion conductivity, S/m; represents the lithium-ion concentration in the electrolyte, mol/L; is the lithium-ion mobility coefficient in the electrolyte; F is the Faraday constant, ; is the liquid-phase activation coefficient of the lithium-ion battery; is the universal gas constant, ; and is the battery temperature, K.
The electrochemical reaction kinetics equation is expressed as follows [1,38]:
where is the exchange current density, A/m2; is the overpotential between the solid and liquid phases, V; is the anode charge transfer coefficient; and is the cathode charge transfer coefficient.
where is the solid-phase potential, V; is the liquid-phase potential, V; and is the open-circuit potential, V.
The calculation formula for the battery heat generation rate is expressed as follows [37,38]:
In the equation, represents the Ohmic heat, J; denotes the polarization heat, J; signifies the reversible heat, J; indicates the total heat generated by the battery, J; represents the particle specific volume; denotes the battery overvoltage, V; signifies the battery current density, A/m2; and represents the battery temperature, K.
To verify the accuracy of the established electrochemical-thermal coupled model, the simulated temperature rise of the battery at a 0.5C discharge rate was compared with experimental data from a 280 Ah lithium iron phosphate battery reported in the literature [39], as shown in Figure 1. The comparison indicates that the simulated temperature rise curve agrees well with the experimental values, with a maximum relative error of less than 3.0%, demonstrating that the model accurately captures the thermal characteristics under this specific rate. Owing to the lack of experimental data on temperature rise or heat generation rate for batteries of the same specification at higher rates (1C, 1.5C, 2C) in the publicly available literature, direct validation was only performed for the 0.5C condition in this study. Although direct experimental validation at higher C-rates is unavailable, the predicted increasing trend of temperature with C-rate is consistent with the findings reported in relevant studies on lithium-ion batteries [40], and the electrochemical parameters and heat generation mechanisms employed in the model are derived from the well-validated P2D model framework [1,38]. Furthermore, key outputs, such as the voltage response, exhibit trends consistent with those reported in the literature. Therefore, the model’s predictions of heat generation rates for other discharge rates remain credible to a certain extent.
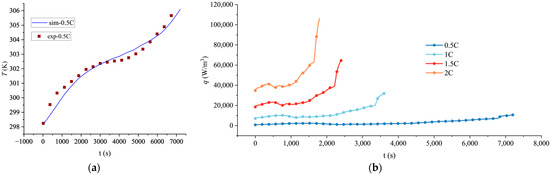
Figure 1.
Thermal characteristics of the lithium battery at various discharge rates: (a) Comparison of simulated and experimental temperature rise at 0.5C discharge rate; (b) simulated volumetric heat generation rate at different C-rates.
The calculated volumetric heat generation rate q of lithium batteries at different rates is shown in Figure 1.
2.2. Flow and Heat Transfer Model
The flow and heat transfer model assumes the following:
- (1)
- At Re < 2300, fluid flow is laminar, considering viscous dissipation;
- (2)
- A no-slip condition exists between the fluid and the inner wall of the channel;
- (3)
- Gravity effects on fluid flow are neglected;
- (4)
- The fluid is incompressible.
The liquid cooling plate material is aluminum (specific heat capacity at constant pressure , density , and thermal conductivity . The fluid is water (density , thermal conductivity , specific heat capacity , and kinematic viscosity ). Fluid enters through the inlet, undergoes convective heat transfer with the high-temperature wall and fins, and exits through the outlet. To ensure the cell temperature remains within the optimal operating range for lithium-ion batteries (20–40 °C), the flow rate was selected accordingly. A Reynolds number of 800, corresponding to an inlet velocity of approximately 0.3 m/s for a single channel, was chosen. Preliminary calculations indicated that under this flow condition, the cell temperature stays below 40 °C during 2C discharge (the maximum discharge rate) for all structural parameters considered, while the pressure drop remains within an acceptable range. The outlet has a relative pressure P = 0. The unit surface heat generation rate of the battery under different discharge rates (0.5C, 1C, 1.5C, and 2C) is set as the heat source on the upper and lower contact surfaces of the microchannel cold plate. The remaining surfaces are set as adiabatic boundaries, which corresponds to a scenario in which the battery operates in a confined space with extremely limited heat dissipation, making this assumption practically relevant, and the fluid inlet temperature is set to 298.15 K.
Heat generated internally within the lithium battery is transferred to the coolant via convective heat exchange through the liquid cooling plate, adhering to the laws of mass conservation, energy conservation, and momentum conservation. The governing equations are as follows:
where is the density of the cooling medium, ; v is the fluid velocity of the cooling medium, m/s; p is the static pressure of the cooling medium, Pa; is the isobaric specific heat capacity of the cooling medium, ; is the thermal conductivity of the cooling medium, ; and is the temperature of the cooling medium, K.
The primary heat transfer mechanism between the liquid cooling plate and the battery cell is thermal conduction. The energy equation governing this process is expressed as follows:
where is the density of the liquid cooling plate, ; is the isobaric specific heat capacity of the liquid cooling plate, ; is the thermal conductivity of the liquid cooling plate, ; and is the temperature of the liquid cooling plate, K.
2.3. Geometric Structure
The liquid-cooled structure of a single cell is shown in Figure 2, primarily consisting of the cell and a liquid cooling plate. The cooling plate is positioned on the side of the lithium battery to cool the cell during discharge. The cooling plate is a plate-like structure with a thickness of 4 mm, height of 202 mm, and width of 174 mm. Internally, it contains N parallel tubular microchannels. Each channel has identical dimensions and is uniformly spaced, exhibiting periodic symmetry. Based on this characteristic, one representative microchannel was selected as the computational domain.
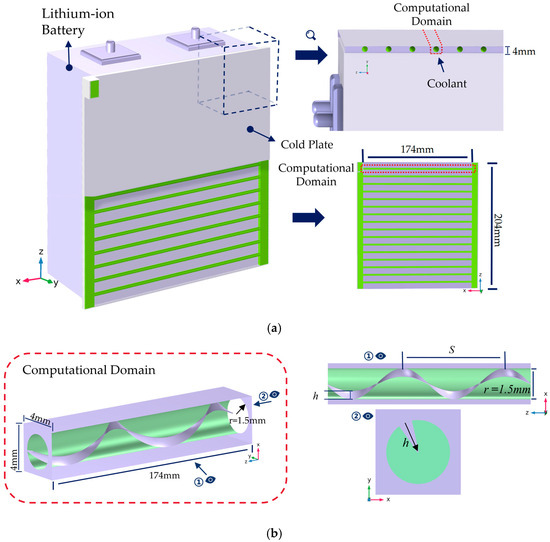
Figure 2.
Schematic of geometric model and computational domain. (a) Schematic of lithium battery structure and computational domain location; (b) schematic of the helical fin structure.
The computational domain is a slender rectangular prism with a square cross-section of 4 mm × 4 mm and a length of 174 mm. The flow channel cross-section within the domain is circular with a diameter of 3 mm. To enhance heat transfer, a single-helix fin is installed inside the microchannel. This fin spirals upward along the channel wall with a thickness of 0.2 mm, height of h, and helical pitch of S.
In this section, to further enhance performance while considering the manufacturing processes and assembly constraints of both the battery and cold plate dimensions, the design calculations focus on two parameters of the continuous spiral fin structure: the pitch S and the fin height h. The values of these variables are specified in Table 1:

Table 1.
Design variables and the values for fin structure.
2.4. Mesh Independence Verification
The heat dissipation model was solved using the finite element analysis software COMSOL Multiphysics 6.0, employing boundary layer meshes for fluid domains and tetrahedral meshes for solid domains. To ensure computational accuracy, mesh independence was verified.
For the spiral rib microchannel convective heat transfer model, with Re = 800, h = 0.5 mm, S = 20 mm, and a discharge rate of 2C, the number of grid cells increased from to . The corresponding inlet/outlet pressure drop , Nusselt number Nu, and relative error rate are shown in Table 2. To balance computational accuracy and efficiency, the example selected grid cells for calculation. The continuity convergence criterion was . The convergence criterion for the energy equation was set as . The relative errors for and Nu were 0.25% and 0.54%, respectively, which were both within acceptable tolerance ranges. All calculations in this study were performed according to the above criteria.
Table 2.
Mesh independence test.
2.5. Parameter Description
The Reynolds number (Re) provides key information about the flow conditions, enabling differentiation between laminar and turbulent flow. Throughout the simulation, Re is held constant at 800. Its expression is given as follows:
where is the fluid density, kg/m3; is the inlet velocity, m/s; is the dynamic viscosity of the fluid, ; is the hydraulic diameter of the flow channel, m; is the cross-sectional area of the coolant inlet, m2; and is the wet perimeter of the coolant inlet cross-section, m.
In practical applications, the Nusselt number (Nu) is widely used in the analysis of heat exchangers, cooling systems, and other heat transfer equipment, helping engineers optimize thermal performance and enhance energy efficiency. Its expression is given as follows:
In the equation, h represents the convective heat transfer coefficient, ; k denotes the thermal conductivity of the fluid, ; is the heat flux density at the wall surface, ; is the average wall temperature, K; and is the reference temperature, K. A higher Nu indicates stronger convective heat transfer, signifying better thermal performance of the cooling plate.
To simultaneously evaluate the overall efficiency of different microchannel heat sinks (considering both thermal and hydraulic characteristics), the comprehensive performance evaluation index PEC is employed. This index assesses both enhanced heat transfer and increased flow resistance to determine the net benefit of heat transfer enhancement technologies.
In the formula, f represents the Darcy friction factor; denotes the total pressure drop between the inlet and outlet of the channel, in Pa; indicates the flow velocity at the channel inlet, in m/s; L is the length of the channel, in m; and and represent the Nusselt number and Darcy friction factor, respectively, for the smooth tube condition without internal spiral fins. A higher PEC value indicates a better overall thermo-hydraulic performance, meaning the heat transfer enhancement outweighs the penalty of increased flow resistance.
3. Results
Based on the heat generation characteristics of lithium iron phosphate batteries under different discharge rates (0.5C, 1C, 1.5C, and 2C), the microchannel cooling structure with single spiral fins was optimized using the domain maximum temperature , maximum temperature difference , Nusselt number Nu, pressure drop , and comprehensive evaluation factor PEC as evaluation metrics. The influence patterns of various structural parameters on the temperature distribution and heat dissipation performance within the channel are discussed.
3.1. Influence of Continuous Single-Helix Fin Pitch on Microchannel Heat Transfer Performance
A microchannel geometric model was established with rectangular single-helix fins rotating along the inner wall, featuring helical pitch S, as shown in Figure 2b.
With the inlet Reynolds number Re set to 800 and , the spiral fin pitch S was selected as the optimization variable.
3.1.1. Temperature Distribution Characteristics Analysis Under Different Pitches S
When the inlet Reynolds number is fixed at 800, Figure 3 shows the variation in maximum temperature in the computational domain as pitch S changes under discharge rates of 0.5C, 1C, 1.5C, and 2C.
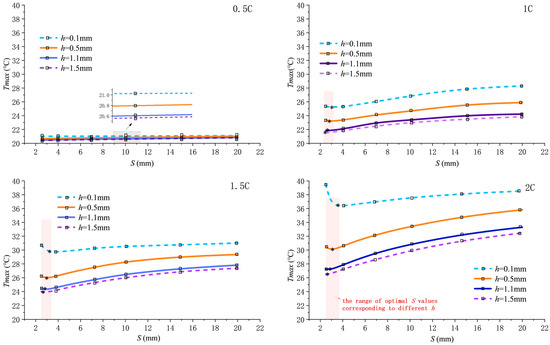
Figure 3.
Variation in maximum temperature with pitch S at different discharge rates.
As the discharge rate increases from 0.5C to 2C, the heat generation load rises, causing the overall elevation of the curves. The impact of fin structure parameter variations on the maximum temperature becomes increasingly pronounced with higher discharge rates. For any given fin height h, first decreases and then increases with increasing S, exhibiting a minimum point near S = 3 mm, which represents the optimal heat dissipation pitch . Taking a 2C discharge rate and h = 0.5 mm as an example, significantly decreases from 35.83 °C at S = 20 mm to 29.85 °C at S = 3 mm, representing a 16.69% reduction. This highlights the critical role of optimized pitch in suppressing temperature rise, primarily by enhancing convective heat transfer.
The optimal pitch shifts slightly to the right as fin height h decreases (increasing by approximately 0.8 mm when h transitions from 1.5 mm to 0.5 mm). This rightward shift occurs because a smaller fin height reduces the effective fin area that induces swirl flow. If the small pitch was maintained under this condition, the flow resistance difference between finned and un-finned regions would be amplified, causing the fluid to preferentially flow along the lower-resistance axial center rather than being guided into the fins. Consequently, to compensate for the weakened radial-flow induction and maintain sufficient flow disturbance, a slightly larger pitch is required to provide adequate axial space for flow development within a single spiral cycle. Although local disturbance may slightly diminish, this adjustment prevents the flow “short-circuiting” effect, achieving a more optimal structural balance in overall heat dissipation performance.
As shown in Figure 4, Nu first increases and then decreases with changes in pitch S, with the peak occurring near S = 3 mm, corresponding to the minimum point of . Taking h = 0.5 mm as an example, the maximum Nu value reaches 105.6 with varying pitch S, representing an approximately 2.98-fold increase compared to the Nu value of 26.5 at S = 200 mm. This trend is governed by the dual effect of pitch on flow structure. When pitch S is around 3 mm, the helical fins induce secondary vortices with moderate intensity and uniform spatial distribution, which effectively disrupt and thin the thermal boundary layer, significantly enhancing heat transfer. When the pitch is too small (e.g., S = 2.5 mm), the denser fin arrangement, while increasing turbulence, severely restricts the main flow path, leading to flow obstruction or even dead zones. This reduces effective heat transfer area and flow velocity, ultimately hindering heat transfer. When the pitch is too large, the fin’s flow-guiding effect weakens, and the secondary flow intensity becomes insufficient, causing the flow to straighten and behave similarly to a smooth tube, thereby degrading heat transfer performance.
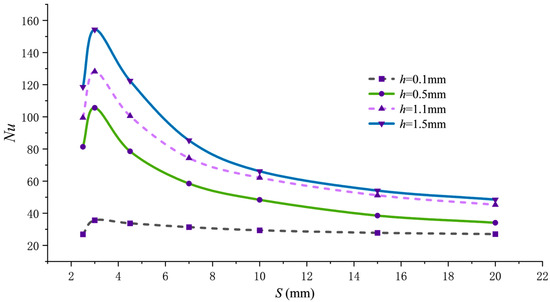
Figure 4.
Nu variation with pitch S.
Figure 5 presents temperature distribution contour plots for the horizontal center cross-section within the flow channel under 2C discharge and h = 0.5 mm, corresponding to different pitch conditions. From top to bottom, the spiral fin pitch S varies from 100 mm to 2.5 mm, indicating a transition from sparse to dense fin spacing. When pitch S is 100 mm, the temperature difference between the flow channel wall and the fluid is significant in the temperature distribution map, with high-temperature regions occupying most of the channel area. This is because at larger pitches, the weaker fluid flow disturbance between the fins fails to disrupt the thermal boundary layer, leading to inefficient heat transfer from the fin surfaces to the fluid. As pitch S decreases (S = 50 mm, 25 mm, 15 mm, and 7 mm), the fin density increases. The fins now forcibly guide the fluid into swirling motion, converting axial kinetic energy into radial kinetic energy. This enhanced radial flow promotes fluid impingement onto both the fins and channel walls, locally intensifying heat transfer. At S = 3 mm, the temperature difference between the wall and fluid is minimal, indicating optimal fluid-solid heat transfer under this fin arrangement. When S decreases to 2.5 mm, the axial frictional resistance in the fin area increases rapidly. Most fluid bypasses the fins, flowing through the center of the channel where resistance is lower. The local flow field characteristics are further verified by the corresponding streamline diagrams in Figure 6. The fluid velocity between the fins slows, resulting in insufficient heat transfer. Consequently, the wall temperature downstream of the channel increases compared to when S = 3 mm.
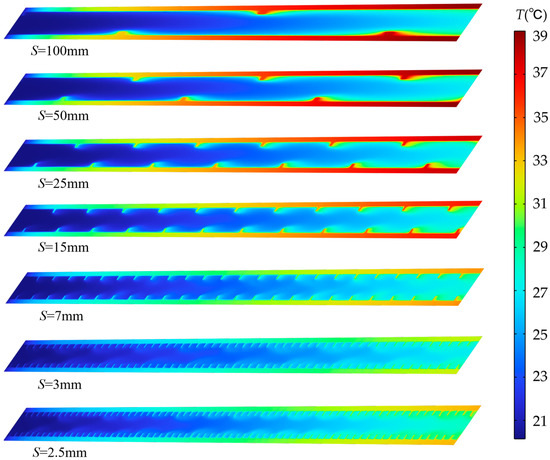
Figure 5.
Temperature contour map at the center cross-section for different pitches at t = 1800 s, discharge rate 2C, and h = 0.5 mm.
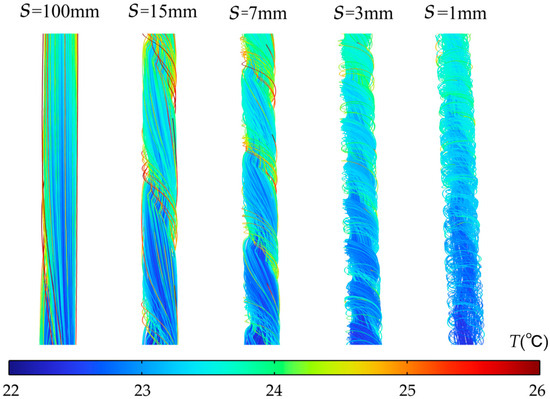
Figure 6.
Local streamline diagrams corresponding to different pitch S values at h = 0.5 mm.
Under large pitch conditions (S = 100 mm and 50 mm), the flow within the channel approaches the flow state of a smooth pipe. The heat cannot be promptly carried away by the fluid, causing thermal accumulation along the solid region and resulting in a large axial temperature gradient. At pitch values S = 25 mm and 15 mm, the swirling effect of the fins enhances the heat transfer along the flow path to some extent. However, a significant axial temperature gradient along the flow path still exists, with the outlet section temperature being markedly higher than the inlet section. When the pitch is reduced to S = 3 mm, the axial temperature gradient along the flow path is minimized.
This configuration strikes an optimal balance: it avoids both the insufficient local heat exchange and streamwise heat accumulation seen at larger pitches and it prevents the excessive flow resistance that diminishes heat transfer efficiency at extremely small pitches (e.g., S = 2.5 mm).
3.1.2. Analysis of Working Fluid Flow Characteristics Under Different Pitches S
This section investigates the pressure drop of the fluid in the liquid cooling plate. The battery discharge rate primarily correlates with the electrochemical heat generation process, and its kinetic impact on the pressure drop of the cooling fluid flow can be considered negligible. Based on this, the 2C discharge condition was selected as a representative sample for pressure drop characteristic characterization. This condition setting is also applied to subsequent analysis of the working fluid flow characteristics to ensure continuity of the study conditions.
Enhanced heat transfer typically comes at the cost of increased flow resistance. Figure 7 illustrates the effect of spiral fin microchannel pitch variation on the inlet–outlet pressure drop (). The inlet–outlet pressure drop Δp decreases as pitch S increases. This is because a reduced pitch directly increases the number of fins per unit channel length, intensifying fluid twisting and friction. When pitch S decreases to 10 mm or smaller, the influence of fin height h on the pressure drop gradually increases. For instance, at S = 4.5 mm, the (7462.9 Pa) for the h = 1.5 mm structure reaches 29 times that of the h = 0.1 mm structure (257.07 Pa), whereas at S = 15 mm it is only 4 times higher, as the large fin height significantly reduces the flow cross-sectional area. The side-view streamline diagram in Figure 7 further corroborates this analysis. At the optimal pitch, a distinct radial velocity component is observable, indicating that the fluid is effectively “flung” toward the wall by the helical fins, promoting mixing between the core and near-wall fluid regions. This radial transport is the key flow mechanism enabling high Nu and reasonable pressure drop.
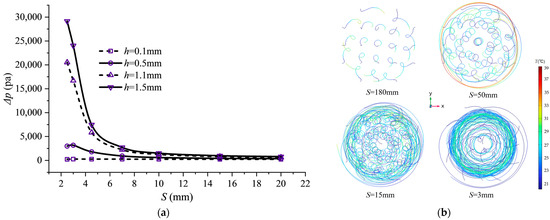
Figure 7.
Pressure drop characteristics and streamline distribution at different pitches. Schemes follow another format: (a) Pressure drop variation with pitch S; (b) side view of flow lines at 2C discharging.
To comprehensively evaluate both heat transfer enhancement and flow resistance increase, Figure 8 shows the variation in the comprehensive performance evaluation criterion PEC with pitch for different fin heights. All curves exhibit peaks, with two outstanding performance points: PEC = 2.18 at h = 0.5 mm and S = 3 mm, and PEC = 2.22 at h = 1.5 mm and S = 3.6 mm. Though comparable in magnitude, these peaks represent distinct approaches. The 1.5 mm h value achieves a high PEC value through “extreme shear mode” by forming near-wall spiral channels, enabling high heat transfer intensity under extreme flow resistance. Conversely, the 0.5 mm h value attains a high PEC value by balancing flow resistance and heat dissipation through optimized structural parameters.
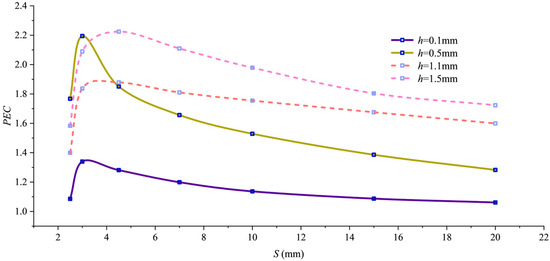
Figure 8.
PEC variation with pitch.
3.2. Effect of Continuous Single-Helix Fin Height h on Microchannel Heat Transfer Performance
As concluded in Section 3.1, when pitch S is set to 3 mm, the channel temperature remains low across different discharge rates, demonstrating excellent heat dissipation performance and good temperature uniformity. Therefore, building upon the previous section, this section adopts an inlet Reynolds number of Re = 800 and a pitch of S = 3 mm. The structural design calculation analysis focuses on the helical fin height h as the design variable.
3.2.1. Temperature Distribution Characteristics Analysis Under Different Fin Heights h
Figure 9 shows the variation in maximum temperature across the computational domain with fin height h at different discharge rates.
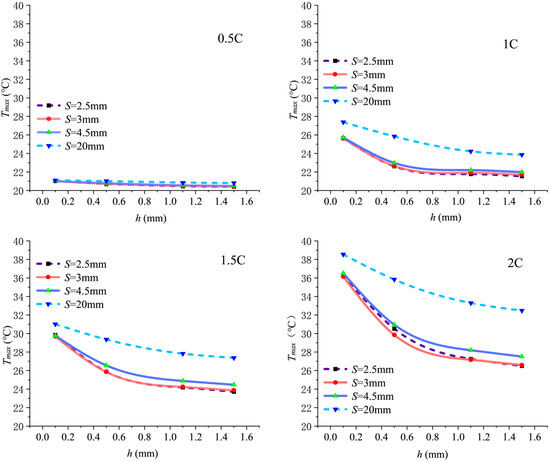
Figure 9.
Temperature variation with fin height h at different discharge rates.
decreases as fin height h increases, with the most significant cooling effect observed when h increases from 0.1 to 0.5 mm. Taking S = 3 mm and 2C discharge as an example, when h increases from 0.1 mm to 0.5 mm, decreases by approximately 6.3 °C. However, when h increases from 0.5 mm to 1 mm, decreases by only about 2.69 °C, indicating diminishing returns, because an increased fin height directly offers two benefits: expanding heat transfer area and enhancing flow turbulence to strengthen secondary flow intensity. Yet, once the fin height becomes sufficiently large, turbulence intensity saturates, slowing the growth rate of its contribution to boundary layer disruption and heat transfer enhancement.
The Nu curve in Figure 10 confirms this. Nu monotonically increases with h, but the slope of the curve noticeably flattens after h > 0.5 mm.
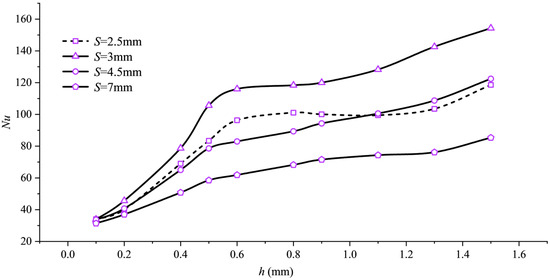
Figure 10.
Nusselt number variation with fin height h.
Figure 11 presents the distribution cloud map of the flow channel center section at S = 3 mm and a 2C discharge rate for different fin heights, visually demonstrating the influence of h. When is small, the finless zone at the channel center has a larger radius and lower flow resistance, causing most of the fluid to preferentially pass through this region. By contrast, the spiral fin zone is not only narrow but also experiences sluggish flow due to obstruction by the fins, making it prone to flow “dead zones” and resulting in insufficient convective heat transfer in this area. As increases, the radius of the finless zone decreases, reducing the difference in flow resistance between this zone and the fin zone, allowing more fluid to enter the fin zone. Within the fin zone, the fluid is guided by the fins to develop higher radial velocities. The longer rotational flow path generates more vortices, while simultaneously increasing the contact area between the wall and the fluid, thereby enhancing heat transfer.
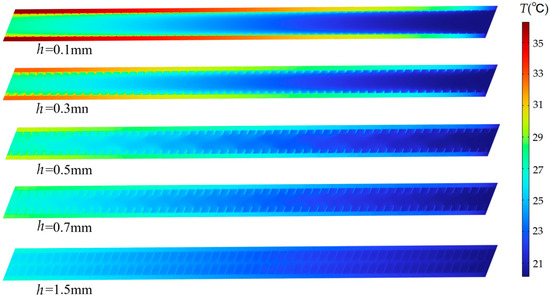
Figure 11.
Temperature contour map at the center cross-section for different fin heights h at t = 1800 s and discharge rate 2C.
This mechanism is visually demonstrated in the distribution cloud map of Figure 11. When , the high-temperature zone is mainly concentrated in the spiral fin region. As increases, the high-temperature zone continuously contracts, indicating that local overheating is suppressed. The streamline diagram in Figure 12 further reveals the changes in fluid behavior. At , streamlines in the spiral fin zone are sparse, confirming sluggish flow in this area. When increases, streamlines in the fin zone become significantly denser with pronounced swirling characteristics, indicating that more fluid participates in effective heat transfer. Thus, by regulating the resistance distribution of flow paths, fundamentally alters the flow field structure, thereby achieving control over the temperature distribution.
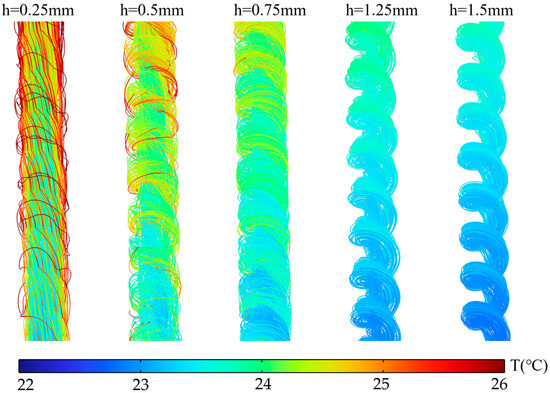
Figure 12.
Local streamline diagram at S = 3 mm for different rib heights h.
3.2.2. Analysis of Working Fluid Flow Characteristics Under Different Fin Heights h
The effect of fin height variation on flow resistance is substantial. Figure 13 illustrates the impact of helical fin height h on pressure drop . The pressure drop exhibits near-exponential growth with increasing fin height h. Taking pitch S = 7 mm as an example, the pressure drop at h = 1.5 mm reaches 10.8 times that at h = 0.1 mm. This is because an increased fin height substantially captures and directs a larger proportion of the fluid flow, significantly extending the actual flow path length. Additionally, a greater fin height increases the fluid–solid contact area, elevating friction losses during flow. Thus, the surge in pressure drop results from the combined effects of increased fluid flow path length and expanded friction area.
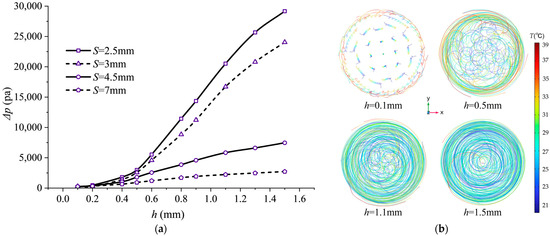
Figure 13.
Pressure drop characteristics and streamline distribution at different fin heights: (a) Pressure drop variation with pitch h at inlet/outlet; (b) streamline side view at 2C magnification (20 streamlines).
The equilibrium between the final pressure drop and heat dissipation is illustrated by the PEC–h curve in Figure 14. Based on the curve characteristics, two scenarios can be distinguished according to pitch S. When the fin pitch is small (S ≤ 3 mm, as seen in the S = 3 mm and S = 2.5 mm curves), the PEC value initially rises rapidly with increasing fin height h, peaks near h = 0.5 mm, then declines. The decline flattens as h reaches 1.1 mm. Beyond h = 1.1 mm, the PEC value increases again with h but does not surpass the peak value. This dense packing creates intense flow disturbance. Using a moderate fin height (h = 0.5 mm) achieves the optimal balance between effectively enhancing swirling turbulence and preventing excessive flow resistance growth. Excessively small fin heights (e.g., h = 0.1 mm) result in insufficient disturbance, while excessively large fin heights (e.g., h > 0.5 mm) drastically lengthen flow paths and significantly increase friction area, causing flow resistance penalties to outweigh heat transfer gains and resulting in a decreased PEC value. Furthermore, comparing the curves for S = 2.5 mm and S = 3 mm reveals that the peak point for the former shifts slightly to the right, i.e., toward slightly larger h values, because the further reduction in pitch at S = 2.5 mm amplifies the flow resistance disparity between the smooth central zone and the helically fin region.
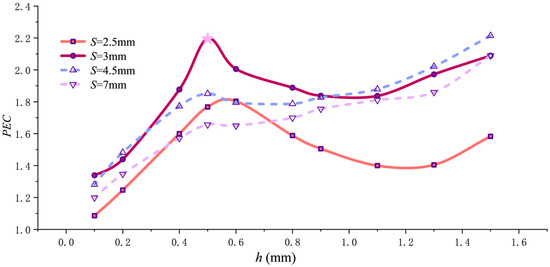
Figure 14.
PEC variation with pitch h.
When pitch S exceeds 3 mm, the trend of PEC variation with h changes, as shown by the curves for S = 4.5 mm and S = 7 mm in the figure. For pitch values greater than 3 mm, as illustrated by the curves for S = 4.5 mm and S = 7 mm in the figure, increasing h from 0.1 mm to 0.5 mm causes the PEC value to rise, with both curves exhibiting a maximum point at h = 0.5 mm. However, unlike the case where the pitch is ≤3 mm, it experiences only a gradual decline between h = 0.5 mm and 0.6 mm before continuing to rise. By h = 1.5 mm, the PEC value surpasses the peak reached at h = 0.5 mm. This is due to the fact that when pitch S exceeds 3 mm, although increasing the fin height still elevates flow resistance, the rate of increase becomes relatively gradual. Concurrently, the benefits from the increased heat transfer area and enhanced near-wall shear effects become more pronounced. Particularly at the limit where h approaches the pipe radius (h = 1.5 mm), the flow channel no longer contains rib-free regions. Instead, it is divided into narrow helical gaps by the fins, creating intense near-wall directed flow. This intensified heat transfer effect dominates the PEC evaluation, causing the PEC value to continue increasing with rising fin height h beyond 0.6 mm.
4. Conclusions
This study establishes a microchannel cold plate lithium battery heat dissipation model based on continuous single-helix fins. Under a given inlet Reynolds number of 800, the effects of pitch S and fin height h on heat dissipation performance are investigated. The channel structure is analyzed and designed based on metrics including , Nu, , and PEC. The research findings indicate:
- (1)
- The PEC values for S = 3 mm and h = 0.5 mm (2.19) and S = 4.5 mm and h = 1.5 mm (2.21) indicate that both structures exhibit excellent comprehensive performance in enhancing heat transfer. However, the latter exhibits a pressure drop of 7462.9 Pa, which is significantly higher than the former’s pressure drop of 2569.4 Pa. Therefore, when both structures meet the cooling requirements, the S = 3 mm and h = 0.5 mm configuration with a lower pressure drop is preferred to balance flow resistance and system energy consumption.
- (2)
- When the structural parameters are optimized to S = 3 mm and h = 0.5 mm, the PEC value reaches its peak. At this point, the fluid–wall heat transfer is sufficient, and the axial temperature gradient is small. Compared with the smooth channel without spiral ribs, the maximum temperature under discharge rates of 0.5C, 1C, 1.5C, and 2C is reduced by 0.70 °C, 2.75 °C, 6.05 °C, and 10.12 °C, respectively, corresponding to a percentage decrease ranging from 3.27% to 25.32%. The cooling effect achieved by optimizing the spiral rib structure is notably more pronounced at high discharge rates.
- (3)
- Adjusting the pitch S influences heat transfer and flow performance by altering the radial fluid velocity and flow path length within the channel. Smaller pitches tend to induce flow “short-circuiting,” where fluid predominantly traverses the rib-free central region, thereby weakening the spiral ribs’ flow-guiding effect.
- (4)
- Increasing the fin height h significantly alters the flow distribution between the finless and helical fin regions within the channel. As h increases, the proportion of the helical fin region rises, enhancing the fin’s flow guidance effect and correspondingly increasing swirl intensity and heat transfer area. Simultaneously, structures with high fin height suppress bypass flow at small pitches but also cause rapid increase in the pressure drop.
This study examined the optimal structure at a specific Reynolds number. The optimal structure obtained in this work remains valid when the flow rate variation is modest; however, under conditions of high Reynolds numbers (e.g., Re > 2300) or extremely low flow velocities, the influence of flow rate variations cannot be neglected, making it necessary to recalculate and re-analyze the optimal structure for the corresponding flow rate. Future work could focus on structure optimization under different flow rates to elucidate how flow rate variations affect the optimal structural parameters. Additionally, the current model assumes uniform heat generation throughout the battery volume. This assumption is commonly employed in battery thermal models. However, it may not fully capture the spatial non-uniformity of heat generation that can occur in large-format cells. Therefore, for large-format batteries, a three-dimensional battery model could be established to obtain a three-dimensional non-uniform heat generation model for the battery, enabling a more accurate analysis of battery temperature distribution.
Author Contributions
Conceptualization, Z.X.; methodology, Z.X., M.Z., Z.L. and S.X.; software, M.Z., Z.L. and S.X.; validation, M.Z., K.X. and Z.X.; formal analysis, M.Z. and Z.X.; investigation, M.Z., K.X. and S.X.; resources, Z.X. and C.W.; data curation, M.Z. and S.X.; writing—original draft preparation, M.Z., S. X. and K.X.; writing—review and editing, Z.X.; visualization, M.Z. and C.W.; supervision, Z.X.; project administration, Z.X.; funding acquisition, Z.X. All authors have read and agreed to the published version of the manuscript.
Funding
This research was supported by the National Natural Science Foundation of China (grant number 51579244) and the Key Research and Development Program of Hubei Province (grant number 2023BIB017).
Data Availability Statement
The original contributions presented in this study are included in the article. Further inquiries can be directed to the corresponding authors.
Acknowledgments
The authors wish to thank the reviewers for their careful, unbiased, and constructive suggestions, which led to this revised manuscript.
Conflicts of Interest
The authors declare no conflict of interest.
References
- Zhang, Y.; Zhang, W.; Kong, W. Numerical and experimental study on thermal behavior of prismatic lithium-ion battery for large-capacity energy storage. J. Energy Storage 2024, 83, 110620. [Google Scholar] [CrossRef]
- Rocha, L.C.S.; Rotella, J.P.; Aquila, G. Multi-objective optimization of hybrid wind-photovoltaic plants with battery energy storage system: Current situation and possible regulatory changes. J. Energy Storage 2022, 51, 104467. [Google Scholar] [CrossRef]
- Tahir, M.W.; Merten, C. Multi-scale thermal modeling, experimental validation, and thermal characterization of a high-power lithium-ion cell for automobile application. Energy Convers. Manag. 2022, 258, 115490. [Google Scholar] [CrossRef]
- Hao, M.; Weng, S. Structure and evolution of solid electrolyte interphase (SEI) at the electrode-electrolyte interface. Mater. Today Energy 2025, 53, 101998. [Google Scholar] [CrossRef]
- Lain, M.J.; Kendrick, E. Understanding the limitations of lithium-ion batteries at high rates. J. Power Sources 2021, 493, 229690. [Google Scholar] [CrossRef]
- Yang, M.; Ye, Y.; Yang, A.; Jiang, Z. Comparative study on aging and thermal runaway of commercial LiFePO4/graphite battery undergoing slight overcharge cycling. J. Energy Storage 2022, 50, 104691. [Google Scholar] [CrossRef]
- Chen, S.; Bao, N.; Garg, A.; Peng, X.; Gao, L. A fast charging-cooling coupled scheduling method for a liquid cooling-based thermal management system for lithium-ion batteries. Engineering 2021, 7, 1165–1176. [Google Scholar] [CrossRef]
- Pang, H.; Yan, X. Towards co-estimation of lithium-ion battery state of charge and state of temperature using a thermal-coupled extended single-particle model. Energy 2025, 326, 136186. [Google Scholar] [CrossRef]
- Ren, L.; Zhu, G.; Kang, J. An algorithm for state of charge estimation based on a single-particle model. J. Energy Storage 2021, 39, 102644. [Google Scholar] [CrossRef]
- Hunt, M.J.; Brosa, P.F. Derivation of an effective thermal electrochemical model for porous electrode batteries using asymptotic homogenisation. J. Eng. Math. 2020, 122, 31–57. [Google Scholar] [CrossRef]
- Wang, B.C.; He, Y.B. Fast parameter identification of lithium-ion batteries via classification model-assisted Bayesian optimization. Energy 2024, 288, 129667. [Google Scholar] [CrossRef]
- Yu, Y.; Lan, Y.; Ling, Z. A dual-objective data-driven framework combining Bayesian optimization and improved differential evolution for rapid and accurate parameter identification of lithium-ion battery P2D models. Energy 2025, 335, 137974. [Google Scholar] [CrossRef]
- Xu, J.; Sun, C.; Ni, Y. Fast identification of micro-health parameters for retired batteries based on a simplified P2D model by using Padé approximation. Batteries 2023, 9, 64. [Google Scholar] [CrossRef]
- Xu, S.; Cao, L. Optimal-rate error estimates and a twice decoupled solver for a backward Euler finite element scheme of the Doyle–Fuller–Newman model of lithium-ion cells. J. Comput. Appl. Math. 2026, 476, 117131. [Google Scholar] [CrossRef]
- Joly, R.; Allaire, G.; De, L.R. Geometric optimization of a lithium-ion battery with the Doyle–Fuller–Newman model. J. Comput. Phys. 2025, 543, 114390. [Google Scholar] [CrossRef]
- Gotti, D.; Prodanovic, M.; Pinilla, S. A novel Doyle-Fuller-Newman battery model formulation for online parameter estimation. J. Energy Storage 2026, 141, 119115. [Google Scholar] [CrossRef]
- Zhao, R.; Zhang, S.; Liu, J.; Gu, J. A review of thermal performance improving methods of lithium ion battery: Electrode modification and thermal management system. J. Power Sources 2015, 299, 557–577. [Google Scholar] [CrossRef]
- An, Z.; Jia, L.; Ding, Y.; Dang, C. A review on lithium-ion power battery thermal management technologies and thermal safety. J. Therm. Sci. 2017, 26, 391–412. [Google Scholar] [CrossRef]
- Mahamud, R.; Park, C. Reciprocating air flow for Li-ion battery thermal management to improve temperature uniformity. J. Power Sources 2011, 196, 5685–5696. [Google Scholar] [CrossRef]
- Ren, R.; Zhao, Y.; Diao, Y.; Liang, L.; Jing, H. Active air cooling thermal management system based on U-shaped micro heat pipe array for lithium-ion battery. J. Power Sources 2021, 507, 230314. [Google Scholar] [CrossRef]
- Yang, N.; Zhang, X.; Li, G. Assessment of the forced air-cooling performance for cylindrical lithium-ion battery packs: A comparative analysis between aligned and staggered cell arrangements. Appl. Therm. Eng. 2015, 80, 55–65. [Google Scholar] [CrossRef]
- Huang, Q.; Li, X. Thermal management of Lithium-ion battery pack through the application of flexible form-stable composite phase change materials. Appl. Therm. Eng. 2021, 183, 116151. [Google Scholar] [CrossRef]
- Zhang, J.; Li, X.; Zhang, G. Experimental investigation of the flame retardant and form-stable composite phase change materials for a power battery thermal management system. J. Power Sources 2020, 480, 229116. [Google Scholar] [CrossRef]
- Gan, Y.; He, L.; Liang, J. A numerical study on the performance of a thermal management system for a battery pack with cylindrical cells based on heat pipes. Appl. Therm. Eng. 2020, 179, 115740. [Google Scholar] [CrossRef]
- Zhong, Q.; Chandra, P.K. A comprehensive numerical study based on topology optimization for cooling plates thermal design of battery packs. Appl. Therm. Eng. 2024, 236, 121918. [Google Scholar] [CrossRef]
- Liu, Z.; Liu, W.; Lv, S. Numerical study of battery thermal management system using bionic leaf-shaped channel liquid cooling plate. Appl. Therm. Eng. 2025, 268, 125898. [Google Scholar] [CrossRef]
- Jung, E.; Kong, D.; Kang, M.; Park, J.; Kim, J.-H.; Jeong, J.; Bin In, J.; Oh, K.-Y.; Lee, H. Enhanced Immersion Cooling Using Laser-Induced Graphene for Li-Ion Battery Thermal Management. Int. Commun. Heat Mass Transf. 2024, 155, 107558. [Google Scholar] [CrossRef]
- Tuckerman, D.B.; Pease, R.F.W. High-performance heat sinking for VLSI. IEEE Electron Device Lett. 1981, 2, 126–129. [Google Scholar] [CrossRef]
- Shu, Z.; Li, Y.; Goyal, V.; Alghanmi, S. Artificial neural network-based optimization of baffle geometries for maximized heat transfer efficiency in microchannel heat sinks. Case Stud. Therm. Eng. 2023, 49, 103331. [Google Scholar] [CrossRef]
- Chen, L.; Feng, H.; Zhang, F. Constructal design for composite heat dissipating structure composed of an “arrow”-shaped high conductivity channel and an externally connected “T”-shaped fin. Int. Commun. Heat Mass Transf. 2024, 153, 107341. [Google Scholar] [CrossRef]
- Ren, H.; Jia, L.; Dang, C.; Yang, C. Experimental investigation on pouch lithium-ion battery thermal management with mini-channels cooling plate based on heat generation characteristic. J. Therm. Sci. 2022, 31, 816–829. [Google Scholar] [CrossRef]
- Wang, J.; Qi, S.; Xu, Y. Numerical investigations of the thermal-hydraulic characteristics of microchannel heat sinks inspired by leaf veins. Energies 2024, 17, 311. [Google Scholar] [CrossRef]
- Lu, Z.Q.; Xie, Z.H.; Wu, F. Constructal optimization design of hybrid microchannel heat sink with single-sided internal fin array and comparative study of genetic algorithms. Chin. J. Ship Res. 2023, 18, 247–259. [Google Scholar] [CrossRef]
- Lu, Z.Q.; Xie, Z.H.; Wang, R. Flow and heat transfer performance analysis and constructal design of hybrid microchannel heat sink with single-sided internal fin array. J. Eng. Thermophys. 2022, 43, 2841–2851. (In Chinese) [Google Scholar]
- Chen, T.; Wang, G.L.; Wu, Y.J. Study on flow and heat transfer characteristics of microchannels with staggered internal ribs. J. Eng. Therm. Energy Power 2022, 37, 128–135. [Google Scholar] [CrossRef]
- Yang, X.; Zhong, X.; Su, C.; Chen, K.; Xie, J. Thermal Performance Enhancement of Blade Battery Packs via Multi-Branch-Converging Channel Design. Int. J. Heat Mass Transf. 2026, 258, 128330. [Google Scholar] [CrossRef]
- Huang, H.H.; Chen, H.Y.; Liao, K.C. Thermal-electrochemical coupled simulations for cell-to-cell imbalances in lithium-iron-phosphate based battery packs. Appl. Therm. Eng. 2017, 123, 584–591. [Google Scholar] [CrossRef]
- Fu, Z.; Zuo, W.; Li, Q.; Zhou, K.; Huang, Y.; Li, Y. Performance Enhancement Studies on the Liquid Cooling Plate Fully Filled with Porous Medium for Thermal Management of Lithium-Ion Battery Pack. J. Energy Storage 2025, 116, 116072. [Google Scholar] [CrossRef]
- Lin, X.W.; Shi, M.Y.; Zhou, Z.F.; Chen, B.; Lu, Y.J.; Jing, D.W. Multi-Objective Topology Optimization Design of Liquid-Based Cooling Plate for 280 Ah Prismatic Energy Storage Battery Thermal Management. Energy Convers. Manag. 2025, 325, 119440. [Google Scholar] [CrossRef]
- He, T.; Zhang, T.; Wang, Z.; Cai, Q. A Comprehensive Numerical Study on Electrochemical-Thermal Models of a Cylindrical Lithium-Ion Battery during Discharge Process. Appl. Energy 2022, 313, 118797. [Google Scholar] [CrossRef]


Disclaimer/Publisher’s Note: The statements, opinions and data contained in all publications are solely those of the individual author(s) and contributor(s) and not of MDPI and/or the editor(s). MDPI and/or the editor(s) disclaim responsibility for any injury to people or property resulting from any ideas, methods, instructions or products referred to in the content. |
© 2026 by the authors. Licensee MDPI, Basel, Switzerland. This article is an open access article distributed under the terms and conditions of the Creative Commons Attribution (CC BY) license.