


Abstract
This study introduces a multi-stage, multi-objective optimization framework based on the Gravitational Search Algorithm (GSA) for determining the optimal sizing and placement of distributed energy resources (DERs) and associated infrastructure. The proposed approach considers solar distributed generation (DG) units with battery storage systems (BSSs), wind DGs, shunt capacitors (SCs) and electric vehicle charging stations (EVCSs). With the rapid adoption of electric vehicles as part of global decarbonization efforts, integrating EVCSs into already stressed distribution networks poses significant operational challenges, often requiring system reinforcement supported by renewable-based DGs. The uncoordinated deployment of EVCSs and DGs can exacerbate power losses and deteriorate voltage profiles. To address these issues, the first stage of the methodology employs GSA to optimally allocate solar DGs with BSSs, wind DGs and SCs, targeting objectives such as minimizing power losses, enhancing voltage stability and alleviating substation loading. The second stage identifies optimal locations and maximum feasible capacities for EVCS integration. Finally, the third stage upgrades the network to mitigate the impacts of EVCS integration. The effectiveness of the proposed approach is validated through simulations on a practical 52-bus, 11 kV distribution network under hourly varying load, solar irradiance and wind velocity conditions for all seasons. The simulation results show an 85% reduction in power losses during peak hours, with nodal voltages maintained above 0.95 p.u. under all scenarios. Additionally, net-zero grid power exchange during peak periods confirms the full islanded operation.
Keywords:
solar and wind distributed generation and rooftop solar PV system; shunt capacitors; electric vehicle charging station; gravitational search algorithm; multi-stage optimization framework; 52-bus distribution system; seasonal time-varying output/load; power loss minimization and voltage stability MSC:
65Z05
1. Introduction
Global electricity demand continues to rise, driven by economic growth, modernization, urbanization, and the expansion of infrastructure and industry. As a result, ensuring access to sustainable and affordable electric power has become a critical priority for many nations. Meeting this growing demand requires not only an increase in generation capacity but also enhancements to transmission infrastructure—an option that is often constrained by existing installations and geographical limitations. Even when feasible, long-distance transmission introduces significant power losses due to line resistance, increasing operational costs and causing under-voltage conditions for consumers. High distribution losses also place additional stress on central power sources and escalate energy costs.
A practical and effective solution is to promote localized power generation through the deployment of distributed generation (DG) units and shunt capacitors (SCs). These resources improve system capacity and reliability, reduce transmission burdens, minimize network losses, and enhance the overall power quality.
To address environmental concerns such as greenhouse gas emissions and global warming, renewable energy-based DGs—particularly solar PV systems, including rooftop installations and wind DGs—have gained widespread adoption in recent years. This trend is supported by technological advancements and declining module costs, enabling compact and efficient configurations. Furthermore, the depletion of fossil fuel reserves and rising oil prices have accelerated the growth of the electric vehicle (EV) market, which has expanded rapidly due to modern technological breakthroughs. Consequently, there is an increasing need for the extensive deployment of electric vehicle charging stations (EVCSs).
However, the effective integration of DGs, SCs, and EVCSs requires careful planning and configuration. Overloading a node with DGs and SCs can lead to overvoltage conditions, increased power losses, and potential under-voltage issues at downstream nodes. Similarly, the improper placement of EVCSs may degrade voltage profiles and further exacerbate network losses. Therefore, the strategic optimization of these resources is essential to ensure system stability, efficiency, and reliability.
Extensive research has been conducted on the optimal sizing and placement of DGs—including solar, wind and other DGs—along with SCs and EVCSs, either individually or in combination, to enhance distribution network performance. Gümüş et al. [1] introduced a Thevenin-based stability index for DG allocation using a mixed-integer genetic algorithm. Sellami et al. [2] proposed an enhanced Particle Swarm Optimization (PSO) technique for simultaneous DG placement and sizing. Kashyap et al. [3] employed an analytical approach to determine the optimal capacity and location of DGs and SCs under varying load conditions. Nguyen et al. [4] utilized a hybrid neural network algorithm for the multi-objective optimization of DG and SC placement in distribution systems. Rekha and Byalihal [5] applied PSO for siting and sizing solar–wind hybrid systems to minimize power losses. Vempalle and Dhal [6] developed a hybrid optimization method for integrating solar and wind DGs under time-varying load scenarios. Fathy et al. [7] introduced a capuchin search algorithm to identify optimal locations, sizes, and power factors for biomass DG units. Argüello et al. [8] proposed a methodology for deploying rooftop solar PV systems across all consumers in a distribution network and evaluated its performance benefits. Roy et al. [9] presented an integrated approach combining rooftop solar PV systems with optimal DG and SC placement to improve the performance of a practical distribution network across different seasons.
Goli et al. [10] proposed a two-stage methodology to enhance distribution system performance. In the first stage, annual energy losses were minimized through optimal network reconductoring using the Flower Pollination Algorithm. The second stage involved allocating EV charging loads across the distribution nodes. Ferraz et al. [11] formulated a two-stage optimization approach, beginning with strategic planning for EVCS placement and sizing, followed by optimal DG allocation to improve voltage profiles and reduce power losses. Bhadoriya et al. [12] applied a transient search optimization-based multi-objective function for determining the optimal siting of EVCSs and DGs. Mehroliya et al. [13] utilized a whale optimization algorithm within a multi-objective framework for the simultaneous placement of EVCSs, DGs, and SCs to achieve power loss reduction and voltage profile enhancement. Salkuti [14] provided a comprehensive review of smart energy system designs incorporating renewable energy sources, electric vehicles, and energy storage technologies, highlighting applications, challenges, and advancements enabled by artificial intelligence, machine learning, big data analytics, and IoT. In a related study, Salkuti [15] examined the economic integration of renewable energy systems, EVs, and energy storage within modern hybrid grids to address generation–demand fluctuations and improve grid stability. Jung et al. [16] evaluated the techno-economic aspects of modeling renewable energy systems, EVs, and battery storage solutions to mitigate the variability of renewable generation and enhance grid interoperability. Babu et al. [17] presented an integrated framework incorporating EVCSs, distribution static VAR compensators (DSVCs) and renewable energy sources (solar and wind) into radial distribution systems. By enabling both grid-to-vehicle (G2V) and vehicle-to-grid (V2G) operation, the proposed approach minimizes power and energy losses while enhancing system flexibility and resilience under diverse weather conditions. Vaigundamoorthi et al. [18] proposed an enhanced Black Widow Optimization Algorithm (BWOA) framework and compare its performance with the Slime Mould Algorithm (SMA). The proposed approach jointly optimizes the placement and sizing of PV-based distributed generators, distribution static compensators, and EV charging stations by minimizing a normalized multi-objective function incorporating power losses, voltage indices, and total installation and operational cost. Çeçen et al. [19] investigated optimal allocation strategies for EVCSs with and without DG in renewable-supported multi-energy systems. A hybrid optimization framework combining Grey Wolf Optimization (GWO) and Dynamic Fitness–Distance Balance (dFDB) is developed to minimize active power losses and voltage deviations.
The application of rooftop photovoltaic (PV) systems spans from small-scale installations on individual buildings to large-scale deployments in both off-grid and grid-connected configurations, as documented in numerous studies worldwide. Yao and Zhou [20] conducted a comprehensive survey of rooftop PV systems integrated with battery storage, ranging from standalone buildings to city-wide implementations, and performed micro-level comparative analyses considering lifecycle, installation angle, mechanical and tracking systems, as well as indoor and shading effects. Ren et al. [21] focused on optimizing space utilization for irregularly shaped rooftops while minimizing shading impacts to enable large-scale PV deployment in Hong Kong. Barbon et al. [22] developed a generalized algorithm that accounts for irregular flat rooftop geometries, PV module mounting arrangements, and self-shading effects to maximize rooftop space utilization. Alharbi et al. [23] employed mixed-integer programming to optimize grid-connected rooftop PV layouts, incorporating constraints such as inverter type and self-shading limitations. Sujon et al. [24] proposed a sustainable solution for powering household loads using rooftop PV systems by integrating dynamic programming (DP) with Internet of Things (IoT) technologies. Pérez et al. [25] investigated rooftop utilization strategies in Spain, considering obstacles and shaded areas, and validated their approach through simulations and experiments, achieving a 48% utilization. Additionally, the computation of solar radiation variability over time and location is discussed in [26].
Table 1 indicates that numerous studies have explored the integration of solar PV systems—including rooftop PVs—alongside wind DGs, SCs and EVCSs. However, a comprehensive approach that simultaneously considers all four systems, specifically incorporating solar DGs and wind DGs rather than generic DGs and optimizes their allocation, remains insufficiently addressed in the literature. Such an integrated strategy is crucial to enable the distribution system to manage time-varying power demands internally while adhering to network constraints.
Table 1.
Literature analysis.
Solar radiation is inherently variable, fluctuating seasonally and throughout the day, and is completely unavailable during the nighttime. To ensure continuous clean energy generation, the system can be complemented with wind DGs. Since both solar and wind DGs produce intermittent and variable outputs, the inclusion of appropriately sized energy storage systems becomes essential. Furthermore, deploying shunt capacitors within the network helps to meet reactive power requirements and enhances overall system performance.
While the optimal allocation of DGs and SCs significantly reduces power losses, the integration of EVCSs tends to increase losses. Therefore, the present study adopts a three-stage optimization framework. In the first stage, the GSA is applied to determine the optimal sizing and placement of solar DGs, wind DGs, battery storage units and SCs, addressing multiple objectives such as minimizing real and reactive power losses, improving voltage profiles, and minimizing the source substation loading to near zero. Once the network is upgraded, the second stage involves strategically locating fast EVCSs while ensuring that node voltages remain above the minimum permissible threshold. In the third and final stage, the system is further optimized to mitigate the impact of integrated EVCSs while satisfying the same multi-objective criteria and achieving the desired level of EVCS integration.
In the past ten years, many researchers have proposed several metaheuristic optimization techniques based on swarm optimization and evolutionary based concepts. Each of these algorithms has its own importance depending on the application and nature of the problem, and all the algorithms are not suitable for all the solutions. GSA is an optimization method indifferent to the earlier metaheuristic techniques, inspired by the theory of Newtonian gravity in physics. In GSA, the equations developed for updating next-generation solution parameters depend on the fitness values, unlike other algorithms like PSO and GA, whereas the parameter update only depends on the previous best solutions. Many authors effectively used GSA for the past years for solving various complex problems related to electrical engineering. Hence, in the present case, GSA is used for obtaining the optimum planning of the distribution system upgrade with renewable energy resources.
Novelty and Contribution of the Work
- The time-dependent power output of rooftop PV systems is assessed using a solar insolation-based mathematical model.
- Wind turbine power generation is evaluated using reference data for time-varying conditions.
- The Gravitational Search Algorithm (GSA) is employed to determine the optimal sizing and placement of solar DGs, wind DGs, SCs, and fast EVCSs through a multi-stage, multi-objective optimization framework.
- The multi-objective optimization aims to minimize real and reactive power losses, enhance voltage profiles and minimize the source substation loading to near zero.
- Solar DG outputs are computed based on hourly average insolation values.
- Ratings for the battery storage systems, which are fed from the solar DGs, are calculated in accordance with IEEE 485 standards to ensure an adequate capacity for meeting time-varying load demands.
- The high penetration of the EVCSs is considered.
- Fixed ratings for solar DGs are determined to satisfy load requirements and recharge battery storage units.
- A practical 52-bus distribution system is analyzed as the test case.
- Performance evaluation is conducted for summer, rainy and winter seasons, each with a corresponding 24 h load schedule.
- The distribution network is upgraded to work as a microgrid with net metering capability.
For this work, in Section 2, a modified American Society of Heating Refrigeration and Air-conditioning Engineers (ASHRAE) model is discussed for calculating the solar insolation based on geographic location and time. The calculation steps for the solar DG and wind DG power generation capacity are presented in Section 3 and Section 4, respectively, and are used to calculate the time-varying output seasonally. The types/ranges of battery chargers and ratings of some practical EV batteries are presented in Section 5. The battery charging load demand model for lithium-ion batteries is presented in Section 6. The multi-objective function formulation to improve the performance of the distribution system is described in Section 7, and the methodology for the optimum allocation of solar DGs with battery storage systems, SCs, EVCSs and roof top solar PV systems using GSA is presented in Section 8. In Section 9, the simulation results are tabulated and explained, followed by a comparison with other studies in Section 10 and a comparison of the three stages of the optimization work in Section 11. Subsequently, the conclusions of the observations are presented in Section 12.
2. Solar Radiation Assessment via Enhanced ASHRAE Model
In this research, a modified ASHRAE approach [26,27] has been employed to compute hourly average solar radiation tailored to Indian climatic conditions. The following set of mathematical expressions describes the estimation of solar radiation (I) at any given time for a specific geographic location.
The term represents the hourly total global solar radiation, which is composed of two components: (beam radiation) and (diffuse radiation). Additionally, denotes the portion of aligned with the direction of the sun’s rays. The constants and used in these calculations are specified in reference [26] and detailed in Table A1 within Appendix A.
In these equations, denotes the solar zenith angle, while and represent the latitude and longitude of the location, respectively. The parameter corresponds to the solar declination angle, and is the hour angle. Furthermore, ST refers to the standard time, LAT indicates the local apparent solar time at noon, ET is the equation of time correction, STL represents the standard meridian for the local time zone, and signifies the day number within the year.
3. Assessment of Solar Power Production
This section determines the rooftop solar PV capacity (SPVC) [28] for each node within the distribution network, as computed using Equation (11).
The parameter SPVA denotes the rooftop area available for installing solar PV modules, while represents solar insolation. refers to the efficiency of the PV module and PR indicates its performance ratio. In this study, is assumed to be 0.20 [29], and PR is taken as 0.75 [28]. As outlined earlier, the SPVA at the jth node of the distribution network is determined using Equation (12).
The term refers to the total number of houses connected to the jth node of the distribution network. represents the average house area, while AF is the area factor, indicating the proportion of rooftop space available for solar PV installation. In this study, is assumed to be 1000 sq. ft., and AF is taken as 30%, reflecting a conservative feasibility estimate [25]. The value of , as noted earlier, is computed using Equation (13).
The parameter denotes the peak real power load at the jth node of the distribution network, while represents the peak real power demand for a single household, which is approximately 3.54 kW [9].
4. Assessment of Wind Power Production
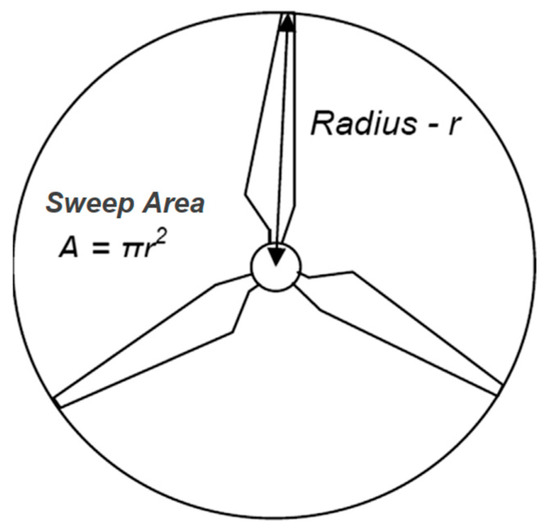
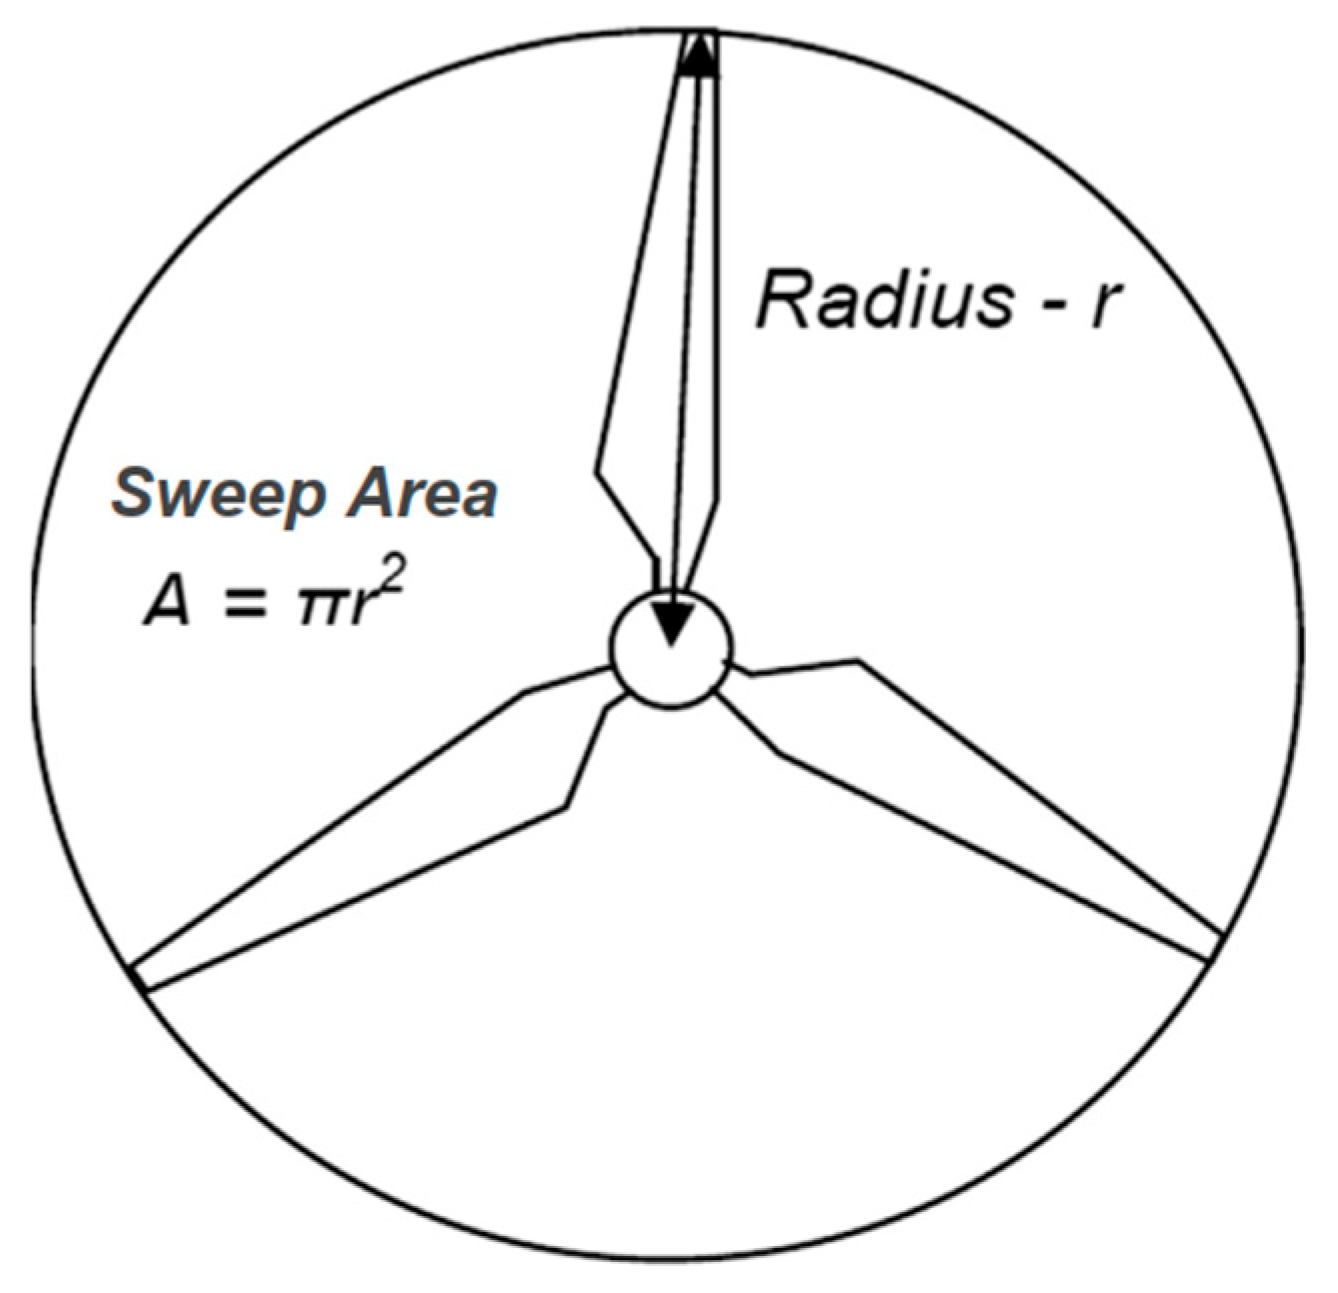
Wind energy conversion results in wind power generation, which is influenced by several key parameters. Figure 1 shows a typical simplified structure of a wind turbine.
Figure 1.
Simplified structure of wind turbine.
The output power from a wind turbine can be expressed using the following equation:
denotes the power output of the wind turbine, refers to the air density, ‘’ represents the swept area, ‘’ is the wind speed, and denotes the power coefficient. Table 2 presents the turbine dimensions and parameters used in this analysis.
Table 2.
Turbine parameters [6].
5. Levels of EV Battery Charging and Ratings of Charging Stations
EV batteries can be charged using either alternating current (AC) or direct current (DC). In AC charging setups, the onboard charger within the EV handles the conversion from AC to DC, as batteries require DC for storage. Conversely, in DC charging systems, the conversion occurs within the external charging station, delivering DC directly to the battery.
For high-speed or fast charging, DC charging is the only practical solution. This is because the power rating and physical size of fast chargers are too large to be integrated into the vehicle without significantly increasing the cost and complexity. Therefore, fast chargers are always part of the external charging infrastructure. Table 3 outlines the standardized charging levels, categorized by power capacity and the corresponding type of charging equipment.
Table 3.
Charging power level [30].
Rating of EVCSs at Strategic Locations
Fast-charging stations should be strategically positioned within the distribution network to maximize coverage and operational efficiency while adhering to network constraints. Table 4 provides examples of various EV categories—such as two-wheelers, three-wheelers, rickshaws, and passenger cars—along with their typical battery capacities and the corresponding travel range per full charge. Based on these vehicle profiles, installing charging ports rated at 10 kW, 50 kW, and 100 kW at key locations is recommended to meet fast-charging demands effectively.
Table 4.
Charging characteristics of EVs.
Smart charging strategies should be employed to dynamically allocate charging ports based on the power ratings of EVs arriving at the station. This ensures that the aggregate load at any given station does not exceed 300 kW. The overall capacity of the charging station must be carefully determined so that the additional demand does not negatively impact other consumers connected to the same distribution network.
6. Modeling of EV Battery Charging Load Demand
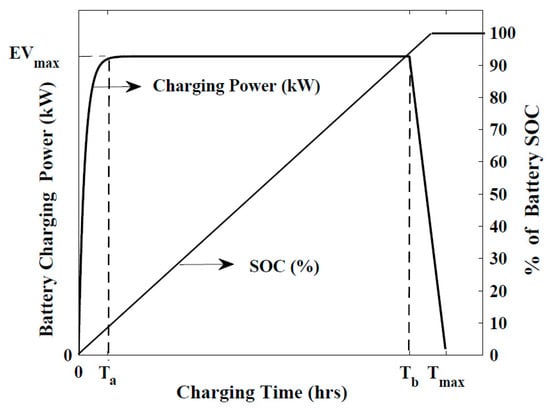
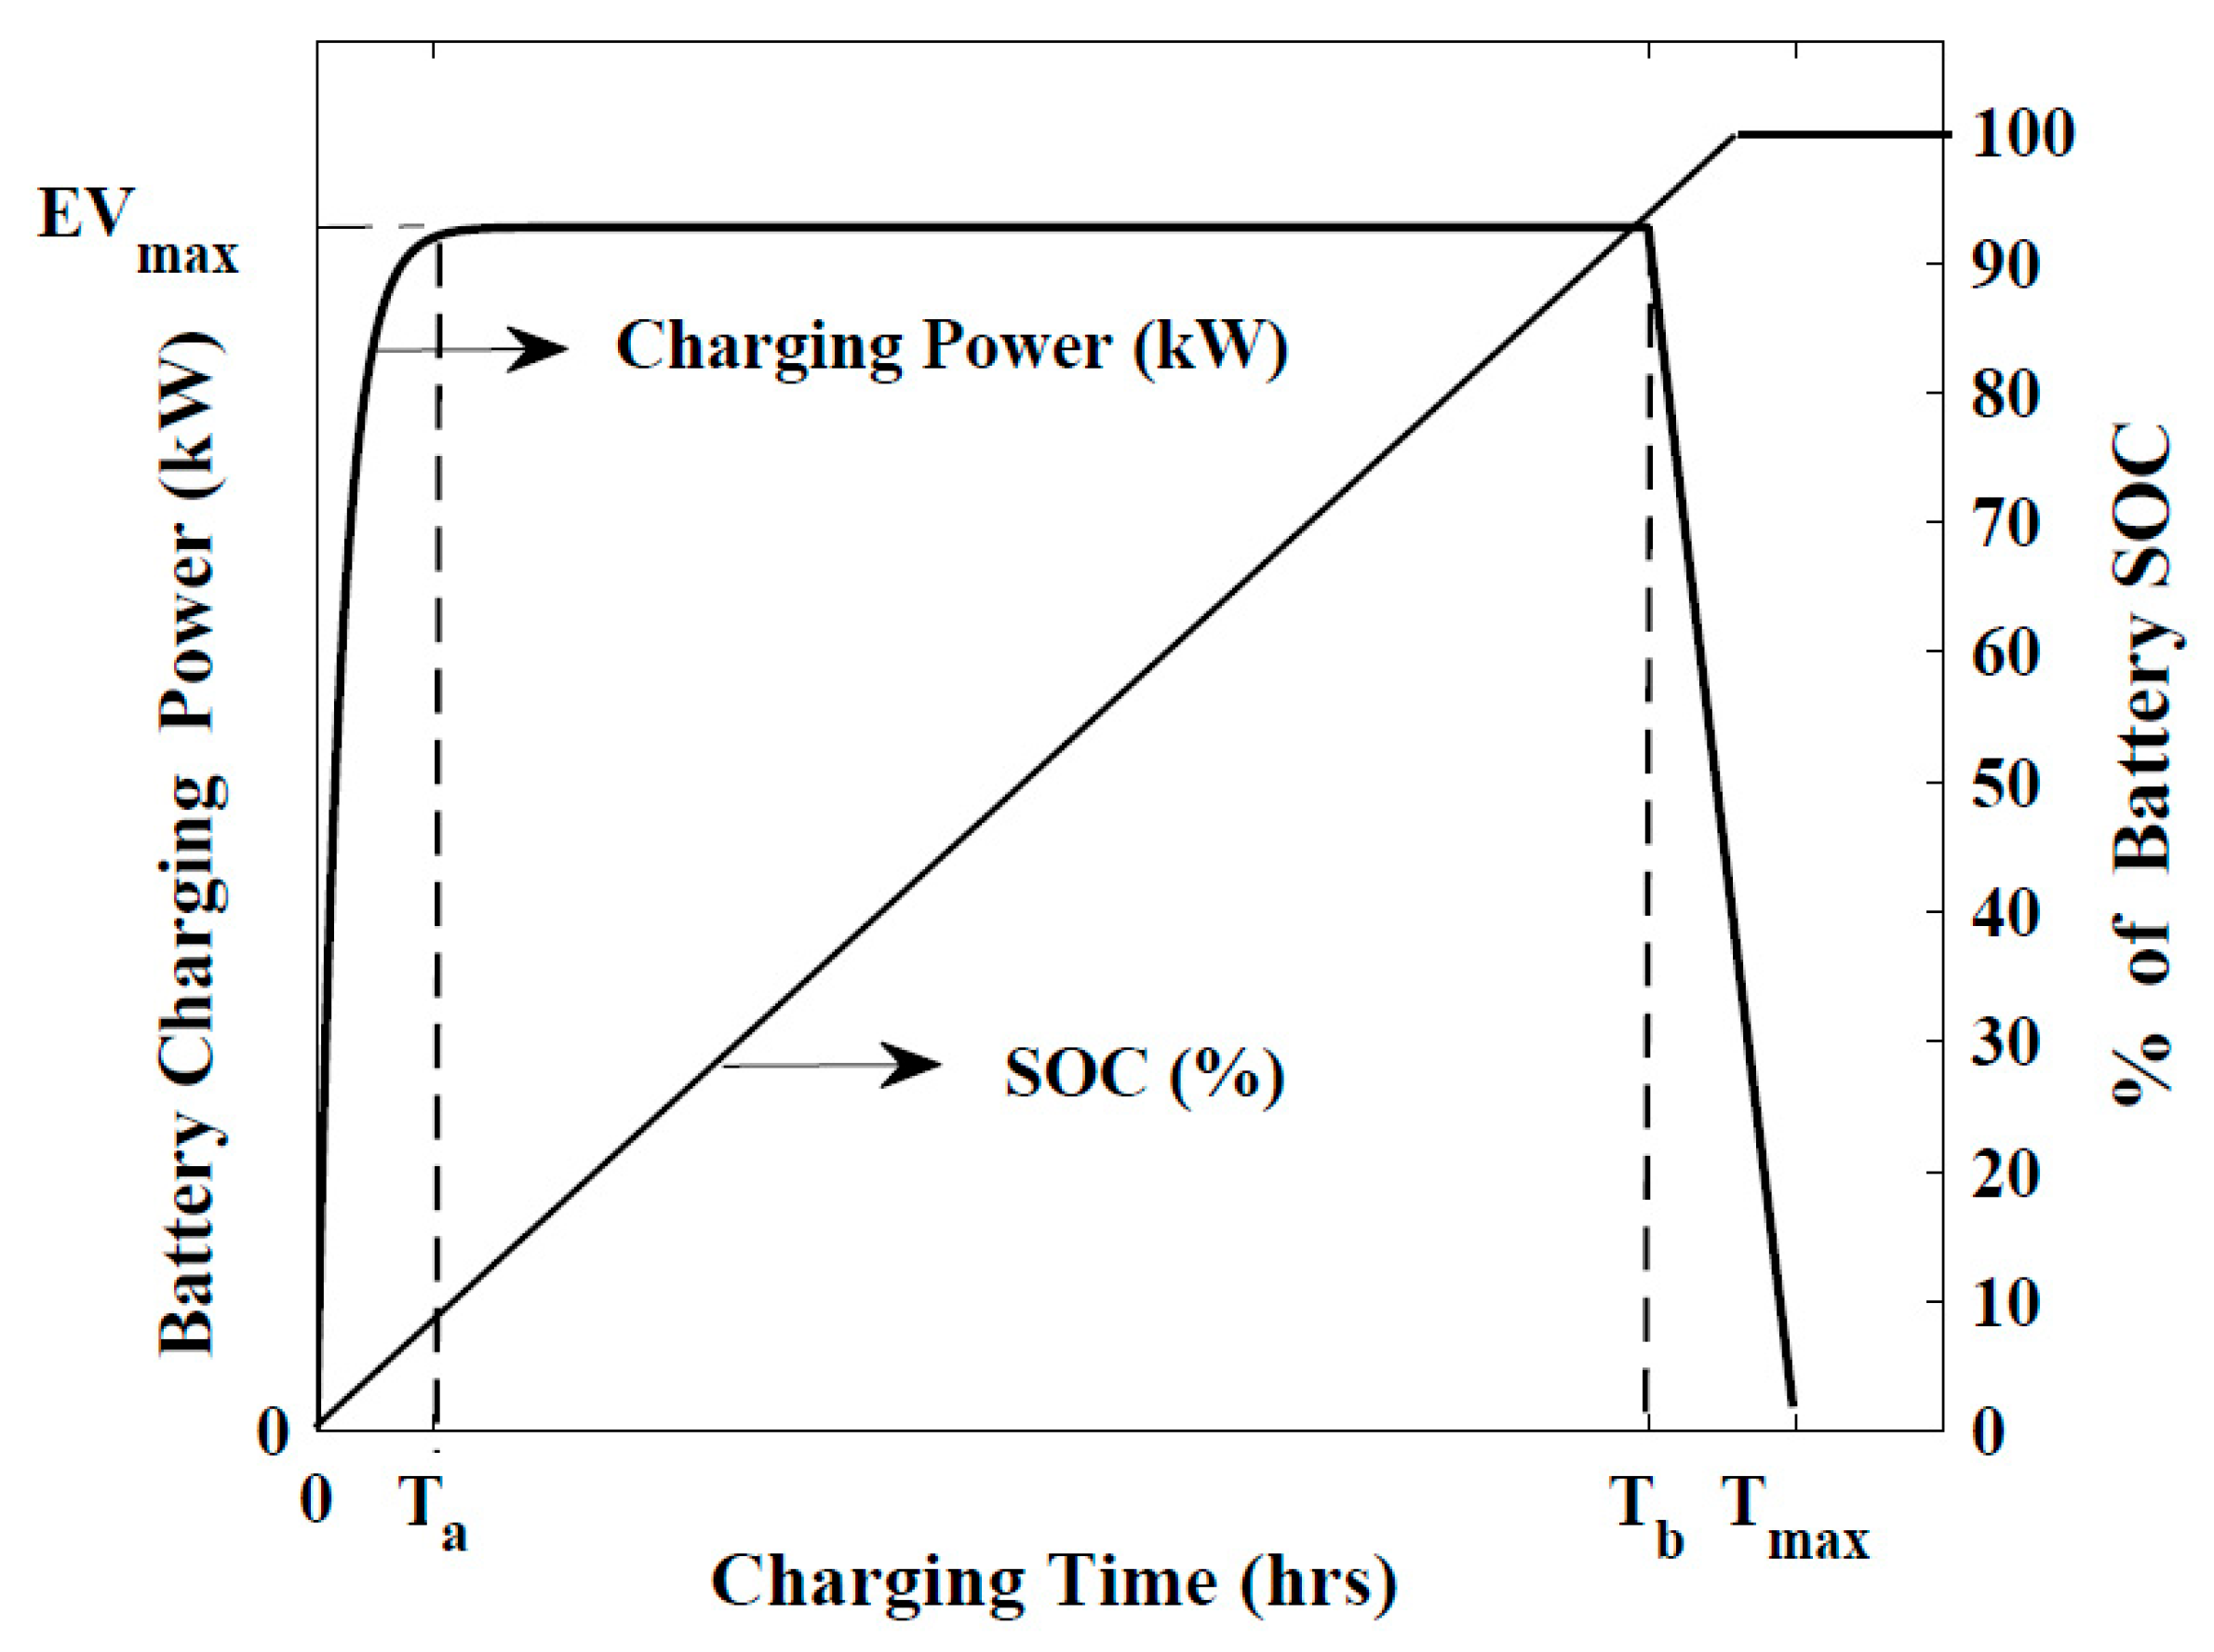
Lithium-ion batteries (LIBs) are highly efficient and well suited for electric vehicle applications. Figure 2 illustrates a typical charging profile for an LIB operating under constant-power and constant-voltage modes. From this characteristic curve, the following equations can be derived to perform load-flow analysis for the battery during charging.
Figure 2.
Charging characteristics of lithium-ion battery [10].
and denote the maximum electric vehicle load demands during the constant-power and constant-voltage charging phases, respectively.
The energy storage capacity of a battery (BES) during the charging process can be quantified through its State of Charge (SOC), which is expressed using the following equations:
Once the SOC reaches 100%, the battery must be detached from the charging socket to prevent overcharging. Modern chargers incorporate advanced power factor correction techniques to minimize charging time. In this study, a lagging power factor of 0.95 has been assumed for the battery chargers. Consequently, the peak battery charging load demand at strategic locations can be expressed using the following equations:
and represent the active and reactive power demand of the EVCS for the Kth node, respectively, denotes the number of EVs connected at that Kth node, indicates the peak charging power of an individual EV, and is the power factor angle.
7. Multi-Objective Function Formulation
This work proposes the optimal allocation of solar DGs, wind DGs, battery storage systems, SCs and fast EVCSs within a distribution network. The primary goal is to minimize both real and reactive power drawn from the source substation, ideally reducing it to near zero. Additional objectives include lowering active and reactive power losses across the network and simultaneously enhancing the voltage profile. These five objectives are formulated individually using mathematical models, and, finally, a combined multi-objective optimization function is developed to achieve the desired performance.
Real power drawn index (XPJ): This index aims to minimize the total real power drawn from the substation by optimally allocating solar DGs, wind DGs, battery storage systems and fast EVCSs (Equation (21)).
PSIB denotes the real power delivered from the source substation under the base configuration. PVDGn represents the real power generated by the rooftop PV system at the nth node of the distribution network having NB nodes. SPDGn and WPDGn refer to the real power generated by solar DGs with battery storage and wind DGs, respectively, at the NDG locations within the distribution network, where is considered as 3 in this study. The PEVCSn indicates the real power consumption of the fast EVCSs at the NCS locations, with NCS taken as 10.
Reactive power drawn index (XQJ): This index aims to minimize the total reactive power drawn from the substation by optimally allocating solar DGs, wind DGs, battery storage systems and fast EVCSs (Equation (22)).
QSIB denotes the reactive power delivered from the source substation under the base configuration. SQDGn and WQDGn refer to the reactive power generations of solar DGs and wind DGs, respectively. SCn refers to the reactive power generations of the shunt capacitors at the NSC locations, where is considered as 3 in this study. The QEVCSn indicates the reactive power consumption of the fast EVCSs.
Real power loss minimization index (XPLJ): This index is designed to minimize the total real power loss within the distribution network (Equation (23)).
TLPB represents the real power loss in the base configuration of the network, while denotes the corresponding loss after implementing the proposed modifications.
Reactive power loss minimization index (XQLJ): This index is designed to minimize the total reactive power loss within the distribution network (Equation (24)).
TLQB represents the reactive power loss in the base configuration of the network, while denotes the corresponding loss after implementing the proposed modifications.
Voltage profile index (XVPJ): This index is intended to enhance the voltage profile across all nodes of the distribution network, bringing them as close as possible to the nominal value of 1 p.u (Equation (25)).
represents the node voltages in the base configuration and denotes the voltages in the modified network.
Multi-objective function (MOF): All five previously discussed objectives are integrated into a single formulation, which can be expressed through the following combined equation.
8. Gravitational Search Algorithm (GSA) for Optimum Allocation of Solar DGs with Battery Storage, Wind DGs, SCs and EVCSs
The Gravitational Search Algorithm (GSA) [34] is a metaheuristic optimization method inspired by Newton’s law of gravity and Newton’s law of motion.
According to Newton’s law of gravity, the gravitational force acting between two masses, and , can be mathematically expressed as follows:
Here, denotes the distance between the two particles, and is the gravitational constant, which gradually decreases as the universe ages.
However, for implementation within the optimization framework, the term in Equation (27) was replaced with to achieve an improved experimental performance. The modified equation is therefore expressed as follows:
According to Newton’s law of motion, the acceleration of a particle under the influence of a force can be expressed mathematically as follows, where denotes the particle’s acceleration and represents its inertial mass.
Based on Newton’s laws, the GSA models the solution space as a gravitational field, where particles (or masses) represent decision variables whose optimal values need to be determined. Initial masses are assigned by randomly generating fitness values within the search space. While all agents exert gravitational attraction on each other, heavier masses apply stronger forces, guiding lighter agents toward them over successive iterations to converge on optimal solutions. In this study, GSA is employed to determine the optimal placement and sizing of solar DGs with battery storage systems, wind DGs, SCs and EVCSs across different seasons. A multi-objective function, defined by Equation (26), serves as the fitness function to enhance the performance of the distribution system.
For an optimization problem with decision variables, each represented as a mass agent with dimensions in the search space, the position of the jth mass is expressed as follows:
In GSA, the force acting on the jth mass due to the kth mass at a given iteration ‘itrn’ is computed using the modified Newtonian gravitational law, as shown in Equation (28).
and represent the active and passive gravitational masses, is the separation distance between those in the search space, and refers to a small constant. G denotes the gravitational constant that varies with each iteration, along with other parameters.
Considering the combined influence of all N masses, the resultant force on the jth mass is calculated by incorporating stochastic random numbers () within the interval [0, 1], which account for the weighted contribution of individual masses.
Based on this resultant force, the acceleration of the jth mass is determined, where denotes its inertial mass.
is derived from the population fitness values as follows:
is the fitness value of the jth mass, and and represent the maximum and minimum fitness values, respectively.
Using the computed acceleration, the velocity and position of the jth mass for the next iteration are updated through the corresponding equations:
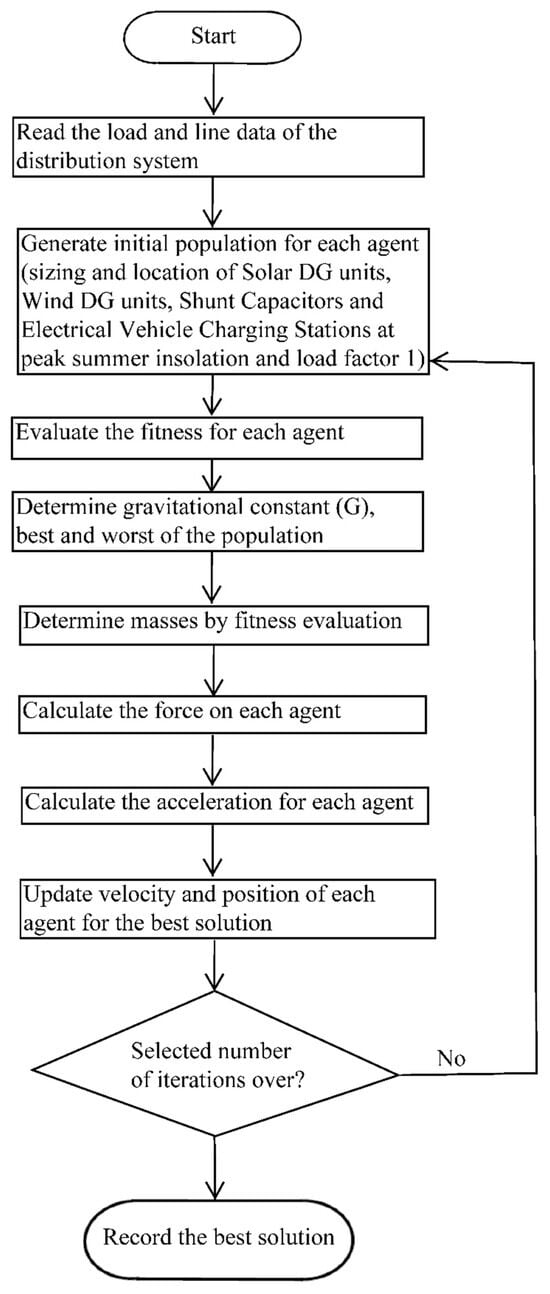
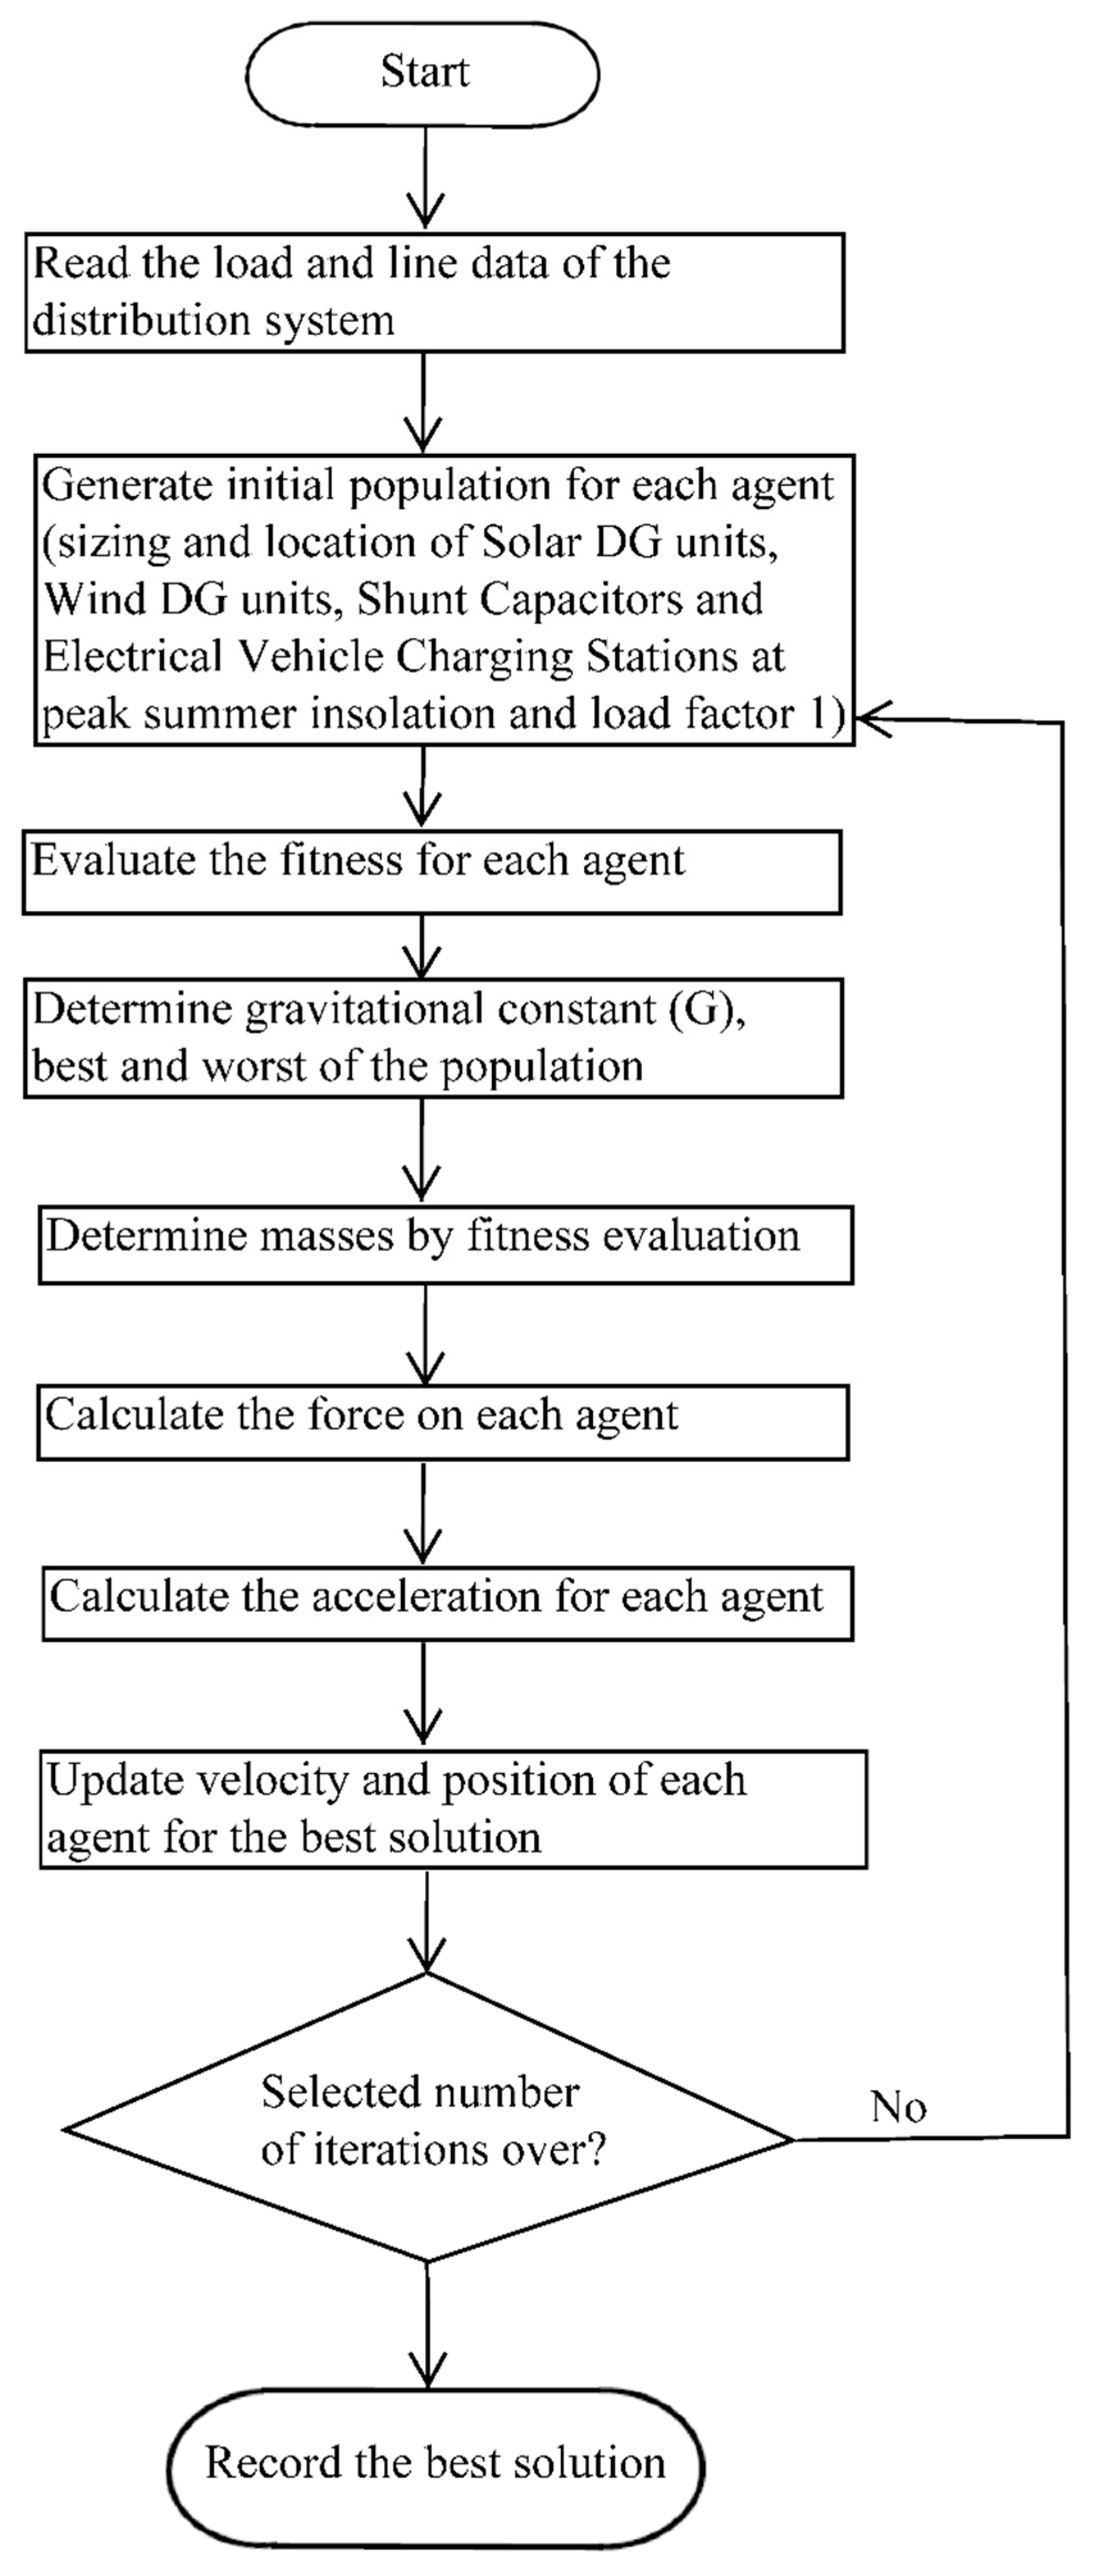
A flowchart illustrating the optimal allocation and sizing of three solar DG units, three wind DG units, three SCs, and ten fast EVCSs using GSA is presented in Figure 3.
Figure 3.
Flow chart for optimal allocation and sizing of solar and wind DG units, SCs and EVCSs using GSA.
9. Results and Discussions
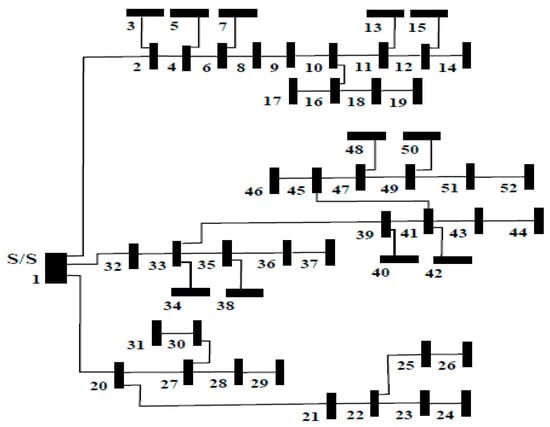
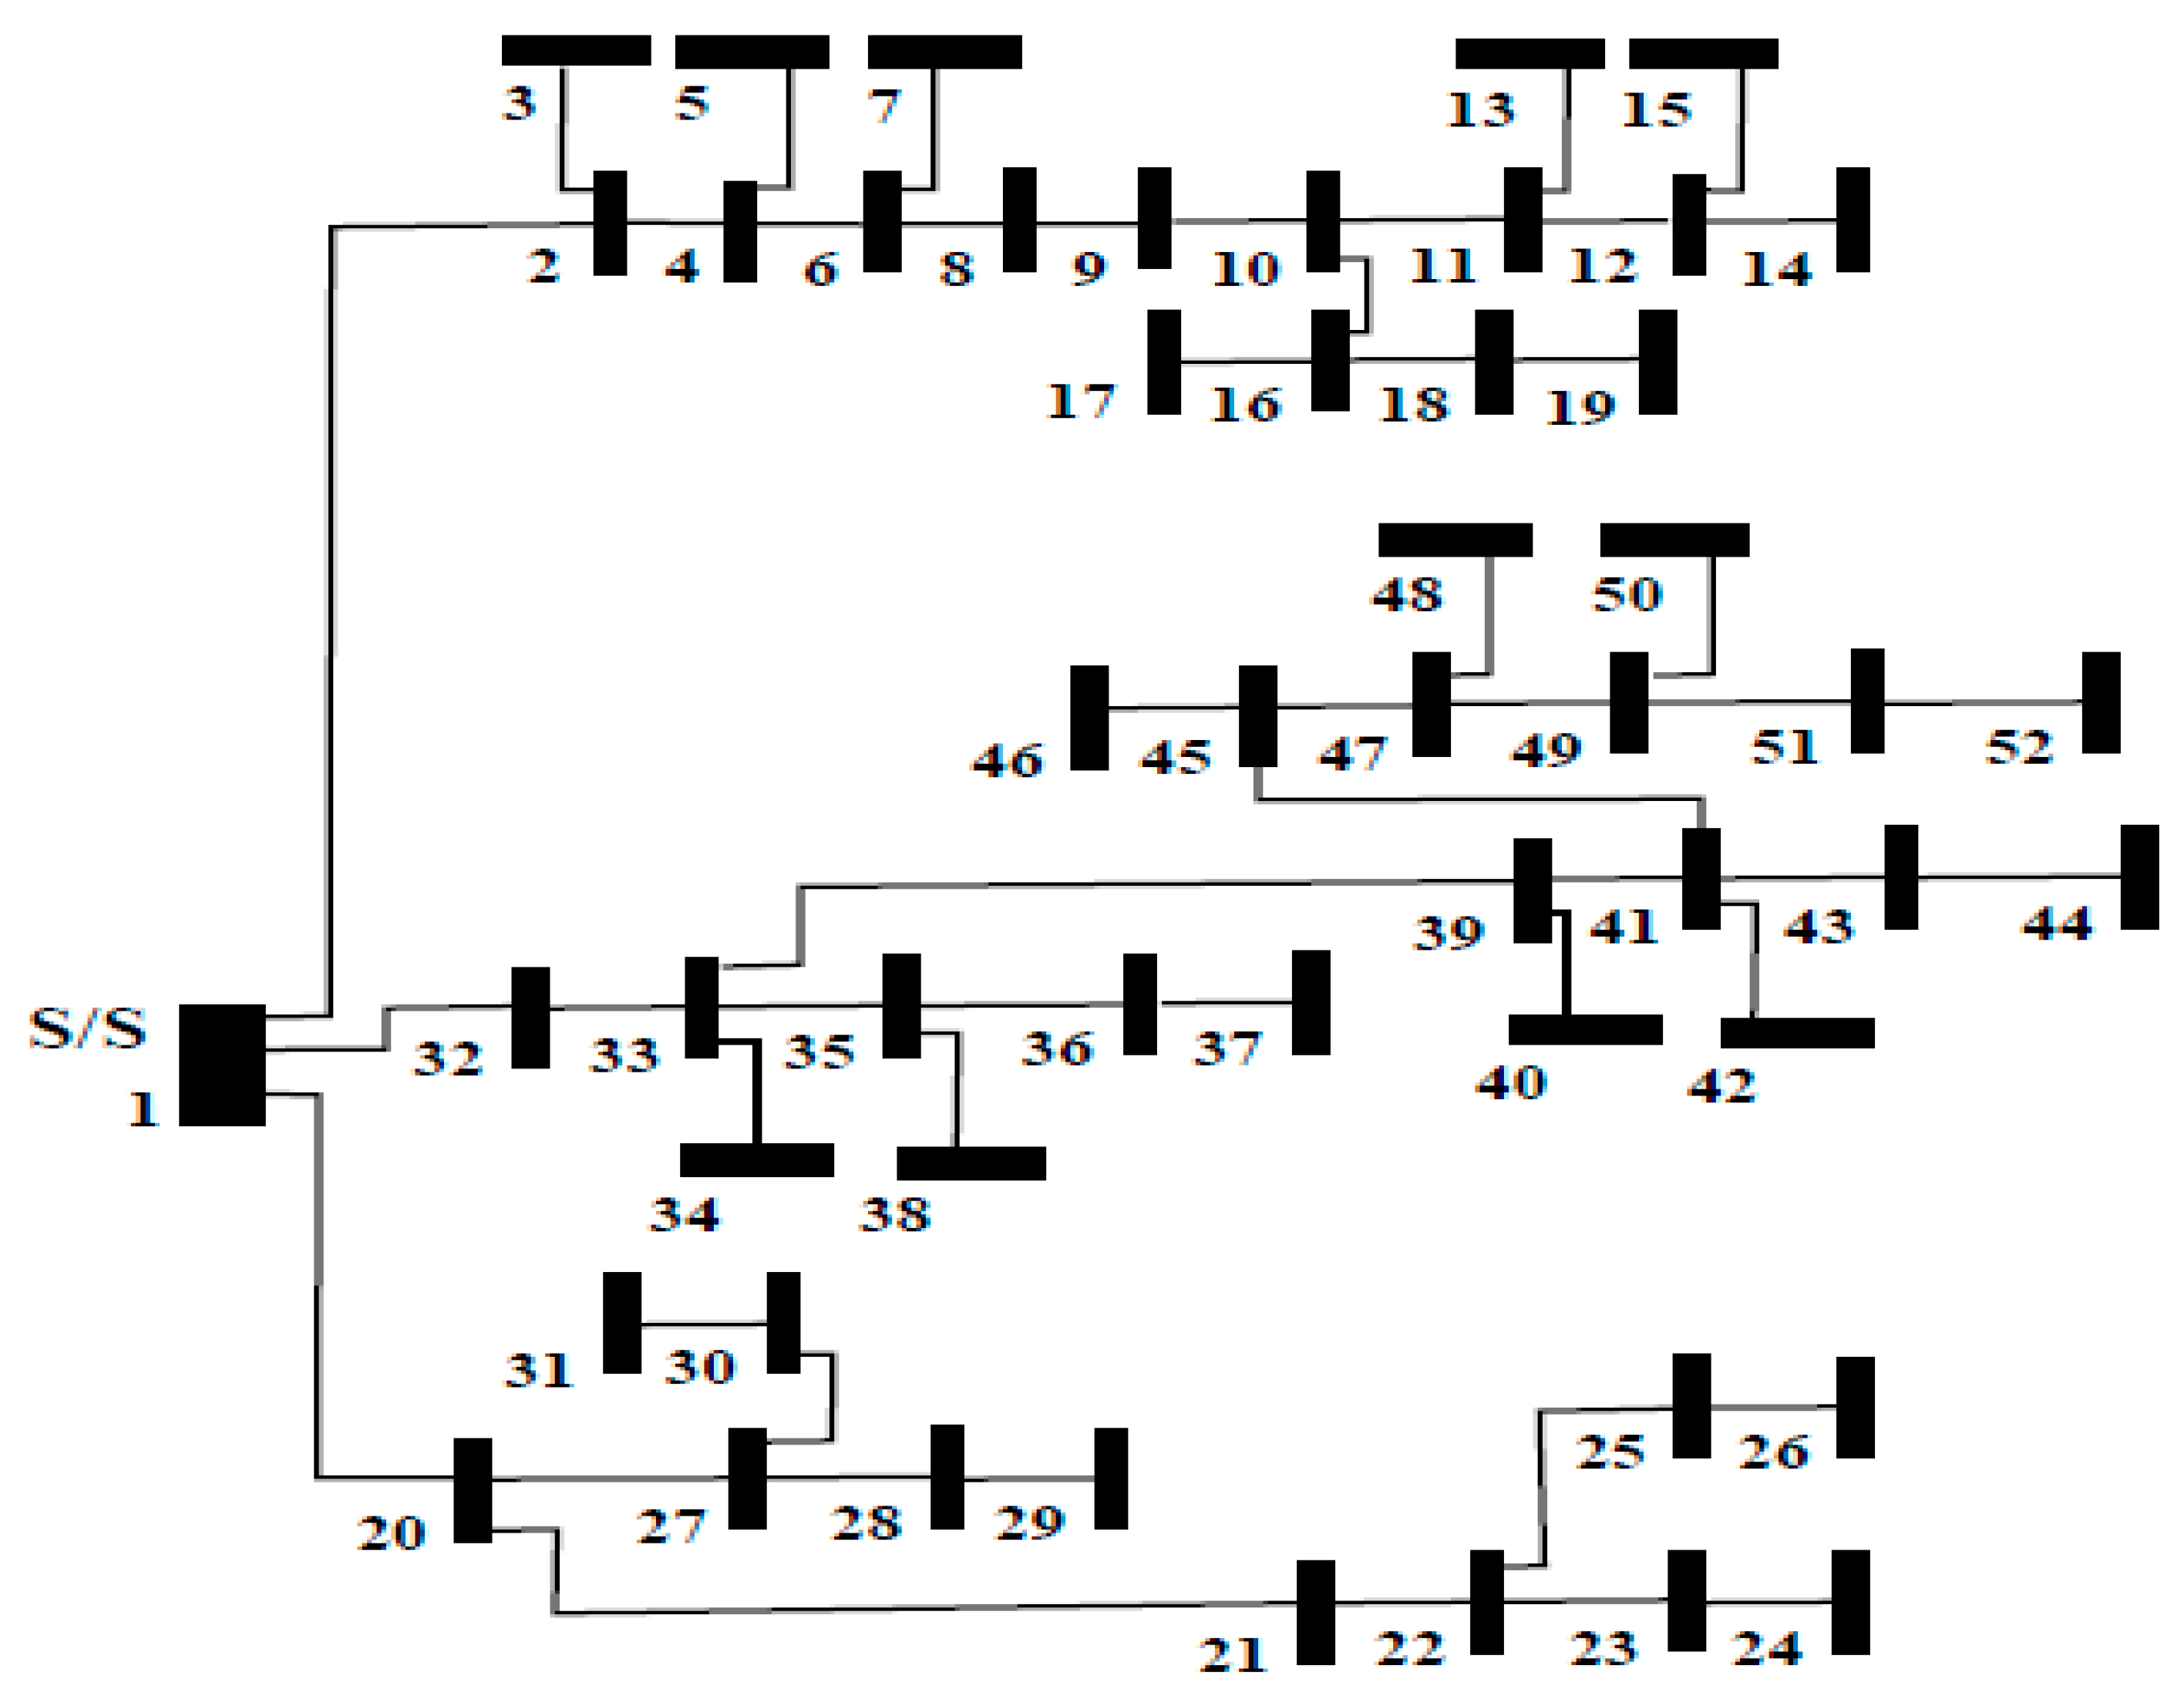
In this study, a practical 11 kV, 52-bus, Indian distribution network [9], illustrated in Figure 4, is examined to improve its operational performance through the proposed multi-objective optimization framework. The system’s line and load parameters, sourced from [9], are presented in Table A2 within Appendix A.
Figure 4.
Practical 52-bus rural distribution system.
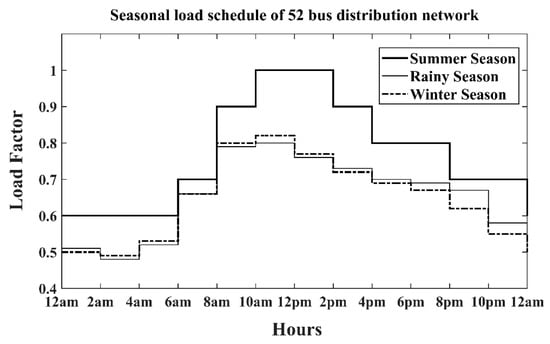
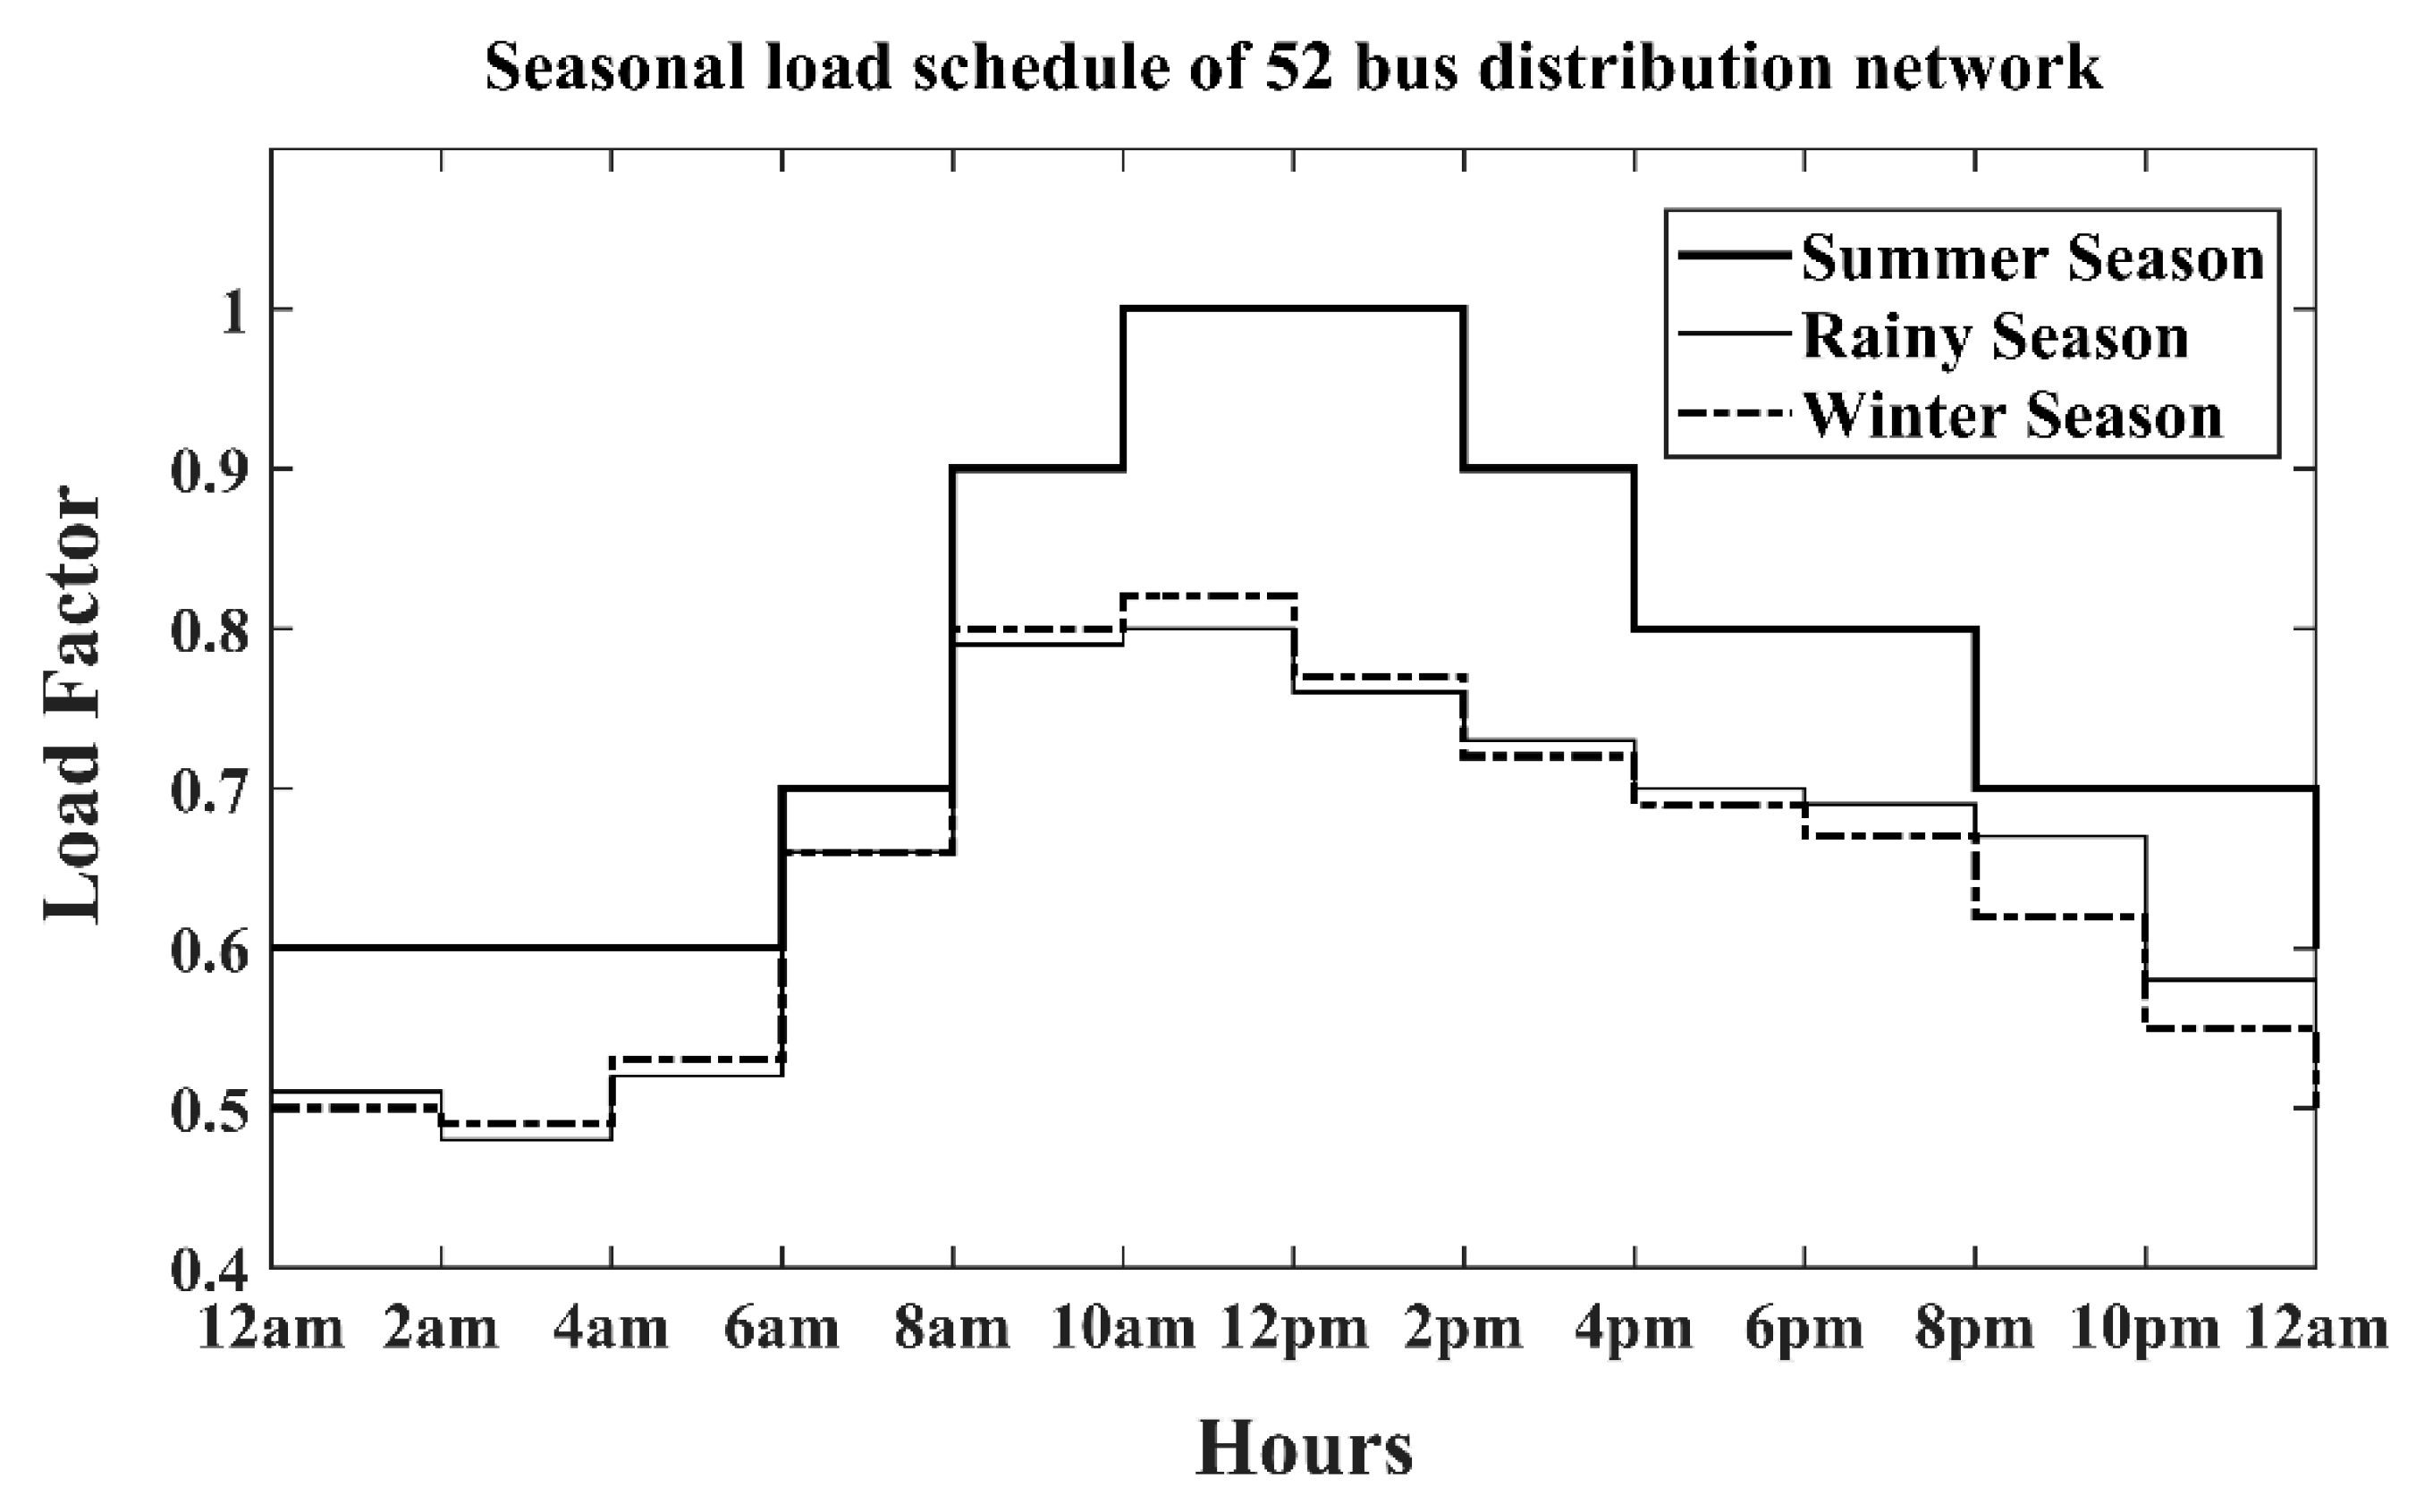
Additionally, the seasonal hourly average load profile for this distribution network, located in Bengaluru, India, is provided in [9] and depicted in Figure 5.
Figure 5.
Seasonal load schedule of the 52-bus distribution system.
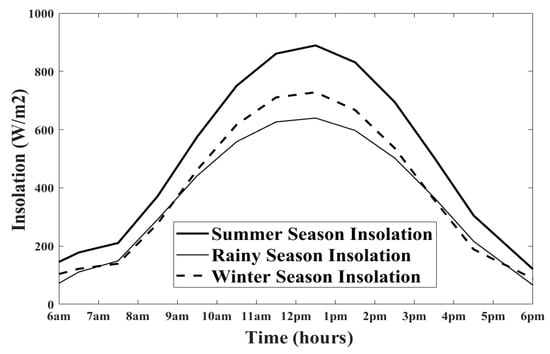
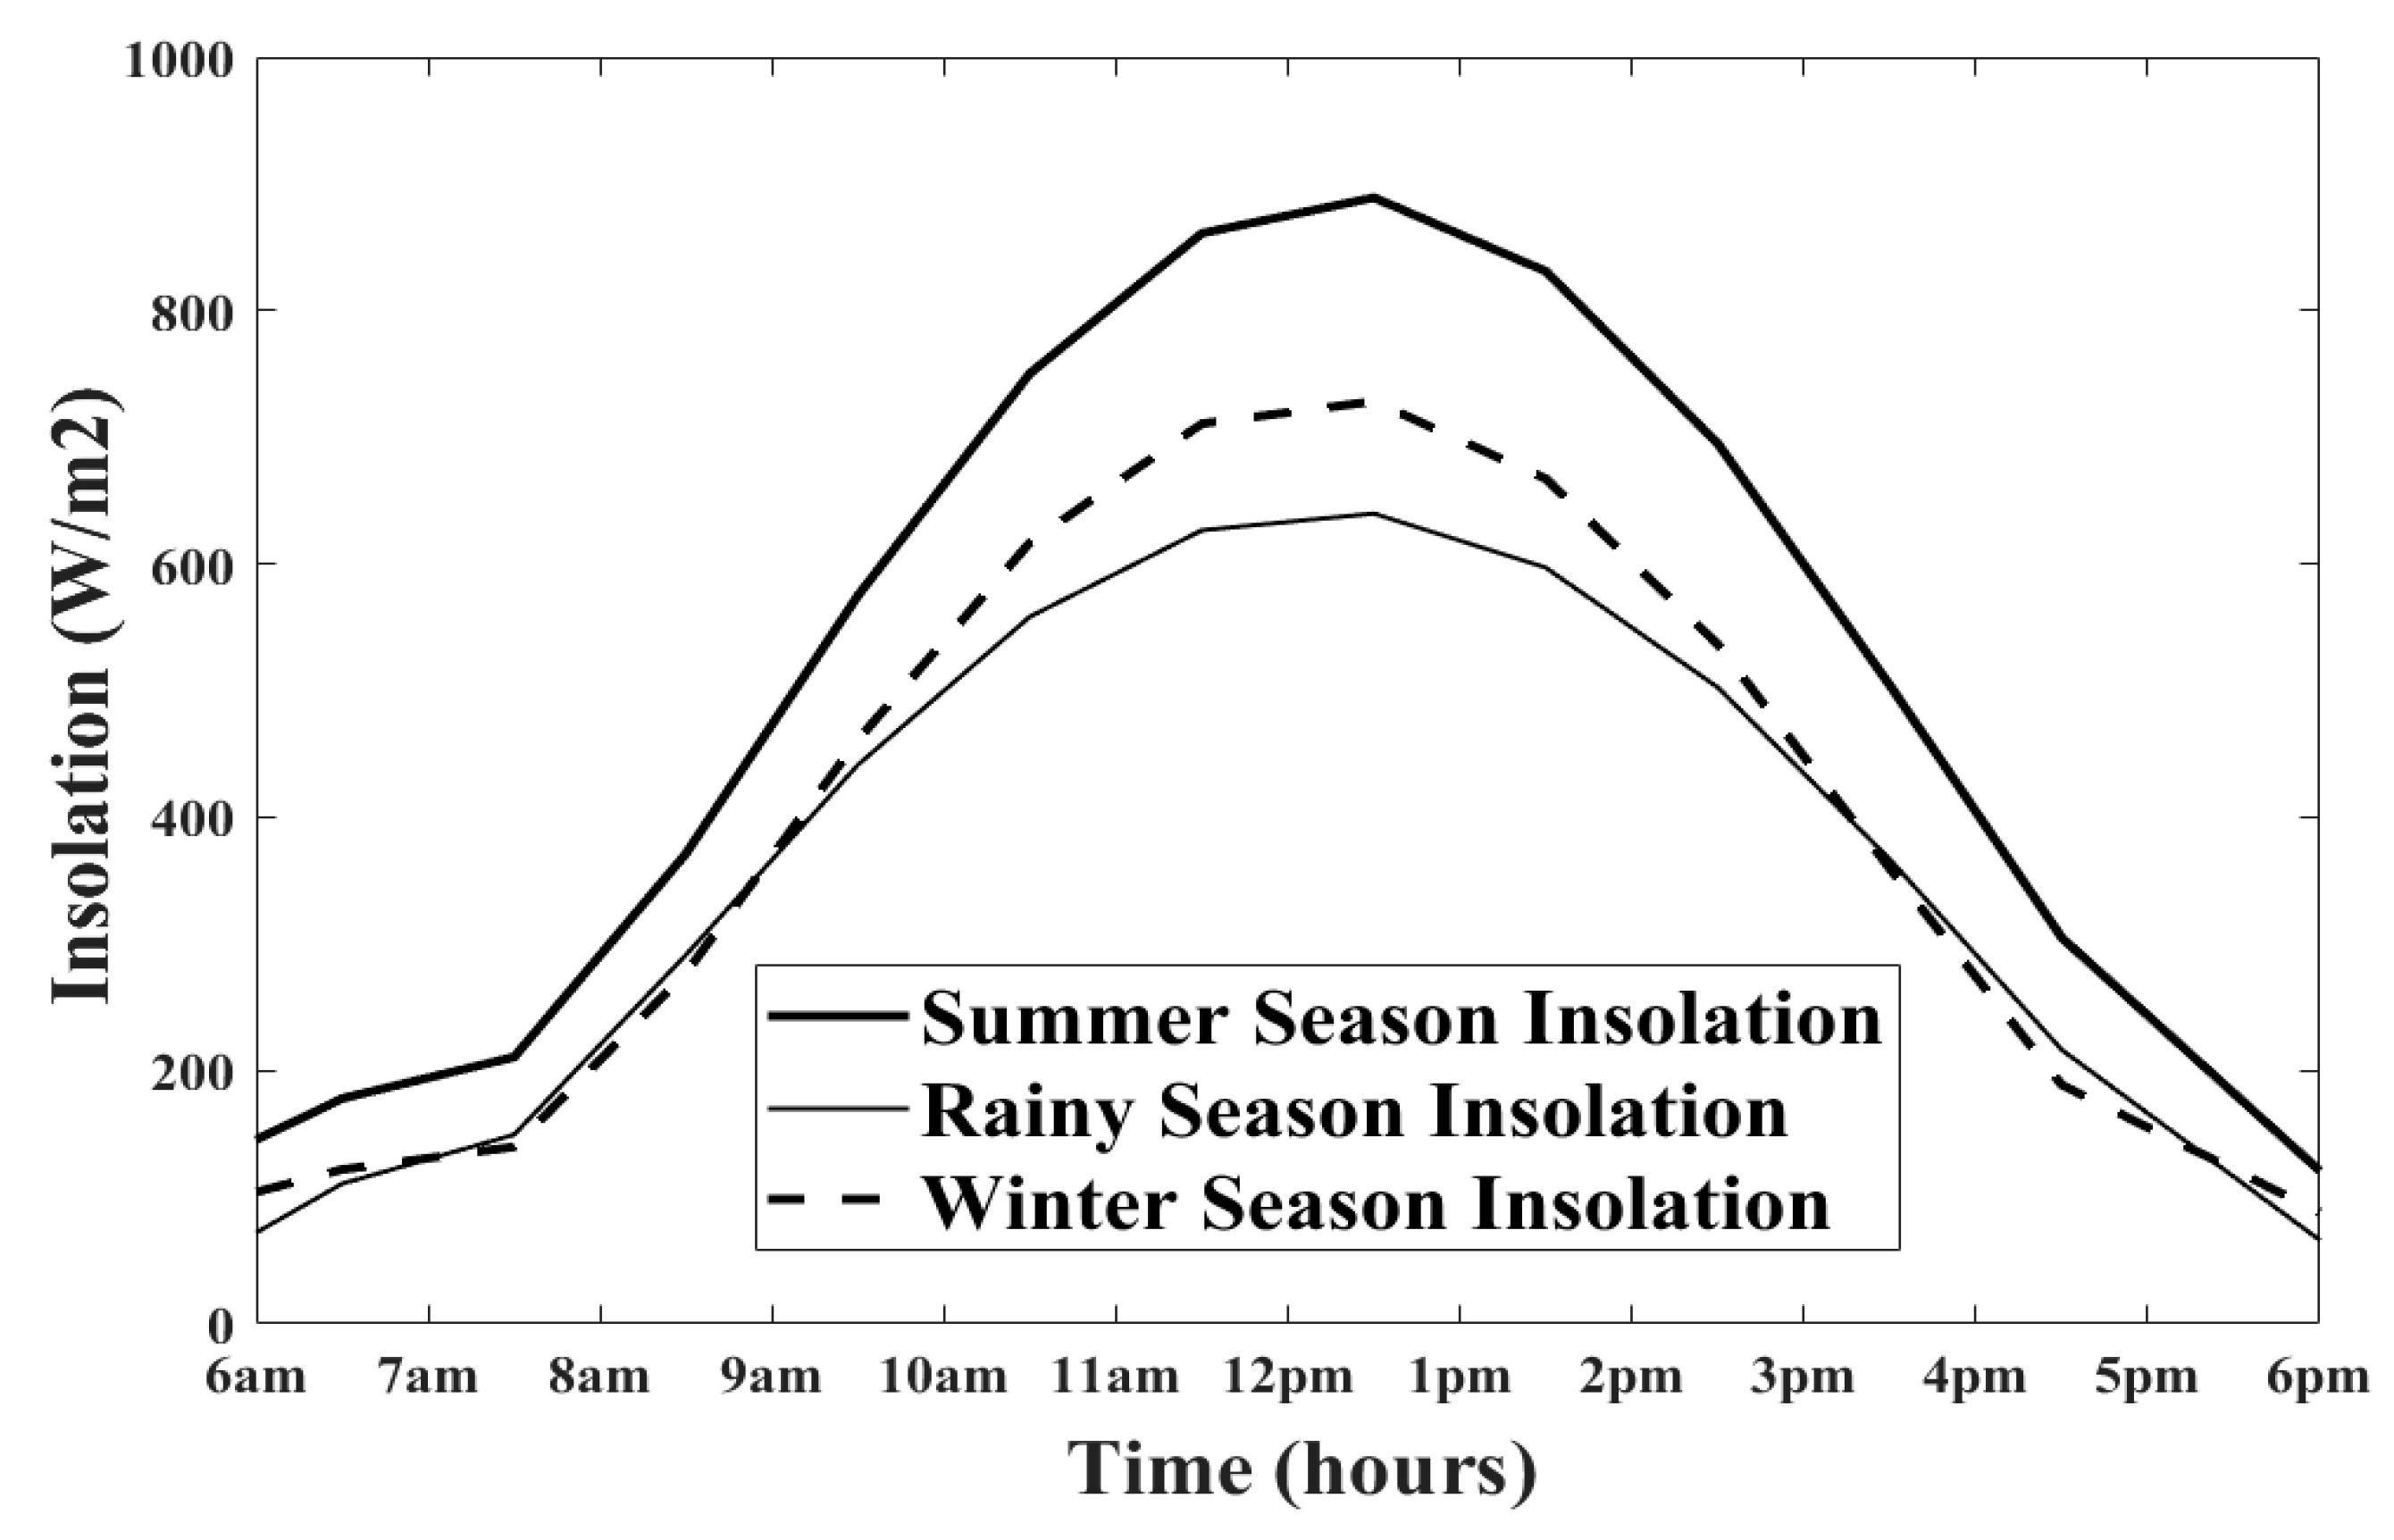
The corresponding hourly average insolation profile season-wise has been assessed using the methodology outlined in Section 2, based on Bengaluru’s geographical coordinates, and is shown in Figure 6.
Figure 6.
Seasonal hourly average insolation profile.
Furthermore, the rooftop solar PV generation capacity for the distribution system has been computed following the procedure described in Section 3, with the results summarized in Tables 5, 8 and 11.
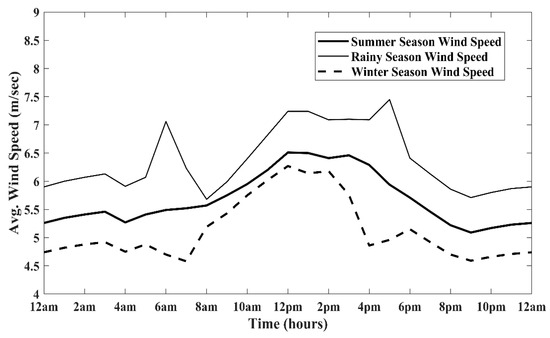
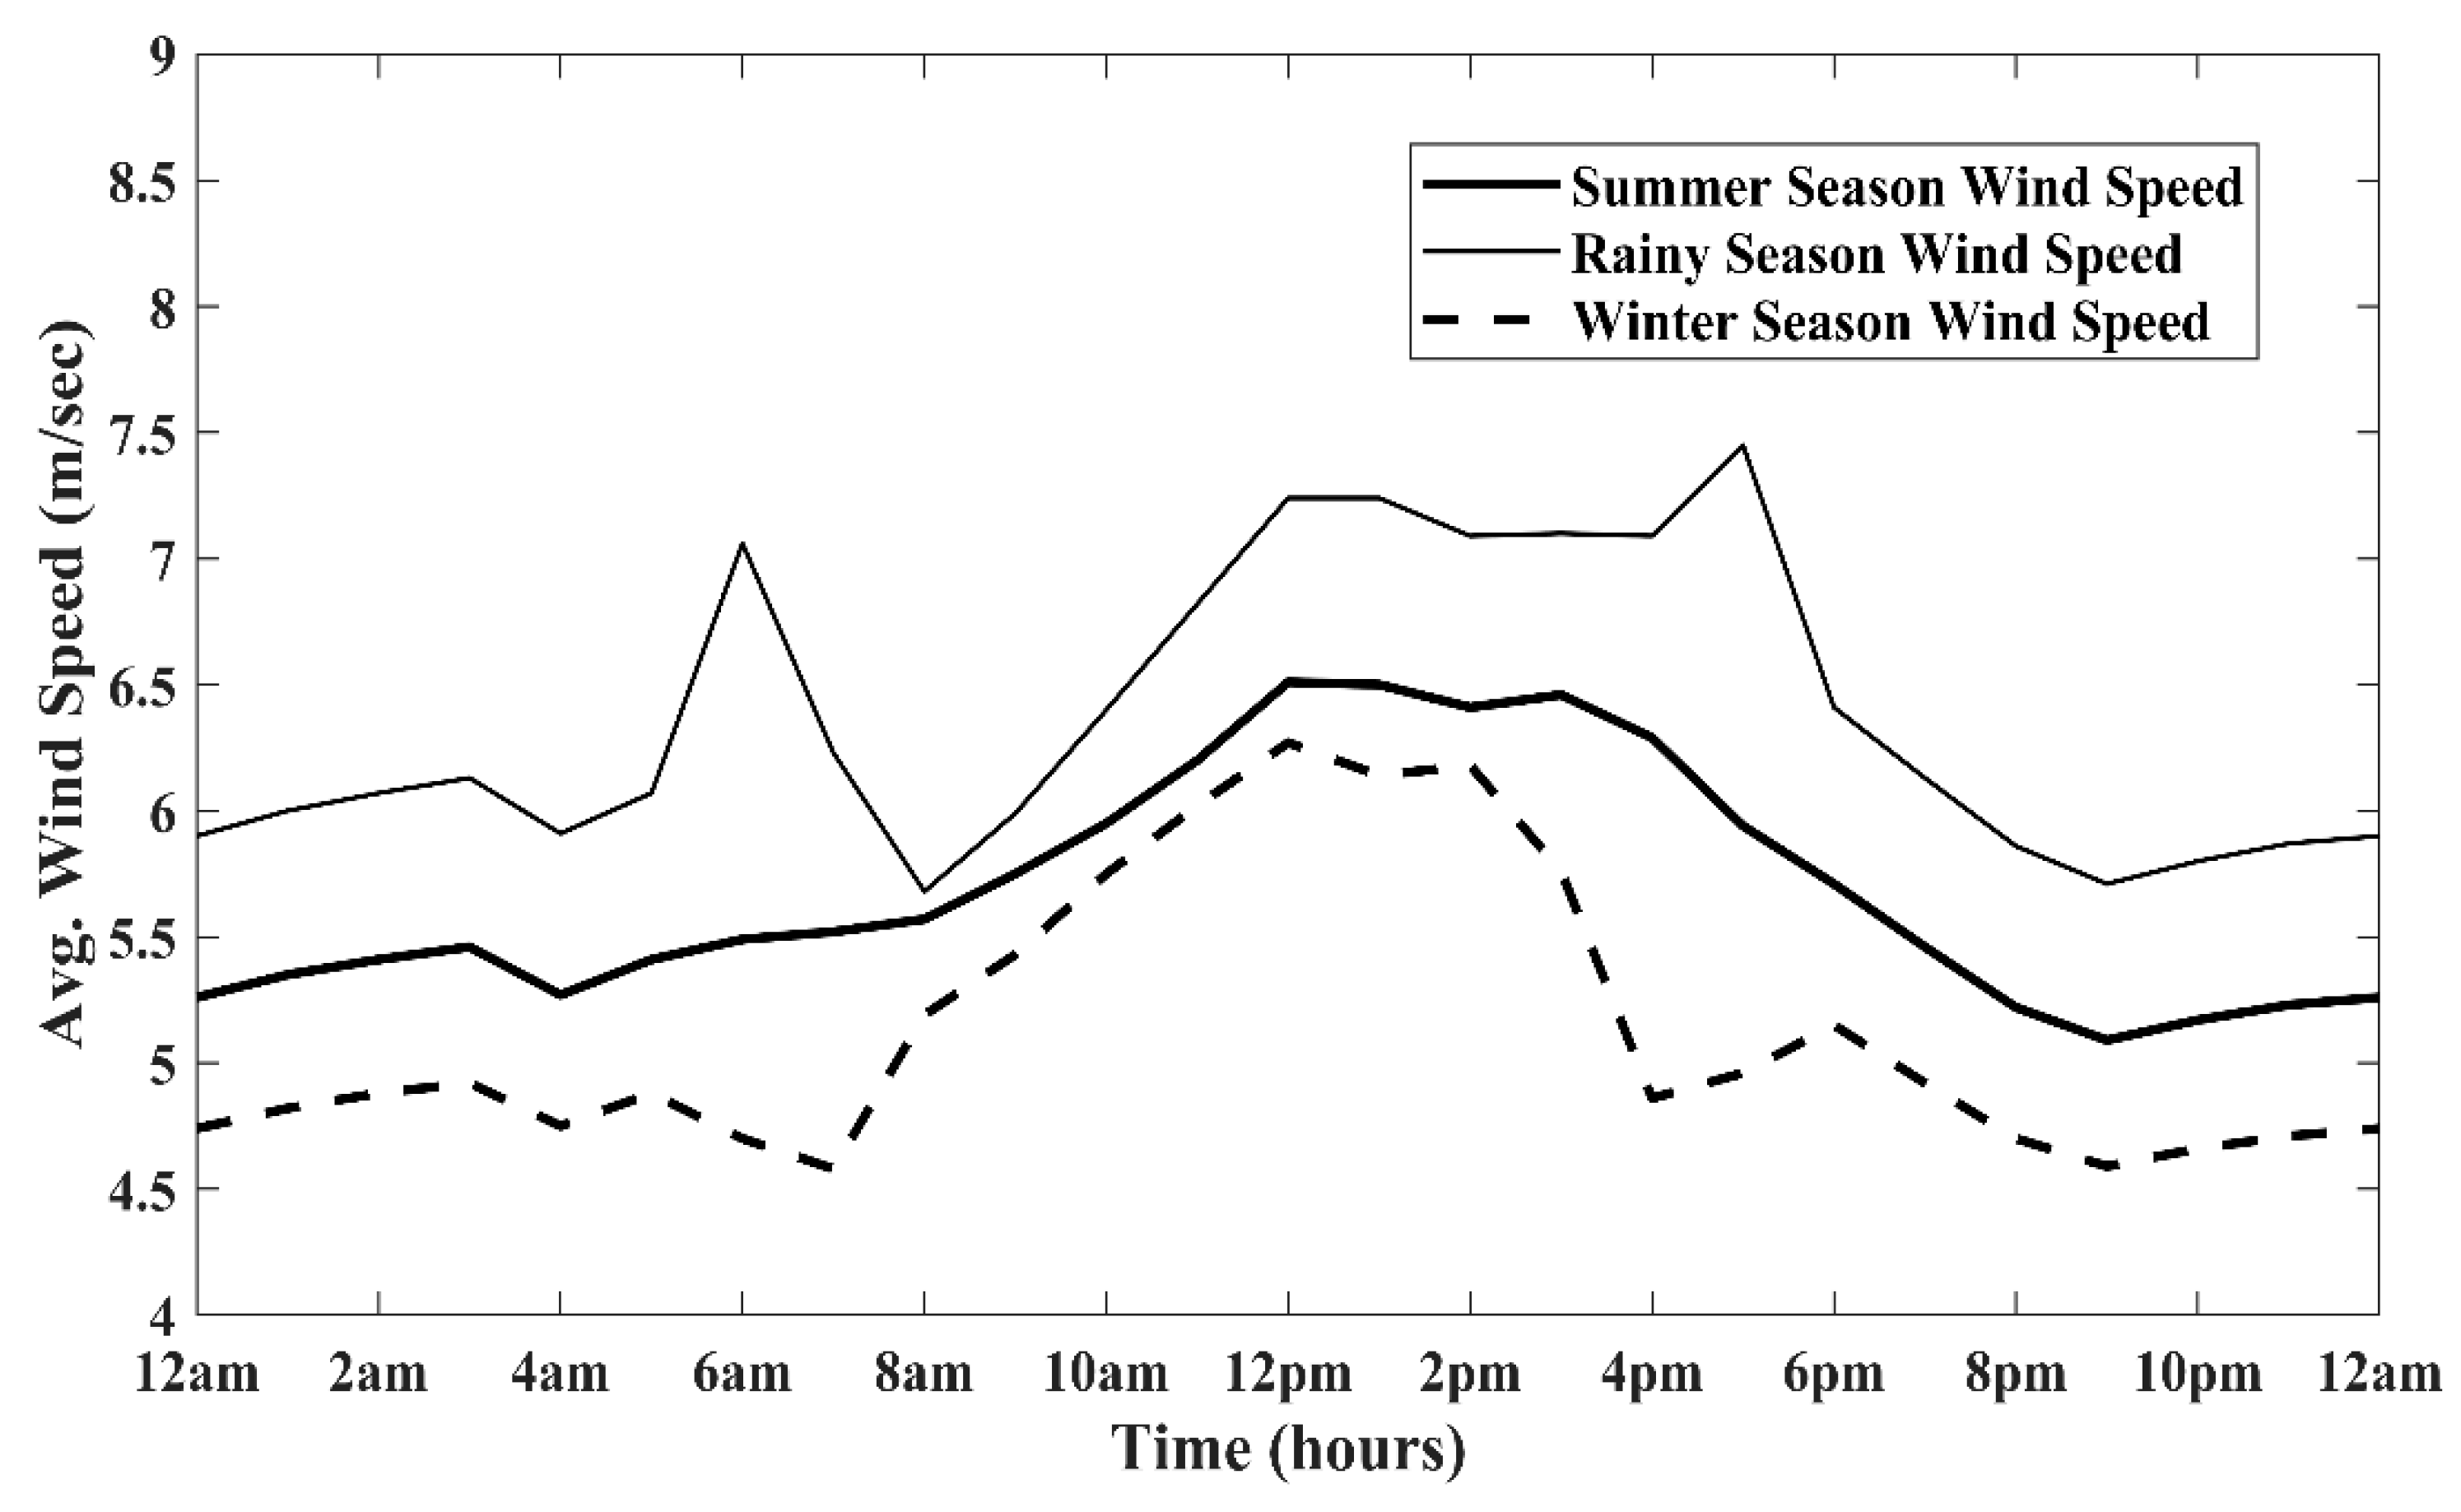
The seasonal hourly average wind speed sourced from [6] is depicted in Figure 7, and the wind power generation capacity for the distribution system has been estimated following the formulation and assumptions described in Section 4, with the results summarized in Tables 5, 6, 8, 9, 11 and 12.
Figure 7.
Seasonal hourly average wind speed profile.
9.1. Optimum Output and Location of Wind DGs, Solar DGs with Batteries, SCs and EVCSs Using GSA
In addition to rooftop solar PV installations, the optimal sizing and placement of wind-based DGs, solar DGs, battery storage, SCs and EVCSs have been determined using the GSA described in Section 7. These solutions satisfy multiple objectives simultaneously. The results for different seasons are summarized in Table 5, Table 6 and Table 7 for summer, Table 8, Table 9 and Table 10 for the rainy season and Table 11, Table 12 and Table 13 for winter.
Table 5.
Solar DG output requirements for summer load (daytime only without battery charging).
Table 6.
Battery storage capacity requirements for summer load (nighttime).
Table 7.
Shunt capacitor capacity requirements for summer load.
Table 8.
Solar DG output requirements for rainy season load (daytime only without battery charging).
Table 9.
Battery storage capacity requirements for rainy season load (nighttime).
Table 10.
Shunt capacitor capacity requirements for rainy season load.
Table 11.
Solar DG output requirements for winter load (daytime only without battery charging).
Table 12.
Battery storage capacity requirements for winter load (nighttime).
Table 13.
Shunt capacitor capacity requirements for winter load.
The strategic locations were initially identified under peak load, insolation and wind speed conditions for the summer season using GSA and then applied across other seasonal scenarios and for successive stages. The optimal nodes are 2, 20 and 32 for wind DGs; 19, 29 and 41 for the solar DGs with battery storage systems; 23, 27 and 49 for the SCs; and 4, 7, 11, 19, 21, 29, 31, 33, 41 and 47 for the EVCSs.
The analysis of Table 5 and Table 7 reveals that, during summer peak hours (12–1 p.m.), the substation does not need to supply any real power to the distribution network. Instead, the network is capable of injecting approximately 12.8231 kW of active power and 9.0029 kVAR of reactive power back into the grid. Similarly, as shown in Table 8 and Table 10, during the rainy season peak hours (12–1 p.m.), the network can export about 395.7040 kW and 123.3448 kVAR to the grid. This surplus occurs because both wind DGs and solar DGs operate at their maximum output, exceeding the peak load demand at that time. The excess energy can alternatively be utilized for charging battery storage systems.
From the comprehensive results presented in Table 5, Table 6, Table 7, Table 8, Table 9, Table 10, Table 11, Table 12 and Table 13, it is evident that the distribution network has been optimized to achieve self-sufficiency in meeting its own power requirements. Furthermore, surplus generation enables net metering with the grid or substation across all seasons and load conditions considered. Therefore, net-zero power exchange with the utility grid during peak hours is attained, effectively demonstrating complete grid independence under islanded operation.
9.2. Sizing of Battery Storage
This section presents the battery storage capacity ratings calculated in accordance with [35,36], as summarized in Table 14. The ratings are based on the seasonal battery output requirements for a 12 h nighttime duration, which are detailed in Table 6, Table 9 and Table 12. These requirements were used as the basis for determining the battery sizes. To account for performance degradation over time, an aging factor of 1.25 has been applied, as recommended in [36]. Additionally, a design margin of 1.1 has been incorporated into the sizing process. The analysis of Table 14 indicates that batteries have their highest ratings during the winter season. Consequently, the selected capacities are 33,000 kVAH for Battery-1, 24,200 kVAH for Battery-2, and 36,300 kVAH for Battery-3.
Table 14.
Battery Storage capacity rating for summer, rainy and winter seasons.
9.3. Sizing of Solar DG
In this study, the DGs are designed not only to supply power during daytime operations but also to simultaneously charge the battery systems. A solar array-to-load ratio of 2.2 has been adopted and reflected in Table 15. For a 12 h daytime period, the seasonal solar DG output requirements and their respective durations are detailed in Table 5, Table 8 and Table 11. The maximum output values across these periods were used to determine the DG ratings. Specifically, Solar DG-1 exhibits its peak requirement of 1747.34 kW during winter (5–6 p.m.), while Solar DG-2 and DG-3 reach their highest demands of 1213.54 kW and 1900.48 kW, respectively, during winter (6–7 a.m.). Based on these observations, the selected average capacities for the solar DGs are 3700 kW for DG-1, 2900 kW for DG-2 and 4050 kW for DG-3, as summarized in Table 15. It is important to note that the actual DG output fluctuates throughout the 12 h daytime window due to variations in solar insolation; the corresponding hourly output values are provided in Table 16.
Table 15.
Solar DG capacity rating.
Table 16.
Solar DG output calculation for summer.
9.4. Evaluation for Battery Recharging
This section validates that the excess energy generated by the solar DGs and wind DGs during the 12 h daytime period is adequate for recharging the batteries. The corresponding data for the summer season is presented in Table 17. The surplus energy from each solar DG is influenced by the load demand and the combined output from the solar DGs and wind DGs, which vary with insolation levels and wind speed throughout the day. Notably, the surplus becomes negative during the early morning (6–7 a.m.) and late evening (5–6 p.m.), indicating insufficient power generation due to low insolation and/or wind speed. During these intervals, the batteries supplement the load to maintain supply. This demonstrates that the integrated power system ensures a stable and reliable power supply, effectively mitigating the uncertainties associated with fluctuating load profiles and variable solar and wind power generations across different times and seasons. The estimated total surplus energies during the summer season are 33,007.1201 kW, 24,369.5848 kW and 36,525.9852 kW for Solar DG-1, DG-2, and DG-3, respectively, as shown in Table 17. These values exceed the corresponding battery capacities discussed in Section 9.2.
Table 17.
Battery recharge calculation.
9.5. Minimizing Power Loss
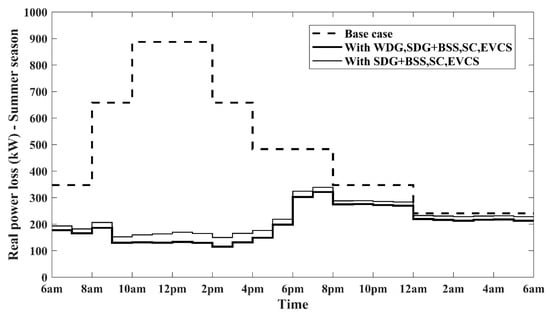
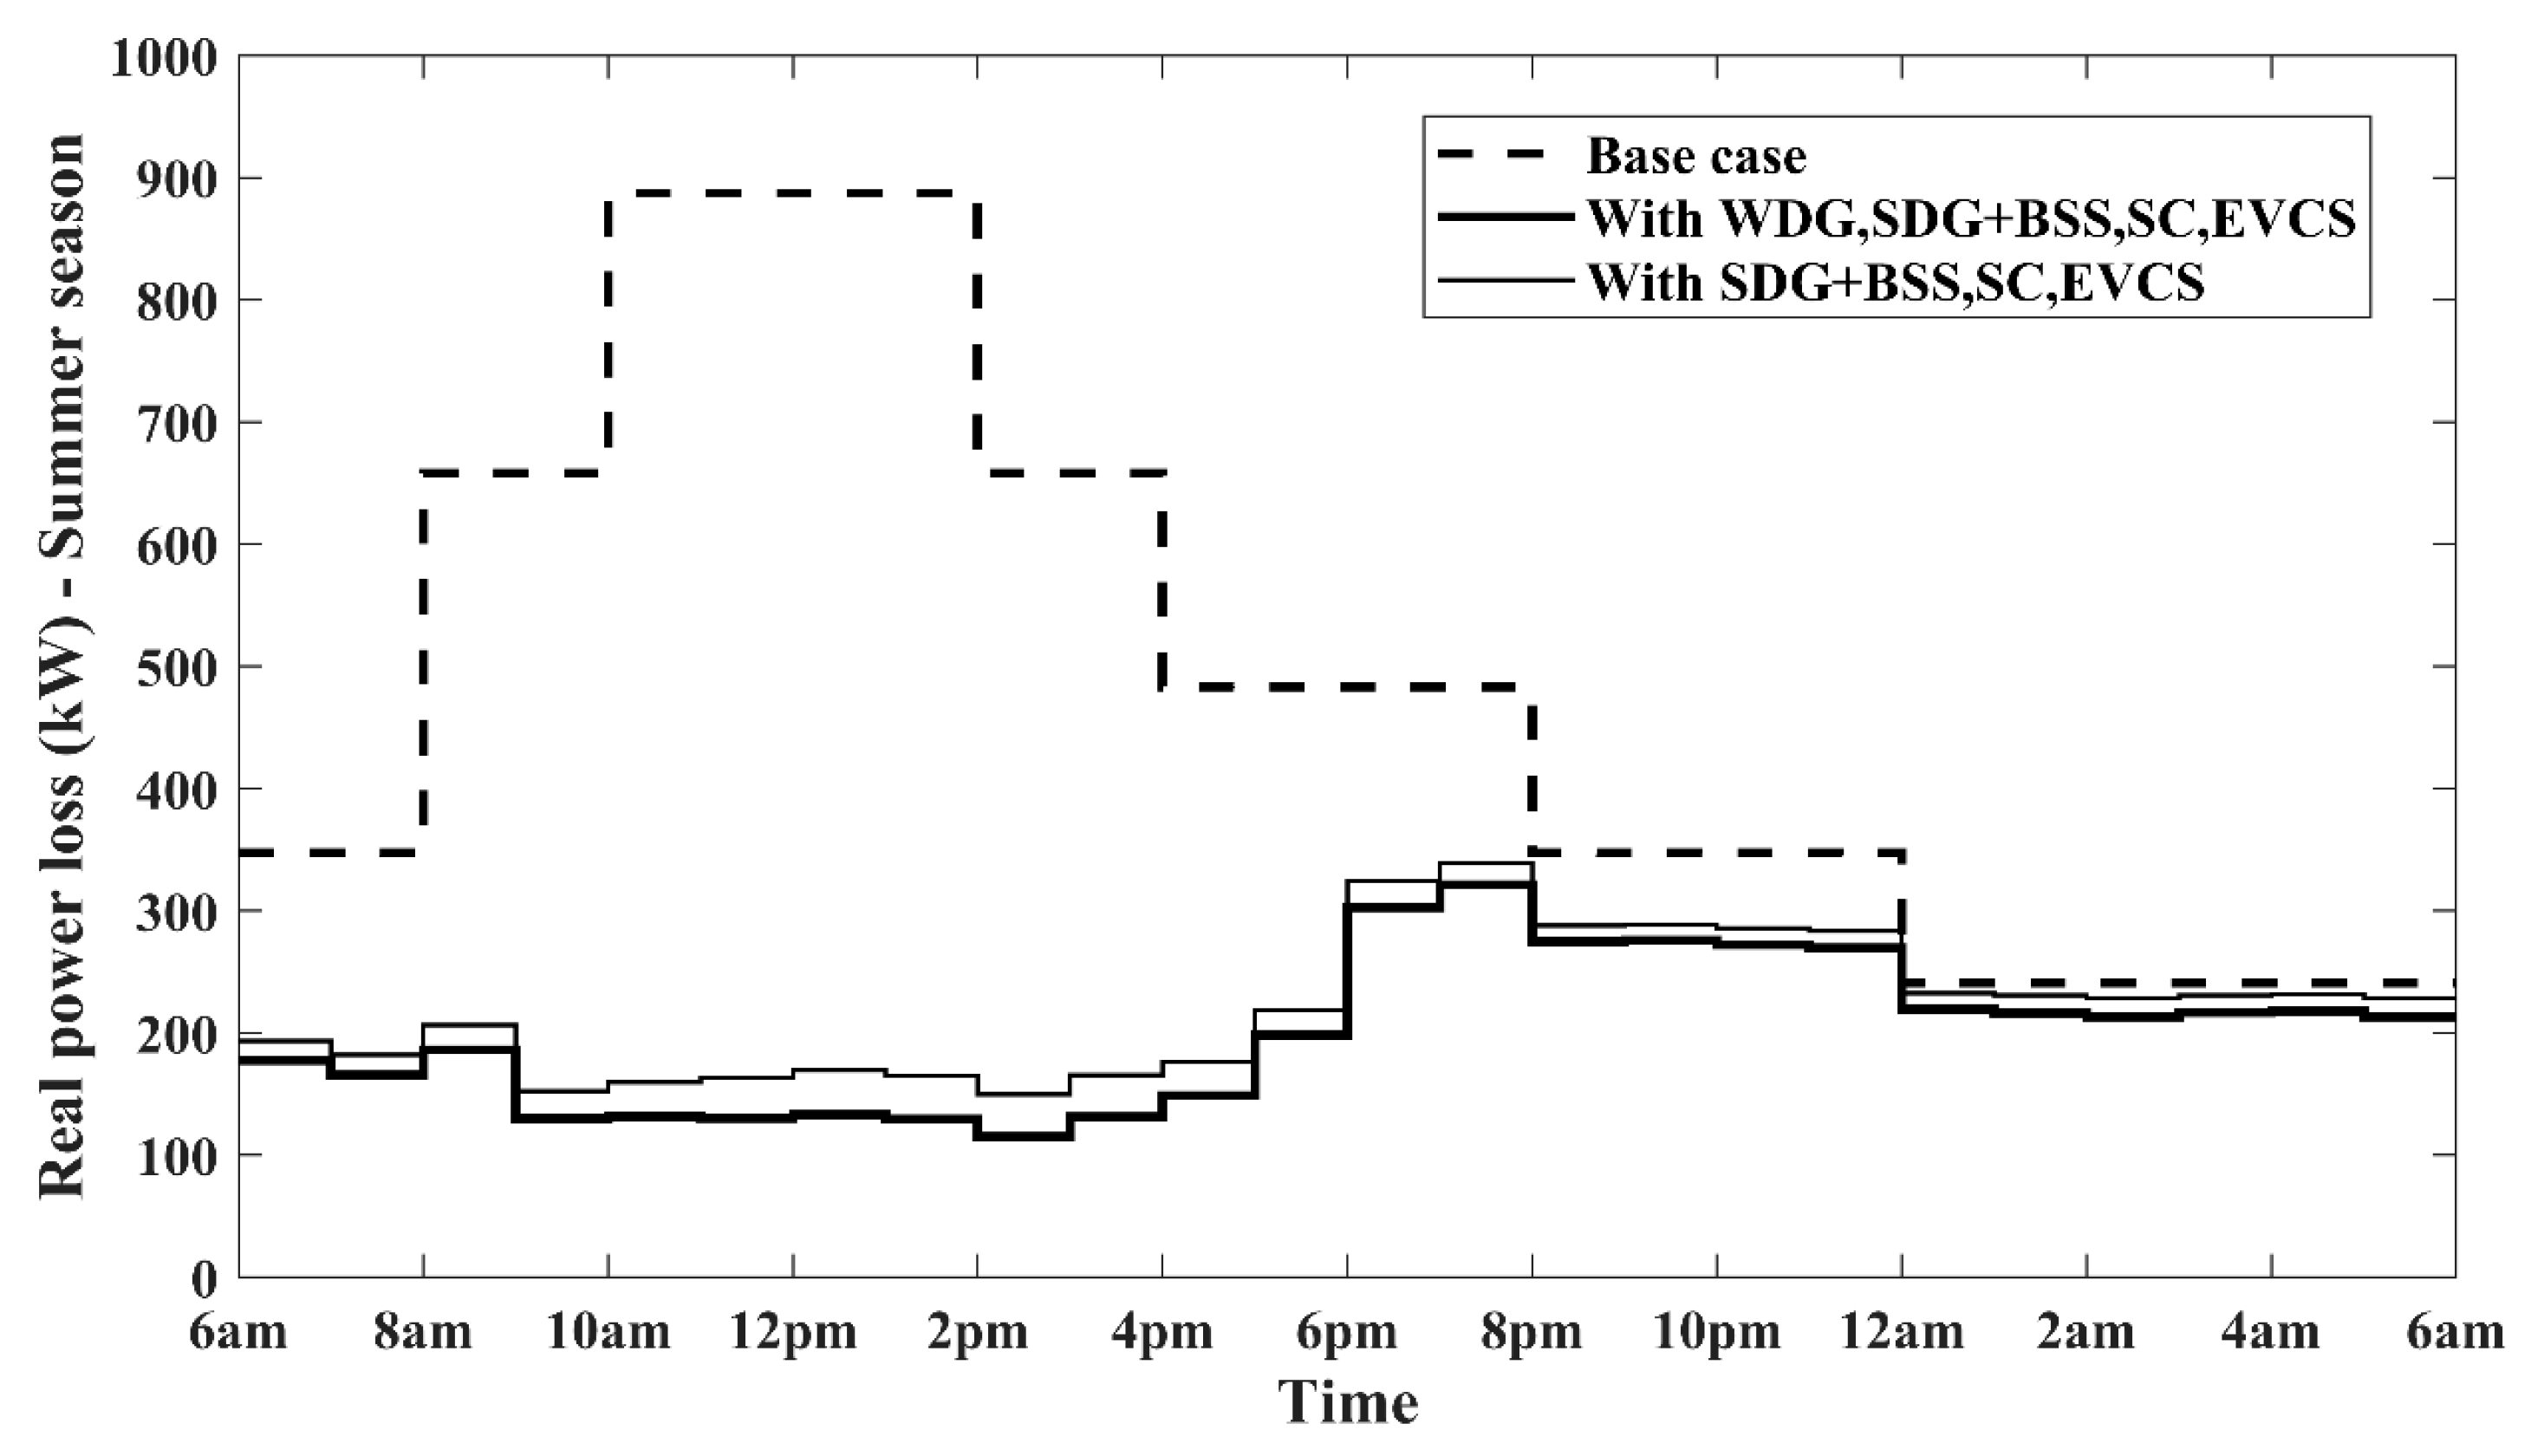
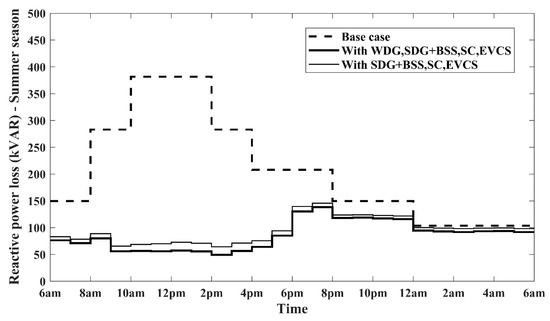
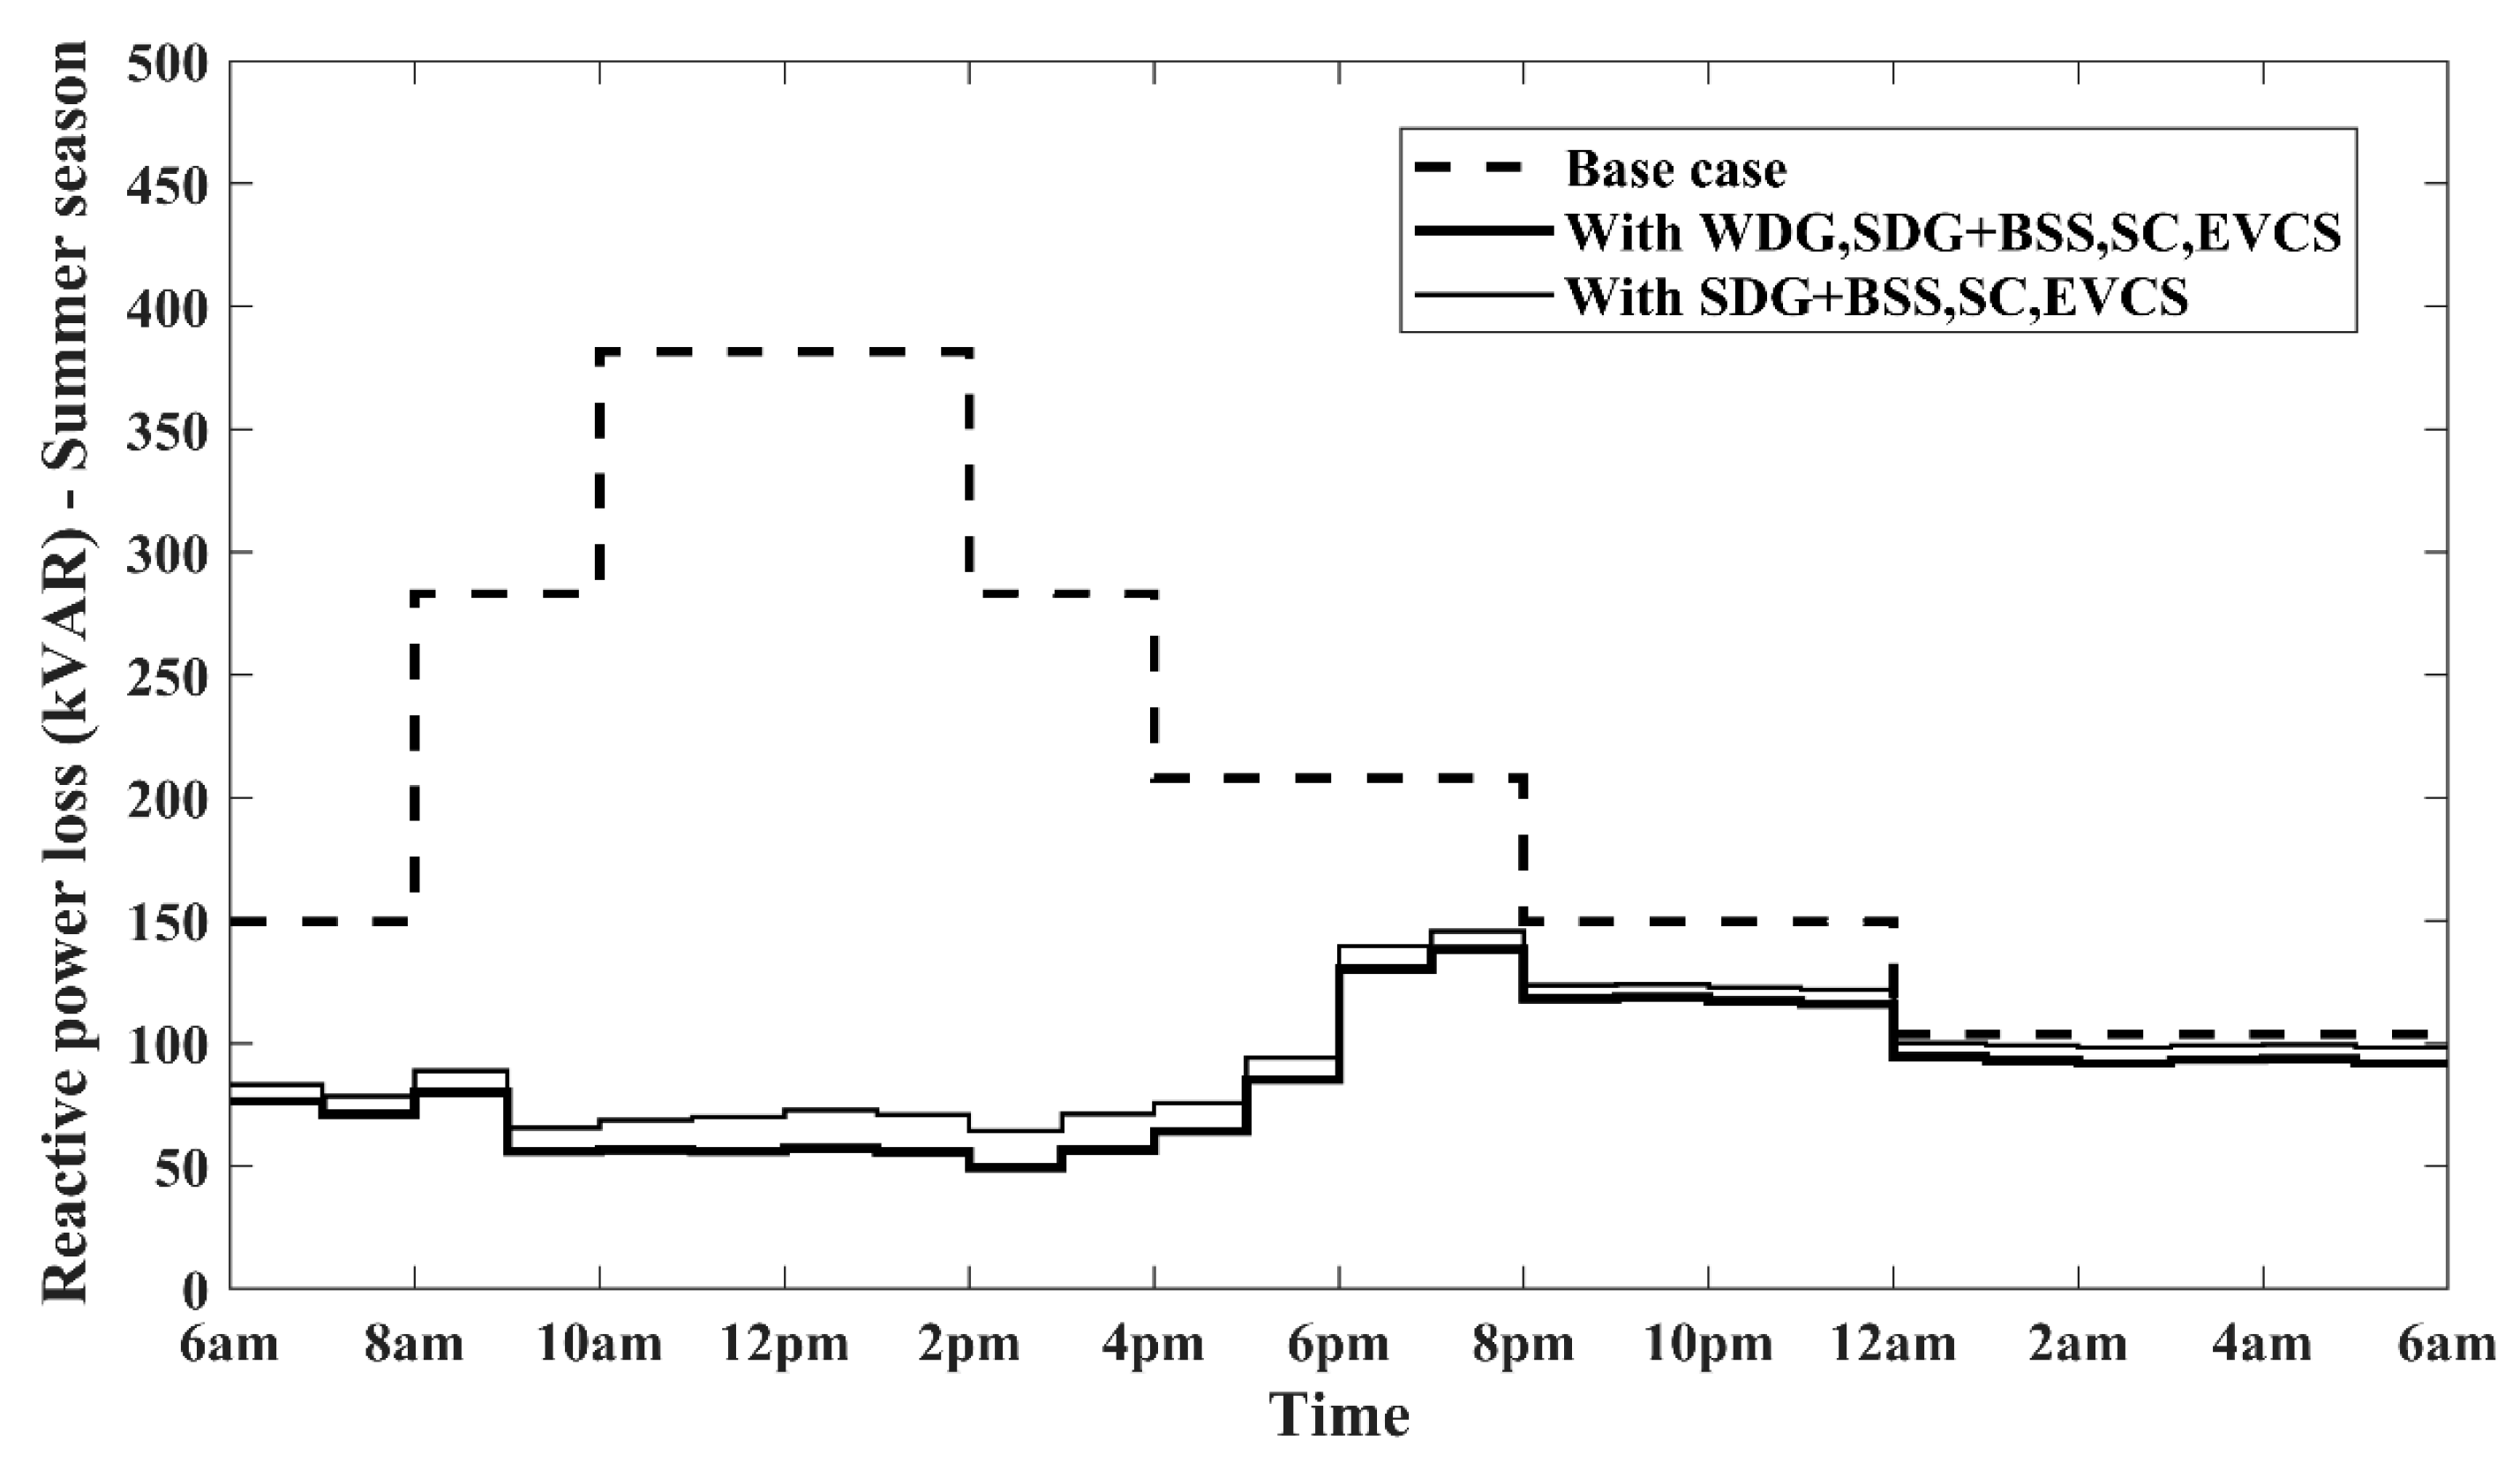
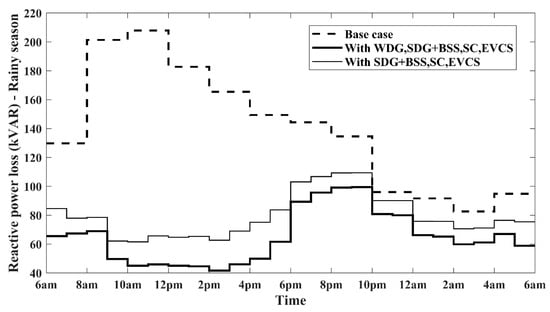
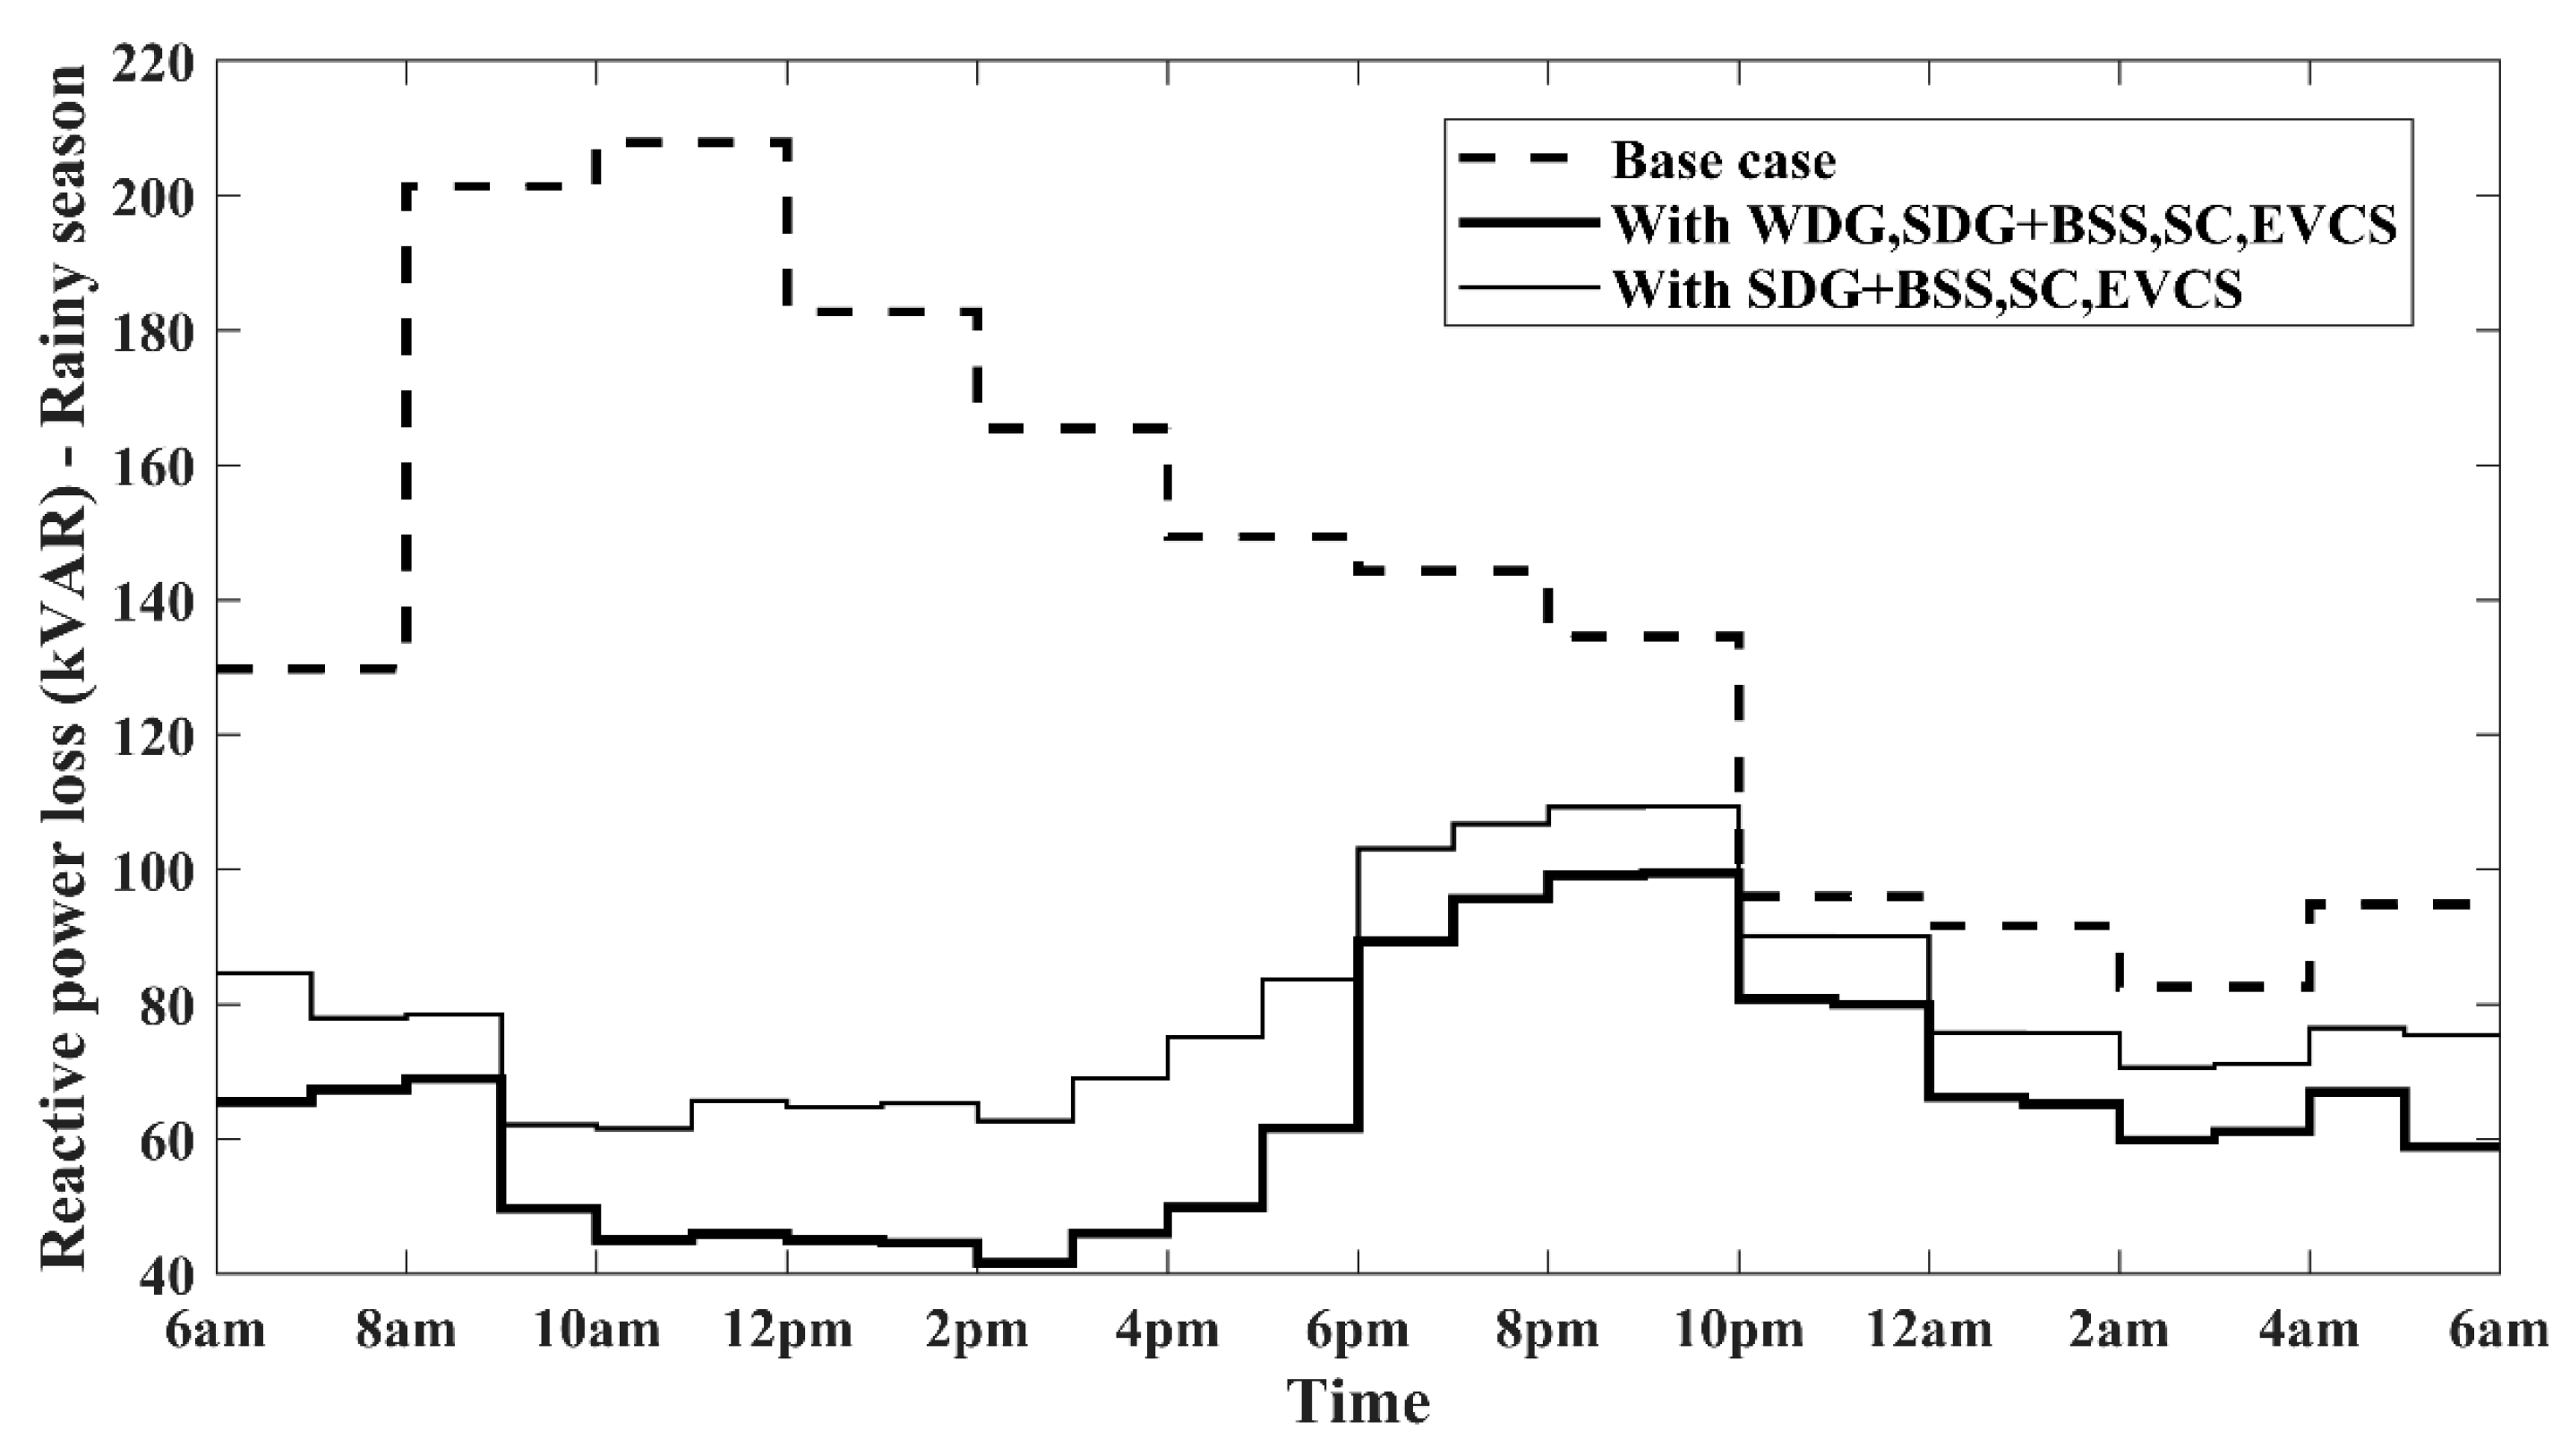
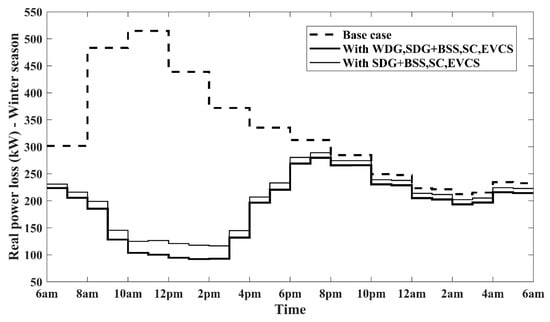
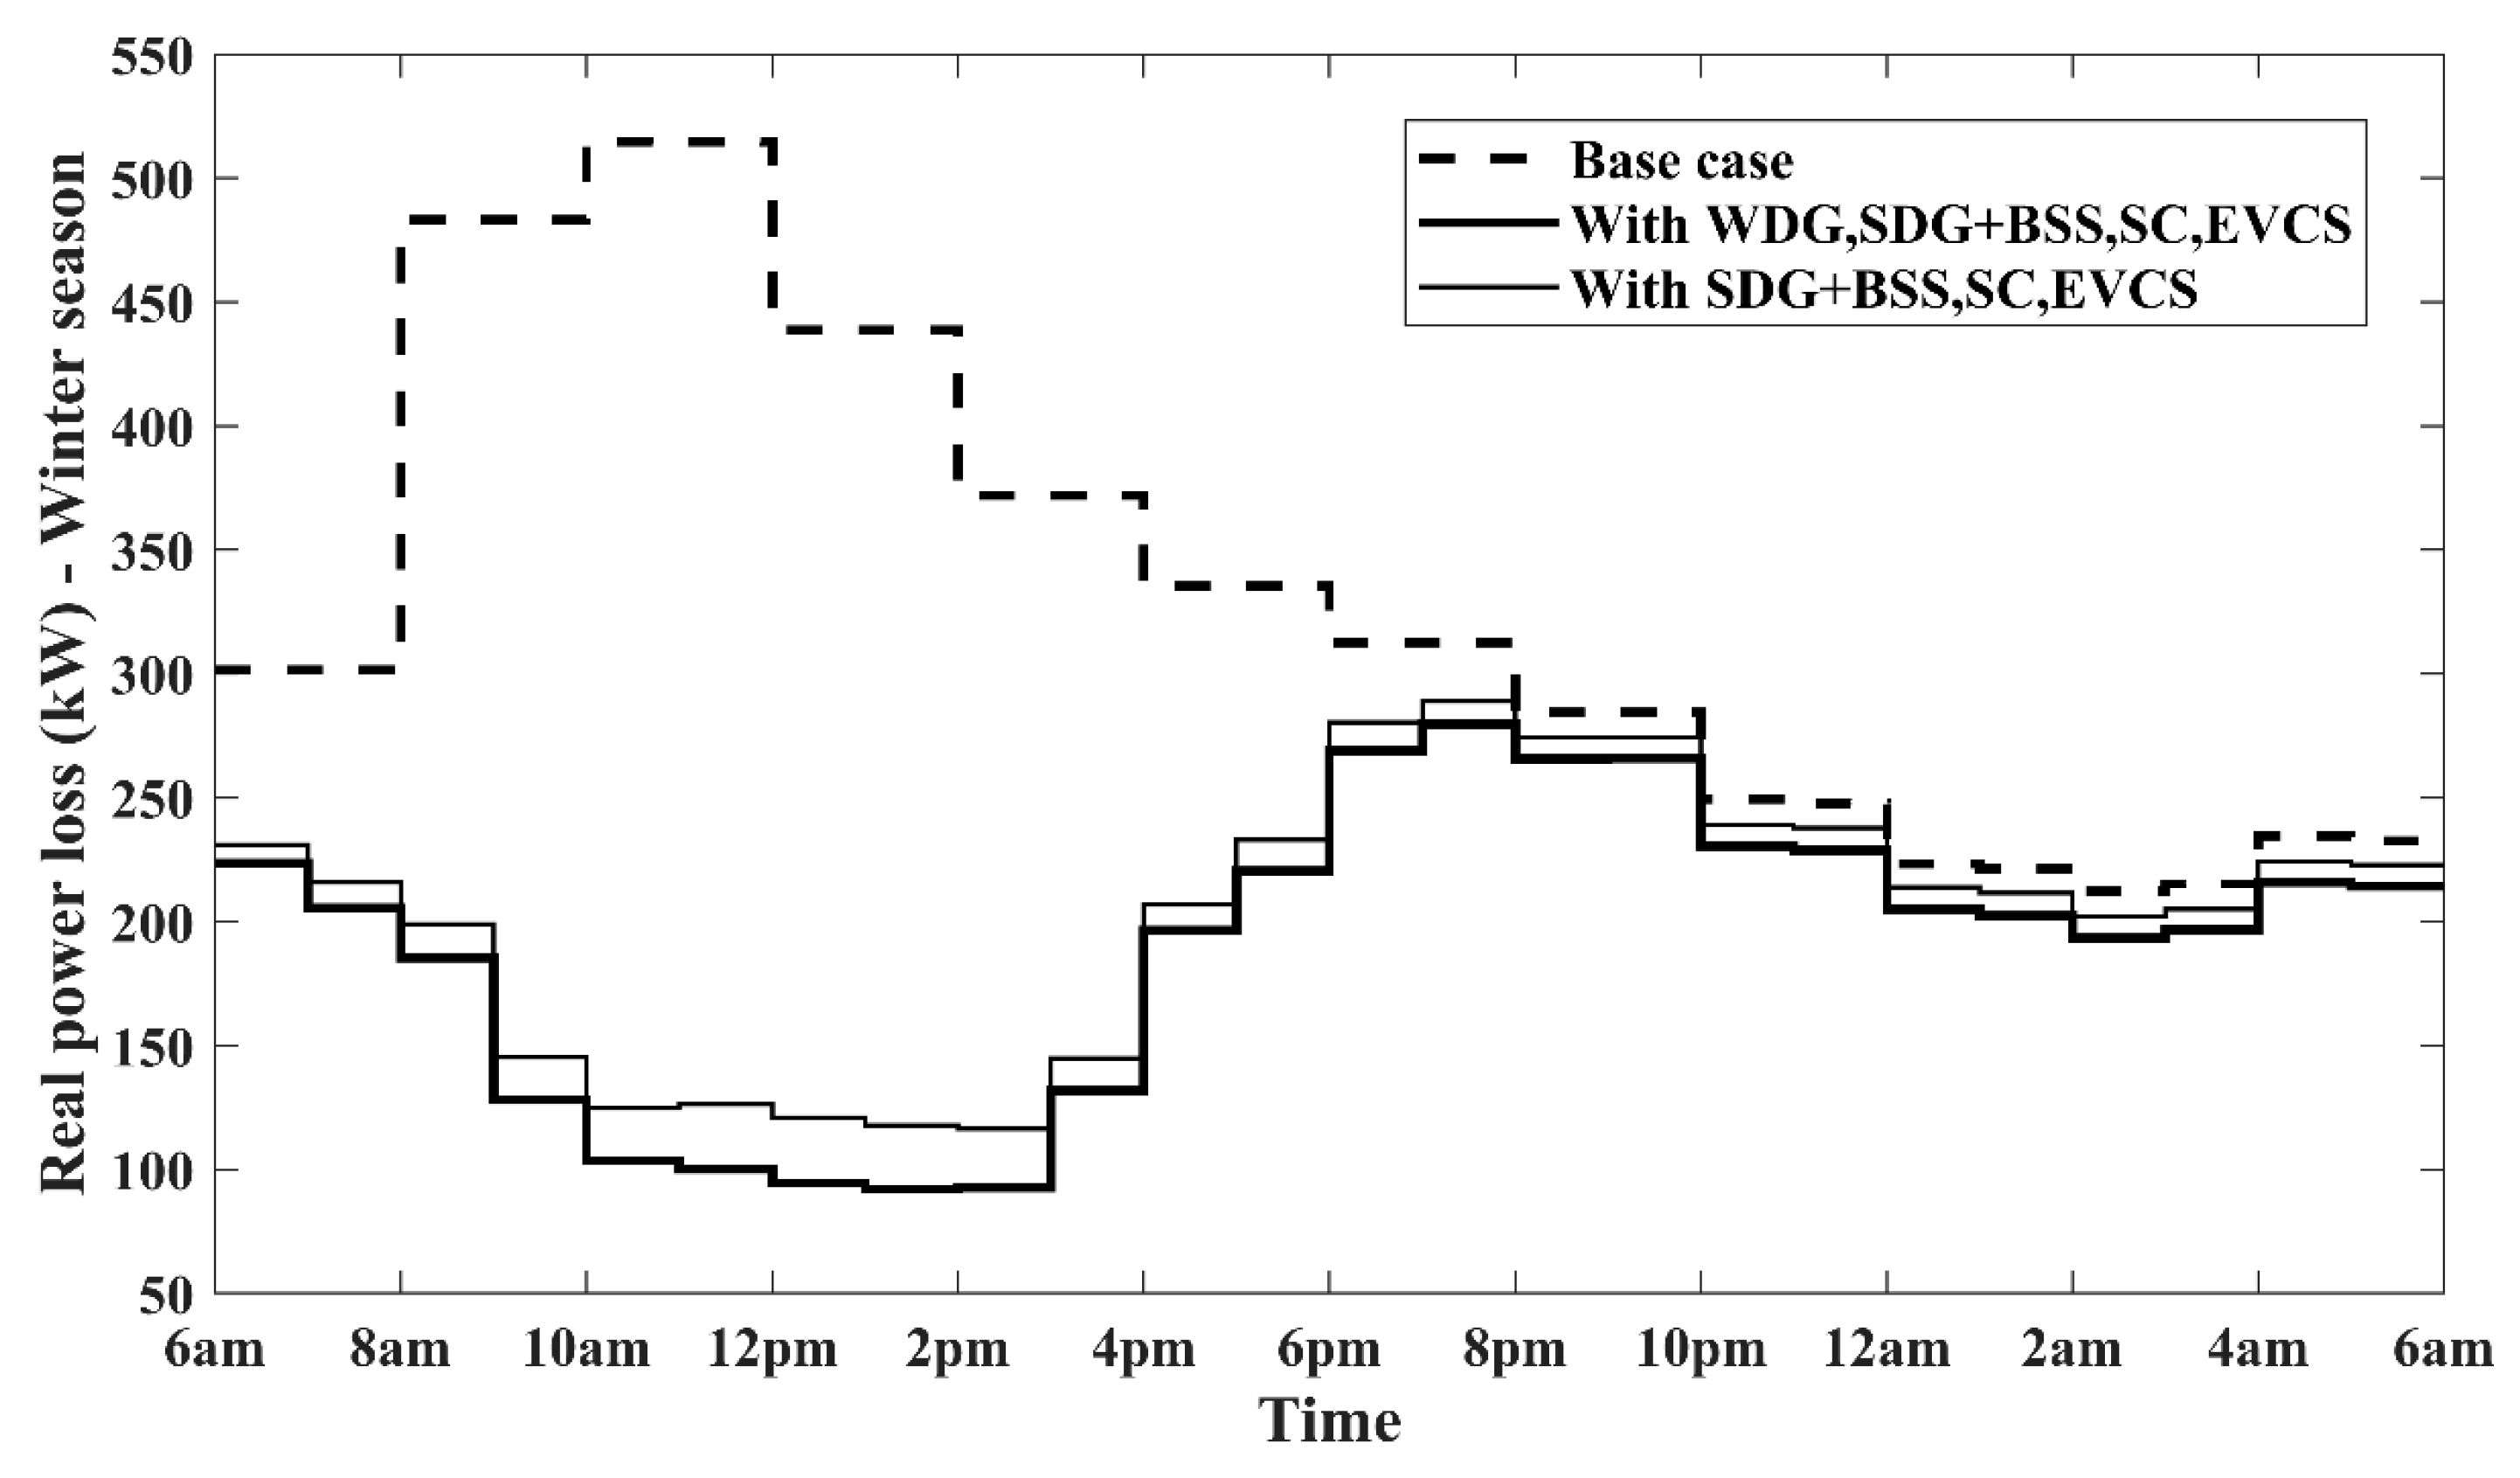
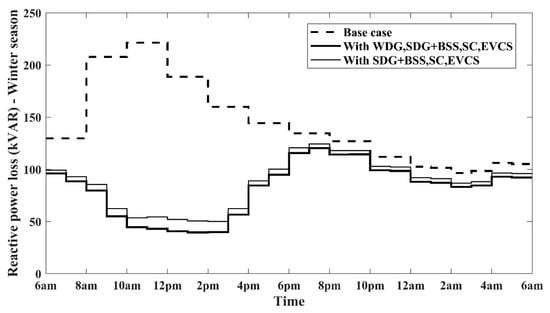
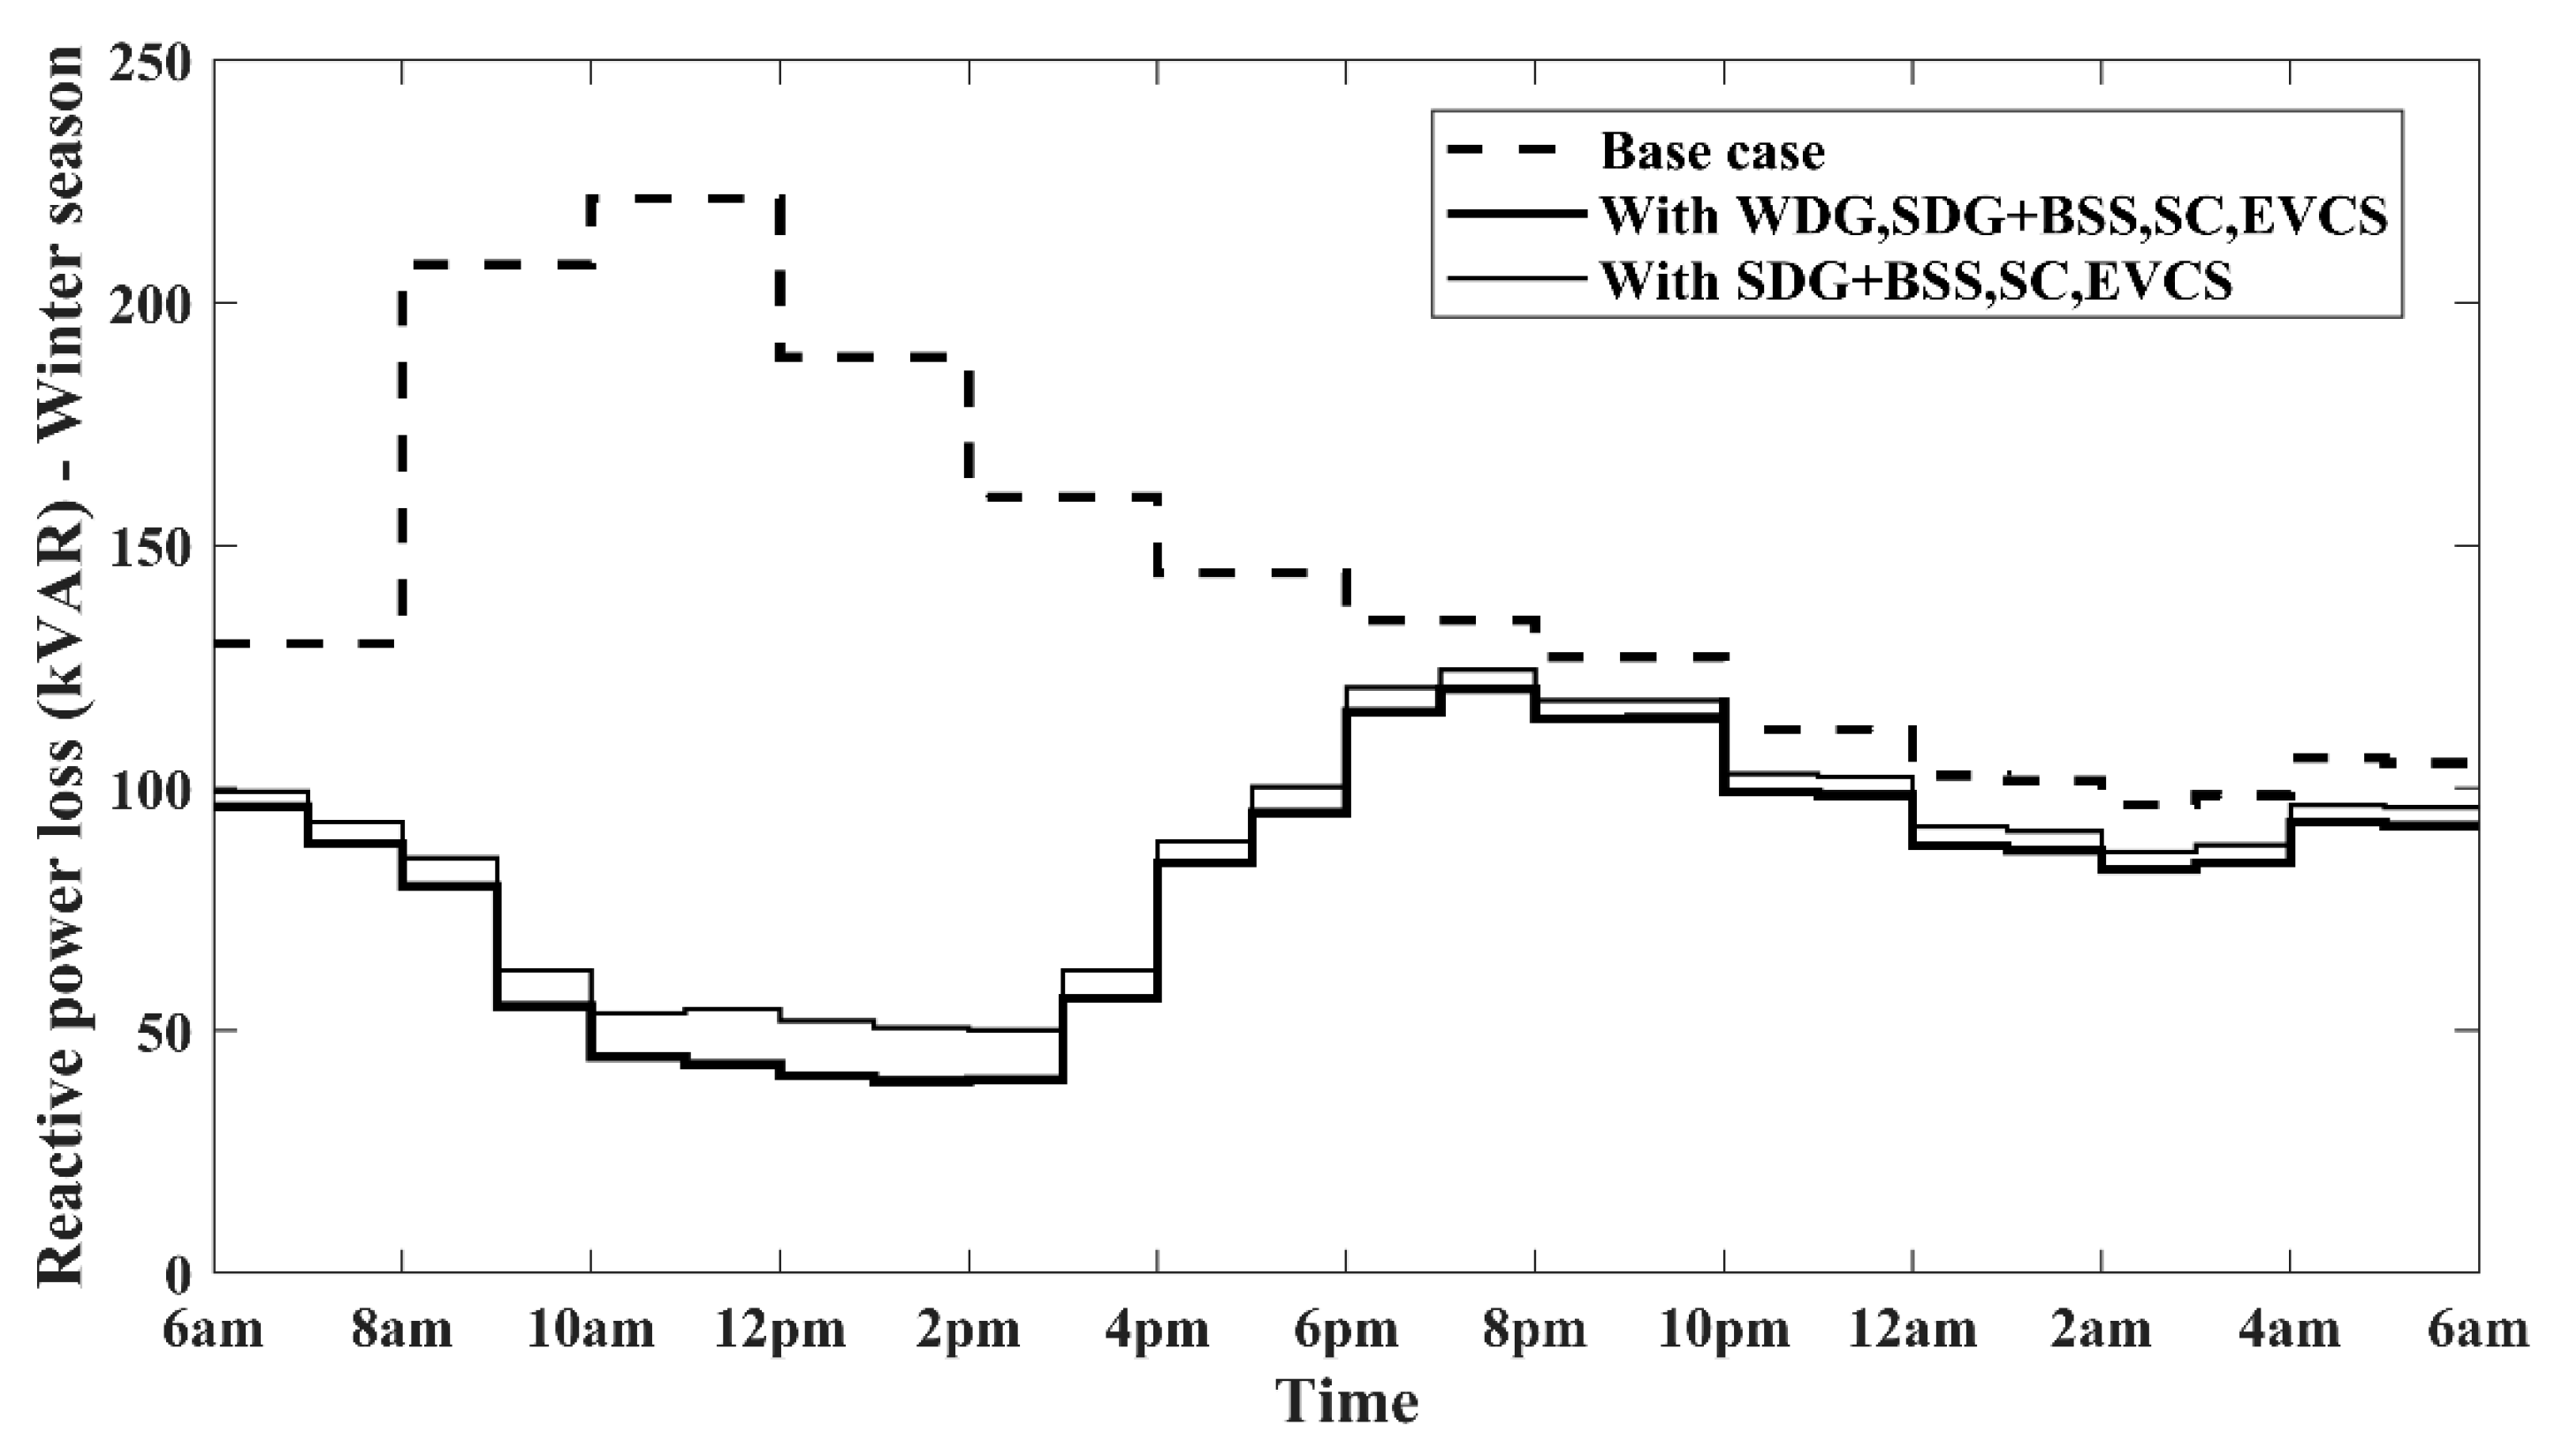
This section presents the seasonal reductions in real and reactive power losses over a 24 h period, as illustrated in Figure 8 and Figure 9 for summer, Figure 10 and Figure 11 for the rainy season, and Figure 12 and Figure 13 for winter. During the summer peak load interval (12–1 p.m.), Figure 8 shows that the real power loss decreases significantly—from 887.19 kW to 169.35 kW, and further to 133.01 kW—with the integration of wind DGs, representing reductions of approximately 81% and 85%, respectively. Similarly, Figure 9 indicates that the reactive power loss during the same period drops from 381.70 kVAr to 72.86 kVAr and then to 57.23 kVAr after adding wind DGs, corresponding to reductions of about 81% and 85%. These results highlight the substantial improvement in system efficiency achieved through the incorporation of wind DGs.
Figure 8.
Real power loss comparison during summer.
Figure 9.
Reactive power loss comparison during summer.
Figure 10.
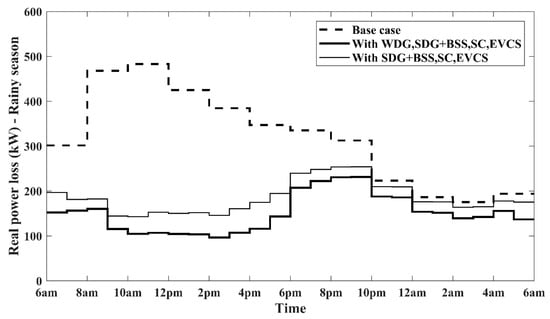
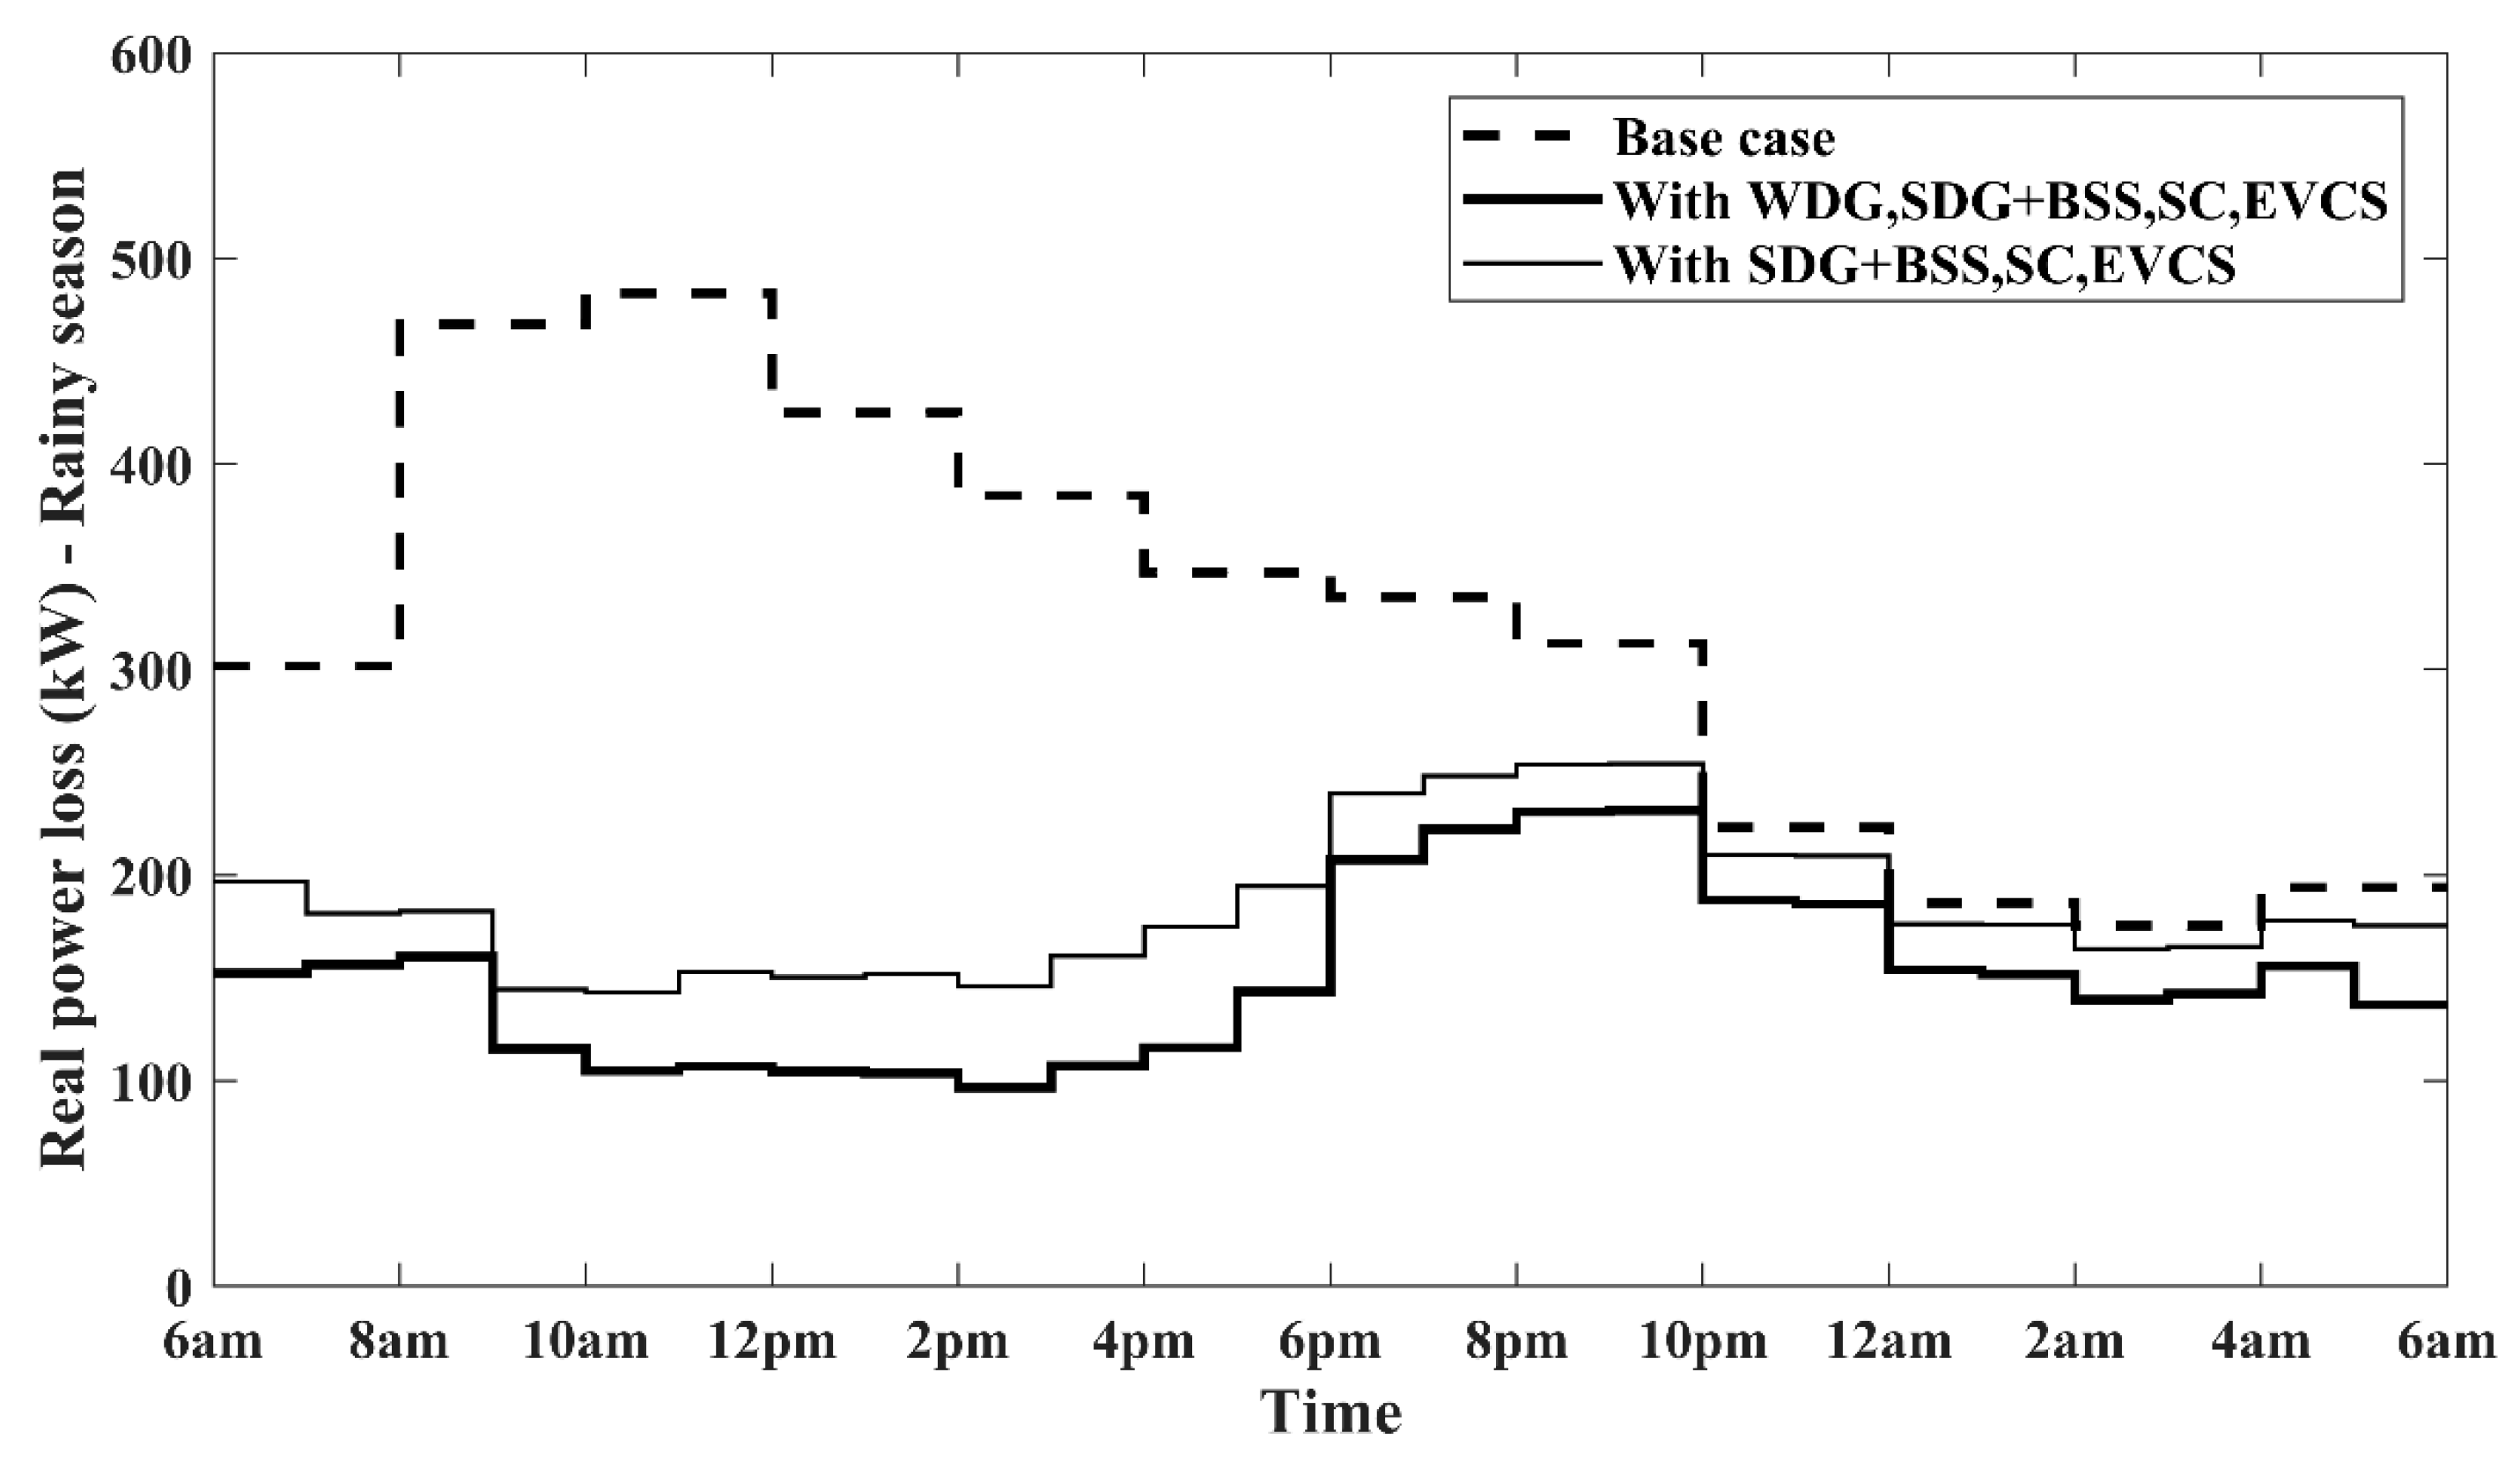
Real power loss comparison during rainy season.
Figure 11.
Reactive power loss comparison during rainy season.
Figure 12.
Real power loss comparison during winter.
Figure 13.
Reactive power loss comparison during winter.
Comparable reductions in power losses are also evident during the rainy and winter seasons, as illustrated in Figure 10, Figure 11, Figure 12 and Figure 13. These improvements are achieved through the proposed multi-objective optimization framework based on the GSA, which determines the optimal placement and sizing of wind DGs, solar DGs, SCs and EVCSs. By strategically allocating these resources, the approach significantly enhances the overall performance of the distribution network, delivering substantial loss reductions across all seasons.
9.6. Enhancement of Voltage Profile
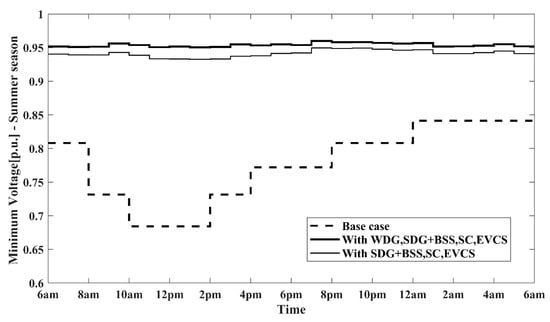
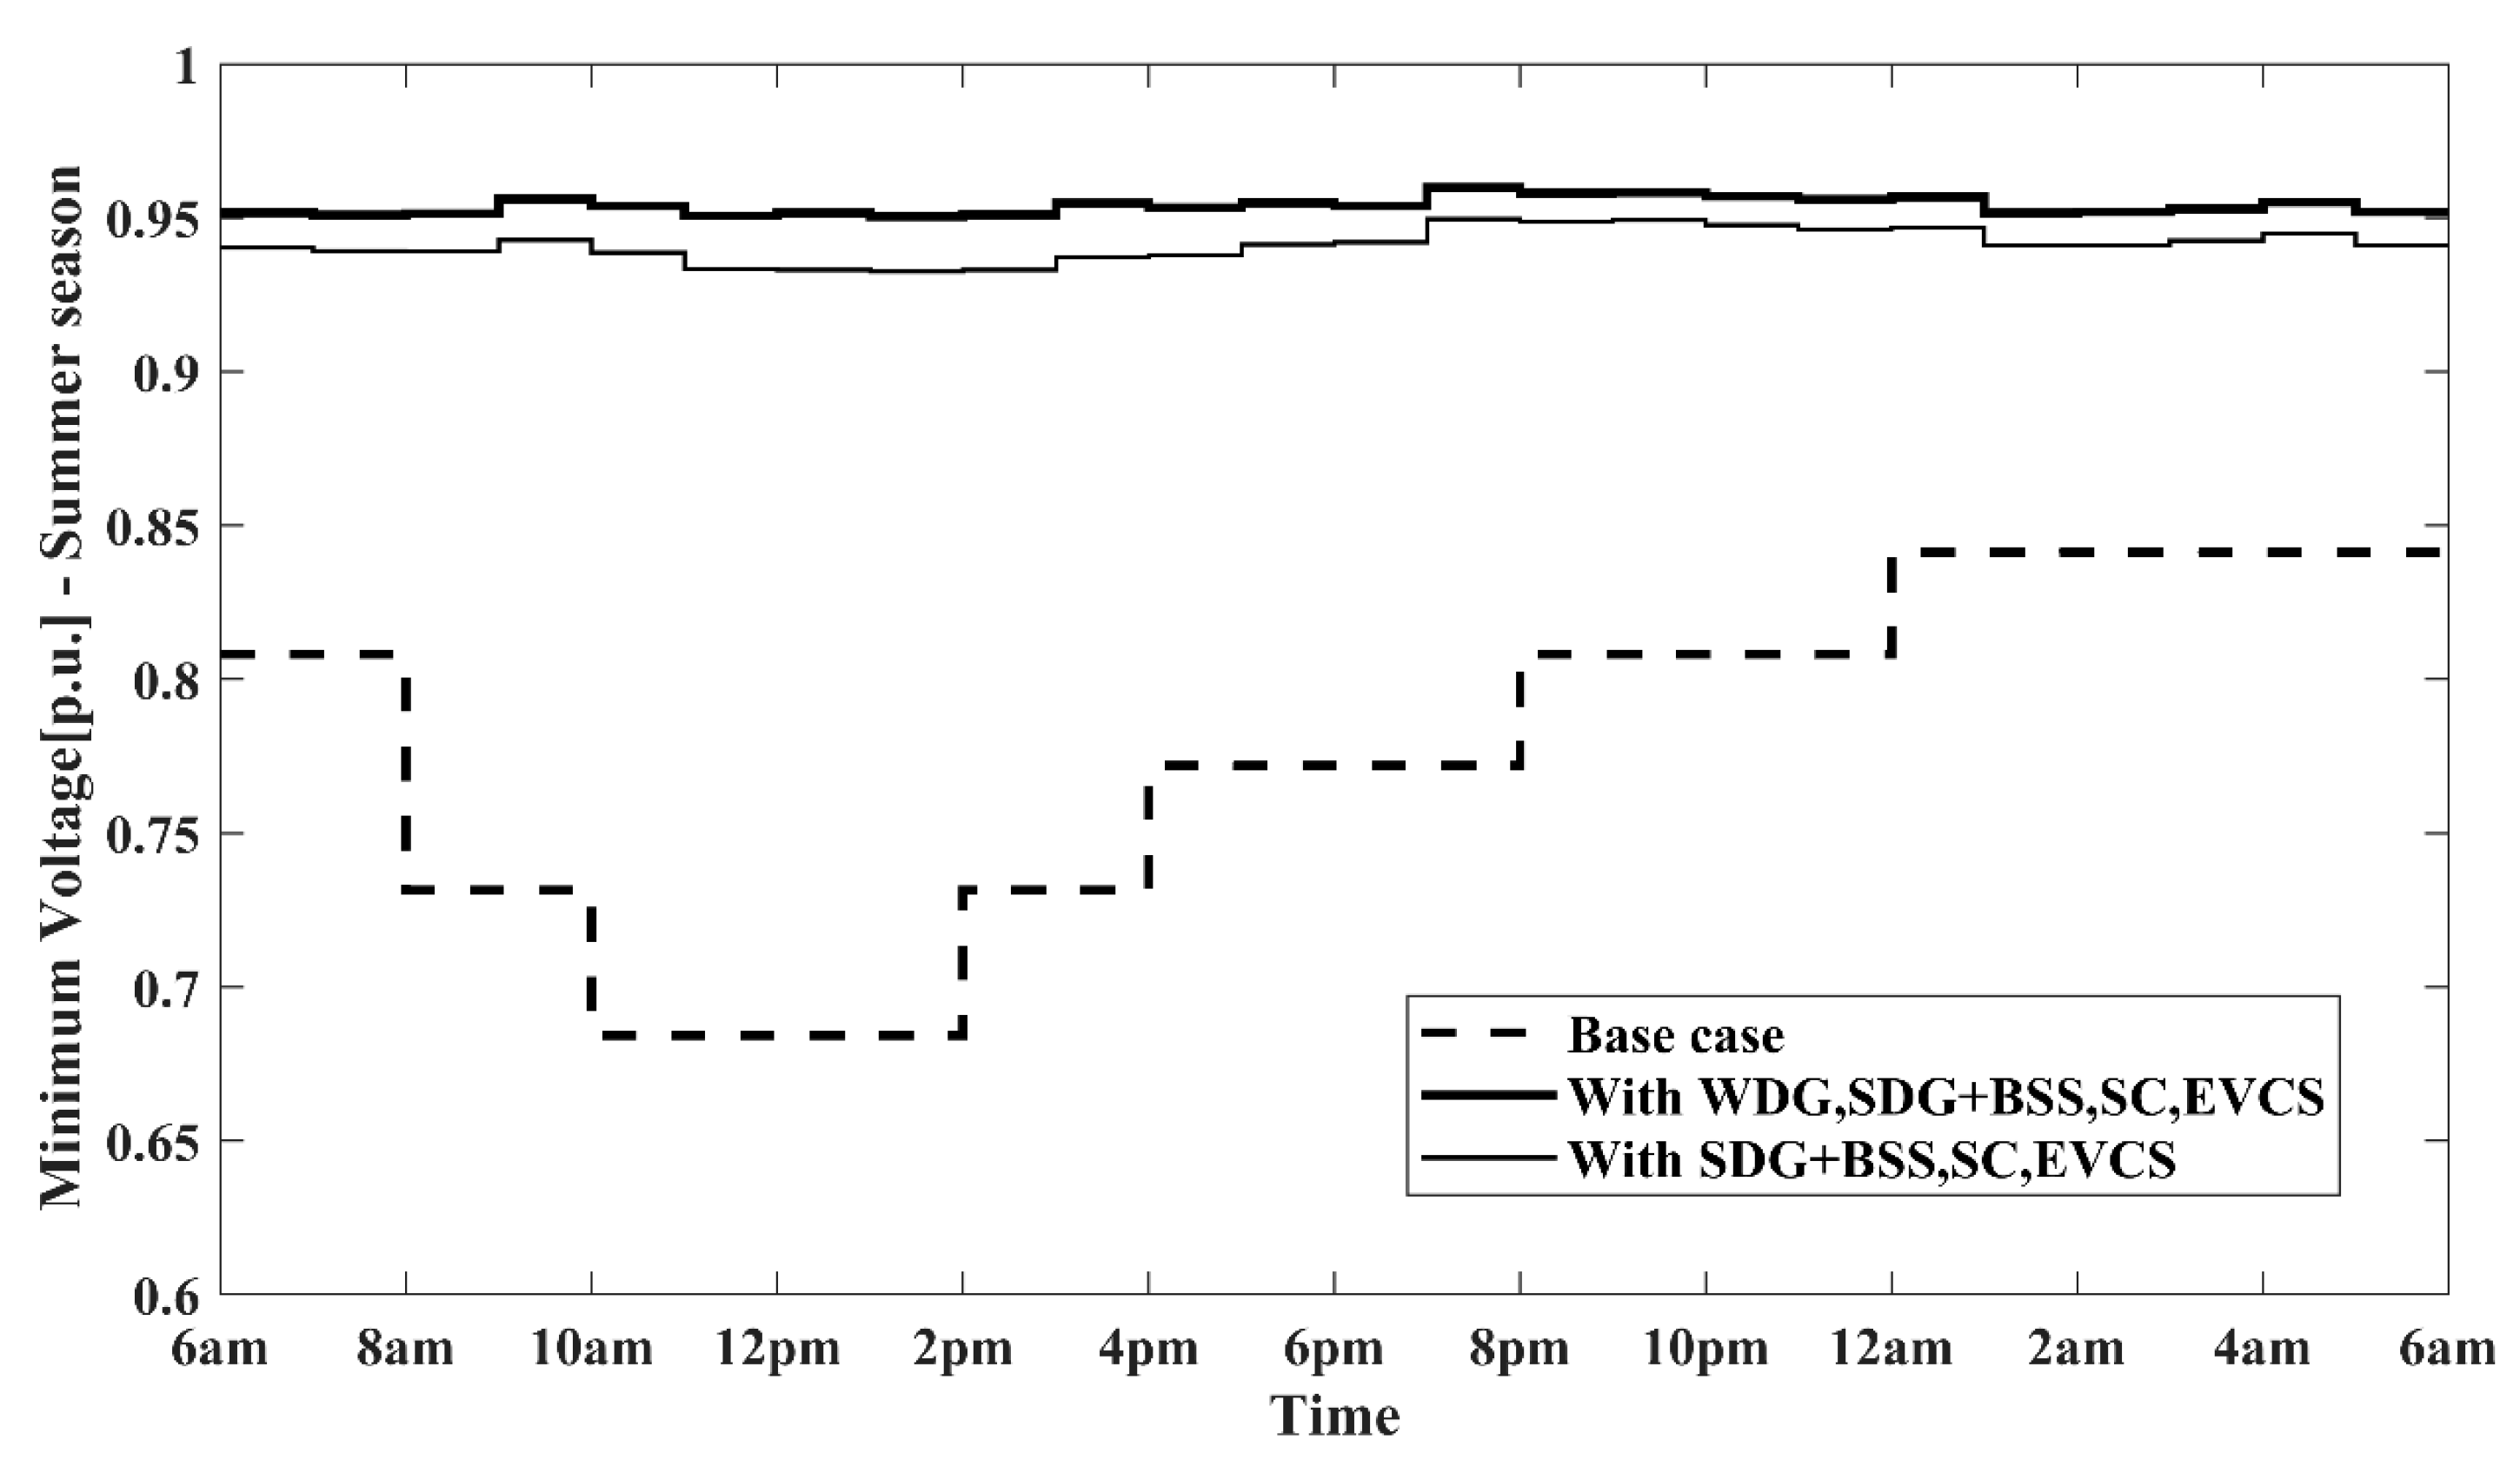
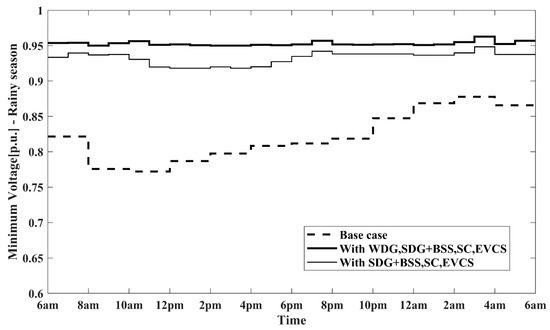
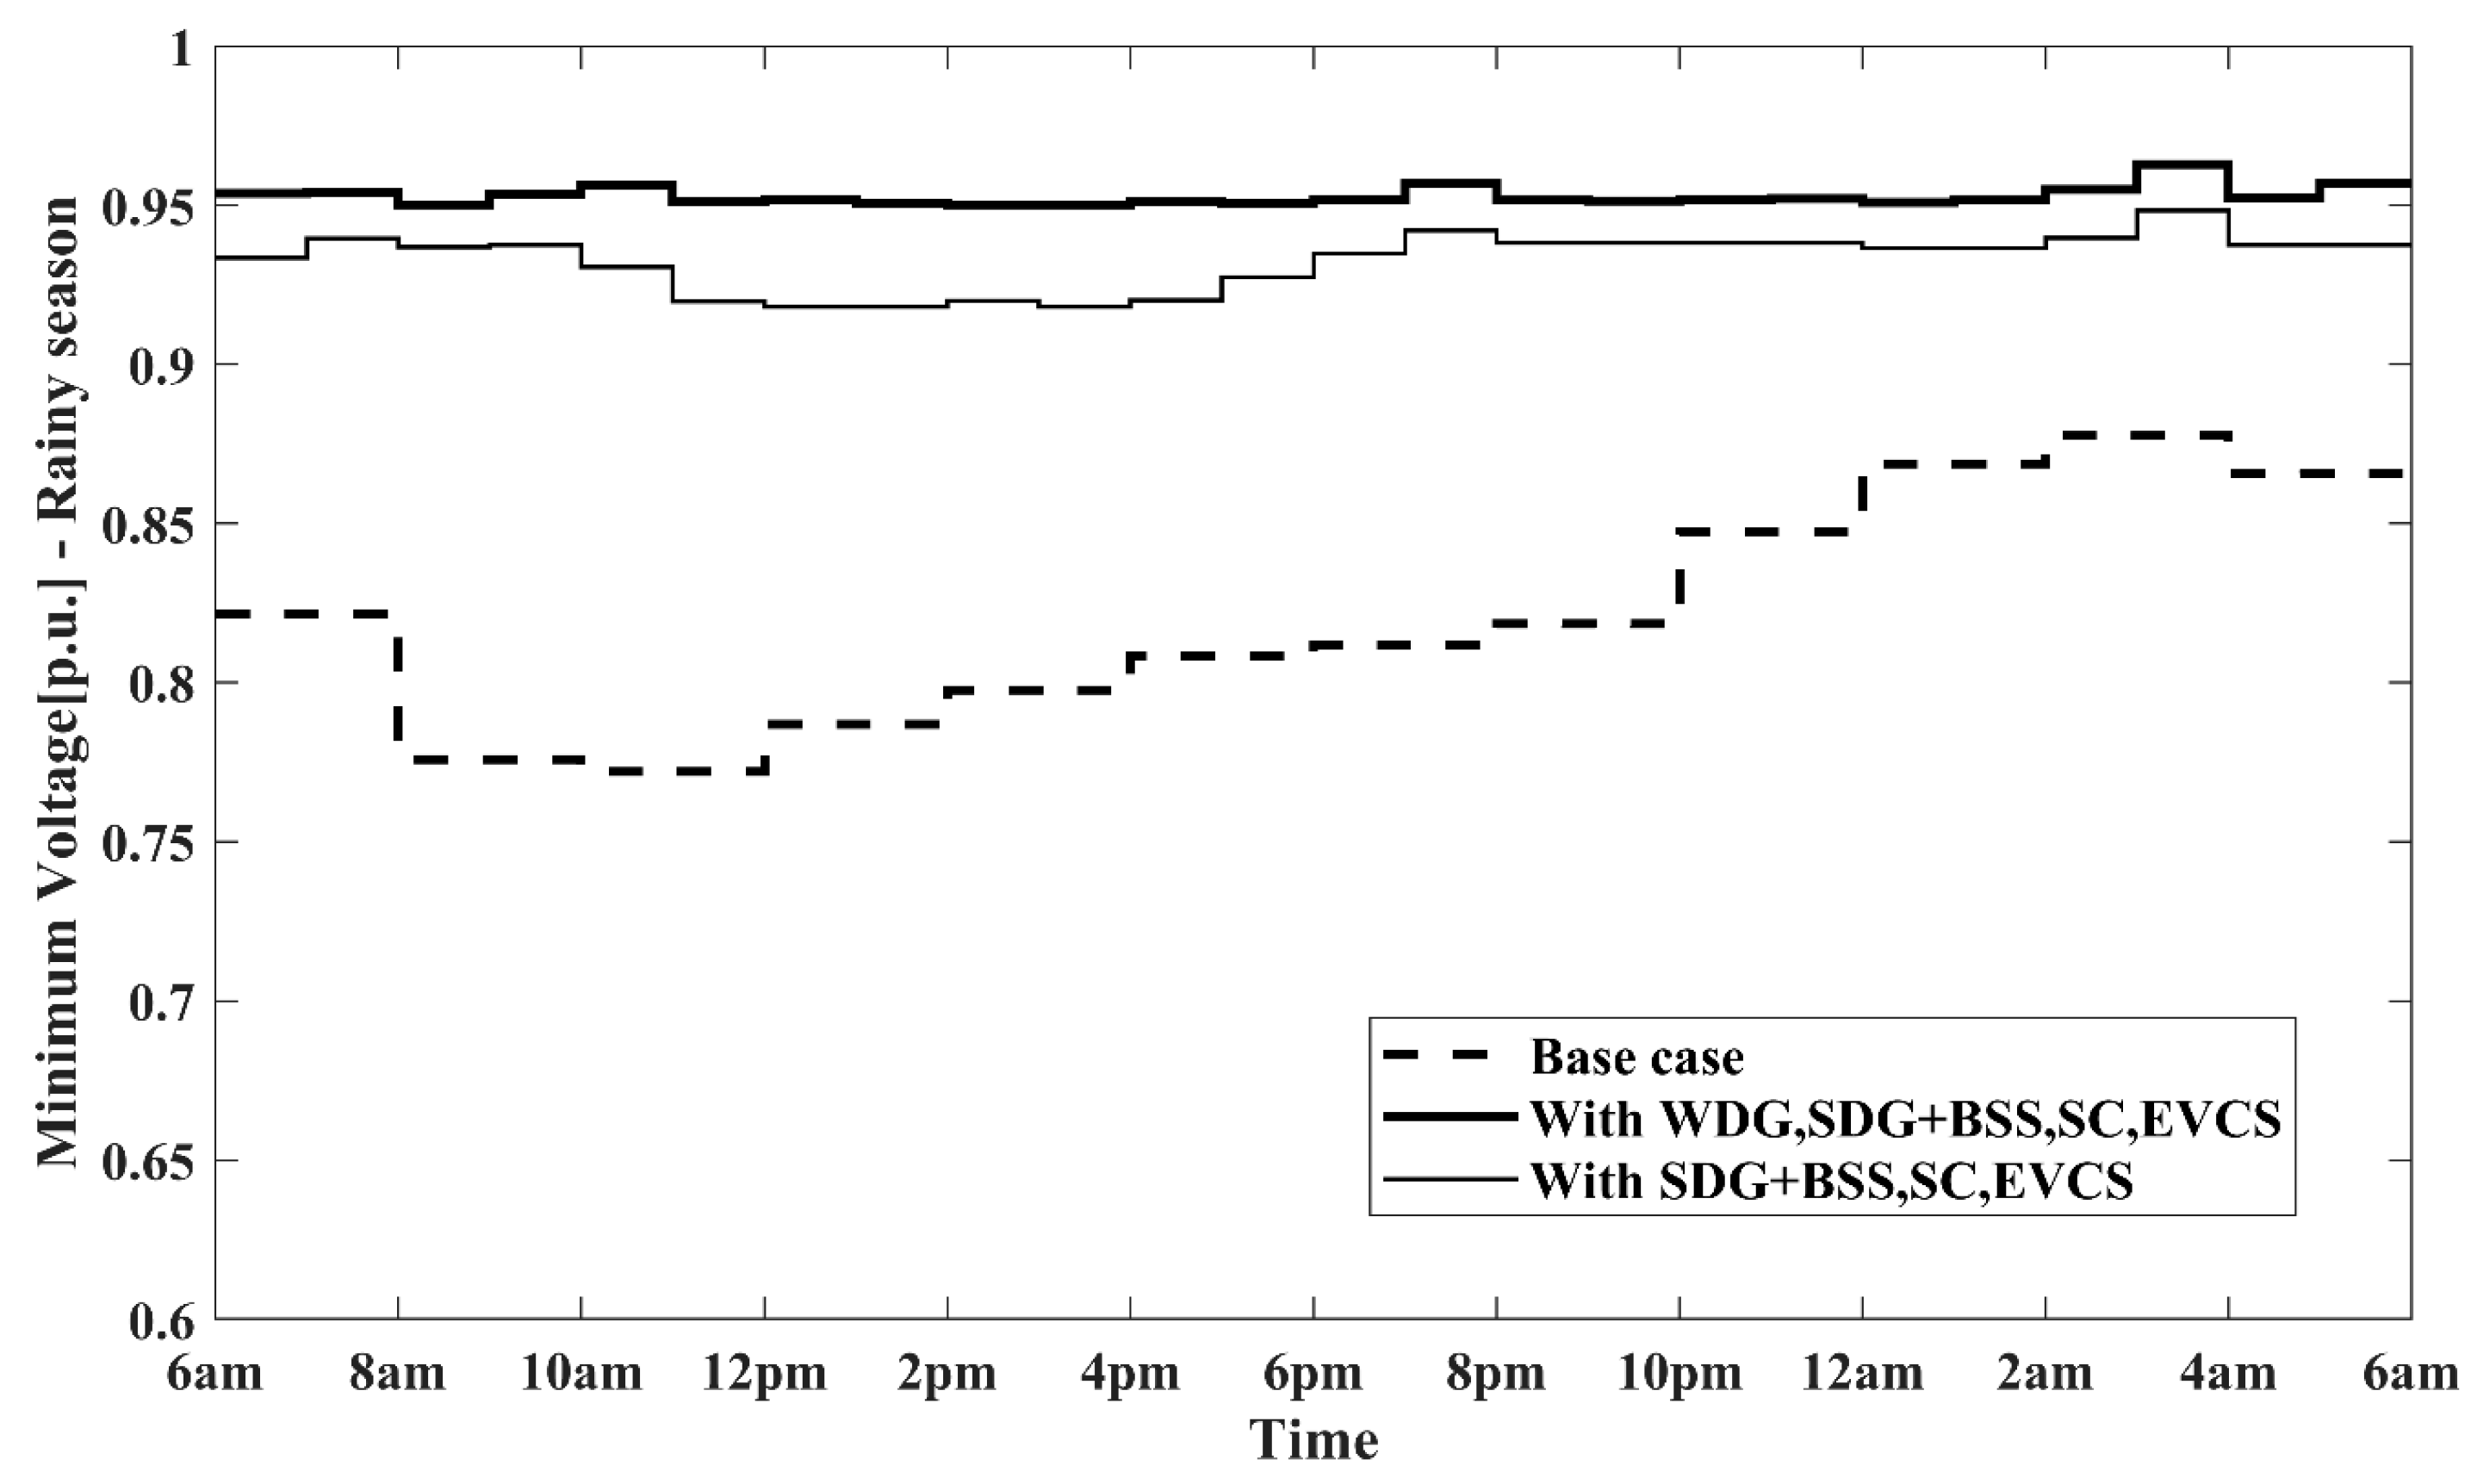
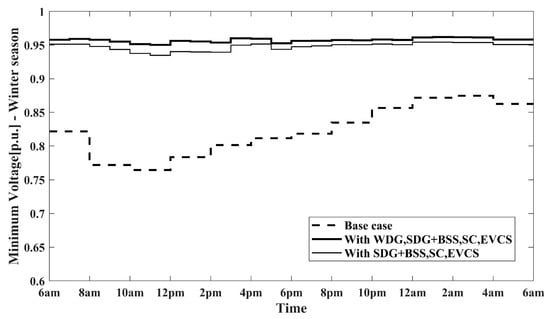
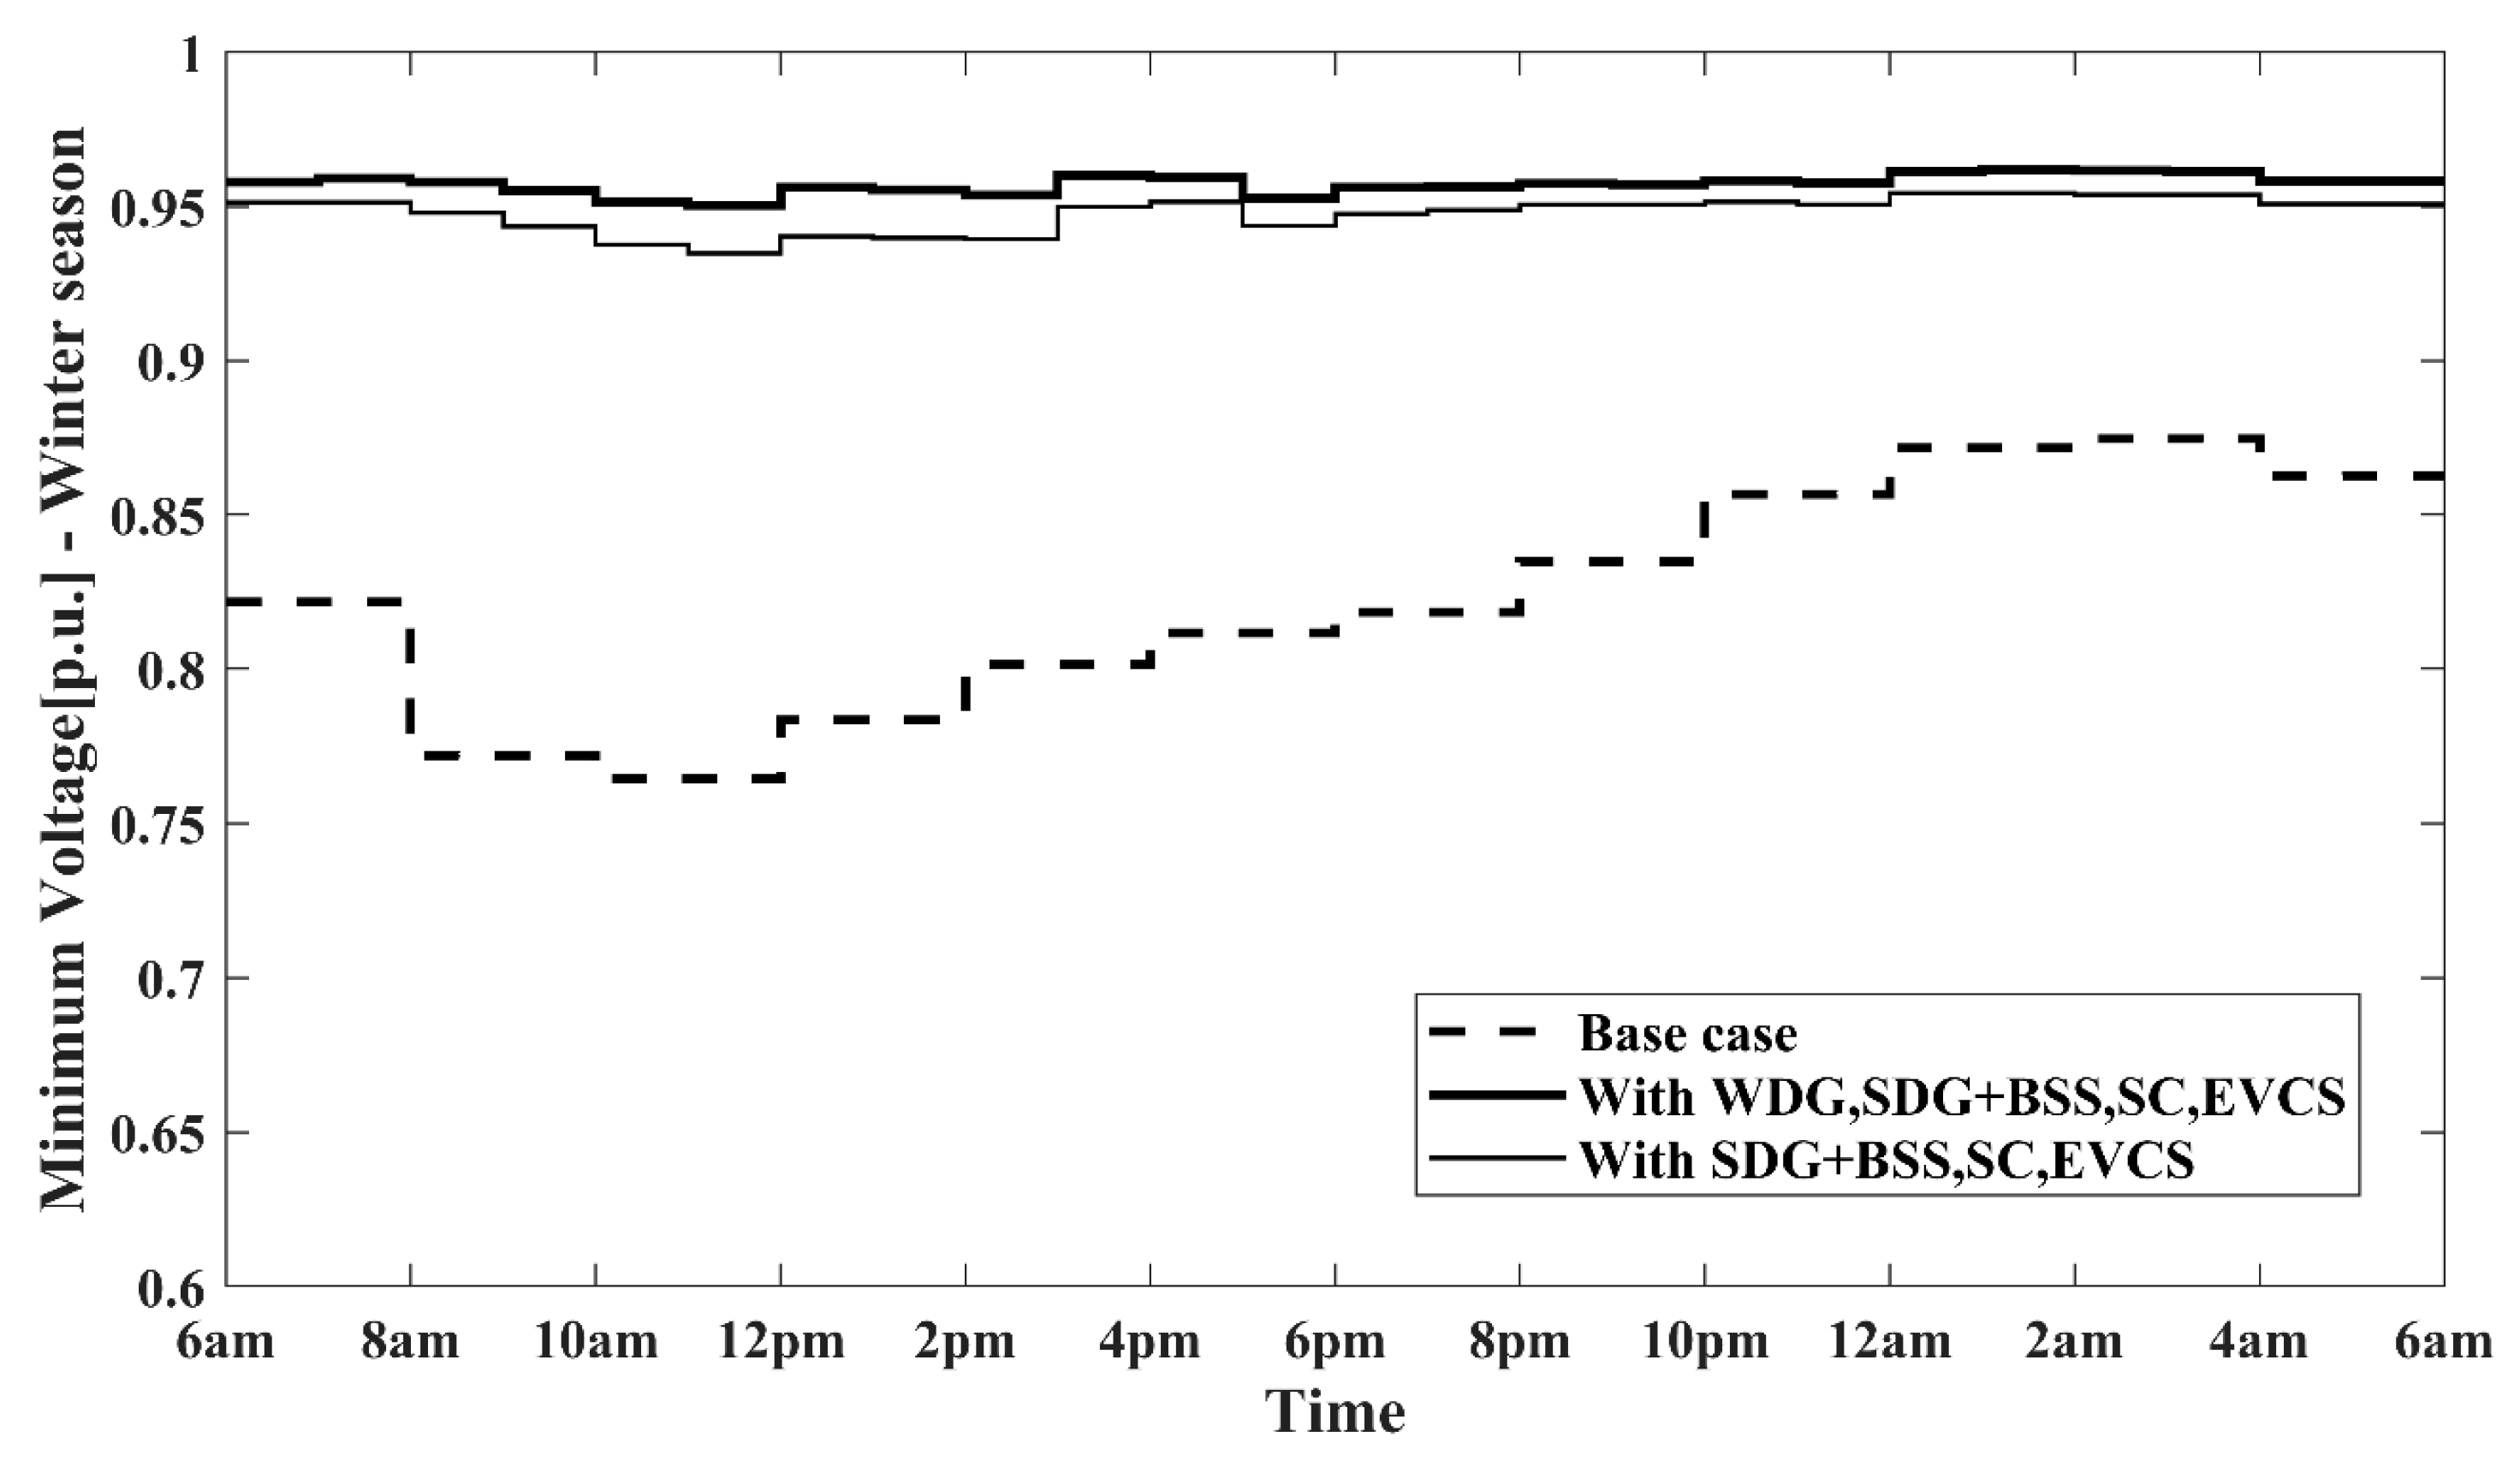
In addition to the substantial reductions in power losses, the voltage profiles also exhibit significant improvements across all three seasons throughout the 24 h period, as illustrated in Figure 14, Figure 15 and Figure 16.
Figure 14.
Minimum voltage profile comparison during summer.
Figure 15.
Minimum voltage profile comparison during rainy season.
Figure 16.
Minimum voltage profile comparison during winter.
During the summer peak period (12–1 p.m.), the minimum voltage in the existing network was approximately 0.6844 p.u., which improved to 0.9515 p.u. after optimization—or 0.9330 p.u. when wind DGs were excluded (Figure 12). Similarly, for the rainy season, the minimum voltage increased from 0.7869 p.u. to 0.9517 p.u. (0.9182 p.u. without wind DGs), and during winter it improved from 0.7833 p.u. to 0.9562 p.u. (0.9403 p.u. without wind DGs), all measured during the same peak interval of 12–1 p.m. These results indicate that maintaining a minimum network voltage above 0.95 p.u. across all seasons is not achievable without the integration of wind DGs.
10. Comparative Analysis with Existing Literature
A comparative analysis of the proposed methodology against approaches reported in the existing literature is presented in Table 1, with the corresponding results summarized in Table 18.
Table 18.
Literature analysis with comparison results.
The comparison is based on the summer peak scenario, which represents conditions of maximum solar insolation and peak system loading. From Table 18, it is obvious that the methodology introduced in this study outperforms conventional techniques that incorporate rooftop solar DGs, wind DGs, battery storage, and SCs while feeding existing loads and new EVCSs. The proposed approach delivers substantial improvements in distribution system performance, particularly in reducing power losses and enhancing minimum voltage levels, while simultaneously enabling the network to achieve self-sufficiency through internal power generation from renewable energy sources.
11. Comparative Analysis Across Three Stages of Optimization
The outcomes of the three stages in the multi-stage optimization process are summarized in Table 19, focusing on summer mornings (6–7 a.m.) for comparison. Stage 1 identifies the optimal placement of solar DGs, wind DGs and SCs to achieve multiple objectives: minimizing real and reactive power losses, enhancing voltage profiles and minimizing the load on the source substation to near zero.
Table 19.
Comparison among three stages.
In Stage 2, case studies are conducted using the same DG and SC allocations from Stage 1. Among these, Case 3 indicates that the network can provisionally support EVCSs rated up to 40 kW. In contrast, Case 1 and Case 2 reveal under-voltage issues, with minimum voltages dropping to 0.8149 p.u. and 0.9246 p.u., respectively.
Finally, Stage 3 introduces an upgraded allocation of solar DGs, wind DGs and SCs to counteract the impact of EVCS integration as proposed in Stage 2, Case 1, while still meeting the original multi-objective optimization criteria. The initial rows of Table 5 and Table 7 present the final allocation corresponding to Stage 3 in Table 19.
12. Conclusions
This study develops and analyses a three-stage multi-objective optimization framework using the GSA for a loss-prone distribution network operating under a weak grid supply. The seasonal simulation results demonstrate that the proposed approach significantly enhances network performance by reducing real and reactive power losses, improving voltage profiles, and ensuring an optimal power quality. The methodology also maximizes internal renewable energy utilization through optimal fixed configurations of solar DGs with battery storage, wind DGs, and SCs, enabling the system to meet both its internal load demand and the additional demand from strategically located EVCSs. This fulfills all five objectives defined in the optimization process. In the first stage, solar DGs with battery storage, wind DGs, and SCs are optimally placed to upgrade the network and achieve the targeted objectives. During peak daytime hours, high insolation ensures maximum solar generation, maintaining load balance. Conversely, during nighttime, early morning, and evening periods, when insolation is low, battery storage and wind DGs compensate for the shortfall. The simulations incorporate hourly variations in insolation, wind speed, and load across all seasons to validate convergence under consistent optimal installations. Hourly solar insolation is computed using the modified ASHRAE model for accurate solar generation estimation. The second stage determines the strategic placement of fast EVCSs with maximum feasible ratings while ensuring that the network performance remains unaffected. In the third stage, the sizing of solar DGs, battery storage, and SCs is revisited to mitigate the impact of EVCS integration while maintaining compliance with the multi-objective criteria. Given the inherent unpredictability of load variations, wind speeds, and solar insolation, the system retains grid connectivity to manage uncertainties. The network operates as a microgrid with net metering capability, supplying existing loads and EVCSs at optimized locations.
Author Contributions
Conceptualization, A.R.; Methodology, A.R.; Software, A.R.; Validation, A.R.; Formal analysis, A.R. and V.V.; Data curation, A.R.; Writing—original draft, A.R.; Writing—review and editing, A.R. and V.V.; Supervision, V.V. All authors have read and agreed to the published version of the manuscript.
Funding
This research received no external funding.
Data Availability Statement
The original contributions presented in this study are included in the article. Further inquiries can be directed to the corresponding author.
Conflicts of Interest
The authors declare that they have no known competing financial interests or personal relationships that could have appeared to influence the work reported in this paper.
Nomenclature
| AF | Area factor | Average area of houses | |
| Acceleration of the jth mass | BSS | Battery storage system | |
| DG | Distributed generation | EPV | Solar PV module efficiency |
| ET | Equation of time correction | EVCS | Electric vehicle charging station |
| EV | Electric vehicle | Fitness value | |
| Force on jth mass due to kth mass at a specific iteration | Total force on jth mass due to all masses | ||
| GSA | Gravitational Search Algorithm | H | Solar insolation |
| I | Global solar radiation | Beam radiation | |
| Portion of aligned with the direction of the sun’s rays | Diffuse radiation | ||
| Latitude of the location | Solar zenith angle | ||
| Solar declination angle | Longitude of the location | ||
| LAT | Local apparent solar time at noon | Hour angle | |
| Active gravitational mass | Passive gravitational mass | ||
| Inertial mass | MOF | Multi-objective function | |
| PV | Photovoltaic | PR | Solar panel performance ratio |
| PSIB | Real power supply from the source substation | PVDGn | Rooftop solar PV power generation |
| Total number of houses | QSIB | Reactive power supply from the source substation | |
| Peak real power load of a house | Peak real power load | ||
| SOC | State of Charge | SC | Shunt capacitor |
| SPVA | Area availability for solar PV installation | SPVC | Rooftop solar PV capacity |
| STL | Standard meridian for the local time zone | Individual node voltage for the modified network | |
| Velocity of the jth mass | Individual node voltage for the base case | ||
| XPLJ | Real power loss minimization index | XPJ | S/S Real power drawn index |
| XQLJ | Reactive power loss minimization index | XQJ | S/S Reactive power drawn index |
| S/S | Substation | XVPJ | Voltage profile index |
Appendix A
Table A1.
Modified ASHRAE model constants [26].
Table A2.
Line data and load data of bus 52 [9].
References
- Gümüş, T.; Emiroglu, S.; Yalcin, M. Optimal DG allocation and sizing in distribution systems with Thevenin based impedance stability index. Int. J. Electr. Power Energy Syst. 2023, 144, 108555. [Google Scholar] [CrossRef] [Scilit]
- Sellami, R.; Farooq, S.; Rafik, N. An improved MOPSO algorithm for optimal sizing & placement of distributed generation: A case study of the Tunisian offshore distribution network (ASHTART). Energy Rep. 2022, 8, 6960–6975. [Google Scholar] [CrossRef] [Scilit]
- Kashyap, M.; Kansal, S.; Verma, R. Sizing and allocation of DGs in a passive distribution network under various loading scenarios. Electr. Power Syst. Res. 2022, 209, 108046. [Google Scholar] [CrossRef] [Scilit]
- Nguyen, T.; Nguyen, T.; Phan, T.; Vo, D. A comprehensive analysis for multi-objective distributed generations and capacitor banks placement in radial distribution networks using hybrid neural network algorithm. Knowl.-Based Syst. 2021, 231, 107387. [Google Scholar] [CrossRef] [Scilit]
- Rekha; Byalihal, S. Optimal allocation of solar and wind distributed generation using particle swarm optimization technique. Int. J. Electr. Comput. Eng. 2023, 13, 229–237. [Google Scholar] [CrossRef] [Scilit]
- Vempalle, R.; Dhal, P. Optimal analysis of time varying load radial distribution system with photovoltaic and wind generating system using novel hybrid optimization technique. Renew. Energy Focus 2022, 41, 246–257. [Google Scholar] [CrossRef] [Scilit]
- Fathy, A.; Yousri, D.; Rezk, H.; Ramadan, H. An efficient capuchin search algorithm for allocating the renewable based biomass distributed generators in radial distribution network. Sustain. Energy Technol. Assess. 2022, 53, 102559. [Google Scholar] [CrossRef] [Scilit]
- Argüello, A.; Lara, J.; Rojas, J.; Valverde, G. Impact of rooftop PV integration in distribution systems considering socioeconomic factors. IEEE Syst. J. 2018, 12, 3531–3542. [Google Scholar] [CrossRef] [Scilit]
- Roy, A.; Verma, V.; Gampa, S.; Bansal, R. Planning of distribution system considering residential roof top photovoltaic systems, distributed generations and shunt capacitors using gravitational search algorithm. Comput. Electr. Eng. 2023, 111, 108960. [Google Scholar] [CrossRef] [Scilit]
- Goli, P.; Jasthi, K.; Gampa, S.R.; Das, D.; Shireen, W.; Siano, P.; Guerrero, J.M. Electric vehicle charging load allocation at residential locations utilizing the energy savings gained by optimal network reconductoring. Smart Cities 2022, 5, 177–205. [Google Scholar] [CrossRef] [Scilit]
- Ferraz, R.S.; Ferraz, R.S.; Medina, A.C.R.; Fardin, J.F. Multi-objective approach for optimized planning of electric vehicle charging stations and distributed energy resources. Electr. Eng. 2023, 105, 4105–4117. [Google Scholar] [CrossRef] [Scilit]
- Bhadoriya, J.S.; Gupta, A.R.; Kumar, A.; Ray, R.; Maini, S. Enhancement of the distribution network in the presence of EV charging stations augmented by distributed generation. Electr. Eng. 2023, 105, 3703–3717. [Google Scholar] [CrossRef] [Scilit]
- Mehroliya, S.; Arya, A. Optimal planning of power distribution system employing electric vehicle charging stations and distributed generators using metaheuristic algorithm. Electr. Eng. 2024, 106, 1373–1389. [Google Scholar] [CrossRef] [Scilit]
- Salkuti, S.R. Editorial Board Members’ Collection Series: Smart Energy System Design. Designs 2024, 8, 120. [Google Scholar] [CrossRef] [Scilit]
- Salkuti, S.R. Sustainable energy technologies for emerging renewable energy and electric vehicles. AIMS Energy 2024, 12, 1264–1270. [Google Scholar] [CrossRef] [Scilit]
- Jung, C.M.; Pagidipala, S.; Salkuti, S.R. Emerging Technologies for the Integration of Renewable Energy, Energy Storage and Electric Vehicles. In Energy and Environmental Aspects of Emerging Technologies for Smart Grid; Springer: Cham, Switzerland, 2024; pp. 107–124. [Google Scholar]
- Babu, C.H.; Raju, H.; Thangaraj, Y.; Thanikanti, S.B.; Nastasi, B. Optimizing power and energy loss reduction in distribution systems with RDGs, DSVCs and EVCS under different weather scenarios. Sustain. Energy Technol. Assess. 2025, 75, 104219. [Google Scholar] [CrossRef] [Scilit]
- Vaigundamoorthi, M.; Thirumalai, M.; Inbamalar, T.M.; Balamurugan, P.; Bajaj, M.; Rubanenko, O. Integrated optimization of solar DG and DSTATCOM placement for enhanced EVCS-Driven Power Distribution Performance. Energy Explor. Exploit. 2026, 44, 31–85. [Google Scholar] [CrossRef] [Scilit]
- Çeçen, M. Optimal integration of electric vehicle charging stations into a renewable-supported multi-energy system. Electr. Power Syst. Res. 2025, 247, 111832. [Google Scholar] [CrossRef] [Scilit]
- Yao, H.; Zhou, Q. Research status and application of rooftop photovoltaic Generation Systems. Clean. Energy Syst. 2023, 5, 100065. [Google Scholar] [CrossRef] [Scilit]
- Ren, H.; Sun, Y.; Tse, C.; Fan, C. Optimal packing and planning for large-scale distributed rooftop photovoltaic systems under complex shading effects and rooftop availabilities. Energy 2023, 274, 127280. [Google Scholar] [CrossRef] [Scilit]
- Barbón, A.; Ghodbane, M.; Bayón, L.; Said, Z. A general algorithm for the optimization of photovoltaic modules layout on irregular rooftop shapes. J. Clean. Prod. 2022, 365, 132774. [Google Scholar] [CrossRef] [Scilit]
- Alharbi, A.; Awwad, Z.; Habib, A.; Weck, O. Economical sizing and multi-azimuth layout optimization of grid-connected rooftop photovoltaic systems using Mixed-Integer Programming. Appl. Energy 2023, 335, 120654. [Google Scholar] [CrossRef] [Scilit]
- Sujon, M.; Podder, A.; Kumar, N.; Bhatt, A.; Kumar, K. Experimental verification of a dynamic programming and IoT-based simultaneous load-sharing controller for residential homes powered with grid and onsite solar photovoltaic electricity. Sustain. Energy Technol. Assess. 2023, 55, 102964. [Google Scholar] [CrossRef] [Scilit]
- Pérez, E.; Molina, P.; Cerdá, I.; Solar, D.; Fernández, A. Multicriteria solar photovoltaic potential evaluation for high educational buildings. Case study of Polytechnic University of Valencia, Spain. Renew. Energy 2024, 227, 120560. [Google Scholar] [CrossRef] [Scilit]
- Katiyar, A.; Pandey, C. Correlation for estimation of hourly solar radiation. Int. J. Energy Environ. 2011, 2, 191–198. [Google Scholar]
- American Society of Heating Refrigeration and Air-Conditioning Engineers. ASHRAE Applications Handbook (SI); ASHRAE: Atlanta, GA, USA, 1999. [Google Scholar]
- Calculation of the Annual Solar Energy Output of a Photovoltaic System. Available online: https://www.saurenergy.com/solar-energy-blog/here-is-how-you-can-calculate-the-annual-solar-energy-output-of-a-photovoltaic-system (accessed on 12 February 2026).
- Most Efficient Solar Panels 2025. Available online: https://www.cleanenergyreviews.info/blog/most-efficient-solar-panels (accessed on 12 February 2026).
- Electric Cars: Introduction, AC and DC Charging. Available online: https://ocw.tudelft.nl/course-lectures/2-3-1-ac-and-dc-charging/ (accessed on 12 February 2026).
- Top 18 Electric Two Wheelers in India in 2024 (Bikes and Scooters). Available online: https://www.godigit.com/motor-insurance/two-wheeler-insurance/find/electric-bike-in-india (accessed on 12 February 2026).
- Top 10 Electric Auto Rickshaws in India in 2024. Available online: https://www.godigit.com/motor-insurance/commercial-vehicle-insurance/find/best-electric-rickshaw-in-india (accessed on 12 February 2026).
- 28 Best EV Cars in India in 2024. Available online: https://www.godigit.com/motor-insurance/car-insurance/find/best-electric-cars-in-india#!#id8 (accessed on 12 February 2026).
- Esmat, R.; Rashedi, E.; Pour, H. A comprehensive survey on gravitational search algorithm. Swarm Evol. Comput. 2018, 41, 141–158. [Google Scholar] [CrossRef] [Scilit]
- Sizing Calculation of Lead-Acid Batteries. Available online: https://hblbatteries.com/index.html (accessed on 12 February 2026).
- IEEE 485-2020; IEEE Recommended Practice for Sizing Lead-Acid Batteries for Stationary Applications. IEEE: New York, NY, USA, 2020.

Disclaimer/Publisher’s Note: The statements, opinions and data contained in all publications are solely those of the individual author(s) and contributor(s) and not of MDPI and/or the editor(s). MDPI and/or the editor(s) disclaim responsibility for any injury to people or property resulting from any ideas, methods, instructions or products referred to in the content. |
© 2026 by the authors. Licensee MDPI, Basel, Switzerland. This article is an open access article distributed under the terms and conditions of the Creative Commons Attribution (CC BY) license.