


Abstract
With the continuously increasing penetration of renewable energy and the growing structural complexity of modern energy systems, the efficient and reliable solution of large-scale, high-dimensional, nonlinear, and strongly constrained optimization problems has become a critical research topic in the field of intelligent optimization. The Secretary Bird Optimization Algorithm (SBOA), a recently proposed swarm intelligence method, achieves a global search by simulating the hunting and defense behaviors of secretary birds and has demonstrated a certain potential in continuous optimization problems. However, when applied to high-dimensional, multimodal, and complex engineering optimization problems, the standard SBOA still suffers from limitations in collaborative search capabilities, late-stage convergence accuracy, and boundary-handling mechanisms. To address these shortcomings, this paper proposes an Adaptive Collaborative Secretary Bird Optimization Algorithm (ACSBOA). From a multi-strategy collaborative perspective, three key mechanisms are incorporated into the original SBOA: (1) an adaptive collaborative search strategy, which integrates positional information from the best, suboptimal, worst, and randomly selected individuals to guide the population toward more directional and efficient exploration; (2) a quadratic interpolation-based local exploitation strategy, designed to enhance fine-grained search capability during the later stages of optimization; and (3) a soft boundary pullback mechanism, which preserves solution feasibility while effectively maintaining population diversity. Through the synergistic interaction of these strategies, ACSBOA achieves a better balance of exploration ability, convergence speed, and algorithmic stability. The optimization performance of ACSBOA is systematically evaluated on the CEC2017 and CEC2022 benchmark suites across different problem dimensions and function categories. The experimental results demonstrate that ACSBOA significantly outperforms several state-of-the-art comparison algorithms in terms of solution accuracy, convergence speed, and robustness. Furthermore, ACSBOA is successfully applied to a 24 h optimal scheduling problem of a grid-connected microgrid. The simulation results indicate that the proposed algorithm can substantially reduce operational costs while satisfying all system operating constraints, thereby validating its effectiveness and practical applicability in real-world engineering optimization problems.
Keywords:
microgrid optimal scheduling; adaptive collaborative optimization; secretary bird optimization algorithm; metaheuristic algorithm; global optimization MSC:
68-06
1. Introduction
With the continuous transition of the global energy structure toward low-carbon and intelligent paradigms, the large-scale integration of renewable energy sources has posed unprecedented challenges to the operation and scheduling of modern power systems [1,2]. On the one hand, renewable energy sources such as wind power and photovoltaic (PV) generation exhibit strong randomness and intermittency, which significantly increase system uncertainty [3]. On the other hand, microgrids—integrated energy systems that combine distributed generation units, energy storage systems, and flexible load management—are typically characterized by high dimensionality, strong nonlinearity, multiple constraints, and, in many cases, multi-objective optimization requirements. These features make it difficult for traditional deterministic optimization methods to obtain high-quality solutions within an acceptable computational time [4,5]. Consequently, the development of efficient, robust, and highly generalizable intelligent optimization algorithms has become a major research focus in microgrid scheduling and complex engineering optimization.
In this context, intelligent optimization algorithms have been widely adopted due to their gradient-free nature, adaptability to complex search spaces, and strong global search capability. These algorithms have achieved substantial success in solving complex engineering optimization problems, particularly in microgrid scheduling, energy management, and power system optimization [6,7]. Classical swarm intelligence algorithms—including Particle Swarm Optimization (PSO) [8], Genetic Algorithm (GA) [9], Ant Colony Optimization (ACO) [10], Bat Algorithm (BA) [11], Grey Wolf Optimizer (GWO) [12], Sparrow Search Algorithm (SSA) [13], Salp Swarm Algorithm (SSA) [14], Whale Optimization Algorithm (WOA), Snake Optimizer (SO) [15], and Red-billed Blue Magpie Optimizer (RBMO) [16]—simulate cooperative behaviors observed in nature and have shown the ability to mitigate premature convergence in non-convex and multimodal optimization problems. However, as problem dimensionality increases and constraint structures become more complex, many of these traditional algorithms gradually reveal inherent limitations, such as reduced convergence speed, insufficient search accuracy, and high sensitivity to control parameters.
In recent years, researchers have increasingly focused on proposing novel bio-inspired optimization algorithms or improving existing ones from a biomimetic perspective, aiming to achieve a more effective balance between exploration and exploitation. For example, Zheng et al. proposed a multi-strategy Improved Snake Optimization algorithm (ISO) to overcome the degradation of search efficiency and premature convergence issues in the late stages of the original SO algorithm [17]. Setiawan et al. introduced a new metaheuristic method termed the Battlefield Optimization Algorithm (BfOA), inspired by battlefield combat dynamics [18]. Abualigah et al. developed an enhanced synergistic swarm optimization algorithm based on Lévy flight mechanisms for task scheduling in cloud computing environments [19]. Li et al. proposed an improved Algorithm Optimization Algorithm (AOA), incorporating Runge–Kutta and golden sine strategies to address slow convergence and weak global search capability [20]. Wang et al. introduced the Animated Oat Optimization Algorithm (AOO), a novel metaheuristic inspired by the natural behavior of animated oats, and demonstrated its effectiveness in wireless sensor network optimization problems [21].
The Secretary Bird Optimization Algorithm (SBOA) [22] is a recently developed bio-inspired optimization technique motivated by the hunting and defensive behaviors of secretary birds in nature. We specifically select SBOA as the baseline algorithm for this study due to three key advantages that align with the requirements of complex microgrid scheduling problems: (1) Structural simplicity: Compared with classical metaheuristics (e.g., PSO, GA) and other bio-inspired algorithms (e.g., GWO, SSA), SBOA has fewer control parameters (only CF, K, RB) and a straightforward position update mechanism, reducing the complexity of algorithm improvement and parameter tuning. (2) Strong global search potential: SBOA’s simulation of secretary birds’ multi-stage hunting (searching, exhausting, attacking prey) and dual escape strategies enables an effective exploration of high-dimensional search spaces, as demonstrated by its superior performance in continuous optimization problems compared to algorithms such as PSO and GWO. (3) Improvement flexibility: The standard SBOA’s inherent limitations (insufficient collaborative search, weak local exploitation, and rigid boundary handling) are targeted and modular, allowing for targeted enhancements without overhauling the core framework—unlike mature algorithms (e.g., PSO, GWO) that have undergone extensive modifications with limited room for significant performance leaps. In SBOA, the hunting process of secretary birds is mapped to the exploration phase, while their evasive behaviors against predators are modeled as the exploitation phase. Existing studies have shown that SBOA possesses a strong global search potential in continuous optimization problems and exhibits promising performance in certain engineering applications, such as renewable energy allocation and gesture recognition [23,24]. Compared with some classical algorithms, SBOA features a simpler structure, fewer control parameters, and greater implementation flexibility, making it an ideal foundation for developing a high-performance optimization algorithm for complex engineering problems like microgrid scheduling.
With respect to the Secretary Bird Optimization Algorithm (SBOA) and its variants, the existing studies have demonstrated their potential across multiple application domains. For instance, Qin et al. proposed an improved SBOA by incorporating an incremental PID control-based feedback regulation mechanism and a golden sine guidance strategy, and applied it to engineering optimization problems [25]. To address the limitations of insufficient global exploration and weak local exploitation, Chen et al. developed a dual-mechanism enhanced SBOA by integrating an optimal neighborhood perturbation mechanism with an opposition-based learning strategy [26]. Wang et al. introduced an improved algorithm (UTFSBOA) that combines adaptive nonlinear factors, a Cauchy–Gaussian crossover strategy, and an exponentially decaying energy-escape factor, thereby enabling a multi-strategy collaborative optimization with Cauchy–Gaussian crossover [27]. Feng et al. proposed a multi-strategy Secretary Bird Optimization Algorithm (MSBOA) for unmanned aerial vehicle path planning, which integrates a pooling mechanism, a dynamic fitness–distance balance technique, and a centroid-based greedy opposition learning update strategy [28]. Yu Zhu et al. presented an improved SBOA (QHSBOA) for deep learning hyperparameter optimization by integrating a Particle Swarm Optimization search mechanism, an optimal individual-based dynamic boundary adjustment, and a quantum computing-inspired t-distribution variation strategy [29]. Nevertheless, these improved algorithms predominantly focus on specific application scenarios (e.g., classification and path planning), and systematic enhancements tailored to high-dimensional, strongly constrained engineering optimization problems—such as microgrid scheduling—remain largely unexplored.
For the grid-connected microgrid scheduling problem, evolutionary computation (EC) algorithms have been extensively applied. Liu et al. proposed a novel multi-objective hybrid microgrid scheduling framework that aims to minimize operating costs while maximizing environmental benefits; a higher solution accuracy and computational efficiency were achieved by employing an improved Peafowl Optimization Algorithm [30]. Osama et al. developed an energy management strategy for a solar–wind hybrid microgrid with energy storage based on an improved Multi-Objective Manta Ray Foraging Optimizer (MOMRFO) [31]. Zishuo Liu et al. proposed a multi-objective optimal scheduling method for microgrids based on the Tuned Dung Beetle Optimization (TDBO) algorithm, which simultaneously reduces operating and environmental costs while satisfying multiple physical and engineering constraints [32]. Liu et al. presented a microgrid optimal scheduling model based on an Improved Gold Rush Optimization (IGRO) algorithm, incorporating dynamically adaptive weighting factors and Halton sequence-based population initialization to enhance the economic performance of the microgrid scheduling system [33]. Karthik Nagarajan et al. proposed an Improved Lyrebird Optimization Algorithm (ILOA) for the optimal segmentation and scheduling of multi-microgrid systems, with the objectives of minimizing generation costs and active power loss while ensuring system reliability [34]. However, the existing evolutionary computation algorithms still face several challenges, including a slow convergence in high-dimensional scenarios, insufficient robustness to renewable energy uncertainty and fluctuations, and difficulties in balancing multiple competing constraints.
Nevertheless, further investigations have revealed that the standard SBOA still suffers from several deficiencies when applied to high-dimensional, nonlinear, and multimodal optimization problems. First, during the exploration phase, the position update of individuals mainly relies on random individual differences and global best guidance, resulting in a highly stochastic search direction. The collaborative information among individuals at different performance levels within the population is not fully exploited, which limits search efficiency [29]. Second, in the later stages of optimization, SBOA primarily depends on random perturbations and Lévy flight for local exploitation, lacking a fine-grained and directionally guided local search mechanism. This often leads to a slow convergence or stagnation near local optima [28]. Third, conventional boundary-handling strategies in SBOA typically employ hard truncation, which forcibly maps out-of-bounds solutions to boundary limits. Although this ensures feasibility, it may cause population aggregation near the boundaries, reduce population diversity, and weaken search capabilities in boundary regions [25,26].
Motivated by the above observations, this study aims to enhance the overall performance of SBOA in solving complex optimization problems and proposes an Adaptive Collaborative Secretary Bird Optimization Algorithm (ACSBOA). The proposed algorithm systematically improves the standard SBOA from three perspectives: population collaborative search, high-precision local exploitation, and boundary constraint handling. Specifically, an adaptive collaborative search strategy is introduced to integrate the relative positional information of the best, suboptimal, worst, and randomly selected individuals, guiding the population toward more explicit and directional search behavior. Furthermore, a quadratic interpolation-based local exploitation strategy is incorporated in the later search stage to improve convergence accuracy and efficiency near promising regions. In addition, a soft boundary pullback mechanism is designed to maintain feasibility while preserving population diversity, effectively preventing excessive aggregation near the search space boundaries.
The primary objective of this paper is to overcome the limitations of existing optimization algorithms in microgrid scheduling problems by developing a more powerful and adaptable optimization approach. The main contributions of this work can be summarized as follows:
- (1)
- Adaptive collaborative search strategy: An adaptive mechanism that fuses the relative positional information of elite, sub-elite, worst, and random individuals is proposed. Directional weight factors based on Euclidean distance and fitness-scaling coefficients are introduced to dynamically regulate the search direction and step size, thereby enhancing search directionality and balance.
- (2)
- Quadratic interpolation-based local exploitation strategy: A quadratic interpolation model is constructed using the current individual, the global best solution, and a randomly selected individual, enabling high-precision exploitation in complex multimodal landscapes and accelerating late-stage convergence.
- (3)
- Soft boundary pullback constraint-handling strategy: A soft boundary mechanism is developed to replace traditional hard truncation. Out-of-bounds solutions are probabilistically pulled back into the feasible domain with random step sizes, preserving feasibility while maintaining population diversity and stochasticity.
- (4)
- Comprehensive experimental validation: Extensive experiments are conducted on benchmark test suites with different dimensions, comparing ACSBOA with nine state-of-the-art algorithms. Convergence behavior, solution accuracy, robustness, and computational efficiency are systematically analyzed, and statistical tests are employed to confirm the significance of the proposed method.
- (5)
- Application to microgrid scheduling optimization: A microgrid scheduling model incorporating multiple cost components and operational constraints is established. Simulation results demonstrate that ACSBOA effectively reduces operating costs while satisfying system constraints, validating its practical applicability in real-world engineering optimization.
The remainder of this paper is organized as follows. Section 2 introduces the basic principles of SBOA and details the proposed ACSBOA. Section 3 presents numerical experiments on benchmark test suites, including convergence, robustness, and computational efficiency analyses. Section 4 applies ACSBOA to the optimal scheduling of a grid-connected microgrid and discusses the simulation results. Finally, Section 5 concludes the paper and outlines directions for future research.
2. Secretary Bird Optimization Algorithm and the Proposed Method
2.1. Secretary Bird Optimization Algorithm (SBOA)
The Secretary Bird Optimization Algorithm (SBOA) is inspired by the natural survival behaviors of secretary birds, primarily simulating their hunting strategies and evasive actions when escaping from predators. In SBOA, the three stages of the hunting process correspond to the exploration phase of the algorithm, while the two escape strategies adopted by secretary birds when facing predators or food theft correspond to the exploitation phase [35].
The mathematical modeling of SBOA consists of three main stages: the initialization stage, the exploration stage, and the exploitation stage. The mathematical formulations of each stage are described as follows.
- (1)
- Initialization Stage
To solve an optimization problem, it is necessary to generate an initial set of candidate solutions as the starting point of the search process. Similar to other metaheuristic algorithms, SBOA initializes the population using the following equation:
where denotes the initial value of the -th decision variable of the -th candidate solution; and represent the upper and lower bounds of the -th dimension, respectively; and is a random number uniformly distributed in the interval (0, 1).
- (2)
- Exploration Phase (Hunting Strategy of Secretary Birds)
The hunting behavior of secretary birds is divided into three stages: searching for prey, exhausting the prey, and attacking the prey. In the searching stage, secretary birds identify potential prey; once prey is located, they enter the exhausting stage, during which they linger, jump, and provoke near the prey to deplete its energy. After the prey is sufficiently weakened, the secretary bird initiates the attack. This process is mathematically modeled using the following equation [22]:
where denotes the current iteration number, is the maximum number of iterations, and represents the updated position of the secretary bird. and are two distinct candidate solutions randomly selected from the population. is a random vector uniformly generated within a predefined range, with dimensionality equal to the problem dimension . is a random vector sampled from a standard normal distribution, and denotes the global best solution found so far. The Lévy flight () function is defined as
where is a constant, and are random numbers uniformly distributed in [0, 1], and denotes the Gamma function.
- (3)
- Exploitation Phase (Escape Strategy)
In nature, secretary birds may encounter predators or competitors attempting to steal their prey. To protect themselves or their food, they typically adopt two escape strategies, rapid flight or running away, and camouflage by utilizing environmental colors or structures to reduce detectability [22]. This behavior is mathematically modeled as
where denotes a random vector generated from a standard normal distribution, is a randomly selected candidate solution, and is a random integer taking the value 1 or 2.
In SBOA, newly generated solutions from both exploration and exploitation phases are subjected to boundary-handling procedures. A solution is accepted and replaces the current individual only if its fitness value is better than that of the original solution:
where denotes the objective (fitness) function.
2.2. Proposed Adaptive Collaborative Secretary Bird Optimization Algorithm (ACSBOA)
To address the limitations of the standard Secretary Bird Optimization Algorithm (SBOA), such as a low search efficiency, insufficient convergence performance, and simplistic boundary handling when dealing with high-dimensional, nonlinear, and multimodal problems, this paper proposes an Adaptive Collaborative Secretary Bird Optimization Algorithm (ACSBOA) by improving the algorithm in three aspects: group collaborative search, local fine-grained development, and boundary guidance. Through the synergy of multiple strategies, the algorithm effectively enhances the convergence speed and solution accuracy while maintaining population diversity.
2.2.1. Adaptive Collaborative Search Strategy
In the standard SBOA, individual position updates mainly rely on random individual differences or global best guidance, which limits the effective utilization of collaborative information among individuals at different fitness levels. To address this issue, an adaptive collaborative search strategy is introduced into the attack stage of the exploration phase. This strategy guides individuals toward more directional and efficient search behaviors by integrating the relative positional information of elite, sub-elite, worst, and randomly selected individuals.
At iteration , all individuals are first ranked according to their fitness values. The global best individual , a randomly selected suboptimal individual and a worst individual are identified. Meanwhile, two distinct individuals, and , are randomly selected from the population. Based on these individuals, four collaborative direction vectors are constructed as follows:
To adaptively balance the influence of different search directions, a direction weight factor based on Euclidean distance is introduced:
where is a small positive constant introduced to avoid division by zero.
In addition, a fitness-scaling factor is incorporated to dynamically adjust the search step size based on individual quality:
where denotes the fitness value of the -th individual and is the population size.
By integrating the above components, the adaptive collaborative search vector is defined as
Accordingly, the position update formula of the -th individual during the attack stage is expressed as
This strategy enables inferior individuals to adopt larger step sizes to escape low-quality regions, while superior individuals perform finer local searches. Consequently, both global exploration capability and convergence stability are significantly enhanced.
2.2.2. Quadratic Interpolation-Based Local Exploitation Strategy
Although the adaptive collaborative search strategy improves the overall directionality of population search, an insufficient local exploitation accuracy may still occur near promising regions in complex multimodal landscapes. To further enhance fine-grained exploitation capabilities during the later stages of optimization, a quadratic interpolation-based local exploitation strategy is introduced into the defense stage of the exploration phase.
For the -th individual, two distinct individuals, and , are randomly selected from the population, together with the current global best individual, . Using their corresponding fitness values, , , and , a quadratic interpolation model is constructed. The position update is given by
All square, addition, subtraction, and division operations are performed element-wise. When the denominator approaches zero or numerical instability occurs, a small positive constant is added to ensure computational stability, whose influence on the solution accuracy is negligible.
By constructing a local quadratic approximation, this strategy enables high-precision exploitation near potential optima, effectively accelerating convergence in the later stages of optimization.
2.2.3. Feasible Domain Constraint Strategy Based on Soft Boundary Pullback
In high-dimensional complex optimization problems, the treatment of boundary constraints plays a critical role in overall algorithm performance. Traditional SBOA typically employs a hard boundary truncation strategy, where any out-of-bounds component of an individual is forcibly set to the corresponding boundary limit. Although this approach ensures feasibility, it often causes excessive population aggregation near the boundaries, reducing diversity and weakening the search capability in boundary regions.
To overcome this drawback, a feasible domain constraint strategy based on a soft boundary pullback mechanism is proposed. Instead of directly truncating out-of-bounds individuals, this strategy probabilistically pulls them back into the feasible domain using random step sizes, thereby preserving both feasibility and population diversity.
Let denote the updated position of the -th individual in the -th dimension, with lower and upper bounds and , respectively. When a boundary violation occurs, the position is corrected as follows:
where is a random number uniformly distributed in (0, 1).
This soft boundary pullback mechanism allows out-of-bounds individuals to re-enter the feasible domain with random step lengths rather than being fixed at the boundary. As a result, population aggregation near the boundaries is effectively avoided, and the algorithm robustness in constrained search spaces is significantly improved.
Based on the above discussion, the pseudocode for ACSBOA is presented in Algorithm 1.
| Algorithm 1. Pseudo-Code of ACSBOA |
| 1: Initialize the ACSBOA parameters (population, ), Max iterations . |
| 2: Initialize the secretary bird’s position and evaluate the objective function using Equation (1). |
| 3: while do |
| 4: Evaluate the fitness values to identify the best, suboptimal, and worst positions. |
| 5: Compute the adaptive collaborative search vector by Equations (6)–(9). |
| 6: for |
| 7: Exploration phase (Hunting strategy): |
| 8: Calculate new status of secretary bird by Equations (2) and (10). |
| 9: Update the population member of secretary bird by Equation (5). |
| 10: The feasible region is constrained through a soft-boundary pullback mechanism by Equation (12). |
| 11: Exploitation phase (Escape strategy): |
| 12: Calculate new status of secretary bird by Equations (4) and (11). |
| 13: Update the population member of secretary bird by Equation (5). |
| 14: The feasible region is constrained through a soft-boundary pullback mechanism by Equation (12). |
| 15: end for |
| 16: Update global best solution . |
| 17: End while |
| 18: Return . |
2.3. Complexity Analysis of ACSBOA
Assume that denotes the population size, denotes the problem dimension, and denotes the maximum number of iterations. For the standard Secretary Bird Optimization Algorithm (SBOA), the computational complexity of the initialization phase is , while the complexity of the iterative process, including the preying and escaping behaviors, is . For the proposed Adaptive Collaborative Secretary Bird Optimization Algorithm (ACSBOA), the initialization phase remains unchanged, and thus its complexity is still . During the iterative process, ACSBOA introduces an adaptive collaborative search mechanism that involves sorting the population with complexity and performing vector-based collaborative updates with complexity ; therefore, the overall complexity of this mechanism is , which can be approximated as , since in most optimization problems. In addition, the quadratic interpolation strategy and the global best-guided boundary handling mechanism are both applied to each individual across all dimensions, resulting in a computational cost of per iteration. As ACSBOA retains the core search framework of SBOA while incorporating the above enhancement strategies, the overall complexity of its iterative process is . Consequently, the total computational complexity of ACSBOA remains , which is equivalent to that of the standard SBOA, indicating that the proposed improvements enhance optimization performance without increasing the algorithm’s time complexity.
3. Numerical Experiments
3.1. Competitor Algorithms and Parameter Settings
In this section, the effectiveness of the proposed ACSBOA is investigated using two highly demanding numerical optimization benchmark suites, namely CEC2017 [36] and CEC2022 [37]. Its performance is systematically compared with that of nine state-of-the-art optimization methods, which are carefully selected to ensure representativeness, comprehensiveness, and relevance to the research context. The competing algorithms considered in this study include: (1) Classical metaheuristic variants: Memory, Evolutionary operator, and Local search-based improved Grey Wolf Optimizer (MELGWO) [38], Improved Whale Optimization Algorithm (IWOA) [39], Modified Particle Swarm Optimization (MPSO) [40], and Improving the search performance of SHADE using linear population size reduction (L-SHADE) [41]; these algorithms serve as baseline references for classical swarm intelligence methods. (2) Recent bio-inspired and physics-based algorithms: Rime optimization algorithm (RIME) [42], Artificial Lemming Algorithm (ALA) [43], and Hannibal Barca optimizer (HBO) [44]; these algorithms represent the latest advances in metaheuristic research (published 2022–2025) to demonstrate ACSBOA’s competitiveness against cutting-edge methods. (3) SBOA-related variants: the original Secretary Bird Optimization Algorithm (SBOA) [22] and Quantum computing and multiple strategies improvement Secretary Bird Optimization Algorithm (QHSBOA) [29]. We selected these to specifically evaluate the superiority of ACSBOA’s modifications over existing SBOA-based methods.
For all benchmark experiments, the control parameters of each algorithm were set according to the recommendations provided in their original publications to ensure fairness. The detailed parameter configurations of the competing algorithms are summarized in Table 1.
Table 1.
Parameter settings of the compared algorithms.
3.2. Experimental Results and Analysis of CEC2017 and CEC2022 Test Suite
This part conducts a systematic performance comparison between ACSBOA and several representative baseline algorithms on the CEC2017 and CEC2022 benchmark suites. These benchmark collections consist of four distinct classes of objective functions, namely unimodal, multimodal, hybrid, and composition functions. Functions with multiple local extrema (multimodal) are mainly employed to assess the global search and exploration ability of optimization methods, whereas unimodal functions, which contain only a single optimum, are primarily used to evaluate convergence accuracy and exploitation efficiency. In addition, hybrid and composition functions are designed to provide a more challenging evaluation environment, testing an algorithm’s robustness and capability to avoid premature convergence.
For a fair and consistent comparison, all competing algorithms were executed under identical experimental settings, with a population size fixed at 30 and a maximum number of 500 iterations. Each algorithm was independently run 30 times to alleviate the influence of stochastic variations. The statistical performance is summarized using the average (Mean) and standard deviation (Std), where the best-performing results are highlighted in boldface. All simulations were carried out using MATLAB 2024b on a Windows 11 operating system, equipped with an AMD Ryzen 7 9700X processor (3.80 GHz) and 48 GB of memory.
Table 2, Table 3, Table 4 and Table 5 present the experimental results of ACSBOA and the nine competing algorithms on the CEC2017 (30-dimensional and 100-dimensional) and CEC2022 (10-dimensional and 20-dimensional) benchmark suites. These results cover unimodal, multimodal, hybrid, and composition functions, providing a comprehensive evaluation of algorithm performance across different problem dimensions and complexity levels. In all tables of this paper, bold values indicate the best or optimal performance for the corresponding metric.
Table 2.
Numerical results of CEC2017 benchmark functions (dim = 30).
Table 3.
Numerical results of CEC2017 benchmark functions (dim = 100).
Table 4.
Numerical results of CEC2022 benchmark functions (dim = 10).
Table 5.
Numerical results of CEC2022 benchmark functions (dim = 20).
In the comparative results for CEC2017 (dim = 30) (Table 2), ACSBOA demonstrates a strong overall performance across multiple categories of functions. Taking representative functions as examples, on F2, ACSBOA achieves a mean value of 7.6827 × 10¹², which is significantly smaller than those of the other comparison algorithms (e.g., QHSBOA at 1.3469 × 10¹⁷ and SBOA at 2.0464 × 10¹⁷). At the same time, its standard deviation is also relatively low, indicating that the algorithm not only obtains better solutions but also exhibits smaller fluctuations and stronger stability over 30 independent runs. On the other hand, ACSBOA is not absolutely optimal for all functions. For instance, on F1, the mean value of MPSO (2.0046 × 10³) is lower than that of ACSBOA (3.4272 × 10³), suggesting that ACSBOA can be outperformed by other algorithms on certain types of problems. For representative hybrid/composition functions (such as F11), ACSBOA achieves a mean value of 2.8967 × 10³, which is lower than those of other algorithms (e.g., L-SHADE at 2.9097 × 10³, SBOA at 2.9034 × 10³, and QHSBOA at 2.9129 × 10³), reflecting its stronger optimization capability in complex landscapes.
When the dimension is increased to CEC2017 (dim = 100) (Table 3), the results further reveal the competitiveness of ACSBOA under high-dimensional conditions. For example, on F1, ACSBOA attains a mean value of 4.0858 × 10⁷, which is clearly superior to those of the other algorithms (e.g., MPSO at 6.0793 × 10⁸ and IWOA at 8.9139 × 10⁹), demonstrating that it can maintain a strong convergence quality even in high-dimensional search spaces. However, Table 3 also shows that different algorithms have their respective advantages for different functions (i.e., ACSBOA is not the best for all functions). Therefore, a more reasonable conclusion is that ACSBOA exhibits outstanding overall performance in high-dimensional scenarios but does not achieve a “dominant” advantage across all functions.
On the CEC2022 test suite, ACSBOA shows good accuracy and stability at both dim = 10 (Table 4) and dim = 20 (Table 5). Taking dim = 10 as an example, on F1, ACSBOA achieves a mean value of 3.0000 × 10² with a standard deviation of 5.5717 × 10⁻⁹, which represents an extremely low level of fluctuation among all comparison algorithms, indicating that it can almost consistently converge to solutions of the same quality for this function. On F2, the mean value of ACSBOA (4.0550 × 10²) is smaller than those of the other algorithms (e.g., SBOA at 4.0618 × 10² and L-SHADE at 4.0676 × 10²), reflecting a better solution accuracy. When the dimension is increased to dim = 20, ACSBOA achieves a mean value of 3.2308 × 10² on F1, which is significantly lower than those of the other algorithms (e.g., QHSBOA at 1.5991 × 10³ and RIME at 1.7285 × 10³), while maintaining a standard deviation of only 3.2279 × 101. This further demonstrates that ACSBOA can obtain better and more stable solutions even at higher dimensional settings.
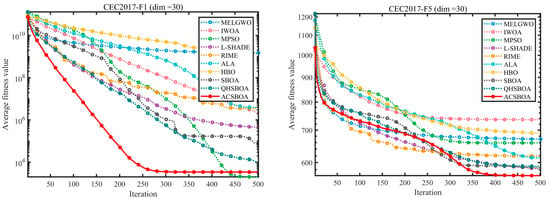
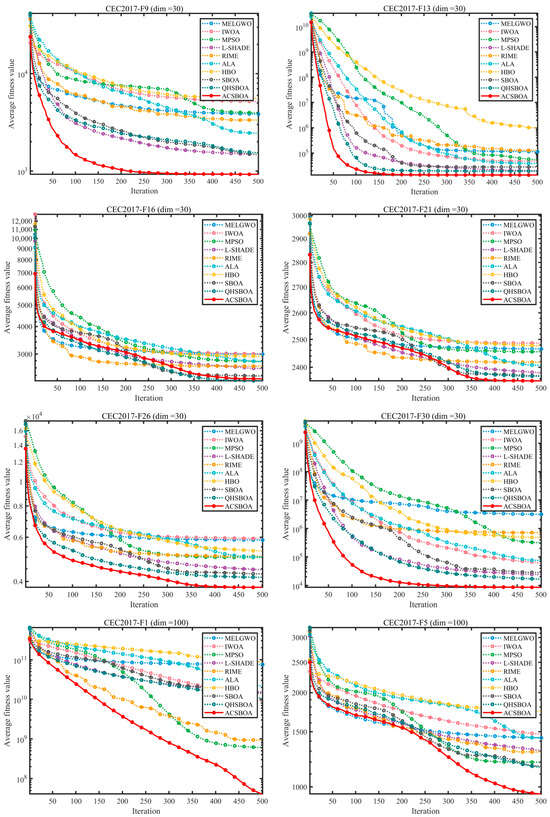
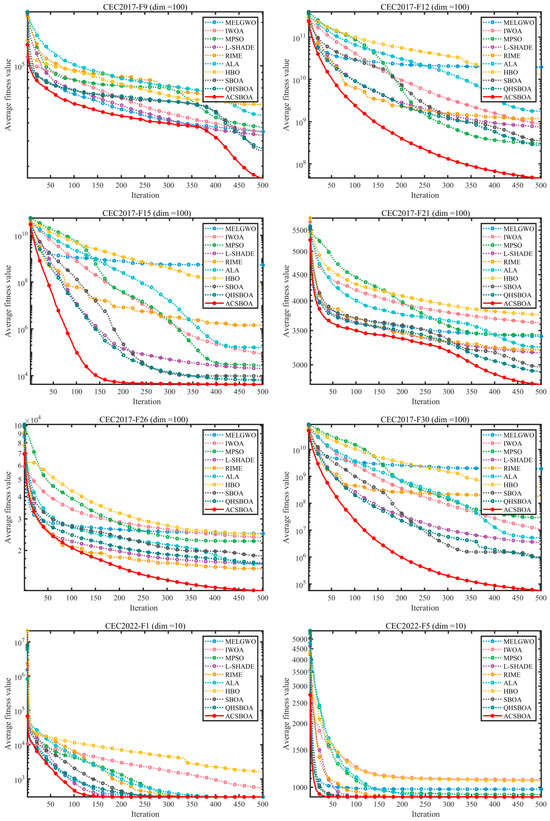
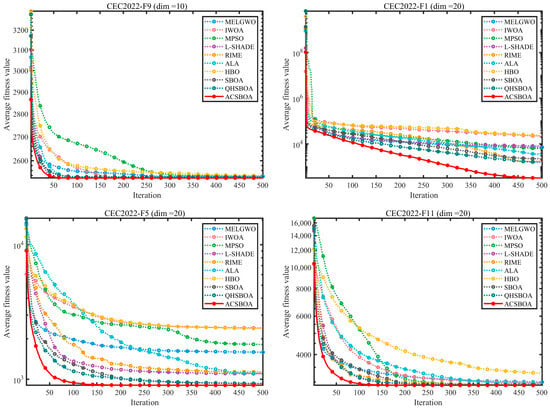
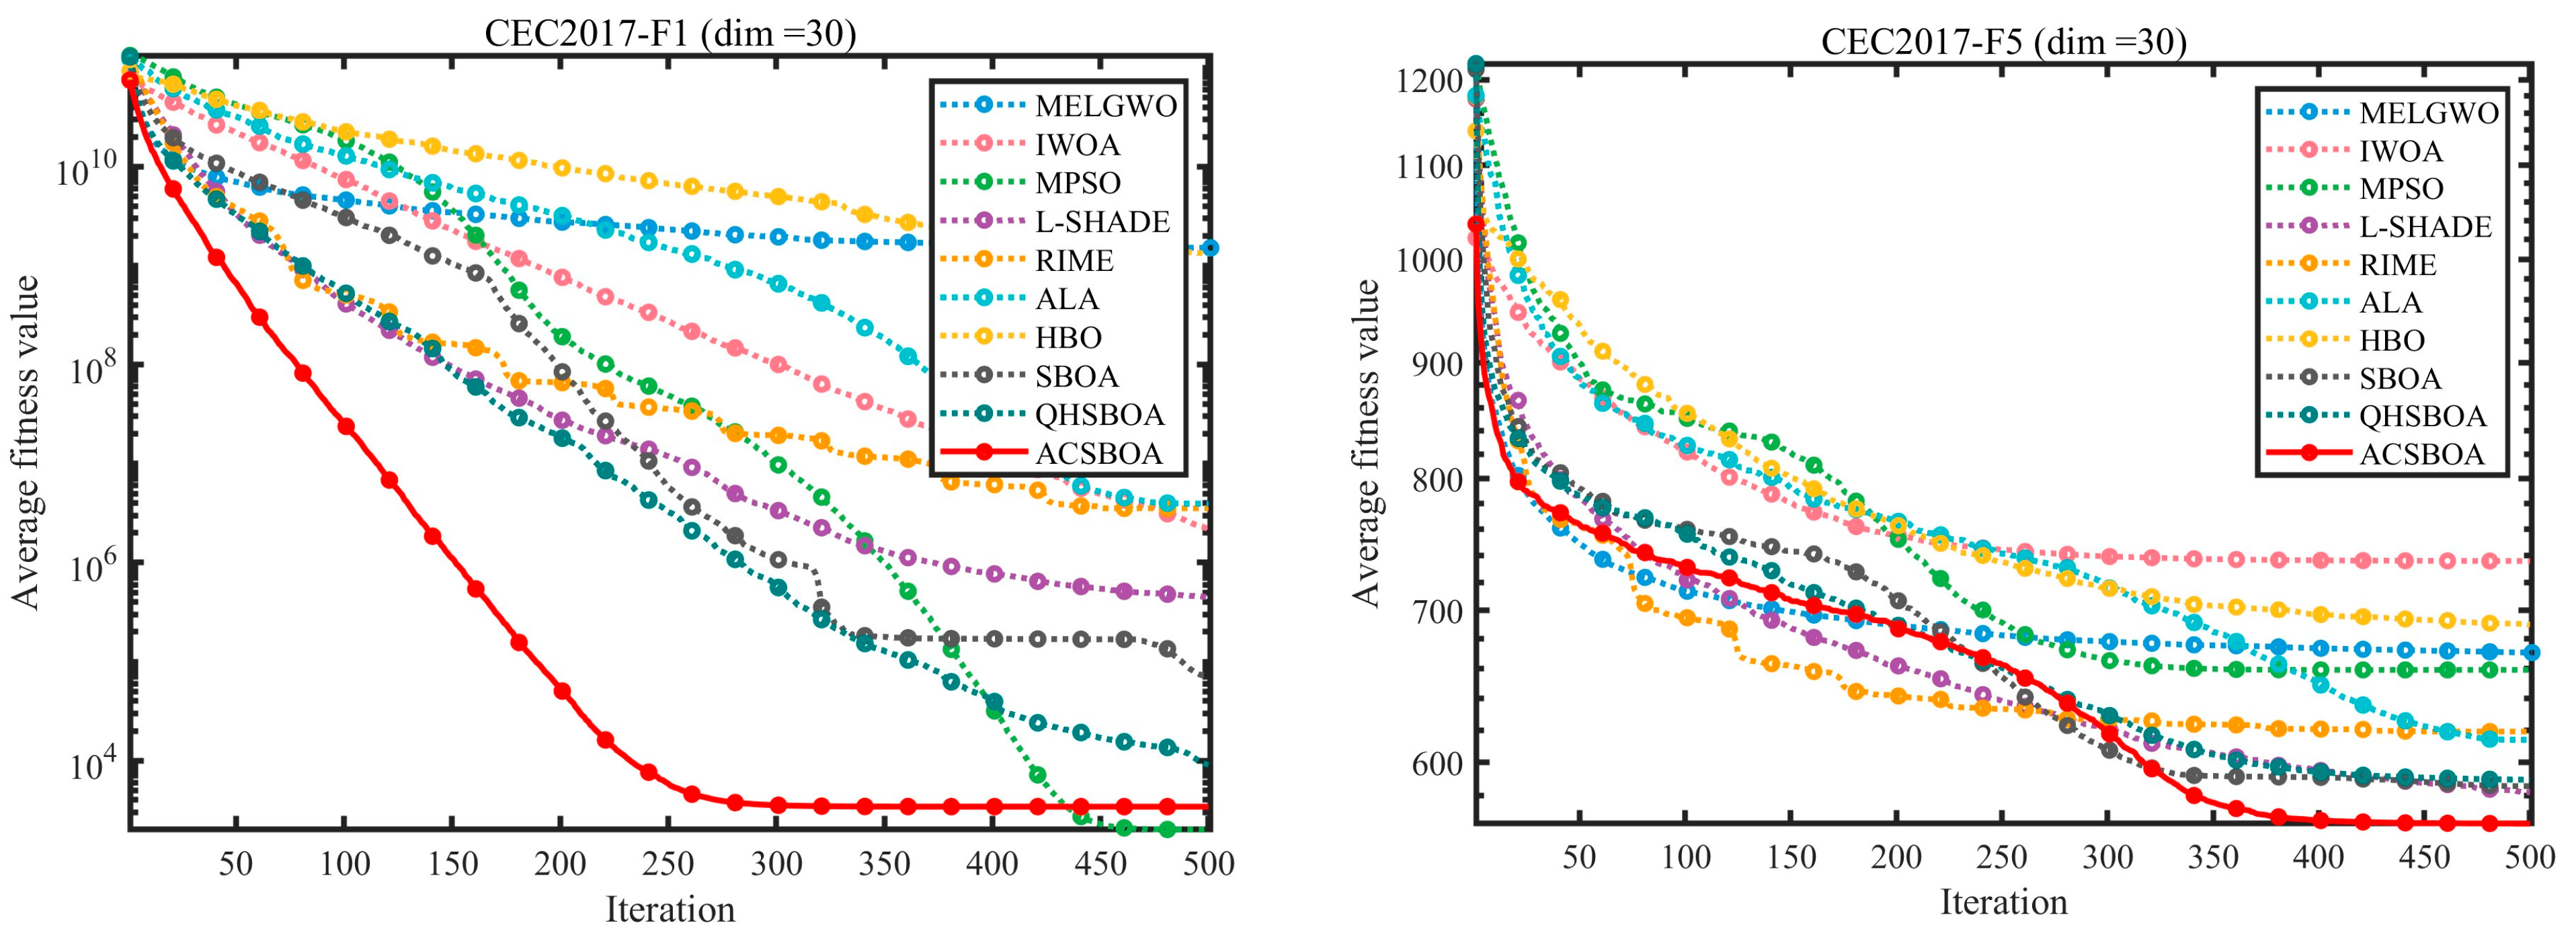
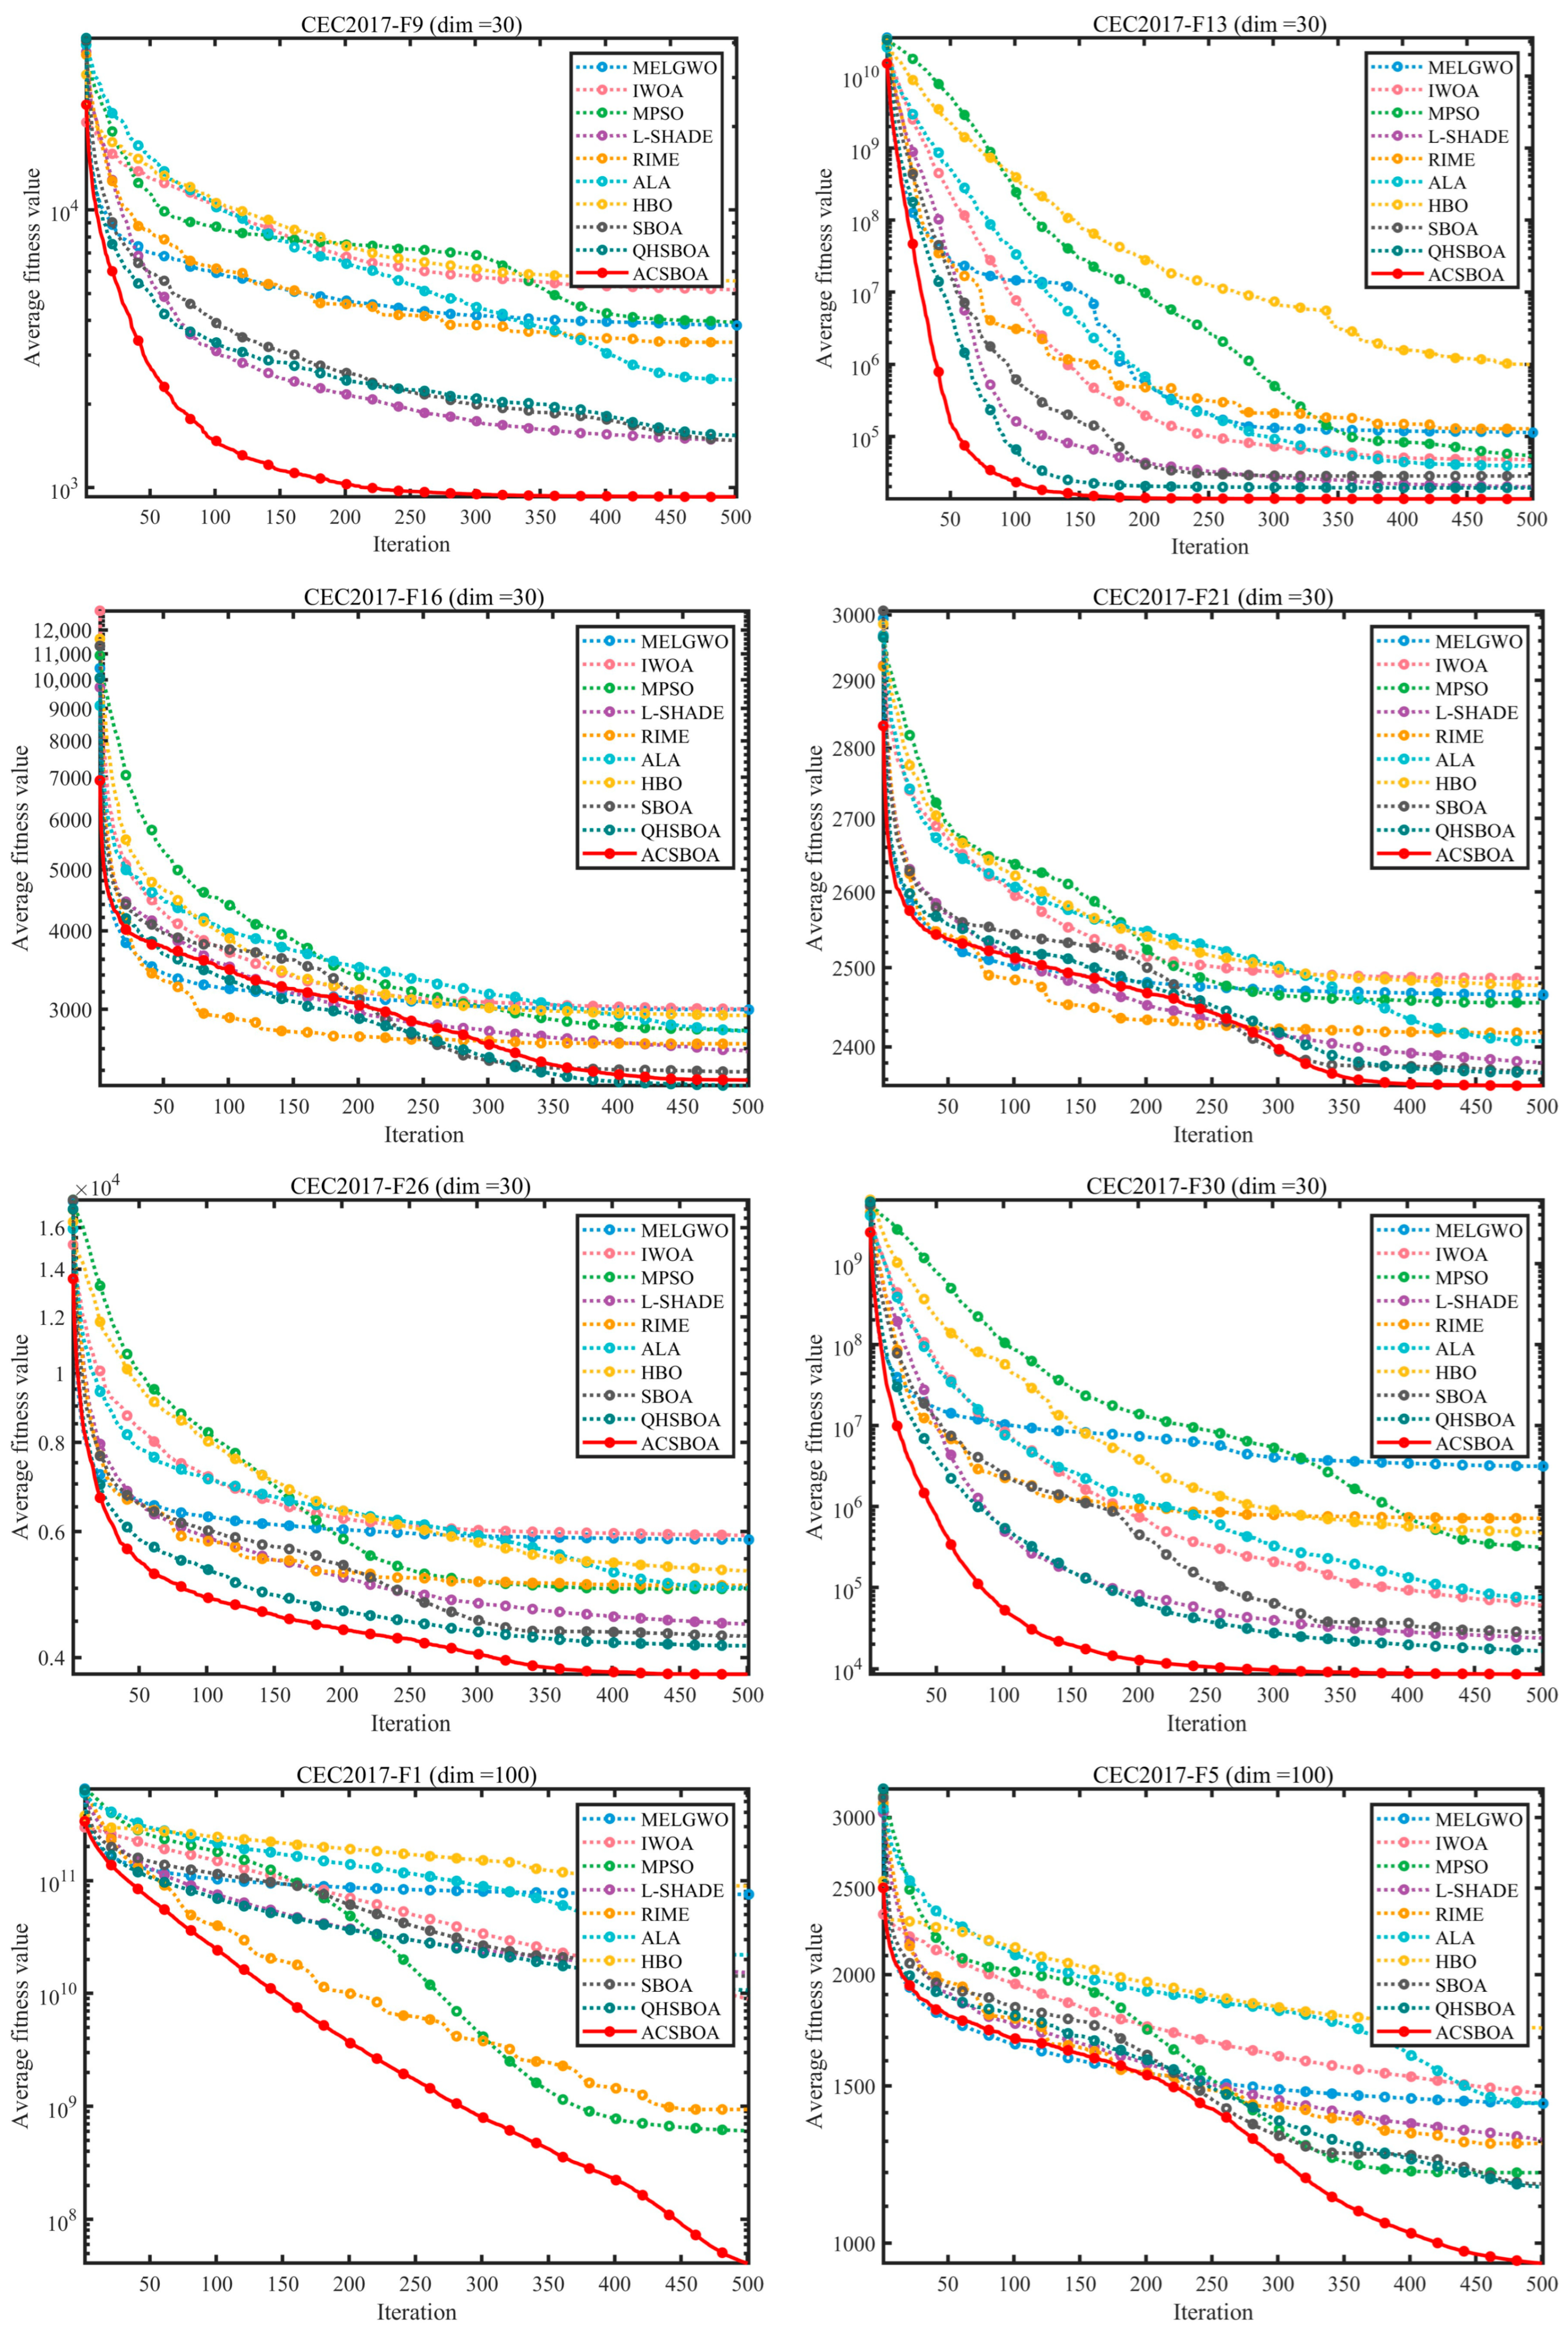
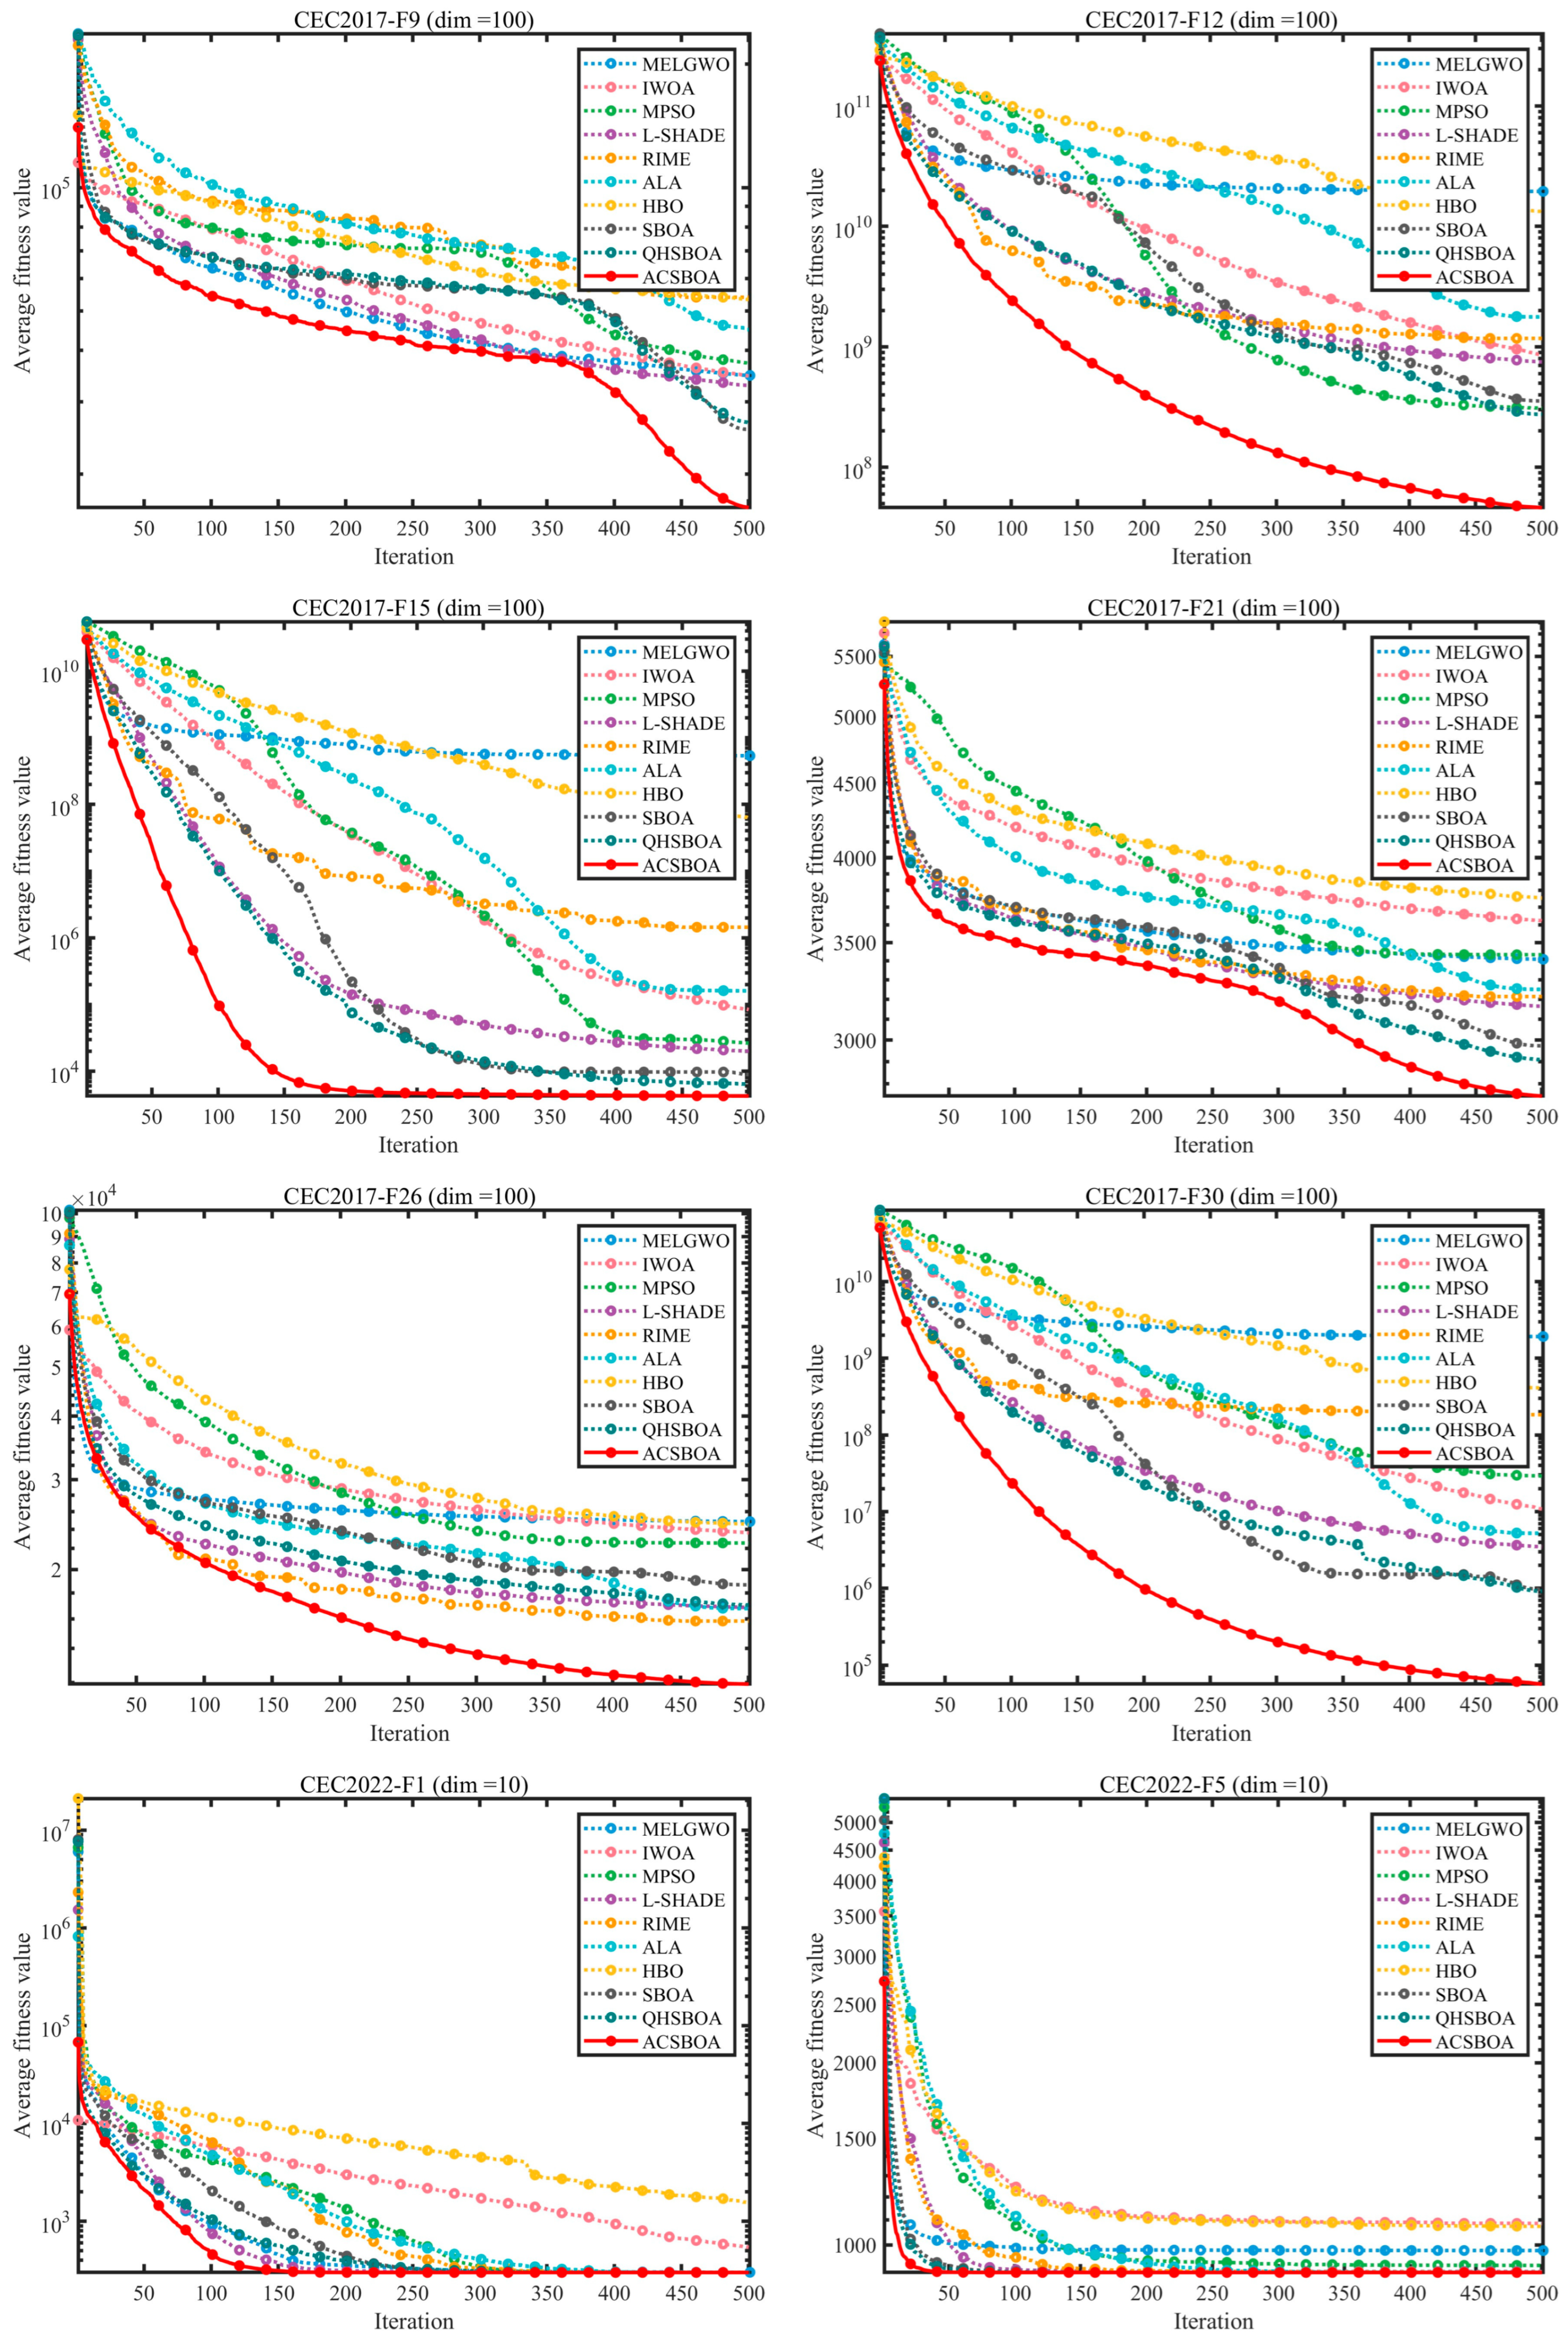
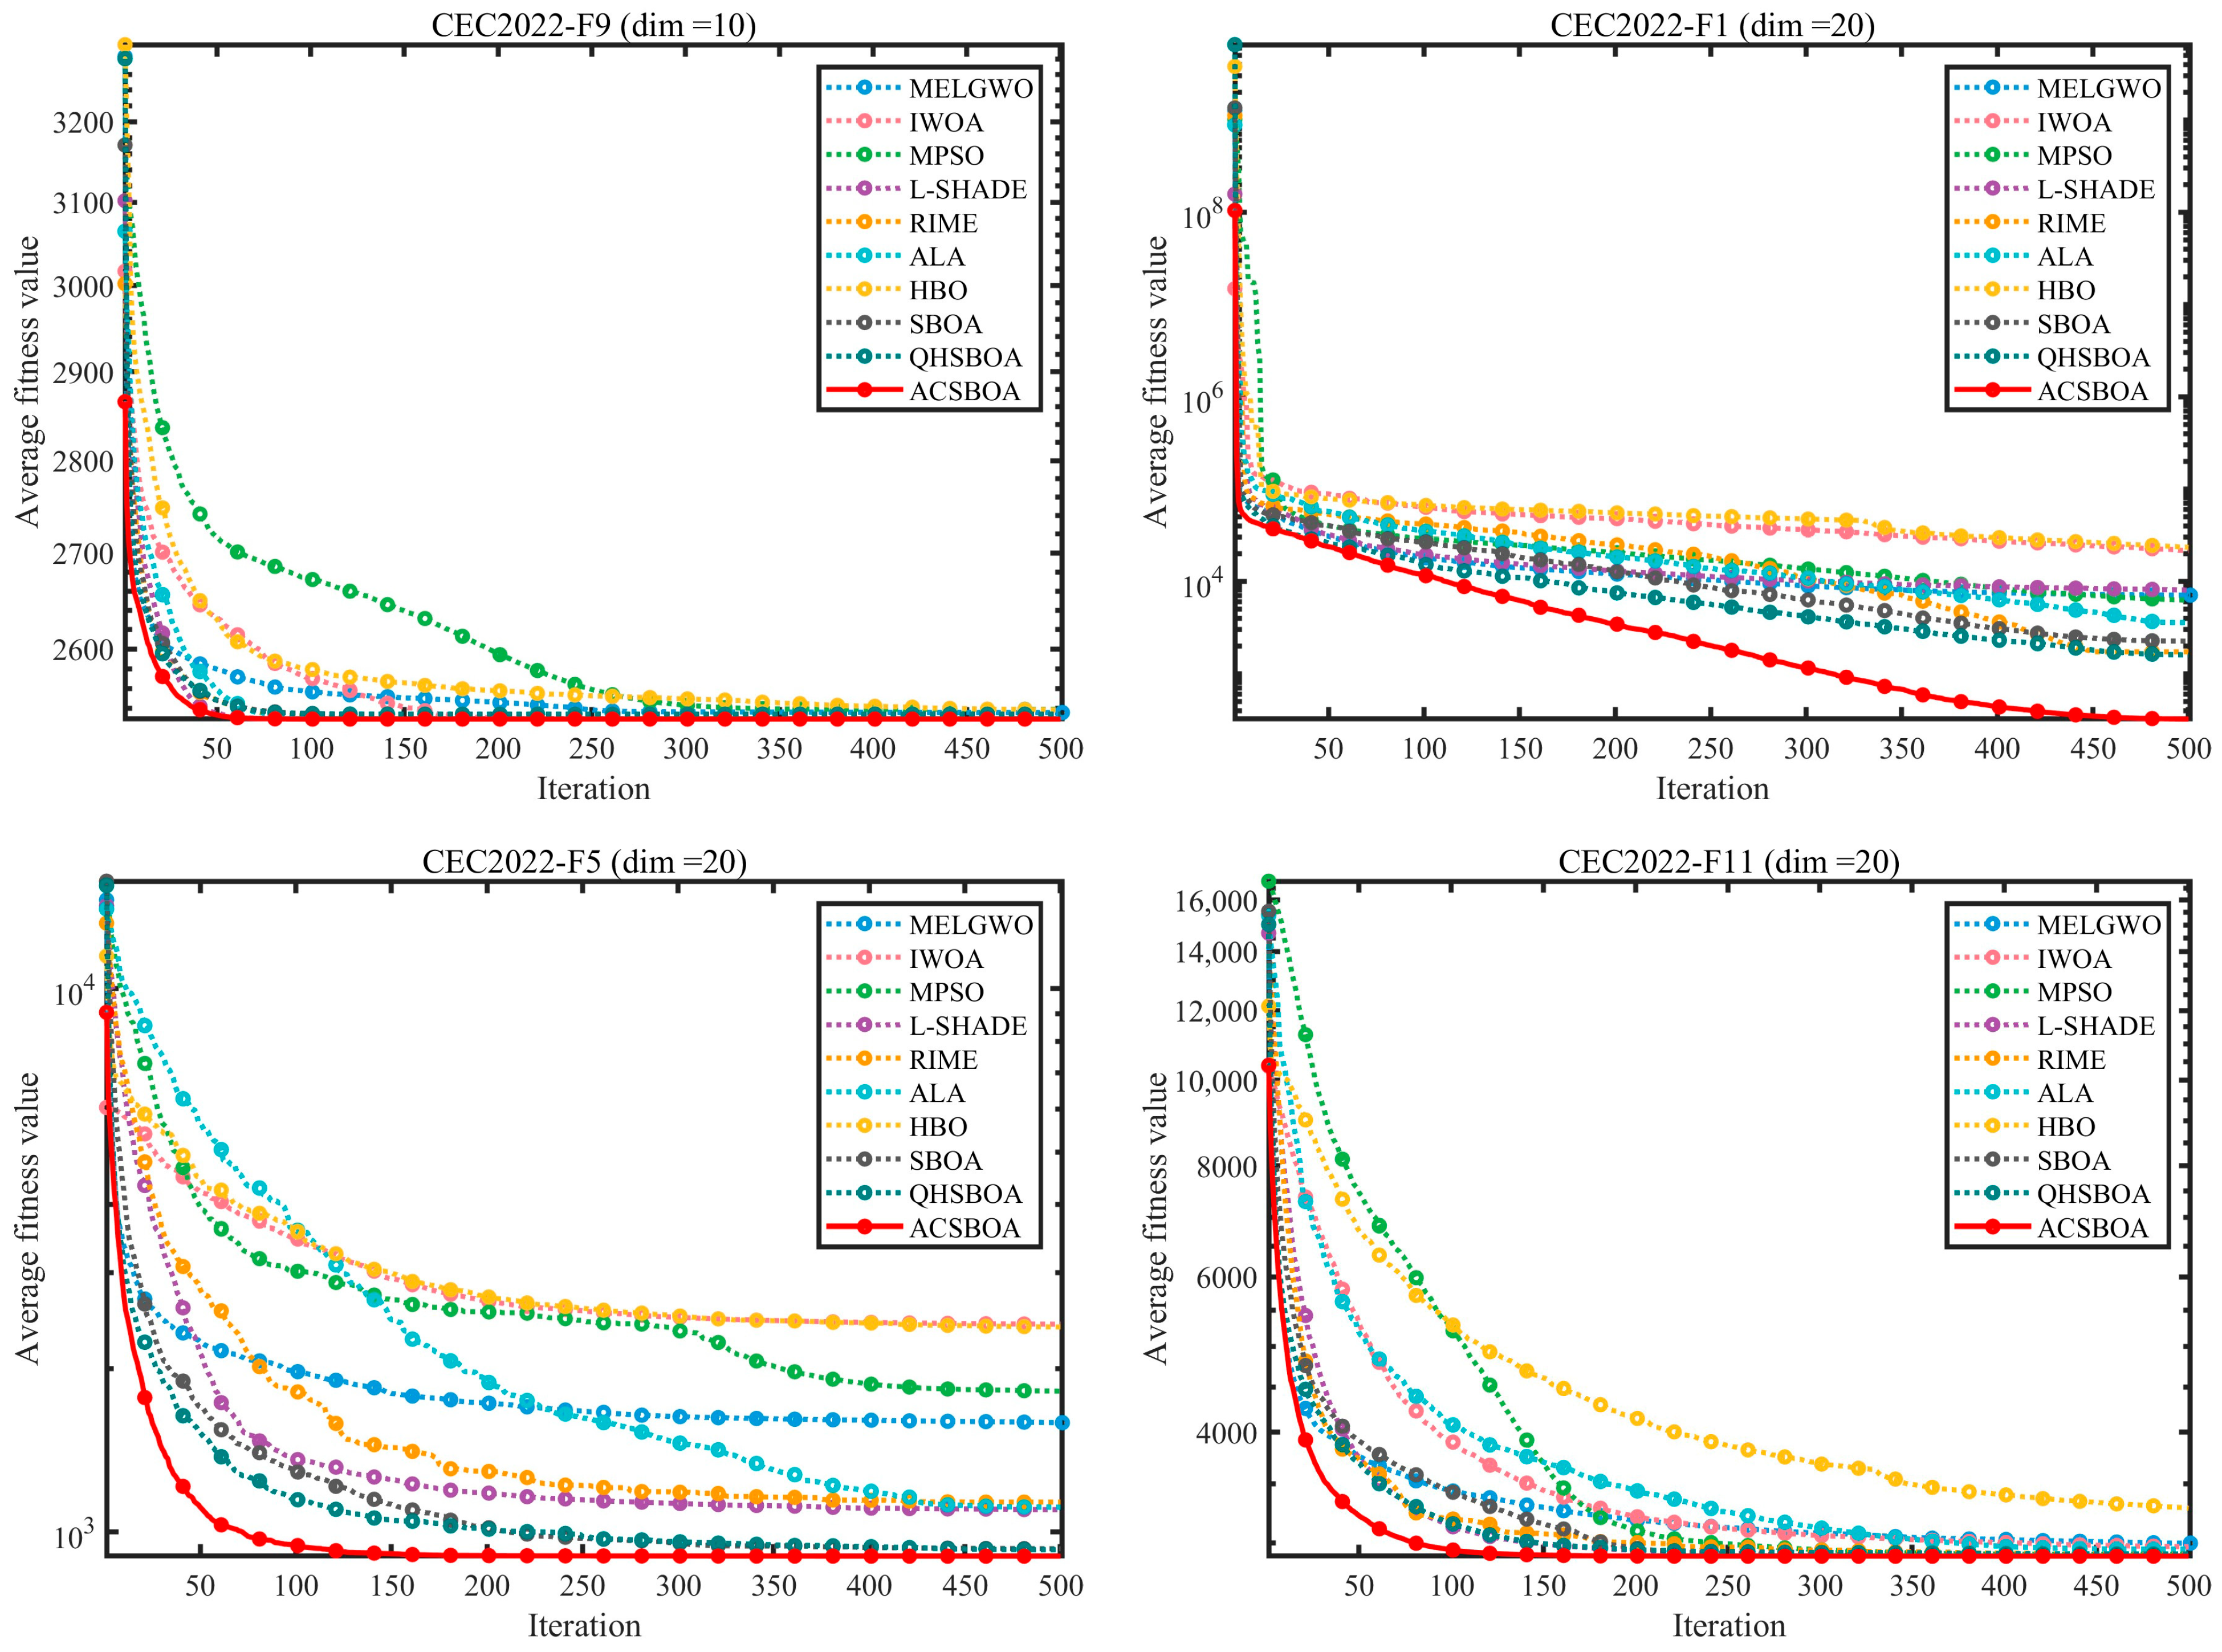
Figure 1 illustrates the convergence curves of different algorithms on selected benchmark functions. For representative CEC2017 30-dimensional functions such as F1, F5, F9, and F30, ACSBOA exhibits a rapid decline in fitness values during the early stages of optimization. In many cases, the fitness achieved by ACSBOA after only 50 iterations is already lower than that obtained by most competing algorithms after 200 iterations. Furthermore, ACSBOA continues to improve steadily during the later stages and ultimately converges to better final solutions. For example, on function F30, ACSBOA reduces the fitness value to the order of 106 after 500 iterations, whereas MELGWO and IWOA remain at the 108–109 level. This behavior indicates that the adaptive collaborative search strategy significantly enhances early-stage exploration efficiency, while the quadratic interpolation-based exploitation strategy improves late-stage refinement accuracy.
Figure 1.
Convergence speed comparison among different algorithms on the test set.
Similar convergence advantages are observed on the CEC2022 benchmark suite. For instance, on the 20-dimensional F1 and F5 functions, ACSBOA reaches a stable convergence state within approximately 100 iterations, which is 50–100 iterations earlier than most competing algorithms.
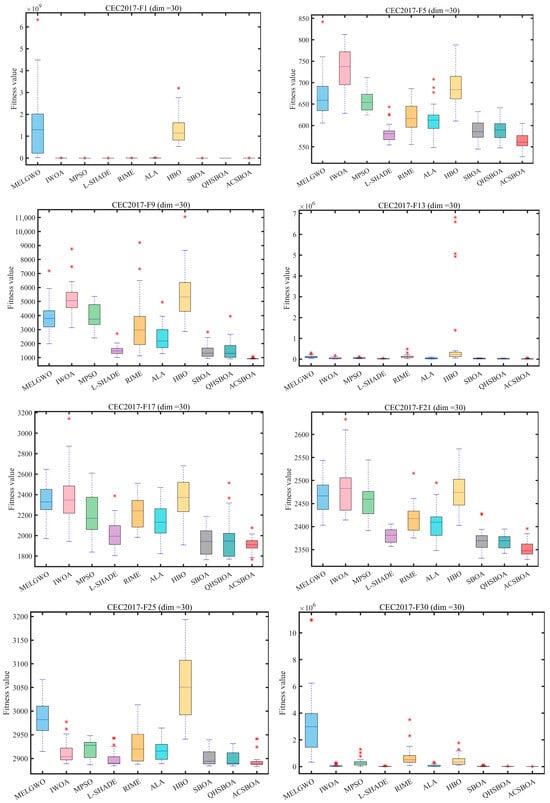
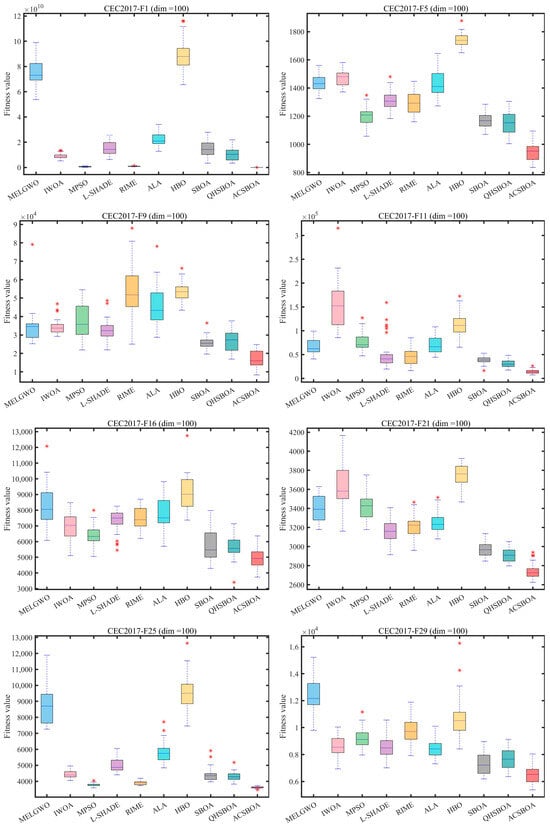
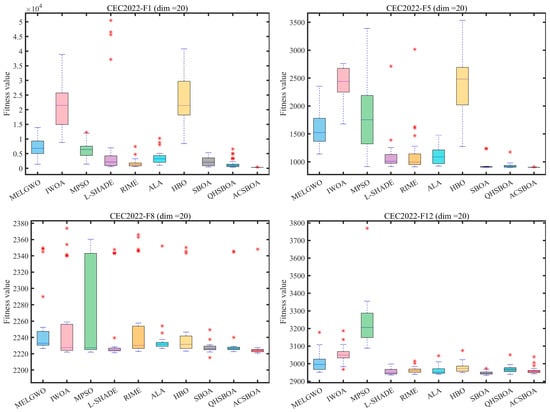
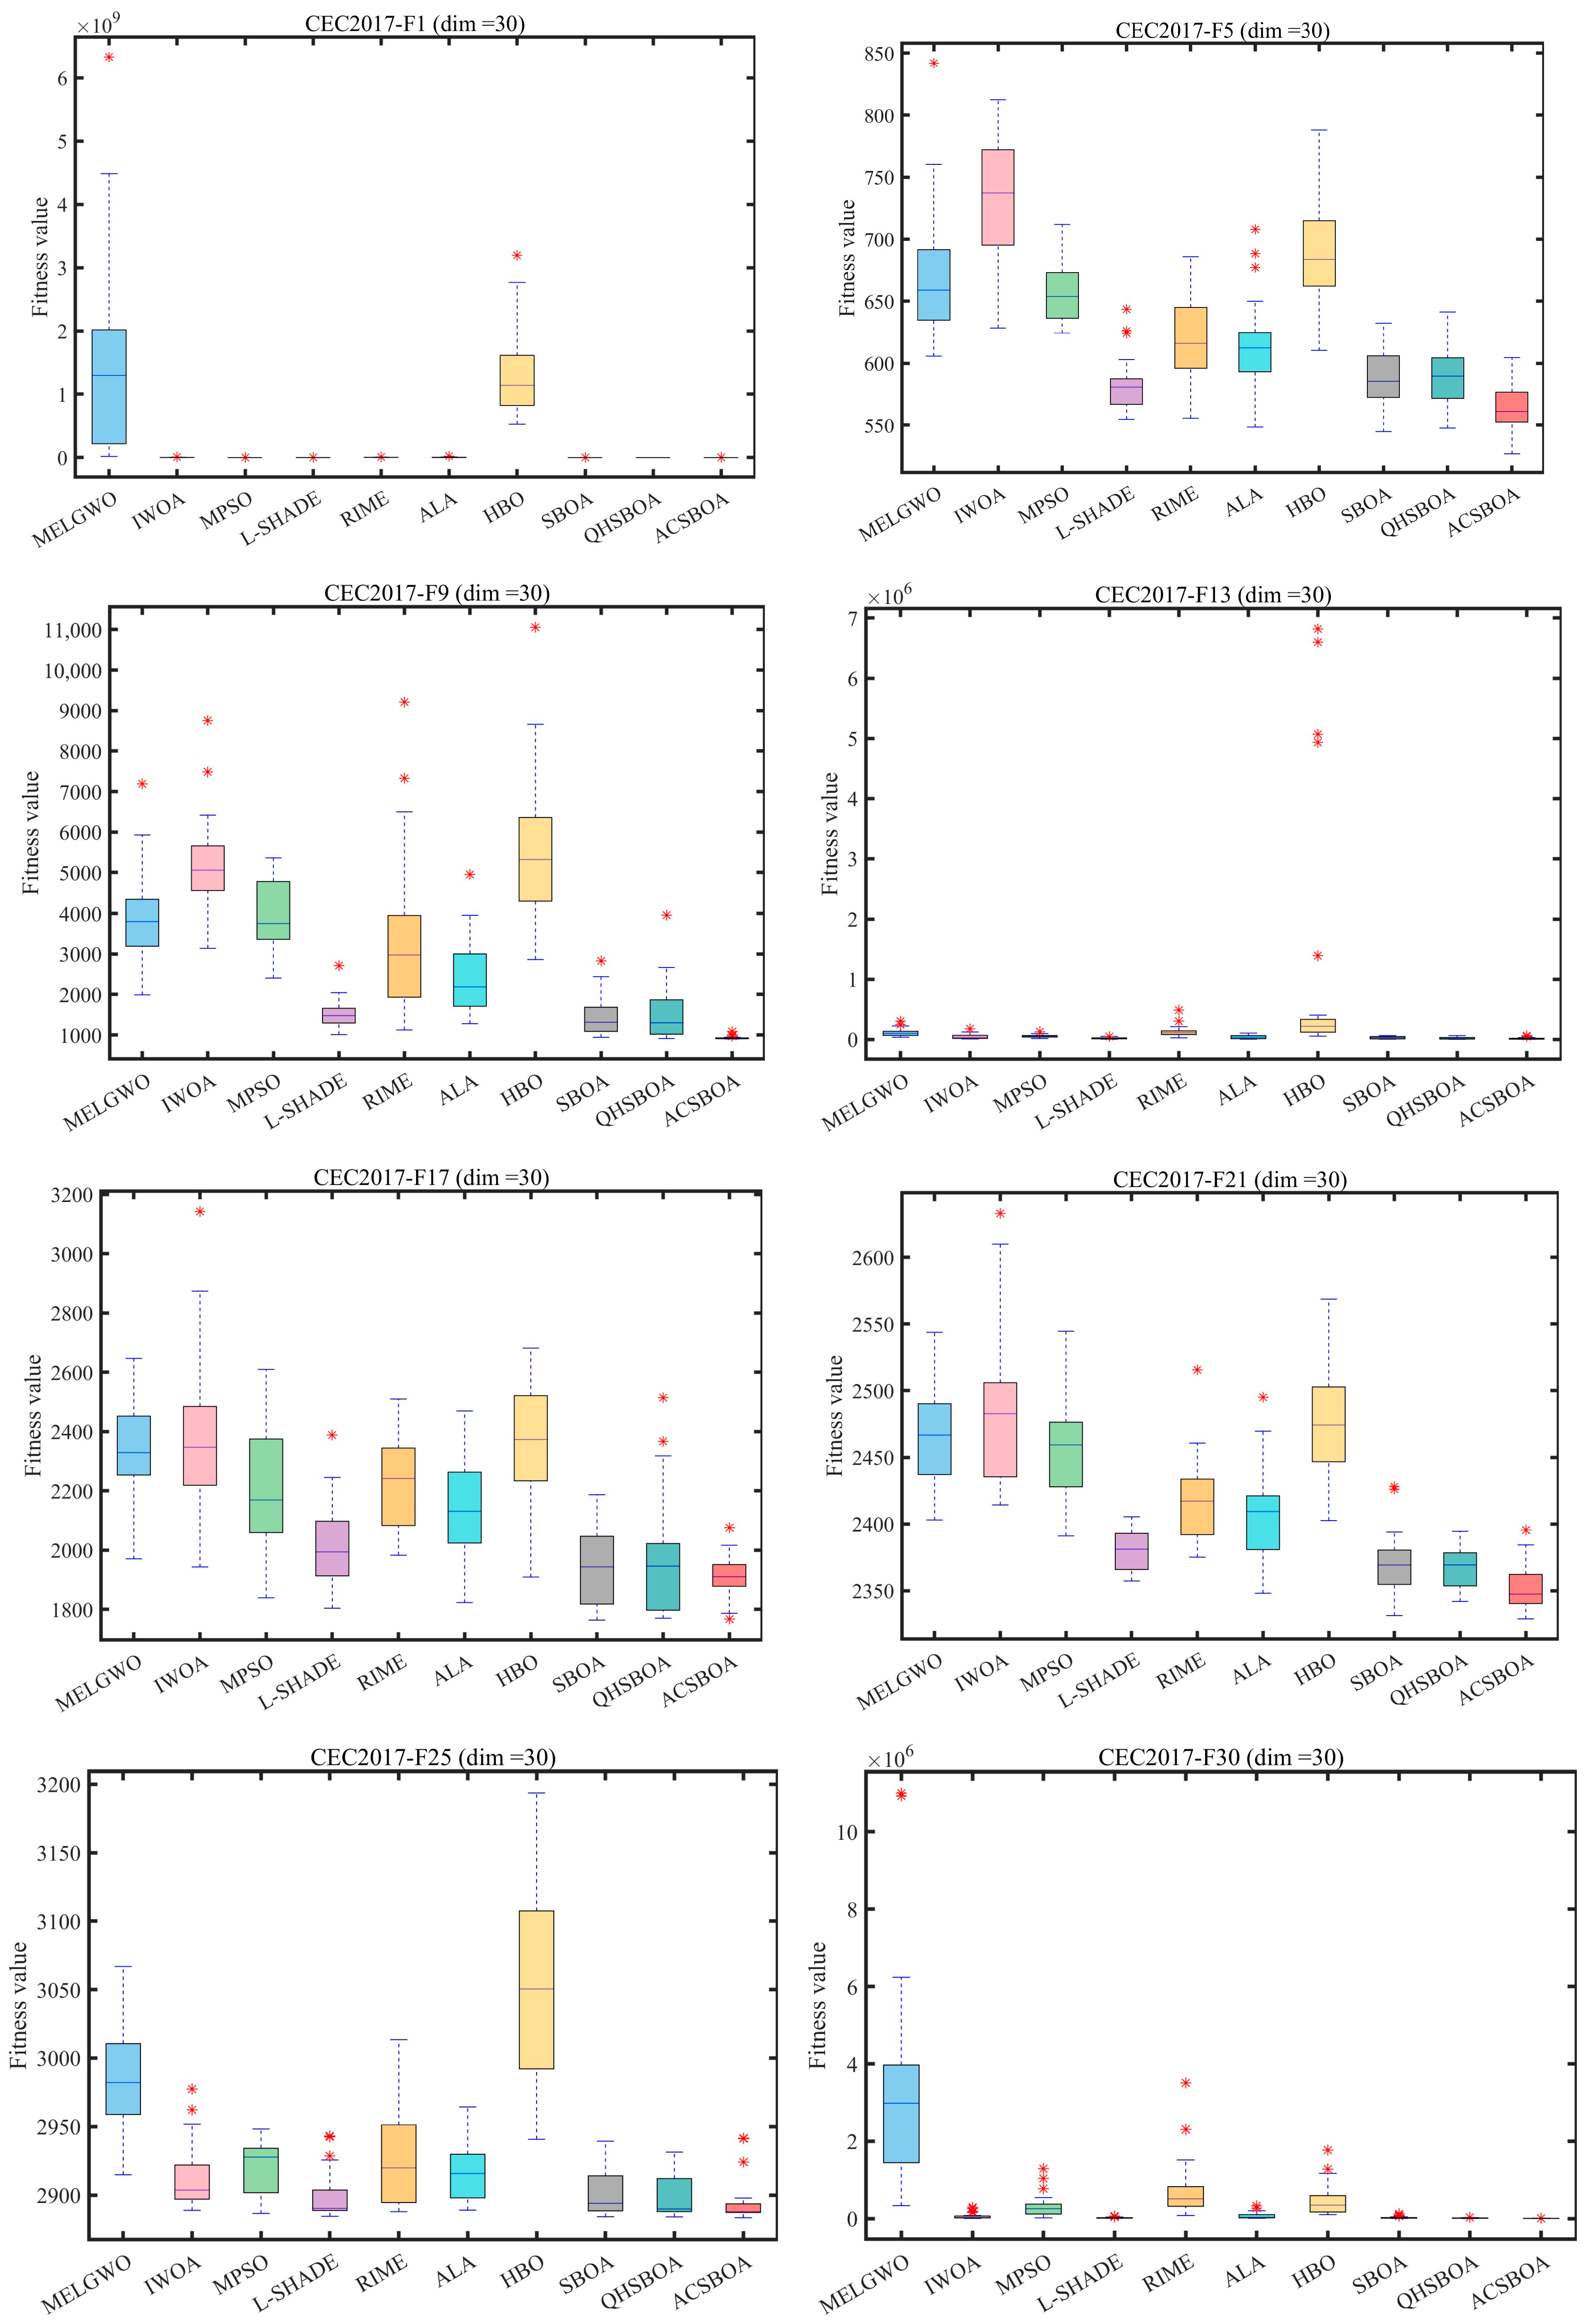
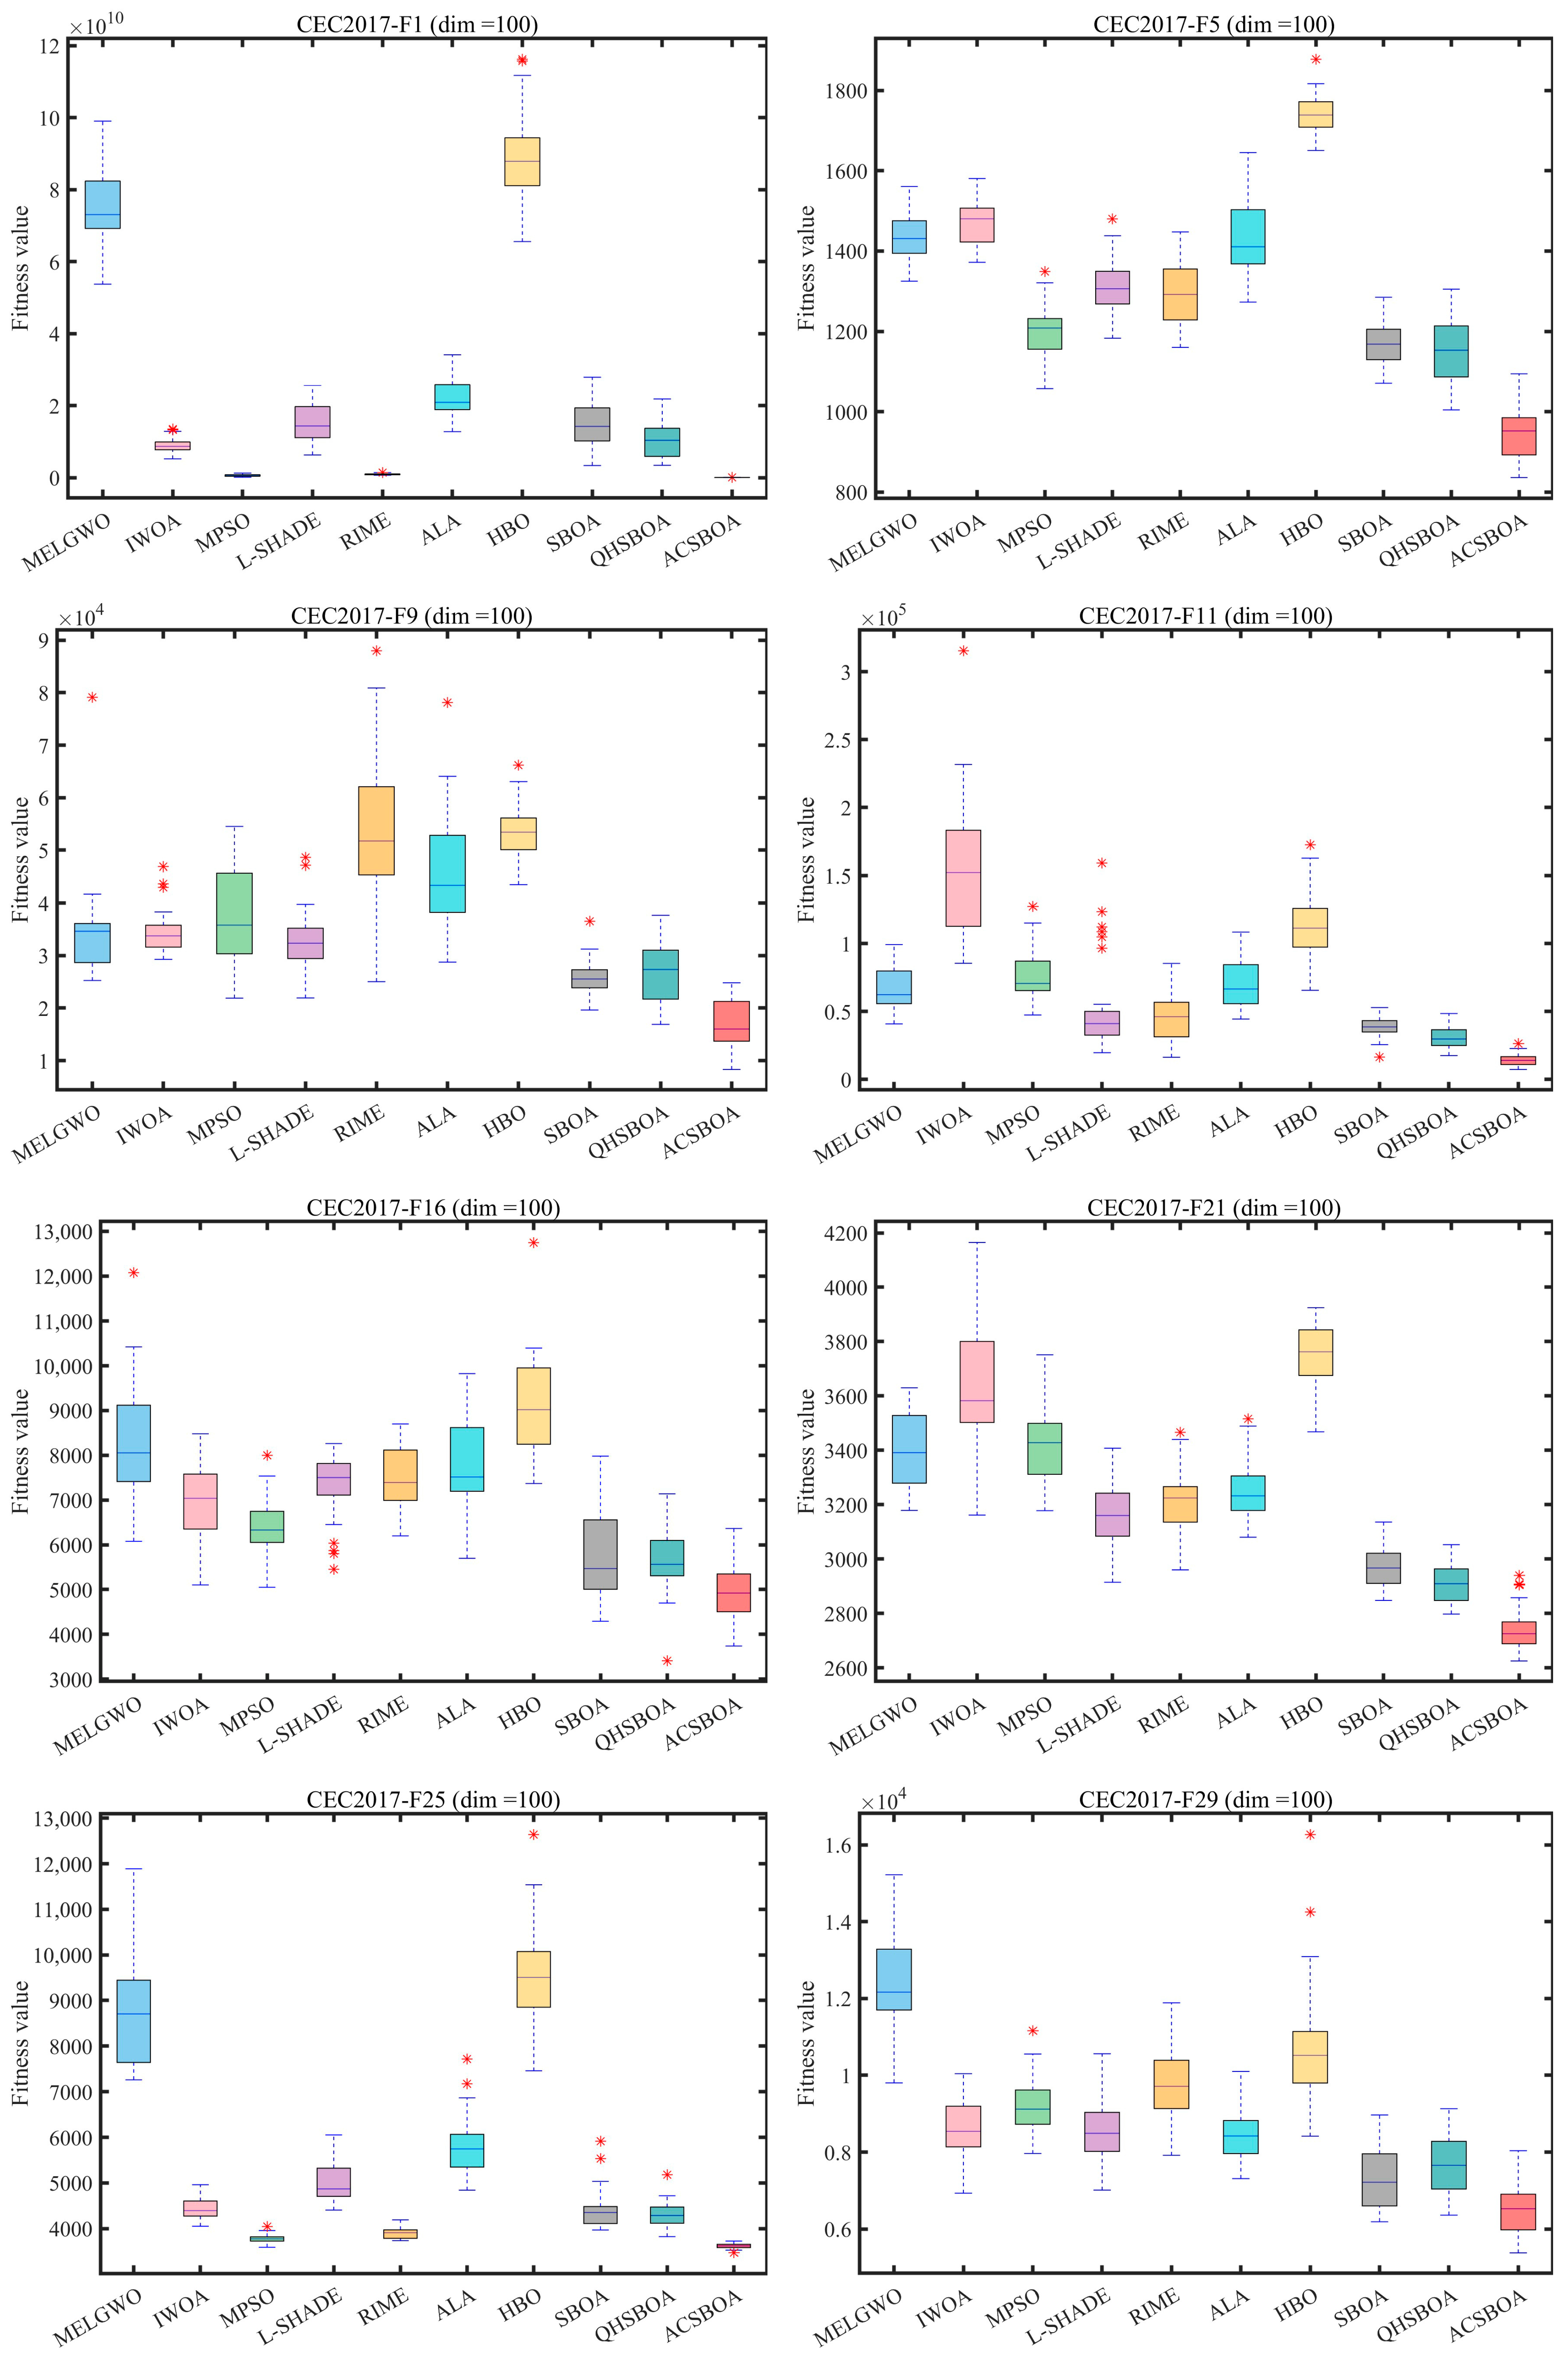
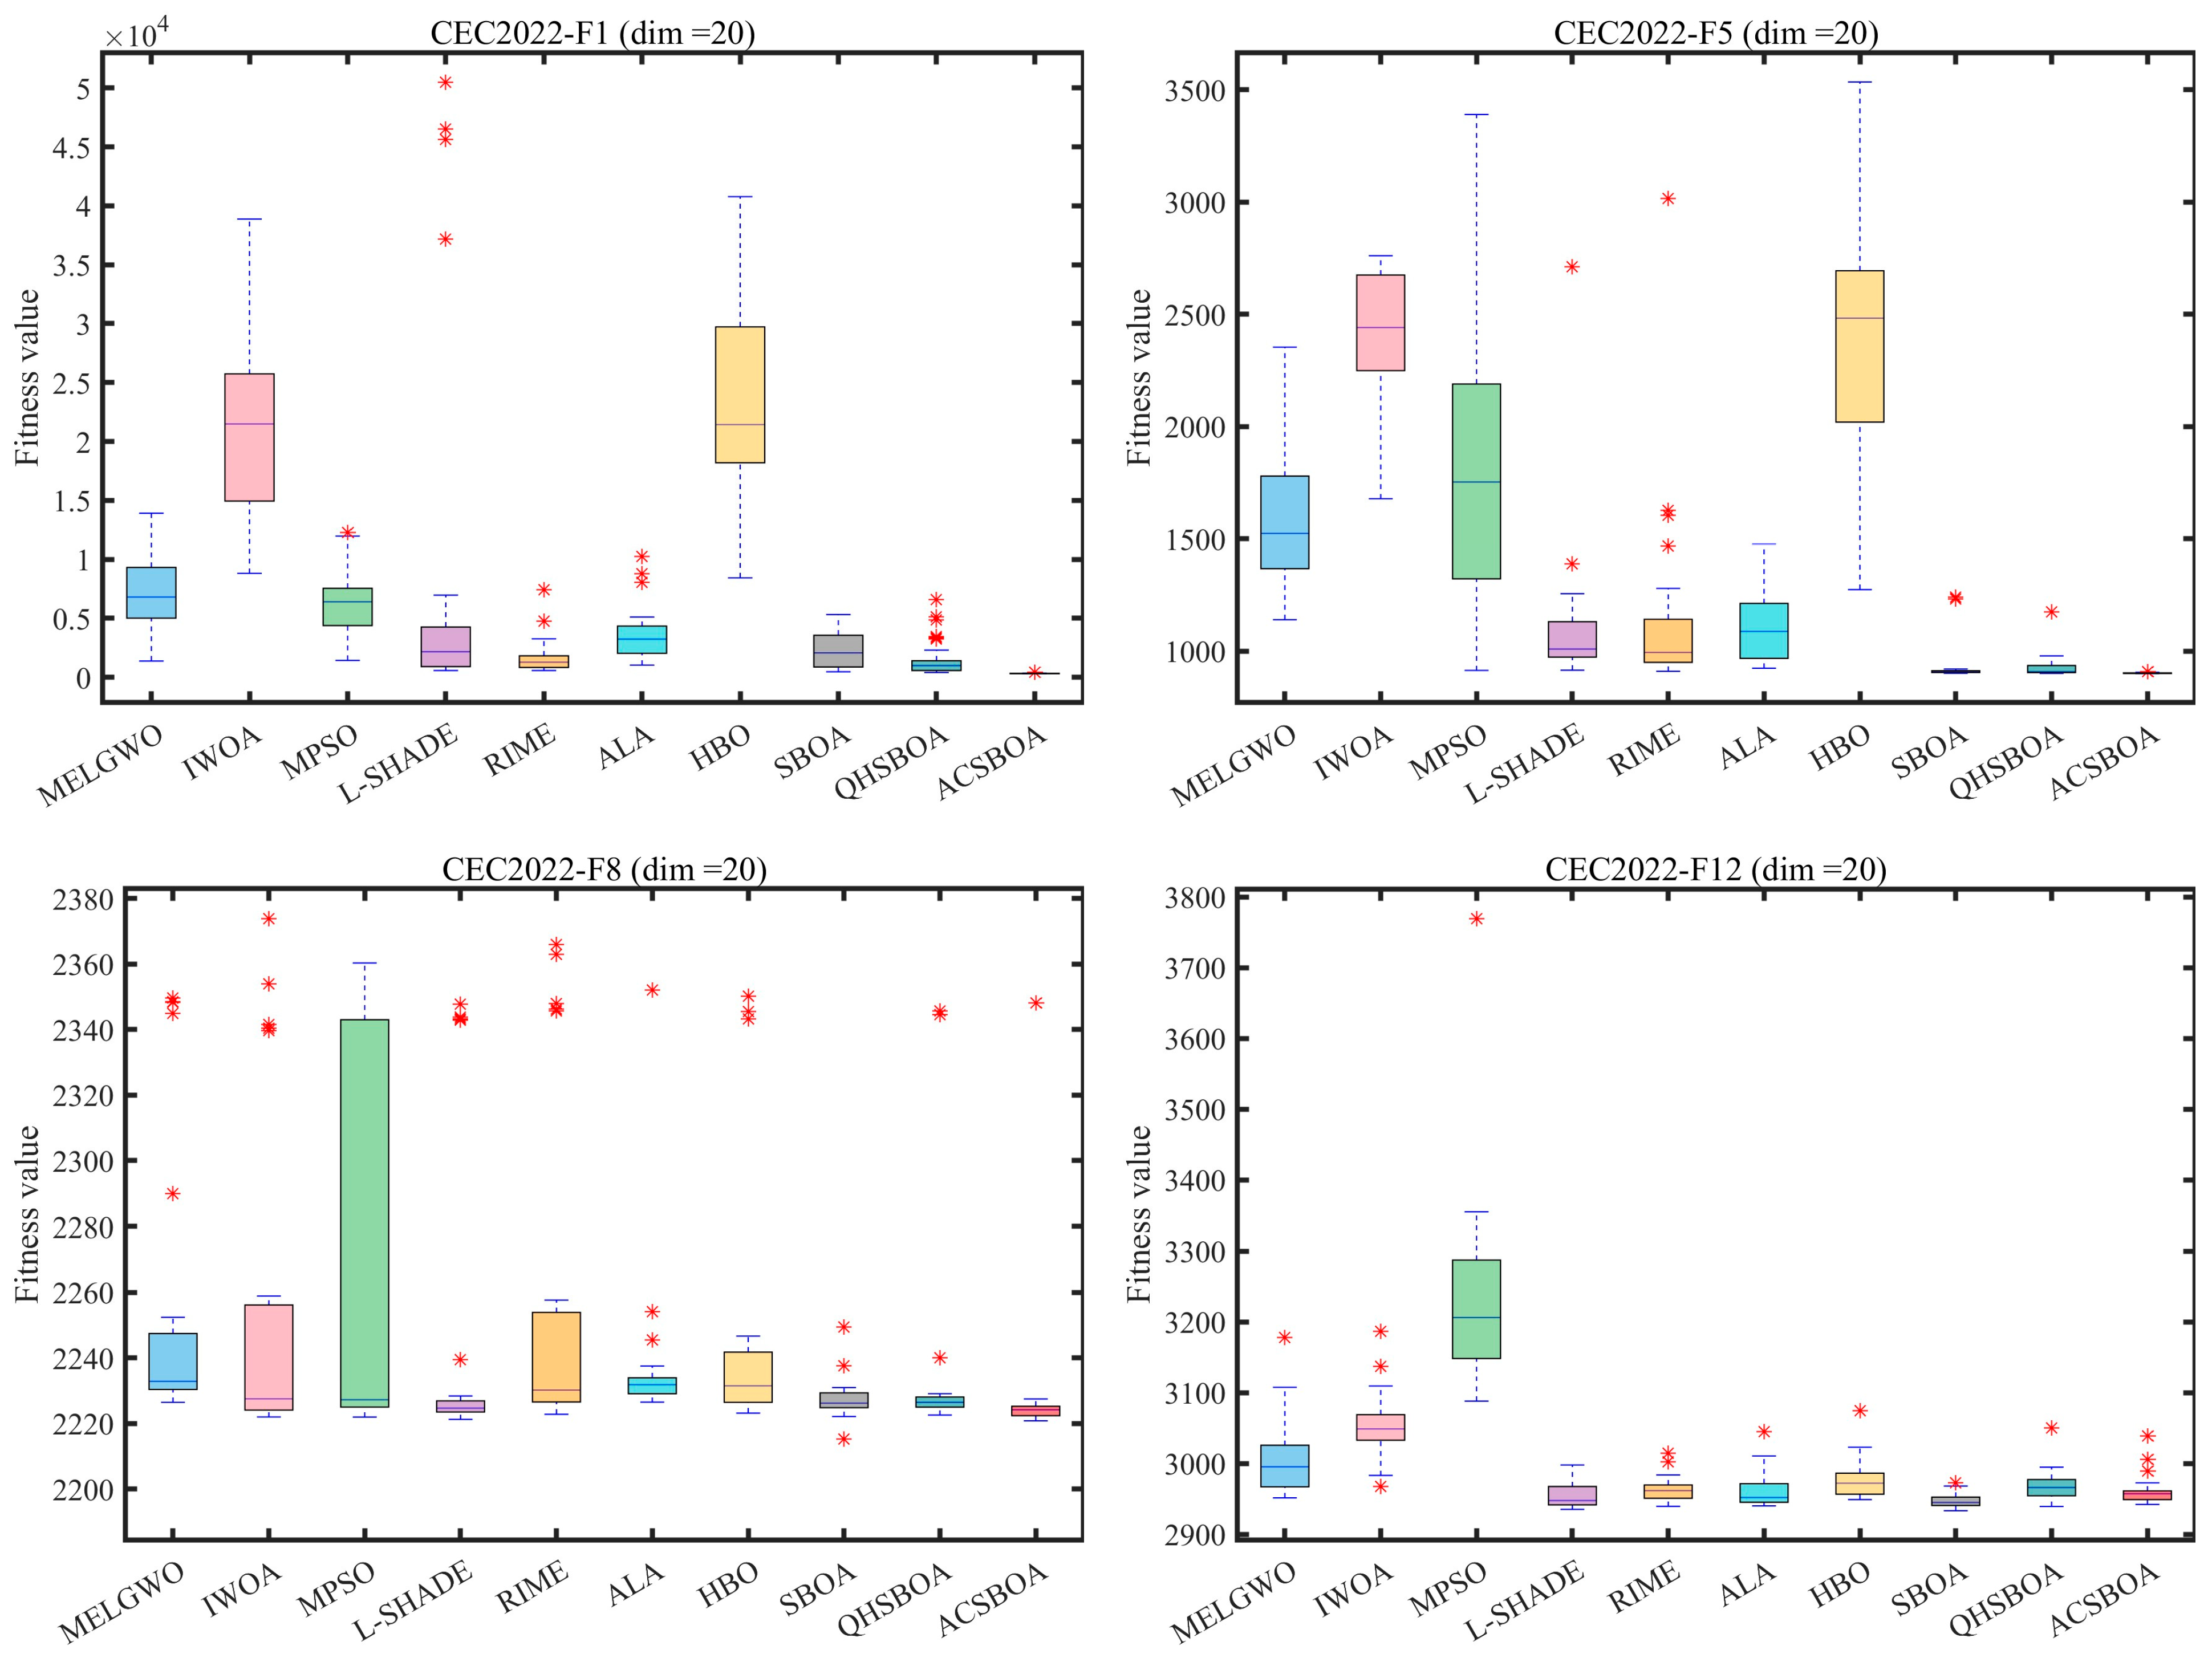
Figure 2 presents boxplot analyses of the optimization results, further illustrating algorithm robustness. For representative functions such as CEC2017 30-dimensional F13, F21, and F30, as well as CEC2022 20-dimensional F5 and F12, ACSBOA exhibits narrower interquartile ranges, lower medians, and fewer outliers compared to other algorithms. In particular, the result distribution of ACSBOA on CEC2017 30-dimensional F30 is concentrated within the range of 106–107, whereas algorithms such as MELGWO and HBO show much wider distributions spanning 107–109, along with numerous outliers. These observations confirm that ACSBOA delivers a highly stable performance across independent runs. In contrast, the wider boxplots of SBOA and QHSBOA indicate a greater sensitivity to population initialization and stochastic factors, which ACSBOA effectively mitigates through the soft boundary pullback mechanism and quadratic interpolation strategy.
Figure 2.
Boxplot-based performance comparison of different algorithms on the test set. * indicates outliers.
3.3. Computational Time Analysis
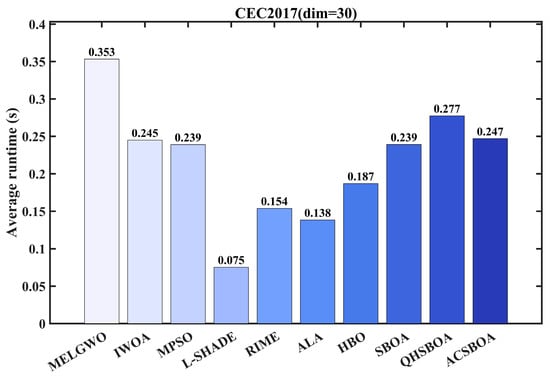
Although ACSBOA demonstrates a superior optimization performance, computational efficiency remains an important consideration. To evaluate the computational cost, experiments were conducted on the 30-dimensional CEC2017 benchmark functions. Each algorithm was independently executed 30 times, and the average runtime over all functions was recorded. The corresponding results are shown in Figure 3.
Figure 3.
Computational efficiency comparison based on average runtime.
The results indicate that ACSBOA achieves competitive computational efficiency. Compared with MELGWO, which exhibits the longest runtime (0.353 s), ACSBOA reduces computational time by approximately 30.0%. Compared with QHSBOA (0.277 s), ACSBOA achieves a reduction of about 10.8%. Moreover, the runtime of ACSBOA is nearly identical to that of the basic SBOA (0.239 s) and MPSO (0.239 s), with a negligible difference of only 0.008 s. Although some algorithms such as L-SHADE (0.075 s) and ALA (0.138 s) exhibit shorter runtimes, their optimization accuracy and convergence stability are substantially inferior to those of ACSBOA, particularly for high-dimensional and complex functions.
The relatively low computational complexity of ACSBOA can be attributed to the lightweight design of its improvement strategies. The adaptive collaborative search strategy relies primarily on vector operations and does not introduce complex iterative procedures. The quadratic interpolation strategy constructs a local model using only three key individuals, avoiding expensive population-wide computations. The soft boundary pullback mechanism involves simple random adjustments with negligible computational overhead. In contrast, MELGWO requires additional memory and local search operators, while QHSBOA introduces complex probabilistic computations associated with quantum-inspired mechanisms, both of which significantly increase runtime.
Overall, ACSBOA achieves an effective balance between optimization performance and computational efficiency. While some algorithms prioritize speed at the expense of solution quality, and others achieve good accuracy at a high computational cost, ACSBOA demonstrates a strong performance across all three dimensions—solution accuracy, convergence speed, and computational efficiency—making it particularly suitable for practical engineering applications such as microgrid scheduling.
3.4. Statistical Analysis
Statistical analysis provides a rigorous framework for evaluating and comparing optimization algorithms. In this subsection, the performance of ACSBOA is further assessed using the Wilcoxon rank-sum test and the Friedman Mean Rank Test to verify the statistical significance of the observed performance differences.
3.4.1. Effectiveness Analysis
The overall effectiveness of ACSBOA relative to the competing algorithms is quantified using Equation (13). Let denote the total number of test functions, the number of functions for which ACSBOA outperforms a competitor, the number of ties, and the number of functions for which ACSBOA performs worse [45]. Table 6 summarizes the win–tie–loss (W/T/L) statistics of ACSBOA against nine competing algorithms across different benchmark suites and dimensional settings.
Table 6.
Effectiveness of the ACSBOA and other competitor algorithms.
On the CEC2017 test suite (30 dimensions), in the competition between ACSBOA and the comparison algorithms, ACSBOA performs better in 241 out of 241 pairwise comparisons, performs worse in 29 cases, and shows no ties, resulting in an overall effectiveness of 72.22%. Specifically, its effectiveness against GWO and AOO reaches 100% (30/0/0), while against RIME it achieves 96.67% (29/0/1). Even when compared with the strong competitor QHSBOA, ACSBOA still attains an effectiveness of 100% (20/0/0). Although its effectiveness against SBOA is relatively lower at 76.67% (23/0/7), ACSBOA still maintains a clear advantage. These results indicate that, in medium-dimensional scenarios, the multi-strategy cooperative mechanism of ACSBOA is already capable of effectively handling optimization demands across various complex functions.
When the dimensionality is increased to 100 (CEC2017), the effectiveness of ACSBOA rises to 86.11%, with ACSBOA outperforming in 263 out of 263 pairwise comparisons and being inferior in only 7 cases. At this stage, its effectiveness against GWO, AOO, and SBOA reaches 100% (30/0/0), while its effectiveness against QHSBOA and HSO also attains 96.67% (29/0/1), representing a comprehensive improvement over the 30-dimensional scenario. This change confirms that the adaptive cooperative search and soft boundary pullback mechanisms of ACSBOA exhibit pronounced advantages in high-dimensional spaces, whereas traditional algorithms suffer severe performance degradation due to the curse of dimensionality, which further amplifies the competitiveness of ACSBOA.
On the CEC2022 test suite (10 dimensions), ACSBOA achieves an effectiveness of 89.26%, outperforming in 78 out of 78 pairwise comparisons and underperforming in 30 cases. Its effectiveness against RIME reaches 91.67% (11/0/1), and against GWO, AOO, and HSO it is 75% (9/0/3). Although, in low-dimensional scenarios, some algorithms (such as L-SHADE) can still maintain a certain level of competitiveness, ACSBOA nevertheless ranks first, with a clear overall advantage. When the dimensionality is increased to 20 (CEC2022), the effectiveness of ACSBOA reaches its peak at 97.41%, with 93 out of 93 cases showing superiority and only 15 cases showing inferiority. In particular, its effectiveness against RIME reaches 100% (12/0/0), while against GWO, WOA, PSO, AOO, and HSO it achieves 91.67% (11/0/1), demonstrating an extremely strong adaptability in low- and medium-dimensional complex function optimization.
Overall, the effectiveness of ACSBOA exhibits an evolutionary pattern of “leading in low dimensions—strengthening in medium dimensions—peaking in high dimensions.” This pattern is highly consistent with the design of the algorithm’s improvement strategies. In low-dimensional scenarios, the quadratic interpolation-based local exploitation strategy ensures a high solution accuracy; in medium-dimensional scenarios, the adaptive cooperative search strategy effectively balances exploration and exploitation; and, in high-dimensional scenarios, the synergistic interaction of the three major strategies fundamentally alleviates the curse of dimensionality that constrains traditional algorithms. Among the comparison algorithms, QHSBOA and L-SHADE show a reasonable performance for specific dimensions or functions, but lack full-dimensional adaptive optimization capability, leading to significant fluctuations in effectiveness as dimensionality changes. In contrast, ACSBOA achieves an efficient optimization across different dimensions and function types through multi-strategy cooperation, maintaining consistently superior effectiveness.
3.4.2. Friedman Mean Rank Test
This subsection employs the Friedman statistical test to assess the comprehensive ranking performance of the ACSBOA in comparison with competing approaches. The Friedman test is a distribution-free technique designed to identify differences in median outcomes among three or more dependent samples. It is particularly suitable for blocked experiments or repeated observations, and it provides a reliable alternative to classical ANOVA when the assumption of normality is violated.
The Friedman test statistic is computed according to Equation [46]:
where denotes the number of blocks, represents the number of compared methods, and is the cumulative rank assigned to the -th method. For sufficiently large values of and , the statistic approximately follows a chi-square distribution with degrees of freedom.
Table 7 quantifies, from a statistical perspective, the overall performance ranking of ACSBOA and nine comparison algorithms under different test suites and dimensional settings using the Friedman Mean Rank Test. The results are reported in terms of both the mean rank (M.R) and the total rank (T.R), providing an intuitive reflection of the global optimization capability of each algorithm.
Table 7.
Mean rank outcomes of the Friedman statistical test.
From the perspective of dimensional distribution across test suites, ACSBOA achieves the lowest mean rank and the first total rank in all scenarios, with its advantage becoming increasingly pronounced as dimensionality increases. In the 30-dimensional scenario of the CEC2017 test suite, ACSBOA attains a mean rank of only 1.30, which is far lower than that of the second-ranked QHSBOA (2.97) and the third-ranked SBOA (3.17), representing a 56.2% reduction compared with QHSBOA, the best-performing comparison algorithm. Its total rank remains stably in first place, with a clear gap relative to the other algorithms. When the dimensionality is increased to 100 (CEC2017), the mean rank of ACSBOA further decreases to 1.13, improving by 13.1% compared with the 30-dimensional scenario. In contrast, the mean ranks of most comparison algorithms increase—HBO rises from 8.50 to 9.30, MELGWO from 8.43 to 8.07, and IWOA from 8.13 to 7.47. Only QHSBOA (3.13) and SBOA (3.67) remain relatively stable, yet they are still significantly higher than ACSBOA, indicating that the overall performance advantage of ACSBOA is further amplified in high-dimensional search spaces.
In the low-dimensional (10-dimensional) scenario of the CEC2022 test suite, ACSBOA achieves a mean rank of 2.25. Although this value is higher than that in the high-dimensional CEC2017 scenario, ACSBOA still ranks first, with a clear advantage. The second-ranked L-SHADE has a mean rank of 3.17, which is 40.9% higher than that of ACSBOA, while the third-ranked SBOA (3.33) and the fourth-ranked ALA (4.33) exhibit even larger gaps. When the dimensionality increases to 20 (CEC2022), the mean rank of ACSBOA improves to 1.75, representing a 22.2% reduction compared with the 10-dimensional scenario. Among the comparison algorithms, only L-SHADE (2.75) maintains relatively strong competitiveness, whereas others such as HBO (8.42), MELGWO (8.25), and IWOA (7.92) show increases in the mean rank. This again verifies the stability and adaptability of ACSBOA as dimensionality increases.
From an inter-algorithm comparison perspective, traditional optimization algorithms such as MELGWO, IWOA, and HBO consistently occupy lower-ranking positions across all scenarios, with mean ranks generally above 7.0 and continuing to decline as dimensionality increases. This indicates a lack of effective balance between exploration and exploitation when dealing with complex optimization problems. Improved algorithms such as QHSBOA, SBOA, and L-SHADE exhibit a reasonable performance in specific scenarios (e.g., L-SHADE achieves a mean rank of 2.75 in the 20-dimensional CEC2022 scenario), but their rankings deteriorate noticeably in high-dimensional settings (CEC2017 100 dimensions), making it difficult to maintain a consistent performance across all dimensionalities. In contrast, ACSBOA, benefiting from the synergistic integration of the adaptive cooperative search, quadratic interpolation-based local exploitation, and soft boundary pullback strategies, consistently maintains the best ranking in low-, medium-, and high-dimensional scenarios. Moreover, its mean rank fluctuates only within a narrow range of 1.13~2.25, demonstrating a strong statistically significant advantage.
A further analysis of the total rank distribution shows that ACSBOA consistently ranks first in all eight test scenarios (CEC2017 30 dimensions/100 dimensions and CEC2022 10 dimensions/20 dimensions, each including mean rank and total rank indicators). Among the comparison algorithms, none achieves a top-three position in two or more scenarios. This fully confirms that ACSBOA possesses a statistically significant advantage in comprehensive optimization performance. Its multi-strategy cooperative mechanism effectively addresses complex optimization problems across different dimensionalities and function types, making it a robust and highly adaptable optimization algorithm.
4. Microgrid Optimal Scheduling
4.1. Overall Framework for Optimal Operation of the Microgrid
This work investigates the optimal operational scheduling of a grid-connected microgrid over a representative 24 h dispatch horizon. The considered microgrid architecture integrates diverse distributed energy resources (DERs), including renewable generation units, dispatchable conventional generators, energy storage facilities, and bidirectional power exchange with the main utility grid. The system configuration is designed to closely reflect practical engineering applications and realistic operational constraints [6,47].
The microgrid framework is composed of the following main subsystems:
- Stochastic renewable generation units: Photovoltaic (PV) arrays and wind turbine (WT) generators are incorporated as renewable energy sources. Their power outputs are inherently intermittent and are characterized using forecasted typical-day generation profiles.
- Dispatchable conventional generation resources: Fuel cells (FCs), micro gas turbines (MTs), and gas supply generators (GSs) are modeled as controllable power sources. Their output levels can be flexibly adjusted within predefined operating limits to satisfy system demand requirements.
- Energy storage system: A battery-based energy storage unit is employed to mitigate power fluctuations, facilitate peak-load shifting, and enhance the operational stability and reliability of the microgrid.
- Utility grid interface: The microgrid is interconnected with the main grid, enabling both electricity purchasing and selling. Power exchange is subject to predefined capacity constraints to ensure safe and stable grid operation.
Table 8.
Key parameters of distributed generation units in the microgrid.
Table 9.
Detailed specifications of microgrid components.
4.2. Mathematical Representation of Distributed Energy Resources
- (1)
- Renewable Generation Modeling
The power outputs of PV and WT units are predominantly influenced by meteorological conditions. In this study, their outputs are treated as known inputs derived from typical-day forecasts and are therefore excluded from the optimization decision variables. The renewable generation models are formulated as follows [7,47]:
where denotes the scheduling time interval. Variables and represent the actual power outputs of photovoltaic and wind units, respectively, while their forecasted counterparts are denoted by and .
- (2)
- Dispatchable Generation Unit Modeling
Fuel cells, micro gas turbines, and gas generators are treated as controllable generation units. Their power outputs can be regulated according to system operating requirements while remaining within predefined minimum and maximum output limits. These constraints are expressed as follows [47]:
where , and denote the output powers of the respective units at time .
- (3)
- Energy Storage System Modeling
The battery energy storage system is characterized by both power constraints and state-of-charge (SOC) limitations. The permissible charging and discharging power range is defined as follows [47]:
where represents the battery power at time , with positive values corresponding to charging and negative values indicating discharging.
The SOC evolution and safety constraints are given by
where denotes the battery state of charge, is the rated storage capacity, and SOC values must remain within prescribed safety limits throughout the scheduling horizon.
- (4)
- Utility Grid Interaction Modeling
The microgrid is allowed to exchange power with the main grid in both directions. This interaction is subject to capacity limits and is modeled as follows [47]:
where denotes the exchanged power at time . Positive values indicate electricity purchase from the grid, while negative values represent electricity sales.
4.3. Objective Function Formulation
The primary objective of the microgrid scheduling problem is to minimize the total operational cost over the considered scheduling horizon. The comprehensive cost function consists of multiple components, including fuel consumption costs, operation and maintenance costs, environmental emission treatment costs, electricity trading costs with the main grid, and a penalty term associated with power imbalance. Accordingly, the objective function is defined as follows [47]:
Each cost component is detailed as follows.
- (1)
- Fuel Consumption Cost
Fuel costs arise from the operation of FC, MT, and GS units and depend on their output power levels, fuel consumption coefficients, and the prevailing natural gas price. The fuel cost is calculated as follows [47]:
where represents the natural gas price and denote the fuel consumption coefficients of each conventional unit.
- (2)
- Operation and Maintenance Cost
The operation and maintenance (O&M) cost accounts for routine operational expenses associated with all DERs, including renewable generators and the battery system. This cost component is expressed as follows [47]:
where absolute values are employed to account for both charging and discharging processes of the battery system.
- (3)
- Emission Treatment Cost
To quantify the environmental impact of pollutant emissions, a treatment cost is introduced for major pollutants, such as CO2, SO2, and NOx, produced by conventional generators and grid electricity usage. The emission-related cost is formulated as follows [47]:
where and denote the treatment cost coefficient and emission factor of pollutant p, respectively.
- (4)
- Grid Power Trading Cost
The cost associated with electricity transactions between the microgrid and the utility grid is determined by time-varying electricity prices and the direction of power flow. This cost is calculated as follows [47]:
where and denote the sets of time intervals corresponding to electricity purchasing and selling, respectively.
- (5)
- Power Imbalance Penalty
To enforce power balance constraints, a penalty term is incorporated to penalize deviations between the total power supply and load demand. This penalty is defined as follows [47]:
The inclusion of this term ensures that feasible solutions satisfy power balance requirements at all scheduling intervals.
4.4. Operational Constraints
At each scheduling interval, the total power supplied by all DERs and grid interaction must meet the load demand, which is expressed as follows [47]:
Additionally, all generation units and energy storage systems must operate within their respective technical limits:
Furthermore, the SOC constraints defined in Section 4.2 must be strictly satisfied throughout the entire scheduling horizon.
In the microgrid scheduling optimization, all system constraints are strictly enforced at every iteration.
4.5. Results and Analysis of Microgrid Dispatch Experiment
The grid-connected microgrid scheduling optimization problem was implemented in MATLAB. To ensure a fair comparison, all optimization algorithms were configured with a population size of 30 and a maximum of 1000 iterations. To reduce the impact of randomness, each algorithm was independently executed 30 times. The maximum allowable power exchange between the microgrid and the main grid was set to 200 kW. The simulation scenario was based on a typical operating day in the Guangdong Province. The experimental results are presented in Table 10 and Figure 4 and Figure 5.
Table 10.
Statistical comparison of operating costs achieved by different optimization methods.
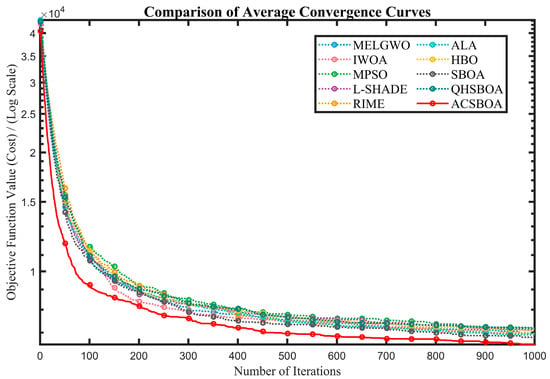
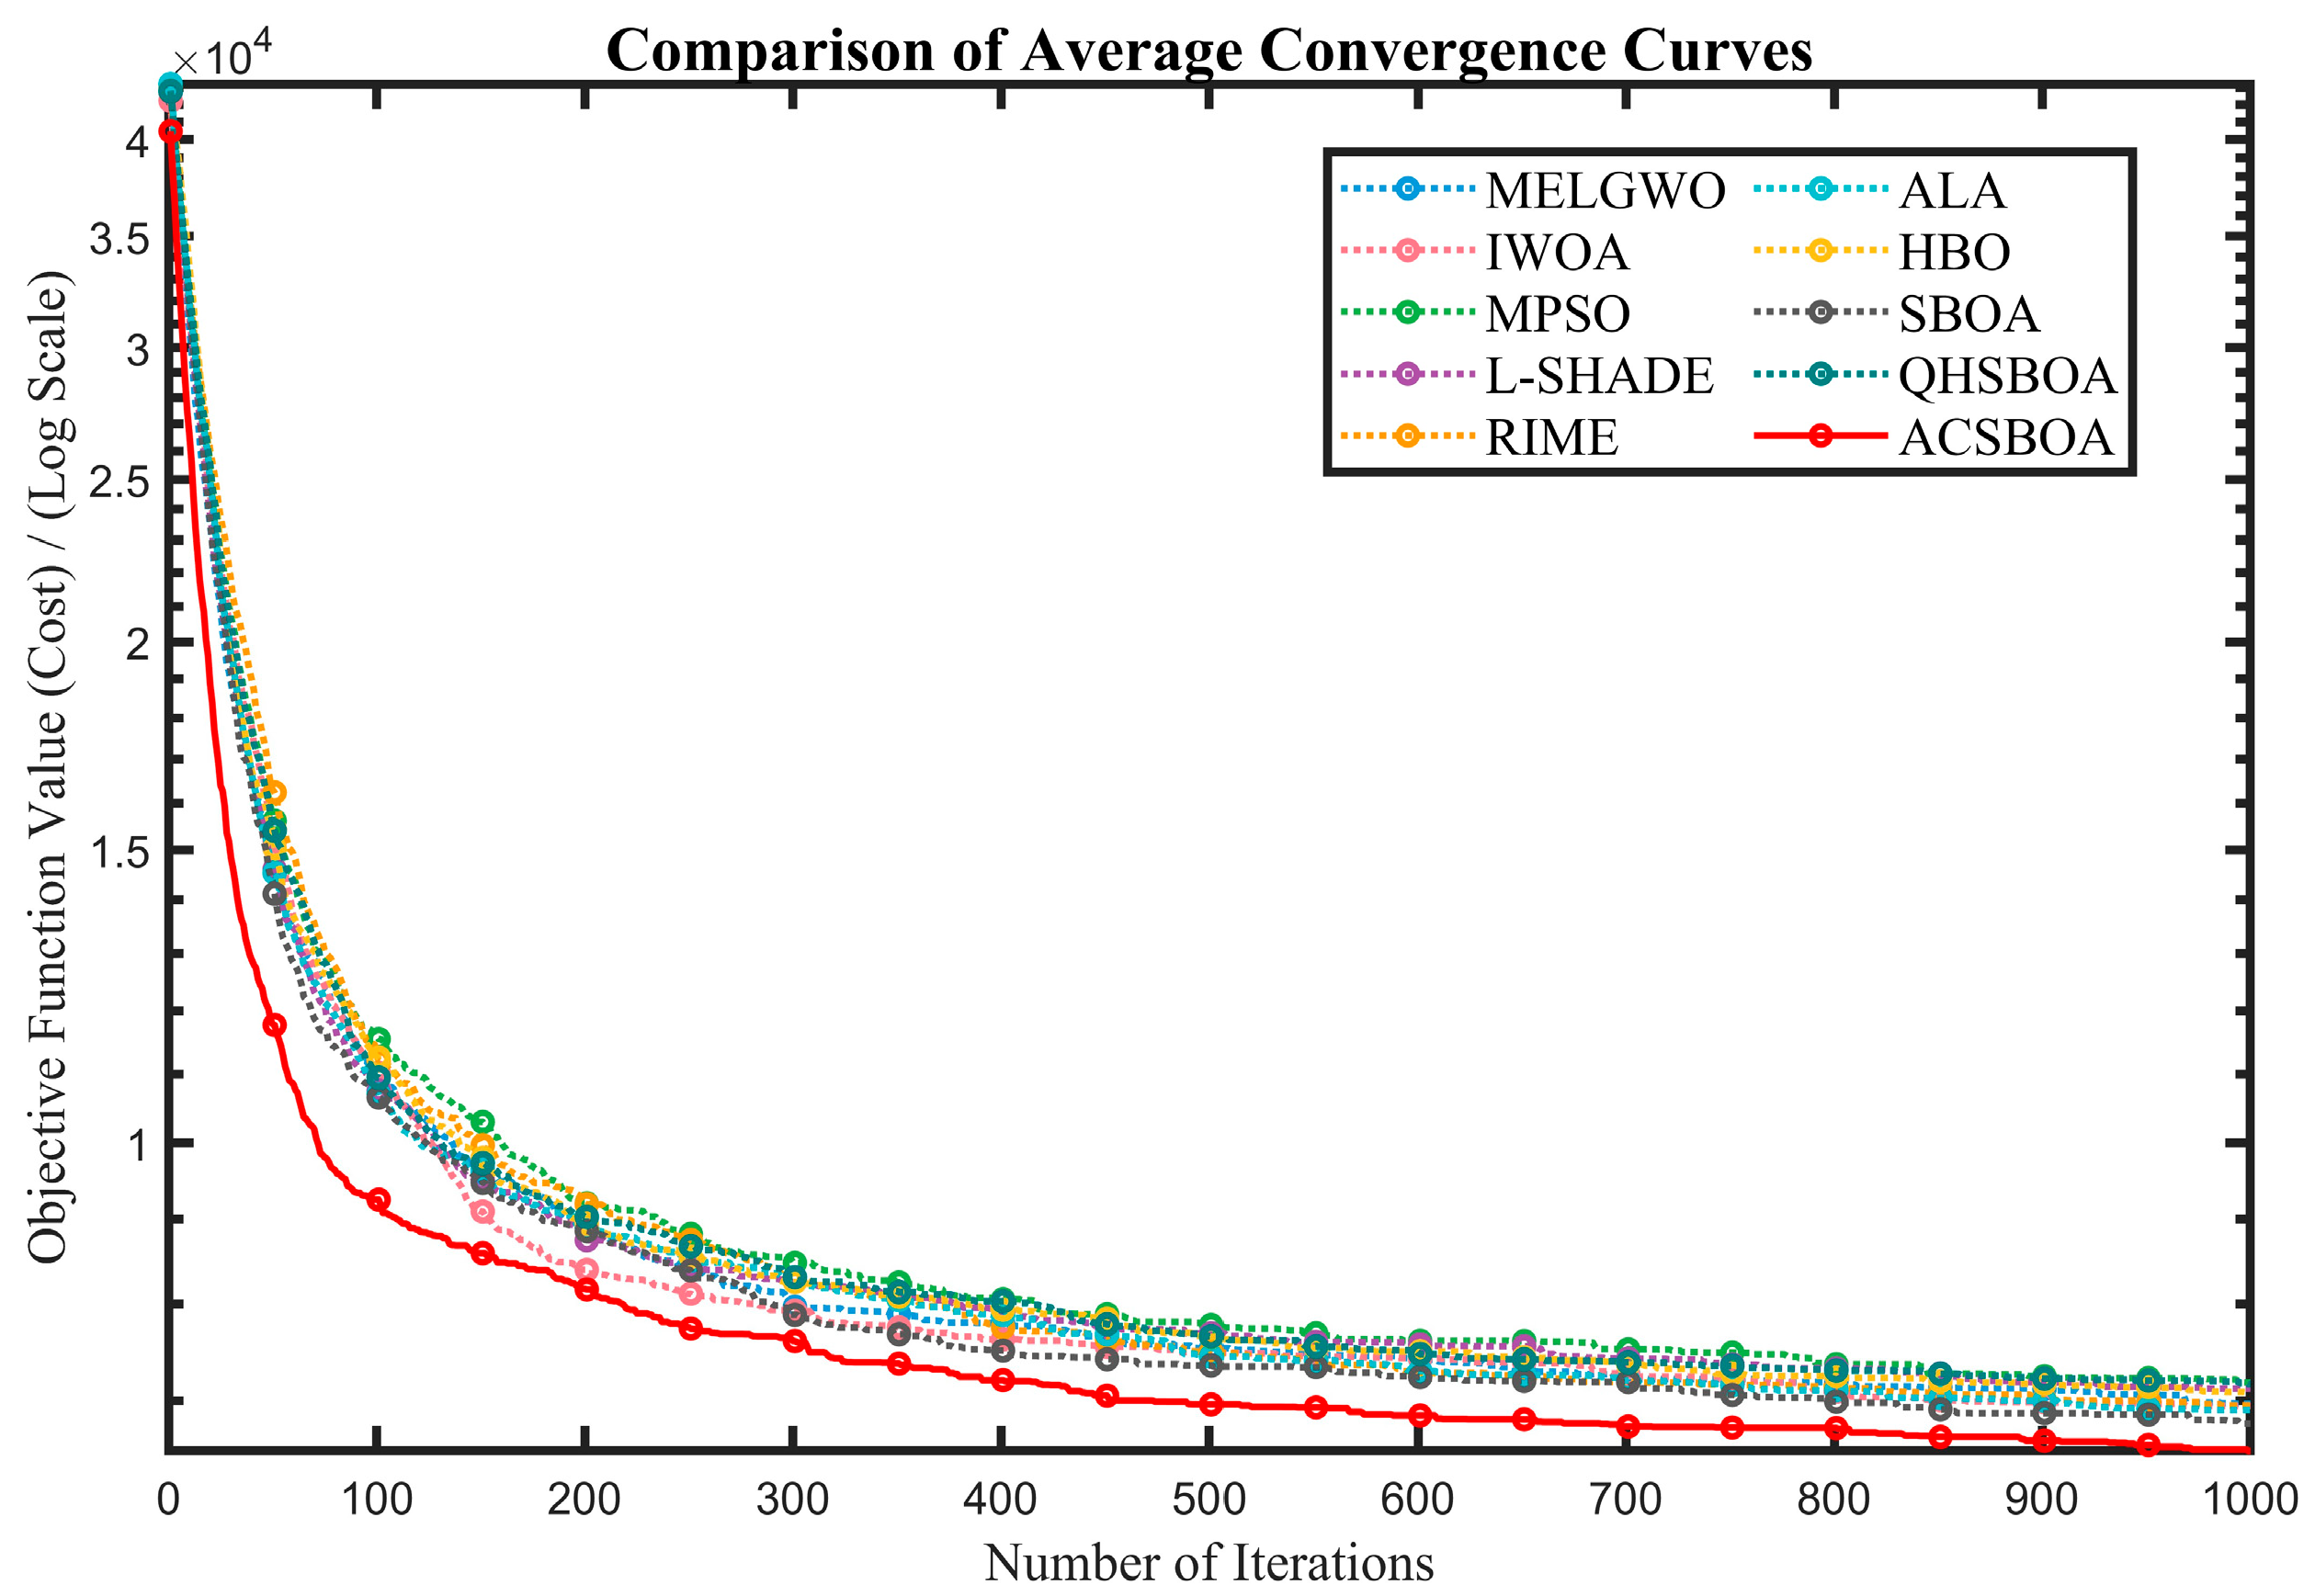
Figure 4.
Cost curves obtained using different algorithms.
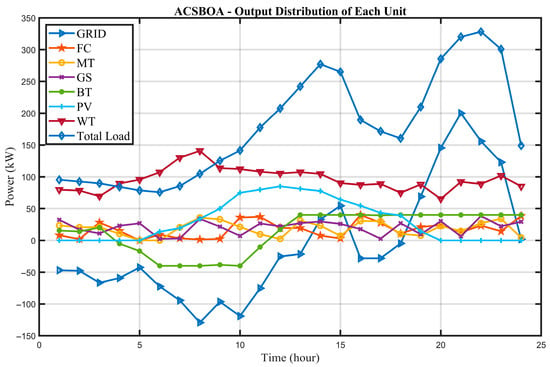
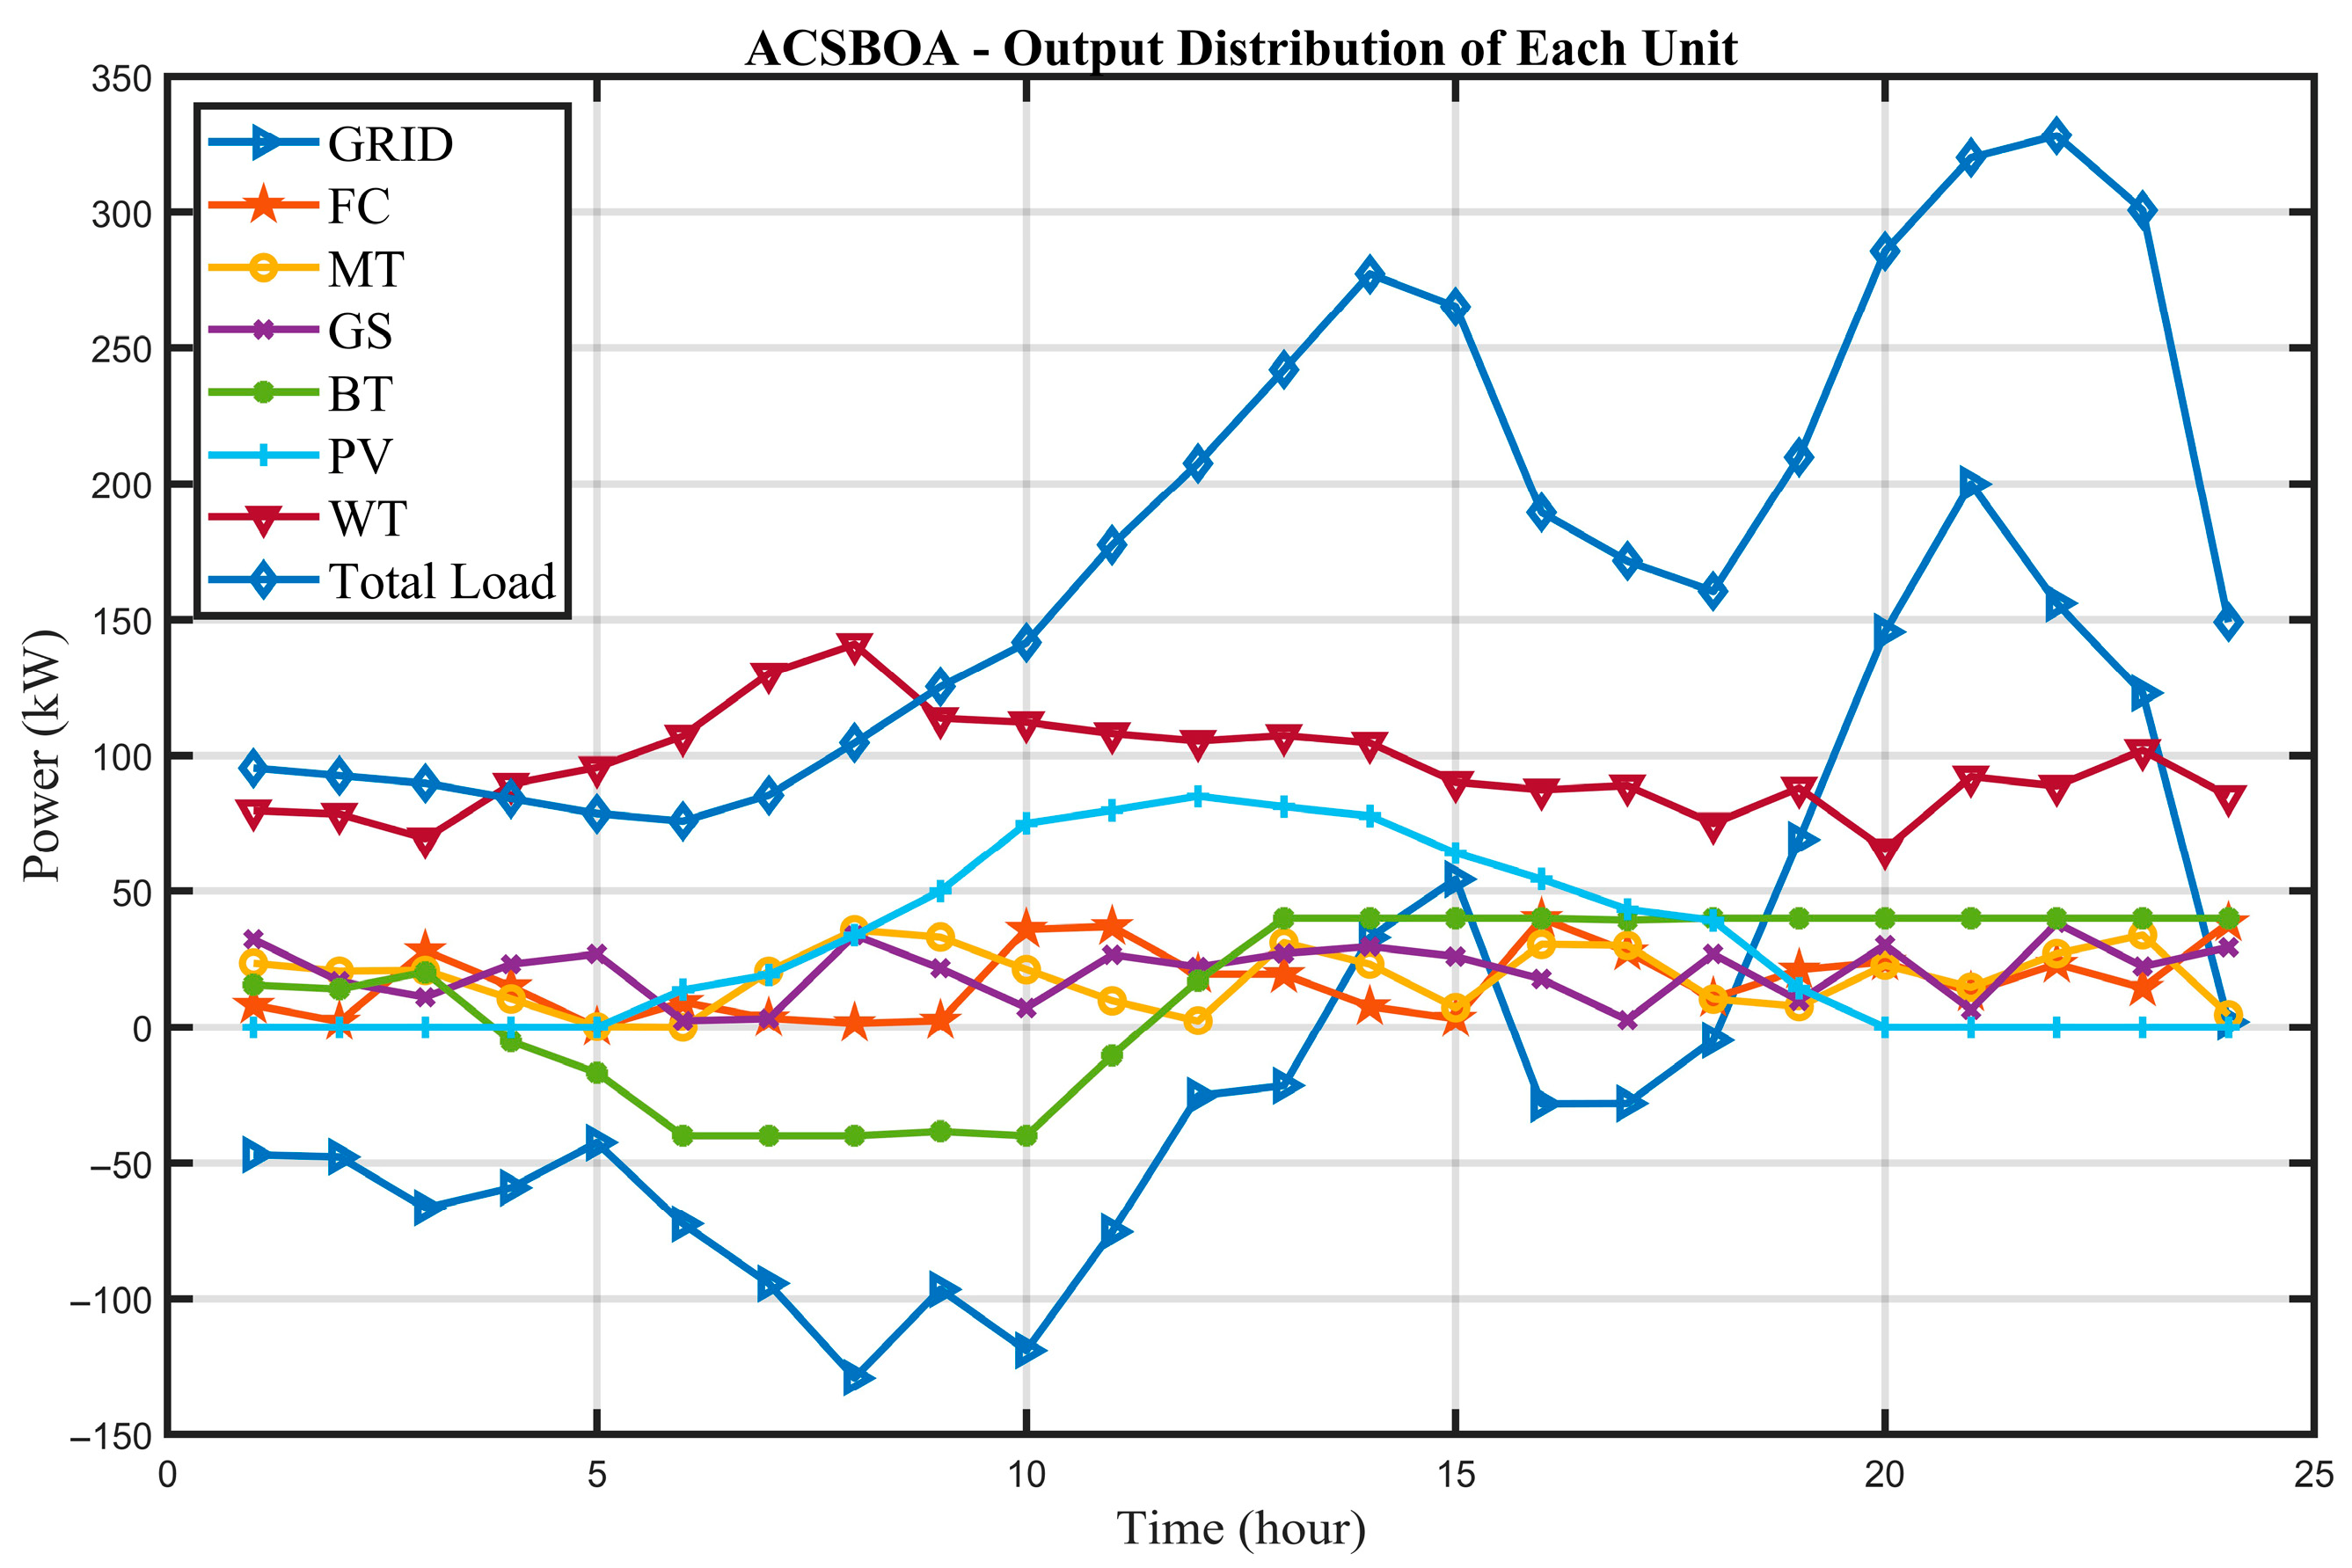
Figure 5.
Optimized power output profiles of individual energy sources from ACSBOA.
Table 10 summarizes the maximum cost, minimum cost, average cost, and standard deviation obtained by each algorithm in the 24 h microgrid scheduling optimization problem. ACSBOA achieves the best performance across all metrics. In terms of the average cost, ACSBOA attains a mean value of only 6470.40 USD, representing a reduction of 3.2% compared with the second-best L-SHADE (6685.97 USD), 5.9% compared with the baseline algorithm SBOA (6878.84 USD), and 5.6% and 7.0% compared with the traditional algorithms MELGWO (6851.73 USD) and IWOA (6958.46 USD), respectively. These results indicate a significant reduction in daily operational costs for the microgrid.
From the perspective of solution quality, ACSBOA achieves a minimum cost of 5365.81 USD, which further improves upon the lowest cost obtained by L-SHADE (5529.40 USD) by 2.9%, and reduces the cost by 4.6% and 11.9% compared with SBOA (5623.16 USD) and QHSBOA (6088.12 USD), respectively. This demonstrates its ability to identify more optimal scheduling configurations.
In terms of stability, ACSBOA exhibits a standard deviation of only 363.92 USD, the smallest among all algorithms—corresponding to just 38.8% of that of IWOA (938.12 USD) and 45.0% of that of RIME (808.63 USD) and representing a 28.4% reduction compared with SBOA (508.46 USD). This indicates extremely small performance fluctuations across 30 independent runs, a low sensitivity to random factors, and a higher reliability of the resulting scheduling solutions. In addition, the maximum cost obtained by ACSBOA is 7000.07 USD, which is substantially lower than those of IWOA (10,856.46 USD) and RIME (10,272.26 USD). This effectively avoids high-cost risks under extreme conditions and provides stronger assurance for the stable operation of the microgrid.
The cost convergence curves in Figure 4 visually illustrate the scheduling optimization efficiency of each algorithm. The convergence superiority of ACSBOA is characterized by a dual feature of “rapid descent + stable convergence.” In the early iteration stage (the first 200 iterations), the cost curve of ACSBOA quickly drops below 7000 USD, while MELGWO, IWOA, RIME, and other algorithms remain in the range of 8000~10,000 USD. The convergence speed of ACSBOA is approximately 2~3 times faster than that of the comparison algorithms, benefiting from the adaptive cooperative search strategy, which rapidly identifies promising scheduling directions. During the middle iteration stage (200~600 iterations), ACSBOA continues to improve steadily, with the cost gradually decreasing from 7000 USD to around 6500 USD. In contrast, algorithms such as SBOA and QHSBOA exhibit convergence stagnation at this stage and struggle to escape local optima. In the late iteration stage (after 600 iterations), ACSBOA finally converges to a stable value of approximately 6470 USD with no noticeable oscillations, whereas the convergence curves of the comparison algorithms still show slight fluctuations. This further validates the fine-grained optimization capability of the quadratic interpolation-based local exploitation strategy.
Figure 5 presents the 24 h power output curves of each energy unit optimized by ACSBOA. The resulting scheduling scheme achieves an efficient coordination among renewable energy sources, conventional generators, the energy storage system, and the main grid. During daytime periods with strong photovoltaic (PV) output (10~15 h), PV power reaches a peak of 35 kW. ACSBOA prioritizes the utilization of renewable energy while controlling the battery (BT) to charge at 20~40 kW, thereby avoiding energy curtailment. During this period, the outputs of conventional power units (FC, MT, GS) are maintained at relatively low levels (5~15 kW), serving only to compensate for load deficits, which reduces fuel consumption and emission costs. At night (20~6 h of the following day), when the PV and wind turbine (WT) outputs drop sharply, ACSBOA schedules the battery to discharge (−20~−40 kW) in coordination with conventional generators. Among them, FC becomes the primary conventional power source due to its lower operating cost (0.02933 USD/kW), while MT and GS provide auxiliary output only during load peaks. Meanwhile, a bidirectional interaction with the main grid (GRID) is employed to smooth power fluctuations—selling electricity to the grid during low-load periods (negative power) and purchasing electricity during peak-load periods (positive power)—thus ensuring a 24 h power supply–demand balance.
From an overall scheduling logic perspective, the optimization scheme of ACSBOA not only maximizes the utilization of low-cost renewable energy but also reduces the start–stop frequency and output fluctuations of conventional generators through coordinated energy storage and grid interaction. At the same time, it strictly satisfies the power constraints of all units (e.g., maximum outputs of 40 kW for FC, MT, and GS, and ±40 kW for BT charging/discharging), thereby achieving a multi-objective balance among “economic efficiency, operational stability, and environmental sustainability.” Compared with the scheduling schemes generated by traditional algorithms (e.g., MELGWO tends to produce oscillatory outputs of conventional generators, and IWOA exhibits suboptimal charging–discharging strategies for energy storage), ACSBOA yields smoother scheduling curves and a more reasonable energy allocation, fully demonstrating its strong adaptability to complex engineering optimization problems.
5. Summary and Prospect
This paper addresses several limitations of the standard Secretary Bird Optimization Algorithm (SBOA) when applied to high-dimensional, nonlinear, and complex constrained optimization problems, including its insufficient search efficiency, limited convergence accuracy in the later stages, and unreasonable boundary-handling mechanisms. To overcome these issues, an Adaptive Cooperative Secretary Bird Optimization Algorithm (ACSBOA) is proposed. By incorporating an adaptive cooperative search strategy, a quadratic interpolation-based local exploitation strategy, and a soft boundary pullback mechanism, the proposed algorithm achieves a more balanced trade-off among exploration capability, exploitation accuracy, and population diversity.
Extensive experimental results on the CEC2017 and CEC2022 benchmark test suites demonstrate that ACSBOA consistently outperforms a variety of comparison algorithms across different dimensions and function types, exhibiting significant advantages in solution accuracy, convergence speed, and stability. Statistical analyses further confirm the significant superiority of ACSBOA in terms of global optimization performance. In addition, an application to the 24 h scheduling optimization problem of a grid-connected microgrid shows that ACSBOA can effectively reduce operating costs while satisfying all system operational constraints, and can generate smooth and reasonable scheduling schemes. These results fully highlight the strong potential of ACSBOA for practical engineering optimization problems.
From a practical deployment perspective, ACSBOA has three main limitations: (1) It is currently designed for static optimization problems and may require modifications (e.g., integrating dynamic population adjustment mechanisms) to adapt to real-time scheduling scenarios with time-varying constraints (e.g., sudden changes in renewable energy output). (2) The algorithm’s performance depends on reasonable parameter initialization (e.g., population size and maximum iterations), which may require preliminary tests for unfamiliar problem types. (3) For ultra-high-dimensional problems (>500 dim), the quadratic interpolation strategy may experience a slight decrease in local exploitation efficiency, as the local search space becomes excessively large. Future work will focus on addressing these limitations by introducing adaptive parameter tuning and dynamic strategy switching mechanisms.
Future research may be conducted in several directions. First, ACSBOA can be further extended to multi-objective and dynamic optimization problems to address more complex real-world scenarios. Second, integrating uncertainty modeling and robust optimization theory could enhance the scheduling reliability of the algorithm under stochastic environments. Third, the deeper integration of ACSBOA with machine learning and forecasting models may be explored to construct more intelligent and adaptive optimization frameworks. Through continued investigation along these directions, ACSBOA is expected to demonstrate even greater application value in intelligent energy systems, industrial optimization, and other complex engineering domains.
Author Contributions
Conceptualization, Y.G.; Methodology, K.F. and W.Q.; Software, K.F. and Y.G.; Validation, K.F. and W.Q.; Writing—original draft, K.F. and Y.G.; Writing—review & editing, K.F. and W.Q.; Visualization, Y.G.; Supervision, K.F.; Project administration, W.Q. All authors have read and agreed to the published version of the manuscript.
Funding
This research received no external funding.
Institutional Review Board Statement
Not applicable.
Informed Consent Statement
Not applicable.
Data Availability Statement
The original contributions presented in this study are included in the article. Further inquiries can be directed to the corresponding author.
Conflicts of Interest
The authors declare no conflicts of interest.
References
- Carpinelli, G.; Mottola, F.; Proto, D.; Russo, A. A Multi-Objective Approach for Microgrid Scheduling. IEEE Trans. Smart Grid 2017, 8, 2109–2118. [Google Scholar] [CrossRef] [Scilit]
- Albaker, A.; Majzoobi, A.; Zhao, G.; Zhang, J.; Khodaei, A. Privacy-preserving optimal scheduling of integrated microgrids. Electr. Power Syst. Res. 2018, 163, 164–173. [Google Scholar] [CrossRef] [Scilit]
- Liu, T.; Li, Y.; Qin, X. Hybrid strategy improved Harris Hawks optimization algorithm for global optimization and microgrid economic scheduling problem. Clust. Comput. 2025, 28, 177. [Google Scholar] [CrossRef] [Scilit]
- Liu, Y.; Tang, Y.; Hua, C. Multi-objective nutcracker optimization algorithm based on fast non-dominated sorting and elite strategy for grid-connected hybrid microgrid system scheduling. Renew. Energy 2025, 242, 122455. [Google Scholar] [CrossRef] [Scilit]
- Rajendran, A.; Selvam, K. Multi-objective Chaotic-Enhanced Competitive Swarm Optimizer (CECSO) algorithm based optimal scheduling of microgrid with renewable energy sources. Energy 2025, 334, 137550. [Google Scholar] [CrossRef] [Scilit]
- Yu, X.; Xu, P.; Wang, X.; Zhang, W. Optimizing islanded microgrid scheduling with reinforcement learning enhanced multi-strategy cuckoo search algorithm. Appl. Soft Comput. 2025, 186, 114251. [Google Scholar] [CrossRef] [Scilit]
- Guan, Z.; Wang, H.; Li, Z.; Luo, X.; Yang, X.; Fang, J.; Zhao, Q. Multi-Objective Optimal Scheduling of Microgrids Based on Improved Particle Swarm Algorithm. Energies 2024, 17, 1760. [Google Scholar] [CrossRef] [Scilit]
- Kennedy, J.; Eberhart, R. Particle swarm optimization. In Proceedings of the ICNN’95—International Conference on Neural Networks, Perth, WA, Australia, 27 November–1 December 1995; Volume 4, pp. 1942–1948. [Google Scholar]
- Holland, J.H. Genetic algorithms. Sci. Am. 1992, 267, 66–73. [Google Scholar] [CrossRef] [Scilit]
- Dorigo, M.; Birattari, M.; Stützle, T. Ant Colony Optimization. Comput. Intell. Mag. IEEE 2006, 1, 28–39. [Google Scholar] [CrossRef] [Scilit]
- Yang, X.-S.; He, X. Bat algorithm: Literature review and applications. Int. J. Bio-Inspired Comput. 2013, 5, 141–149. [Google Scholar] [CrossRef] [Scilit]
- Mirjalili, S.; Mirjalili, S.M.; Lewis, A. Grey Wolf Optimizer. Adv. Eng. Softw. 2014, 69, 46–61. [Google Scholar] [CrossRef] [Scilit]
- Xue, J.; Shen, B. A novel swarm intelligence optimization approach: Sparrow search algorithm. Syst. Sci. Control Eng. 2020, 8, 22–34. [Google Scholar] [CrossRef] [Scilit]
- Mirjalili, S.; Gandomi, A.H.; Mirjalili, S.Z.; Saremi, S.; Faris, H.; Mirjalili, S.M. Salp Swarm Algorithm: A bio-inspired optimizer for engineering design problems. Adv. Eng. Softw. 2017, 114, 163–191. [Google Scholar] [CrossRef] [Scilit]
- Hashim, F.A.; Hussien, A.G. Snake Optimizer: A novel meta-heuristic optimization algorithm. Knowl. Based Syst. 2022, 242, 108320. [Google Scholar] [CrossRef] [Scilit]
- Fu, S.; Li, K.; Huang, H.; Ma, C.; Fan, Q.; Zhu, Y. Red-billed blue magpie optimizer: A novel metaheuristic algorithm for 2D/3D UAV path planning and engineering design problems. Artif. Intell. Rev. 2024, 57, 134. [Google Scholar] [CrossRef] [Scilit]
- Zheng, K.; Liu, H.; Li, B. Improved Snake Optimization Algorithm for Global Optimization and Engineering Applications. Sci. Rep. 2025, 15, 18171. [Google Scholar] [CrossRef] [Scilit] [PubMed]
- Setiawan, D.; Suyanto, S.; Erfianto, B.; Gozali, A.A. Battlefield Optimization Algorithm. Expert. Syst. Appl. 2024, 266, 126097. [Google Scholar] [CrossRef] [Scilit]
- Abualigah, L.; Hussein, A.M.; Almomani, M.H.; Zitar, R.A.; Migdady, H.; Alzahrani, A.I.; Alwadain, A. Improved synergistic swarm optimization algorithm to optimize task scheduling problems in cloud computing. Sustain. Comput. Inform. Syst. 2024, 43, 101012. [Google Scholar] [CrossRef] [Scilit]
- Li, M.; Liu, Z.; Song, H. An improved algorithm optimization algorithm based on RungeKutta and golden sine strategy. Expert. Syst. Appl. 2024, 247, 123262. [Google Scholar] [CrossRef] [Scilit]
- Wang, R.-B.; Hu, R.-B.; Geng, F.-D.; Xu, L.; Chu, S.-C.; Pan, J.-S.; Meng, Z.-Y.; Mirjalili, S. The Animated Oat Optimization Algorithm: A nature-inspired metaheuristic for engineering optimization and a case study on Wireless Sensor Networks. Knowl. Based Syst. 2025, 318, 113589. [Google Scholar] [CrossRef] [Scilit]
- Fu, Y.; Liu, D.; Chen, J.; He, L. Secretary bird optimization algorithm: A new metaheuristic for solving global optimization problems. Artif. Intell. Rev. 2024, 57, 123. [Google Scholar] [CrossRef] [Scilit]
- Assiri, M.S.; Selim, M.M. A swin transformer-driven framework for gesture recognition to assist hearing impaired people by integrating deep learning with secretary bird optimization algorithm. Ain Shams Eng. J. 2025, 16, 103383. [Google Scholar] [CrossRef] [Scilit]
- Badreldin, O.G.; Ali, M.H.; Ahmed, M.K.; Nassar, I.A. Optimizing renewable DG allocation with the secretary bird algorithm for enhanced power system stability and efficiency. Sci. Afr. 2025, 30, e02967. [Google Scholar] [CrossRef] [Scilit]
- Qin, S.; Liu, J.; Bai, X.; Hu, G. A Multi-Strategy Improvement Secretary Bird Optimization Algorithm for Engineering Optimization Problems. Biomimetics 2024, 9, 478. [Google Scholar] [CrossRef] [Scilit]
- Chen, C.; Cao, L.; Chen, B.; Chen, Y.; Wu, X. A Dual-Mechanism Enhanced Secretary Bird Optimization Algorithm and Its Application in Engineering Optimization. Biomimetics 2025, 10, 679. [Google Scholar] [CrossRef] [Scilit]
- Wang, X.; Wei, P.; Li, Y. Enhanced secretary bird optimization algorithm with multi-strategy fusion and Cauchy-Gaussian crossover. Sci. Rep. 2025, 15, 23163. [Google Scholar] [CrossRef] [Scilit]
- Feng, L.; Liu, H.; He, Z.; Ye, H.; Yang, S. Multi-strategy secretary bird optimization algorithm for UAV path planning in complex environment. Sci. Rep. 2025, 16, 101. [Google Scholar] [CrossRef] [Scilit]
- Zhu, Y.; Zhang, M.; Huang, Q.; Wu, X.; Wan, L.; Huang, J. Secretary bird optimization algorithm based on quantum computing and multiple strategies improvement for KELM diabetes classification. Sci. Rep. 2025, 15, 3774. [Google Scholar] [CrossRef] [Scilit]
- Liu, Y.; Tang, Y.; Hua, C. Hybrid nutcracker optimization algorithm for multi-objective energy scheduling in grid-connected microgrid systems. J. Comput. Sci. 2025, 92, 102716. [Google Scholar] [CrossRef] [Scilit]
- Osama, A.; Allam, D.; Fathy, A.; Abdelaziz, A.Y.; Kim, W.-W.; Hong, J.; Geem, Z.W. Optimal energy managing and power scheduling of microgrid in grid-connected mode using modified multi-objective manta ray technique. Energy Rep. 2025, 13, 4781–4799. [Google Scholar] [CrossRef] [Scilit]
- Liu, Z.; Liu, R. Research on a Multi-Objective Optimal Scheduling Method for Microgrids Based on the Tuned Dung Beetle Optimization Algorithm. Electronics 2025, 14, 3619. [Google Scholar] [CrossRef] [Scilit]
- Liu, W.; Dou, Z.; Yan, Y.; Zhou, T.; Chen, J. Research on Optimal Scheduling of the Combined Cooling, Heating, and Power Microgrid Based on Improved Gold Rush Optimization Algorithm. Electronics 2025, 14, 3135. [Google Scholar] [CrossRef] [Scilit]
- Nagarajan, K.; Rajagopalan, A.; Bajaj, M.; Raju, V.; Blazek, V.; Prokop, L. Improved Lyrebird optimization for multi microgrid sectionalizing and cost efficient scheduling of distributed generation. Sci. Rep. 2025, 15, 17345. [Google Scholar] [CrossRef] [Scilit]
- Hofmeyr, S.D.; Symes, C.T.; Underhill, L.G. Secretarybird Sagittarius serpentarius population trends and ecology: Insights from South African citizen science data. PLoS ONE 2014, 9, e96772. [Google Scholar] [CrossRef] [Scilit] [PubMed]
- Wu, G.; Mallipeddi, R.; Suganthan, P. Problem Definitions and Evaluation Criteria for the CEC 2017 Competition and Special Session on Constrained Single Objective Real-Parameter Optimization. 2016. Available online: https://www.researchgate.net/profile/Guohua-Wu-5/publication/317228117_Problem_Definitions_and_Evaluation_Criteria_for_the_CEC_2017_Competition_and_Special_Session_on_Constrained_Single_Objective_Real-Parameter_Optimization/links/5982cdbaa6fdcc8b56f59104/Problem-Definitions-and-Evaluation-Criteria-for-the-CEC-2017-Competition-and-Special-Session-on-Constrained-Single-Objective-Real-Parameter-Optimization.pdf (accessed on 23 December 2025).
- Luo, W.; Lin, X.; Li, C.; Yang, S.; Shi, Y. Benchmark functions for CEC 2022 competition on seeking multiple optima in dynamic environments. arXiv 2022, arXiv:2201.00523. [Google Scholar] [CrossRef] [Scilit]
- Ahmed, R.; Rangaiah, G.P.; Mahadzir, S.; Mirjalili, S.; Hassan, M.H.; Kamel, S. Memory, evolutionary operator, and local search based improved Grey Wolf Optimizer with linear population size reduction technique. Knowl. Based Syst. 2023, 264, 110297. [Google Scholar] [CrossRef] [Scilit]
- Huang, S.; Liu, D.; Fu, Y.; Chen, J.; He, L.; Yan, J.; Yang, D. Prediction of Self-Care Behaviors in Patients Using High-Density Surface Electromyography Signals and an Improved Whale Optimization Algorithm-Based LSTM Model. J. Bionic Eng. 2025, 22, 1963–1984. [Google Scholar] [CrossRef] [Scilit]
- Zhang, X.; Gu, G.; Zhao, C. Modified particle swarm optimization for engineering optimization problems and UAV path planning. IEEE Access 2025, 13, 83956–83982. [Google Scholar] [CrossRef] [Scilit]
- Tanabe, R.; Fukunaga, A.S. Improving the search performance of SHADE using linear population size reduction. In Proceedings of the 2014 IEEE Congress on Evolutionary Computation (CEC), Beijing, China, 6–11 July 2014; pp. 1658–1665. [Google Scholar]
- Su, H.; Zhao, D.; Heidari, A.A.; Liu, L.; Zhang, X.; Mafarja, M.; Chen, H. RIME: A physics-based optimization. Neurocomputing 2023, 532, 183–214. [Google Scholar] [CrossRef] [Scilit]
- Xiao, Y.; Cui, H.; Khurma, R.A.; Castillo, P.A. Artificial lemming algorithm: A novel bionic meta-heuristic technique for solving real-world engineering optimization problems. Artif. Intell. Rev. 2025, 58, 84. [Google Scholar] [CrossRef] [Scilit]
- Ouertani, M.W.; Manita, G.; Korbaa, O. Hannibal Barca optimizer: The power of the pincer movement for global optimization and multilevel image thresholding. Clust. Comput. 2025, 28, 482. [Google Scholar] [CrossRef] [Scilit]
- Fu, S.; Huang, H.; Ma, C.; Wei, J.; Li, Y.; Fu, Y. Improved dwarf mongoose optimization algorithm using novel nonlinear control and exploration strategies. Expert Syst. Appl. 2023, 233, 120904. [Google Scholar] [CrossRef] [Scilit]
- Chen, Y.; Sun, R.; Zheng, J.; Shao, Y.; Zhou, H. MEIAO: A Multi-Strategy Enhanced Information Acquisition Optimizer for Global Optimization and UAV Path Planning. Biomimetics 2025, 10, 765. [Google Scholar] [CrossRef] [Scilit] [PubMed]
- Cao, L.; Wei, Q.J.B. SZOA: An Improved Synergistic Zebra Optimization Algorithm for Microgrid Scheduling and Management. Biomimetics 2025, 10, 664. [Google Scholar] [CrossRef] [Scilit]

Disclaimer/Publisher’s Note: The statements, opinions and data contained in all publications are solely those of the individual author(s) and contributor(s) and not of MDPI and/or the editor(s). MDPI and/or the editor(s) disclaim responsibility for any injury to people or property resulting from any ideas, methods, instructions or products referred to in the content. |
© 2026 by the authors. Licensee MDPI, Basel, Switzerland. This article is an open access article distributed under the terms and conditions of the Creative Commons Attribution (CC BY) license.