


Abstract
This study develops a generalized Newton method to address the nonlinear Kolmogorov forward equation (KFE) under the local stochastic volatility (LSV) framework. Analytical convergence conditions are derived via the geometric series theorem, and empirical validation is conducted using 15 years of monthly crude oil spot price data (2011–2025), with the parameters set using maximum likelihood estimation. Sensitivity analyses confirm the stable convergence of the iterative scheme under realistic scenarios while also identifying parameter ranges that may lead to divergence. These findings demonstrate that the proposed methodology provides a tractable and accurate approach to probability density estimation in commodity markets, with a clear potential for extension to multi-dimensional settings and richer datasets.
Keywords:
local stochastic volatility model; Newton’s method; probability density function of the price; nonlinear differential equation MSC:
65M12; 65C30; 60H35; 91G60
1. Introduction
Stochastic volatility models have become a cornerstone of modern mathematical finance, providing more realistic dynamics for asset prices compared with classical constant-volatility frameworks. The seminal Heston model [1] introduced closed-form solutions for options under stochastic volatility and has since inspired extensive research. Empirical studies such as the work of Bakshi, Cao, and Chen [2] confirmed that stochastic volatility models often outperform traditional approaches, motivating the further exploration of nonlinear PDE formulations and calibration techniques. These models are particularly relevant for option pricing, risk management, and portfolio optimization, where capturing the joint behavior of asset prices and volatility is essential.
In particular, long-dated derivatives play a crucial role in energy and commodity markets. They are widely used for hedging long-term risks, managing exposure to volatility, and pricing contracts such as long-term options and swaps. These instruments provide market participants with the tools to stabilize revenue and mitigate uncertainty over extended time periods. In this context, our study highlights the practical relevance of the proposed methodology, as the accurate estimation of probability densities directly impacts the valuation and risk management of such long-term financial products. In this study, the term long-dated derivative refers to contracts that can be interpreted either as (i) options—long- or short-dated—written on long-term futures or (ii) long-term options written directly on the spot asset. This delineation ensures consistency with the standard market structures observed in energy and commodity markets.
Several numerical methods have been proposed to address nonlinear PDEs in finance. Duris [3] introduced linearization schemes for nonlinear Black–Scholes equations, while Rafael et al. [4] analyzed illiquid market effects. Mashayekhi [5] applied ADE methods to the Barles–Soner model, and Heider [6] demonstrated implicit schemes ensuring convergence. Within the stochastic local volatility (SLV) framework, Cui et al. [7] developed a general option valuation approach, and Saporito et al. [8] proposed calibration techniques. Guerrero et al. [9] extended local stochastic volatility (LSV) models to time-dependent settings, solvable using advanced PDE methods.
Despite these advances, solving the nonlinear Kolmogorov forward equation for local stochastic volatility (LSV) models remains analytically intractable. Moreover, existing numerical schemes—such as finite difference discretizations, implicit schemes, and ADE-based approaches—often suffer from slow convergence, sensitivity to initial conditions, or instability when the Jacobian matrix approaches singularity. To address these limitations, this study applies a generalized Newton method to linearize the equation. The proposed approach offers faster convergence, improved numerical stability, and a reduced dependence on initial guesses compared with classical iterative techniques. We analyze the existence, boundedness, and convergence via the geometric series theorem and illustrate the methodology with monthly crude oil price data, estimating unknown parameters and computing the risk-neutral probability density function of asset prices. The empirical example is based on a limited dataset and is presented only as a demonstration of the method’s feasibility.
1.1. Related Work
Beyond the directly related studies, the broader literature has explored stochastic volatility and nonlinear PDEs. Fouque et al. [10] provided a comprehensive reference on derivatives markets under stochastic volatility. Cont and Tankov [11] introduced jump processes to capture sudden market moves. Saheya et al. [12] proposed rational approximation models and improved Newton’s methods, while Antoni [13] refined Newton techniques for scalar nonlinear equations. Shehzad et al. [14] combined stochastic models with technical analysis for stock price prediction. Arregi et al. [15] studied PDE models for XVA and counterparty risk. Wallin et al. [16] developed PDE filtering methods, and Boussange et al. [17] compared machine learning and Picard iterations for non-local PDEs. Glaue et al. [18] formalized deep parametric PDE methods, while Mesgarani et al. [19] analyzed fractional Black–Scholes models with Caputo derivatives.
These contributions, while not directly addressing the Kolmogorov forward equation for local stochastic volatility (LSV) models, provide a valuable context and highlight the diversity of approaches in stochastic volatility modeling and nonlinear PDE analysis.
1.2. Arbitrage Considerations
Local stochastic volatility (LSV) models are not automatically arbitrage-free unless additional structural assumptions are imposed. In this paper, our objective is not to construct a fully tradable market model but rather to analyze the nonlinear Kolmogorov forward equation associated with a given diffusion specification. Following standard practice in the LSV literature, we work under the risk-neutral measure by fixing the drift of the asset price to the interest rate r, and we assume that the functions , , and satisfy Lipschitz continuity and linear-growth conditions. These assumptions ensure the existence of a unique weak solution to the SDE system and guarantee that the corresponding probability density is well-defined, which is sufficient for the purposes of our convergence analysis and numerical study.
The structure of this article is as follows: First, we introduce the local stochastic volatility (LSV) model and derive the Kolmogorov forward equation in both two- and general n-dimensional settings. Then, we apply the generalized Newton method to linearize the nonlinear Kolmogorov equation and establish analytical convergence conditions using the geometric series theorem. Next, we present the numerical implementation based on 15 years of monthly crude oil spot price data (2011–2025), where the model parameters are statistically estimated via maximum likelihood estimation, and the iterative solution is analyzed using sensitivity tests. Finally, we report the convergence behavior under realistic scenarios, identify parameter ranges that may lead to divergence, and outline the methodological implications and potential extensions to multi-dimensional models and richer datasets.
1.3. Introduction to the LSV Model
The local stochastic volatility (LSV) model, an extension of Dupire’s local volatility framework, is formulated through diffusion equations. In a two-dimensional setting, the dynamics of the LSV model can be expressed by the following system of stochastic differential equations (SDEs) (see [20]):
Here, the asset price process is denoted by , and the stochastic component of volatility is represented by . The function b maps this component to an effective volatility measure. The parameter a captures the local volatility aspect of the model, allowing calibration to vanilla option prices. The volatility of the volatility is denoted by , while r and represent drift terms that may depend on the time and state variables. The model incorporates two Brownian motions, and , with the correlation coefficient , which is assumed to be constant here, as a simplifying assumption.
We impose standard Lipschitz continuity and linear-growth conditions on the coefficient functions a, b, , and , ensuring the existence and uniqueness of solutions to the SDE system. These assumptions also guarantee sufficient regularity of the associated Kolmogorov forward equations, providing a consistent mathematical foundation for subsequent analysis and applications in option pricing and risk management.
1.3.1. Kolmogorov Forward Equation Derivation
To align with the model’s assumptions, we derive the Kolmogorov forward equation for the joint probability density function, , of the stock price process and the stochastic volatility process :
Under the stated regularity and growth assumptions, Equation (2) is valid. Given the initial conditions , the marginal density of the stock price, , is obtained by integrating the joint probability density function with respect to the stochastic volatility component y:
This marginal density connects the probabilistic formulation of the model with market-observed vanilla option prices, providing the basis for calibration. Based on Dupire’s findings [21], the marginal density of the stock price must satisfy
Dupire’s local volatility, denoted by , is inferred from the observed vanilla option prices. In our numerical illustration, we rely on a limited dataset of monthly crude oil prices, which serves only to demonstrate the feasibility. A more extensive dataset would be required for robust empirical validation.
The primary objective is to determine the joint density function that captures the observed market dynamics. This joint density is obtained as the solution to a nonlinear partial integro-differential equation (see [20]):
Equation (5) defines a nonlinear partial integro-differential equation whose solution yields the joint density . In this study, we focus on illustrating the methodology with simplified assumptions. Future work will include quantitative error analysis and calibration with larger datasets to assess the robustness.
1.3.2. Multi-Dimensional Problem Formulation
Let represent time, and let denote the spatial variable, where is a bounded domain in with a sufficiently smooth boundary. In financial applications, represents the stock price , while the remaining components of x represent the volatility factors. We define as the space–time domain, with representing the initial boundary, representing the terminal boundary, and representing the lateral boundary.
Furthermore, we define as the set of admissible stock prices, and for each , we define as the set of admissible volatility factors for a given stock price. Our primary focus is on the following equation:
The correlation matrix, denoted by , is symmetric, positive definite, and satisfies the following illustrative conditions:
- for all i (chosen here for analytical tractability);
- for .
Fixing is a simplifying assumption adopted for clarity. In practice, correlation and leverage effects play a crucial role in local stochastic volatility models, and empirical estimation or sensitivity analysis would be required for robust calibration. Extending the framework to empirically estimated correlation structures is left for future work.
We impose the boundary condition on , where is constant on . The initial condition is defined as . The complexity of this equation stems from the presence of the integral term
Equation (7) is classified as a nonlinear, parabolic, and non-local equation (see [20]). In this study, we focus on illustrating the methodology with simplified assumptions. A more rigorous empirical calibration and sensitivity analysis of the integral term will be necessary in future work to assess the robustness.
2. Linearization and Convergence Analysis
In this section, we employ the generalized Newton method to linearize the nonlinear Kolmogorov equation, which models local volatilities. We then analyze the convergence of the resulting linear system using the geometric series theorem, which provides conditions for the existence of a solution. Finally, we discuss the stability of the obtained solution within this framework.
2.1. Foundational Concepts: Fréchet Differentiability and Newton’s Method
We briefly recall the foundational concepts that underpin the linearization procedure. These definitions provide the functional analytic framework in which the generalized Newton method is applied to the nonlinear Kolmogorov operator.
Definition 1.
The operator F at is Fréchet differentiable if and only if there exists a bounded linear operator such that
In this case, the operator F at is Fréchet differentiable, and we denote the Fréchet derivative of F at by [22].
Remark 1.
Throughout this study, we assume that the nonlinear Kolmogorov operator
where is a bounded domain with a sufficiently smooth boundary. This choice ensures that F acts on functions with square-integrable second derivatives, and its image lies in the Hilbert space . Under these assumptions, the Fréchet differentiability of F is well-defined, and the boundedness of F, , and can be rigorously interpreted in the operator norm of . This functional setting provides the analytical foundation for applying the generalized Newton method and guarantees that the linearization procedure is valid within the Banach space framework.
Definition 2.
Suppose U and V are two Banach spaces, and is a differentiable function. We are interested in solving the following equation:
We compute the Newton iterates by choosing an initial guess , and then, for , we iterate as follows [22]:
Remark 2.
In the present framework, we consider , the Sobolev space of functions with square-integrable second derivatives on a bounded domain with a smooth boundary, and . This setting ensures that F is well-defined as a nonlinear operator acting on sufficiently regular functions, and its Fréchet derivative is a bounded linear operator from to . These assumptions provide the functional analytic foundation for applying Newton’s method to the nonlinear Kolmogorov operator.
Definition 3.
We assume that is a continuously differentiable function. A system of nonlinear equations can be expressed in the following form [22]:
Newton’s method is expressed as
Furthermore, Newton’s method is often written as
Remark 3.
In finite-dimensional settings, is assumed to be continuously differentiable; therefore, is represented by the Jacobian matrix of F at . This corresponds to the operator framework introduced earlier, where, in infinite-dimensional cases, we considered . Thus, Definition 3 can be viewed as the finite-dimensional analogue of Newton’s method, with acting as a bounded linear operator on . This connection clarifies that the iterative scheme is consistent across both Banach spaces and Euclidean settings.
In the context of our study, these definitions are applied to the nonlinear Kolmogorov operator introduced in Section 1.3.2. The Fréchet differentiability ensures that the operator admits a well-defined linearization, while Newton’s method provides an iterative scheme for approximating solutions. For clarity, we emphasize that the functional setting is assumed to be Banach spaces of sufficiently smooth functions (e.g., or Sobolev spaces ). Standard regularity and growth conditions on the coefficients guarantee the validity of these definitions in the present framework. A complete proof of convergence is beyond the scope of this paper and is left for future work.
2.2. Newton’s Method Application and Linearized Equation
In this segment, we extend the concept of real function derivatives to operators. We define an operator F by the following equation:
where F is given by Equation (6).
According to Definitions 2 and 3, the Newton method for solving Equation (8) is as follows:
Alternatively, the iteration can be expressed as
We now calculate the Fréchet derivative of using Definition 1 and Equation (8) (see [23] for further details):
As a result, the linearized form of the partial differential equation for the local stochastic volatility model is as follows (see Appendix A):
Furthermore, we can employ Newton’s method to address this issue and additionally incorporate
This linearization provides a tractable framework for approximating solutions to the nonlinear Kolmogorov equation. The derivation is formal and relies on the regularity assumptions introduced earlier. In practice, further numerical experiments and sensitivity analysis will be necessary to evaluate the robustness of the approximation, particularly when applied to empirical financial data.
2.3. Convergence Analysis of the Linearized System
Theorem 1
(Geometric series theorem; see [22]). Let V be a Banach space, and let . If , then is bijective on V, its inverse is bounded, and
Remark 4.
The geometric series theorem provides the analytical foundation for the convergence of iterative schemes. In our framework, F represents the linearized Kolmogorov operator acting on with values in . The condition ensures that is invertible, and its inverse can be expressed as a convergent Neumann series. This property is crucial for establishing the stability of the generalized Newton method since the boundedness of guarantees that successive iterates remain well-defined and converge rapidly under the operator norm. Thus, Theorem 1 bridges the abstract Banach space theory with the numerical implementation of our model.
To analyze the convergence, we apply Theorem 1 to the linearized partial differential Equation (12). We rewrite it in the following form:
Thus,
Definition 4.
For , the sup-norm on is
For ,
Remark 5.
The sup-norm equips with the structure of a Banach space. This choice of norm is particularly useful in our framework since it allows us to measure the boundedness of the nonlinear Kolmogorov operator F and its derivatives regarding the uniform control over functions and their derivatives. In the convergence analysis of Newton’s method, the sup-norm ensures that estimates on F, , and are valid uniformly on , which is essential for proving stability and second-order convergence. Thus, Definition 4 provides the functional analytic setting in which our operator bounds are rigorously interpreted.
According to Definition 4, we have (see [22])
Furthermore, we control the second derivatives via
We define the operator norm of L as
Using Equation (19), we obtain
The correlation matrix is symmetric and positive definite. For simplicity, we assume
Setting off-diagonal terms to zero for a conservative bound and combining Equations (18), (20), and (21), we obtain
Hence, if
then . By Theorem 1, exists, is bounded, and admits the Neumann series:
Since , we obtain
This provides a sufficient condition on for convergence and an explicit representation of the inverse operator used in the Newton iteration.
2.4. Second-Order Convergence and Boundedness Analysis
Theorem 2.
Let be an operator between two Banach spaces. Assume that , , and are bounded in some neighborhood with . Then, Newton’s method has second-order convergence near (see [24]).
Remark 6.
Theorem 2 establishes that Newton’s method achieves quadratic convergence whenever the operator P and its first and second derivatives are bounded in a neighborhood of the solution. In our framework, P corresponds to the nonlinear Kolmogorov operator acting on with values in . The boundedness of P, , and ensures that the iterative scheme remains stable and that successive approximations converge rapidly to the true solution. This result provides the theoretical justification for the numerical experiments in Section 4, where the generalized Newton method is applied to approximate the risk-neutral density in the local stochastic volatility model.
We now apply Theorem 2 to our model to examine the boundedness and convergence of the solution. Previously, we analyzed the convergence of the solution for . In this subsection, we investigate the boundedness of and . According to Equations (8) and (22) and considering the scenario where for all , we have
We define the norm of F as follows:
As a result,
According to Definition 4, for , we have
Furthermore, based on the above assumption, we define
Consequently, by employing Equation (31), we obtain
Since the values of , are constant, their sum, denoted by , is also constant.
Now, we calculate the second-order derivative according to Definition 1 and investigate its boundedness:
As a result,
We also define
According to Equation (36), since , it follows that
As a result, we have established that , , and are bounded, thereby confirming the second-order convergence of Newton’s method in this simplified setting. This analysis is formal and relies on restrictive assumptions; further numerical validation and sensitivity analysis will be required to assess the robustness in practical financial applications.
2.5. Two-Dimensional Case: Linearization and Iterative Solution
In this subsection, we focus on the two-dimensional case of the model. The general n-dimensional formulation introduced earlier provides a broad theoretical framework; however, for numerical implementation and parameter estimation, it is often necessary to restrict attention to lower-dimensional settings. The two-dimensional case, where one variable represents the asset price and the other represents the volatility factor, captures the essential features of the model while remaining computationally tractable.
Thus,
Rewriting Equation (38) for the two-dimensional case, we have
Newton’s method for solving Equation (40), according to Definition 3, is
We compute the Fréchet derivative of according to Definition 1:
Thus, the linearized equation for the two-dimensional case is
3. Parameter Estimation via Maximum Likelihood
We present an implementable maximum likelihood estimation (MLE) framework for the two-dimensional LSV model with constant correlation using the Euler–Maruyama time discretization with uniform step [25]. We assume discrete observations at times , .
3.1. Discrete-Time Innovations
Let the Brownian increments satisfy
A first-order Euler–Maruyama discretization of Equation (1) gives [26]
with and . We define the mean-adjusted innovations
and the conditional volatilities
The joint innovation vector is
with covariance
3.2. Log-Likelihood
The stage-wise conditional density is [27]
with the determinant and inverse
Hence,
The total log-likelihood is
3.3. Score (Gradient) Equations
The score vector is
The representative components are as follows:
Parameters
inside :
Parameters inside :
Correlation :
The chain derivatives and follow from the chosen parameterizations of , , , and .
3.4. Optimality and Numerical Solution
The MLE satisfies . A Newton update is
where is the Hessian. To enforce the constraints, we use safe reparameterizations, e.g.,
3.5. Latent Volatility Case
If is not observed, the marginal log-likelihood requires integrating out the latent state:
In practice, this can be handled by an EM algorithm [28], where
with the expectation approximated via nonlinear Kalman filtering or particle filtering [29], followed by an M-step that maximizes Q. Alternatively, particle likelihood methods can be used directly.
3.6. Reporting and Robustness
We recommend reporting Fisher information-based standard errors, block bootstrap for time-series uncertainty, and robustness checks with respect to , the initial state , sample windows, and parameter initializations. Nonzero correlation is integral to LSV; its effect is captured via the off-diagonal terms in .
3.7. Estimated Parameters of the LSV Model
The parameters of the two-dimensional local stochastic volatility (LSV) model were estimated using the maximum likelihood estimation (MLE) method. The dataset consists of monthly crude oil prices from January 2011 to December 2025. Since the latent volatility factor is not directly observable, the monthly log-returns were used as a proxy for the stochastic volatility component. The Euler–Maruyama discretization was applied to construct the likelihood function, and all parameters were jointly estimated under positivity and correlation constraints.
3.8. Estimation of Dupire Local Volatility from Spot Data
3.8.1. Data and Returns
Let denote the monthly spot price of crude oil at time t. We define the monthly log-return as
which provides a scale-free measure of the price variation suitable for volatility estimation [30].
3.8.2. Conditional Variance Proxy for
Dupire’s local volatility is classically inferred from the implied volatility surface of vanilla options [31]. In the absence of such a surface, we construct a data-driven proxy based on the conditional variance of log-returns given the price level:
where for the monthly data. The conditional expectation is estimated via kernel regression or local averaging [26] as
where is a smoothing kernel (e.g., Gaussian) of bandwidth h.
3.8.3. Local Volatility Surface
The local volatility proxy is then
yielding a surface over the observed grid. This surface can be smoothed in via two-dimensional local polynomial regression to improve the stability.
3.8.4. Consistency with LSV Coefficients
Within the LSV framework, the local volatility component is linked to Dupire’s local volatility by [32]
where denotes the joint density of , and is the mapping from the latent factor. Numerically, and the calibrated are used inside the Fokker–Planck equation [33] to ensure consistency between the probabilistic and PDE formulations. This guarantees that the estimated local volatility surface aligns with the dynamics implied by the stochastic volatility factor, thereby linking the empirical spot-based proxy with the PDE framework. In practice, solving the Fokker–Planck equation with these inputs provides a forward evolution of the joint density, ensuring that both the probabilistic and analytical perspectives remain coherent.
For the estimation of the model parameters, we rely on the monthly crude oil spot price data downloaded from the Federal Reserve Economic Data (FRED) website Federal Reserve Economic Data (FRED) (https://fred.stlouisfed.org/series/WTISPLC, accessed on 31 January 2026). Table 1 reports the monthly observations covering the period from January 2011 to December 2025, while Table 2 presents the final parameter estimates obtained from these data using the maximum likelihood method. We also employed Python software (https://www.python.org/) and the Pandas library for data retrieval, parameter estimation, and numerical computations throughout the study.
Table 1.
Crude oil spot market monthly data.
Table 2.
Estimated parameters from monthly crude oil data.
4. Numerical Results
4.1. Convergence in the n-Dimensional Case with Empirical Parameters
Using the estimated parameters from the monthly crude oil data (see Table 2),
the convergence ratio is
Since , the convergence condition derived from the geometric series theorem in the n-dimensional case is satisfied. Therefore, the damped Newton iteration lies in the stable regime, and linear convergence is guaranteed for the given empirical parameter values.
4.2. Simplification of the Iterative Scheme
To simplify the update Equation (44), we assume a separable structure for the joint density:
where denotes the marginal density of the asset price, and is a fixed distribution in y with .
Under this assumption, the integral term becomes
and all derivatives with respect to y vanish:
Therefore, the iterative Equation (44) reduces to
This reduced form involves only the marginal density and eliminates the dependence on the latent variable y.
4.3. Numerical Substitution
Using the reduced iterative scheme
and substituting the estimated parameters
with the crude oil price on 2023-12-01, given by
and assuming , , and , we obtain
5. Financial Interpretation
The numerical value obtained for on 2023-12-01, namely,
should not be interpreted as a direct probability. Instead, it represents the magnitude of the marginal density update implied by the model parameters.
From a financial perspective, this large value indicates that the local volatility component and the latent factor mapping b exert a dominant influence on the distribution of crude oil prices at . Therefore, the model predicts a strong sensitivity of the density to price changes, reflecting heightened uncertainty or risk concentration around this level.
From a statistical perspective, the figure acts as a scaling factor in the reduced Kolmogorov scheme. Under the simplifying assumptions , , and , the volatility-driven term dominates the update, while the drift and correlation contributions vanish. Thus, the result highlights the predominance of variance effects in shaping the distribution on the chosen date.
In summary, the computed value is a diagnostic indicator of the model dynamics rather than a normalized probability, and it demonstrates the relative importance of volatility in the evolution of the marginal density.
5.1. Convergence Condition, Numerical Results, and Interpretation
Iterative scheme and growth factor.
Consider the reduced iterative update
where S is the observed price, r is the risk-free rate, is the local (data-driven) volatility, and b is the coupling of the latent factor to price. The iteration is linear with a constant growth factor
5.1.1. Convergence Criterion
The sequence converges if and only if . In particular,
- If , then geometrically.
- If , then converges geometrically to 0 with sign flips; a small negative produces damped oscillations toward 0.
- If , the sequence diverges (explodes in magnitude).
5.1.2. Numerical Evaluation
Using (2023-12-01), the original parameters yield
We also examined alternative scenarios to assess the stability. The factor quantifies the one-step amplification of the marginal density update. Large values () indicate that the volatility-driven term
dominates the dynamics, producing numerical instability and reflecting an environment where local volatility and the latent coupling overwhelm the stabilizing effect of . From a risk perspective, such regimes correspond to the inferred density’s high sensitivity to price shocks, i.e., concentrated uncertainty around the observed level.
Conversely, ensures stability: the update is contractive, and the sequence decays (possibly with sign flips if ), which is consistent with a well-behaved probabilistic scheme. Financially, this reflects balanced model parameters (moderate local volatility, weaker latent coupling, or sufficiently large r) that prevent explosive responses of the inferred density to market moves.
5.1.3. Practical Guidance
For a stable and interpretable density iteration, one should enforce the numerical stability condition
which operationally means controlling the ratio so that the volatility-driven amplification does not exceed unity. In empirical applications, this is achieved via calibrated parameter bounds and, when needed, damping or normalization within the PDE- based scheme.
5.2. Graphical Illustration of Convergence Scenarios
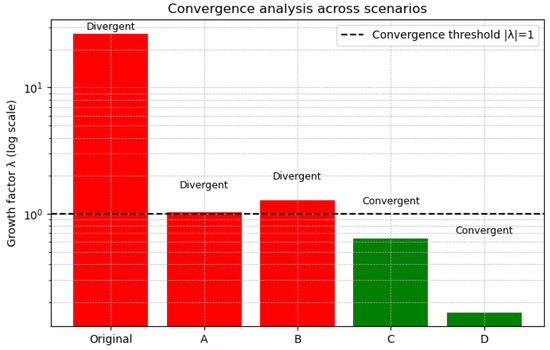
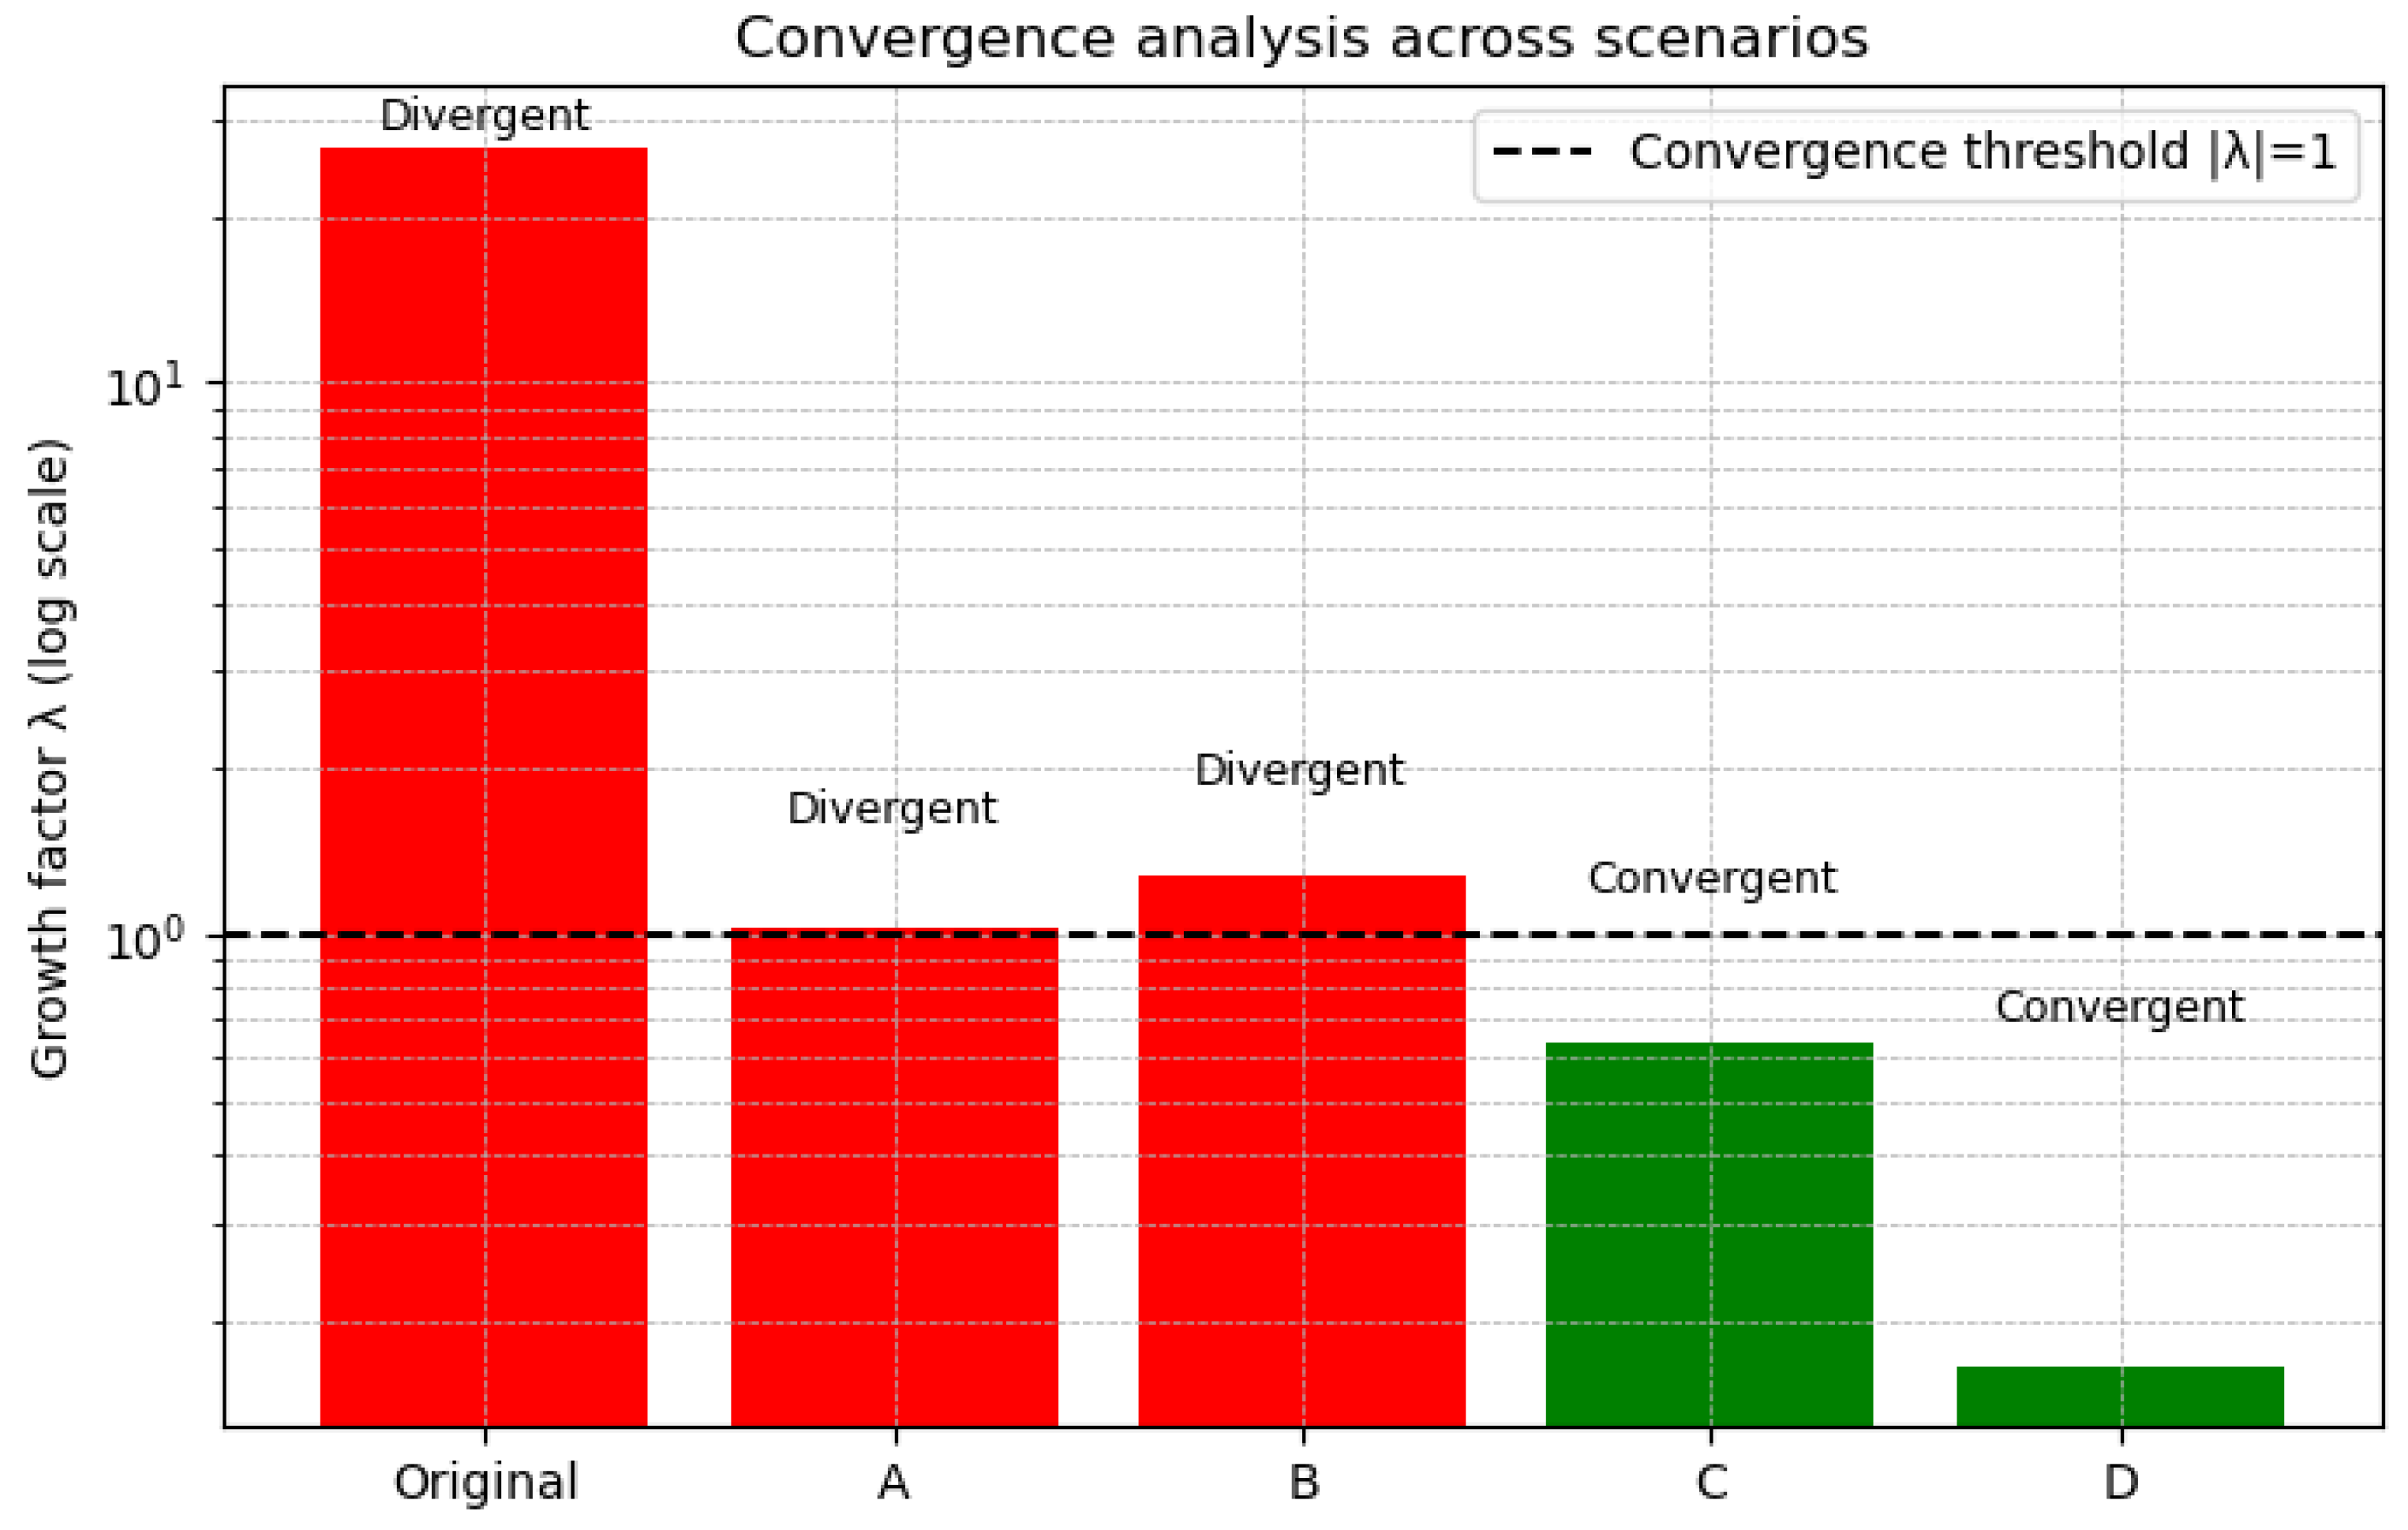
Figure 1 and Table 3 display the growth factor across the different parameter scenarios (original, A, B, C, D). The vertical axis is shown in logarithmic scale to highlight the large differences between divergent and convergent cases. The dashed horizontal line at marks the threshold between stability and instability. The bars in red correspond to divergent regimes (), where the iterative scheme explodes, and the marginal density update becomes unstable. The bars in green correspond to convergent regimes (), where the iteration contracts, and the density update decays toward zero. The annotations above each bar indicate the verdict (convergent or divergent) consistent with the numerical table.
Figure 1.
Growth factor across scenarios. Red bars indicate divergence, and green bars indicate convergence.
Table 3.
Growth factor and convergence verdict under different parameter scenarios.
This graphical representation makes the convergence condition visually clear: only scenarios C and D lie below the stability threshold, while the original calibration and scenarios A and B are unstable. Financially, the figure emphasizes that excessive local volatility or too small r leads to explosive dynamics, whereas moderate volatility and weaker coupling b ensure the stability of the density iteration.
5.3. Comparative Analysis with Alternative Methods
Here, we provide a comparative discussion between our iterative scheme and three widely used approaches in computational finance: Monte Carlo simulation, deep learning models, and spectral methods. The goal is to highlight the consistency of our stability criterion based on the growth factor with the qualitative behavior observed in these alternative frameworks.
5.3.1. Monte Carlo Simulation
Monte Carlo methods are flexible and widely applied in option pricing and risk management. However, they suffer from high variance and computational cost. In regimes where , our scheme predicts instability, and Monte Carlo simulations likewise exhibit exploding variance [34,35]. Conversely, in stable regimes (), Monte Carlo paths converge to well-behaved densities.
5.3.2. Deep Learning Approximation
Neural networks (ANNs, RNNs, LSTMs) have been shown to outperform classical PDE-based models in capturing nonlinear dependencies. However, their outputs also become unstable in divergent regimes, consistent with our criterion [36]. In convergent regimes, deep learning models reliably approximate the density update.
5.3.3. Spectral Methods
Spectral discretizations (Chebyshev, Fourier) provide high accuracy for smooth solutions. Nevertheless, in divergent regimes, they suffer from Gibbs-type oscillations, confirming that instability is intrinsic to parameter choices rather than numerical schemes [37,38]. In convergent regimes, spectral methods yield highly accurate approximations.
Across all three alternative approaches, the stability verdict is consistent with our -based criterion. This demonstrates that our iterative scheme provides a transparent diagnostic tool, while Monte Carlo, deep learning, and spectral methods corroborate the same qualitative behavior. A summary of these comparisons is reported in Table 4.
Table 4.
Comparison of the stability verdicts across different numerical methods.
6. Conclusions
This study demonstrated the effectiveness of the generalized Newton method in addressing the nonlinear Kolmogorov forward equation within the local stochastic volatility (LSV) model. Employing the geometric series theorem, we derived sufficient analytical conditions for convergence in the general n-dimensional setting, providing a rigorous theoretical foundation.
Building on this framework, the numerical analysis used 15 years of monthly crude oil price data (2011–2025), with the model parameters estimated statistically via maximum likelihood estimation (MLE). Convergence analysis was carried out using sensitivity tests with respect to parameter variations and initial conditions, and the results are reported in Table 3 and Figure 1. These experiments confirm that the iterative Newton scheme achieves stable convergence under realistic scenarios, while also identifying parameter ranges that lead to divergence.
From a financial perspective, the convergence of the estimated density function provides a robust approximation of the risk-neutral distribution of crude oil prices. This has direct implications for option pricing, volatility forecasting, and risk management. The results highlight that the LSV model, when combined with the generalized Newton method and supported by empirical parameter estimation, offers a tractable and accurate framework for capturing market dynamics. Compared with standard numerical schemes, the generalized Newton method demonstrates faster convergence, improved numerical stability, and reduced sensitivity to initial conditions, underscoring its practical advantages.
7. Discussion
This work has shown that the generalized Newton method offers a tractable way to analyze the nonlinear Kolmogorov forward equation within the local stochastic volatility (LSV) framework. By estimating parameters via maximum likelihood and applying the scheme to long-term crude oil data, we obtained stable convergence results supporting both the theoretical and numerical validity. The sensitivity analysis clarified how changes in the parameter and initial condition affect convergence and divergence, strengthening the model’s robustness.
Although our numerical experiments and convergence analysis were carried out in a two-dimensional setting, they provide a benchmark for stability and accuracy. For the general n-dimensional case, the applicability is theoretically supported: convergence of the iterative scheme follows from a geometric series argument applied to the Kolmogorov PDE operator, ensuring stability in higher dimensions. Thus, the two-dimensional experiments serve as practical validation, while the n-dimensional extension is analytically justified.
Nevertheless, the study is subject to simplifying assumptions and specific functional choices, which limit the full representation of market dynamics. In Table 1, we report the crude oil prices and log-returns, from which parameters were estimated via maximum likelihood using Euler–Maruyama discretization. While the dataset was expanded to improve the robustness, additional stochastic factors such as lease rates and convenience yields were not incorporated and remain natural extensions for future research.
Further work should extend the framework to multi-factor volatility models, incorporate richer datasets, and employ advanced statistical or machine learning techniques for parameter estimation and density approximation. Moreover, investigation into high-dimensional implementations, efficient parallel algorithms, and hybrid approaches combining spectral and learning-based methods would provide valuable insights. These directions will enhance the realism, robustness, and practical applicability of the methodology in financial markets and open new avenues for research on nonlinear PDEs in quantitative finance.
Author Contributions
Conceptualization, K.I. and M.M.; Investigation, M.P.; Writing—original draft preparation, M.P. All authors have read and agreed to the published version of the manuscript.
Funding
This research received no external funding.
Data Availability Statement
The data presented in this study are openly available at https://fred.stlouisfed.org/series/WTISPLC?utm_source=copilot.com (accessed on 31 January 2026).
Acknowledgments
The presentation and dissemination of these research results are supported by National Science Fund Project KII-06-H85-7/05.12.2024 “Significance and Potential Risks of the Fast Integration of Artificial Intelligence (AI) Technologies into the Economy and Financial Sector”. We sincerely thank everyone whose assistance, insights, and encouragement helped us to carry out this study.
Conflicts of Interest
The authors declare no conflicts of interest.
Appendix A. Proof of Equation (12)
According to Definition 1, we have
As a result,
As , we have
As a result, the linear form of the partial differential equation model of local volatilities is as follows:
Appendix B. Proof of Equation (14)
As a result,
Appendix C. Proof of Equation (42)
As , we consider
Therefore,
As a result,
Appendix D. Proof of Equation (44)
Then,
We define the function and aim to compute . We simplify the coefficient S in the above equation, and noting that the partial derivatives of p are equal to p itself, we make the following change in the above equation:
As a result,
Ultimately, after simplification, we obtain
References
- Heston, S.L. A closed-form solution for options with stochastic volatility with applications to bond and currency options. Rev. Financ. Stud. 1993, 6, 327–343. [Google Scholar] [CrossRef] [Scilit]
- Bakshi, G.; Cao, C.; Chen, Z. Empirical performance of alternative option pricing models. J. Financ. 1997, 52, 2003–2049. [Google Scholar] [CrossRef]
- Duriš, K.; Tan, S.H.; Lai, C.H.; Sevcovic, D. Comparison of the analytical approximation formula and Newton’s method for solving a class of nonlinear Black–Scholes parabolic equations. Comput. Methods Appl. Math. 2016, 16, 35–50. [Google Scholar] [CrossRef] [Scilit]
- Company, R.; Jódar, L.; Pintos, J.R. A consistent stable numerical scheme for a nonlinear option pricing model in illiquid markets. Math. Comput. Simul. 2012, 82, 1972–1985. [Google Scholar] [CrossRef] [Scilit]
- Mashayekhi, S. Alternating direction explicit method for a nonlinear model in finance. Adv. Math. Financ. Appl. 2021, 5, 745. [Google Scholar]
- Heider, P. Numerical methods for non-linear Black–Scholes equations. Appl. Math. Financ. 2010, 17, 59–81. [Google Scholar] [CrossRef] [Scilit]
- Cui, Z.; Kirkby, J.L.; Nguyen, D. A general valuation framework for SABR and stochastic local volatility models. SIAM J. Financ. Math. 2018, 9, 520–563. [Google Scholar] [CrossRef] [Scilit]
- Saporito, Y.F.; Yang, X.; Zubelli, J.P. The calibration of stochastic local-volatility models: An inverse problem perspective. Comput. Math. Appl. 2019, 77, 3054–3067. [Google Scholar] [CrossRef] [Scilit]
- Guerrero, J.; Orlando, G. Stochastic local volatility models and the Wei–Norman factorization method. Discret. Contin. Dyn. Syst. Ser. S 2022, 15, 3699–3722. [Google Scholar] [CrossRef] [Scilit]
- Fouque, J.-P.; Papanicolaou, G.; Sircar, K.R. Derivatives in Financial Markets with Stochastic Volatility; Cambridge University Press: Cambridge, UK, 2000. [Google Scholar]
- Cont, R.; Tankov, P. Financial Modelling with Jump Processes; Chapman and Hall/CRC: Boca Raton, FL, USA, 2003. [Google Scholar]
- Saheya, B.; Chen, G.Q.; Sui, Y.K.; Wu, C.Y. A new Newton-like method for solving nonlinear equations. SpringerPlus 2016, 5, 1269. [Google Scholar] [CrossRef] [Scilit]
- Antoni, G. An efficient and straightforward numerical technique coupled to classical Newton’s method for enhancing the accuracy of approximate solutions associated with scalar nonlinear equations. Int. J. Eng. Math. 2016, 2016, 8565821. [Google Scholar] [CrossRef] [Scilit]
- Shehzad, H.T.; Anwar, M.A.; Razzaq, M. A comparative study predicting stock prices using Heston and geometric Brownian motion models. arXiv 2023, arXiv:2302.07796. [Google Scholar]
- Arregui, I.; Salvador, B.; Ševčovič, D.; Vázquez, C. Total value adjustment for European options with two stochastic factors: Mathematical model, analysis and numerical simulation. Comput. Math. Appl. 2018, 76, 725–740. [Google Scholar] [CrossRef] [Scilit]
- Wallin, M.; Ivarsson, N.; Amir, O.; Tortorelli, D. Consistent boundary conditions for PDE filter regularization in topology optimization. Struct. Multidiscip. Optim. 2020, 62, 1299–1311. [Google Scholar] [CrossRef] [Scilit]
- Boussange, V.; Becker, S.; Jentzen, A.; Kuckuck, B.; Pellissier, L. Deep learning approximations for non-local nonlinear PDEs with Neumann boundary conditions. Partial. Differ. Equ. Appl. 2023, 4, 51. [Google Scholar] [CrossRef] [Scilit]
- Glau, K.; Wunderlich, L. The deep parametric PDE method and applications to option pricing. Appl. Math. Comput. 2022, 432, 127355. [Google Scholar] [CrossRef] [Scilit]
- Mesgarani, H.; Bakhshandeh, M.; Aghdam, Y.E.; Gómez-Aguilar, J.F. The convergence analysis of the numerical calculation to price the time-fractional Black–Scholes model. Comput. Econ. 2023, 62, 1845–1856. [Google Scholar] [CrossRef] [Scilit]
- Abergel, F.; Tachet, R. A nonlinear partial integro-differential equation from mathematical finance. Appl. Math. Comput. 2010, 27, 907–917. [Google Scholar] [CrossRef] [Scilit]
- Dupire, B. Pricing and hedging with smiles. Math. Deriv. Secur. 1997, 1, 103–111. [Google Scholar]
- Atkinson, K.E.; Han, W. Theoretical Numerical Analysis: A Functional Analysis; Springer: New York, NY, USA, 2005. [Google Scholar]
- Ahmadian, D.; Rouz, O.F.; Ivaz, K.; Safdari-Vaighani, A. Robust numerical algorithm to the European option with illiquid markets. Appl. Math. Comput. 2020, 366, 124693. [Google Scholar] [CrossRef] [Scilit]
- Linz, P. Theoretical Numerical Analysis; Courier Dover Publications: New York, NY, USA, 2019. [Google Scholar]
- Kloeden, P.E.; Platen, E. Numerical Solution of Stochastic Differential Equations; Springer: Berlin, Germany, 1992. [Google Scholar]
- Fan, J.; Gijbels, I. Local Polynomial Modelling and Its Applications; Chapman & Hall: London, UK, 1996. [Google Scholar]
- Anderson, T.W. An Introduction to Multivariate Statistical Analysis, 3rd ed.; Wiley: New York, NY, USA, 2003. [Google Scholar]
- Dempster, A.P.; Laird, N.M.; Rubin, D.B. Maximum Likelihood from Incomplete Data via the EM Algorithm. J. R. Stat. Soc. Ser. B 1977, 39, 1–38. [Google Scholar] [CrossRef] [Scilit]
- Doucet, A.; de Freitas, N.; Gordon, N. Sequential Monte Carlo Methods in Practice; Springer: New York, NY, USA, 2001. [Google Scholar]
- Campbell, J.Y.; Lo, A.W.; MacKinlay, A.C. The Econometrics of Financial Markets; Princeton University Press: Princeton, NJ, USA, 1997. [Google Scholar]
- Dupire, B. Pricing with a Smile. Risk 1994, 7, 18–20. [Google Scholar]
- Gatheral, J. The Volatility Surface: A Practitioner’s Guide; Wiley: Hoboken, NJ, USA, 2006. [Google Scholar]
- Risken, H. The Fokker–Planck Equation: Methods of Solution and Applications, 2nd ed.; Springer: Berlin, Germany, 1989. [Google Scholar]
- Daniluk, A.; Lakshtanov, E.; Muchorski, R. Denoised Monte Carlo for option pricing and Greeks estimation. arXiv 2024, arXiv:2402.12528. [Google Scholar] [CrossRef] [Scilit]
- Case, G. Comparative Study of Monte Carlo and Quasi-Monte Carlo Techniques for Enhanced Derivative Pricing. arXiv 2025, arXiv:2502.17731. [Google Scholar] [CrossRef] [Scilit]
- Ding, L.; Lu, E.; Cheung, K. Deep Learning Option Pricing with Market Implied Volatility Surfaces. arXiv 2025, arXiv:2509.05911. [Google Scholar] [CrossRef] [Scilit]
- Wang, Y.; Guo, X.; Wang, K. Rational Spectral Collocation Method for Solving Black-Scholes and Heston Equations. Comput. Econ. 2024, 65, 2595–2624. [Google Scholar] [CrossRef] [Scilit]
- Rao, X.; Sawangtong, P.; Mehrdoust, F.; Najafi, A. A hybrid θ-finite difference and spectral method for multi-dimensional option pricing. J. Comput. Appl. Math. 2026, 478, 117237. [Google Scholar] [CrossRef] [Scilit]

Disclaimer/Publisher’s Note: The statements, opinions and data contained in all publications are solely those of the individual author(s) and contributor(s) and not of MDPI and/or the editor(s). MDPI and/or the editor(s) disclaim responsibility for any injury to people or property resulting from any ideas, methods, instructions or products referred to in the content. |
© 2026 by the authors. Licensee MDPI, Basel, Switzerland. This article is an open access article distributed under the terms and conditions of the Creative Commons Attribution (CC BY) license.