


Abstract
The in situ stress state of deep surrounding rock is critically important for mine safety and resource extraction. This study focuses on a lead–zinc mine in Yunnan Province, China, with the objective of characterizing the distribution of the deep in situ stress field. A self-developed digital wireless acquisition system for in situ stress measurement with dual temperature compensation was emplo6yed to conduct measurements at eight underground points. Based on the measured data, the in situ stress field was inverted using the finite difference method combined with multiple linear regression, and a three-dimensional geological model of the mining area was established. The results indicate that the stress field is predominantly governed by horizontal tectonic stress, with the principal stresses showing an approximately linear increase with depth. The average relative error between the inverted and measured stress field values was 7.74%. Finally, stress parameters at key underground locations derived from the inversion model were applied in numerical simulations, providing data support for the engineering design and safety assessment in deep mining of this lead–zinc mine.
Keywords:
deep surrounding rock; stress relief method; dual temperature compensation; multiple linear regression; inversion of the geostress field MSC:
74S99
1. Introduction
The in situ stress state of deep surrounding rock in mines is a critical factor governing the stability of underground excavations, the safety of mining operations, and the prevention of dynamic hazards. As mining depths continue to increase, in situ stress levels rise significantly, often accompanied by the deterioration of surrounding rock towards weaker and more fractured conditions, posing severe challenges to mine design and construction. Therefore, accurate measurement and scientific assessment of the in situ stress state in deep rock masses are of paramount theoretical and practical importance for ensuring mine safety, for optimizing engineering layouts, and for enhancing resource extraction efficiency.
Commonly used methods for in situ stress measurement in rock masses include hydraulic fracturing [1], acoustic emission [2], and the hollow inclusion strain gauge technique [3]. Each method possesses specific applicable scenarios and technical requirements. Among them, the hollow inclusion strain gauge method enables in situ measurement, faithfully reflecting the primitive rock stress state, and can determine the magnitudes and directions of the three principal stresses in the rock mass. Owing to its accuracy and reliability, this method has been widely adopted for stress measurements in deep rock masses [4].
Since Hast’s pioneering application of the stress relief method using the overcoring technique for in situ stress measurement in Europe in 1951 [5], the method has undergone continuous theoretical and technological refinements. Cai et al. [6,7] made significant improvements to the traditional stress relief method by introducing comprehensive temperature compensation technology and corresponding hollow inclusion strain gauge. They conducted systematic measurements of the in situ stress field in the main mining area of the Linglong Gold Mine, thereby elucidating its characteristic distribution patterns. Other scholars, including Zhou [8] and Qiao [9], have also successfully applied this method to in situ stress measurements at the Sanshandao Gold Mine in Shandong and the Aerhada Lead–Zinc Mine, respectively, achieving satisfactory engineering results.
However, due to constraints such as testing costs, borehole conditions, and rock mass integrity, large-scale in situ stress measurement campaigns are often impractical, and the acquired data only reflect localized stress characteristics. Consequently, inversion of the in situ stress field based on measured data becomes particularly crucial for obtaining the macro-scale stress distribution within a study area. Current primary methods for in situ stress field inversion and numerical simulation include Heim’s rule, the lateral pressure coefficient method, the boundary load adjustment method, the stress function method, the displacement function method, regression analysis, neural networks, and genetic algorithms.
As a classical statistical analysis technique, multiple linear regression (MLR) has been extensively applied in the inversion of initial in situ stress fields in recent years. The methodology proposed by Guo et al. [10], which combines a finite element mathematical model with linear regression for stress analysis, has been widely adopted due to its ability to ensure the uniqueness and rationality of the stress field. Zhao et al. [11] employed MLR and finite element analysis to systematically investigate the in situ stress field distribution characteristics of the Wuqiaoling Tunnel, providing critical input for the tunnel design. Based on hydraulic fracturing measurements, He et al. [12] utilized MLR to invert the tectonic stress field in a tunnel area and analyzed the distribution of principal stresses along the tunnel axis, offering vital support for the construction of a high-altitude, deep-buried tunnel. Xu et al. [13] applied the method to invert the in situ stress field in a steeply inclined ultra-thick coal seam within a fold structure area, subsequently assessing rock burst risk based on the results, thereby providing a theoretical foundation for safe coal mining. Pei et al. [14] introduced a local stress inversion method considering stress-induced failure characteristics of rock mass and successfully predicted the local stress field using MLR combined with intelligent numerical inversion technology at the Baihetan Hydropower Station. To address inversion accuracy, Zhu et al. [15] employed a partial least squares regression method within FLAC3D to fit individual stress components separately, effectively enhancing simulation accuracy in local anomalous stress zones and resolving issues related to singular boundary stress distributions. Meng et al. [16] proposed quantitative indices based on probability and statistics theory to measure the deviation between measured and calculated stresses, optimizing the inversion process for regression models with and without constant terms, thereby further improving the accuracy of stress field inversion. Han et al. [17] applied MLR to analyze the three-dimensional in situ stress field distribution of a high-head pumped storage power station and performed an anti-splitting analysis of the surrounding rock. These studies collectively demonstrate the broad applicability and high accuracy of the multiple linear regression method in geostress inversion. Although multiple-linear-regression-based back analysis is a mature technique, its integrated application with a self-developed dual-temperature-compensated digital wireless measurement system in the complex high-stress conditions of deep metal mines remains underexplored.
To systematically characterize the in situ stress distribution in the deep surrounding rock of a lead–zinc mine in Yunnan, this study employs a self-developed in situ digital wireless stress measurement system featuring dual temperature compensation for field measurements. Based on a refined geological model, the multiple linear regression method is utilized for inversion of the in situ stress field, and the effectiveness of the approach is verified. Stress parameters at key underground locations are derived from the inversion model, enabling localized small-scale numerical simulations. This study provides a validated high-precision methodology for deep hard rock mining conditions—integrating advanced field measurement, three-dimensional back analysis, and localized application—thereby addressing the practical challenge of obtaining reliable stress data for engineering design under such demanding settings.
2. Dual-Temperature-Compensated In Situ Digital Wireless Stress Measurement Technology
The deep rock mass environment is characterized by high in situ stress, high seepage pressure, high ground temperature, and strong disturbances. Conducting in situ stress measurements in such conditions necessitates careful consideration of the equipment’s measurement range and the impact of the environment on accuracy, particularly when temperatures—both ambient and from the device itself—significantly influence the results. To address this, the research team developed an in situ digital wireless acquisition system for stress measurement that incorporates dual-temperature compensation.
2.1. Improvement of the In Situ Digital Hollow Inclusion Strain Gauge
Currently, commercially available digital hollow inclusion strain gauges predominantly utilize resistive strain gauges in Wheatstone bridge circuits. To address the limitations of conventional designs, an in situ digital hollow inclusion strain gauge has been developed based on the principle of complete temperature compensation. Comprehensive enhancements were made in strain gauge configuration, structural design, cement properties, circuitry, and temperature compensation, thereby reducing measurement error at each stage and improving the accuracy of in situ stress measurement.
Academician Cai pioneered a hollow inclusion strain gauge with a 15-wire connection method [18]. This design connects two identical wires of the same length and type to the bridge arm of the active strain gauge and its adjacent arm, effectively eliminating lead wire errors. Recognizing temperature as the most critical factor affecting measurement accuracy, a new strain conversion device was designed to transform resistance changes into voltage signals. A temperature-sensitive resistor was positioned near the strain gauge to record temperature variations for precise compensation. The design also accounts for additional thermal strain induced by the strain gauge leads, thereby improving the measurement accuracy of conventional hollow inclusion strain gauge.
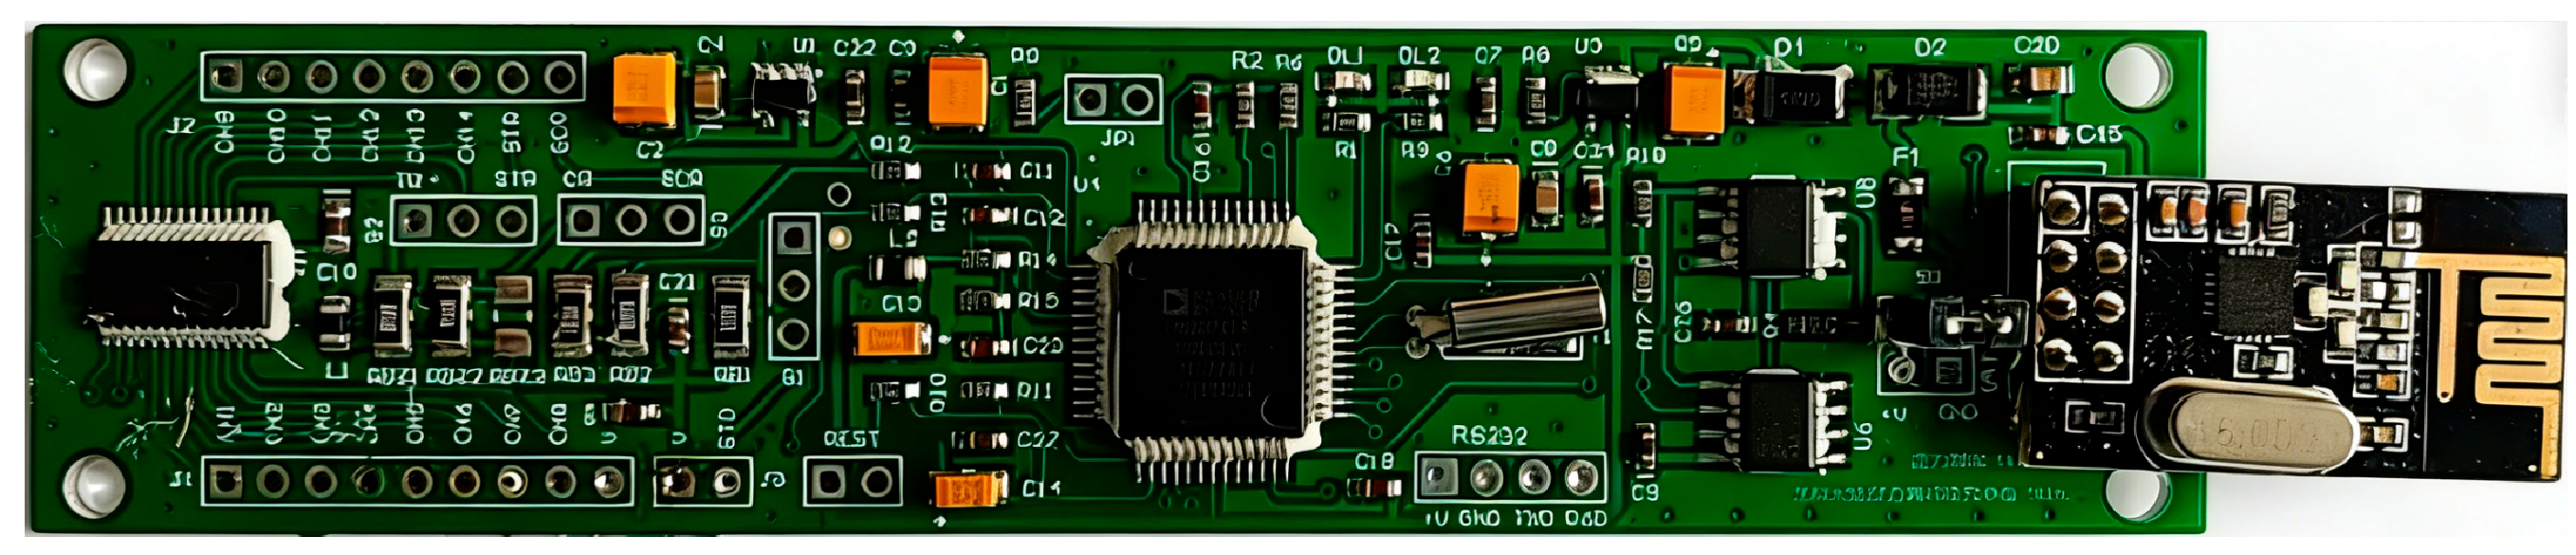
Furthermore, a wireless acquisition and transmission module was developed for the strain gauge. Wireless acquisition eliminates errors caused by long lead wires, including resistance, additional thermal strain, and common line voltage drop, thus enhancing measurement accuracy. The miniaturized acquisition unit is housed within an instrument compartment, allowing both the acquisition and measurement systems to be placed inside the borehole. However, significant temperature fluctuations within the borehole can affect the results. To minimize the error impact of temperature variations on the acquisition circuit, improvements were made based on the specialized Wheatstone bridge circuit for the hollow inclusion strain gauge invented by the academician Cai [18,19]. The micro-acquistion card for the in situ digital hollow inclusion strain gauge is shown in Figure 1.
Figure 1.
Micro-acquisition card for the in situ digital hollow inclusion strain gauge.
The in situ digital hollow inclusion strain gauge employs a dual-temperature compensation circuit. A dedicated thermistor, suitable for the specialized Wheatstone bridge circuit of the hollow inclusion strain gauge, is incorporated for temperature calibration, allowing adjustment of measured values during temperature changes. For instance, prior to measurement, the circuit temperature can be calibrated and adjusted according to the ambient temperature variations. During measurement, the calibrated values undergo secondary temperature compensation based on the characteristics of the temperature sensor in the circuit, thereby achieving dual-temperature compensation. In deep in situ stress measurement, using this method to calibrate and eliminate temperature errors can reduce or even eliminate the measurement errors caused by temperature variations in both the strain gauges and the acquisition circuit.
2.2. Calibration of Dynamic and Static Mechanical Parameters for Stress-Relieved Cores
The rapid, convenient, and accurate acquisition of dynamic mechanical parameters from rock cores is crucial for in situ stress measurement. Although the relationships between the dynamic and static elastic moduli of rocks have been studied, the most scientifically sound and established method remains the confining pressure test on core samples following in situ stress relief to obtain the requisite mechanical parameters. However, in practice, cores often become fractured or broken after stress relief, rendering them unsuitable for conventional confining pressure tests. To address this limitation, this study utilizes a self-developed ultrasonic–acoustic emission–strain monitoring system. A multi-parameter characterization method correlating the rock mass stress field and physical field is introduced to conduct synchronized monitoring tests on rock damage and failure. Based on the damage evolution characteristics of the cores, the dynamic elastic modulus and dynamic Poisson’s ratio of the stress-relieved cores are calculated. The static mechanical parameters of the cores are then derived from the established relationship between dynamic and static parameters.
2.2.1. Calibration of Elastic Modulus and Poisson’s Ratio via Confining Pressure Calibration Tests
The elastic modulus and Poisson’s ratio of rock cores are essential parameters for calculating in situ stress in the laboratory. The prevailing method for determining these parameters is the confining pressure calibration test. In this test, confining pressure is applied to a stress-relieved core using a biaxial high-pressure calibration device. The strain values, measured by an in situ digital hollow inclusion strain gauge embedded within the core, are recorded. A confining pressure–strain curve is then plotted, and the elastic modulus and Poisson’s ratio of the rock are calculated using formulas derived from thick-walled cylinder theory.
Under the assumption that the core behaves as a linear elastic material during loading, the elastic modulus, E, can be calculated using the following formula [20]:
where E is the elastic modulus; k1 is the correction coefficient; σr is the radial pressure, with compressive stress defined as positive; εθ is the average strain measured from the three sets of strain gauges, where compressive strain is also taken as positive; R and r are the outer radius of the core and the radius of the small hole, respectively.
Poisson’s ratio, ν, is given by:
where v is Poisson’s ratio; εa is the average axial strain obtained from the three sets of strain gauges.
2.2.2. Calibration of Dynamic Parameters for Stress-Relieved Cores
The calculation of dynamic mechanical parameters requires the longitudinal and shear wave velocities of the rock core. However, during in situ stress measurement, the stress-relieved core contains a hollow inclusion strain gauge that is tightly cemented to the inner borehole wall. This configuration prevents the insertion of an ultrasonic receiving sensor into the borehole, making it impossible to directly measure the wave velocity through the opposite wall. To address this issue, the wave velocities from both direct transmission and surface transmission measurements were obtained from conventional core specimens in the same borehole. A proportional relationship between these two velocities was established, enabling the estimation of the direct transmission wave velocity for the rock mass at the stress-relieved borehole wall. The anisotropy of the core was then characterized by analyzing the variations in longitudinal and shear wave velocities among different measurement points.
The wave velocity test was conducted in accordance with the Standard for Rock Testing in Water Conservancy and Hydropower Engineering (SL/T 264–2020) [21]. The direct transmission method was employed to measure the wave velocities. Based on the estimated direct transmission wave velocities for the stress-relieved core, the dynamic mechanical parameters at three measurement points were determined. The elastic parameters for an infinite solid can be calculated using the following formulae:
where Ed is the dynamic elastic modulus; ρ is the density of the core; VP is the average longitudinal wave velocity; VS is the average shear wave velocity; Vd is the dynamic Poisson’s ratio.
3. In Situ Stress Measurement of Deep Surrounding Rock
3.1. Project Overview
A lead–zinc mine in northeastern Yunnan Province, formed by structurally controlled ore-fluid emplacement [22], is situated on the eastern side of the Xiaojiang Fault Zone within the Diandong Fold Belt of the Yangtze Paraplatform. After over 70 years of development, the underground mining depth has reached 1500 m, and operations are progressively advancing to depths of between 1500 and 2500 m. With increasing depth, the in situ stress escalates, and the surrounding rock becomes more fractured. Stability control of roadways, chambers, and stope surroundings has become increasingly critical, posing significant challenges to deep mining safety. Consequently, it is essential to measure the in situ stress field in the deep sections of the mine to provide a theoretical basis for ensuring safe mining practices.
3.2. In Situ Stress Measurement
3.2.1. Layout of Measurement Points and Field Procedure
The rational layout of measurement points is crucial for accurately characterizing the in situ stress distribution across the entire mining area. Therefore, eight measurement points were strategically selected in the field, taking full account of rock mass quality and avoiding complex excavations and fault fracture zones (based on the China Geodetic Coordinate System 2000), as detailed in Table 1.
Table 1.
Locations and test hole parameters of in situ stress measurement points.
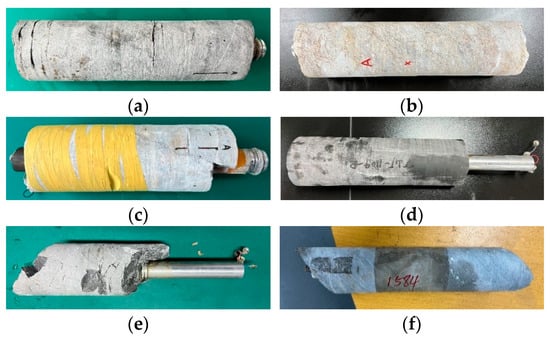
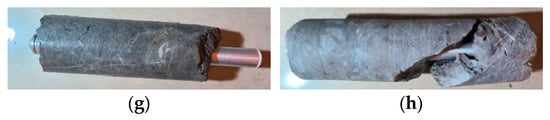
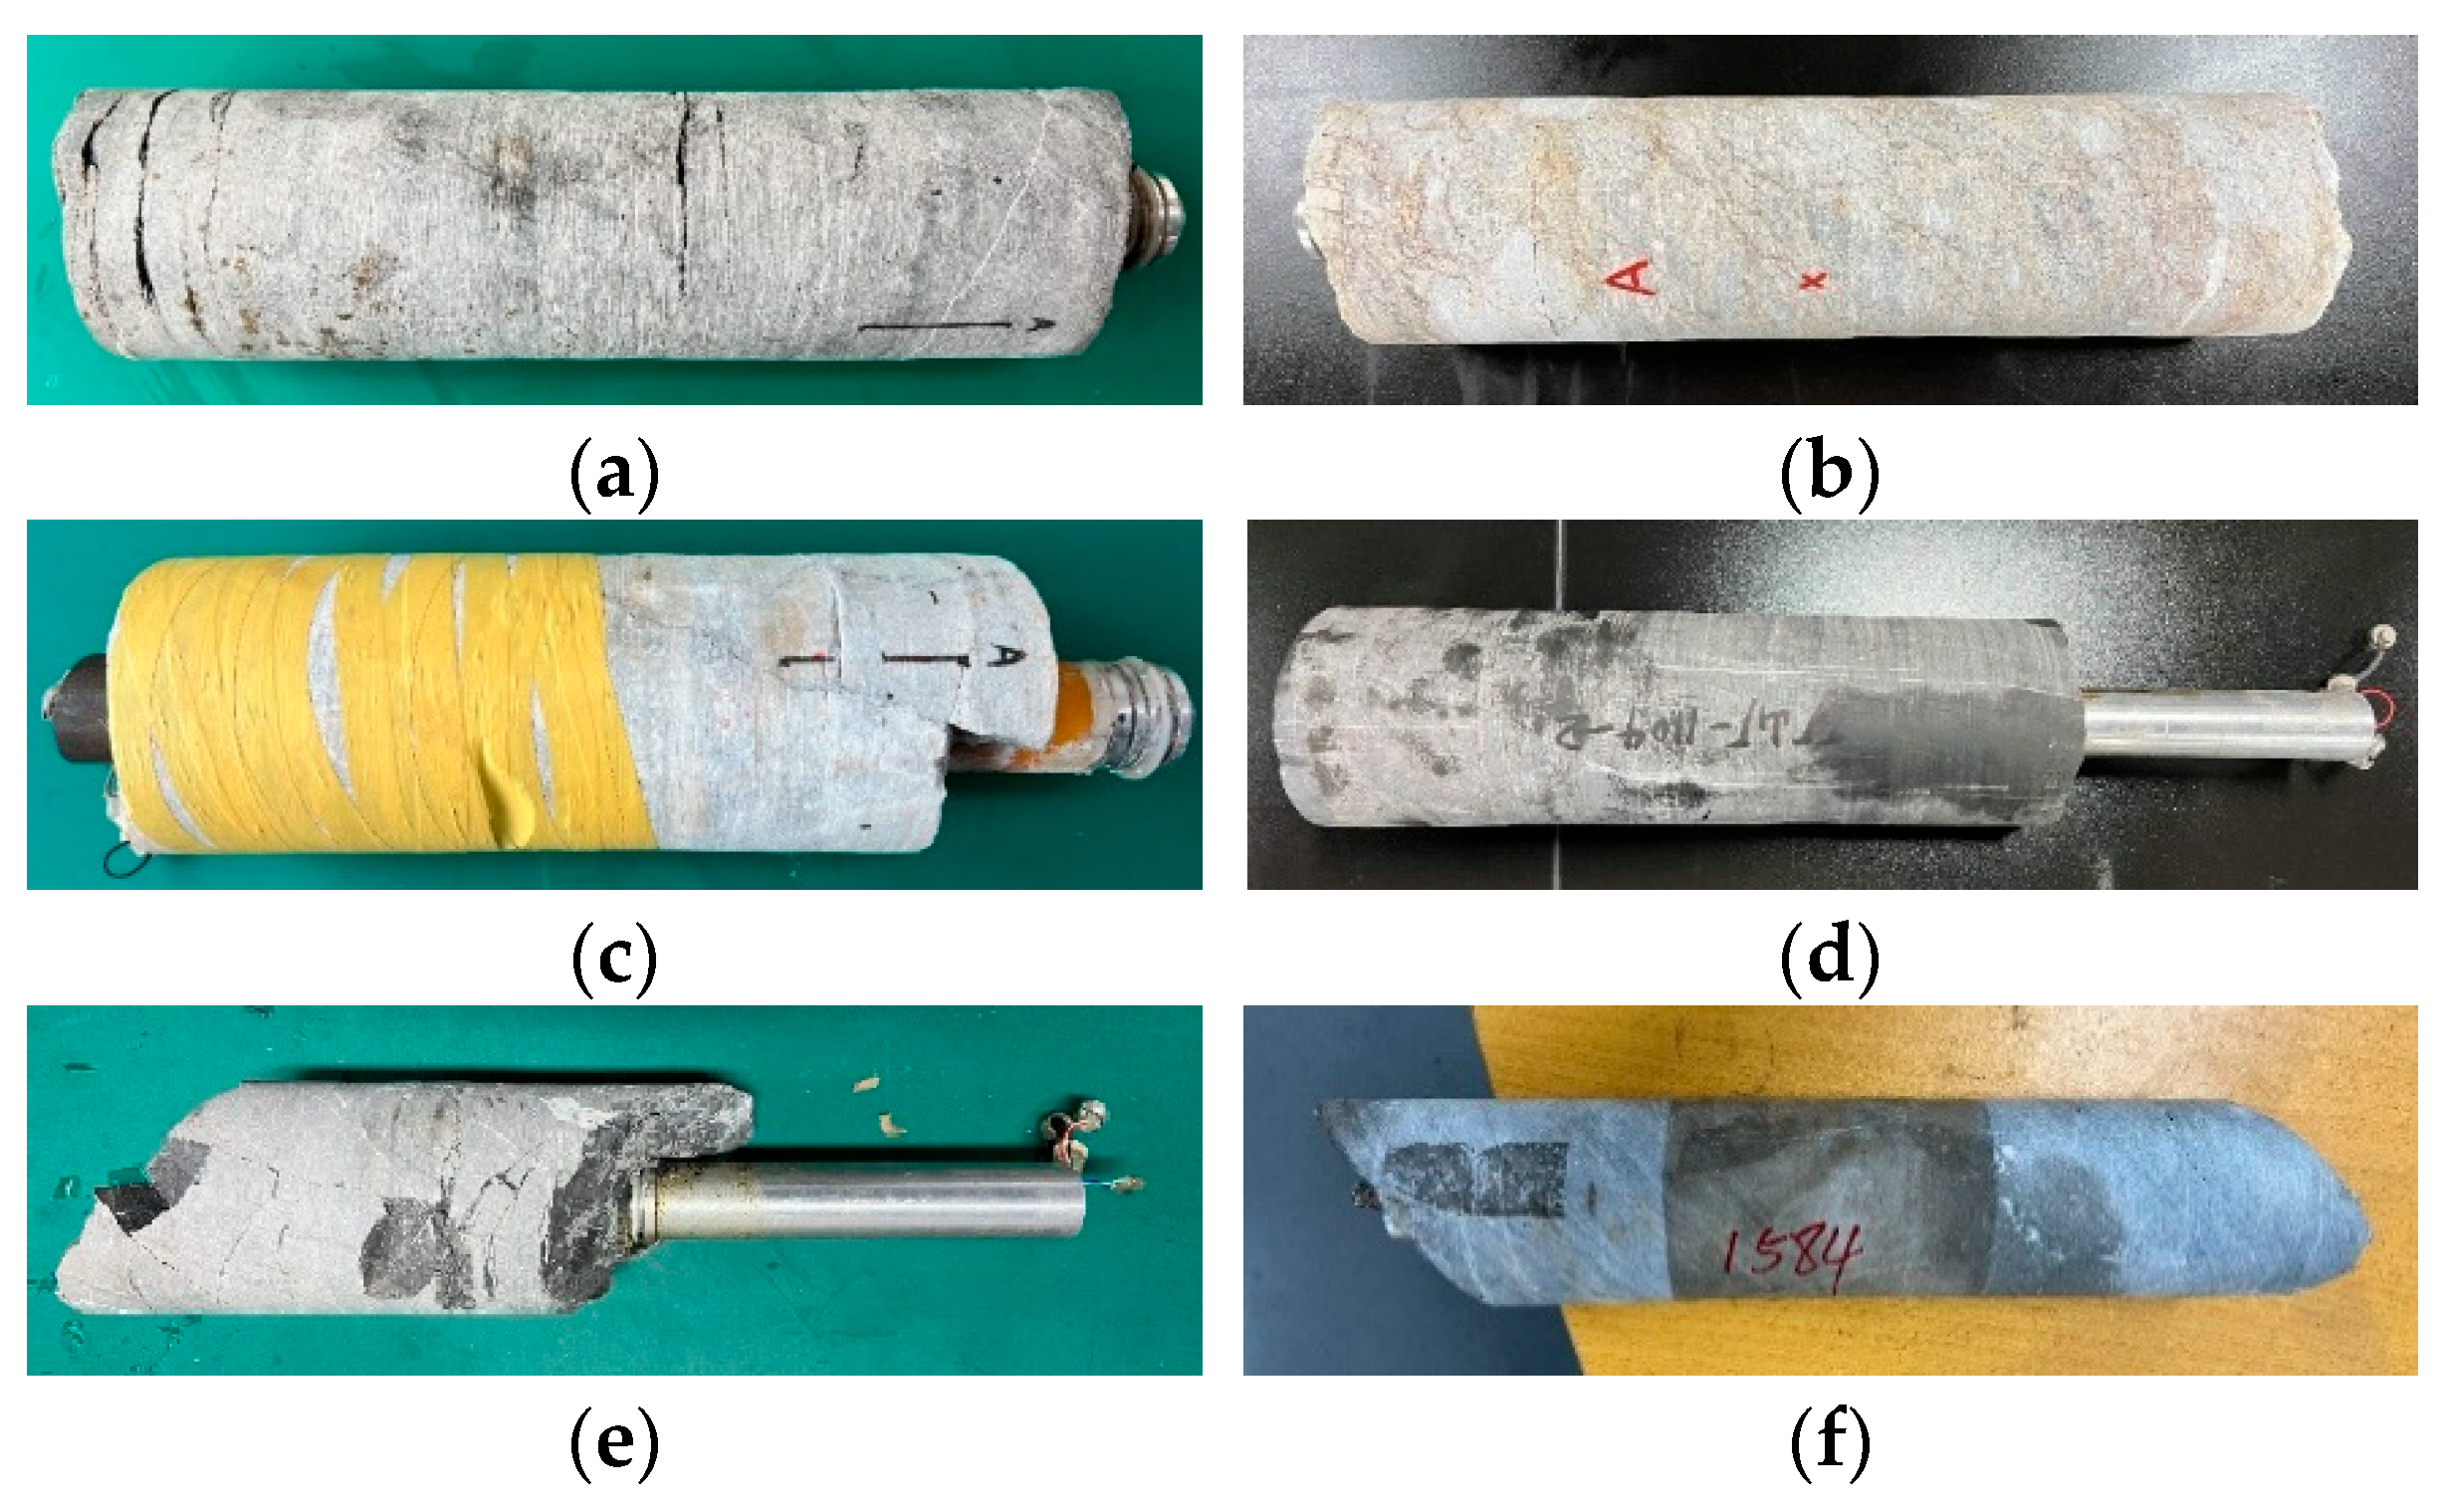
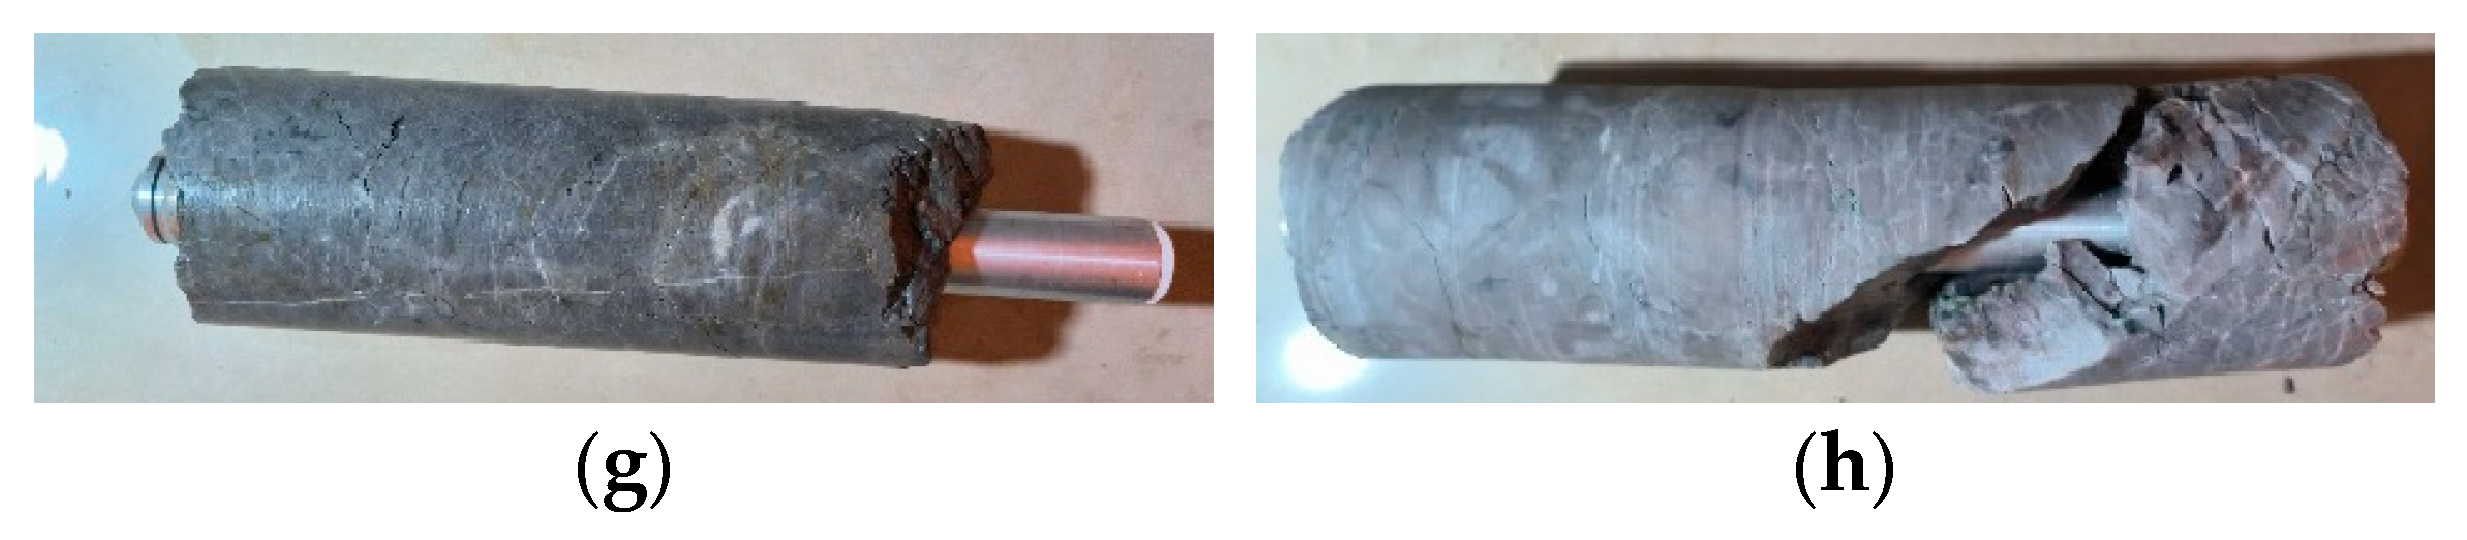
In situ stress measurements at the underground points were conducted using the digital hollow inclusion strain gauge, independently developed by the University of Science and Technology Beijing. The stress-relieved cores are shown in Figure 2.
Figure 2.
Stress-relieved core samples from measurement points (a) 1#, (b) 2#, (c) 3#, (d) 4#, (e) 5#, (f) 6#, (g) 7#, and (h) 8#.
3.2.2. Temperature Calibration and Confining Pressure Determination
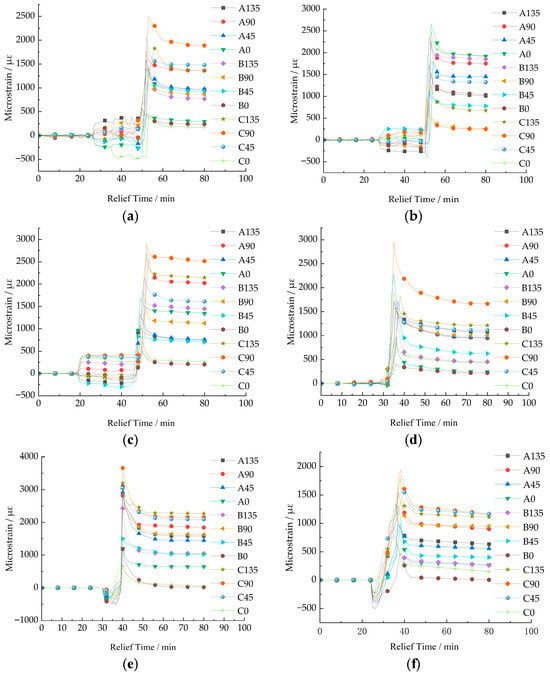
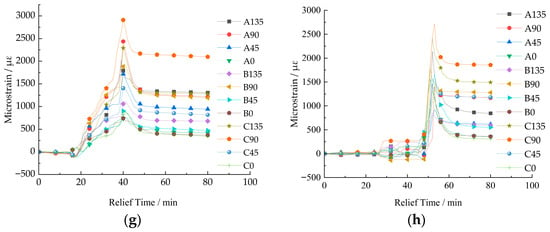
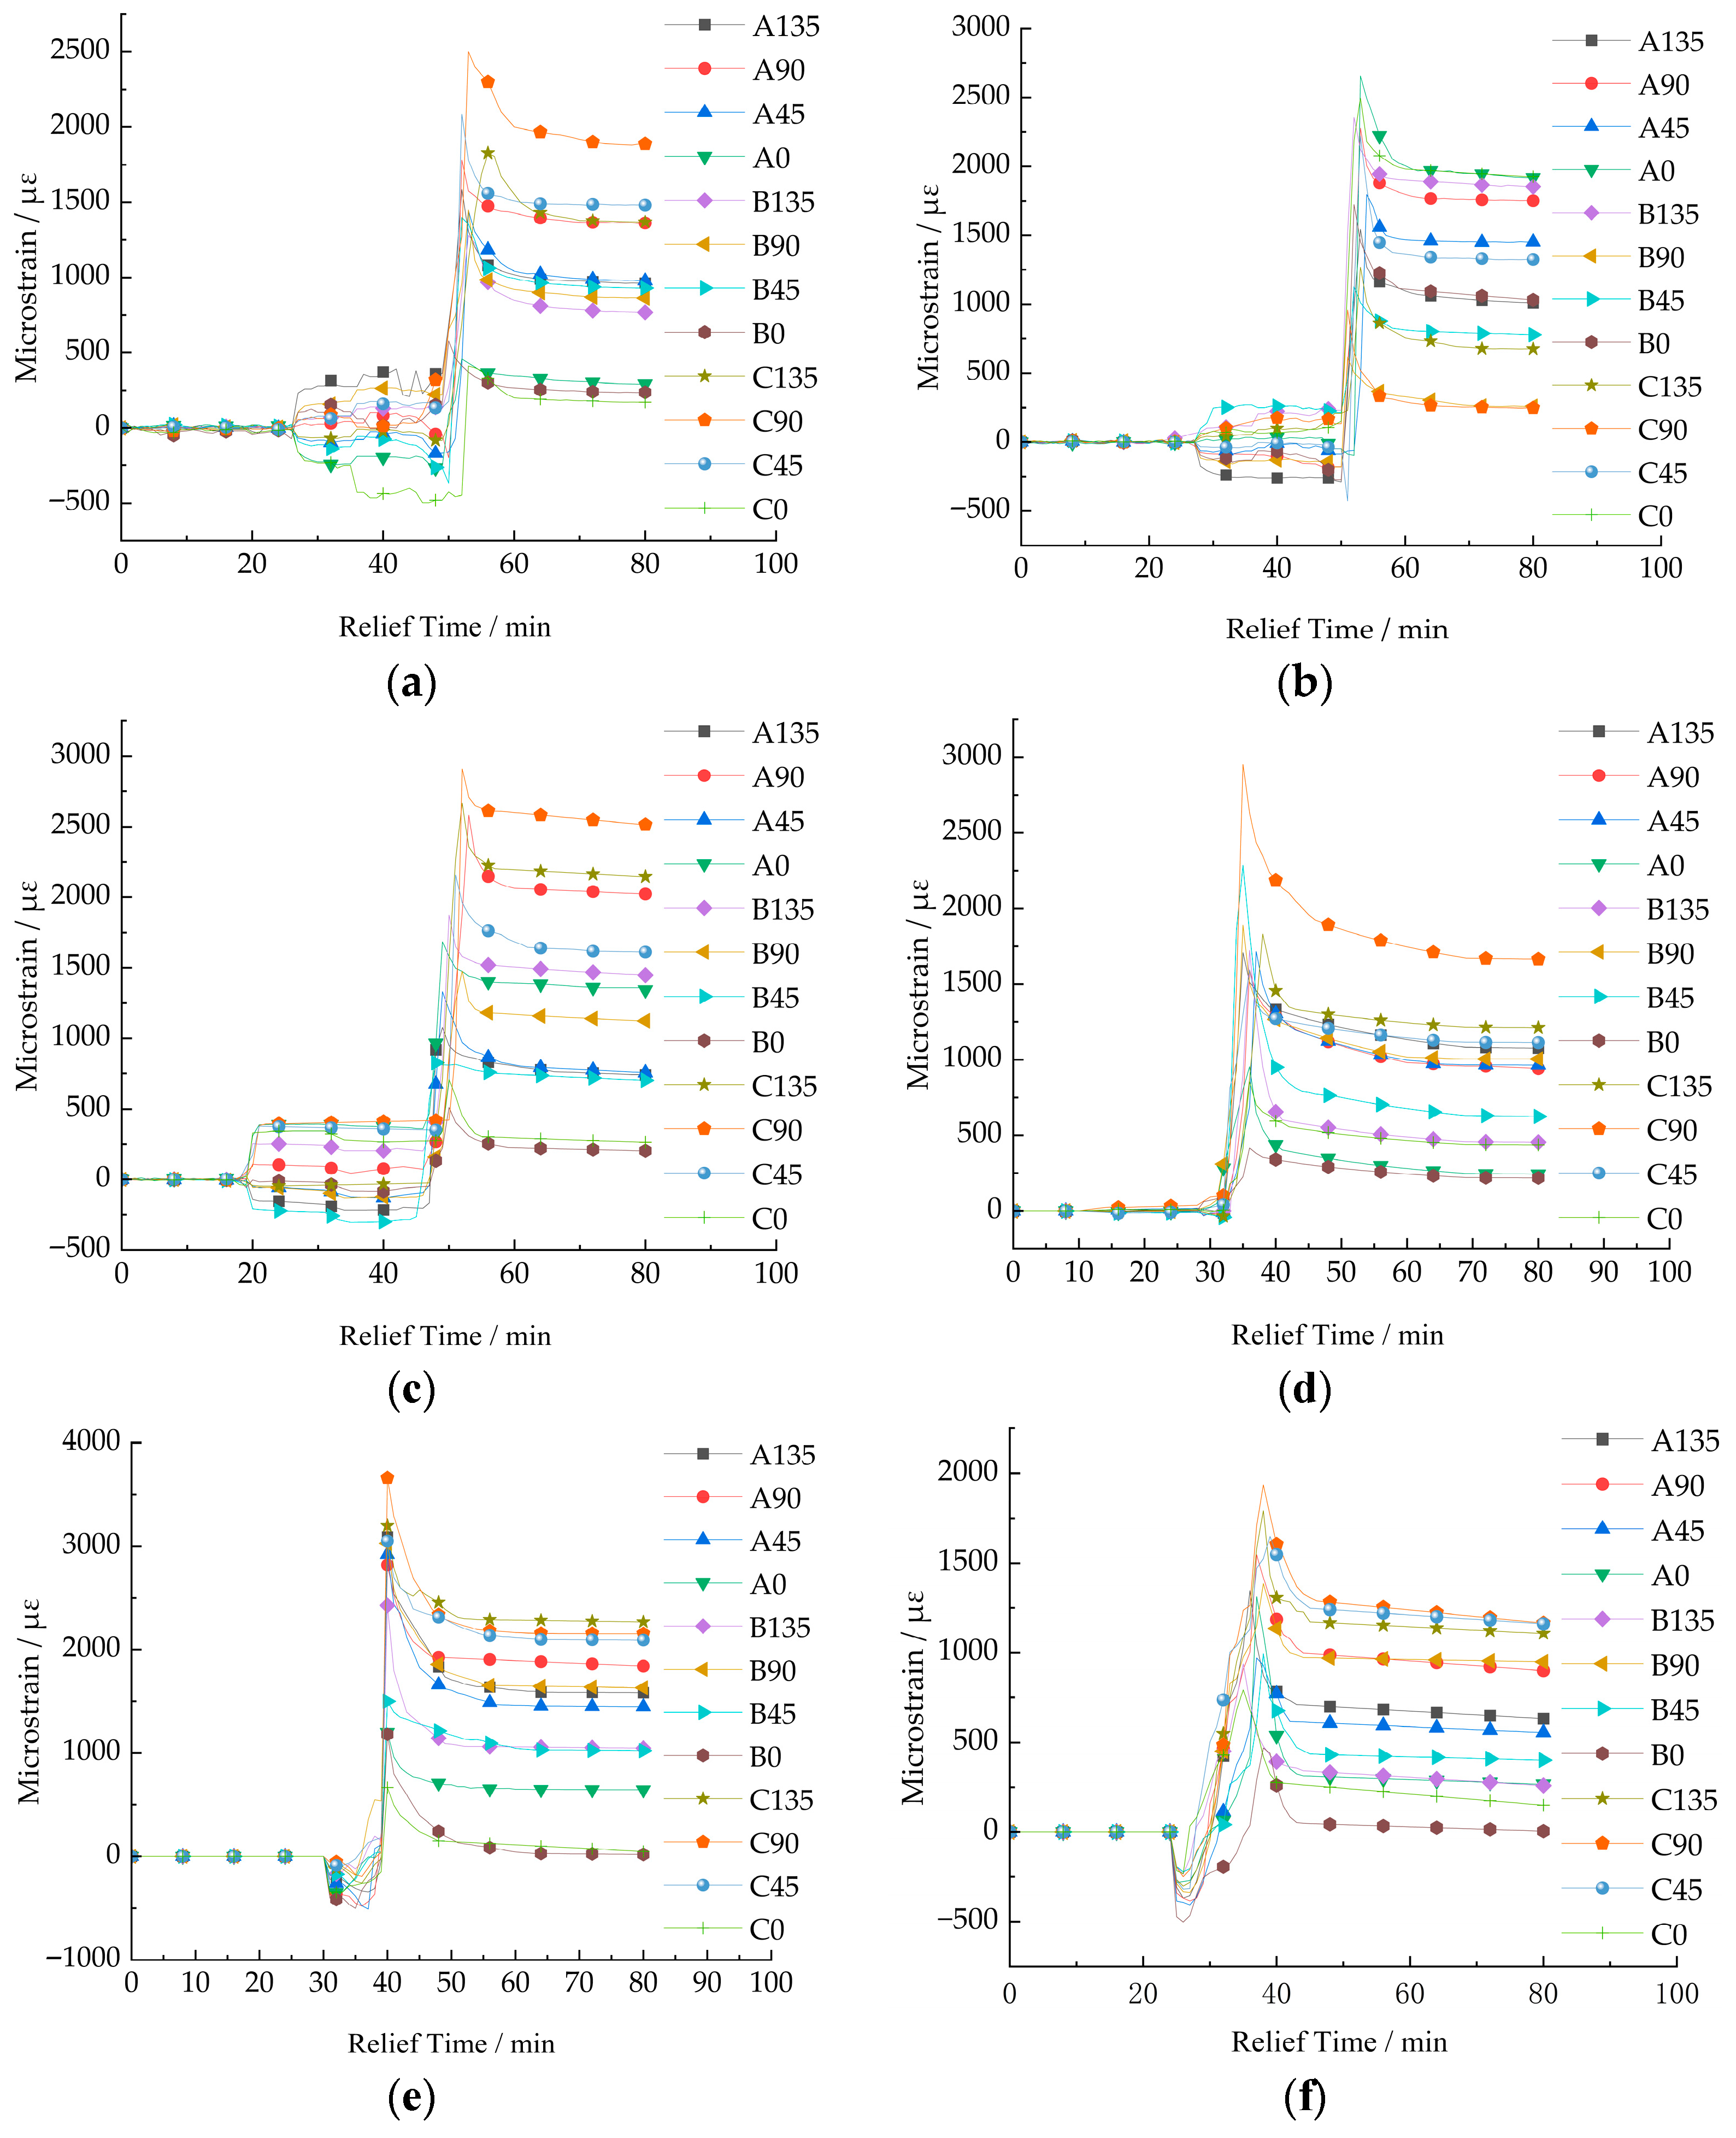
At each measurement point, strain values in 12 directions were recorded by 12 strain gauges, designated as A135, A90, A45, A0, B135, B90, B45, B0, C135, C90, C45, and C0. The letters A, B, and C represent three strain rosettes, each comprising four gauges, while the numbers (135, 90, 45, 0) indicate the angle (in degrees) between the gauge orientation and the borehole axis. In addition, a colocated thermistor channel (T1) and the acquisition system’s internal temperature channel (T2) were utilized. The fully compensated strain, based on the dual-temperature compensation algorithm, was obtained by subtracting both the temperature-induced strain of each channel and the temperature drift of the acquisition system from the raw strain relief value of each channel.
Taking measurement point #1 as an example (see Table 2), the conventional method for determining strain in hollow inclusion strain gauge stress measurement, which does not fully account for temperature effects, introduces significant errors.
Table 2.
Comparison of data from three hollow inclusion strain gauge stress measurement methods at measurement point 1#.
In the front-end digital measurement system, both the acquisition and testing systems are exposed to significant temperature variations. The implementation of a dual-temperature compensation algorithm is therefore essential to meet the accuracy requirement for full temperature compensation. Applying this algorithm, the data from the thermistor channel (T1) was corrected from 364 µε to 325 µε, representing an 11% correction. After the dual-temperature compensation was applied, the discrepancy in the fully compensated values among the measurement channels was reduced to 39 µε.
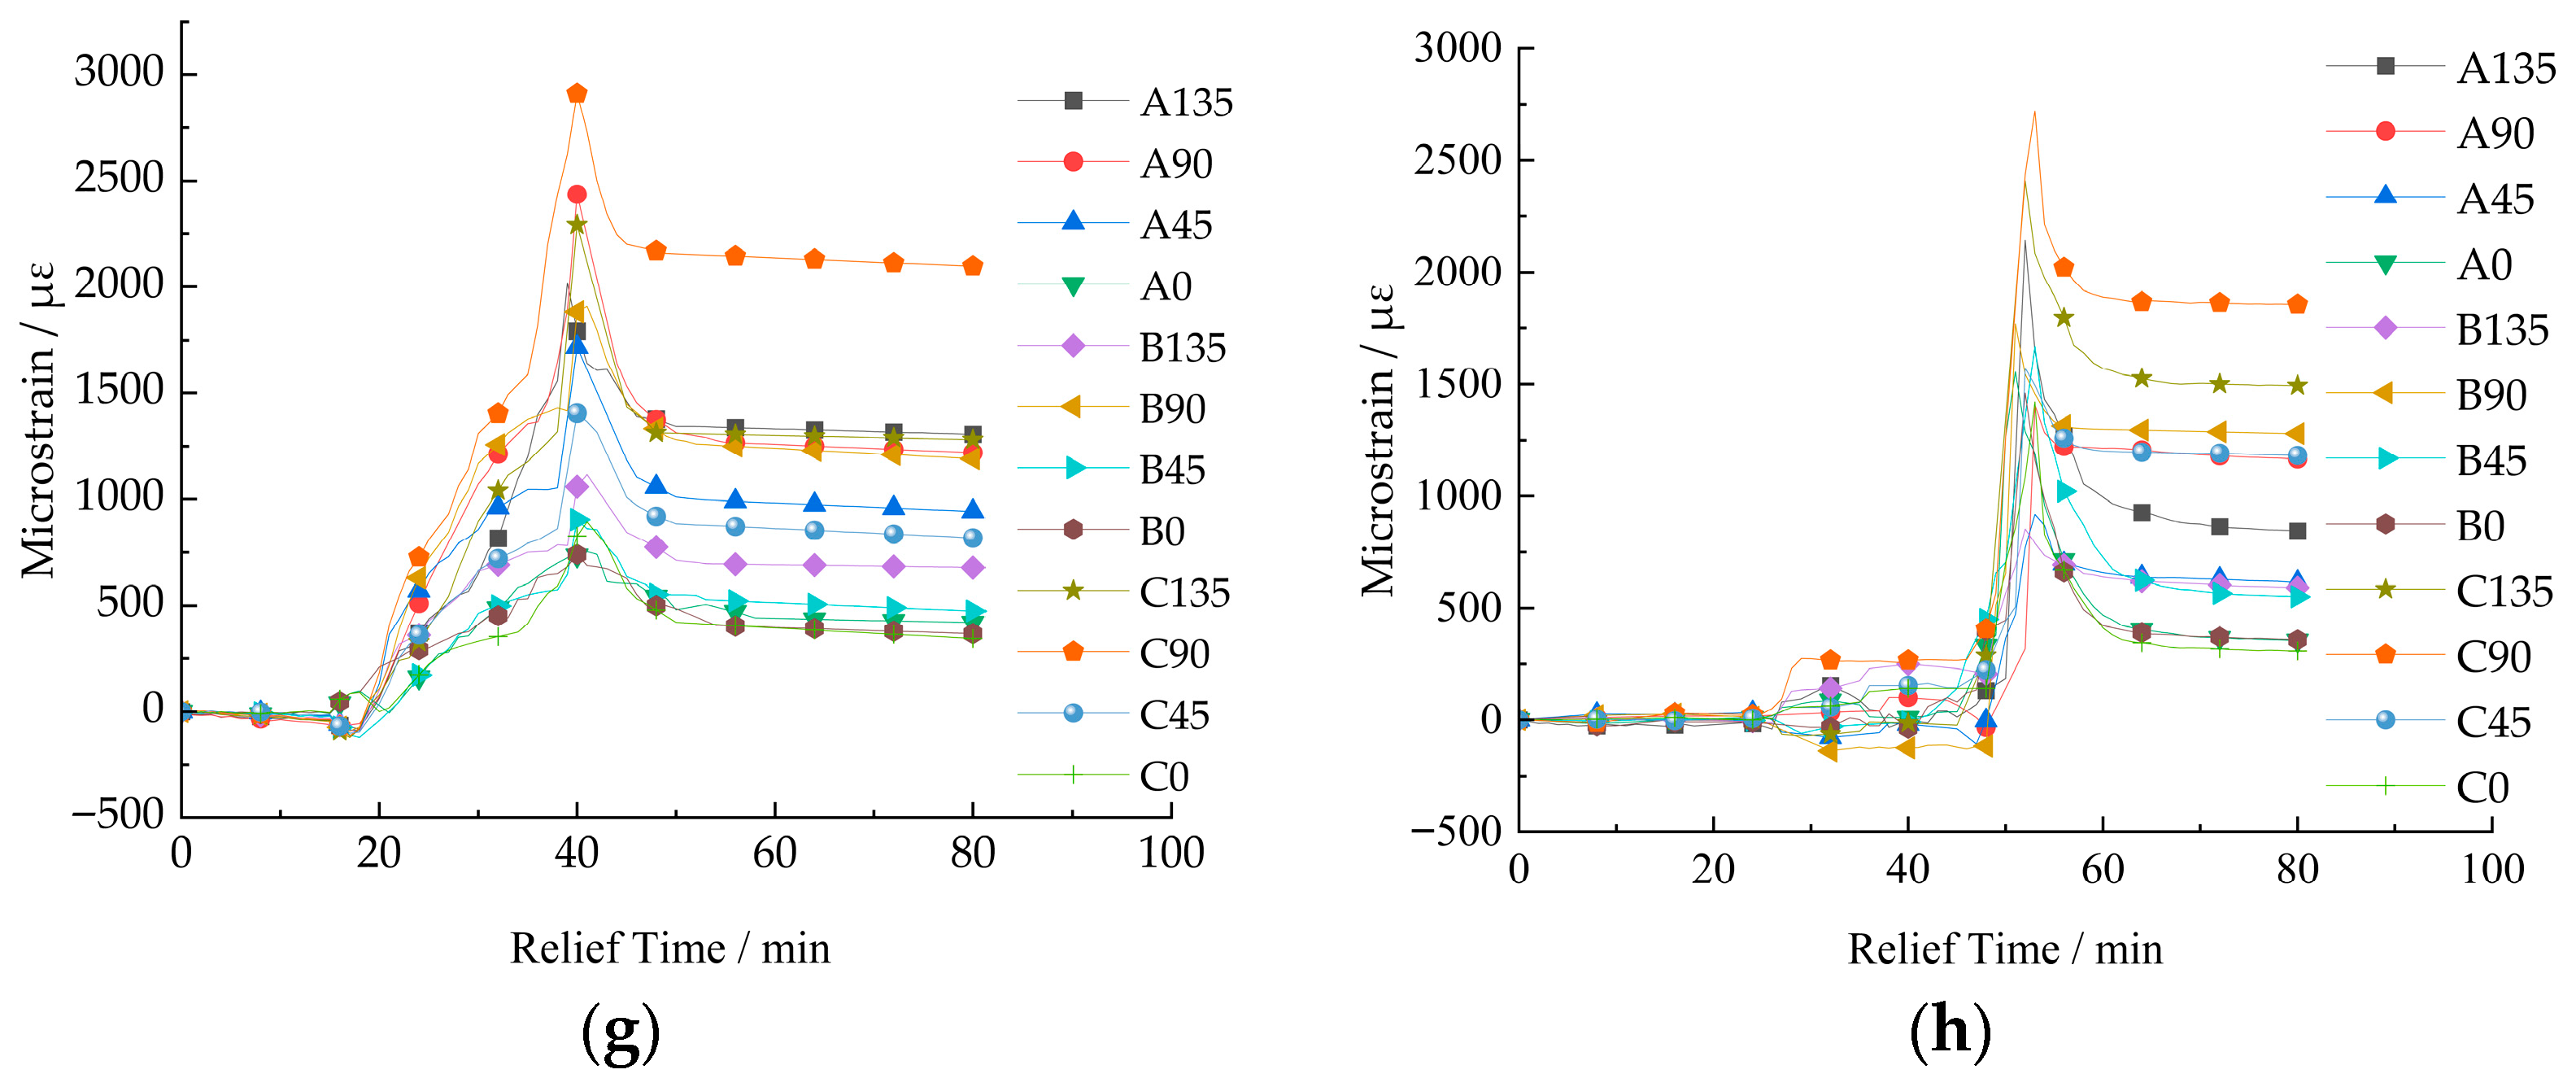
Based on the strain relief curves corrected by dual-temperature compensation at the in situ stress measurement points (Figure 3), it can be observed that the recovered strain generally varies synchronously with the advance of the borehole during the overcoming process. Before the overcoming depth reaches the measurement section (where the strain gauges are installed), the strain values recorded by the gauges are generally very small. Some gauges even register negative strain values, a result of stress redistribution caused by the drilling process, analogous to an “excavation effect.” As the overcoming depth approaches the measurement section, many curves reverse their trend. The maximum strain value occurs when the drill bit passes the immediate vicinity of the measurement section. After the overcoming depth proceeds beyond the measurement section by a certain distance, the strain values gradually stabilize, and the curves flatten.
Figure 3.
Temperature-Compensated Strain Relief Curves from the 8 Measurement Points: (a) 1# Measuring point; (b) 2# Measuring point; (c) 3# Measuring point; (d) 4# Measuring point; (e) 5# Measuring point; (f) 6# Measuring point; (g) 7# Measuring point; (h) 8# Measuring point.
The elastic modulus and Poisson’s ratio of the surrounding rock at each measurement point, calculated using the method described in Section 2.2.1, are presented in Table 3.
Table 3.
Calculated elastic modulus and Poisson’s ratio values.
3.2.3. Development of the In Situ Stress Calculation Algorithm
The in situ stress components are determined from the hollow inclusion strain gauge measurements using Equations (5) and (6), which define the relationship between strain and the three-dimensional stress state [23].
Among them:
where σx, σy, σz, τxy, τyz, and τzx, are the three-dimensional stress components at the measurement points, respectively. ~ represent the measured strain values of 12 strain gauges; E is the elastic modulus of the rock at the measurement point; ν is the Poisson’s ratio of the rock at the measurement point; k1, k2, k3, and k4 are the correction factors given by Vorotniki and Walton, respectively.
Then, the magnitudes and orientations of the principal stresses are calculated using Equations (8)–(10), derived from the stress state equation and Shengjin’s formula.
where σ1, σ2, and σ3 are respectively the three principal stresses at the measurement points; θ is the inclination angle of the principal stress; β the angle between the principal stress of β and the Y-axis; the azimuth of the principal stress φσ; φz represents the azimuth of the Z-axis. φ is the angle formed by rotating the positive Z-axis counterclockwise to the positive direction of the principal stress projection. Its calculation formula is related to the quadrant where the principal stress is located, as shown in Table 4.
Table 4.
Calculation of the principal stress orientation angle φ.
3.3. Analysis of In Situ Stress Distribution Patterns in the Study Area
The six in situ stress components and the magnitude, direction, and inclination of the principal stresses were calculated using the “Data Processing–In-Situ Stress Calculation” program, with results presented in Table 5 and Table 6.
Table 5.
In situ stress component values at each measurement point.
Table 6.
Calculated principal stresses at each measurement point.
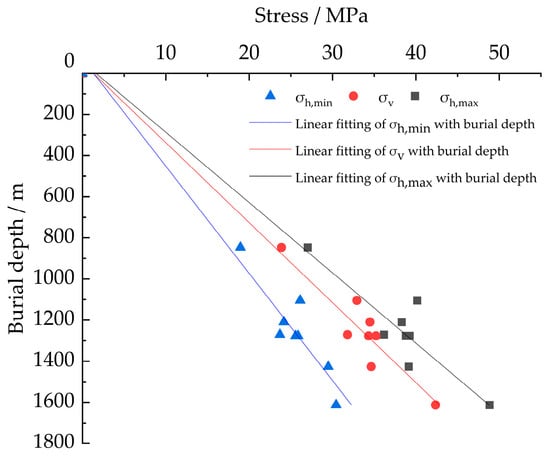
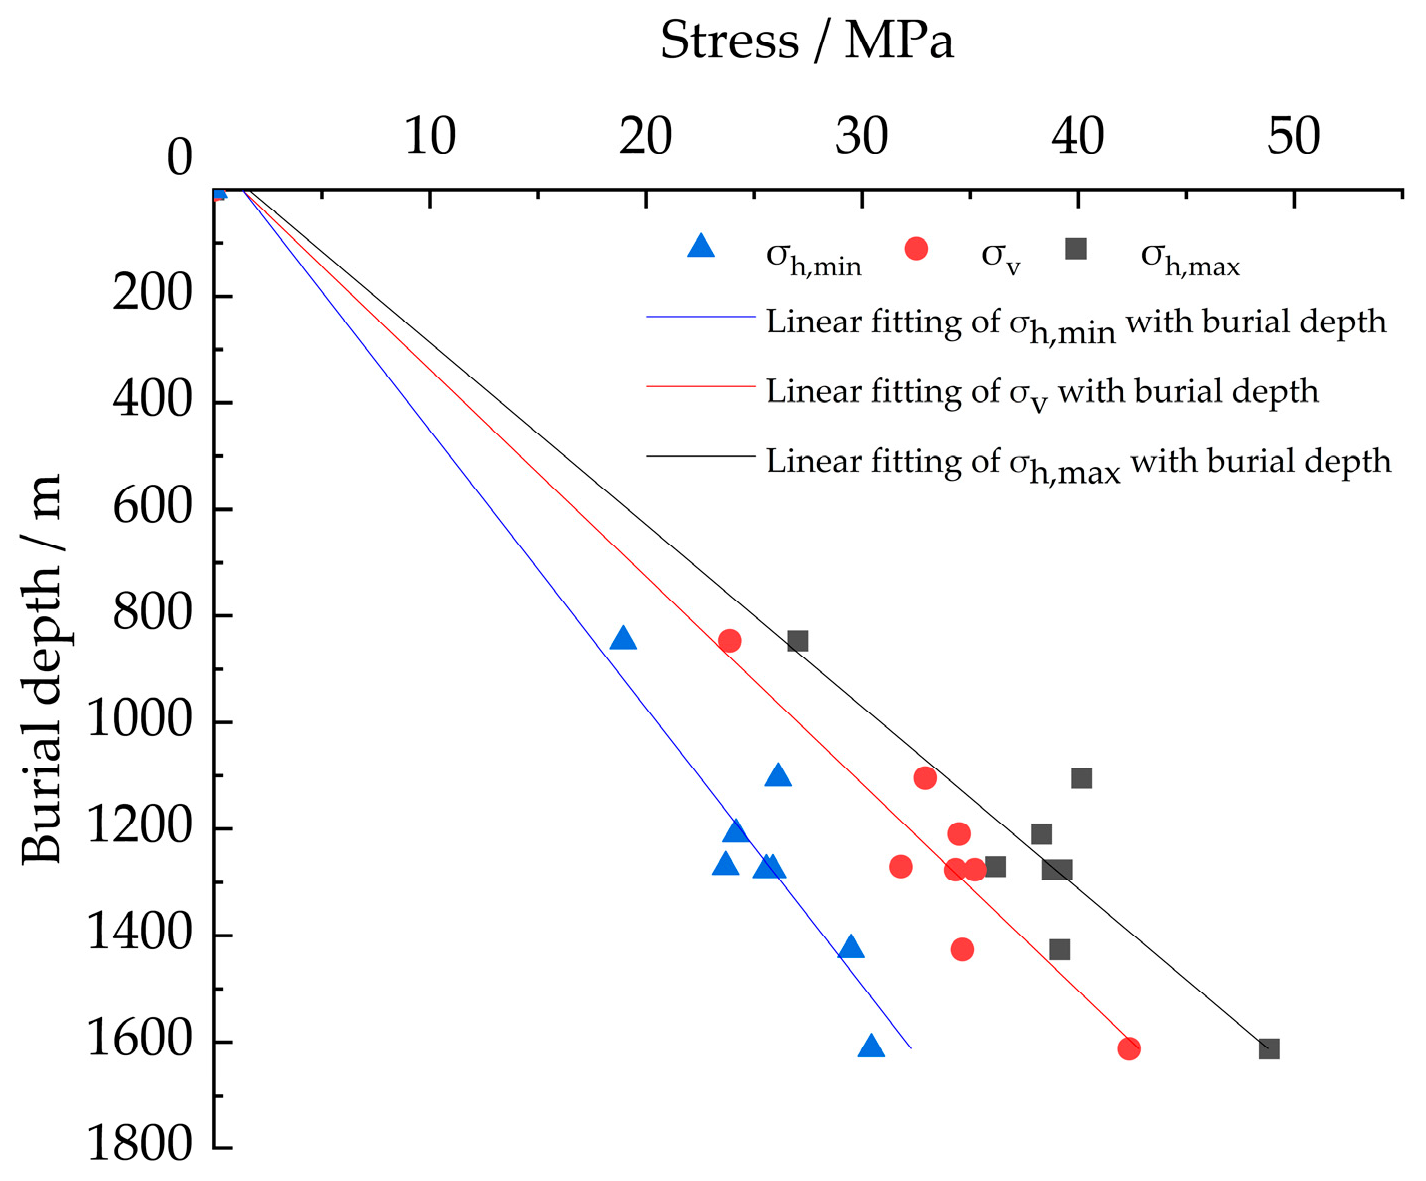
To better analyze the variation of the in situ stress field with depth, linear regression was applied to the measured stress values, yielding regression equations (Equation (11)) and curves (Figure 4) for the maximum horizontal, minimum horizontal, and vertical principal stresses versus depth.
where σh,max represents the maximum horizontal principal stress, MPa; σh,min is the minimum horizontal principal stress, MPa; σv is the vertical principal stress, MPa; H represents the burial depth, m.
Figure 4.
Variation of σh,max, σh,min, and σv with depth.
Based on the measured stresses, the in situ stress at greater depths is projected to reach 50–70 MPa. These elevated stress levels may intensify rock pressure activity and increase the frequency of related disasters, posing significant challenges to deep mining safety.
- (1)
- The maximum horizontal (σh,max), minimum horizontal (σh,min), and vertical principal stresses (σv) all increase approximately linearly with depth. However, the measured data exhibit some scatter, attributable to the high stress levels and complex geological structures in deep rock masses.
- (2)
- At each measurement point, two principal stresses are subhorizontal, with inclinations ranging from −11° to 17°, while the third is subvertical, deviating from the vertical direction by no more than 15°.
- (3)
- The maximum principal stress is subhorizontal. Across the eight points, the direction of σh,max ranges from 304° to 333°, approximately NW, aligning generally with the NNW orientation of the maximum principal stress in the regional tectonic stress field.
- (4)
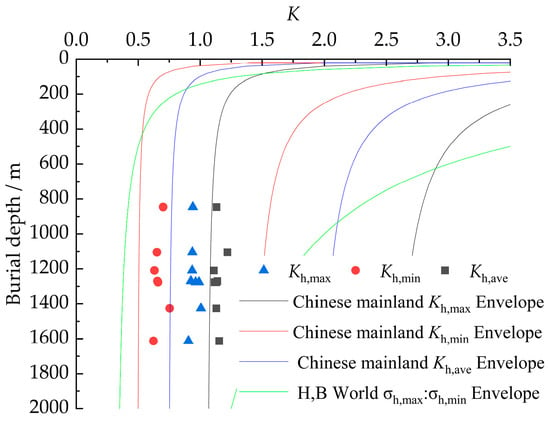
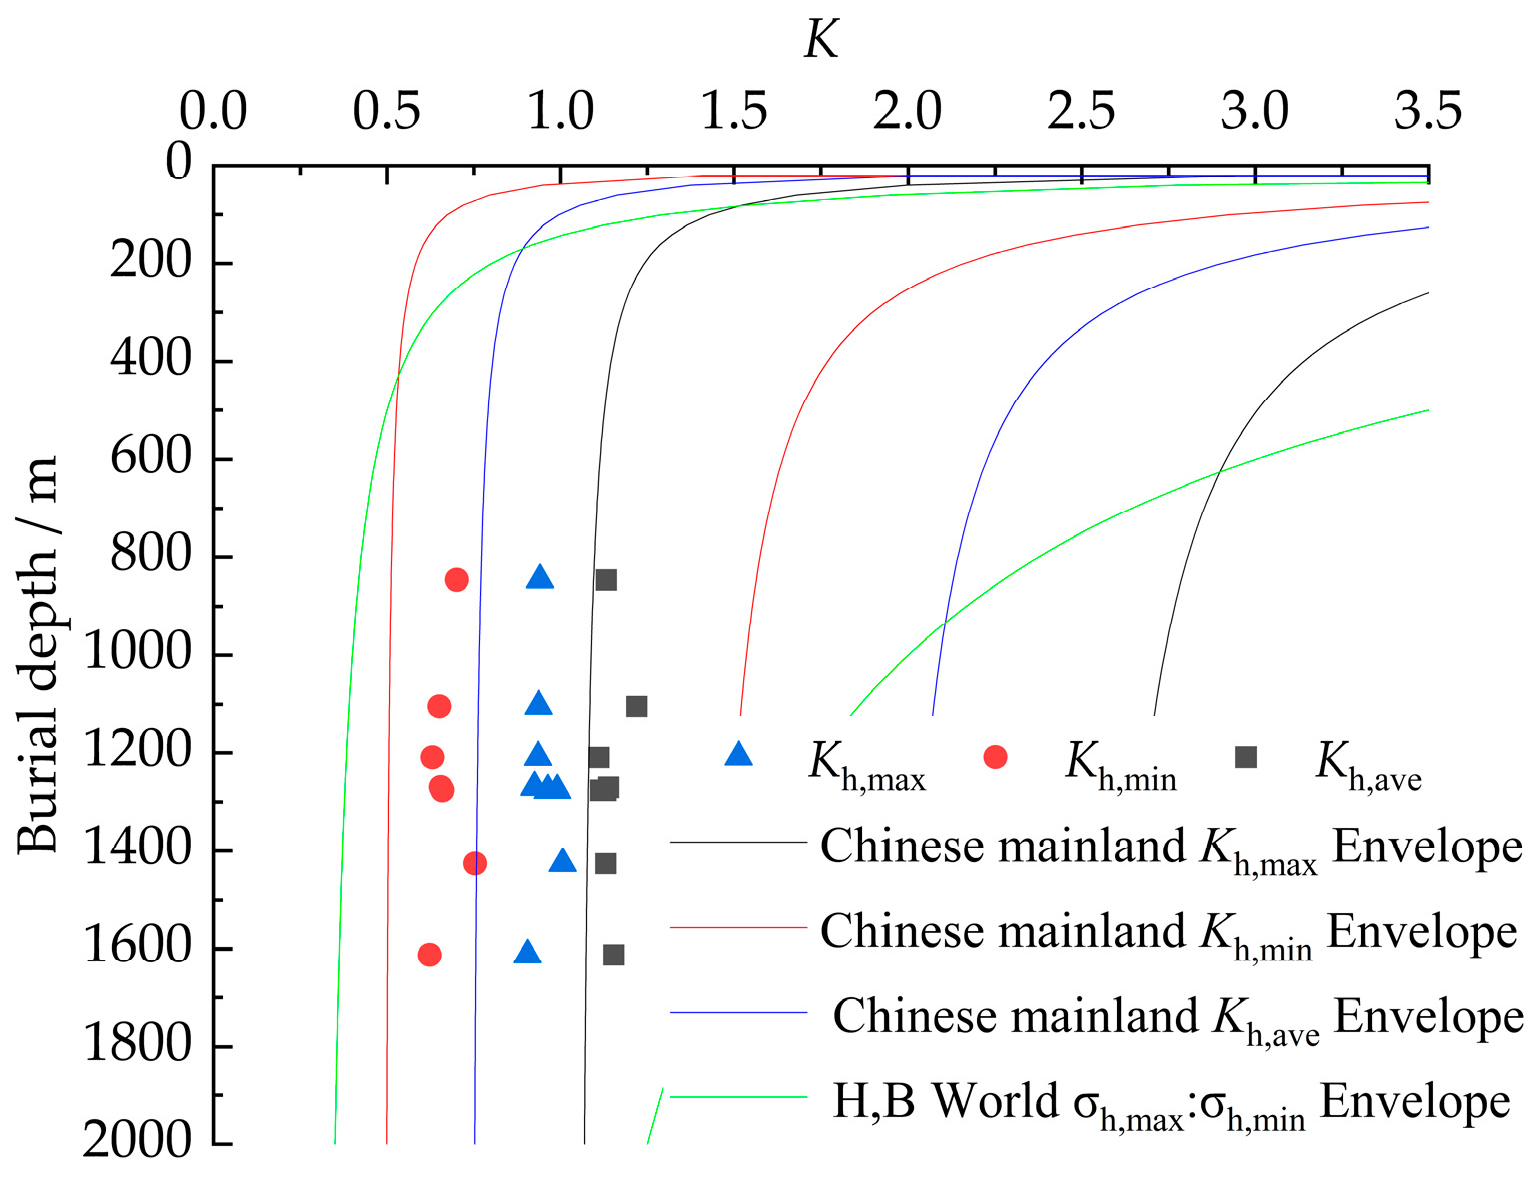
- As shown in Table 7, the average ratio (Kh,max) of σh,max to σv is 1.14, the average ratio (Kh,min) of σh,min to σv is 0.76, and the average ratio (Kh,ave) of the mean horizontal stress (σh,ave) to σv is 0.75. This indicates that the in situ stress field is dominated by horizontal tectonic stress rather than gravitational stress. The dominance of the horizontal tectonic stress field remains essentially unchanged with increasing burial depth, consistent with the regional geological structure. These trends agree with the statistical patterns of the lateral pressure coefficient in metal mining areas of mainland China [24] and the global trends in the variation of horizontal and vertical principal stresses with burial depth compiled by Brown and Hoek [25,26], as shown in Figure 5.Table 7. Ratios of maximum, minimum, and average horizontal principal stresses to vertical principal stress.Figure 5. Variation of Kh,max, Kh,min, and Kh,ave with Depth.
- (5)
- The minimum principal stresses at the eight points are also subhorizontal. The ratios of σh.max to σh.min at these points are shown in Table 8, with an average value of 1.51. According to the Mohr–Coulomb failure criterion, the difference between the two principal stresses represents the shear stress. Since rock mass failure is often induced by shear, the significant shear stress within the horizontal plane is a primary cause of deformation and failure in underground roadways and stopes, warranting considerable attention.Table 8. Ratio of maximum horizontal principal stress to minimum horizontal principal stress.
4. Inversion of the In Situ Stress Field
4.1. Multiple-Linear-Regression-Based Inversion Algorithm for the In Situ Stress Field
The distribution of the in situ stress field exhibits a complex mapping relationship with factors such as spatial location, topography, rock mass mechanical properties, and tectonic activity within the engineering region. This relationship can be expressed as:
where σ represents the initial in situ stress value; x, y, and z represent the spatial coordinates of the engineering area. T1, T2, and T3 are influencing factors of in situ stress, such as temperature, geological structure, groundwater, etc. E is the elastic modulus of the rock mass in the inversion area; μ is Poisson’s ratio; γ represents the unit weight of the rock mass.
The finite element mathematical model regression analysis method applies mathematical statistics principles to maximize the accuracy of simulating the in situ stress field under the influence of various comprehensive factors. The regression model for the initial stress field, based on the linear regression superposition principle, is:
where k denotes the serial number of each measurement point or factor; represents the regression value of ground stress at point k; Li is the regression coefficient; is the finite element calculated value for factor i at point k; and n indicates the number of major influencing factors.
For a model containing m measurement points, the equation for the sum of squared residuals between the measured and finite element calculated in situ stress values is:
where S denotes the sum of squared residuals; represents the measured value of the j-th ground stress component at observation point k; denotes the finite element computed value of the -th component at observation point k under the influence of the i-th factor.
According to the principle of least squares, to minimize S, its partial derivatives with respect to the regression coefficients are set to zero to determine the extremum.
The system of equations minimizing the sum of squared residuals is:
Solving this system yields the regression coefficients Lᵢ. The initial stress values under various influencing factors can then be calculated using the superposition principle:
where σjm represents the initial stress value at measurement point m.
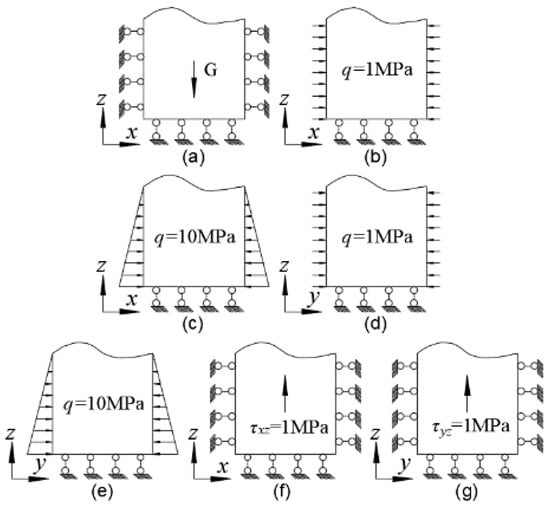
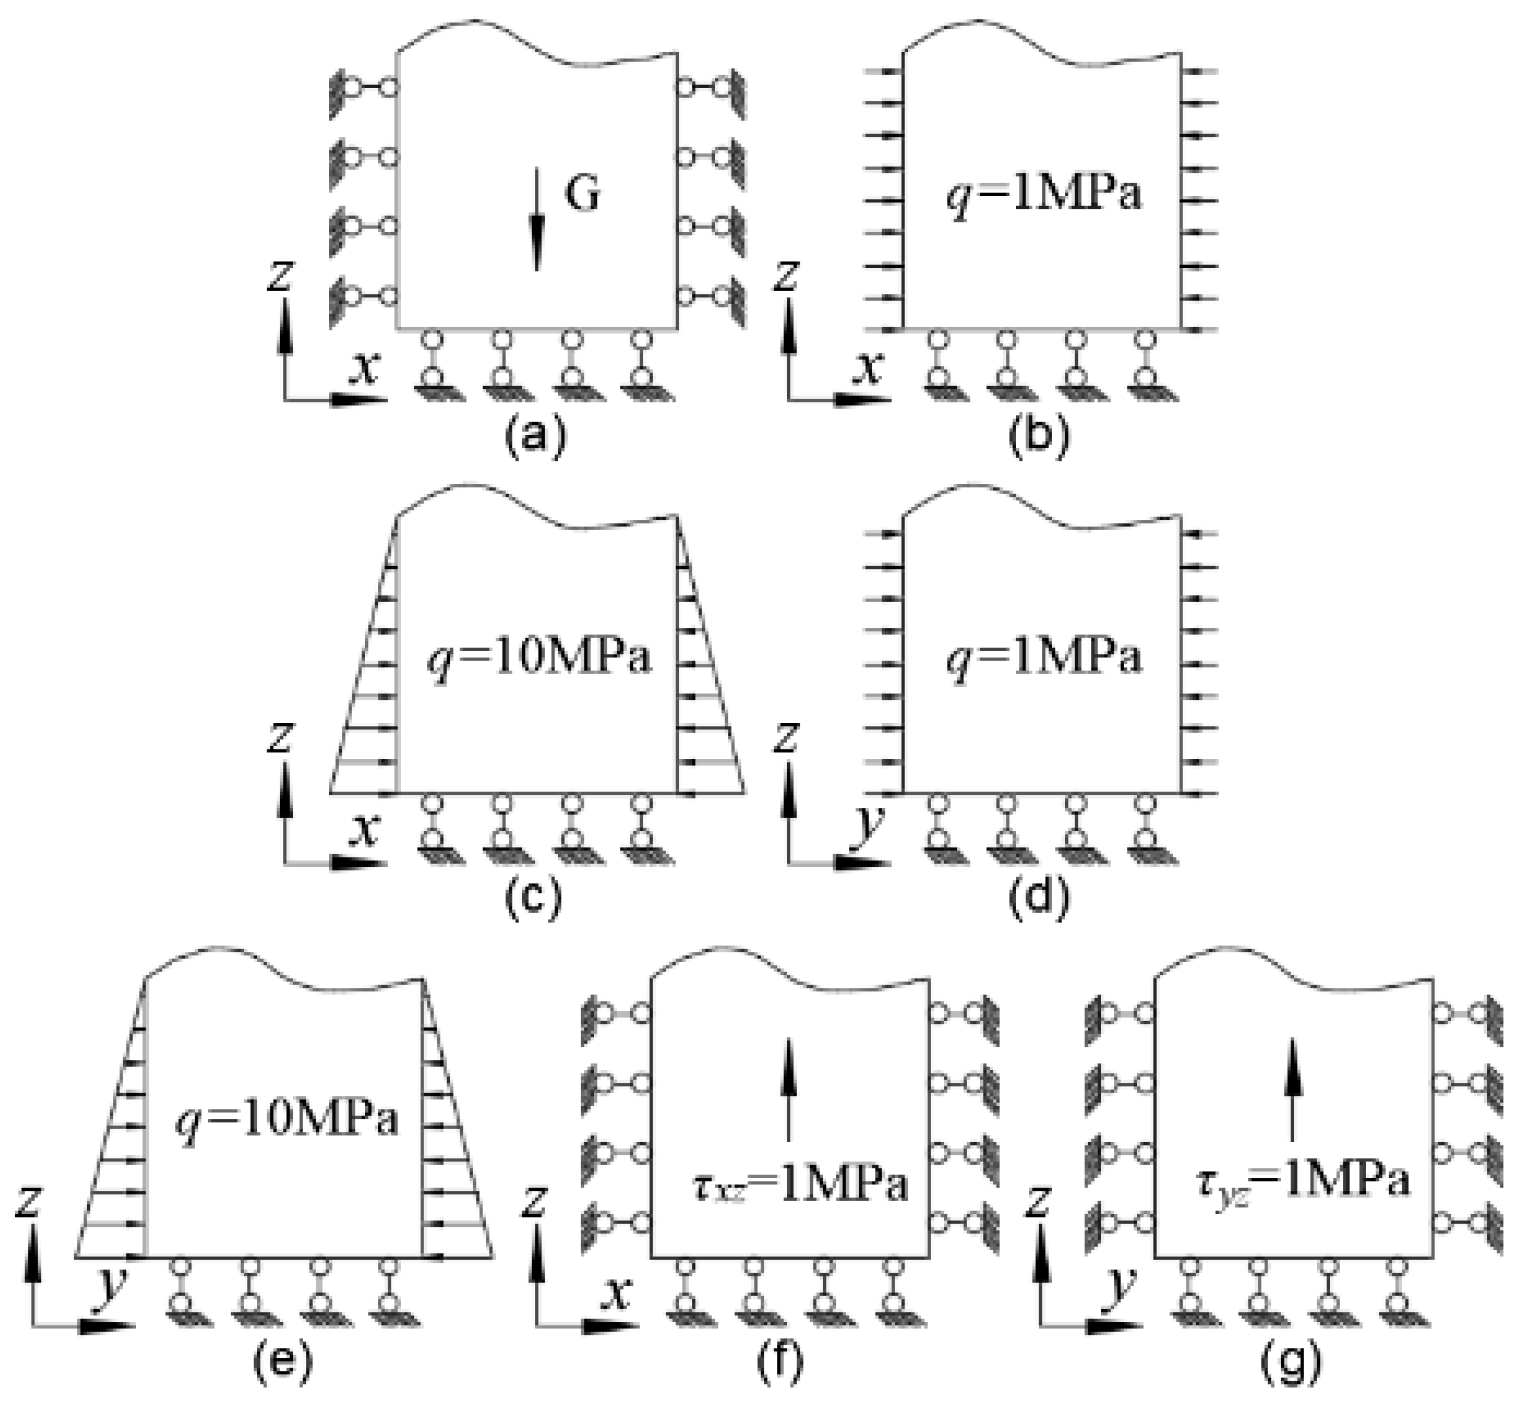
The inversion process applies seven load cases to the model (see Figure 6): (a) gravitational stress; (b) uniform load in the x-direction; (c) triangularly distributed load in the x-direction; (d) uniform load in the y-direction; (e) triangularly distributed load in the y-direction; (f) shear stress in the xz-plane; (g) shear stress in the yz-plane. By applying these different stress conditions, the six spatial stress components of each fundamental stress field at the measured in situ stress points are obtained: σx (xx-direction), τxy (xy-direction), τxz (xz-direction), σy (yy-direction), τyz (yz-direction), σz (zz-direction).
Figure 6.
Structural load settings under seven load cases. (a) gravitational stress; (b) uniform load in the x-direction; (c) triangularly distributed load in the x-direction; (d) uniform load in the y-direction; (e) triangularly distributed load in the y-direction; (f) shear stress in the xz-plane; (g) shear stress in the yz-plane.
The inversion analysis was implemented in MATLAB R2021b. The multiple linear regression model was established using the regress function from the MATLAB R2021b Statistics Toolbox, called in the format b = regress(y, x), where x is the matrix of independent variables and y is the vector of the dependent variable. The estimated regression coefficients were evaluated through their confidence intervals (bint), residuals (r), and residual confidence intervals (rint). The goodness-of-fit of the regression model was assessed using statistical metrics including the coefficient of determination (R2), the F-statistic, and its associated p-value.
4.2. Inversion Analysis
4.2.1. Establishment of the Inversion Model
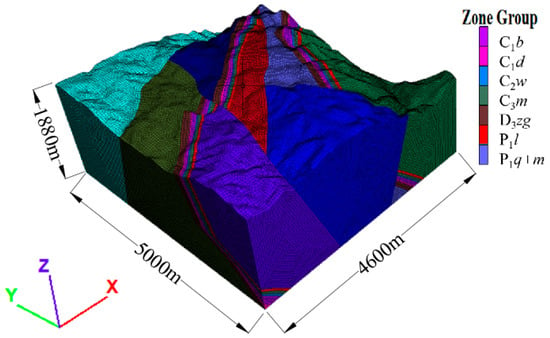
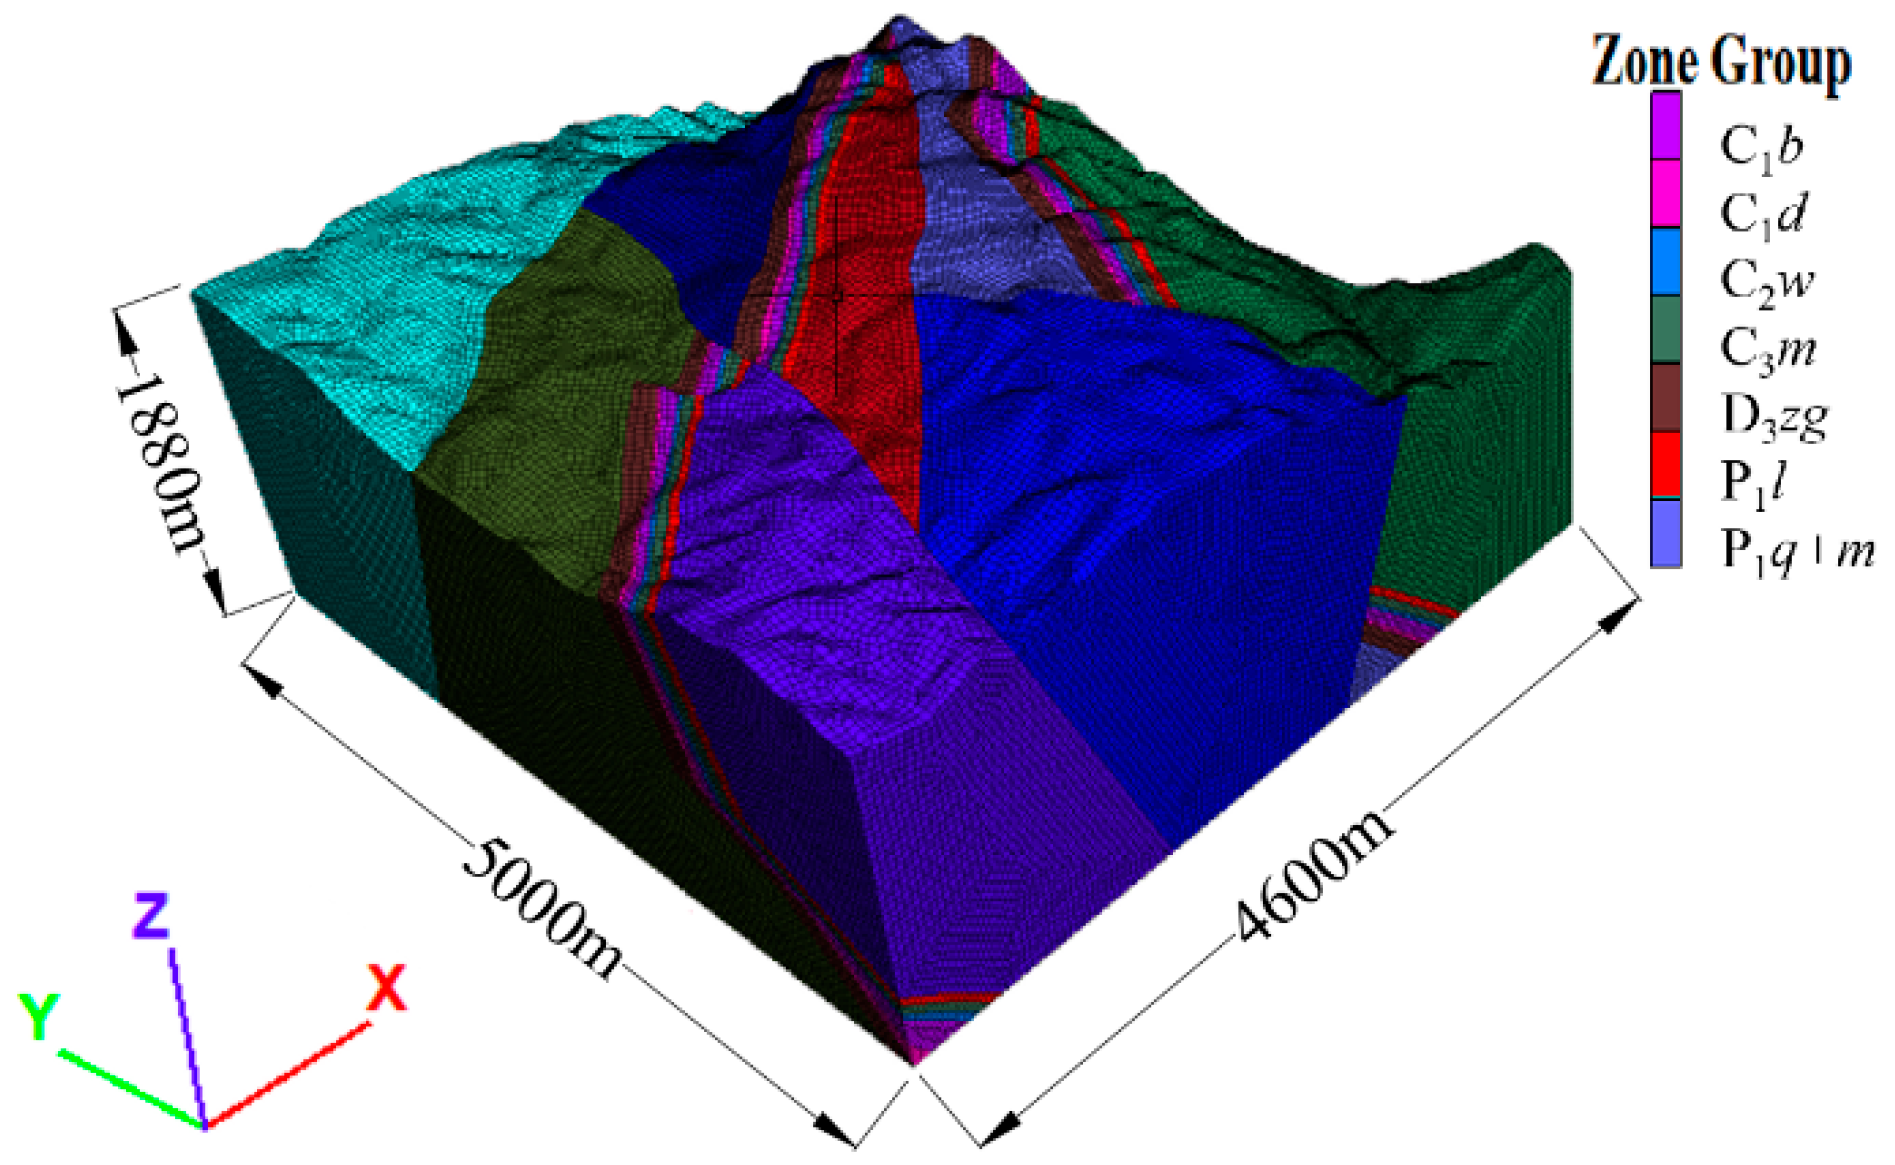
A three-dimensional geological model of the mining area was developed in 3Dmine 2017.5 mining engineering software, integrating the geological–topographic map, level plans, and exploration line profiles. The model measures 5000 m in length, 4600 m in width, and extends from the surface to a depth of 1880 m, incorporating major stratigraphic units and significant geological structures. This model was imported into Rhino 7 to generate a 3D geological mesh, which was subsequently transferred to FLAC3D 6.0 to establish the final numerical model (Figure 7). The numerical model comprises seven rock mass types, discretized into 3,673,635 nodes and 5,768,055 zones. The specific mechanical parameters and physical properties for each rock mass type are provided in Table 9.
Figure 7.
Numerical model for 3D in situ stress inversion in the study area.
Table 9.
Rock mechanics parameters of rock mass types.
This inversion analysis treated the eight measured points as in situ stress data. The measured values were transformed according to the computational coordinate system to obtain the measured spatial in situ stress components for each point. The actual in situ stress field was approximated via the least squares method using the established regression model. The fitted regression coefficients are listed in Table 10. The coefficient of determination (r2) is 0.899, close to 1.0, indicating a good fit. The observed F-statistic is 140.417, which is significant, and the p-value is much less than 0.05, approaching zero, confirming the validity of the regression model.
Table 10.
Multiple linear regression coefficients.
4.2.2. Results of Stress Field Inversion
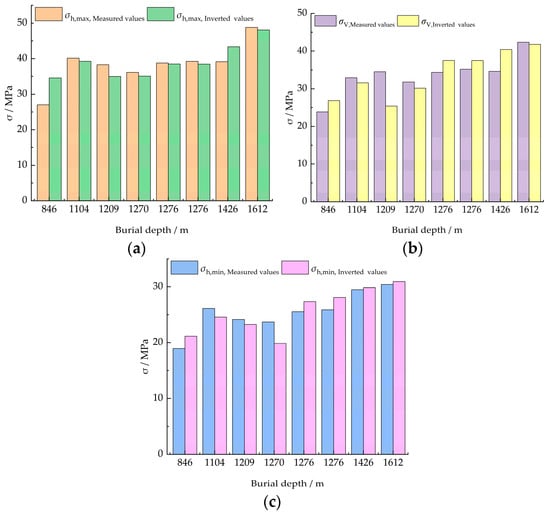
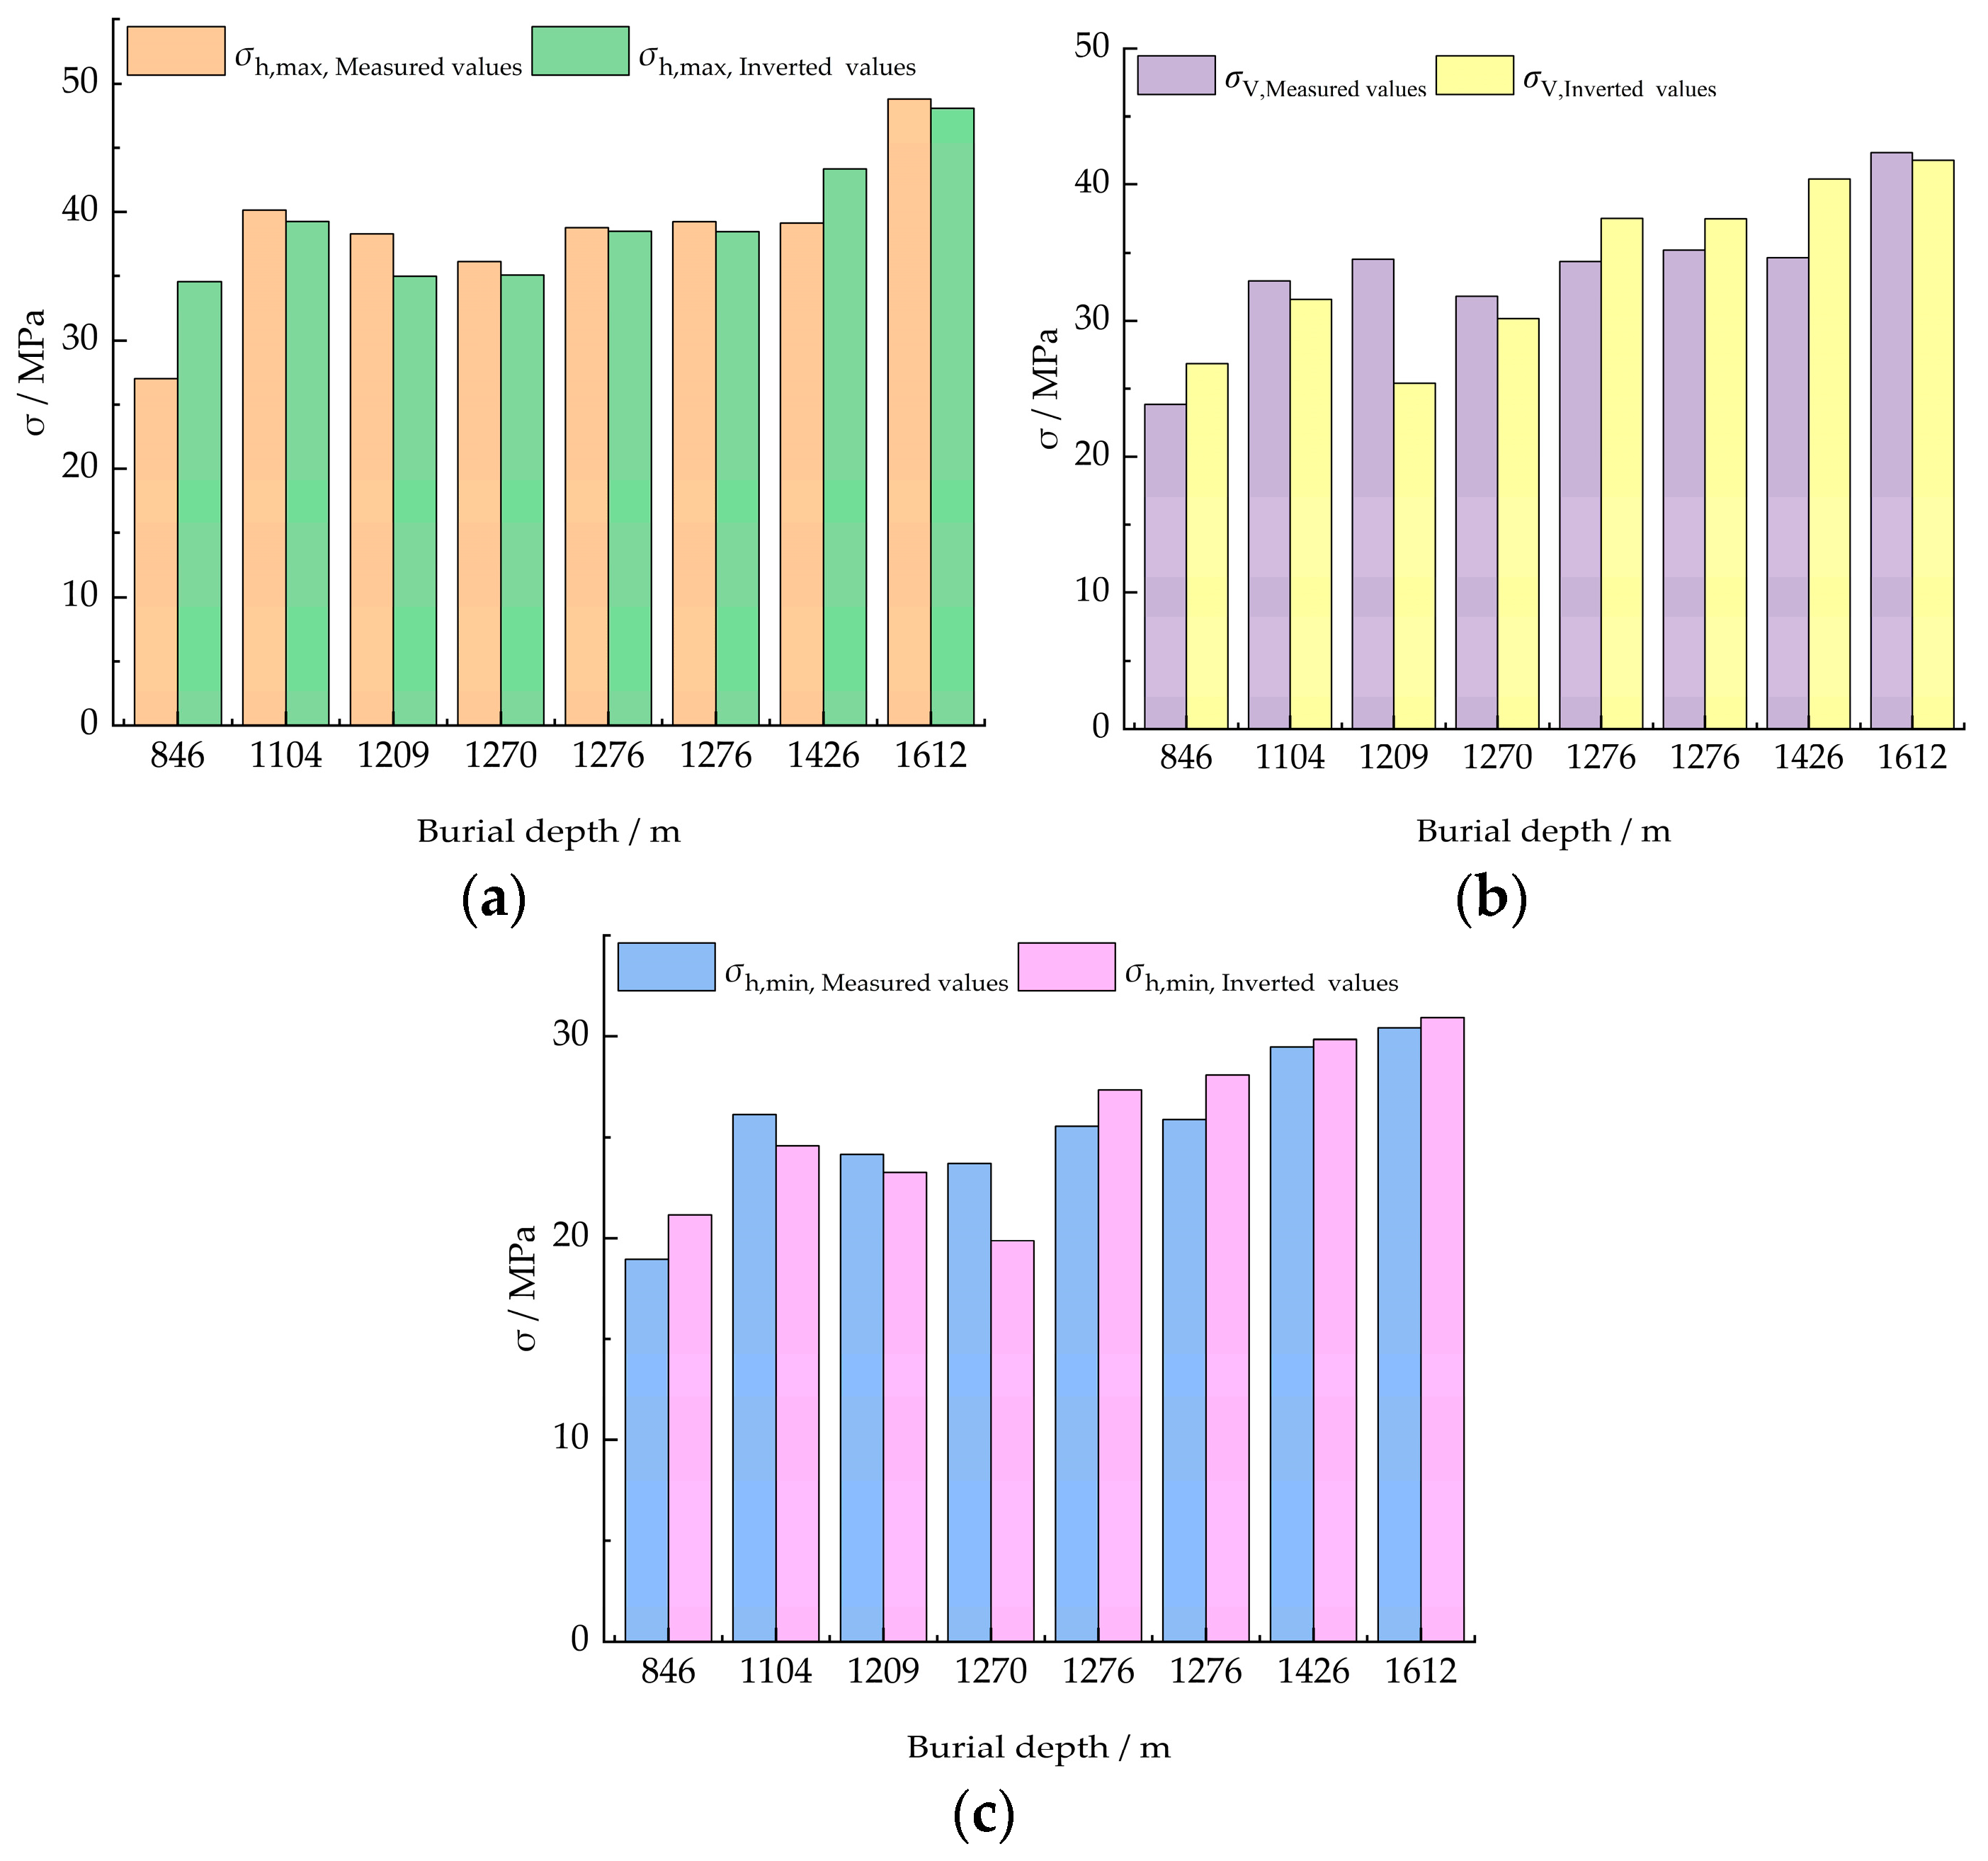
Based on the regression coefficients from Table 10, the initial conditions for each loading case were modified to obtain the corrected stress application schemes and boundary conditions. These adjusted loading conditions were then superimposed and applied in a subsequent numerical simulation. The resulting principal stress values at each in situ stress measurement point, derived from the model, represent the inversion results of the stress field, as summarized in Table 11 and visualized in the comparison between measured and inverted values for σh,max, σV, and σh,min (Figure 8).
Table 11.
Principal stress inversion results at measurement points.
Figure 8.
Comparison of measured and inverted values: (a) Comparison of measured and inverted values for σh,max; (b) Comparison of measured and inverted values for σV; (c) Comparison of measured and inverted values for σh,min.
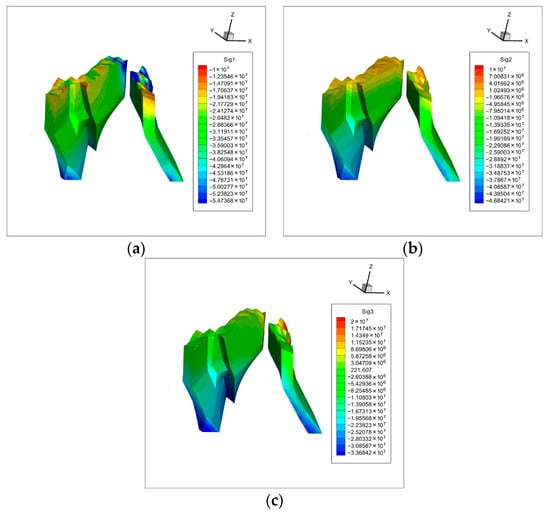
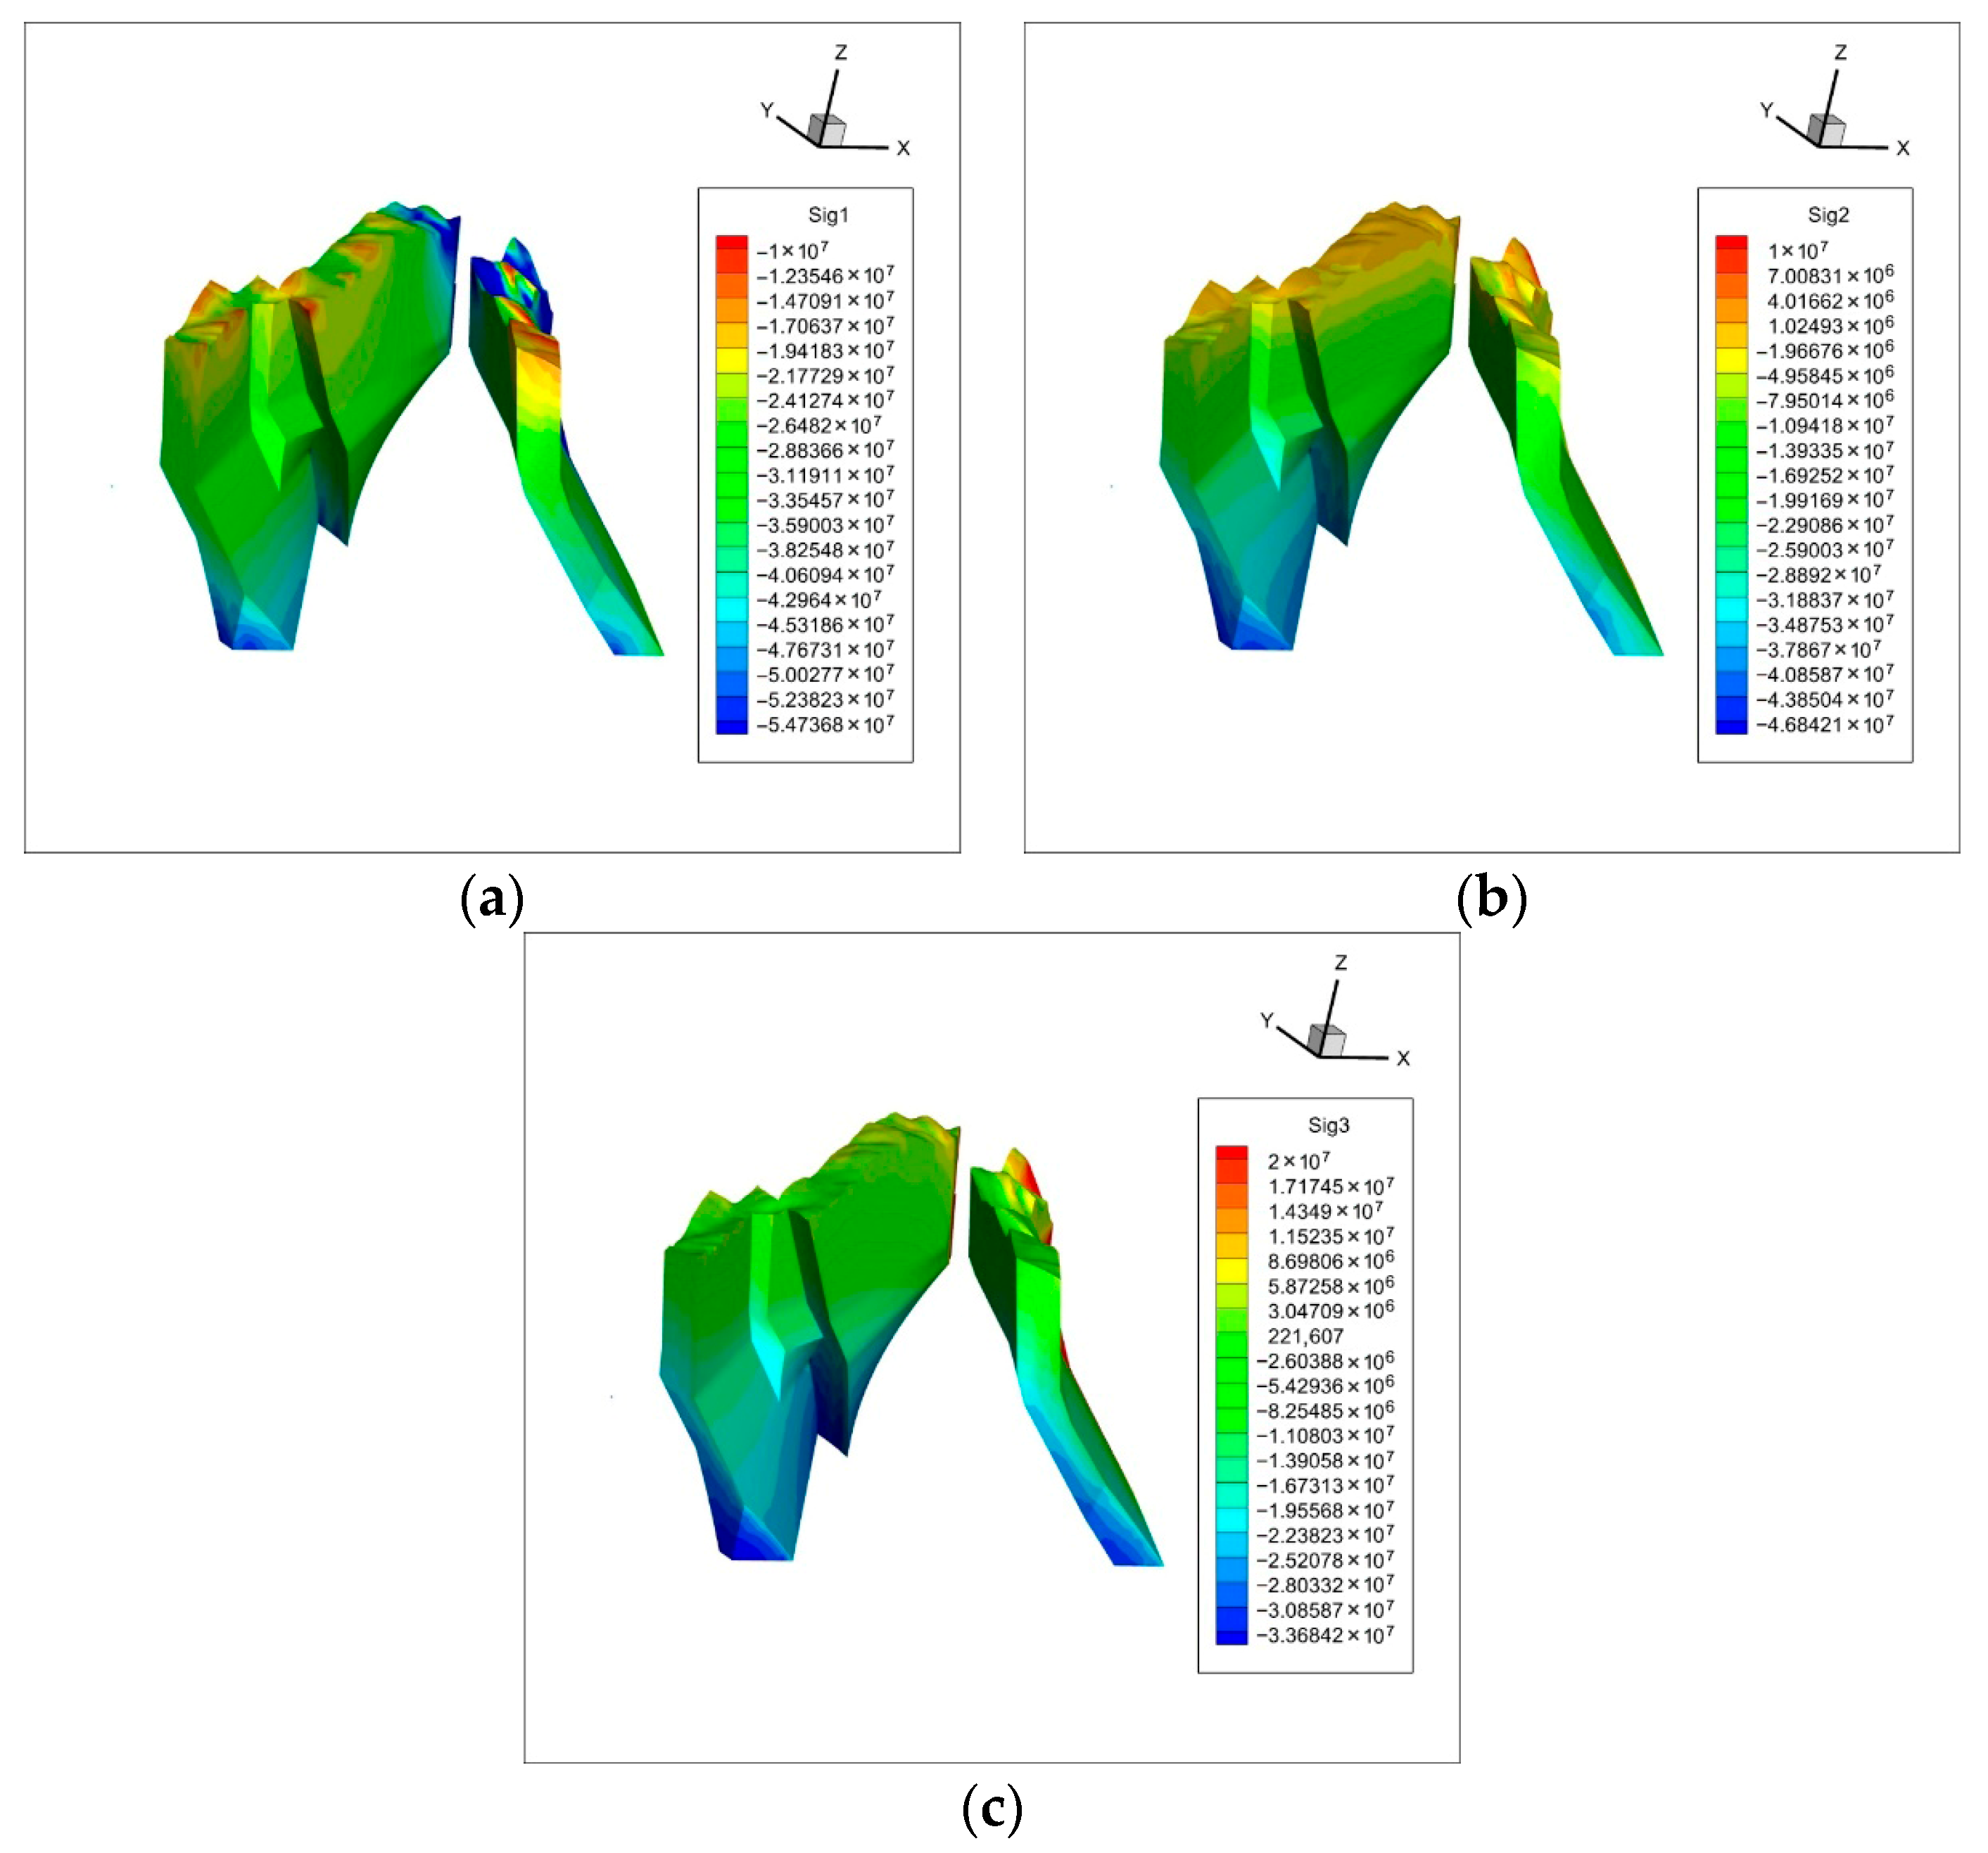
The stress nephograms of the eight strata relevant to development and mining activities were analyzed (Figure 9). The inversion results indicate that, in the main strata, the maximum principal stress reaches approximately 54.74 MPa, the intermediate principal stress is 46.84 MPa, and the minimum principal stress is 33.68 MPa. The ratio of the maximum to minimum principal stress in the main strata is 1.62. Stress concentrations induced by roadway excavation generally do not create tensile zones, which is favorable for roadway stability. Consequently, the in situ stress magnitude in this area is moderate, dominated by subhorizontal stresses. The orientation of the maximum principal stress is predominantly northwest, consistent with the measured data. The regional principal stress relationship is σh,max > σv > σh,min. Due to the absence of prominent tectonic structures and the influence of topography near the surface, the in situ stress varies significantly, with distinct stress concentration zones apparent near steep terrain.
Figure 9.
Nephograms of maximum, intermediate, and minimum principal stresses in the strata: (a) Nephogram of maximum principal stress in main strata; (b) Nephogram of intermediate principal stress in main strata; (c) Nephogram of minimum principal stress in main strata.
4.2.3. Error Analysis
When performing the inversion of the in situ stress field using FLAC3D 6.0, localized geological features such as small-scale joints and minor faults were not considered in the inversion model due to its scale. Regarding the high-temperature conditions of deep surrounding rock, compensation was applied during the in situ stress measurement stage and was not further considered here. The relative error is defined by Equation (18) [27]:
where represents the L2-norm
A comparison between the measured and inverted values is presented in Table 12.
Table 12.
Comparison of measured and inverted principal stresses.
The inversion-derived maximum principal stress ranges from 34.54 to 48.04 MPa, the intermediate principal stress from 26.84 to 41.81 MPa, and the minimum principal stress from 21.16 to 30.92 MPa. The relative errors at the eight measurement points range from 0.9% to 19.30%, with an average relative error of 7.74%. Except for certain individual stress components at a few points, which exhibit relatively large errors potentially attributable to measurement inaccuracies caused by fractured surrounding rock in deep stress measurements, the overall inversion results of the in situ stress field are accurate, reasonable, and reliable.
5. Application of the Inverted In Situ Stress Field
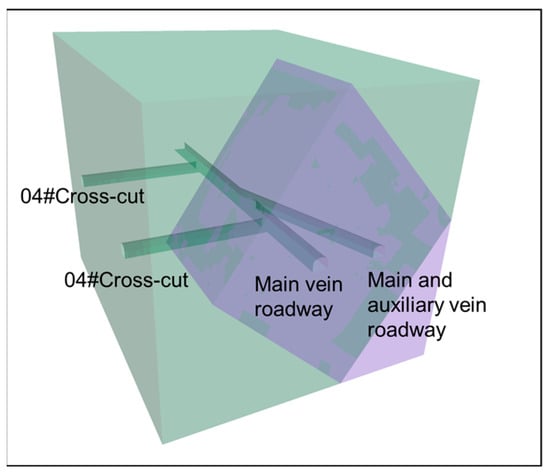
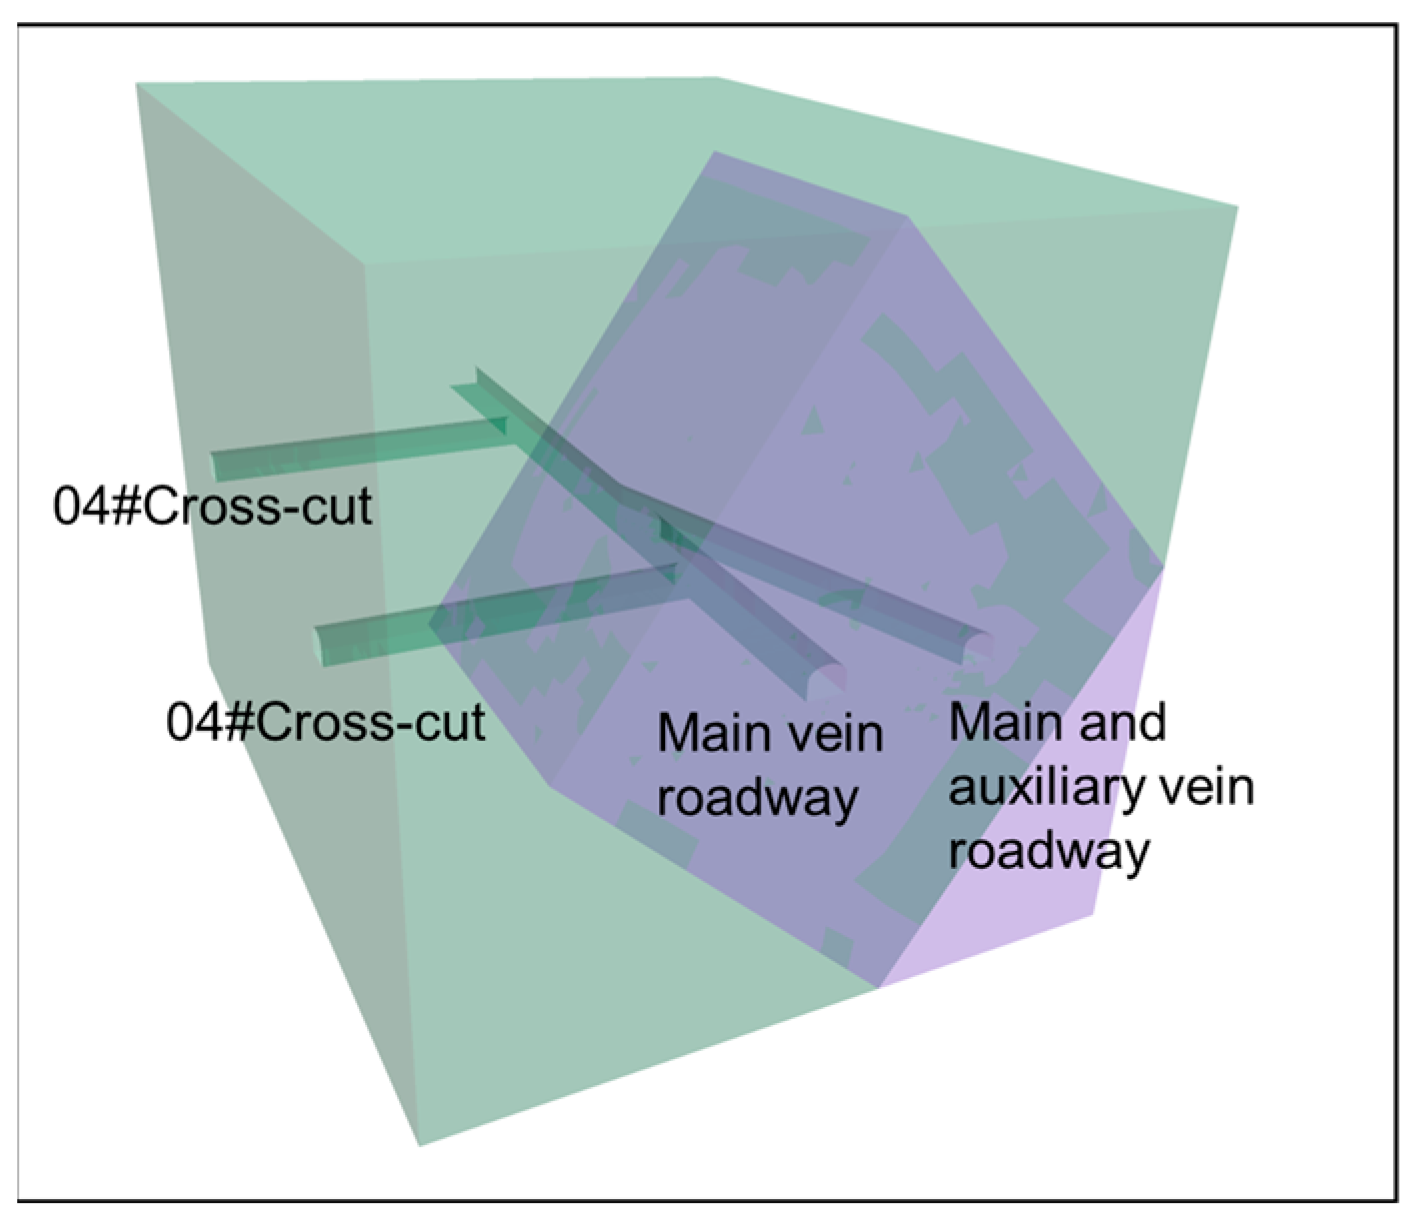
To analyze the in situ stress characteristics at the intersection of the main vein roadway and the auxiliary vein roadway within the level containing measurement point 3#, a detailed local model measuring 100 m × 80 m × 80 m (length × width × height) was constructed. Given the limited extent of the model, the variation in in situ stress within it is negligible. Based on the coordinate transformation between the field and the inversion model, the stress values at coordinates (1137, 1100, 232) from the inverted in situ stress field model were applied as boundary conditions to the local model. At this location, the maximum horizontal principal stress is 49.05 MPa, the vertical principal stress is 38.77 MPa, and the minimum horizontal principal stress is 29.14 MPa. The orientation of the maximum principal stress aligns with the strike of the crosscut, while the direction of the minimum horizontal principal stress direction coincides with the strike of the main vein roadway. The established model is shown in Figure 10.
Figure 10.
Local model near measurement point 3# between exploration lines 04# and 02#.
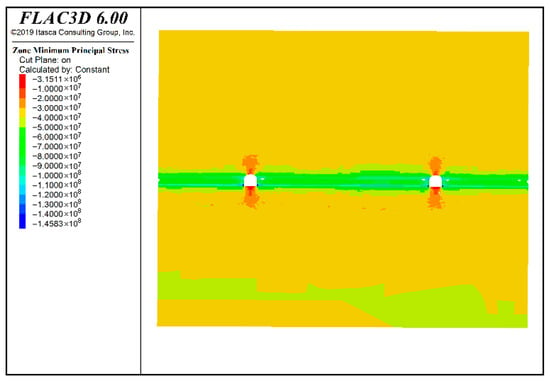
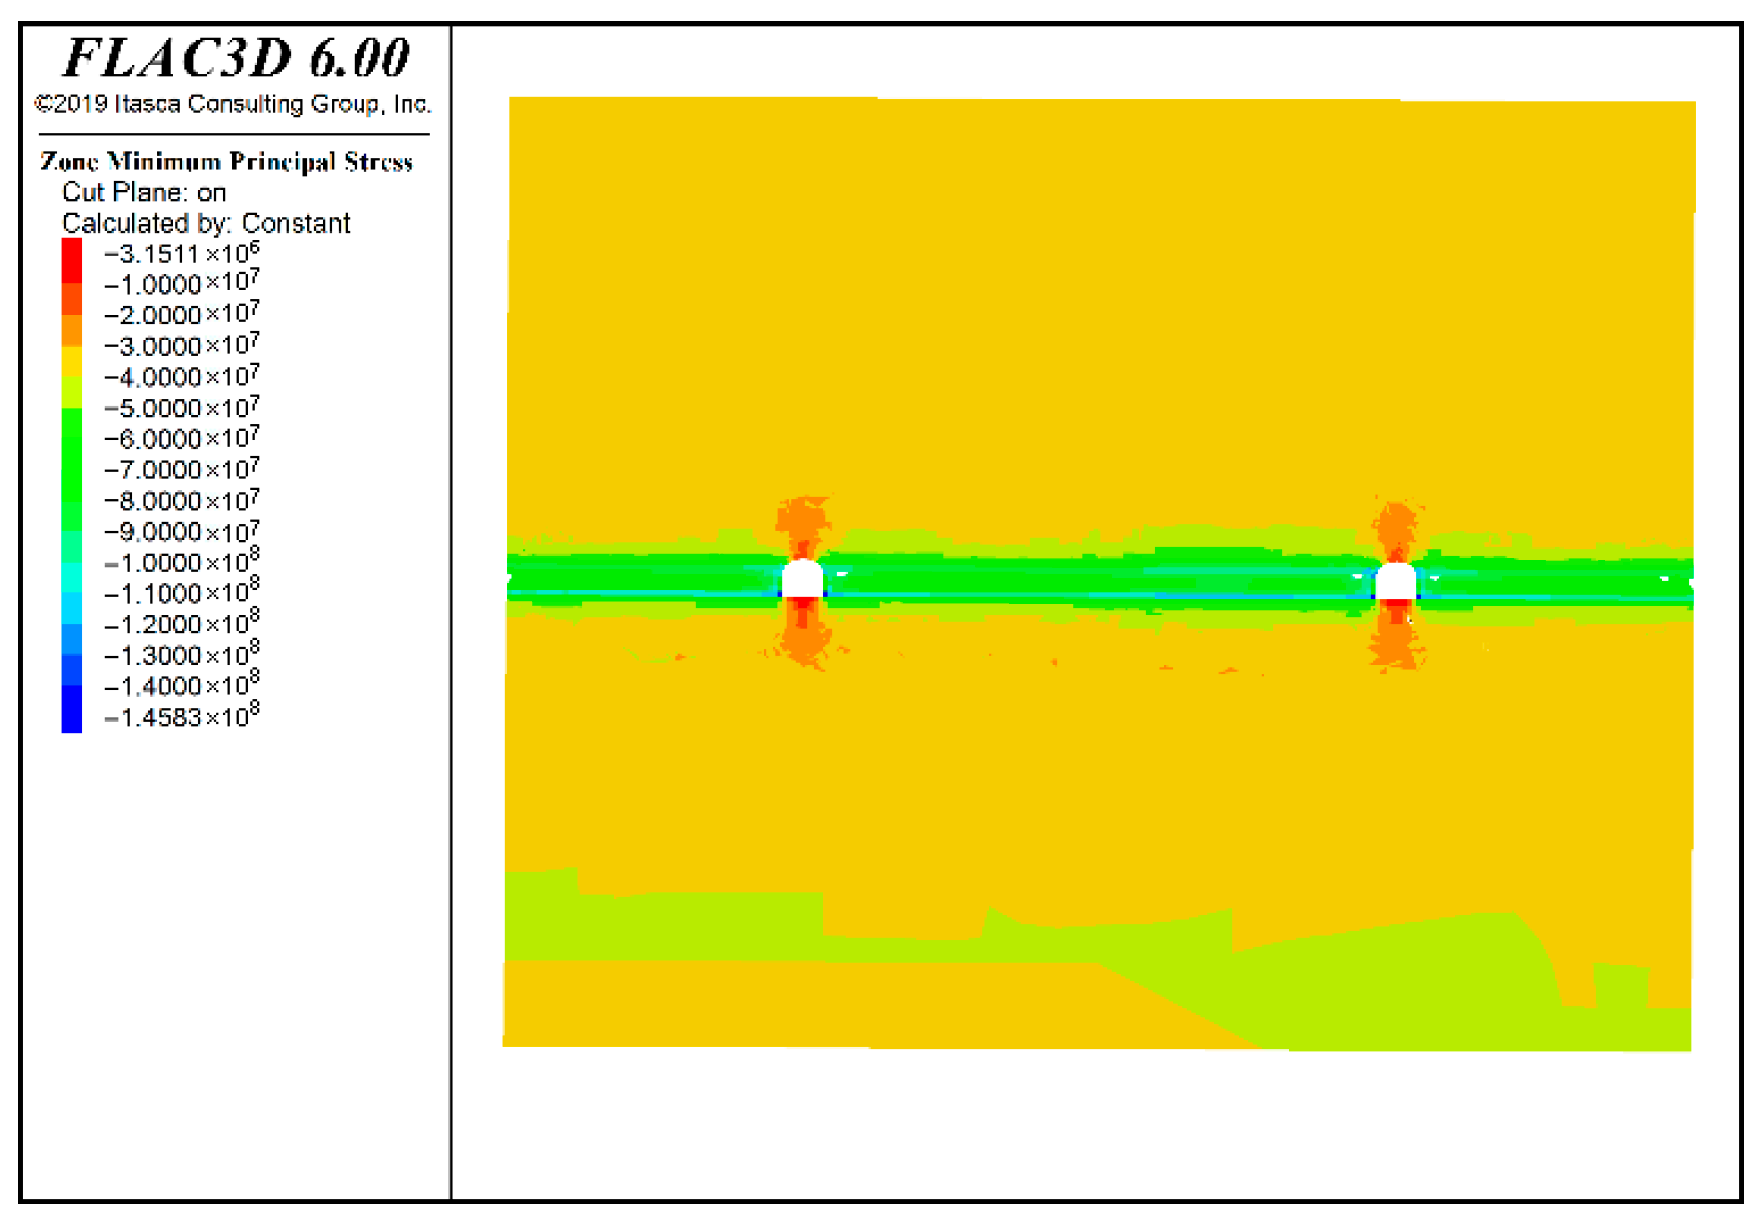
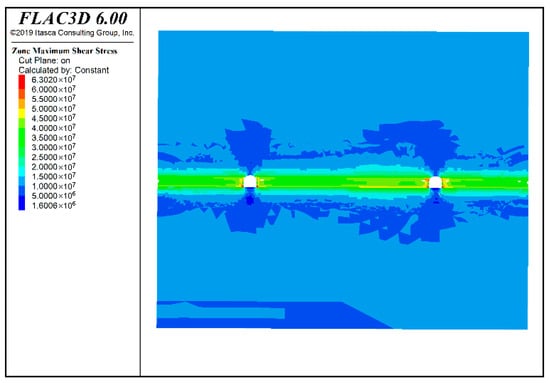
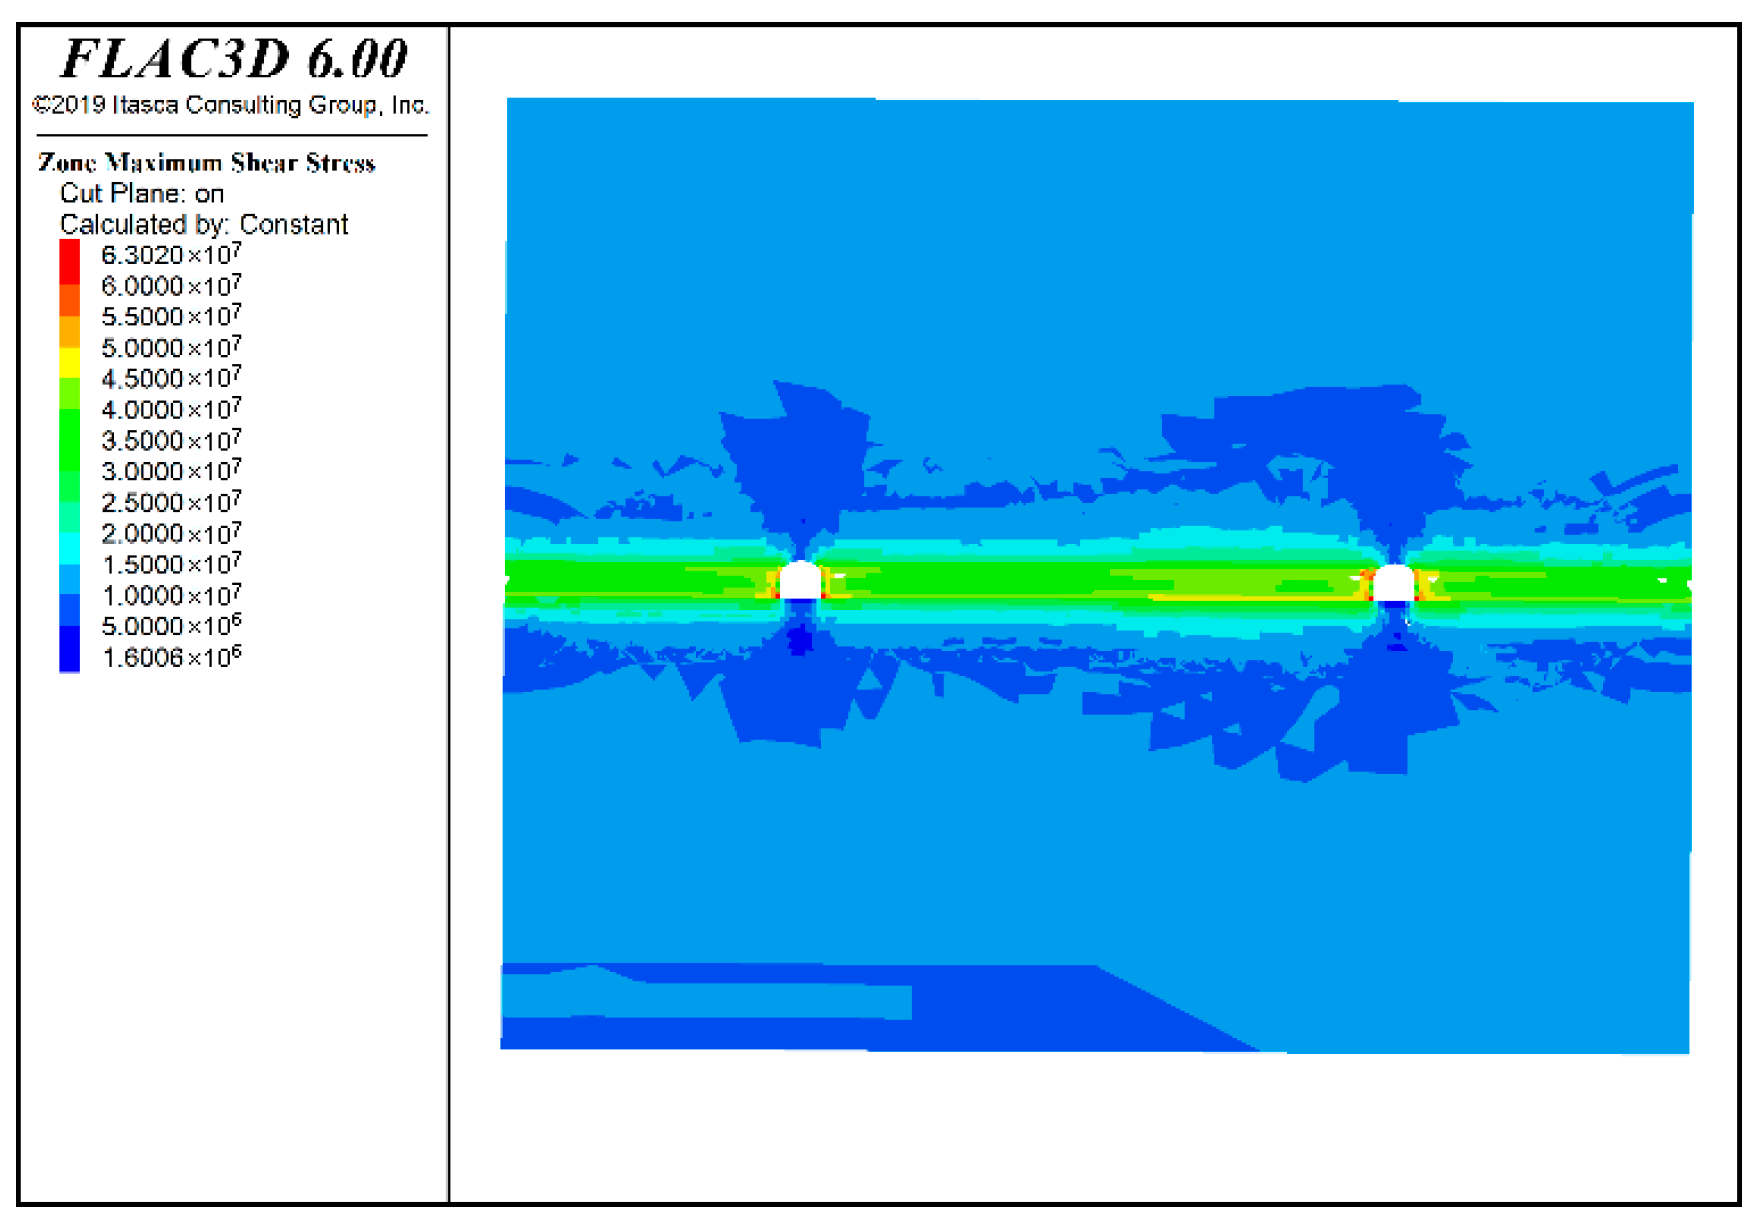
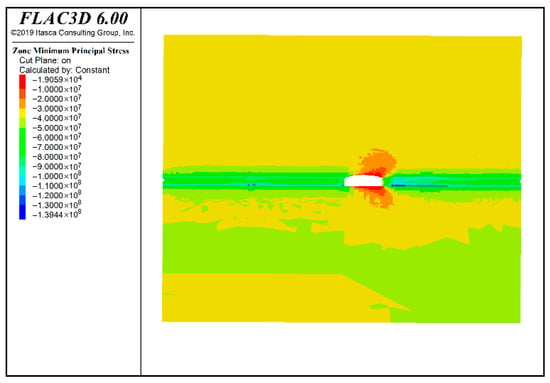
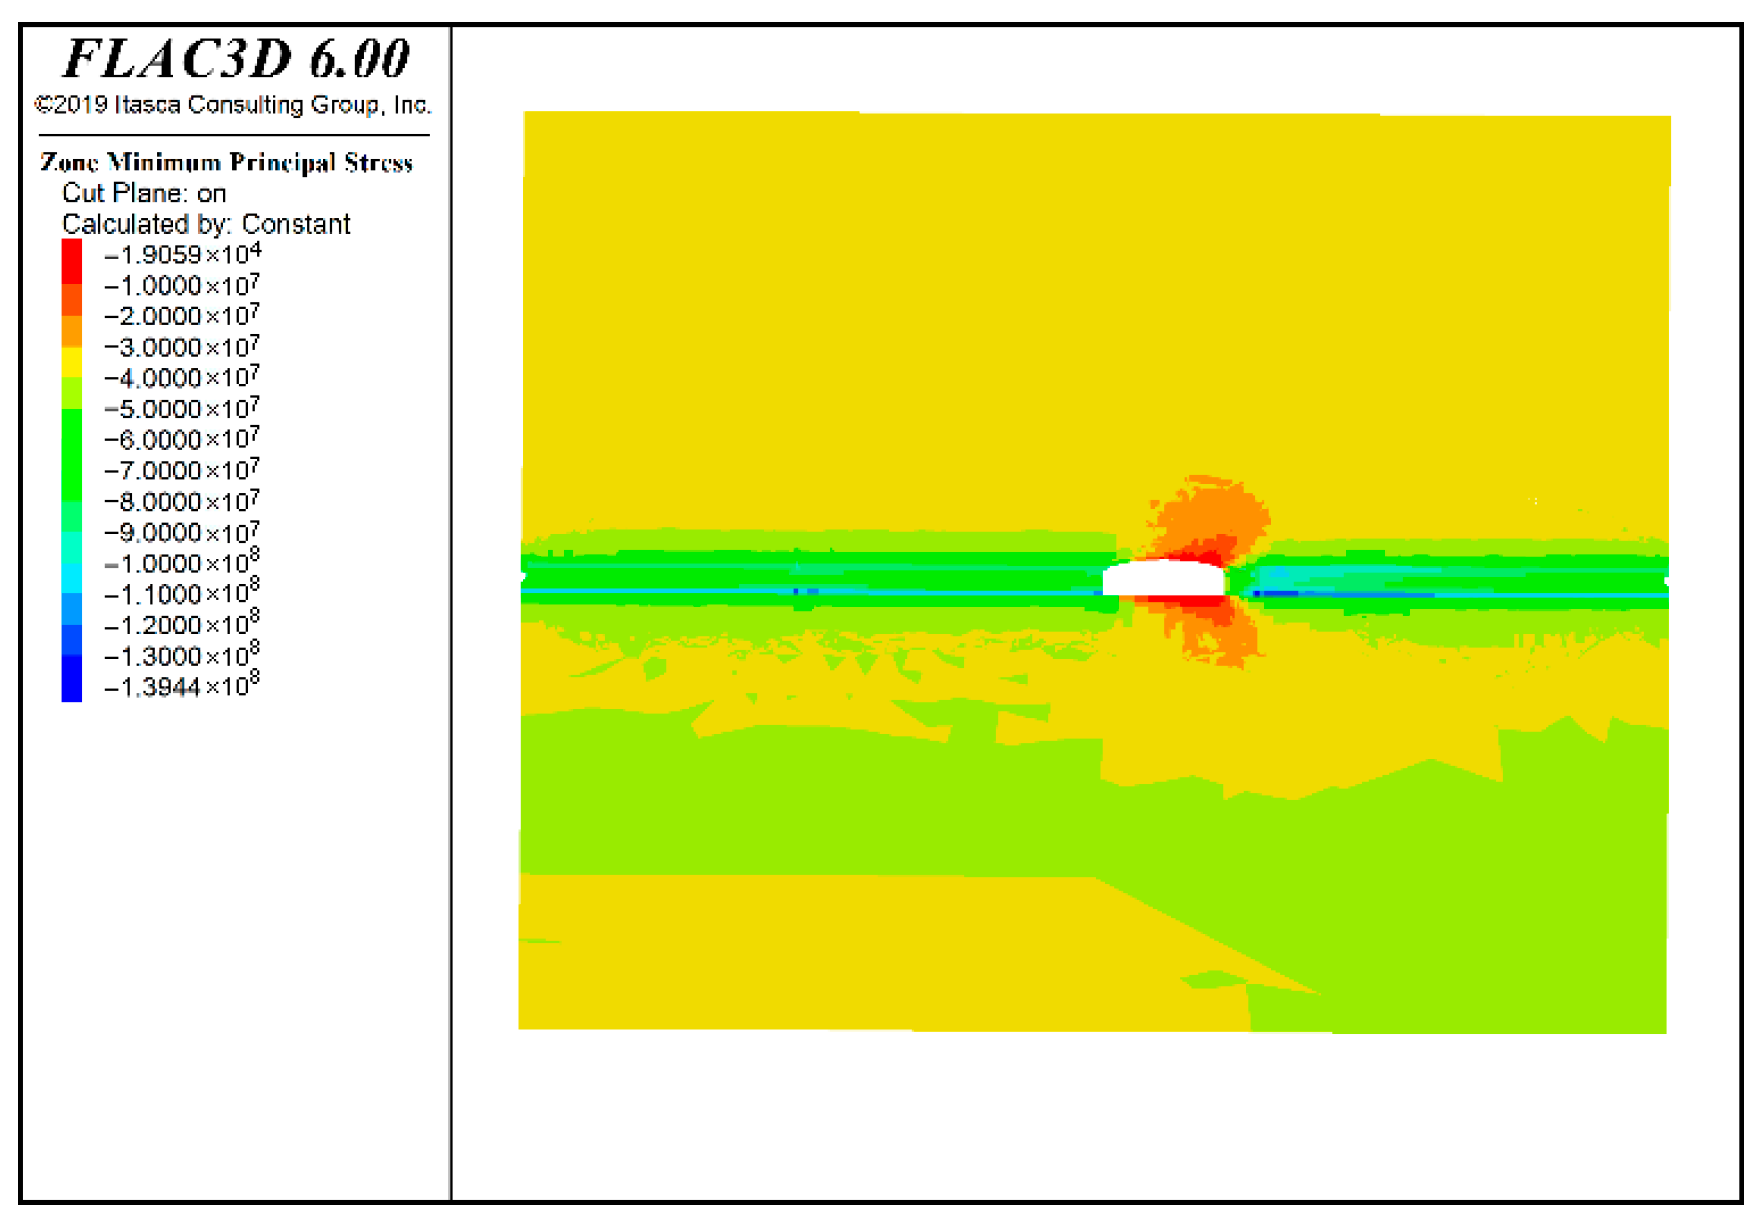
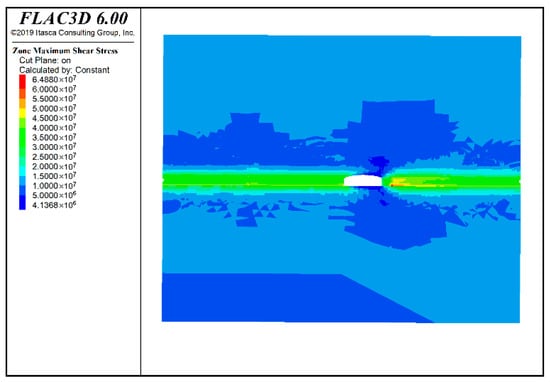
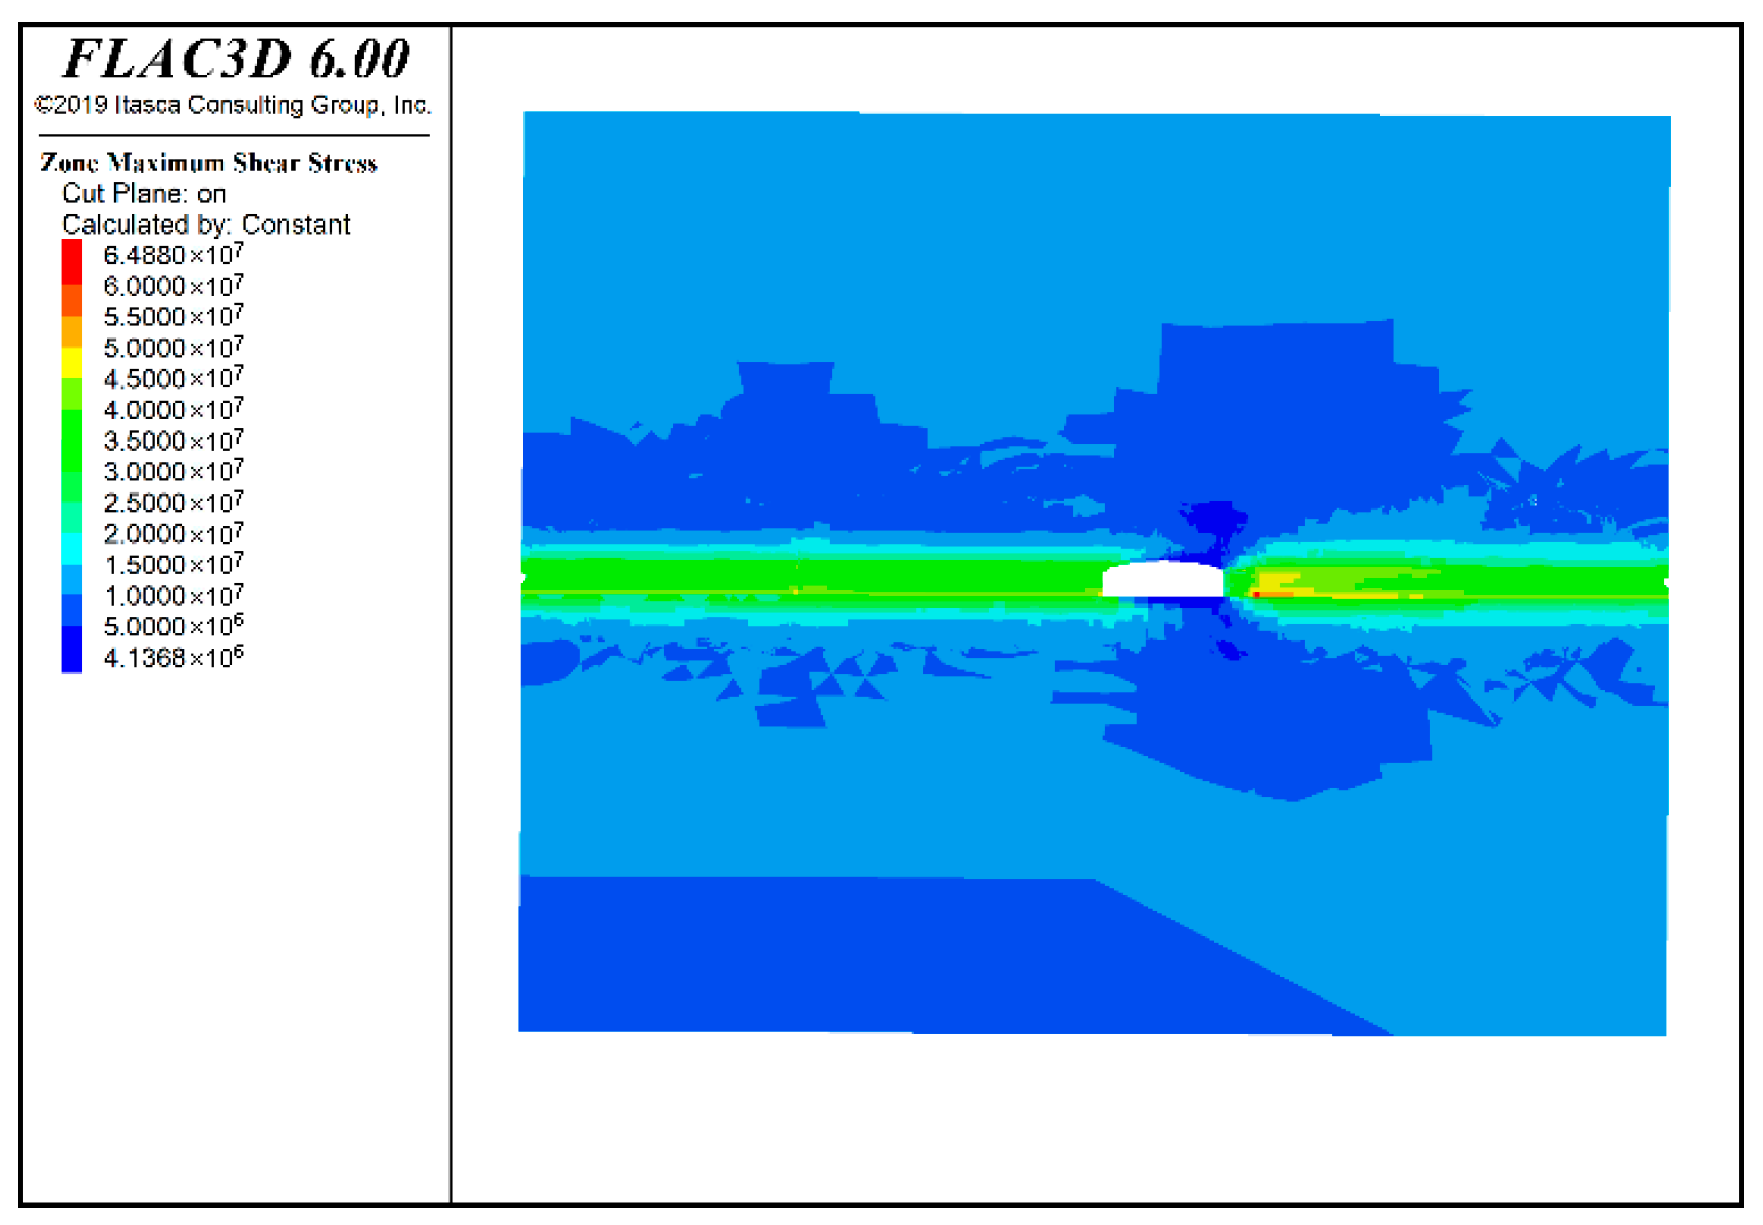
Figure 11, Figure 12, Figure 13 and Figure 14 demonstrate that roadway excavation disrupts the equilibrium of the original rock stress, inducing stress redistribution in the surrounding rock mass. The hanging wall of the main vein roadway exhibits a maximum principal stress of 145.83 MPa and a corresponding maximum shear stress of 63.02 MPa, while the footwall shows values of 139.44 MPa and 64.88 MPa, respectively. Compared with the initial in situ stress state, the elevated principal stresses around the excavation indicate a significant mechanical disturbance due to the mining activity.
Figure 11.
Maximum principal stress nephogram on the hanging wall of the main vein roadway.
Figure 12.
Maximum shear stress nephogram on the hanging wall of the main vein roadway.
Figure 13.
Maximum principal stress nephogram on the footwall of the main vein roadway.
Figure 14.
Maximum shear stress nephogram on the footwall of the main vein roadway.
Notably, both the maximum principal stress and maximum shear stress concentrate at the acute-angle area of the intersection. This pattern suggests that such intersections constitute potential weak zones under high in situ stress conditions. The surrounding rock is subjected not only to high compressive stresses but also to considerable shear stresses, implying that failure is unlikely to be purely compressive. Instead, instability may manifest as shear failure or a combination of compression and shear. In practice, this stress state can readily trigger dynamic hazards such as brittle fracture, rib spalling, shear slippage, or even local rock burst—especially in rock masses with well-developed discontinuities or brittle lithology—thereby increasing the engineering risk.
Consequently, in engineering practice, special attention should be paid to reinforcing the support at and near roadway intersections. Effective measures may include increasing bolt (cable) density, implementing high-prestress support systems, or applying local reinforced concrete lining. Such measures can help control stress-induced deformation and mitigate the risk of surrounding rock failure.
6. Conclusions
- (1)
- In situ stress measurements were conducted at a lead–zinc mine in Yunnan using a self-developed in situ digital wireless acquisition system with dual-temperature compensation. Comprehensive improvements to the digital hollow inclusion strain gauge, combined with temperature-error calibration and core mechanical parameter calibration, significantly enhanced measurement accuracy, providing a reliable basis for obtaining precise in situ stress data.
- (2)
- The in situ stress field exhibits distinct characteristics, being predominantly governed by horizontal tectonic stress. At most measurement points, two principal stresses are subhorizontal, while the third is subvertical. The maximum principal stress is oriented subhorizontally in an approximate NW–SE direction, consistent with both the regional tectonic stress field and the local geological structure. The maximum and minimum horizontal principal stresses and the vertical principal stress all increase approximately linearly with depth. The average ratio of maximum to minimum horizontal principal stress is 1.51, indicating significant shear stress within the horizontal plane, which substantially impacts the stability of roadways and stopes.
- (3)
- The in situ stress field was inverted using a finite difference model integrated with MATLAB and employing multiple linear regression analysis. The regression coefficients passed statistical validation, and an average relative error of 7.74% confirms good accuracy. This provides effective mechanical boundary conditions for subsequent rock pressure control studies, including mining design and support reinforcement.
- (4)
- Local numerical simulations based on the inversion model reveal that significant stress concentration occurs at roadway intersections, where both the maximum principal stress and shear stress are substantially higher than the in situ rock stress, readily inducing shear failure and dynamic hazards in the surrounding rock. Therefore, in deep mining engineering, particular attention should be paid to structural weak zones such as roadway intersections. Adopting high-strength, high-prestress support measures is essential to effectively control surrounding rock deformation and failure, thereby ensuring safe and efficient mining operations.
Author Contributions
Conceptualization, Z.F.; methodology, M.C. and F.L.; software, S.W.; validation, Z.F. and Q.G.; resources, Q.Y.; data curation, X.L.; writing—original draft preparation, Z.F. and S.W.; writing—review and editing, Q.G. and Z.F.; supervision, Q.G. and F.L. All authors have read and agreed to the published version of the manuscript.
Funding
This research was funded by the Ministry of Science and Technology of the People’s Republic of China 2024ZD1700101.
Data Availability Statement
The original contributions presented in this study are included in the article. Further inquiries can be directed to the corresponding authors.
Conflicts of Interest
Qingwen Yan was employed by Yunan Chihong Zn & Ge Co., Ltd. Xianquan Lei was employed by CINF Engineering Co., Ltd. The remaining authors declare that the research was conducted in the absence of any commercial or financial relationships that could be construed as a potential conflict of interest.
References
- Song, Z.; Jiang, Q.; Chen, P.; Xia, Y.; Xiang, T. Nonlinear Intelligent Inversion Method and Practice for In-situ Stress in Stratified Rock Masses with Deep Valley. Rock Mech. Rock Eng. 2025, 58, 1933–1955. [Google Scholar] [CrossRef] [Scilit]
- Zhao, K.; Yang, D.; Huang, Z.; Gong, C.; Zeng, P.; Wang, X.; Li, C.; Zhao, Y. Investigations and new insights on the relation between the valid interval of the Kaiser effect and the characteristic stress. Earth-Sci. Rev. 2024, 249, 104673. [Google Scholar] [CrossRef] [Scilit]
- Li, P.; Liu, Y.; Cai, M.F.; Miao, S.J.; Li, Y.; Hu, Y.J.; Gorjian, M. The Overcoring Technique for Precise Measurement of In Situ Rock Stress at Great Depths: Challenges and Solutions. Engineering 2025, 46, 9–15. [Google Scholar] [CrossRef] [Scilit]
- Cai, M.; He, M.; Liu, D. Rock Mechanics and Engineering, 2nd ed.; Science Press: Beijing, China, 2013. [Google Scholar]
- Hast, N. The state of stresses in the upper part of the earth’s crust. Tectonophysics 1969, 8, 169–211. [Google Scholar] [CrossRef] [Scilit]
- Cai, M.; Liu, W.; Li, Y. In-situ stress measurement at deep position of Linglong Gold Mine and distribution law of in-situ stress field in mine area. Chin. J. Rock Mech. Eng. 2010, 29, 227–233. (In Chinese) [Google Scholar]
- Cai, M.; Guo, Q.; Li, Y.; Du, Z.; Liu, J. In-situ stress measurement and its application in the 10th Mine of Pingdingshan Coal Group. J. Univ. Sci. Technol. Beijing 2013, 35, 1399–1406. [Google Scholar] [CrossRef]
- Zhou, Y.; Bai, Y.; Zhao, X.; Guo, Q.; Zhang, J.; Zhang, L. In-situ stress distribution characteristics in A’erhada Lead-Zinc Mine and its application. Min. Res. Dev. 2022, 42, 85–89. [Google Scholar] [CrossRef]
- Qiao, L.; Ouyang, Z.; Lai, X.; Miao, S. In-situ stress measuring and its result analysis in Sanshandao Gold Mine of China. J. Univ. Sci. Technol. Beijing 2004, 6, 569–571. [Google Scholar] [CrossRef]
- Guo, H.; Ma, Q.; Xue, X.; Wang, D. The Analytical Method of the Initial Stress Field for Rock Masses. Chin. J. Geotech. Eng. 1983, 5, 64–75. (In Chinese) [Google Scholar]
- Zhao, D.; Li, G.; Chen, Z.; Li, S.; Xia, W. Three-dimensional FE regression analysis of multivariate geostress field of Wushaoling Tunnel. Chin. J. Rock Mech. Eng. 2009, 28, 2687–2694. [Google Scholar]
- He, J.; Hu, S.; Guo, Y.; Chen, L. Analysis of tectonic stress in high altitude deep buried tunnel based on multiple linear regression principle. J. Disaster Prev. Mitig. Eng. 2024, 44, 120–127. [Google Scholar] [CrossRef]
- Xu, J.; Pan, P.; Chen, J.; Zhao, S.; Wu, Z.; Liu, X. Study on burst risk assessment of coal seam in folded area based on pre-mining stress back analysis. Coal Sci. Technol. 2023, 51, 35–45. [Google Scholar] [CrossRef]
- Pei, S.; Zhao, J.; Yu, H.; Liu, G.; Xia, Y.; Zhang, D.; Xu, J. Inversion method for local in situ stress considering stress-induced damage of cavern surrounding rock and its application. Rock Soil Mech. 2020, 41, 4093–4104. [Google Scholar] [CrossRef]
- Zhu, W.; Guo, Y.; Li, X.; Jia, C.; Li, Y. Improved regression method for initial geostress based on FLAC3D. Chin. J. Geotech. Eng. 2014, 36, 892–898. [Google Scholar] [CrossRef]
- Meng, W.; He, C.; Yan, J.; Wu, F.; Zhou, Z.; Kou, H. Back Analysis of Geo-stress Field for Adopting or Removing a Constant Term Based on Residual Sum of Squares. J. China Railw. Soc. 2022, 44, 115–122. (In Chinese) [Google Scholar]
- Han, X.; Zheng, W.; Dong, Z.; Zhang, X. Comprehensive testing and analysis of crack resistance in high-head pumped storage power stations. Rock Soil Mech. 2024, 45, 2167–2174. [Google Scholar] [CrossRef]
- Cai, M. Studies of temperature compensation techniques in rockstress measurements. Chin. J. Rock Mech. Eng. 1991, 10, 227–235. (In Chinese) [Google Scholar]
- Li, Y.; Wang, Z.; Qiao, L.; Cai, M.; Li, Q. Development of CSIRO cell with the compromised application of instantaneous data-logging, no-power data-connection and twin temperature compensation techniques. Chin. J. Rock Mech. Eng. 2017, 36, 1479–1487. [Google Scholar] [CrossRef]
- Cai, M. Test and study of reliability of stress relief by overcoring techniques indifferent rock condition. Chin. J. Rock Mech. Eng. 1991, 10, 339–353. (In Chinese) [Google Scholar]
- SL/T 264-2020; Rock Testing Code for Water and Hydropower Engineering. China Water & Power Press: Beijing, China, 2020.
- Han, R.; Wu, P.; Zhang, Y.; Huang, Z.; Wang, F.; Jin, Z.; Zhou, G.; Shi, Z.; Zhang, C. New research progress in metallogenic theory for rich Zn-Pb-(Ag-Ge) deposits in the Sichuan-Yunnan-Guizhou Triangle (SYGT) area, southwestern Tethys. Acta Geol. Sin. 2022, 96, 554–573. [Google Scholar] [CrossRef]
- Yan, Z. Research on Digital Mining and Recovery Index Optimization of Sublevel Caving Method in Gongchangling Iron Mine. Ph.D. Thesis, University of Science and Technology Beijing, Beijing, China, 2019. [Google Scholar]
- Li, P.; Miao, S. Analysis and application of in-situ stress in metal mining area of Chinese mainland. Chin. J. Eng. 2017, 39, 323–334. [Google Scholar] [CrossRef]
- Brown, E.T.; Hoek, E. Trends in relationships between measured in-situ stress and depth. Int. J. Rock Mech. Min. Sci. Geomech. Abstr. 1978, 15, 211–215. [Google Scholar] [CrossRef] [Scilit]
- Hoek, E.; Brown, E.T. Underground Excavations in Rock; Institution of Mining and Metallurgy: London, UK, 1980. [Google Scholar]
- Pei, Q.; Ding, X.; Lu, B.; Huang, S.; Fu, J.; Han, X. Two-stage back analysis method of initial geostress field in dam areas considering distribution characteristics of geostress. Rock Soil Mech. 2016, 37, 2961–2970. [Google Scholar] [CrossRef]


Disclaimer/Publisher’s Note: The statements, opinions and data contained in all publications are solely those of the individual author(s) and contributor(s) and not of MDPI and/or the editor(s). MDPI and/or the editor(s) disclaim responsibility for any injury to people or property resulting from any ideas, methods, instructions or products referred to in the content. |
© 2026 by the authors. Licensee MDPI, Basel, Switzerland. This article is an open access article distributed under the terms and conditions of the Creative Commons Attribution (CC BY) license.