


Abstract
Ultrasound-driven coated microbubbles are a promising vehicle for targeted drug delivery, yet how peristaltic wall motion, non-Newtonian blood rheology, and shell-resolved bubble dynamics jointly govern delivery remains poorly understood. Resolving this coupling, we identify two operating principles for microbubble-mediated delivery: drug release is gated by shell rupture rather than graded by acoustic amplitude, and near-wall targeting is governed by matching the drive frequency to the shell resonance. At the clinically standard operating point (PA = 120 kPa, f = 2 MHz, mechanical index MI = 0.085) 88% of the payload is released within one acoustic cycle, while the minimum rupture threshold reported here lies below MI = 0.06; for SonoVue-like shells the threshold itself is minimized along the frequency–size locus fopt R0 ≈ 3.9 MHz.μm. We establish these results with a multiscale framework coupling a Carreau–Yasuda peristaltic carrier flow, obtained from a long-wave lubrication reduction, with the Lagrangian dynamics of a coated microbubble governed by the Marmottant–Keller–Miksis equation and a phenomenological rupture-gated release model, integrated with an adaptive stiff solver at acoustic resolution. The rupture threshold, at which the periodic radial orbit first reaches the rupture radius, is mapped in the drive-frequency–pressure plane. Near-wall migration is driven not by the hydrodynamic pressure, which modulates the oscillation by only one part in 105, but by the secondary-Bjerknes attraction: in the continuity-consistent peristaltic carrier field it induces a radial migration of 28% of the vessel radius over three peristaltic periods at the shell resonance of a 1 MHz drive, f shell/f ≈ 1.13, more than an order of magnitude above that of smaller off-resonant bubbles and insensitive to the near-wall regularization. Shear-thinning suppresses the peristaltic pressure variation as , thirteen-fold at baseline, while reducing the net throughput by only about 10%. These results establish frequency–size matching as the primary lever for rupture-gated release and near-wall migration, with the peristaltic amplitude ratio as a geometric modulator of the wall-directed attraction.
Keywords:
coated microbubbles; peristaltic flow; Marmottant–Keller–Miksis; shell rupture; non-Newtonian rheology; targeted drug delivery MSC:
76M35; 35Q31; 35Q05; 76M20
1. Introduction
Targeted drug administration remains a primary obstacle in contemporary medicine, requiring spatial accuracy, temporal control, and reduced systemic toxicity. Acoustically activated coated microbubbles, gas-filled microspheres enveloped by a phospholipid or polymer membrane, have emerged as an exceptionally adaptable medium for this application. When exposed to a focused ultrasound beam, these agents undergo nonlinear radial oscillations that generate mechanical stresses that can temporarily permeabilize the surrounding endothelium, facilitating localized drug delivery across typically impermeable vascular barriers [1,2,3]. In addition, this modality is clinically attractive because phospholipid-shelled agents such as SonoVue are already approved as diagnostic contrast agents, thus providing an established safety profile for in vivo use [4].
The physical mechanism underlying the therapeutic efficacy is based on shell-resolved bubble dynamics. The most robust framework for predicting the response of lipid-coated microbubbles under moderate-to-large acoustic forcing remains the constitutive model of Marmottant et al. [5], coupled with the compressible Keller–Miksis equation [6]. This covers three mechanically different shell regimes, buckling, elastic expansion, and rupture, with qualitatively different oscillation amplitudes, acoustic emissions, and drug-release properties. The nonlinear response of this system, from subharmonic emission at moderate forcing to the abrupt onset of rupture-dominated dynamics, has been systematically characterized [7,8,9]. More recently, Cattaneo et al. [10] experimentally showed that the cyclic microjets formed by single microbubbles at mild acoustic pressures play an important role in transendothelial drug uptake, highlighting the significance of near-wall bubble dynamics in therapeutic delivery. Wu et al. [11] extended nonlinear modeling of encapsulated microbubbles to three dimensions, and Song et al. [12] examined coated-microbubble oscillation over a range of ultrasonic parameters and bubble properties.
Equally important to the efficacy of delivery is the hydrodynamic environment where the microbubble is circulating. Blood is a non-Newtonian fluid that exhibits a strong shear-thinning behavior, with apparent viscosity ranging over nearly two orders of magnitude between the low and high shear limits, a behavior well described by the Carreau–Yasuda constitutive model [13,14]. The consequences of the non-Newtonian rheology for bubble dynamics [15,16] and for the transport of particles in the vasculature are far from cosmetic: Fanelli et al. [17] showed that Newtonian models systematically overestimate drug-carrier delivery efficiency in physiologically relevant flow regimes, where the required driving force varies by as much as a factor of 2 compared to the shear-thinning case. Also, biological vessels are not rigid pipes. Smooth-muscle vasomotion makes arteriolar diameters oscillate at ≈0.1 Hz, and in the awake mouse brain these oscillations propagate along pial and penetrating arterioles as traveling waves with wavelengths of 15–19 mm and speeds of ≈2 mm s−1 [18,19], continuously reshaping the hydrodynamic environment experienced by circulating agents.
The peristaltic pumping of non-Newtonian fluids has been studied extensively, including in curved channels [20,21,22], but mostly for passive solutes, not for acoustically active agents. Peristaltic forcing is ubiquitous in physiology but has been virtually ignored in the setting of acoustically activated microbubble-mediated drug delivery.
This difference is important for three interrelated reasons. First, the external pressure of the Keller–Miksis equation is considered as a spatiotemporal bias fluctuation by the propagating pressure wave, which leads to the question of whether and at what amplitude the peristaltic pressure modulation can alter the oscillation regime and the shell-rupture threshold in relation to the acoustically driven baseline. Secondly, the radial component of the peristaltic velocity field results in a lateral hydrodynamic force on the bubble, which could continuously influence its radial position in the vessel lumen, possibly pushing it toward the endothelium, where proximity to the cells is a key determinant of sonoporation [10]. Third, the nonlinear coupling between the non-Newtonian rheological properties of blood and both the peristaltic flow dynamics and the viscous damping at the bubble scale makes the effective drag and wall-interaction forces on the bubble indistinguishable using only Newtonian or acoustic evaluations. No existing model treats these three couplings together.
We address this gap by proposing here a coupled multiscale computational framework that integrates four physical subproblems: (i) generalized-Newtonian peristaltic carrier flow modeled by the Carreau–Yasuda constitutive equation in an axisymmetric biomimetic vessel; (ii) Lagrangian microbubble transport including viscous drag, pressure-gradient, added-mass, wall-interaction, and secondary Bjerknes forces; (iii) shell-resolved radial dynamics modeled by the Marmottant–Keller–Miksis equation; and (iv) phenomenological, rupture-gated drug release. The transport and transendothelial uptake of the released drug are not resolved; near-wall delivery is assessed instead through an estimate of the bubble-induced wall loading. The subproblems are combined across their different temporal scales: the shell-resolved radial dynamics using an adaptive stiff (Radau) solver at acoustic resolution, the peristaltic carrier flow from a long-wave lubrication approximation of the Carreau–Yasuda momentum equation, and the Lagrangian transport happening at the peristaltic time scale, taking advantage of the six-order difference between the acoustic and peristaltic intervals. The specific objectives are (1) to quantify the influence of peristaltic wall motion on bubble migration toward the wall, (2) to relate the shell-resolved oscillation to the extent and timing of drug release, (3) to estimate the bubble-induced wall loading and the stand-off within which it can permeabilize the endothelium, and (4) to elucidate, through systematic parametric analysis, the collective effects of drive frequency, acoustic pressure amplitude, and peristaltic amplitude ratio on shell rupture and near-wall migration. To the authors’ knowledge, this is the first study to couple a peristaltic non-Newtonian carrier flow with the shell-resolved dynamics of an acoustically driven coated microbubble; it shows that frequency–size matching both selects the bubbles that migrate to the endothelium and minimizes the acoustic pressure at which the shell ruptures and releases its payload.
2. Mathematical Formulation
2.1. Problem Formulation and Modeling Assumptions
The physical layout is depicted in Figure 1. A coated microbubble translating in whole blood in an axisymmetric vessel with sinusoidal peristaltic wall motion described by Equation (1) moving axially with phase velocity c (Figure 1A). The mean value is a0 and the half width of the lumen varies from a0 − b at the minima to a0 + b at the maxima with the intensity of the peristaltic stimulation being controlled by the amplitude ratio ϕ = b/a0. The vessel is insonified by a plane wave propagating along its axis, so that the acoustic pressure is uniform over each cross-section and the pressure exerted on the bubble is the sum of the static reference pressure, the hydrodynamic gage pressure of the carrier flow and the acoustic drive as given by Equation (27). On the individual bubble level (Figure 1B), the agent is an equilibrium-radius, R0 gas core covered by a viscoelastic shell of finite thickness, with surface tension following the Marmottant law; the bubble’s centroid Xb(t) is advected by the carrier flow and its radius R(t) changes according to the acoustic excitation [6].
Figure 1.
Schematic of the coupled peristaltic–acoustic problem. (A) A drug-loaded coated microbubble suspended in Carreau–Yasuda blood within an axisymmetric vessel whose wall follows , Equation (1), with mean half-width a0, wave amplitude b, wavelength λ, and phase speed c; the amplitude ratio is ϕ = b/a0. Coordinates z and r are axial and radial. (B) Cross-section of a single bubble of equilibrium radius R0 and centroid Xb(t) = (rb(t), zb(t)), enclosed by a viscoelastic shell of finite thickness; the double-headed arrow denotes the radial oscillation R(t).
The undeformed vessel is assumed to be cylindrical with mean radius a0. Its wall undergoes a prescribed sinusoidal peristaltic deformation propagating axially with constant wave speed c, so that the instantaneous wall position is given by [20,21]
with 0 < b < a0, which keeps the lumen radius strictly positive at all times; the amplitude ratio ϕ = b/a0 sets the strength of the peristaltic forcing. Equation (1) describes an idealized biomimetic configuration rather than a specific vascular bed. Like measurements of vasomotion [19], it retains only the first Fourier component of the wall motion; unlike vasomotor waves, which propagate in either direction with variable phase [19], it is a single unidirectional wave, the coherent limit of classical peristalsis [23]. Its wavelength, λ = 15 mm, coincides with the measured vasomotor wavelength, while its speed and frequency, c = 5 mm s−1 and c/λ = 0.33 Hz, exceed the measured ≈ 2 mm s−1 and ≈ 0.1 Hz by factors of about 2.5 and 3. The amplitude ϕ = 0.20 lies above the spontaneous range, Δd/⟨d⟩ ≤ 0.13, and is comparable to driven constrictions [19], so that the amplitude dependence is examined over ϕ = 0.05 − 0.30 (Section 5.6, Section 5.7 and Section 5.8). The radius a0 = 1 mm exceeds that of cortical arterioles because the point-particle and unbounded-liquid descriptions of Section 2.4 and Section 2.5 require R0/a0 ≪ 1.
The carrier phase is incompressible and axisymmetric, and its shear-dependent viscosity is represented by the Carreau–Yasuda constitutive model, the standard inelastic description of whole blood over the shear-rate range spanned by the present flow [13,14]. A single coated microbubble is suspended within this carrier flow, with instantaneous centroid position
and instantaneous radius R(t). The bubble is presumed to maintain a spherical form: shape variations are not accounted for. Its mechanical influence on the endothelium is characterized by the radial excursion, which serves as the jetting-onset criterion established experimentally in [10] (Section 5.10), and by an order-of-magnitude estimate of the wall shear stress. The shell exhibits viscoelastic properties and is characterized by the Marmottant constitutive law, wherein the effective interfacial tension depends on the current shell area, allowing for the identification of multiple mechanical regimes like as buckling, elastic expansion, and rupture during bubble oscillation. The gas core is presumed to maintain a uniform pressure distribution and to adhere to a polytropic compression principle. The microbubble is propelled by the synergistic influence of the local hydrodynamic gage pressure produced by the peristaltic carrier flow and an externally applied harmonic ultrasonic field characterized by amplitude PA, angular frequency ω, and starting phase ϕUS, as delineated in Equation (27). The suspension is diluted: the bubble is transported by the carrier flow without altering it, allowing the hydrodynamic issue to be addressed independently while the bubble-scale subproblems are linked to it unidirectionally. The therapeutic agent is attached to the shell and released according to its oscillatory state (Section 2.6); the subsequent transport and transendothelial uptake of the released drug are not resolved, and near-wall delivery is assessed through the bubble-induced wall loading of Section 5.9.
The formulation relies on these fundamental premises:
- The transport medium is incompressible, axisymmetric, and generalized-Newtonian, with its effective viscosity dictated by the Carreau–Yasuda model.
- The wall of the vessel experiences the specified sinusoidal peristaltic movement as described in Equation (1). Its motion is prescribed rather than compliant and purely radial, with no axial displacement of the wall material.
- The carrier flow is obtained from a long-wave (lubrication) reduction in the axisymmetric momentum balance, justified by the slenderness ratio and the Reynolds number of Table 1.Table 1. Baseline parameters and dimensionless groups of the coupled peristaltic–bubble–release problem. Rheological constants are the Carreau–Yasuda fit for human whole blood at 37 °C [24], shell constants are representative of SonoVue [5], and release constants are phenomenological.
- The suspension is sparse: one exemplary drug-encapsulated coated microbubble is monitored, interactions between bubbles are disregarded, and the bubble does not influence the carrier flow. Due to the axisymmetric nature of the carrier field and the unidirectional coupling, monitoring the bubble in the meridional (r, z) plane is precise for both the translational and radial subproblems, with no constraints on rb/a0.
- The bubble retains a spherical form; shape modes are not differentiated. Its encapsulating shell exhibits viscoelastic properties and adheres to a Marmottant-type constitutive model, where the effective interfacial tension depends on the current shell area.
- The gas core is uniform in pressure and follows a polytropic law, and the applied ultrasonic field is uniform in space on the size of the bubble.
- Translational motion is described by a point-particle force balance, valid for R0/a0 = 1.25 × 10⁻³, with the Basset history force neglected on the grounds established in Section 2.4. The acoustic and peristaltic time scales are separated by six orders of magnitude, Tac = 2π/ω = 5 × 10⁻⁷ s against Tp = λ/c = 3 s, so that the radiation forces Fac and FBj2 of Equation (17), and the radius-dependent coefficients of Equations (18)–(23), are evaluated as acoustic-cycle averages on the peristaltic time scale.
- The released drug is not tracked: its transport and transendothelial uptake lie outside the present model.
With these assumptions the formulation is organized around two scale separations, both of which are exploited in the solution technique of Section 4. Spatially the bubble is smaller than the vessel by three orders of magnitude, R0/a0 = 1.25 × 10⁻³, so that the carrier flow is uniform over the bubble and the bubble is treated as a point particle. The acoustic and peristaltic time scales are separated by six orders of magnitude, Tp/Tac = 6 × 10⁶, allowing the shell-resolved radial dynamics to be integrated at acoustic resolution while the translational subproblem is advanced on the peristaltic time scale. The framework is thus designed to answer, in a single coupled system, three questions posed by the confluence of peristaltic and acoustic forcing: what amplitude, if any, of the peristaltic hydrodynamic pressure can alter the oscillation regime and the shell-rupture threshold relative to the purely acoustic baseline; is the peristaltic carrier field biased in a radial direction toward the endothelium, and over what time scale; and how does the resulting near-wall history, in conjunction with the shell state, control payload release and wall loading. The subproblems are introduced in this order in Section 2.2, Section 2.3, Section 2.4, Section 2.5 and Section 2.6.
2.2. Carreau–Yasuda Peristaltic Carrier-Flow Model
The carrier phase resides within the time-varying axisymmetric region delineated by the vessel axis and the peristaltically altering wall. The flow is regulated by the continuity equation
and the momentum equation
The fluid is generalized-Newtonian with a Carreau–Yasuda constitutive relation
in which the scalar shear rate is the second invariant , given in cylindrical coordinates by
Equation (6) is stated in full; the reduction consistent with the long-wave ordering adopted below is given in Equation (9). The apparent viscosity follows the Carreau–Yasuda law
where μ0, μ∞, λc, nc, and ac are the zero-shear viscosity, infinite-shear viscosity, relaxation time, power-law index and Yasuda parameter respectively. The values listed in Table 1 are the standard fit for human whole blood at 37 °C [24]; since such fits are not uniquely identifiable from steady-shear data [14], results that depend on the low-shear plateau are stated for this set (Section 5.8), and the effect of the closure itself is assessed in Section 5.10. The vessel diameter, 2 mm, exceeds the red-cell diameter by a factor of 250, so that the carrier flow is treated as a continuum.
The non-zero stress components are
Two characteristics of this closure govern the interconnected issue. Initially, the viscosity is constrained at both extremes of the shear-rate spectrum, resulting in a maximum contrast throughout the lumen limited to μ0 /μ∞ = 45.7; of this, a factor of 20.6 is achieved at the baseline operating point (Section 5.1). Secondly, the shift between the two plateaux transpires at , a figure that falls within the spectrum of shear rates produced by the peristaltic wall motion, so allowing both asymptotic states to be observed within a singular wavelength. A closure with constant viscosity fails to replicate this stratification; Section 5.10 demonstrates that two-parameter shear-thinning models without a zero-shear plateau inaccurately depict it in the contrary manner. The slenderness ratio δ = a0 /λ = 0.067 and the reduced Reynolds number of Table 1 [23] permit a long-wave (lubrication) reduction in Equations (3)–(8). Under this ordering the radial momentum balance degenerates to ∂p/∂r = 0, so that p = p(z, t), and the shear rate of Equation (6) reduces to
the overlooked contributions, such as the azimuthal term Dθθ = ur /r, emerge at O(δ2) = 4.4 × 10⁻³. Maintaining in its complete representation in Equation (6) while neglecting O(δ) terms in the momentum balance would lead to inconsistency; thus, Equation (9) is employed consistently to assess in the carrier-flow solution. Given that the wall configuration in Equation (1) represents a purely propagating wave, the flow is stabilized using the wave-frame transformation.
in which the wall is stationary and, by assumption II, carries no axial material velocity, so that w = −c at r = Rw(Z). The leading-order axial momentum balance is , which integrates once, using τrz = 0 on the axis, to
For the Carreau–Yasuda law of Equation (7) this relation cannot be inverted in closed form; it is solved pointwise for ∂w/∂r at each radial station, and the axial velocity recovered by integration from the wall,
the radial velocity is derived from the continuity Equation (3). Equation (12) represents the generalized-Poiseuille profile of the issue: its configuration is determined locally by instead of being parabolic, and it converges to the Newtonian parabola just in the limit λc → 0. The axial pressure gradient dp/dZ is yet to be ascertained. In the wave frame, the flow remains constant, hence the volumetric flux in the wave frame is stable.
it is autonomous from Z; necessitating Equations (11)–(13) to yield a consistent q at each axial location establishes dp/dZ at specific points. The sole enduring variable, q, is determined by the free-pumping criterion ∮(dp/dZ) dZ = 0, which enforces a null average pressure increase throughout one wavelength and signifies a container propelled solely by peristalsis, devoid of any externally imposed axial pressure gradient.
The pressure rise Δp of Equation (47) and the peristaltic wall shear stress of Equation (48) are assessed as diagnostics of this solution instead of being treated as inputs.
2.3. Boundary Conditions for the Carrier-Flow Model
The domain enclosed by the vessel centerline and the peristaltically deforming wall is where the carrier-flow problem is closed. The axial momentum balance is second order in uz and requires two conditions after the long-wave reduction in Section 2.2, whereas ur follows from the continuity Equation (3) by radial integration and requires one. Axisymmetry necessitates that the axial velocity be regular and the radial velocity disappear at the vessel axis r = 0.
At the moving wall r = Rw(z, t), the fluid adheres to the wall material. Because the wall deformation of Equation (1) is purely radial and carries no axial material velocity (assumption II), the no-slip condition reads
in the laboratory frame, equivalently w = −c in the wave frame of Equation (10). The kinematic condition at the wall follows from differentiating Equation (1),
Equation (16) does not represent an autonomous situation. Incorporating the continuity Equation (3) across the lumen with the condition ur (0) = 0 yields the wall value of ur expressed in terms of , which precisely replicates Equation (16) as long as the axial flux corresponds to the constant wave-frame flux q specified in Equation (13). Equation (16) thus functions as a kinematic consistency verification for the carrier-flow solution instead of providing further data; it is validated numerically in Section 5.1, where the flux is maintained to |Δq|/q < 10−13. No constraints regarding pressure are applied at the axis. In the context of long-wave ordering, ∂p/∂r = 0 is maintained across the lumen, indicating that p = p(z, t); the axial pressure gradient is not specified but is ascertained by the flux-conservation and free-pumping criteria outlined in Section 2.2.
2.4. Lagrangian Transport of the Coated Microbubble
The coated microbubble is treated as a discrete Lagrangian entity with instantaneous centroid position Xb(t) = (rb(t), zb(t)) and translational velocity Vb = dXb/dt. Its equation of motion [25] is
Two components of the overall equation are not included. The Basset history force’s impact is minimal within the timeframe associated with Equation (17): its ratio to the quasi-steady drag is , where ωp = 2π/Tp = 2.09 s−1 signifies the angular frequency of the peristaltic wave, which should not be conflated with the acoustic ω in Equation (27), and μapp indicates the carrier viscosity at the bubble centroid. According to the characteristics presented in Table 1, this ratio equals 1.5 × 10⁻⁴ [25]. Correspondingly, the viscous penetration depth of the peristaltic oscillation, with μapp≃μ0 in the plug-like core, exceeds the vessel radius a0 by a factor of 8.5 (Womersley number a0/δν = 0.12), suggesting that the carrier flow is quasi-steady across the full lumen, consistent with the long-wave simplification presented in Section 2.2. The shear-induced lift force is also minimal: with the characteristic lumen shear rate , the Saffman number , and the bubble resides within the plug-like core outlined in Section 5.1, where the shear rate is further diminished.
For axial insonation the primary Bjerknes force is directed along the vessel axis and has no radial component, so it does not enter the radial balance that governs migration; its axial part, of order 10−9 − 10−7 N for the bubbles considered, is neglected. The remaining contributions are as follows. The viscous drag [25] is
where denotes the local Carreau–Yasuda apparent viscosity assessed at the bubble centroid, and ⟨R⟩ T represents the radius averaged over a single acoustic period, aligning with the temporal scale utilized for the integration of Equation (17). The proper coefficient is 6π for the rigid sphere instead of the clean-interface value of 4π, as the lipid monolayer stabilizes the gas–liquid interface, inhibiting the internal circulation responsible for the Hadamard–Rybczynski reduction. The force resulting from the pressure gradient is
In Section 2.2’s long-wave ordering, the carrier pressure is such that ∂p/∂r = 0, which means that ∇p = (∂p/∂z) ez and FP is axially pure. Radial migration, if it happens, must arise from either the carrier velocity field or the contact between the bubble and the wall, not from the peristaltic pressure, because the peristaltic pressure field does not apply a radial force to the bubble at any amplitude ratio. This is a property of the formulation, independent of the numerical results of Section 5.5 and Section 5.6. The added-mass force accounts for the inertia of the displaced fluid [25].
For a bubble of varying volume, the general expression carries the additional contribution . This term is omitted here by the scale-separation argument of assumption VII: the slip velocity u − Vb evolves on the peristaltic scale Tp and is therefore constant over one acoustic period Tac to O(Tac /Tp) = O(10−7), so that , since identically for a periodically oscillating bubble. The term thus makes no net contribution on the peristaltic time scale over which Equation (17) is advanced.
A short-range repulsion is introduced to prevent the bubble centroid from crossing the wall:
where is the bubble–wall gap, Aw and are the interaction strength and range of Table 1, and
is the outward unit normal to the vessel wall, directed from the lumen toward the wall; the leading negative sign in Equation (21) therefore makes FW repulsive. The same normal fixes the direction of the secondary Bjerknes force of Equation (23). Equation (21) represents a numerical regularization instead of a constitutive assertion: the physical near-contact resistance corresponds to the lubricating force, which becomes infinite as for a stationary interface, while Equation (21) saturates at Aw. The exponential representation is utilized for its numerical stability at diminishing gaps, in accordance with similar approaches in immersed-boundary formulations [26,27]. Since Aw is not a separately quantified variable and is comparable to the wall-directed attraction described in Equation (23) at contact-scale distances, the dependence of the trajectory outcomes on Aw is discussed in Section 5.5. The fluctuating bubble engages hydrodynamically with the adjacent wall segment via its image, resulting in a secondary Bjerknes force that forms the radial wall-targeting mechanism of the current setup [28,29,30]. For a bubble and its corresponding in-phase picture distanced by double the centroid-wall distance h(t) = Rw(zb, t) − rb(t), the conventional two-bubble outcome simplifies to
it is oriented along +nw and hence draws toward the wall for all shell states. The mean ⟨⋅⟩T is computed across a single acoustic cycle, aligning with the temporal framework of Equation (17). The distance in Equation (23) is defined as the centroid-wall separation instead of the surface gap dw, ensuring that the force remains finite as the bubble nears contact, with its value at dw → 0 determined by ⟨R⟩T rather than escalating.
The translational kinematics are completed by
2.5. Shell-Resolved Radial Dynamics of the Coated Microbubble
The instantaneous bubble radius R(t) is governed by the Marmottant–Keller–Miksis equation
where cf is the speed of sound in the surrounding liquid, and
At this scale the law serves as an effective approximation: the viscous layer around the bubble, of thickness , is thinner than a red cell, so that the sheared fluid is predominantly plasma, of lower viscosity [31], and the use of μ∞ overestimates the viscous damping. Here, κs is the shell dilatational viscosity, and is the Carreau–Yasuda apparent viscosity evaluated at the bubble surface using the local shear rate . Since this rate peaks above 6 × 10⁵ s−1, μb exceeds μ∞ by more than 10% only where |R|/R < 3 × 10² s−1, over about 3 × 10⁻⁴ of each cycle near the turning points, where the viscous stress vanishes; the bubble problem is therefore effectively Newtonian with viscosity μ∞. A bubble smaller than an erythrocyte is surrounded by plasma, a Newtonian liquid of viscosity 1.10 − 1.30 mPa s at 37 °C [31], so that μ∞ = 3.5 mPa s overestimates the viscous damping and the computed oscillation amplitudes are conservative.
The external pressure is decomposed as
where P0 denotes the static reference pressure, ph represents the hydrodynamic gage pressure of the peristaltic carrier flow assessed at the bubble centroid, and PA, ω, ϕUS signify the acoustic amplitude, angular frequency, and starting phase, respectively. The three contributions exhibit significant disparity in size. The peristaltic gage pressure is bounded by the lubrication scale Pa of Equation (38) and, after the shear-thinning suppression S = 0.074 of Section 5.8, remains of order 1 Pa, so that Ph/PA∼10−5 at the baseline of Table 1. The peristaltic wave, based only on dimensional considerations, cannot alter the oscillation regime of the bubble; any effect of peristalsis on delivery must operate via the carrier velocity field and the consequent bubble path, rather than through the pressure in Equation (27). This anticipation is explicitly validated in Section 5.2.
Gas pressure obeys a polytropic law
where γ is the polytropic exponent and Pg0 follows from the static mechanical balance at , giving Pg0 = P0 + 3.2 × 10⁴ Pa for the parameters of Table 1. For an uncoated gas bubble the natural frequency reduces to the Minnaert [32] value
This results in MHz at R0 = 1.25 μm. Equation (29) is referenced solely as a benchmark: it characterizes a free gas–liquid interface and disregards the shell, while the shell plays a pivotal role in providing the primary restoring force for the agents examined in this context. The suitable eigenfrequency, along with the classification ratio of the driving regime discussed in this study, is hence the coated-bubble value obtained below.
The coated interface follows the area-based Marmottant constitutive law [5,33,34]. Writing the shell area as A = 4πR2 with buckling area , the effective surface tension is
where χs is the shell elastic modulus and the elastic branch varies with shell area, not radius. The buckling and rupture radii follow from σeff(R0) = σ0 and σeff(Rrup) = σrup,
which yield and Rrup = 1.365 for the parameters of Table 1. The area-based version of Equation (30) is utilized in all calculations; it simplifies to the well-known radius-linear expression solely in the small-oscillation limit R → Rbuck, and the two representations exhibit measurable differences at the expansion amplitudes attained here. Linearizing Equations (25)–(28) around R = R0 on the elastic segment of Equation (30) produces the eigenfrequency of the coated bubble.
in which the elastic group , obtained by differentiating the area-based tension law of Equation (30) through 2σeff(R)/R, is the shell stiffness contribution absent from the free-bubble result of Equation (29). For the baseline parameters Pa, of which the shell term 2.77 × 10⁵ Pa exceeds the gas contribution γPg0 = 1.43 × 10⁵ Pa, giving fshell = 4.39 MHz against MHz: the shell nearly doubles the eigenfrequency. All driving conditions in this work are classified by the ratio f/fshell. The piecewise tension law of Equation (30) has a discontinuous slope dσeff/dR at Rbuck and Rrup. To render the right-hand side of Equation (25) Lipschitz-continuous for the adaptive integrator of Section 4, each corner is regularized by hyperbolic-tangent blending over a width δs = 0.01 R0, a smoothing that alters the peak expansion ratio by less than 0.5% relative to the sharp-cornered law.
The initial conditions are
2.6. Rupture-Gated Drug-Release Model
Let Md(t) denote the drug mass bound to the shell, with Md(0) = Md0. It decays according to [35]
in which the instantaneous release-rate coefficient couples the smooth oscillatory state to a gated rupture contribution:
In this context, k0 represents the fundamental release constant, α1 and α2 quantify the influences of radial displacement and oscillation velocity, while denotes the Heaviside function. The two systems operate on distinct levels. The enclosed term signifies gradual diffusive leaking from an unbroken shell and maintains a value close to one consistently: throughout an oscillation, it elevates above k0 by a maximum determined by the permissible displacement and velocity amplitudes, typically by a factor of only a few. The rupture term activates solely when the radial displacement surpasses Rrup, at which moment an additional contribution krup/k0 = 100 is superposed on the smooth term, so that the instantaneous rate reaches k0[101 + α1A2 + α2B2], two orders of magnitude above the intact-shell value. Release is hence conditional rather than evaluative: the critical factor is not the amplitude of oscillation but whether the path intersects Rrup, a differentiation elaborated in Section 5.3.
Equation (35) is a phenomenological release law: the rupture gate is imposed constitutively through the Heaviside term, and the shell dynamics determine only whether and when Rrup is crossed. Its structure, a threshold-activated release completed within a few acoustic cycles, follows the lipid shedding observed in single lipid-shelled microbubbles above a threshold oscillation amplitude [36]; the onset is not calibrated against these data but fixed by σrup, which, like the other shell constants of Table 1, is representative of SonoVue [5,37,38]. The factor krup = 100k0 sets the completion time: over the 25-cycle pulse of Section 5.4, the released fraction exceeds 99.8% for every krup/k0 ≥ 10, against 75.2% without rupture, while at 120 kPa the time to 99% release falls from 17 to 0.08 acoustic periods as krup/k0 increases from 10 to 1000. The extent of release is thus set by the rupture crossing and its duration by krup, provided the pulse outlasts this completion time. The constants k0, α1, α2 and krup are listed in Table 1. They set the release time scales k0−1 = 9.0 μs for the intact shell and after rupture. The smooth term is linear in α1 and α2 and exceeds unity by only 0.25% below threshold, so a tenfold change in both alters no reported fraction by more than one percentage point. Since Equation (34) is linear and homogeneous in Md, every reported quantity is the normalized fraction of Equation (36), and Md0 requires no value.
The cumulative released fraction is
Because Equation (34) is linear in Md(t) once the radial history R(t) is known, it integrates exactly along the shell-resolved solution,
so that no operator-splitting error is incurred between the radial and release subproblems.
3. Scaling Analysis and Governing Parameter Space
The governing equations are rendered dimensionless using the characteristic scales of the peristaltic flow, bubble oscillation, and drug release:
Since this viscous pressure scale is inappropriate for the bubble subsystem, a separate pressure scale is introduced for Equations (25)–(28). The relevant scale there is the inertial one set by the Keller–Miksis operator, Pa, so that the driving pressure is normalized as , which is the normalization that renders the inertial terms of Equation (43) coefficient-free. The static reference pressure enters through the acoustic number of Table 1, which classifies the drive amplitude but is not the scale of Equation (43).
and the dimensionless continuity and momentum equations take the form
Under the anisotropic long-wave scaling of Equation (38), the radial and axial momentum balances carry different powers of δ and are therefore written component-wise rather than in isotropic vector form. Retaining terms through Oδ2, they read
where is the Reynolds number. Since the reduced Reynolds number of Table 1 and δ2 = 4.4 × 10⁻³ are both small, the leading-order lubrication system is
the dimensionless counterpart of Equations (11) and (12), and the form used in all computations. The dimensionless Carreau–Yasuda viscosity is
where μr = μ∞/μ0 is the viscosity ratio and Cu = λcc/a0 is the Carreau number. The bubble subproblem evolves on the acoustic scale and is therefore advanced in the acoustic time τ = ωt of Equation (38) rather than in the peristaltic time ; with a prime denoting d/dτ, the dimensionless bubble dynamics equation is
where εc = R0ω/cf is the liquid-compressibility parameter. The two time variables are related by , with (Table 1), measuring the acoustic–peristaltic scale separation exploited in Section 4. The dimensionless drug-release equation is
where is the release-rate coefficient of Equation (35) normalized by the baseline constant k0, and denotes the release number, juxtaposing the fundamental release rate with the peristaltic advection time. Equation (44) is advanced in the peristaltic time of Equation (38), the release being evaluated as a post-processing quadrature along the acoustically resolved radial history of Section 2.6. For the parameters in Table 1, : the inherent release duration is five orders of magnitude less than the peristaltic interval λ/c, rendering the gated release of Equation (35) virtually immediate upon surpassing Rrup. In conjunction with the sixth-order acoustic-peristaltic separation, this validates that the three subproblems exist on separate time scales and can be independently integrated.
4. Solution Algorithm and Numerical Implementation
The interconnected system encompasses temporal scales differing by six orders of magnitude: the acoustic period Tac = 2π/ω = 0.5 μs during which the shell-resolved radius fluctuates, and the peristaltic period T p = λ/c = 3.0 s over which the bubble moves and the carrier wave progresses. A solitary monolithic integrator addressing the acoustic scale over three peristaltic periods would necessitate acoustic cycles for each trajectory and is neither essential nor efficient, as the interaction between the scales is unidirectional and asymptotically feeble. Three characteristics of the formulation justify this decomposition. Initially, the peristaltic hydrodynamic pressure influences bubble dynamics solely via ph in Equation (27), where ph/PA ∼10−5, indicating that the carrier flow does not significantly affect the radial oscillation. Secondly, the translational relaxation duration of the bubble is s, therefore at the peristaltic scale, the radial condition attains its acoustic equilibrium virtually quickly and contributes to the force balancing solely via cycle-averaged metrics. Third, the gated emission of Equation (35) occurs virtually instantaneously on the transport scale, .
These decompositions imply a decomposed approach where each subproblem is solved separately and interacts with the others through scale-reduced metrics rather than the fully resolved fields. The radial dynamics of Equation (25) are solved at acoustic resolution, yielding the cycle-averaged group and the maximum expansion , incorporated into the translational force equilibrium of Equation (17), developed on the peristaltic scale. The carrier flow is obtained separately from the long-wave solution of Section 2.2. The release is integrated analytically along the radial trajectory, using the release relation of Section 2.6. In a peristaltic-scale transition, there is no transmission of any rigid acoustic-scale field. No operator-splitting inaccuracies occur between release and radial dynamics. The coupling is thus one-way and sequential, carrier field → radial state → translation and release, with no feedback (Assumptions IV and VII): each subproblem is integrated implicitly, but no iteration between subproblems is required. This differs from fully implicit formulations of a single two-way coupled field problem, such as the monolithic Newton solution for a deformable bubble with a level-set interface [39] and the Newton–Krylov–Schwarz solution of three-dimensional Carreau–Yasuda blood flow [40]. The physical models differ as well: here the bubble is a spherical coated oscillator and the carrier flow is long-wave, so that the viscosity depends on the local stress alone and the relaxed iteration of Equation (45) converges without a Jacobian. A monolithic formulation such as that of [39] would be needed to resolve the non-spherical near-wall dynamics. This section defines the three constituent solvers and presents the convergence analysis used to set their tolerances.
- (i)
- Carrier-flow solution: The long-wave carrier flow described in Section 2.2 is resolved once for each peristaltic wave, as it remains constant in the wave frame. At every axial station Nz, the wall radius Rw(z) as defined in Equation (1) remains constant, and the velocity distribution is derived from the integrated momentum balance discussed in Section 2.2 across a radial grid including NR points. Due to the inability to invert the Carreau–Yasuda law for ∂w/∂r in a closed form, the apparent viscosity is determined via fixed-point iteration: initiating with μ = μ0, the shear rate is computed from the existing stress, μ is revised with relaxation factor 0.5, , untilwhich is reached in at most 110 iterations at every station; relaxing the tolerance to 10−4 changes no carrier-flow quantity by more than 0.003%.
The axial pressure gradient at each station is then found by a bracketed root solve (Brent’s method) enforcing the prescribed wave-frame flux q of Section 2.2, and q itself by an outer Brent [41] solve enforcing the free-pumping condition ∮(dp/dz)dz = 0 of Section 2.2. The resulting flux is conserved to |∆q|/q < 10−13, and the kinematic consistency of Equation (16) is recovered to the same order, confirming the carrier solution independently of the momentum balance.
- (ii)
- Shell-resolved radial dynamics: For every operational point, the Marmottant–Keller–Miksis equation from Equation (25) is solved from the quiescent initial condition of Section 2.5 using the implicit adaptive Radau method [42], which necessitates L-stability due to the stiffness introduced by the shell viscosity κs and the tension gradient approaching rupture. The relative tolerance corresponds to the sensitivity of the extracted quantity from the solution: 10−7 when a cycle-averaged group like is necessary, and tightened to 10−8 when the cumulative release fraction, which encompasses the radial history throughout the entire pulse, is desired. The increment is restricted to Tac/25 to Tac/40 within the identical range, while the absolute tolerance is maintained at 10−12 m consistently. The abrupt discontinuities in the tension law at Rbuck and Rrup are smoothed using a hyperbolic-tangent blend as described in Section 2.5, with a width of δs = 0.01 R0, therefore reinstating the Lipschitz continuity necessary for the adaptive controller while modifying the peak expansion by under 0.5%. The convergence of the integration in each resolution parameter is reported in Section 4.2. From the stable segment of each record, considered as the latter half to exclude the initial transient, the cycle-averaged radiation group , the maximum expansion ratio , and the rupture indicator are derived and transmitted to the translational and release solvers.
- (iii)
- Translational transport and release: Utilizing the cycle-averaged radiation group and the maximum radius obtained from step (ii) for every equilibrium radius and drive frequency, the Lagrangian force equilibrium described in Equation (17) is progressed over three peristaltic cycles on the peristaltic temporal scale. The radial state is only determined by these two cycle-reduced values, so the acoustic scale remains unaddressed in the translational integration; this exemplifies the scale separation introduced at the beginning of this section. The carrier velocity at the bubble’s center is derived from the wave-frame solution in step (i), whereas the secondary Bjerknes attraction from Equation (23), wall repulsion, and the forces due to pressure gradient and increased mass are compiled from the stationary radial condition. The Stokes drag near the wall incorporates the Brenner lubrication adjustment, with mobility diminished by the factor as the gap dw narrows [43]. The system employs a variable-order Adams/BDF method (LSODA) with a relative tolerance of 10−8 and an absolute tolerance of 10−12 m, automatically transitioning to its stiff branch when the bubble nears the wall, where the lubrication term intensifies the balance [44]. The wall arrival is recorded as a terminal root of the gap dw(t) = 0 instead of through time-step detection, allowing the arrival time to be determined irrespective of the output frequency. The constrained drug mass is not proposed as an independent rigid subproblem. Given that Equation (34) is linear in Md once the radial history is established, it can be integrated in a closed form along the radial solution via the analytic release relation outlined in Section 2.6, allowing the released fraction to be derived from a singular quadrature of throughout the resolved radial record. This eliminates the operator-splitting error that would arise from an explicit linkage of the release and radial subproblems, transforming the released fraction into a post-processing diagnostic of the radial solution instead of an extra integration.
4.1. Diagnostics and Integral Performance Metrics
The hydrodynamic response is characterized by the volumetric flow rate
the pressure difference along the wave, relative to a reference station z0,
whose maximum magnitude over one wavelength measures the local pressure variation, the net rise over a full wavelength vanishing by the free-pumping condition of Section 2.2.
The total wall shear stress in the presence of an acoustically driven coated microbubble is decomposed as
where is the peristaltic contribution given by Equation (48), and the bubble-induced wall shear stress is
with h the centroid–wall distance of Equation (23), fixed over the acoustic cycle, dw the clearance of Equation (21), and μCY the Carreau–Yasuda viscosity at . Bubble transport is quantified through the trajectory Xb(t), the minimum bubble–wall gap
and the near-wall residence time
where is the Heaviside function and is the sonoporation window of Sec. 5.9, within which . The oscillatory response is described by the maximum expansion ratio and the normalized oscillation amplitude . Drug release is quantified through the cumulative released fraction of Section 2.6, evaluated along the resolved radial history as described in step (iii) of the algorithm.
4.2. Convergence of the Partitioned Solver
Every resolution parameter was varied one at a time, the others being held at their production values, and the change in the quantities of interest was measured against the finest level (Table 2). The radial dynamics were tested at the peak-drift operating point, R0 = 3.5 and f = 1 MHz, where the radial displacement and the near-wall migration are largest. The carrier flow is insensitive to the radial grid and converged in the axial resolution and in the tolerance of the viscosity iteration. For the radial dynamics the number of acoustic cycles, which controls the residual transient, dominates the error, while four time schemes of different character agree to 6 × 10⁻⁵ % in amplitude and 3 × 10⁻⁷, rad in the phase of the fundamental, so that neither numerical damping nor phase drift affects the results. The phase average of the drift, whose dependence on the initial axial phase is discontinuous between phases that do and do not reach the wall, converges to 0.01% of a0 with sixteen phases. All changes at production settings are below 0.25%.
Table 2.
One-at-a-time convergence of the partitioned solver. Each parameter is varied with the others at production values; the last column gives the largest change in the listed quantities at the production level relative to the finest level.
5. Coupled Flow, Bubble, and Release Dynamics: Results and Physical Interpretation
5.1. Peristaltic Carrier Flow and Shear-Thinning Viscosity Redistribution
The microbubble’s carrier-flow field is derived by resolving the long-wave momentum equilibrium using the Carreau–Yasuda model, with the axial pressure gradient at each location established through wave-frame flux conservation, where the wave-frame flux q is constrained by the free-pumping condition ⟨Δp⟩T = 0. The solution maintains flux to machine precision (|Δq|/q < 10−13) and precisely adheres to no-slip and axial symmetry conditions.
Figure 2A illustrates the resultant axial velocity across a single wavelength. Transport in the forward direction is restricted to the dilated segment of the lumen, whereas the constricted segment experiences reflux with uz measuring −3.21 mm s−1; compared to a forward peak of 3.19 mm s−1. The two areas are divided by the uz = 0 boundary; reflux is an inherent characteristic of peristaltic pumping under finite occlusion and is observed here without external enforcement. The genesis of this structure is elucidated by Figure 2B. The observed viscosity ranges from 0.156 Pa·s at the axis, where the shear rate is less than the Carreau transition and μ nears its zero-shear limit, to 7.59 × 10⁻³ Pa·s at the wall, resulting in a disparity of 20.6 throughout the lumen radius. The area close to the wall functions as a low-viscosity lubricating layer, but the core maintains a predominantly hard, high-viscosity nature. This stratification alters the velocity profile in a way that no constant-viscosity model can replicate. Figure 2C illustrates that uz maintains 90% of its central value up to r/Rw ≈ 0.469 − 0.476, in contrast to 0.32 for the Newtonian parabola: the core exhibits a distinctly plug-like behavior, with the velocity gradient localized in the narrow near-wall region. Two outcomes ensue from the interconnected issue. Initially, a bubble located in the core undergoes an almost uniform axial velocity with minimal shear, resulting in its translational dynamics being dictated by the acoustic forces outlined in Section 2.4 instead of hydrodynamic straining. Secondly, the wall shear stress is predominantly determined by the low-viscosity annulus, which explains why the peristaltic wall shear stress remains below 0.1 Pa, far lower than the bubble-induced stresses that dictate permeabilization.
Figure 2.
Peristaltic carrier flow of Carreau–Yasuda blood at ϕ = 0.20 and c = 5 × 10⁻³ m s−1, shown over one wavelength at t = 0 as the full axisymmetric section. The wave-frame flux is fixed by the free-pumping condition ⟨∆p⟩ = 0, and the no-slip condition uz(Rw) of Section 2.3 is enforced exactly. (A) Axial velocity uz(r, z); dashed contours mark uz = 0, separating forward transport in the expanded lumen from reflux in the contracted lumen. (B) Local apparent viscosity μ
on a logarithmic scale, showing the low-viscosity near-wall annulus. (C) Radial velocity profiles at the expanded, mean and contracted stations (z/λ = 0.25, 0.50, 0.75), compared at equal volumetric flux with the Newtonian parabola at μ0.
5.2. Bubble Oscillation Regimes Under Acoustic Forcing
The peristaltic wave is only present in the bubble dynamics as the static gage pressure ph in the external pressure of Equation (27). Its influence is limited a priori by the order of magnitude estimate of Section 2.5: with ph of order 1 Pa against an acoustic amplitude PA = 1.2 × 10⁵ Pa, the ratio ph/PA~10−5 is insignificant for the peristaltic pressure to change the radial response. This is confirmed quantitatively in Figure 3, which also shows the sensitivity in the full range of vascular pressures. During the nine decades of ph variation, the relative amplitude suppression |∆AR|/AR is 6 × 10⁻⁶ at the peristaltic scale, rising only to 9.7% at mean arterial pressure (13.3 kPa) and to 20% at hypertensive levels (30 kPa). Thus, the acoustic drive alone determines the oscillation regime, the buckling and rupture crossings, and the peak expansion ratio; the peristaltic contribution to the radial dynamics is negligible at all physiologically accessible pressures. This is the central simplification used throughout the coupled problem: peristalsis does not modulate the shell oscillation to affect delivery, but moves the bubble through the carrier velocity field, as the trajectory analysis of Section 5.5 and Section 5.6 develops.
Figure 3.
Insensitivity of the shell-resolved radial dynamics to hydrodynamic gauge pressure (, PA = 1.2 × 10⁵ Pa, , f = 2 MHz, SonoVue shell). The gauge pressure ph enters Equation (27) as a static compressive bias. (A,B) R(t)/R0 over the first and full records at four values spanning the vascular range, from quiescent to hypertensive; dash-dotted and dashed lines mark Rbuck/R0. (C) Relative amplitude suppression |∆AR|/AR versus ph across nine decades.
The peristaltic pressure is shown to be dynamically inert and the oscillation regime is only determined by the acoustic amplitude. Figure 4 shows the three regimes produced by the area-based Marmottant law of Equation (30) as PA is increased at constant frequency. The radius is confined to the elastic branch between Rbuck and Rrup, with a maximal expansion of only and a minimal compression that is not buckling. The release in this region is diffusive and partial. The shell at the transient-cavitation amplitude is driven to a buckled state where σ eff = 0 at the compression phase below Rbuck, and the expansion exceeds Rrup at the beginning of the acoustic cycle at t = 0.34 . At maximum amplitude the bubble reaches and collapses even sooner, at t = 0.32 , the compression falling below a third of the equilibrium radius. This interrelated issue has two basic characteristics. When the rupture threshold is exceeded, the crossing of the rupture threshold takes place within one acoustic cycle, and it has little dependence on the amplitude. After that, the trup varies only 0.02 for the pressures between 120 and 300 kPa. Second, the release changes abruptly at this crossing, whereas the oscillation itself changes continuously; the abruptness resides in the release law, Equation (35), not in the dynamics. Thus, the distinction between the regimes is not whether the amplitude of the oscillation is large or small, but whether the trajectory crosses Rrup or not.
Figure 4.
Shell-resolved radial dynamics of a SonoVue microbubble in Carreau–Yasuda blood () over 25 acoustic cycles at three acoustic pressures spanning the three regimes of the area-based Marmottant law. Shading marks the elastic regime between R buck/R0 = 0.962 (dashed) and R rup/R0 = 1.092 (dash-dotted). Sub-threshold forcing (PA = 50 kPa, ) confines the oscillation within the elastic branch; transient cavitation (120 kPa, ) drives buckling on compression and reaches rupture at t = 0.34 ; shell rupture (300 kPa, ) attains . Triangle marks the first rupture; inset resolves the first three cycles.
The acoustic amplitude fixes the oscillation regime, whereas the shell determines the response’s magnitude at a specific amplitude. Five formulations, with the shell constants of Table 3, are compared at the transient-cavitation stage in Figure 5. With simply the clean-interface stress, the uncoated bubble grows the most freely, with . All four of the coated shells cross their corresponding rupture radii at this amplitude, demonstrating that transient cavitation is a rupturing regime over the therapeutically relevant spectrum of lipid compositions. The coated shells resist expansion to varying degrees. However, the ordering of the coated responses is not monotone in the elastic modulus χs: SonoVue, with an intermediate χs = 0.25, expands less than the stiffer BR14 because its rupture radius, Rrup/R0 = 1.092, is the largest in the group, so that it retains its elastic resistance over a wider part of the expansion; BR14, with Rrup/R0 = 1.035, loses it earlier and expands under the constant tension .
Table 3.
Shell mechanical parameters for the five microbubble formulations compared in Figure 5. Parameters for coated agents are fitted to experimental resonance-frequency and attenuation data. All equilibrium-radius values correspond to .
Figure 5.
Effect of shell composition on radial dynamics at the transient-cavitation operating point (PA = 1.2 × 10⁵ Pa, f = 2 MHz, R0 = 1.25 , = 1.18), Carreau–Yasuda blood. Five formulations solved with the area-based Marmottant–Keller–Miksis model. (A) R(t)/R0 over 25 cycles; inset resolves the first three. (B) Maximum expansion ratio (solid) and peak-to-peak amplitude (hatched); the red tick on each bar marks that shell’s own , and † denotes rupture.
Therefore, the elastic modulus, rupture tension, and dilatational viscosity jointly control the expansion at a fixed drive, with each formulation possessing a unique point in this three-parameter space rather than sitting on a single stiffness axis. This proves that the choice of contrast agent only affects the delivery outcome for the coupled problem through the amplitude of the near-wall bubble loading, not through the rupture switch itself, which each formulation activates at the transient-cavitation amplitude used throughout.
The non-monotonic arrangement depicted in Figure 5 is clarified by sequentially isolating each shell parameter. Figure 6 alters one of χs, σrup, κs individually in relation to the SonoVue baseline. When considered in isolation, the elastic modulus behaves as anticipated: the surplus expansion diminishes steadily with χs, indicating that a more rigid shell opposes expansion, as shown in panel (A). This monotonic behavior is obscured in Figure 5 by the rupture tension, which exerts an influence that is both contrary in direction and greater in intensity; panel (B) illustrates that increasing σrup postpones the rupture crossing and allows for a more significant excursion, resulting in a shell with elevated σrup expanding more than a more rigid shell with diminished σrup. The dilatational viscosity, as shown in panel (C), maintains the peak expansion nearly constant while attenuating the peak-to-peak amplitude, influencing the oscillation velocity instead of the maximum radius. The three factors regulate different characteristics of the response χs and σrup, vying to determine the peak expansion, with κs dictating the amplitude, which explains why the coating formulations in Figure 5 cannot be arranged along a singular axis. In the subsequent rupture-gated delivery, the operative implication is that σrup, rather than χs, serves as the primary shell factor in determining if and when the rupture radius is breached.
Figure 6.
Parametric sensitivity of the radial response to the three shell parameters at the transient-cavitation point (PA = 1.2 × 10⁵ Pa, f = 2 MHz, R0 = 1.25 , Πac = 1.18), each parameter varied with the other two held at the SonoVue baseline (χs = 0.25 N m−1, σrup = 0.072 N m−1, κs = 3.0 × 10⁻⁹ kg s−1). (A) Elastic modulus χs: the excess expansion falls monotonically, by 48% from χs = 0.05 to 0.60. (B) Rupture tension σrup: the opposing and stronger trend, falling from 1.44 to 1.18 as σrup rises, since a higher threshold lets the shell resist longer before rupture. (C) Dilatational viscosity κs: little effect on but marked damping of the peak-to-peak amplitude AR. (D) Elastic bands [Rbuck, Rrup] (shaded bars) for each parameter set, with the computed maximum expansion (circles) and minimum radius (ticks) indicating whether the periodic orbit breaches the rupture threshold.
The linear coated-shell resonance is observed at fshell = 4.39 MHz, which is almost double the free-bubble Minnaert value, indicating that the shell, rather than the gas, determines the restoring force. Figure 7 illustrates that this resonance is not static but rather diminishes with increasing amplitude: as PA escalates from 5 to 60 kPa, the intact-shell peak shifts lower from 4.06 to 3.58 MHz. The process involves the buckling nonlinearity described in Equation (30). As the excursion expands, the bubble occupies a larger portion of each cycle beneath Rbuck, where σeff = 0, resulting in the shell providing no contribution to the restoring force; hence, the cycle-averaged stiffness and resonance diminish as the drive intensifies. At 120 kPa, the response has surpassed Rrup, and the observed peak at 2.95 MHz is a signature of rupture rather than of a resonance. Throughout, the subharmonic content stays beneath 0.1% of the fundamental frequency, and the oscillation remains period-1, with no period-doubling cascade; the rupture crossing examined next is therefore a threshold on the amplitude of a single periodic orbit, not a change in its structure.
Figure 7.
Frequency response of a SonoVue microbubble in Carreau–Yasuda blood (R0 = 1.25 ). (A) Steady-state peak-to-peak amplitude AR versus drive frequency at four acoustic pressures, evaluated over the second half of each record. Solid segments denote an intact shell, dashed segments . Vertical lines mark the free-bubble Minnaert value of Equation (29), 2.23 MHz, and the coated-shell resonance fshell = 4.39 MHz. The intact-shell peak softens from 4.06 to 3.58 MHz between 5 and 60 kPa; the 120 kPa maximum at 2.95 MHz lies beyond rupture and is not a shell resonance. (B) Radius–time traces below, at and above resonance at PA = 120 kPa over a fixed window; dashed line, Rrup/R0. Subharmonic content stays below 0.1% of the fundamental, so the response is period-1 throughout.
5.3. Shell-Rupture Boundary in the (f, PA) Plane
The current model employs a gated release mechanism instead of a graded one. The coefficient in Equation (35) incorporates the Heaviside term krup , resulting in a two-order-of-magnitude increase in the instantaneous release rate upon surpassing Rrup during a single half-cycle, whereas the displacement- and velocity-weighted components contribute at most a factor of approximately one. Consequently, delivery is dictated not by the amplitude of oscillation but by the location of the operating point relative to the rupture locus , at which the periodic orbit first reaches the rupture radius. This locus is a threshold-crossing transition rather than a dynamical bifurcation: the regularized dynamics are smooth and remain period-1 across it, and the abrupt change resides in the release law, Equation (35). Figure 8A illustrates this region at R0 = 1.25 , with each trial commencing from a stationary state and designated as the overall maximum throughout eight acoustic cycles, as a single excursion beyond Rrup is adequate to disturb the monolayer. Figure 8B presents the threshold , the minimal amplitude that meets at a specified frequency, determined using bisection based on the identical criterion.
Figure 8.
Shell-rupture boundary of a SonoVue-shelled microbubble in Carreau–Yasuda blood. (A) Expansion ratio over the (f, PA) plane at R0 = 1.25 ; the heavy contour is the rupture locus . (B) Rupture threshold for three equilibrium radii; triangles mark the minima.
The threshold curves exhibit non-monotonic behavior. Beneath the optimal threshold, the motion is quasi-static in relation to the shell-modified eigenfrequency of Equation (32): the displacement is determined only by amplitude, with no potential for resonant enhancement. The liquid inertia of the Keller–Miksis operator limits the expansion possible throughout each half-period, resulting in a threshold increase by a factor of 5.6 from 3.37 to 8.00 MHz at R0 = 1.25 . Triangles denote each minimum: 131.5 kPa at 5.20 MHz (R0 = 0.75 ), 60.6 kPa at 3.37 MHz (1.25 ), and 23.4 kPa at 1.42 MHz (2.50 ). The optimal frequencies satisfy fopt R0 = 3.9 ± 0.3 MHz , with the associated thresholds , and are consistently positioned beneath the coated-bubble resonance at fopt/fshell = 0.78 ± 0.08 for the standard radius. These relations are empirical: they hold for the SonoVue shell constants of Table 3 over R0 = 0.75−2.5 and threshold pressures of 23–132 kPa. Since itself varies from 6.7 to 4.4 MHz·μm over this range, the near-constancy of reflects a compensation between shell stiffness and amplitude softening (fopt/fshell = 0.58 − 0.82), and is not expected to transfer to other coatings or environments without recomputation.
This reduction is the amplitude softening observed independently in Figure 7, where the intact-shell peak shifts from 4.06 to 3.58 MHz between 5 and 60 kPa: as the excursion increases, the bubble remains a greater proportion of each cycle below Rbuck, where σeff = 0 and the shell provides no contribution to the restoring force, thus the cycle-averaged stiffness and consequently the optimum decline with amplitude. The fact that a frequency sweep at constant pressure and a threshold bisection at a set criterion yield the same softening serves as an internal consistency verification for the shell treatment. The frequency grid operates on a logarithmic scale with a ratio of 1.24 between neighboring points, therefore fopt is determined within ±12%, and the stability of foptR0 is confirmed at, rather than exceeding, that resolution.
It is the global peak over eight cycles against Rrup/R0 = 1.092 that is relevant here, not the steady-state peak (Section 5.2), because the baseline of Table 1 is inside the rupture domain. At f = 2 MHz, the threshold is 79 kPa, which PA = 1.2 × 10⁵ Pa surpasses by 52%. For the same therapeutic switch, formulation, and payload, the corresponding lever is shown in Figure 8B: driving the same agent at 3.37 MHz achieves rupture at 60.6 kPa, a 23% drop in pressure, and a 41% reduction in sound intensity. The reaction stays period-1 throughout, with subharmonic content below 0.1% of the fundamental (Figure 7). With (PA in MPa, f in MHz), the minimum rupture thresholds lie below MI = 0.06: MI = 0.058, 0.033 and 0.020 at the three minima of Figure 8B, and MI = 0.056 at the 2 MHz threshold of 79 kPa; away from the minima the thresholds rise, to MI ≈ 0.12 at 8 MHz. The baseline drive, lying 52% above that threshold, corresponds to MI = 0.085. Both remain far below the diagnostic limit of 1.9. Over the amplitudes considered the response thus remains period-1, and the rupture locus is the only transition relevant to delivery.
5.4. Oscillation-Regulated Drug Release
The rupture boundary of Section 5.3 is transformed into a switch for the delivered payload by the gated structure of the release law, Equation (35). This is quantified across all three regimes in Figure 9. Under sub-threshold forcing, the radius is never raised to Rrup; instead, the release is gradual and partial, reaching over the pulse at the uncalibrated rate k0. This is because the release only occurs through the smooth displacement- and velocity-weighted term of Equation (35). Once the drive exceeds the rupture boundary, the Heaviside contribution raises the instantaneous release rate by two orders of magnitude. At 120 kPa the first excursion beyond Rrup lasts 0.37 Tac, and the released fraction rises from 4.5% at the first crossing to 88%, 98.5% and 99.8% after one, two and three acoustic cycles, against about 9% for an intact shell over one cycle; at 300 kPa, with 67% of each cycle spent beyond Rrup, 98% is released within one cycle. In terms of the final delivered fraction, the transient-cavitation and rupture regimes are identical; the only difference is the peak expansion that occurs with release. Both regimes are complete.
Figure 9.
Oscillation-regulated drug release (R0 = 1.25 , f = 2 MHz, 25-cycle pulse of 12.5 , constants of Table 1). (A) Cumulative released fraction , Equation (37), integrated along the resolved radial history, across the three regimes: sub-threshold forcing gives slow, incomplete release ( over the pulse); transient cavitation and shell rupture both drive , 88% of the payload being released within one acoustic cycle of the first rupture at 120 kPa. (B) Mean (solid) and peak (hatched) of over the second half of the pulse for each regime; the ruptured shell reaches (dashed), the excess being the smooth displacement- and velocity-weighted contribution of Equation (35).
Two characteristics of this behavior are crucial to the interconnected issue. Initially, the delivery is governed by the rupture crossing rather than the oscillation amplitude exceeding it: the cycle-averaged release coefficient rises from 100 k0 in the sub-threshold regime to 37.9 k0 and 68.5 k0 once Rrup is attained (Figure 9B), indicating that the delivered fraction behaves as a step function of the operational point concerning the rupture locus instead of a continuous function of PA. This is the release-side expression of the threshold-crossing transition of Section 5.3. Secondly, the thoroughness of release is determined solely by the crossing and is not contingent upon the exact value of krup, while the duration for the completion of release is dictated by krup: the parameter krup = 100 k0 compresses 88% of the release into one acoustic cycle. Collectively, these findings indicate that when the frequency–size alignment discussed in Section 5.3 positions the operating point beyond the rupture threshold, the payload is transmitted nearly in its entirety and almost instantaneously; thus, the primary factor influencing therapeutic efficacy is spatial, specifically whether the ruptured bubble is sufficiently proximal to the endothelium to allow its near-wall loading to induce permeabilization, a topic explored in Section 5.5, Section 5.6, Section 5.7, Section 5.8 and Section 5.9.
5.5. Frequency–Size Matching Governs Near-Wall Migration
The movement of a coated bubble toward the endothelium is driven by the secondary Bjerknes attraction of Equation (23), the only radial force of significant magnitude under axial insonation: at R0 = 3.5 μm and dw = 0.6 a0 it exceeds the pressure-gradient and added-mass forces by factors of 2 × 10⁵ and 3 × 10⁵ and the wall repulsion by fourteen orders of magnitude, a force-level confirmation of the estimate ph/pA~10−5 of Section 2.5. Figure 10 integrates Equation (17) in the continuity-consistent carrier field of Section 2.2, with the bubble advected axially by uz, the drift [rb(tend) − rb(0)]/a0 averaged over sixteen initial axial phases, and contact registered at dw = 0. A passive tracer (E = 0) in the same field is displaced by 11.6% of a0 over 3Tp, a kinematic offset along its streamline that involves no migration; subtracting it isolates the Bjerknes-induced drift Δ.
Figure 10.
Frequency–size matching governs near-wall migration of coated microbubbles in the continuity-consistent peristaltic carrier field (ϕ = 0.20, PA = 1.2 × 10⁵ Pa). (A) Radial trajectories rb(t)/a0 over three peristaltic periods at f = 1 MHz for five equilibrium radii, initial axial phase z0 = 0; the wall is that seen by the R0 = 3.5 bubble, and circles mark contact. (B) Net radial drift over 3Tp, averaged over sixteen initial axial phases, versus R0 at f = 1, 2, 3 MHz; dashed, passive tracer. (C) Bjerknes-induced drift Δ, the drift minus that of the tracer, versus fshell (R0)/f. (D) Δ over the (R0, f) plane with the resonance locus fshell (R0) = f.
At f = 1 MHz, Δ is resonance-selective (Figure 10B,C). It peaks at 28.4% of a0 for R0 = 3.5 , fshell/f = 1.13, with a nearly equal value at R0 = 3.0 , the broad maximum lying above unity because of the amplitude softening of Section 5.2; seven of the sixteen initial phases bring the bubble into contact with the oscillating wall, at t/Tp = 1.69 on average. Bubbles with fshell/f ≥ 1.7 barely migrate (Δ≤1.8%), whereas those with fshell/f ≤ 0.73 retain 9 − 13%. The magnitude also falls steeply with frequency: at 2 and 3 MHz, Δ remains below 1.9% and 0.9% over R0 = 1.5–8 μm, including the resonant radius, because the radiation group of a resonant bubble decreases rapidly with its radius. Frequency–size matching thus selects which bubble migrates at a given drive, and a low drive frequency, with its larger resonant radius, sets how far it migrates (Figure 10D). The clinically used SonoVue radius, with fshell/f ≥ 1.46 at these frequencies, is not targeted to the wall by this mechanism. The prediction is insensitive to the near-wall regularization: changing Aw by factors of 0.1 and 10 and by factors of 0.5 and 2 alters the drift at R0 = 3.5 μm by at most 0.15% of a0, since at contact FBj2 = 2.2 × 10⁻⁶ N exceeds Aw by a factor of 220. Wall compliance, which weakens the rigid-wall image of Equation (23), is represented by an image-strength factor εw ≤ 1 multiplying FBj2. Δ decreases monotonically with it, nearly in proportion (16.8% and 7.8% at εw = 0.5 and 0.25), while the ordering of radii is preserved: compliance sets the magnitude of the migration but not its frequency–size selectivity. For a sufficiently soft wall the image may change sign, and the prediction then no longer applies. The drift velocity varies inversely with the viscosity of the translational drag, evaluated here with the continuum value μ0; a bubble smaller than a red cell may experience a lower effective viscosity, so the drift magnitudes are conservative, whereas the selectivity of the migration rate, set by , is independent of it: at 1 MHz the rate at R0 = 3.5 exceeds that at 2.0 by a factor of 66.
5.6. Peristaltic Rectification of the Secondary Bjerknes Attraction
The movement of Section 5.5 is influenced by the secondary Bjerknes attraction, characterized by its convex h−2 relationship with the distance between the bubble and the wall. During peristalsis, the wall fluctuates, causing the centroid–wall distance to vary about its average, and the curvature of FBj2 guarantees that the average force surpasses the force calculated at the average gap. Peristalsis thus corrects the attraction: even if the average bubble location remains constant, wall movement amplifies the time-averaged force exerted toward the wall. Figure 11 measures this increase. The cycle average possesses a closed-form expression,
applicable for ϕ/A < 1. Panel (A) verifies that this equation accurately reflects the gain derived from the complete time-dependent force integral to machine precision throughout a ϕ-sweep and a rb-sweep. The critical examination involves the third data set, where ϕ is altered threefold while maintaining a constant ϕ/A: The gain remains constant at G = 1.194, indicating that G is determined only by the geometric ratio ϕ/A rather than by ϕ and rb independently. Two outcomes ensue. Initially, G represents a purely geometric gain: as a ratio of identical forces at two gap values, it remains unaffected by the prefactor of Equation (23), the equilibrium radius, and the acoustic pressure. The prefactor and stand-off adjustments that modify the absolute Bjerknes force consequently do not alter G, rendering the rectification outcome resilient to these changes. Secondly, the gain becomes unbounded as the operating point nears the contact locus rb/a0 = 1 − ϕ, seen in panel (B), where the trough of the peristaltic wave coincides with the bubble, ensuring capture within a single cycle. At the fundamental operational condition of Table 1, ϕ/A = 0.333 and G = 1.19: peristalsis increases the wall-directed attraction by 19% compared to its non-peristaltic counterpart, a magnification regulated independently of the acoustic pressure via the amplitude ratio ϕ. At spontaneous vasomotor amplitudes, ϕ ≤ 0.13, the gain falls to G ≤ 1.08; since G depends only on the local gap oscillation, it is independent of the direction of wave propagation. The peristaltic amplitude ratio consequently becomes a control parameter in the delivery issue, complementing the acoustic drive: the frequency–size alignment from Section 5.5 determines if migration takes place, while ϕ adjusts its velocity.
Figure 11.
Peristaltic rectification of the secondary Bjerknes attraction. The oscillating wall modulates the centroid–wall distance ℎ, so the cycle-averaged FBj2∝h−2 exceeds its value at the mean distance by the rectification gain , with A = 1 − rb/a0 the mean normalized centroid–wall distance. (A) G from the full time-dependent force integral against this closed form: a ϕ-sweep at fixed rb (circles), an rb -sweep at fixed ϕ (squares), and a degeneracy-breaking test varying ϕ threefold at fixed ϕ/A (triangles), all collapsing onto the closed form. (B) G over the (rb/a0, ϕ) plane; the contact locus rb/a0 = 1 − ϕ (red) bounds the domain of certain capture, and the star marks the Table 1 operating point, G = 1.19.
5.7. Peristaltic Pumping and the Nonlinear Role of the Amplitude Ratio
The peristaltic movement of the wall governs the volumetric flow within the vessel, irrespective of the drug and bubble subproblems. Figure 12 delineates this pumping. Panel (A) illustrates the flow rate at a stationary point during two peristaltic cycles: as the amplitude ratio ϕ escalates, the pulses get more defined and larger, while the quiescent fraction of the cycle falls from 46% at ϕ = 0.10 to 38% at ϕ = 0.30. The maximum flow rate increases with ϕ as , as shown in panel (B).
Figure 12.
Peristaltic pumping and the kinematic character of the flow rate. (A) Normalized flow rate at over two peristaltic periods for ϕ = 0, 0.10, 0.20, 0.30; larger ϕ produces sharper, higher pulses, the quiescent fraction of the cycle falling from 46% to 38%. (B) against ϕ on logarithmic axes for the Carreau–Yasuda carrier and the Newtonian reference at μ0 under identical wall motion. The two differ by less than 3% and rise 3.9-fold from ϕ = 0.10 to 0.30: the instantaneous flux is set by the wall kinematics, the rheology entering only through the wave-frame flux q.
The structure of this pumping follows from continuity. In the wave frame the flux q is uniform, so that the laboratory flux is exactly , and the rheology enters only through q, fixed by the free-pumping condition. For a Newtonian fluid is independent of viscosity [23], a closed form the solver reproduces to within 10−5; shear-thinning changes q by only 1.8% at ϕ = 0.20. The instantaneous flux, dominated by the kinematic term, is therefore nearly rheology-independent: the Carreau–Yasuda and Newtonian values of differ by less than 3%. The time-mean throughput , in contrast, is a small difference of two large terms and is reduced by shear-thinning by 8 − 14% over ϕ = 0.05 − 0.30. This near-independence is specific to free pumping: under an imposed pressure rise, q depends directly on the constitutive law. Free pumping thus separates flux from pressure for any constitutive law; relative to the zero-shear Newtonian reference, shear-thinning lowers the pressure variation 13-fold but the net throughput by only about 10%, which is the sense in which ϕ acts as a transport control parameter at reduced mechanical load.
5.8. Peristaltic Pressure Rise and the Shear-Thinning Suppression Law
The pressure variation Δp(z) of Equation (47) along one wavelength is shown in Figure 13A for three amplitude ratios at the standard wave velocity. Two characteristics differentiate the shear-thinning behavior from the harmonic waveform generated by a constant-viscosity carrier. First, the maximum magnitude grows sublinearly with ϕ, in contrast to the nearly kinematic instantaneous flux of Figure 12. Hence, peristalsis facilitates improved convective transport at a correspondingly diminished pressure expense. Secondly, at ϕ = 0.30, both peaks of the waveform depicted in Figure 13A exhibit significant flattening. This saturation arises from the radial layering of the perceived viscosity under peristaltic influence. During maximum driving conditions, the near-wall viscosity decreases to 7.2 × 10⁻³ Pa·s, whilst the core maintains a viscosity of 0.12 Pa·s, resulting in a disparity of 16.6, thereby creating a low-viscosity annular layer next to the moving wall. This stratum allows for increased wall movement with minimal extra pressure expenditure, and Δp levels out when the near-wall shear rate surpasses the Carreau transition, . The absence of such flattening in the Newtonian framework substantiates that the distortion originates from rheological factors rather than only from the finite wall amplitude. The generality of this suppression is established in Figure 13B, which reports the ratio against the Carreau number Cuw = λccϕ/a0. Data obtained from an amplitude sweep at fixed wave speed (circles) and from a wave-speed sweep at fixed amplitude (squares) collapse onto a single master curve spanning nearly four decades in Cu. That Cu constitutes the sole controlling group rather than ϕ and c acting as independent parameters is verified by a degeneracy-breaking test (triangles): at fixed Cu, a six-fold variation of ϕ over the range 0.05 ≤ ϕ ≤ 0.30 alters S by at most 2.2%. Amplitude ratio and wave speed thus influence the pressure rise exclusively through the characteristic wall shear rate ~cϕ/a0 that they jointly set.
Figure 13.
Peristaltic pressure rise and the shear-thinning suppression law. (A) Normalized pressure variation of Equation (47) along one wavelength for ϕ = 0.10, 0.20, 0.30 at c = 5 × 10⁻³ m s−1; the waveform flattens at its extrema as ϕ increases, a distortion absent from the Newtonian reference. (B) Suppression ratio against the wall-shear Carreau number Cuw = λccϕ/a0: a ϕ -sweep at fixed c (circles), a c -sweep at fixed ϕ (squares), and a degeneracy-breaking test at fixed Cuw with ϕ varied sixfold (triangles). The data collapse onto a single master curve, for Cuw ≥ 1, and recovers the Newtonian plateau S → 1 as Cuw → 0.
Two asymptotic states are delineated in Figure 13B. For Cu≪1, the wall shear rate is beneath the Carreau transition, the apparent viscosity is constrained at its zero-shear value μ0, and the suppression ratio nears unity: the calculation yields S = 0.91 at Cuw = 4.1 × 10⁻³, asymptotically approaching the zero-shear Newtonian plateau. As this limit arises from the solution itself rather than being a predetermined restriction, it provides an autonomous verification of the formulation. For Cuw≳1, the response adheres to the empirical power law S ≈ 0.21 Cu−0.48, exhibiting a coefficient of determination R2 = 0.9994 and achieving a maximum suppression of 24-fold at the highest Carreau number investigated. It is important to highlight that the simplistic approximation , derived just by assessing the apparent viscosity at the wall shear rate, fails to replicate the observed exponent. The inconsistency illustrates the radial fluctuation of throughout the lumen, diminishing at the axis and peaking at the wall, indicating that the effective viscosity influencing Δp is an integral quantity rather than a pointwise one. Consequently, the exponent presented herein is quantitatively established and pertains specifically to the Carreau–Yasuda parameters shown in Table 1.
Figure 13A,B together shows that transport and its pressure cost respond very differently to shear-thinning: relative to the zero-shear Newtonian reference, it reduces the pressure variation 13-fold at baseline but the net throughput by only 10%. Increasing ϕ increases the instantaneous flux kinematically, the rheology entering only through q, at a sublinear cost in Δp (Figure 13A); the extent of this favorable trade-off is dictated by a single dimensionless parameter (Figure 13B). This distinction has a real physical meaning in the related problem of controlling microbubble transport using ϕ as the control variable: the vessel’s peristaltic motion can be used without the mechanical load of a Newtonian fluid at the zero-shear viscosity.
5.9. Bubble-Induced Wall Loading and the Sonoporation Window
The wall shear stress generated by an oscillating encapsulated microbubble is evaluated from the incompressible radial velocity field of a pulsating sphere, ur(r) = R2R/r2, with r measured from the bubble center. Since the center is fixed on the acoustic time scale, the wall lies at the constant distance , which yields Equation (50); its peak over the stationary cycle is reported, and dw → 0 denotes contact of the fully expanded bubble, as in Section 5. R(t) and are obtained directly from the Marmottant–Keller–Miksis dynamics of Section 2, with the area-based shell tension of Equation (30), so that no empirical closure enters the stress evaluation. Equation (50) is an order-of-magnitude estimate of the wall loading: it does not resolve the confined flow between bubble and wall, interfacial deformation or asymmetric streaming, and it uses the radial strain rate of the source flow as the scale of the wall shear rate. An independent estimate of the tangential shear, , built from the peak wall-parallel slip velocity of the source and its image and the Stokes-layer thickness , shears the same flux over δac rather than h; it therefore exceeds Equation (50) by the factor 0.54h/δac, between 1 and 5 over the sonoporation-active clearances, so that Equation (50) is the more conservative of the two.
The peristaltic reference level is computed from the exact pressure-gradient solution underlying Figure 12 through the force-balance identity , giving Pa at the baseline operating point a value that already incorporates the thirteen-fold shear-thinning suppression established in Section 5.8. Figure 14A reveals a separation of scales that governs the entire delivery mechanism. At contact-scale stand-off (dw ≈ 1.2 R0) the bubble imposes peak stresses of 0.42 kPa at PA = 0.5 × 10⁵ Pa and 6.4 kPa at PA = 3.0 × 10⁵ Pa, 3.7 to 4.9 decades above the peristaltic level. The h−3decay, however, confines this amplification to the vicinity of the endothelium: the stress falls below τ* within 0.6 − 3.9 R0 of the wall and to the peristaltic level at 48 − 167 R0, that is, within 0.21 a0. The bubble is therefore not a distributed source of wall loading but a strictly localized one, and its therapeutic relevance is contingent on proximity rather than on acoustic amplitude alone. This contingency is measured in relation to the experimentally determined permeabilization standard. Helfield et al. [49] determined a shear-stress threshold induced by oscillation, approximately in the kilopascal range, above which the permeability of the endothelial membrane escalates; utilizing τ* ≈ 1 kPa. Figure 14A shows that the sub-threshold drive PA = 0.5 × 10⁵ Pa attains τ* only in near-contact dw≲0.63 R0, whereas the condition is satisfied for at 1.2 × 10⁵ Pa and dw≲3.87 R0 at 3.0 × 10⁵ Pa. Even at the maximum pressure evaluated, the sonoporation-active clearance remains below four bubble radii, about 4.8 . Figure 14B delineates the relevant area within the (dw, PA) plane, where the τ* contour segregates the parameter space into domains of sonoporation activity and inactivity. Along the τ*contour, a sixfold increase in PA, from 0.5 to 3.0 × 10⁵ Pa, extends the active clearance by only 3.2R0 (4 ), so that stand-off distance, not driving amplitude, controls sonoporation.
Figure 14.
Order-of-magnitude estimate of the bubble-induced wall shear stress , Equation (50), for a coated microbubble of equilibrium radius R0 = 1.25 at f = 2 MHz. (A) Peak of Equation (50) versus the clearance dw/R0 for three acoustic pressure amplitudes. Dashed line: sonoporation threshold τ* ≈ 1 kPa. Dotted line: peristaltic wall shear stress Pa (ϕ = 0.20, c = 5 × 10⁻³ m s−1). (B) Peak in the (dw, PA) plane; the contour marks τ* and separates sonoporation-active from inactive conditions.
5.10. Verification and Validation
The comparisons of this section serve distinct purposes: Figure 15 verifies the radial core against an established theoretical model, Figure 16 is a model-to-model comparison quantifying the sensitivity to the rheological closure, and Figure 17 validates the radial core, in isolation and in water, against experiment. The carrier-flow solver is verified separately: it reproduces the Newtonian free-pumping flux in closed form to within 10−5 (Section 5.7), satisfies the kinematic wall condition to 8 × 10⁻⁵, and recovers the Newtonian limit S → 1 as Cuw → 0. No experiment yet validates the coupled framework as a whole. The radial core is first verified against the coated-bubble model of Marmottant et al. [5] with their published parameters: , χs = 1 N m−1, κs = 15 × 10−9 kg s−1, f = 2.9 MHz, PA = 130 kPa. At this operating point the present solver gives a steady-state radius range of 0.845–1.008 μm against the reported 0.85–1.00 μm, resulting in discrepancies of 0.58% and 0.82% at the compression and expansion limits respectively, as illustrated in Figure 15A. The excursion ratio is ΔR+/ΔR−=0.255 compared to the reference value of 0.264, a 3.4% departure that reproduces the compression-only asymmetry, which is the primary nonlinear forecast of the reference model. This operating point is a sensitive test of the radial core. The Keller–Miksis inversion may include the liquid density ρ f or exclude it, while the Marmottant tension can fluctuate with shell area or increase linearly with radius; of the four resultant cores, solely the density-consistent, area-dependent law replicates the reference asymmetry. The three options produce excursion ratios of 0.330, 0.194, and 0.377, reflecting departures of 25%, 26%, and 43% from the reference, whilst the selected core achieves a return of 0.255, within 3.4%. Figure 15A thus verifies the implementation and discriminates the density-consistent, area-based core from three adjacent formulations. Figure 15B broadens the comparison to encompass the entire spectrum of shell states. The transition of R0/Rbuck from 0.70 to 1.30 encompasses the buckled (σeff = 0), compression-only, and elastic phases; the model accurately reflects all three, featuring a buckled-regime plateau at 1.27, a pronounced minimum of 0.255 at R0/Rbuck = 1, and a return to the elastic plateau. The sudden shift at R0/Rbuck = 1, indicative of the piecewise tension law in Equation (30), is accurately represented both qualitatively and statistically, validating that the shell methodology utilized is consistent with the recognized formulation.
Figure 15.
Verification of the coated-shell formulation against Marmottant et al. [5]. (A) Radius response at the reference operating point (, χs = 1 N/m, κs = 15 × 10−9 kg s−1, f = 2.9 MHz, pa = 130 kPa, water); the shaded band is the excursion range reported in their Figure 5B, and the present model returns (ΔR+/ΔR−=0.255 against the reference 0.264). (B) Excursion ratio ΔR+/ΔR− versus R0/Rbuck across the buckled, compression-only and elastic regimes; the minimum of 0.255 at R0/Rbuck = 1 (marker) is the compression-only asymmetry of the reference model.
The effect of the rheological closure is investigated by calculating the identical long-wave momentum balance for four viscosity laws at a common volumetric flow. This model-to-model comparison follows the established practice of Johnston et al. [50], who showed that the predicted flow field in coronary arteries depends materially on the non-Newtonian description adopted; the power-law and Ellis formulations are taken in the analytical form of Myers [51], and the pairing of Ellis with a Carreau-type law reflects the closures used by Fanelli et al. [17] for non-Newtonian drug transport. Applying a common flux, instead of a common pressure gradient, separates the constitutive effect from any difference in operating point, and is the physically correct restriction for a peristaltic channel in which the flux is determined by the wall motion (Section 5.7). The power-law and Ellis constants are determined by matching the Carreau–Yasuda apparent viscosity at the characteristic wall shear rate; hence the comparison is between constitutive forms and not arbitrary parameter sets. All three shear-thinning closures flatten the velocity profile relative to the Newtonian parabola as shown in Figure 16A, but to very different degrees. The centreline velocity is reduced to 0.675 and 0.677 of the Newtonian value for the power-law and Ellis models, respectively, while the Carreau–Yasuda closure retains 0.928. The near-coincidence of the power-law and Ellis’s predictions is not coincidental. Figure 16B shows its origin: neither law has a zero-shear plateau; thus, their apparent viscosities diverge as near the vessel axis, and both profiles are driven by the same unbounded low-shear asymptotes. The Carreau–Yasuda law saturates only at μ0 on the axis and μ∞ at the wall, leading to a limited viscosity stratification of 36.7-fold across the lumen, from 0.160 Pa s on the axis to 4.4 × 10⁻³ Pa s at the wall. Here, the physically admissible description at the millimeter scale is this bounded response, not the divergent one of the two-parameter models, since blood shows exactly such a bounded plateau at low shear. Figure 16C quantifies the practical result. The Carreau–Yasuda closure needs a pressure gradient of 2.9% of the Newtonian value to sustain the common flux, whereas the power-law and Ellis models need only 0.57% and 0.59%, respectively. Thus, the two-parameter laws overstate the pressure economy of shear-thinning by a factor of about five, which would directly propagate to the peristaltic pumping of Section 5.8 and, through the hydrodynamic pressure in Equation (27), to the projected oscillation regime. The Carreau–Yasuda closure employed throughout is therefore not an accidental refinement but a necessary condition for quantitative integrity in the coupled problem.
Figure 17 compares the radial core with the jetting-onset thresholds measured by Cattaneo et al. [10] at 1 MHz. Following their observation that cyclic microjetting sets in once the radial expansion exceeds ≈1 , the threshold is the pressure at which , computed from Equations (25)–(30) in water at the experimental conditions (ρ = 1000 kg m−3, μ = 1 mPa s, c = 1481 m s−1, C4F10 core, Rbuck = R0). The shell constants of that cohort are unknown: the central curve uses χs = 0.55 N m−1 and κs = 1 × 10⁻⁸ kg s−1, and the band spans χs = 0.25 − 1.0 N m−1 and κs = 0.3 − 1.5 × 10⁻⁸ kg s−1, the SonoVue (Table 3) and Marmottant (Figure 15) values. Without fitting, the central curve reproduces the decrease from ≈200 kPa at R0 = 1.5 to a minimum of 36.8 kPa at R0 = 3.61 , against ≈50 kPa at the annotated resonant radius of 3.5 . Its mean absolute deviation from the data is 11.3 kPa (11.8% of the mean measured pressure) and its RMS deviation 14.3 kPa, against a replicate scatter of 6–7 kPa and a digitization uncertainty of 2 − 3 kPa. The band contains 11 of the 19 measured points, and its limits at the minimum, 19 and 51 kPa, are set by κs rather than χs. The measured thresholds lie above the band at R0 = 2.35 − 2.5 and above resonance, where the largest deviation, 33 kPa, occurs at R0 = 3.95 . Figure 17B shows that the criterion is met by a single dominant expansion rather than by cumulative growth. The comparison thus validates the pressure scale and the resonant structure of the threshold. It does not validate the jetting mechanism, which Ref. [10] attributes to a shape instability that the spherical model replaces by its radial surrogate, nor the coupled framework, whose carrier flow and bubble migration it does not test.
Figure 16.
Comparison of constitutive closures for the carrier flow at a common volumetric flux Q = 6.63 × 10⁻⁸ m3 s−1 in a vessel of mean radius a0 = 1 mm. (A) Axial velocity profiles normalized by the Newtonian maximum. (B) Local apparent viscosity across the lumen; dotted lines mark the Carreau–Yasuda limits μ0 and μ∞. (C) Pressure gradient required to sustain the common flux, normalized by the Newtonian value. Four viscosity laws are compared Newtonian, power-law and Ellis [51], and Carreau–Yasuda following the model-comparison approach of Johnston et al. [50] and the non-Newtonian drug-delivery formulation of Fanelli et al. [17]. All profiles derive from the same long-wave momentum balance with the rheological parameters of Table 1; only the viscosity law differs.
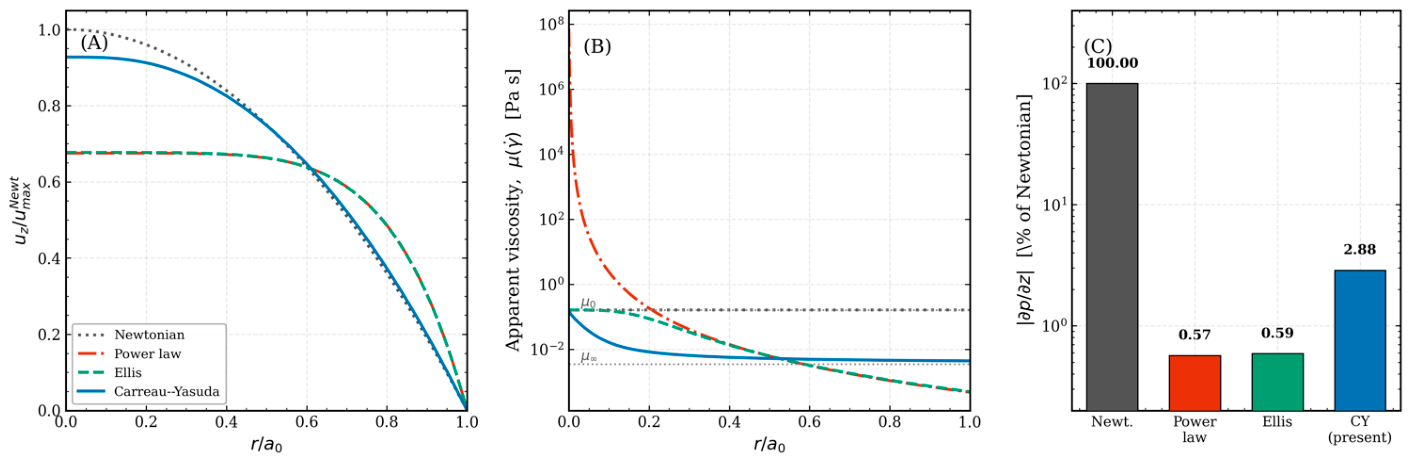
Figure 17.
Validation of the radial core against the jetting-onset thresholds of Cattaneo et al. [10]. (A) Acoustic pressure at which the radial expansion reaches , computed from Equations (25)–(30) in water at f = 1 MHz (line; band, coating range χs = 0.25 − 1.0 N m−1, κs = 0.3 − 1.5 × 10⁻⁸ kg s−1), compared with the pressures at which the first microjet was observed (symbols, digitized from Figure 4c of Ref. [10]). (B) Radial expansion R(t) − R0 at threshold for three equilibrium radii; the dashed line is the jetting criterion.
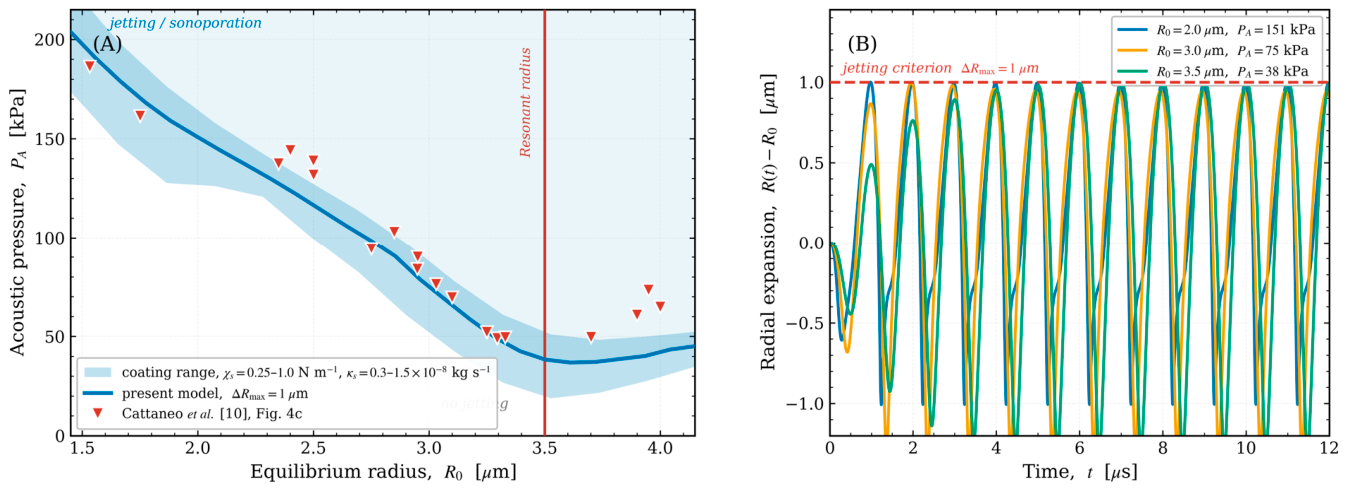
6. Limitations and Outlook
The present model addresses the interaction between peristaltic non-Newtonian flow and coated microbubble behavior. However, some assumptions warrant consideration as directions for future research. First, we assume the bubble is spherical, but oscillations close to the wall can still excite non-spherical shape modes and periodic microjetting. Our model predicts the wall-loading threshold for sonoporation by radial excursion, similar to the experimental criterion, but a full boundary-element or interface-tracking method incorporating shape modes is required to explicitly represent the jetting mechanics. Secondly, the model assumes a sparse suspension and unidirectional interaction between the bubble and the carrier flow; in denser clusters, secondary Bjerknes forces between adjacent bubbles and bidirectional changes in the carrier field could alter trajectories before reaching endothelium. Third, we model the vessel wall as a fixed boundary that executes a prescribed peristaltic motion, neglecting fluid–structure interaction and the elasticity of the vascular wall under acoustic influence; in particular, the rigid-wall image bounds the secondary Bjerknes attraction from above, and a sufficiently compliant wall may weaken or reverse it. Fourth, the present analysis tracks the payload to its release; the subsequent near-wall transport, diffusion, and transendothelial uptake would require a mass-conserving moving-boundary transport framework that we leave for future study. Fifth, the insonation is taken along the vessel axis and the axial primary radiation force is neglected; for an oblique or transverse beam the primary force, which exceeds the secondary Bjerknes attraction away from the wall, would govern the migration. Despite these simplifications, the scaling laws and the frequency–size alignment criterion developed here provide a robust and computationally efficient basis for improving acoustic parameters in microbubble-assisted drug delivery.
7. Conclusions
We have introduced a coupled multiscale framework for acoustically activated coated microbubbles in peristaltic non-Newtonian blood flow, incorporating a Carreau–Yasuda peristaltic carrier, shell-resolved Marmottant–Keller–Miksis dynamics, Lagrangian bubble transport, and rupture-gated release, addressed across a six-order separation of acoustic and peristaltic time scales. Four primary deductions can be drawn. Initially, peristaltic wall movement does not facilitate delivery by the pressure it produces. The peristaltic hydrodynamic gage pressure influences bubble dynamics at ph/PA~10−5, with the associated radial force being five orders of magnitude less than the secondary Bjerknes attraction. The oscillation regime, rupture threshold, and released percentage are completely determined by the acoustic drive; peristalsis affects delivery solely via the carrier velocity field that moves the bubble. Secondly, drug release is regulated rather than continuous. The release rate increases by two orders of magnitude when the radial excursion surpasses the rupture radius, making delivery a threshold function of the operating point relative to the rupture locus in the drive-frequency–pressure plane, rather than a graded function of acoustic amplitude. At the clinically established working point (MI = 0.085) this threshold is already surpassed, so that 88% of the payload is released within one acoustic cycle of the first rupture and 98.5% within two, while the minimum rupture threshold reported here lies below MI = 0.06.
The rupture locus exhibits a non-monotonic frequency response; for the SonoVue shell over R0 = 0.75 − 2.5 its minimum follows foptR0 ≈ 3.9 , so that tuning the drive toward the shell resonance reduces the rupture threshold by up to 41% in acoustic intensity for a given formulation. Third, near-wall migration is selected by the correspondence between frequency and size. The secondary Bjerknes attraction, the sole radial force of considerable strength under axial insonation, induces in the continuity-consistent carrier field a migration of 28% of the vessel radius over three peristaltic periods at the shell resonance of a 1 MHz drive, fshell /f ≈ 1.13, more than an order of magnitude above that of smaller off-resonant bubbles; the magnitude falls steeply at higher frequencies, is insensitive to the near-wall regularization, and scales with the strength of the wall image. The clinically used SonoVue radius lies far from resonance at these frequencies and is not targeted by this mechanism; targeting requires a low drive frequency matched to a correspondingly larger agent. The peristaltic amplitude ratio adjusts the wall-directed attraction through a purely geometric rectification, without additional acoustic pressure. Fourth, under free pumping, shear-thinning lowers the mechanical cost of peristaltic transport far more than the transport itself. Under free pumping the instantaneous flow rate is fixed kinematically up to the wave-frame flux, and shear-thinning lowers the net throughput by only 8 − 14% while diminishing the peristaltic pressure variation as S = 0.21 , by as much as 24 times; a comparative analysis of common flux indicates that solely the constrained Carreau–Yasuda law is quantitatively valid at the millimeter scale, with two-parameter laws exaggerating the pressure efficiency of shear-thinning by approximately five times.
The radial core is verified against the coated-shell model of Marmottant et al. [5] and validated, in water and without parameter fitting, against the jetting-onset thresholds of Cattaneo et al. [10] (mean absolute deviation 11.8%); the coupled framework as a whole has no experimental counterpart yet. Collectively, these findings identify frequency–size matching as the principal lever for rupture-gated release and near-wall migration, with the peristaltic amplitude ratio as a geometric modulator of the wall-directed attraction; resolving the transport and uptake of the released drug is the natural next step.
Author Contributions
Conceptualization, A.K.A.-N.; methodology, A.K.A.-N.; software, A.K.A.-N.; validation, A.K.A.-N. and E.M.E.; formal analysis, A.K.A.-N. and A.J.A.; investigation, A.K.A.-N.; resources, A.K.A.-N. and E.M.E.; data curation, A.K.A.-N. and A.J.A.; writing—original draft preparation, A.K.A.-N.; writing—review and editing, A.K.A.-N.; visualization, A.K.A.-N. All authors have read and agreed to the published version of the manuscript.
Funding
A.K.A. acknowledges funding from the Ministry of Science and Higher Education of the Russian Federation (Agreement No. 075-15-2024-560).
Data Availability Statement
The original contributions presented in this study are included in the article. Further inquiries can be directed to the corresponding author.
Acknowledgments
The authors are thankful to the Deanship of Graduate Studies and Scientific Research at University of Bisha for supporting this work through the Top-impact Journals Support Program.
Conflicts of Interest
The authors declare no conflicts of interest.
References
- Stride, E.; Coussios, C. Nucleation, Mapping and Control of Cavitation for Drug Delivery. Nat. Rev. Phys. 2019, 1, 495–509. [Google Scholar] [CrossRef] [Scilit]
- Mitragotri, S. Healing Sound: The Use of Ultrasound in Drug Delivery and Other Therapeutic Applications. Nat. Rev. Drug Discov. 2005, 4, 255–260. [Google Scholar] [CrossRef] [Scilit]
- Lehmann, J.F.; Herrick, J.F. Biologic Reactions to Cavitation, a Consideration for Ultrasonic Therapy. Arch. Phys. Med. Rehabil. 1953, 34, 86–98. [Google Scholar]
- Kooiman, K.; Roovers, S.; Langeveld, S.A.G.; Kleven, R.T.; Dewitte, H.; O’Reilly, M.A.; Escoffre, J.-M.; Bouakaz, A.; Verweij, M.D.; Hynynen, K.; et al. Ultrasound-Responsive Cavitation Nuclei for Therapy and Drug Delivery. Ultrasound Med. Biol. 2020, 46, 1296–1325. [Google Scholar] [CrossRef] [Scilit]
- Marmottant, P.; van der Meer, S.; Emmer, M.; Versluis, M.; de Jong, N.; Hilgenfeldt, S.; Lohse, D. A Model for Large Amplitude Oscillations of Coated Bubbles Accounting for Buckling and Rupture. J. Acoust. Soc. Am. 2005, 118, 3499–3505. [Google Scholar] [CrossRef] [Scilit]
- Keller, J.B.; Miksis, M. Bubble Oscillations of Large Amplitude. J. Acoust. Soc. Am. 1980, 68, 628–633. [Google Scholar] [CrossRef] [Scilit]
- Qin, D.; Zou, Q.; Lei, S.; Wang, W.; Li, Z. Nonlinear Dynamics and Acoustic Emissions of Interacting Cavitation Bubbles in Viscoelastic Tissues. Ultrason. Sonochem. 2021, 78, 105712. [Google Scholar] [CrossRef] [Scilit]
- Sojahrood, A.J.; Earl, R.; Haghi, H.; Li, Q.; Porter, T.M.; Kolios, M.C.; Karshafian, R. Nonlinear Dynamics of Acoustic Bubbles Excited by Their Pressure-Dependent Subharmonic Resonance Frequency: Influence of the Pressure Amplitude, Frequency, Encapsulation and Multiple Bubble Interactions on Oversaturation and Enhancement of the Subharmonic Signal. Nonlinear Dyn. 2021, 103, 429–466. [Google Scholar] [CrossRef] [Scilit]
- Versluis, M.; Stride, E.; Lajoinie, G.; Dollet, B.; Segers, T. Ultrasound Contrast Agent Modeling: A Review. Ultrasound Med. Biol. 2020, 46, 2117–2144. [Google Scholar] [CrossRef] [Scilit]
- Cattaneo, M.; Guerriero, G.; Shakya, G.; Krattiger, L.A.; Paganella, L.G.; Narciso, M.L.; Supponen, O. Cyclic Jetting Enables Microbubble-Mediated Drug Delivery. Nat. Phys. 2025, 21, 590–598. [Google Scholar] [CrossRef] [Scilit]
- Wu, W.; Liu, Y.; Smith, W.; Wang, Q. Nonlinear Three-Dimensional Modeling for Encapsulated Microbubble Dynamics Subject to Ultrasound. Phys. Fluids 2024, 36, 097120. [Google Scholar] [CrossRef] [Scilit]
- Song, Y.; Qin, S.; Yu, Y.; Cao, H. Coated Microbubble Oscillation Using a Coupling Model at Varied Ultrasonic Parameters and Bubble Properties for Biomedical Application. Phys. Fluids 2025, 37, 037157. [Google Scholar] [CrossRef] [Scilit]
- Gijsen, F.J.; Allanic, E.; van de Vosse, F.N.; Janssen, J.D. The Influence of the Non-Newtonian Properties of Blood on the Flow in Large Arteries: Unsteady Flow in a 90 Degrees Curved Tube. J. Biomech. 1999, 32, 705–713. [Google Scholar] [CrossRef] [Scilit]
- Santesarti, G.; Marino, M.; Viola, F.; Verzicco, R.; Vairo, G. An Insight into Parameter Identifiability Issues in the Carreau–Yasuda Model: A More Consistent Rheological Formulation for Shear-Thinning Non-Newtonian Inelastic Fluids. J. Nonnewton. Fluid Mech. 2025, 342, 105438. [Google Scholar] [CrossRef] [Scilit]
- Abu-Nab, A.K.; Selima, E.S.; Morad, A.M. Theoretical Investigation of a Single Vapor Bubble during Al2O3/H2O Nanofluids in Power-Law Fluid Affected by a Variable Surface Tension. Phys. Scr. 2021, 96, 035222. [Google Scholar] [CrossRef] [Scilit]
- Abu-Nab, A.K.; Morad, A.M.; Selima, E.S. Impact of Magnetic-Field on the Dynamic of Gas Bubbles in N-Dimensions of Non-Newtonian Hybrid Nanofluid: Analytical Study. Phys. Scr. 2022, 97, 105202. [Google Scholar] [CrossRef] [Scilit]
- Fanelli, C.; Kaouri, K.; Phillips, T.N.; Myers, T.G.; Font, F. Magnetic Nanodrug Delivery in Non-Newtonian Blood Flows. Microfluid. Nanofluidics 2022, 26, 74. [Google Scholar] [CrossRef] [Scilit]
- Munting, L.P.; Bonnar, O.; Kozberg, M.G.; Auger, C.A.; Hirschler, L.; Hou, S.S.; Greenberg, S.M.; Bacskai, B.J.; van Veluw, S.J. Spontaneous Vasomotion Propagates along Pial Arterioles in the Awake Mouse Brain like Stimulus-Evoked Vascular Reactivity. J. Cereb. Blood Flow Metab. 2023, 43, 1752–1763. [Google Scholar] [CrossRef] [Scilit]
- Broggini, T.; Duckworth, J.; Ji, X.; Liu, R.; Xia, X.; Mächler, P.; Shaked, I.; Munting, L.P.; Iyengar, S.; Kotlikoff, M.; et al. Long-Wavelength Traveling Waves of Vasomotion Modulate the Perfusion of Cortex. Neuron 2024, 112, 2349–2367.e8. [Google Scholar] [CrossRef] [Scilit]
- Abd-Alla, A.M.; Abo-Dahab, S.M.; El-Shahrany, H.D. Effects of Rotation and Initial Stress on Peristaltic Transport of Fourth Grade Fluid with Heat Transfer and Induced Magnetic Field. J. Magn. Magn. Mater. 2014, 349, 268–280. [Google Scholar] [CrossRef] [Scilit]
- Mekheimer, K.S. Peristaltic Flow of a Magneto-micropolar Fluid: Effect of Induced Magnetic Field. J. Appl. Math. 2008, 2008, 570825. [Google Scholar] [CrossRef] [Scilit]
- Ali, N.; Sajid, M.; Abbas, Z.; Javed, T. Non-Newtonian Fluid Flow Induced by Peristaltic Waves in a Curved Channel. Eur. J. Mech. B Fluids 2010, 29, 387–394. [Google Scholar] [CrossRef] [Scilit]
- Shapiro, A.H.; Jaffrin, M.Y.; Weinberg, S.L. Peristaltic Pumping with Long Wavelengths at Low Reynolds Number. J. Fluid Mech. 1969, 37, 799–825. [Google Scholar] [CrossRef] [Scilit]
- Boyd, J.; Buick, J.M.; Green, S. Analysis of the Casson and Carreau-Yasuda Non-Newtonian Blood Models in Steady and Oscillatory Flows Using the Lattice Boltzmann Method. Phys. Fluids 2007, 19, 093103. [Google Scholar] [CrossRef] [Scilit]
- Maxey, M.R.; Riley, J.J. Equation of Motion for a Small Rigid Sphere in a Nonuniform Flow. Phys. Fluids 1983, 26, 883–889. [Google Scholar] [CrossRef] [Scilit]
- Favier, J.; Revell, A.; Pinelli, A. A Lattice Boltzmann–Immersed Boundary Method to Simulate the Fluid Interaction with Moving and Slender Flexible Objects. J. Comput. Phys. 2014, 261, 145–161. [Google Scholar] [CrossRef] [Scilit]
- Kamensky, D.; Hsu, M.-C.; Schillinger, D.; Evans, J.A.; Aggarwal, A.; Bazilevs, Y.; Sacks, M.S.; Hughes, T.J.R. An Immersogeometric Variational Framework for Fluid-Structure Interaction: Application to Bioprosthetic Heart Valves. Comput. Methods Appl. Mech. Eng. 2015, 284, 1005–1053. [Google Scholar] [CrossRef] [Scilit]
- Mettin, R.; Akhatov, I.; Parlitz, U.; Ohl, C.; Lauterborn, W. Bjerknes Forces between Small Cavitation Bubbles in a Strong Acoustic Field. Phys. Rev. E Stat. Phys. Plasmas Fluids Relat. Interdiscip. Top. 1997, 56, 2924–2931. [Google Scholar] [CrossRef] [Scilit]
- Matula, T.J.; Cordry, S.M.; Roy, R.A.; Crum, L.A. Bjerknes Force and Bubble Levitation under Single-Bubble Sonoluminescence Conditions. J. Acoust. Soc. Am. 1997, 102, 1522–1527. [Google Scholar] [CrossRef] [Scilit]
- Crum, L.A. Bjerknes Forces on Bubbles in a Stationary Sound Field. J. Acoust. Soc. Am. 1975, 57, 1363–1370. [Google Scholar] [CrossRef] [Scilit]
- Késmárky, G.; Kenyeres, P.; Rábai, M.; Tóth, K. Plasma Viscosity: A Forgotten Variable. Clin. Hemorheol. Microcirc. 2008, 39, 243–246. [Google Scholar] [CrossRef] [Scilit]
- Minnaert, M. XVI. On Musical Air-Bubbles and the Sounds of Running Water. Lond. Edinb. Dublin Philos. Mag. J. Sci. 1933, 16, 235–248. [Google Scholar] [CrossRef] [Scilit]
- Qin, S.; Caskey, C.F.; Ferrara, K.W. Ultrasound Contrast Microbubbles in Imaging and Therapy: Physical Principles and Engineering. Phys. Med. Biol. 2009, 54, R27–R57. [Google Scholar] [CrossRef] [Scilit]
- Abu-Bakr, A.F.; Abu-Nab, A.K. Growth of Lipid-Coated Multi-Microbubbles in Viscoelastic Tissues. Eur. Phys. J. Plus 2022, 137, 513. [Google Scholar] [CrossRef] [Scilit]
- Pontrelli, G.; de Monte, F. A Two-Phase Two-Layer Model for Transdermal Drug Delivery and Percutaneous Absorption. Math. Biosci. 2014, 257, 96–103. [Google Scholar] [CrossRef] [Scilit]
- Luan, Y.; Lajoinie, G.; Gelderblom, E.; Skachkov, I.; van der Steen, A.F.W.; Vos, H.J.; Versluis, M.; De Jong, N. Lipid Shedding from Single Oscillating Microbubbles. Ultrasound Med. Biol. 2014, 40, 1834–1846. [Google Scholar] [CrossRef] [Scilit]
- Gorce, J.M.; Arditi, M.; Schneider, M. Influence of Bubble Size Distribution on the Echogenicity of Ultrasound Contrast Agents: A Study of SonoVue. Investig. Radiol. 2000, 35, 661–671. [Google Scholar] [CrossRef] [Scilit]
- Tu, J.; Guan, J.; Qiu, Y.; Matula, T.J. Estimating the Shell Parameters of SonoVue Microbubbles Using Light Scattering. J. Acoust. Soc. Am. 2009, 126, 2954–2962. [Google Scholar] [CrossRef] [Scilit]
- Laadhari, A. Exact Newton Method with Third-Order Convergence to Model the Dynamics of Bubbles in Incompressible Flow. Appl. Math. Lett. 2017, 69, 138–145. [Google Scholar] [CrossRef] [Scilit]
- Qin, S.; Chen, R.; Lin, Z.; Cai, X.-C. A Highly Parallel Domain Decomposition Method for a Non-Newtonian Model of Blood Flows in Cerebral Artery with Aneurysm. Appl. Math. Model. 2026, 159, 117059. [Google Scholar] [CrossRef] [Scilit]
- Brent, R.P. An Algorithm with Guaranteed Convergence for Finding a Zero of a Function. Comput. J. 1971, 14, 422–425. [Google Scholar] [CrossRef] [Scilit]
- Hairer, E.; Wanner, G. Solving Ordinary Differential Equations II. In Springer Series in Computational Mathematics, 2nd ed.; Springer: Berlin/Heidelberg, Germany, 2010. [Google Scholar]
- Brenner, H. The Slow Motion of a Sphere through a Viscous Fluid towards a Plane Surface. Chem. Eng. Sci. 1961, 16, 242–251. [Google Scholar] [CrossRef] [Scilit]
- Petzold, L. Automatic Selection of Methods for Solving Stiff and Nonstiff Systems of Ordinary Differential Equations. SIAM J. Sci. Stat. Comput. 1983, 4, 136–148. [Google Scholar] [CrossRef] [Scilit]
- Novell, A.; Escoffre, J.-M.; Bouakaz, A. Ultrasound Contrast Imaging in Cancer–Technical Aspects and Prospects. Curr. Mol. Imaging 2013, 2, 77–88. [Google Scholar] [CrossRef] [Scilit]
- Faez, T.; Goertz, D.; De Jong, N. Characterization of DefinityTM Ultrasound Contrast Agent at Frequency Range of 5-15 MHz. Ultrasound Med. Biol. 2011, 37, 338–342. [Google Scholar] [CrossRef] [Scilit]
- Goertz, D.E.; de Jong, N.; van der Steen, A.F.W. Attenuation and Size Distribution Measurements of Definity and Manipulated Definity Populations. Ultrasound Med. Biol. 2007, 33, 1376–1388. [Google Scholar] [CrossRef] [Scilit]
- Gümmer, J.; Schenke, S.; Denner, F. Modelling Lipid-Coated Microbubbles in Focused Ultrasound Applications at Subresonance Frequencies. Ultrasound Med. Biol. 2021, 47, 2958–2979. [Google Scholar] [CrossRef] [Scilit]
- Helfield, B.; Chen, X.; Watkins, S.C.; Villanueva, F.S. Biophysical Insight into Mechanisms of Sonoporation. Proc. Natl. Acad. Sci. USA 2016, 113, 9983–9988. [Google Scholar] [CrossRef] [Scilit]
- Johnston, B.M.; Johnston, P.R.; Corney, S.; Kilpatrick, D. Non-Newtonian Blood Flow in Human Right Coronary Arteries: Steady State Simulations. J. Biomech. 2004, 37, 709–720. [Google Scholar] [CrossRef] [Scilit]
- Myers, T.G. Application of Non-Newtonian Models to Thin Film Flow. Phys. Rev. E Stat. Nonlin. Soft Matter Phys. 2005, 72, 066302. [Google Scholar] [CrossRef] [Scilit]
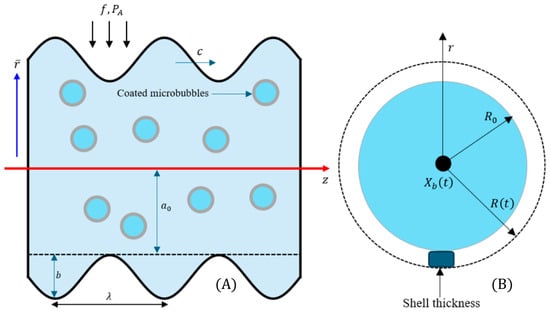
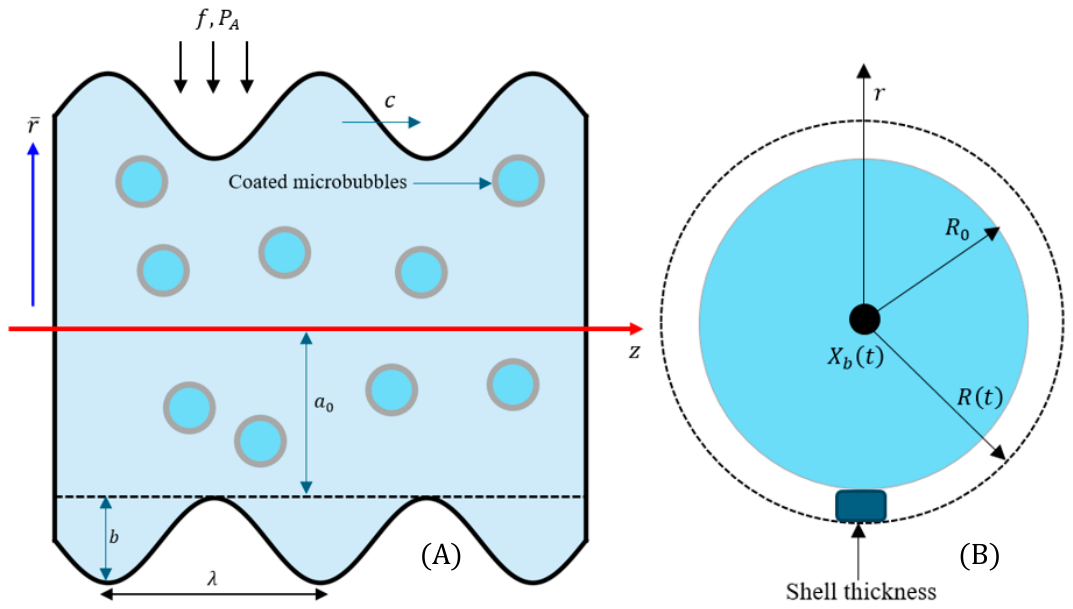
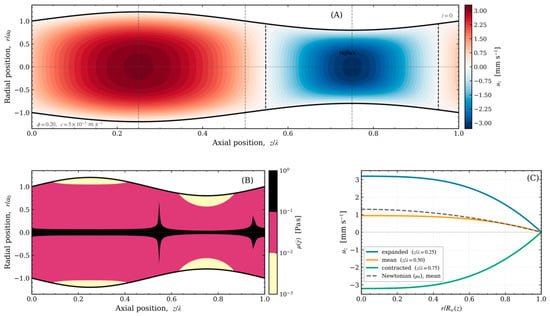
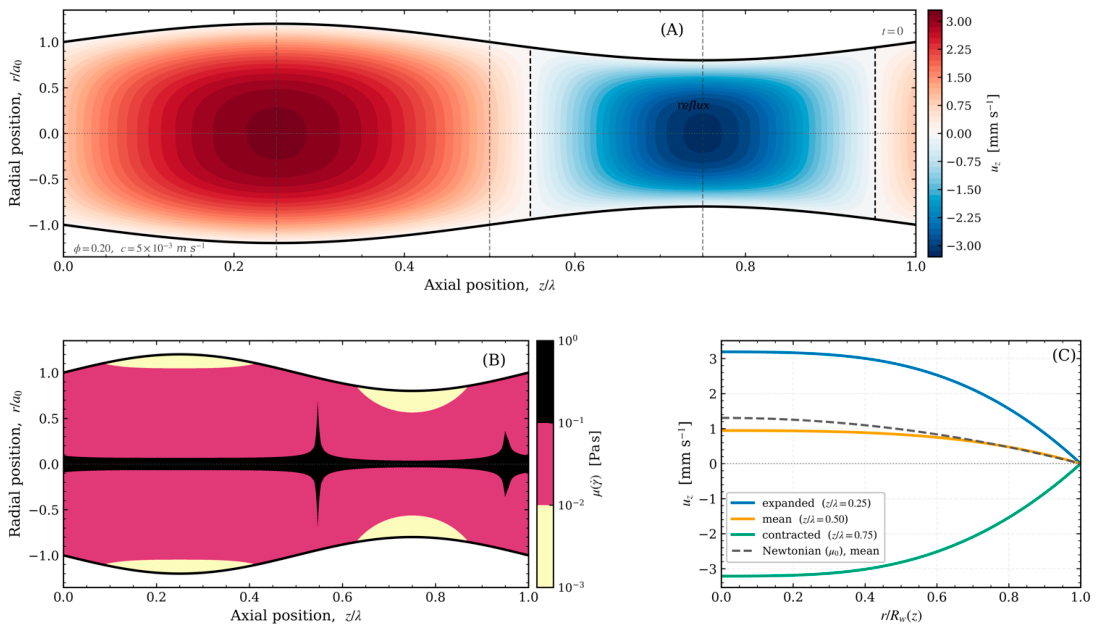
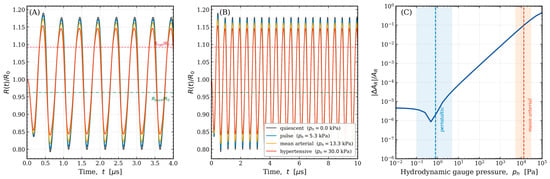
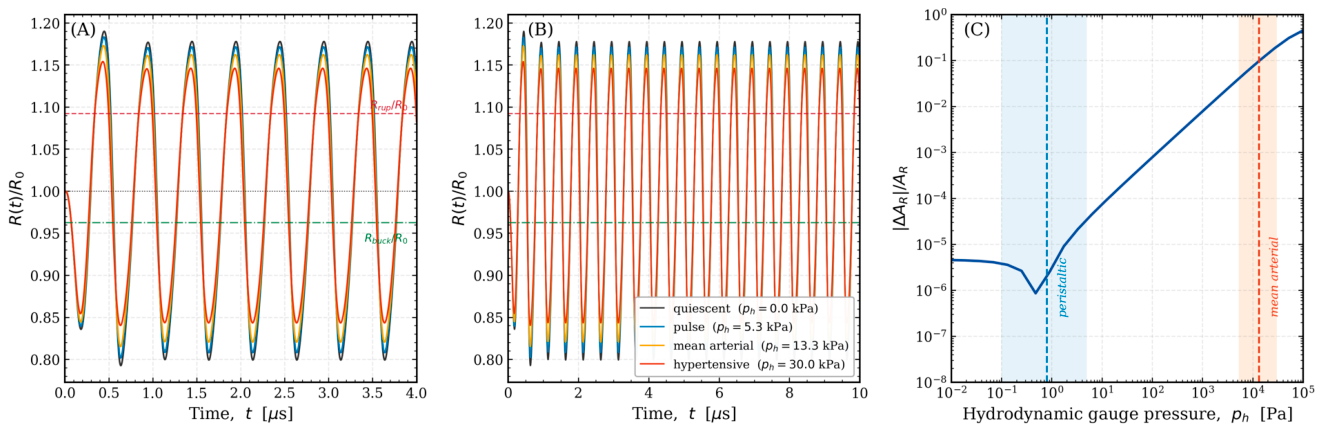
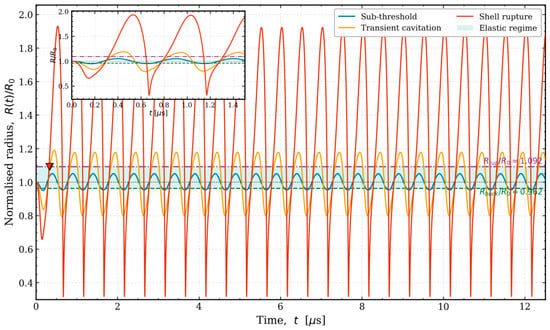
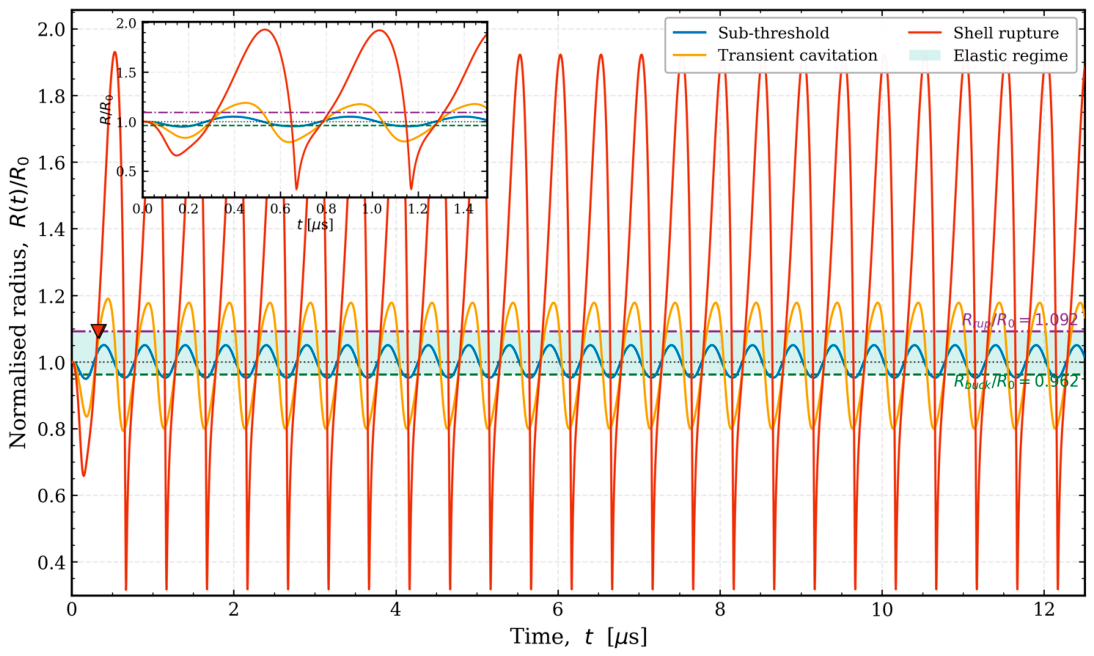
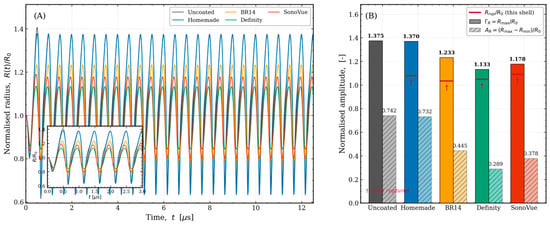
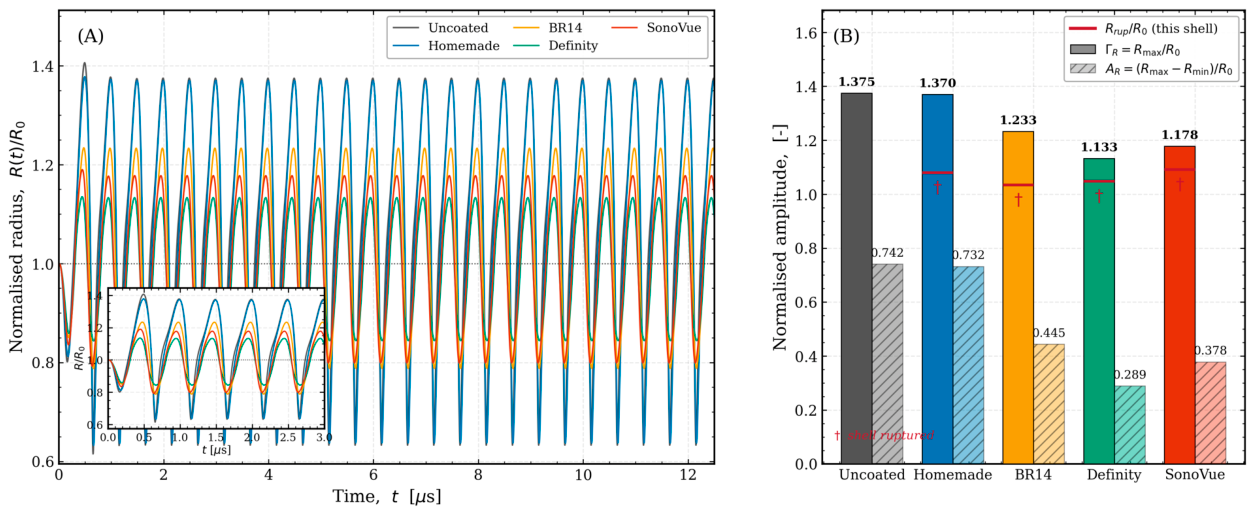
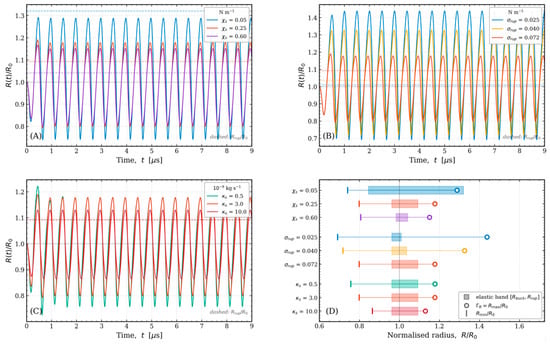
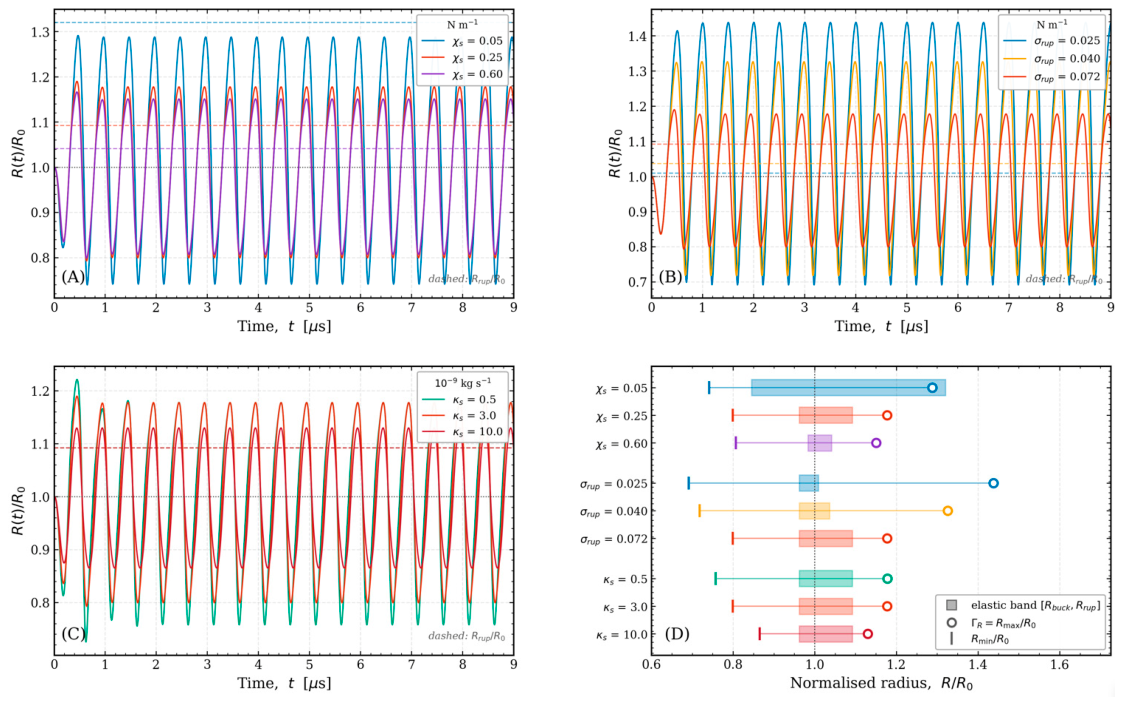
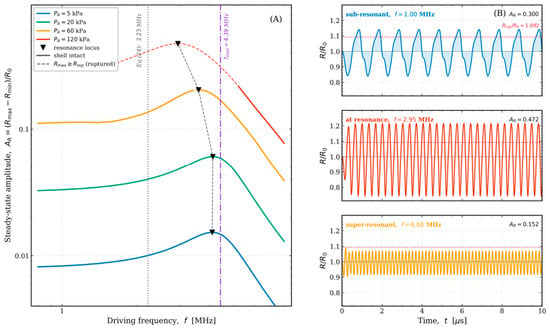
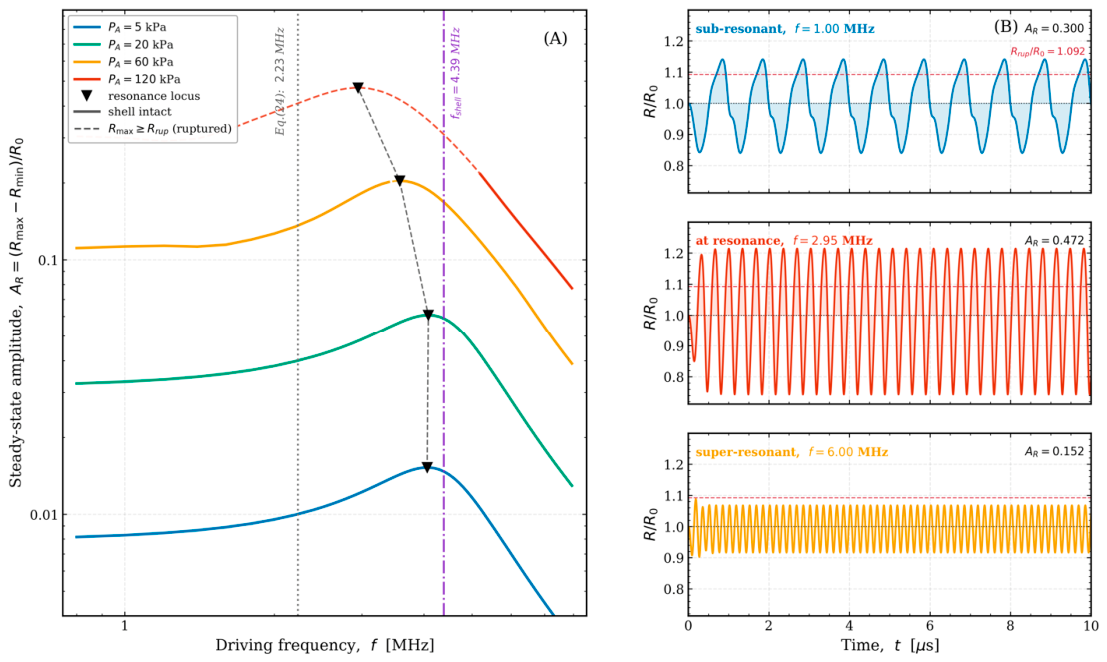
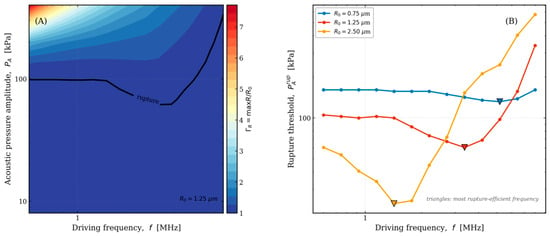
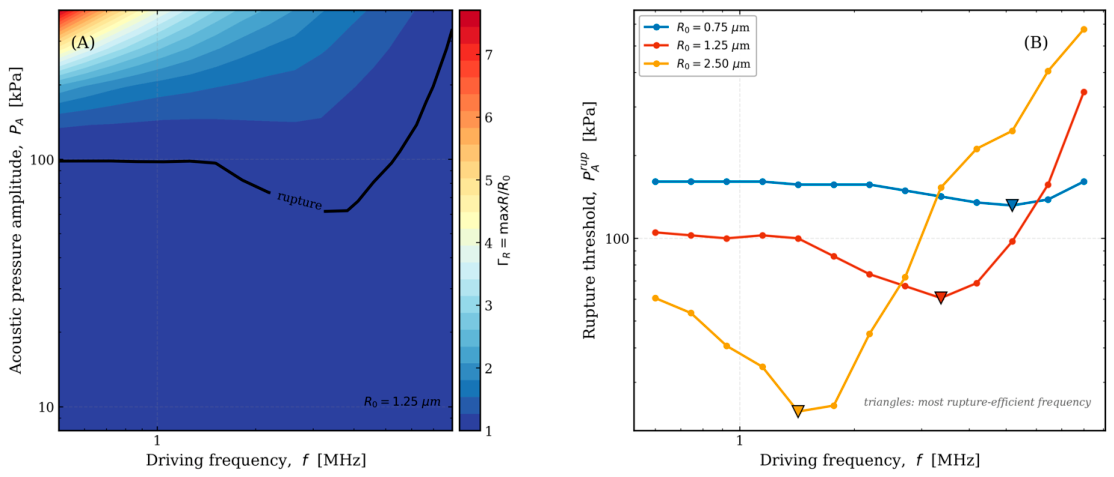
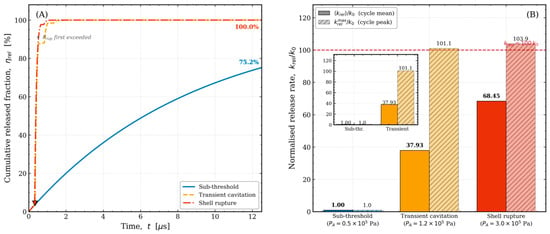
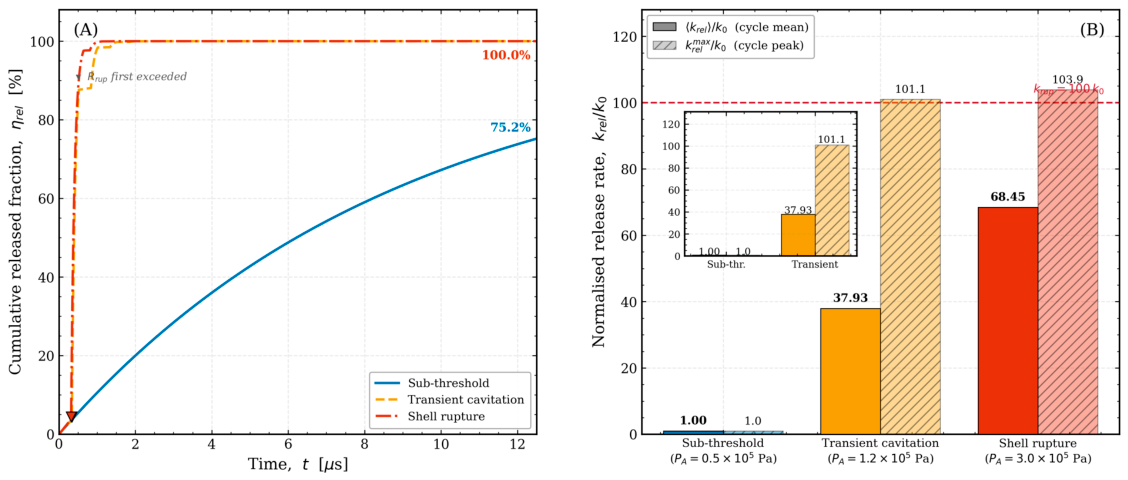
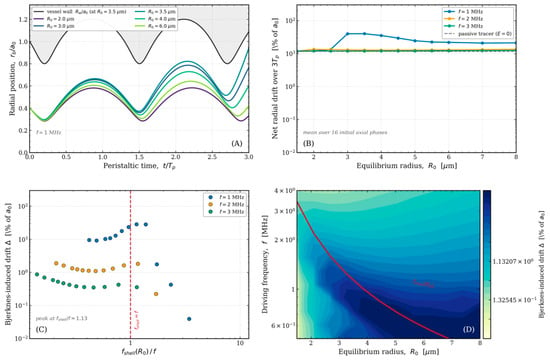
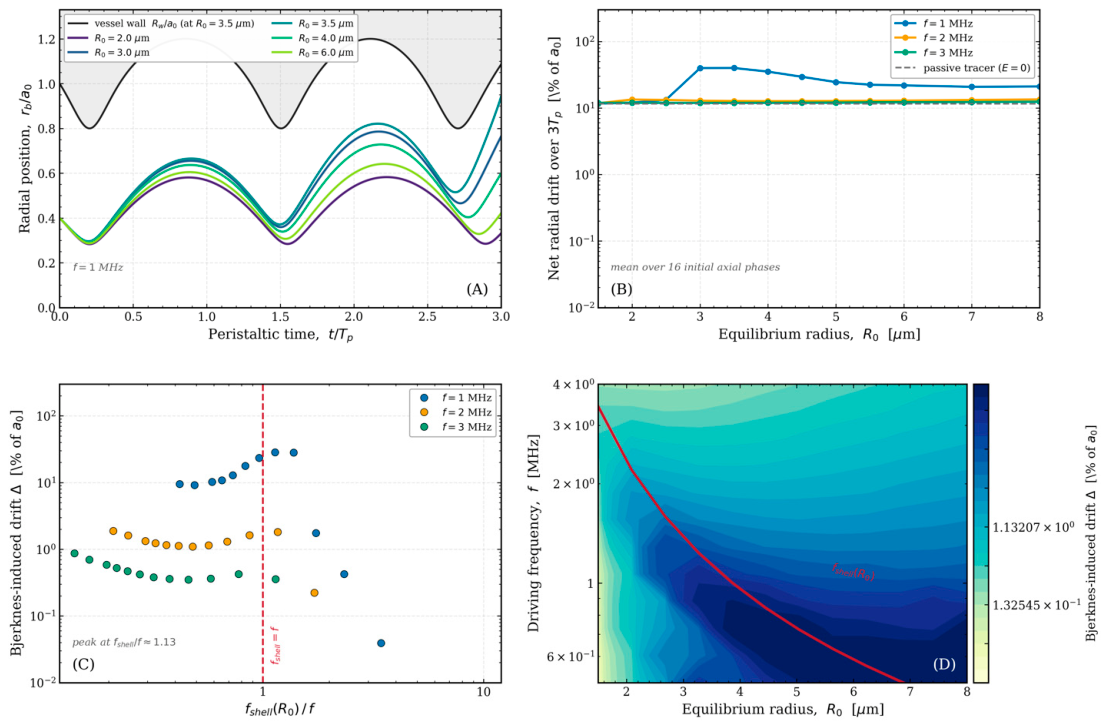
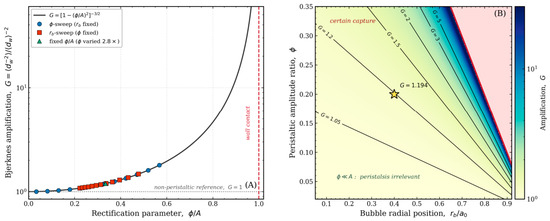
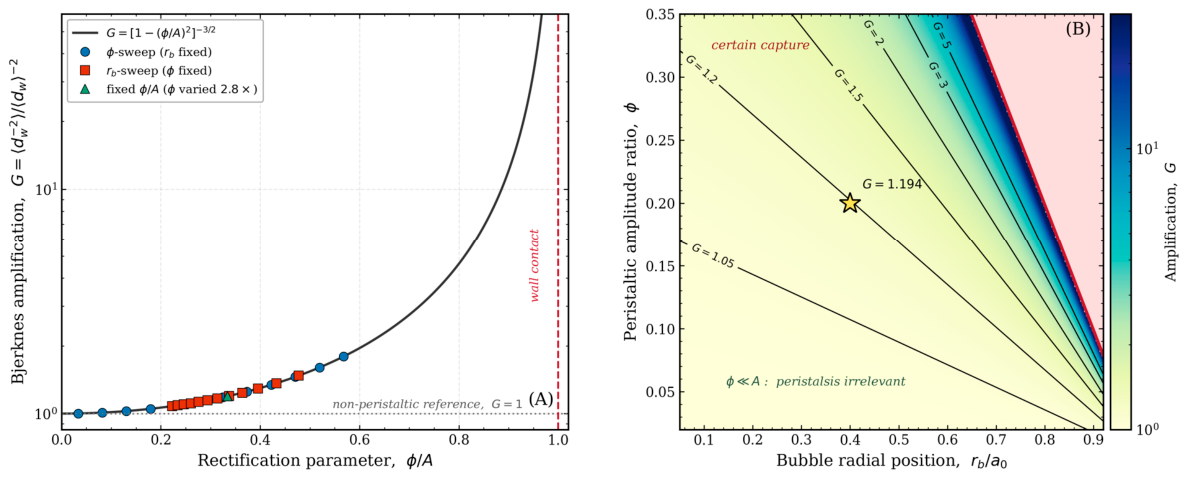
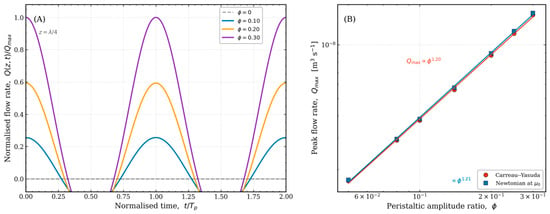
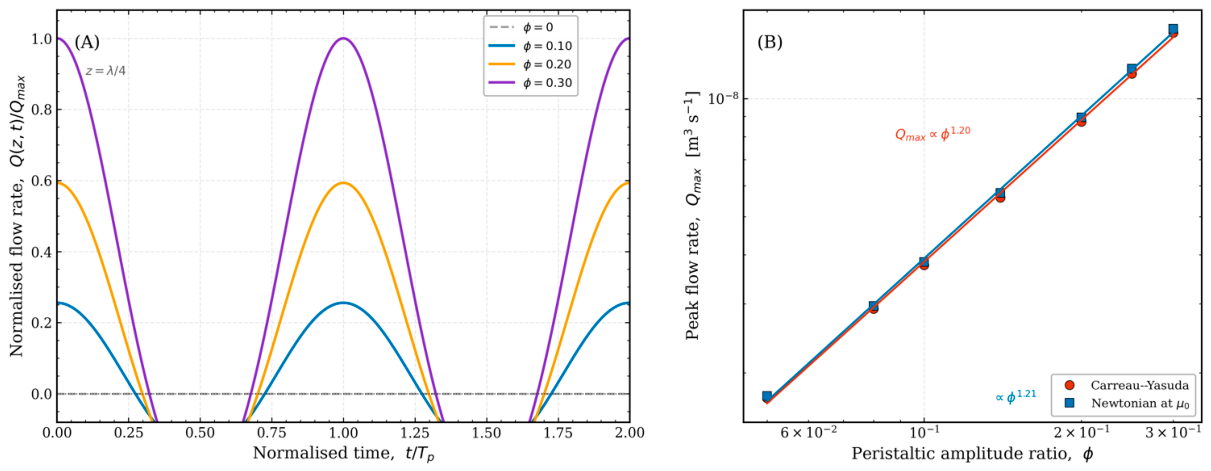
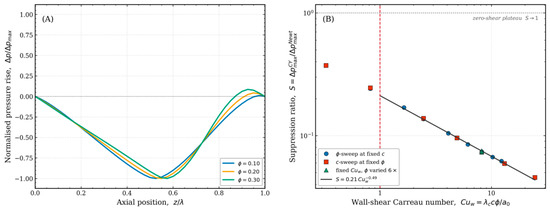
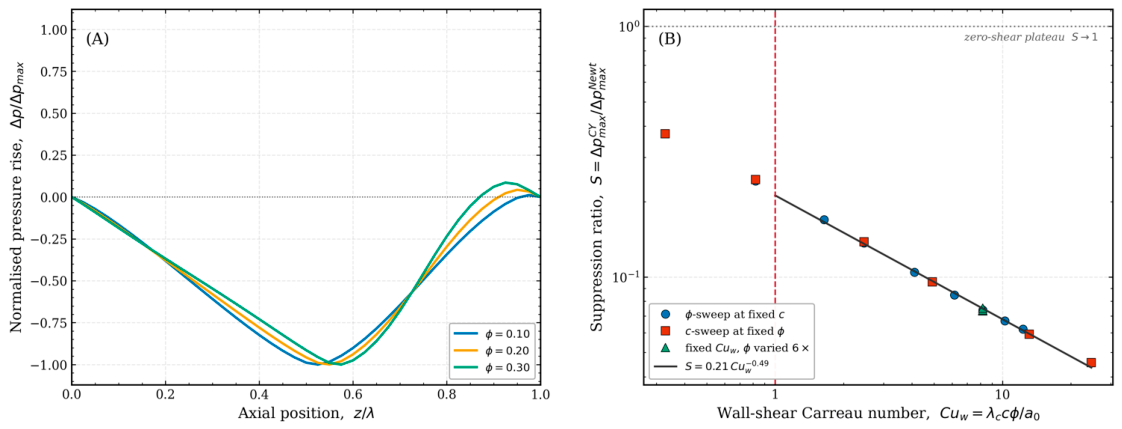
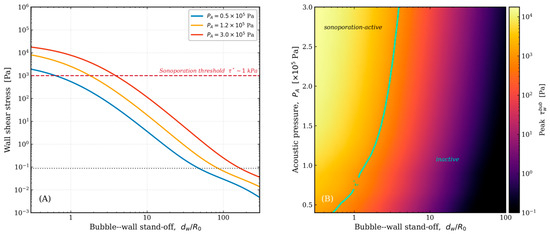
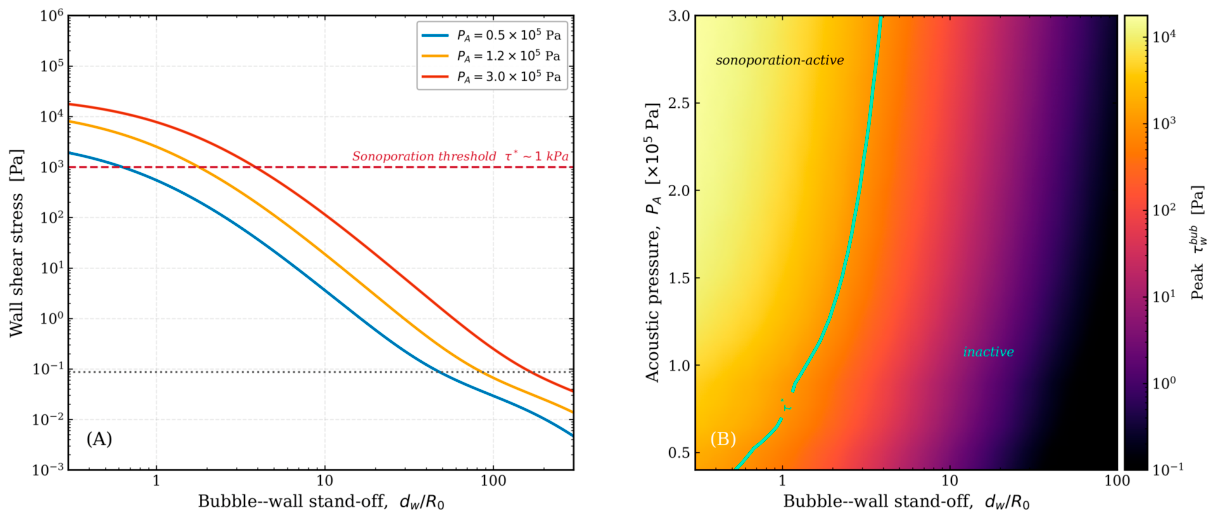
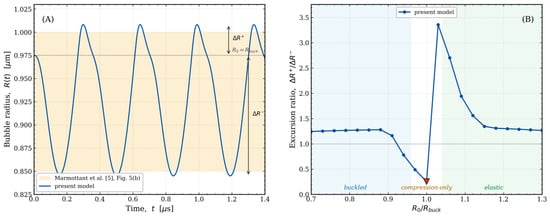
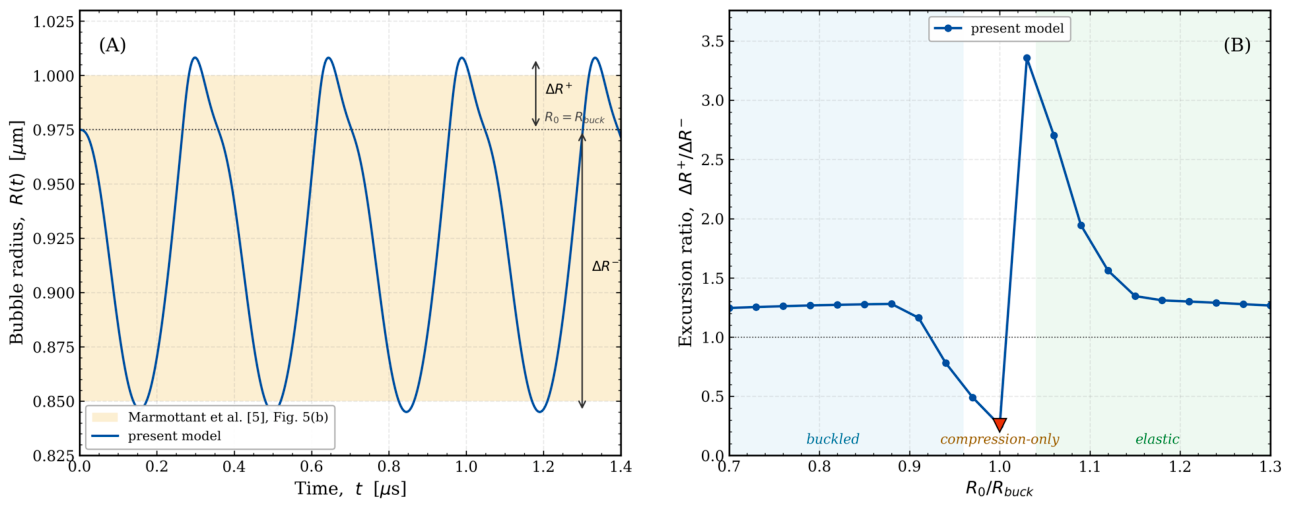

Disclaimer/Publisher’s Note: The statements, opinions and data contained in all publications are solely those of the individual author(s) and contributor(s) and not of MDPI and/or the editor(s). MDPI and/or the editor(s) disclaim responsibility for any injury to people or property resulting from any ideas, methods, instructions or products referred to in the content. |
© 2026 by the authors. Licensee MDPI, Basel, Switzerland. This article is an open access article distributed under the terms and conditions of the Creative Commons Attribution (CC BY) license.