


Abstract
The U.S. Ending the HIV Epidemic (EHE) initiative targets 3000 annual HIV infections by 2030. This study develops a seven-compartment transmission model distinguishing oral and long-acting pre-exposure prophylaxis (PrEP), with infection-stage dynamics informed by within-host viral modeling. The mathematical analysis establishes well-posedness, derives the control reproduction number and critical PrEP coverage, and provides sufficient conditions for global disease-free stability and forward bifurcation. Bayesian calibration to national surveillance and PrEP-use data (2017–2024) indicates that the control reproduction number declined from 2.28 to 1.97, while projected incidence approaches an endemic plateau. Under current conditions, annual infections are projected at 25,500 in 2030. Transitioning new PrEP initiations to long-acting formulations reduces this estimate to 20,200, outperforming doubled oral PrEP initiation (21,100) only if annual persistence reaches approximately 78%; its comparative advantage is driven primarily by improved persistence within the examined parameter ranges. Combining long-acting PrEP expansion with improved diagnosis and viral suppression reduces projected incidence to 11,800 and brings the control reproduction number below unity under baseline assumptions. Nevertheless, none of the examined scenarios achieve the 2030 EHE target. Optimal control analysis favors early intensification of long-acting PrEP initiation and testing. These findings highlight PrEP persistence and coordinated improvements in HIV care as essential determinants of sustained transmission reduction.
MSC:
92D30; 92C60; 34D20; 49K15
1. Introduction
In 2019, the United States launched the Ending the HIV Epidemic (EHE) initiative, which set targets of a 75% reduction in annual HIV infections by 2025 and a 90% reduction by 2030, corresponding to approximately 9000 and 3000 infections, respectively [1]. National surveillance shows progress that falls well short of this pace. The CDC estimated 36,200 infections in 2018 and 31,800 in 2022, a 12% decline, while about 1.24 million persons aged 13 years and older were living with HIV at the end of 2022, of whom 87.2% had been diagnosed [2]. Among persons with diagnosed HIV, viral suppression has stagnated near 65% since 2019 [3]. The 2025 EHE target has therefore been missed, and the feasibility of the 2030 target is an open question of national importance.
Two biomedical facts frame the problem. First, persons with a suppressed viral load do not transmit HIV sexually [4,5], so diagnosis and sustained treatment act as prevention. Second, PrEP is highly efficacious when taken [6], but its population effect has been limited by uptake, adherence, and persistence. Annual PrEP users grew from 10,281 in 2013 to 505,730 in 2023 [7], yet roughly half of oral PrEP users discontinue within a year [8]. Long-acting agents directly target this weakness. Injectable cabotegravir proved superior to daily oral PrEP [9]. Twice-yearly subcutaneous lenacapavir prevented almost all infections in the PURPOSE 1 and PURPOSE 2 trials [10,11], and in June 2025 it became the first twice-yearly PrEP option approved in the United States [12]. Early uptake has been slow and has reproduced the racial, ethnic, and age disparities of oral PrEP [13]. Insurance coverage, up-front purchasing by clinics, and persistence outside trials also remain uncertain [14]; in U.S. claims data, only half of long-acting cabotegravir users remained on it after one year [15].
Mathematical models have shaped HIV science at two scales. At the within-host scale, the viral-dynamics models of Perelson and co-workers quantified rapid virion turnover and the infected-cell lifespan [16,17,18] and described viremia during primary infection [19]. At the population scale, transmission models have evaluated test-and-treat strategies [20] and PrEP guidelines in the United States [21]. A recent static-cohort analysis projected that lenacapavir could avert 8–20% of U.S. infections during 2026–2030 [22]. Static cohorts, however, omit the indirect benefits of prevention: in a dynamic model, each infection averted also prevents its onward transmission, so benefits compound over time and scale with the duration of protection. To the authors’ knowledge, no dynamic U.S.-national model that is (i) fitted jointly to multiple CDC surveillance streams, (ii) analyzed rigorously for its threshold dynamics, and (iii) used to derive an optimal allocation between long-acting PrEP and testing has been reported.
This study addresses this gap by developing a transmission model that distinguishes oral and long-acting PrEP in terms of efficacy and persistence, with stage-specific infectiousness linked to a Perelson-type within-host model. The mathematical analysis establishes well-posedness, derives an explicit control reproduction number and a closed-form critical PrEP coverage condition, proves global stability of the disease-free equilibrium under a sufficient condition, and characterizes the forward bifurcation at Rc = 1. The model is calibrated to national CDC data on HIV incidence, diagnoses, viral suppression, prevalence, and PrEP use through Bayesian inference, complemented by profile-likelihood identifiability analysis. Finally, projections to 2030 are assessed against the EHE targets, supported by global sensitivity analysis and an optimal control framework for long-acting PrEP initiation and HIV testing. The model assumes homogeneous mixing within the national elevated-risk population, consistent with the national scale of the surveillance data; a partial-mixing alternative is examined in Section 5.3, and population heterogeneity is discussed as a limitation in Section 7.
The remainder of this paper is organized as follows. Section 2 formulates the model, Section 3 presents the mathematical analysis, Section 4 describes the data and Bayesian calibration, Section 5 reports thresholds, projections, sensitivity analyses, and optimal control, Section 6 discusses the findings, and Section 7 concludes with limitations and future work.
2. Model Formulation
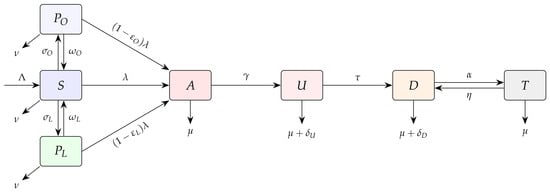
The model population consists of persons aged 13 years and older who are at elevated risk of HIV acquisition, operationalized as persons with indications for PrEP (about 1.2 million [23]), together with all persons living with HIV. Susceptible persons are divided into those not on PrEP (S), on daily oral PrEP (), and on long-acting PrEP (). Infected persons are divided into acute infection (A), undiagnosed chronic infection (U), diagnosed but not virally suppressed (D), and diagnosed with viral suppression (T). The total population is . The model reads
where is the effective susceptible pool and
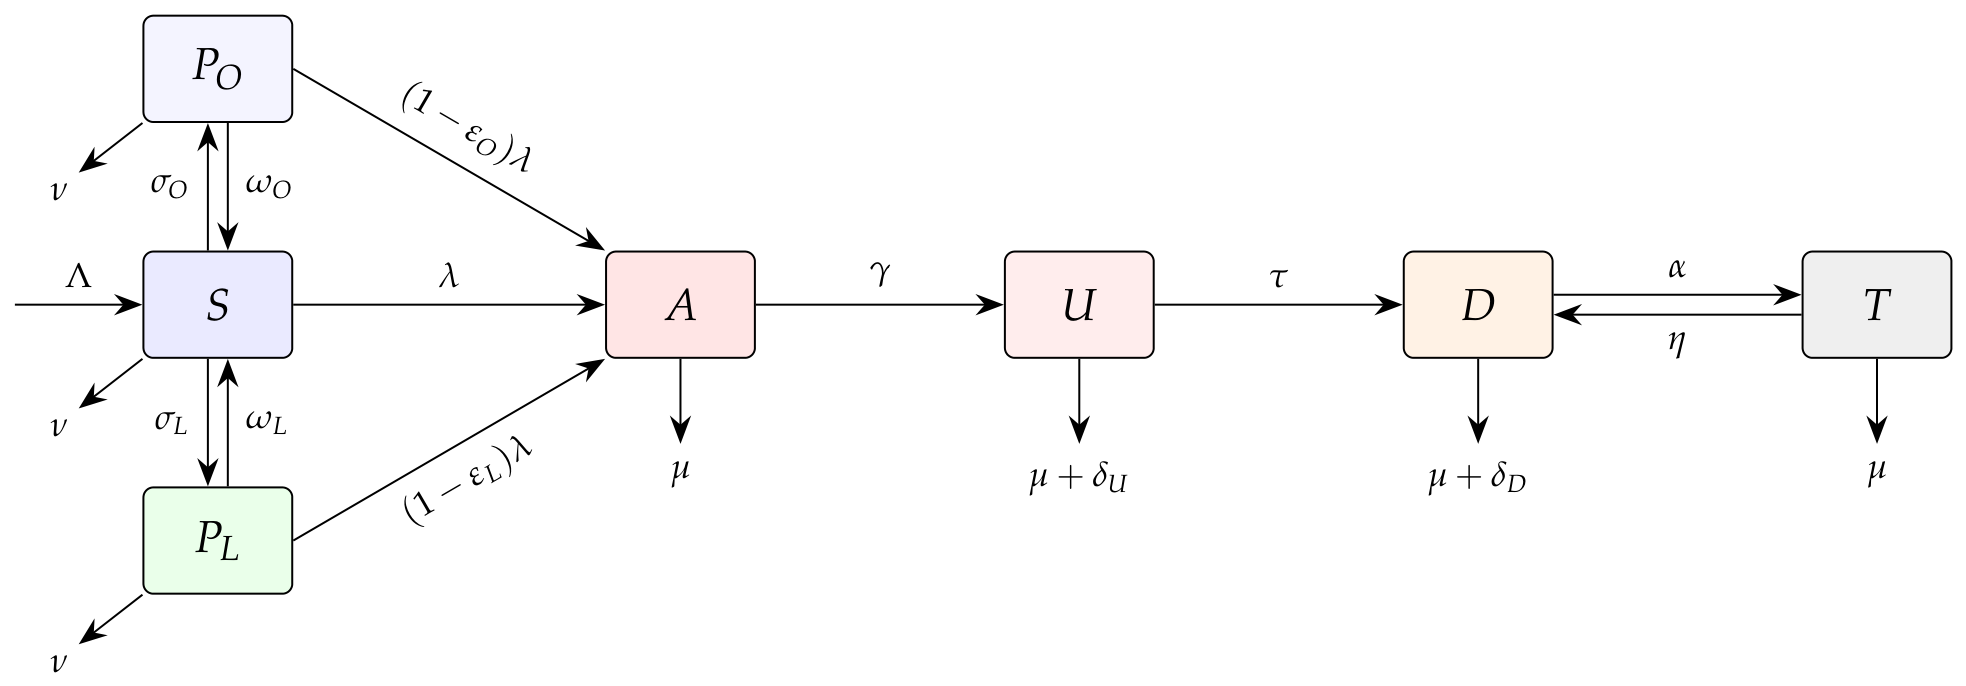
is the force of infection. Persons enter the elevated-risk pool at rate and leave it at rate (aging out or sustained change in risk). PrEP is initiated at rates , discontinued at rates , and reduces acquisition by efficacies . Acute infection lasts on average . Undiagnosed persons are diagnosed at rate , diagnosed persons achieve suppression at rate and lose it at rate , is background mortality among persons with HIV, and are excess HIV-related mortality rates. The weights give infectiousness relative to undiagnosed chronic infection. Consistent with Undetectable = Untransmittable [5], . The value reflects the reduction in risk behavior after diagnosis [24,25]. Figure 1 shows the flow diagram.
Figure 1.
Flow diagram of model (1). Infectious classes contribute to the force of infection with relative weights .
Transmission is frequency dependent, as is standard for sexually transmitted infections, because the number of partners does not scale with population size. The denominator N includes persons with HIV because they remain in the sexual networks of the elevated-risk population, so contacts with virally suppressed persons () dilute the force of infection. To test this assumption, Section 5.3 refits the model with only a fraction of persons with HIV participating in the network, , for and . The baseline is .
The constant is the size of the susceptible elevated-risk population () in 2017 [23]. It is not the infection-free population size . Recruitment balances exits from risk () and new infections (about 36,000 per year in 2017), so remains near during calibration (1,200,000 in 2017 and 1,213,605 in 2024 at the MLE). The infection-free size is a property of the hypothetical disease-free state only. It does not enter , which depends on the PrEP rates only through the coverage fractions in . The construction of all initial values is given in Appendix B.
Over the calibration period 2017–2024, the program rates are
where c captures the documented 2020 disruption of HIV testing during the COVID-19 pandemic [26]. Injectable cabotegravir has been available since December 2021, but it accounted for only 1.1% and 2.5% of PrEP users in 2022 and 2023 [7]. These users are counted in before 2025. Treating them as long-acting rather than oral would raise the protected fraction by at most 0.0017, so setting before 2025 has a negligible effect on calibration. For projections, the rates are frozen at their values at (1 January 2025, the end of the calibration period) and then modified by intervention scenarios (Section 5.2). Throughout, calendar year y corresponds to , and annual quantities are integrals over that interval. For the analysis in Section 3, all rates are treated as constants.
The acute-phase weight is anchored to within-host viral dynamics. The target-cell-limited model [18,19]
is parameterized with cells , , , and , and with chosen so that the within-host reproduction number is and the set point is copies/mL [27]. Per-act infectivity increases 2.45-fold per increment of plasma viral load [28]. The relative infectiousness of the acute phase is therefore
where is the time at which viremia reaches 1 copy/mL. The simulated viral load peaks at copies/mL, and (2) gives . Across and , it ranges from 0.73 to 1.03. Plasma viremia alone therefore explains little of the elevated acute-phase transmission observed in cohorts, where the relative hazard is about 26 over 2.9 months [29]. Genital-tract shedding and partner concurrency during early infection likely account for the remainder, and later re-analyses suggest lower values [30]. The connection between the two scales rests on three assumptions: (i) per-act transmission probability depends log-linearly on viral load, as estimated in [28]; (ii) plasma viremia is a proxy for genital-tract viremia; and (iii) contact rates are equal across infection stages. Under these assumptions, plasma viremia gives , and a saturating dose–response [27] would give a smaller value still. The population weight is therefore decomposed as , where collects mechanisms not captured by plasma viral load: genital shedding in excess of plasma viremia, higher partner acquisition, and sexually transmitted co-infections during early infection. The within-host value is a lower bound for only under the assumption , that is, that the mechanisms omitted from the plasma-viral-load calculation do not make acute infection less infectious relative to chronic infection. This assumption is plausible but has not been established empirically, so is a conditional, model-based reference value, not an empirically established bound. The baseline takes (), between the within-host reference value and the cohort estimate (); because is re-estimated, refits over the full range change projected 2030 incidence by at most 6% (Section 5.3).
3. Mathematical Analysis
This section investigates the fundamental mathematical properties of the proposed model, including well-posedness, equilibrium stability, bifurcation behavior, and endemic equilibria. The analysis begins by establishing the existence, nonnegativity, and boundedness of solutions, ensuring the biological feasibility of the model.
Theorem 1.
For bounded, piecewise-continuous nonnegative rates and any initial condition in with , system (1) has a unique solution on that remains nonnegative. With , the set is positively invariant and attracts all solutions.
Proof.
The right-hand side is locally Lipschitz on . On each face of , one has (for example, when , and when ), so is positively invariant. Summing the equations gives . Hence, with . By the comparison theorem for scalar differential inequalities (equivalently, Grönwall’s inequality applied to and ),
on the maximal interval of existence. The lower bound gives , so the solution never reaches the singular set and remains bounded. The upper bound gives for every component. A solution that stays in a compact subset of the domain cannot cease to exist in finite time, so the maximal interval is . The upper bound also shows that for all t when and that , which proves invariance and attraction of . □
Let and . The disease-free equilibrium is with and . At , the PrEP coverages are and , and the effective susceptible fraction is
Write , , , , and .
Theorem 2.
Proof.
With infected states , the new-infection and transition matrices at are
F has rank one, so . The first column of is the vector of expected residence times in for a newly infected person: , , , and , the last two following from solving the sub-system. This gives (3). Local stability follows from Theorem 2 of [31]. □
The factor is the infectiousness-weighted mean infectious period and depends only on the care cascade (), whereas depends only on PrEP. This separation yields an explicit elimination threshold.
Corollary 1.
if and only if . For a single-modality program () with , elimination requires the initiation rate
which is feasible only if . For equal efficacy, , so persistence multiplies program efficiency proportionally.
Although the control reproduction number determines the local stability of the disease-free equilibrium, global stability requires further investigation. The following theorem establishes a sufficient condition under which the disease-free equilibrium attracts all biologically feasible solutions.
Theorem 3.
Let . If , then is globally asymptotically stable in Ω.
Proof.
Since , the infected vector satisfies componentwise, where . The matrix is Metzler, and implies [31]. By the comparison principle for cooperative systems [32,33], . The limiting system for is linear with a Hurwitz matrix and has as its unique equilibrium, so convergence follows from the theory of asymptotically autonomous systems [34]. Local stability holds because . □
Because , Theorem 3 is conservative. The gap between and could in principle hide a backward bifurcation, which is known to occur in models with imperfect prophylaxis [35]. The next result rules this out under an explicit condition. Let be the susceptibility weights of , and let
be the expected total time spent infected (the sum of the residence times in the proof of Theorem 2).
Theorem 4.
Take β as the bifurcation parameter, with critical value . The Castillo-Chavez–Song coefficients [36] are
where , and w and v are the right and left null vectors of the Jacobian at , normalized so that and . If
which holds in particular whenever , then and the bifurcation at is forward (transcritical). In the absence of PrEP, unconditionally.
Proof.
At , the infected block of the Jacobian is , and its null vector is with , so and . The left null vector is with , because the susceptible columns of the Jacobian vanish in the infected rows at . The susceptible part solves , where , , and is the PrEP switching generator, whose columns sum to zero. Since is a nonsingular M-matrix with column sums , one has and , using and .
Only has nonzero second derivatives among the infected equations. With , where , one finds at that . Summing against gives (4). The coefficient b follows from .
To bound , note that . Terms with are therefore nonpositive, and the remaining terms are at most . Hence, , and under (5). Without PrEP, and , so the first sum vanishes and . □
Condition (5) has a clear physical interpretation as a balance between two feedbacks near the threshold. Each new infection adds a person who remains in the population for about L years, diluting the force of infection; this stabilizing effect scales with . Infection also depletes the susceptible pool and hence PrEP initiations, lowering the protected share of susceptibles for about years; this destabilizing effect is at most . The bifurcation is forward when dilution outweighs this loss of protection; in particular, it suffices that persons live with HIV longer than they remain at elevated risk (). At the calibrated parameters, years and , so the condition holds with a wide margin. As an independent check, the closed form (4) agrees with a direct symbolic Hessian computation to relative error below , giving and at the calibrated values. Among 5000 parameter sets drawn uniformly from wide ranges (, , , , , , , , , , , , , ), condition (5) held in 99.4% of cases, and in all cases. The condition is therefore sufficient but not necessary.
The preceding analysis characterizes the disease-free equilibrium and the direction of bifurcation at the critical threshold. Attention now turns to endemic equilibria, where the infection persists in the population. The following result establishes their existence and identifies conditions for uniqueness.
Theorem 5.
Endemic equilibria of (1) with constant rates correspond one-to-one to roots of , where
and is the unique positive solution of the linear susceptible equations at constant force of infection λ. The function h is continuous, , and as . Hence, an endemic equilibrium exists whenever . If h is strictly decreasing, the endemic equilibrium is unique for and is the only equilibrium for . Without PrEP, , which is strictly decreasing.
Proof.
At an equilibrium with force of infection , the susceptible equations are linear with M-matrix , so is unique and continuous. The infected equations are linear with source , giving , , and . Substituting into and dividing by gives , and conversely each root defines an equilibrium. At , , so . Since , . Existence follows from the intermediate value theorem. □
Corollary 2.
Fix the parameter values. If h is strictly decreasing on for these values, then no endemic equilibrium exists when , and exactly one exists when .
Proof.
A strictly decreasing h with satisfies for all when . When , h crosses the level one exactly once. The conclusion follows from Theorem 5. □
Proposition 1.
Let and , . If
then h is strictly decreasing on . Hence, is the only equilibrium when , and the endemic equilibrium is unique when .
Proof.
At constant , with , . Thus, and , so it suffices that . Now, with ; terms with are nonpositive, and for the others and , giving . Since , is bounded by the right-hand side of (6). The conclusions follow from Corollary 2. □
The right-hand side of (6) vanishes without PrEP; at the calibrated parameters, it is 0.20 years in 2024 and at most 0.74 years in any scenario in 2030, against –55 years. Across 400 posterior draws, its ratio to L is at most 0.026, and it holds in 98.9% of the random parameter sets above. A general global result under alone is not expected: away from , recruitment replenishes unprotected susceptibles and can raise above , the mechanism behind backward bifurcations in imperfect-prophylaxis models [35]. The analysis thus distinguishes three levels of statement. (i) Proved: is globally asymptotically stable when (Theorem 3); it is locally asymptotically stable when (Theorem 2); no endemic equilibrium bifurcates backward from under (5) (Theorem 4); and an endemic equilibrium exists when (Theorem 5). (ii) Proved under the explicit condition (6), which holds at the calibrated parameters and in all 400 posterior draws examined: is the only equilibrium when (Proposition 1). (iii) Supported numerically but not proved: global attraction of when . In simulations from 50 random initial conditions with the 2030 rates of scenario S4 (, ), and from 200 random parameter sets with , the infected population decayed monotonically towards zero in every case. Accordingly, Corollary 1 is an equilibrium-level elimination condition. It guarantees local stability of and the absence of endemic equilibria near the threshold. Because is unstable when (Theorem 2), is necessary for elimination. Its sufficiency for long-run elimination from arbitrary initial states is established only when (Theorem 3); for , it is supported by the simulations above but not proved. It is not a statement about the time required to reach any incidence level.
4. Data and Calibration
Table 1 lists the 22 national data points used. Incidence and prevalence come from the CDC CD4-depletion model [2,37], whose reported relative standard errors (RSEs) are used as observation errors. Diagnoses come from the National HIV Surveillance System [38], viral suppression from the Healthy People 2030 indicator HIV-05 [3], and annual PrEP users from IQVIA pharmacy data [7,39]. Following the IQVIA definition, model PrEP users in year y are the number on PrEP at the start of y plus initiations during y.
Table 1.
National surveillance data used for calibration (persons aged , 50 states and DC).
Ten parameters are estimated, , where and are the total and undiagnosed numbers of persons with HIV on 1 January 2017. Initial PrEP use is set to its quasi-steady value with . The literature-based parameters are fixed (Table 2). The log-likelihood is the sum of the Gaussian terms in Table 1, and the priors are uniform on wide boxes. The maximum-likelihood estimate (MLE) was obtained by multi-start Nelder–Mead and Powell optimization. The posterior was sampled with the affine-invariant ensemble sampler [40,41] using 32 walkers and 18,000 iterations, discarding 4000 as burn-in and thinning by 10, which gave 44,800 draws with mean acceptance fraction 0.33. Integrated autocorrelation times ranged from 167 to 398 iterations, so the post-burn-in chain is 35 times the longest autocorrelation time. This is below the conservative heuristic of 50 suggested for this sampler [41]. The effective sample size is at least 1126, and a split-chain potential scale reduction factor comparing the two halves of the post-burn-in chain was at most 1.044. These diagnostics are consistent with adequate mixing but do not establish convergence definitively. In particular, the split-chain statistic can miss slow drift common to all walkers. Because the length ratio is below the heuristic, the Monte Carlo error of the reported interval endpoints, especially in the tails, may be larger than the effective sample size suggests. All credible and predictive intervals in this paper should be read with this qualification. The ODEs were integrated with LSODA (relative tolerance ). Practical identifiability was assessed with profile likelihoods [42]. Observation errors of different surveillance streams are assumed independent. This is an approximation, because the CDC incidence, prevalence, and knowledge-of-status estimates derive from the same CD4-based back-calculation [37]. Its influence is assessed by refitting with correlated errors within this block.
Table 2.
Parameters. The Type column distinguishes values taken from the literature (L), modeling assumptions (A), values derived from other quantities (D), and fitted parameters (F). Estimated values are posterior medians with 95% credible intervals (CrI). Rates are per year.
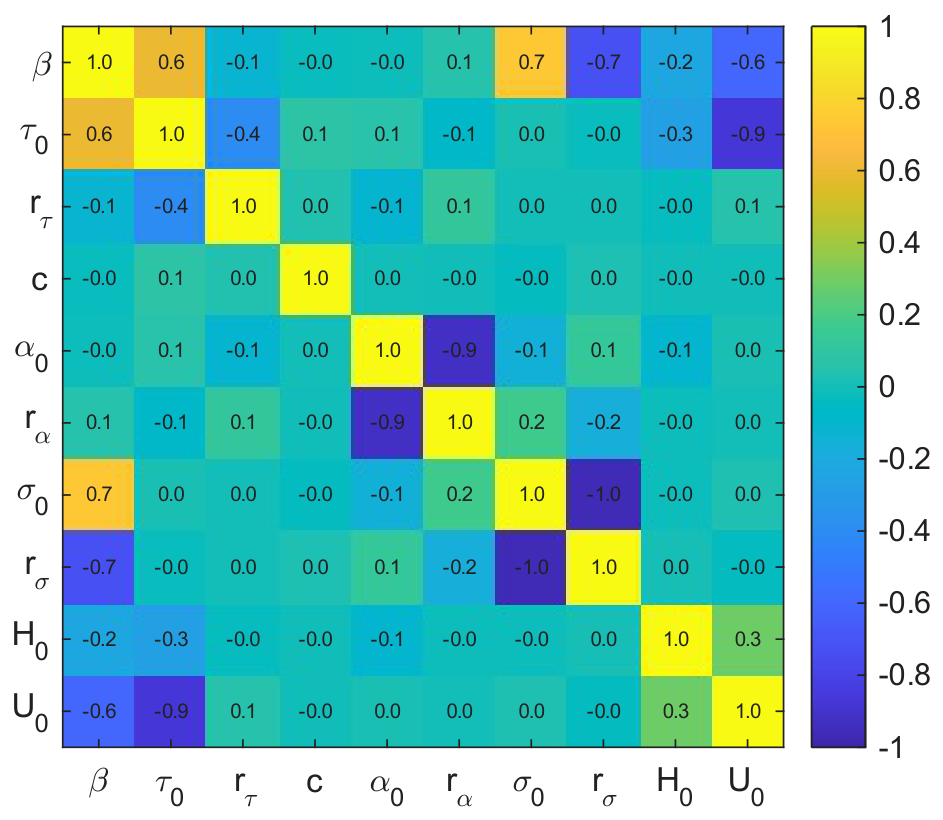
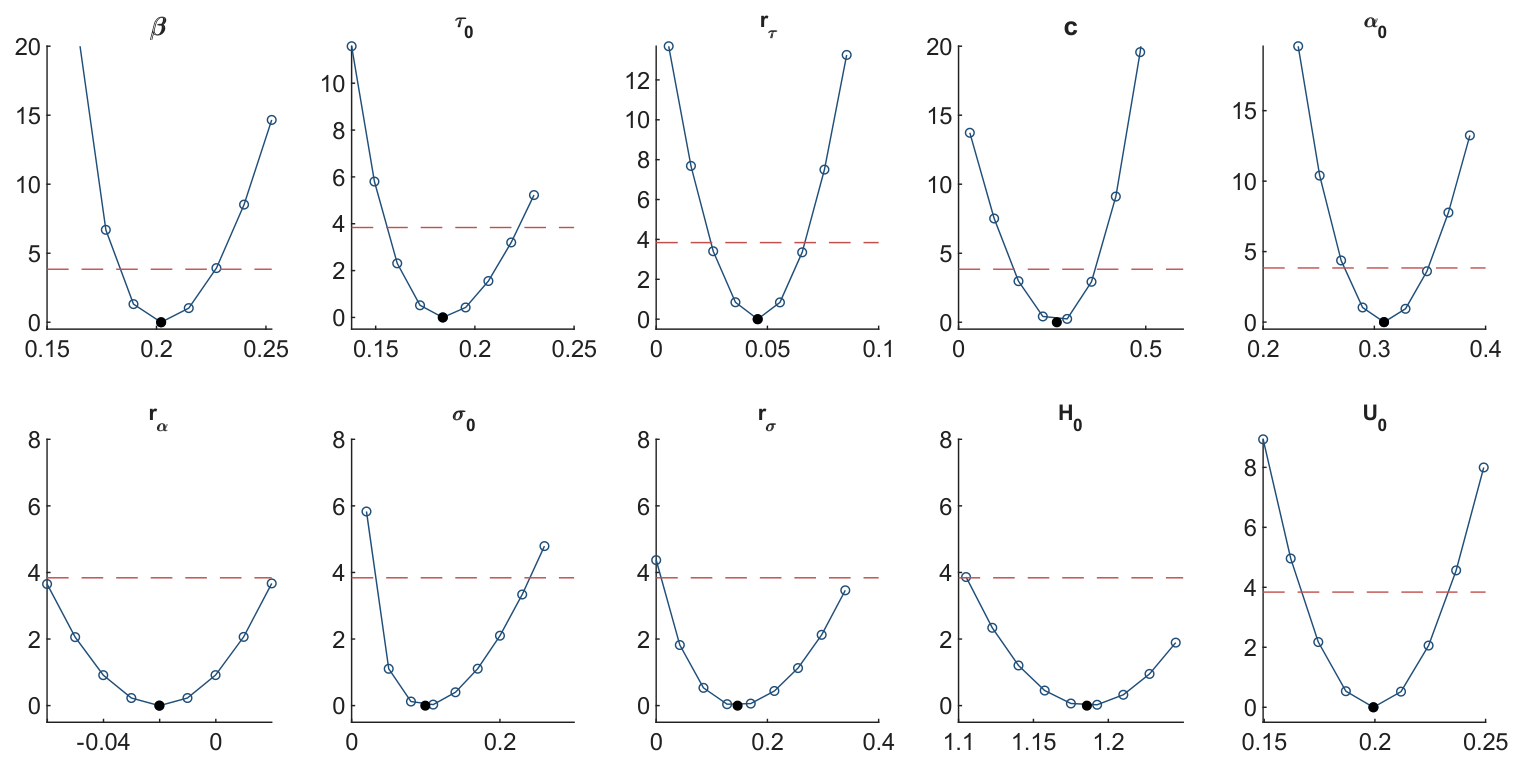
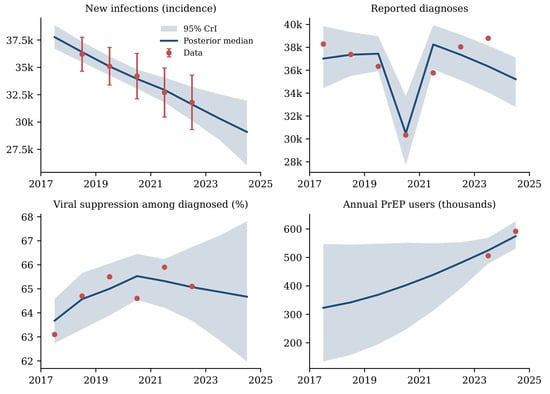
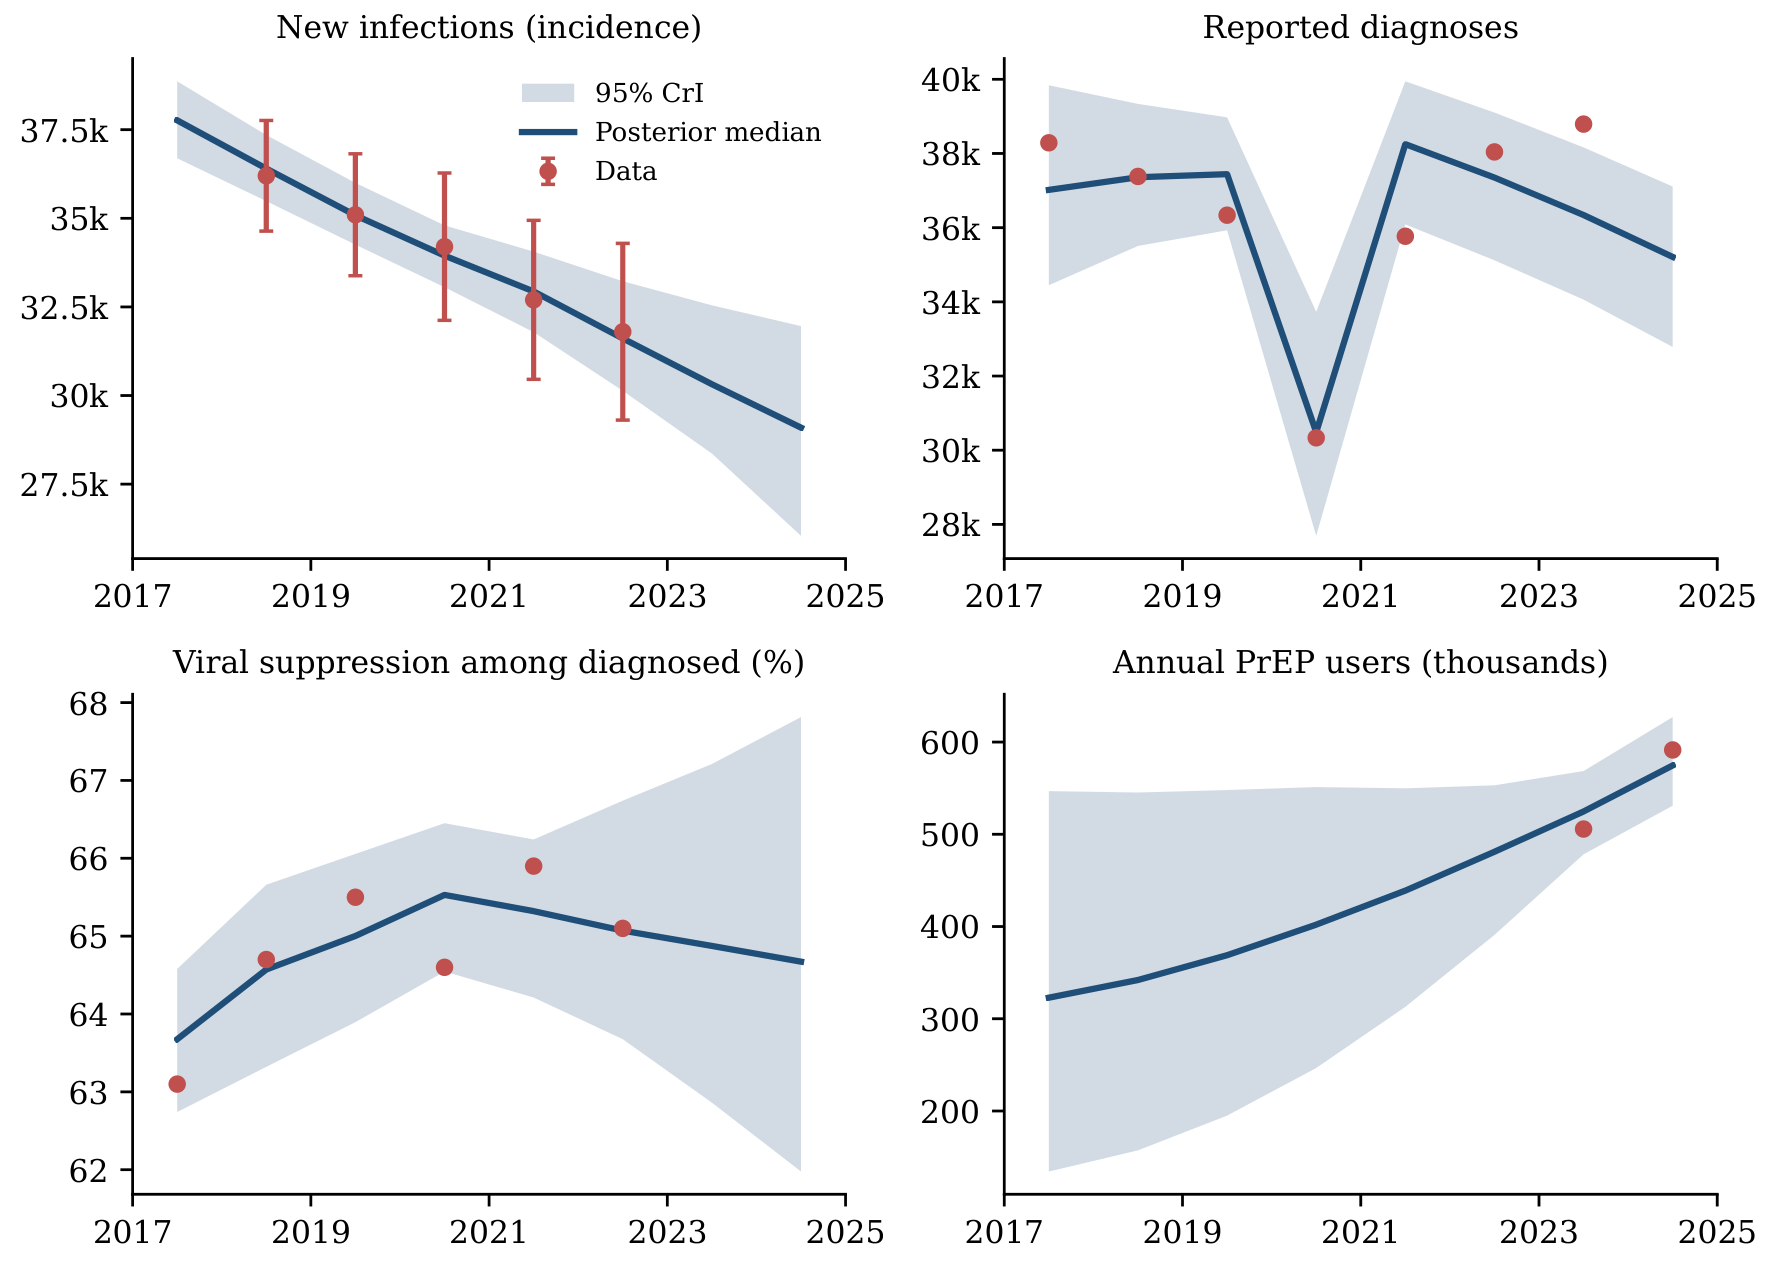
Figure 2 shows that the model reproduces all data streams, including the 2020 diagnosis trough and the 2021–2023 rebound, the plateau in viral suppression, and the growth of PrEP use. The MLE has log-likelihood −3.63 over 22 observations, and independent optimizer starts converged to the same optimum. Eight of the ten profile likelihoods cross the 95% threshold on both sides (Figure A3 in Appendix D). The exceptions are and , which are bounded only from below within their plausible ranges. This is expected, because only two national PrEP-user data points and one prevalence estimate inform them. Their uncertainty is carried into all projections through the posterior. This uncertainty widens the projection intervals but does not alter the scenario ranking, which held in all 400 posterior draws. The standardized residuals at the MLE (Figure A1 in Appendix C) are all within , and none exceed 2 in absolute value. The sum of squared residuals is on degrees of freedom (), indicating no lack of fit and no evidence that the assumed error scales are too small. The strongest posterior correlations (Figure A2) occur between and (), and (), and and (). These correlations reflect compensatory relationships among parameters that influence the same surveillance observations. The two weakly identified parameters differ in their influence on projections. has negligible influence: its Spearman correlation with 2030 incidence is 0.07 under S0 and 0.08 under S2. In contrast, , which sets the PrEP initiation rate at the start of the projection period, is the dominant source of projection uncertainty, with correlations of −0.73 and −0.80. Its uncertainty is propagated through the posterior and accounts for much of the width of the credible intervals in Table 3. Additional years of national PrEP-use data would sharpen the projections most. The fit implies that diagnosis rates increased by 4.5% per year (95% CrI 2.4–6.7%) and that the 2020 disruption reduced testing by 26% (14–36%). In contrast, the suppression rate shows no improvement over the period (; CrI −0.060 to 0.022).
Figure 2.
Model fit to national surveillance data, 2017–2024. Lines show posterior medians and shading shows 95% CrI from 400 posterior draws. Error bars show 95% confidence intervals of CDC incidence estimates.
Table 3.
Projected outcomes (posterior medians and 95% CrI; interval endpoints carry the Monte Carlo caveat of Section 4). Averted infections are relative to S0 over 2025–2030. The last column gives the posterior probability that .
Figure 2 compares the posterior model estimates with national surveillance data for HIV incidence, reported diagnoses, viral suppression, and PrEP use during 2017–2024. The model captures the gradual decline in HIV incidence, the sharp reduction in diagnoses during the 2020 COVID-19 disruption and subsequent recovery, and the stagnation in viral suppression. The observed growth in PrEP use is also reproduced, although the wider credible intervals for earlier years reflect limited historical observations. Overall, the agreement between model estimates and surveillance data supports the model’s ability to reproduce the principal epidemiological trends while highlighting uncertainty in PrEP uptake and selected model parameters.
5. Transmission Dynamics and Intervention Outcomes
5.1. Transmission Thresholds
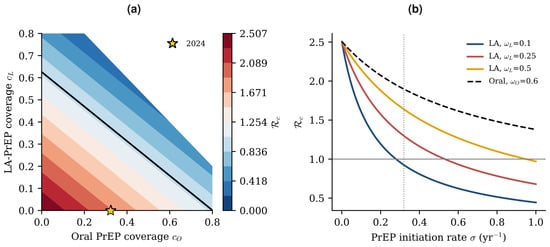
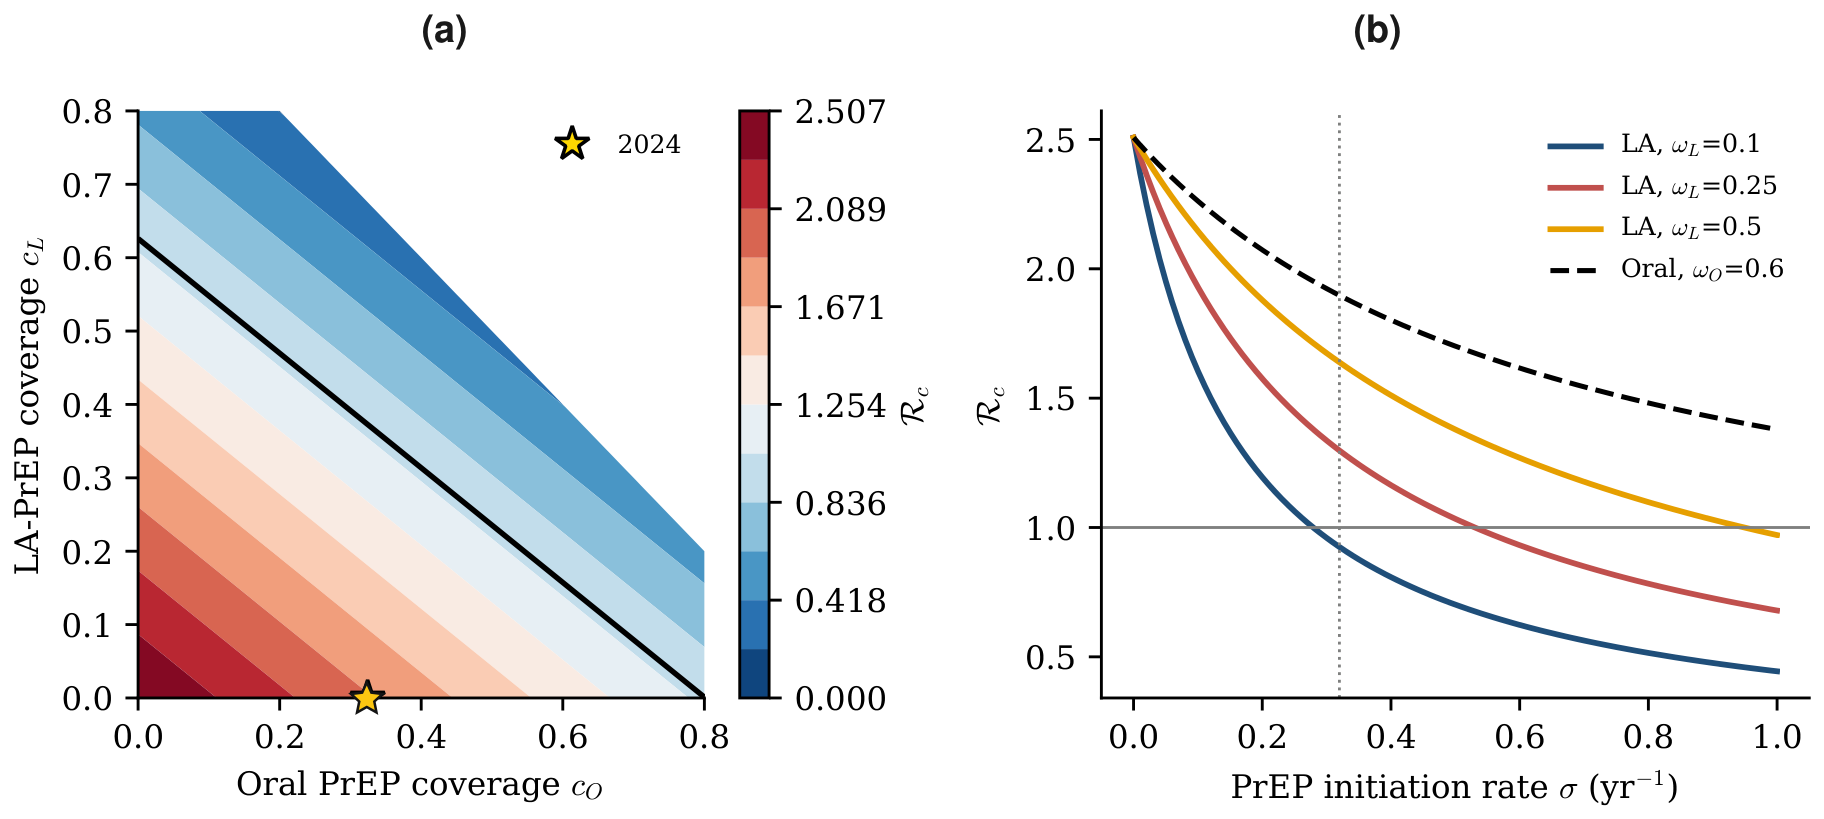
Evaluated with the rates of each year, fell from 2.28 (95% CrI 2.17–2.40) in 2017 to 1.97 (1.68–2.24) in 2024. The transmission potential without PrEP was in 2024, so elimination requires (Corollary 1). In 2024, PrEP coverage of the elevated-risk population was 32%. With all PrEP oral, the critical coverage is , which requires an initiation rate of per year, 8.4 times the 2024 rate . With all PrEP long-acting, and per year, only 1.7 times the 2024 rate. Persistence and efficacy together therefore reduce the initiation effort needed for elimination about fivefold. Figure 3 shows the threshold surface and the strong dependence of on the discontinuation rate .
Figure 3.
(a) as a function of oral and long-acting PrEP coverage at 2024 testing and treatment levels; the black curve is , and the star marks 2024. (b) versus initiation rate for oral PrEP and for long-acting PrEP with different discontinuation rates ; the dotted line marks the 2024 oral initiation rate.
5.2. Projections to 2030
Five scenarios start in 2025 and scale up linearly to full effect in 2030: S0, status quo; S1, oral PrEP initiation doubled; S2, all PrEP initiations shifted to the long-acting formulation; S3, S2 plus doubled initiation; S4, S3 plus 1.5-fold increases in the diagnosis rate and the suppression rate . Linear scale-up is a neutral reference that reaches full effect at the EHE horizon without assuming a particular timing of investment. Under alternative patterns (immediate, front-loaded, back-loaded, or delayed by two years), 2030 incidence under S4 ranged from 7700 to 13,200 (MLE), while the scenario ordering and the long-run plateau were unchanged; faster scale-up yields larger benefits, consistent with the front-loaded optimal strategy (Section 5.5). In S2–S4, the long-acting share applies to new initiations only. A fraction of initiations, rising linearly from 0 in 2025 to its target in 2030, enters , so and . Persons already on oral PrEP are not switched directly. They may start long-acting PrEP after discontinuing, through S, which makes the transition conservative. Table 3 and Figure 4 summarize the results. The credible intervals reflect posterior uncertainty in the fitted parameters conditional on the fixed inputs. Uncertainty in the fixed inputs is examined separately in Section 5.3 and Section 5.4.
Figure 4.
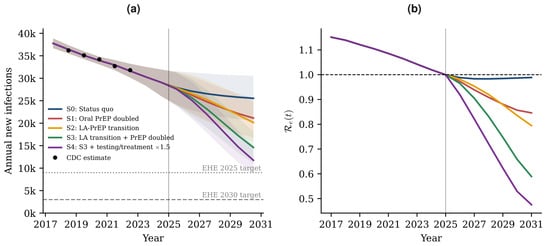
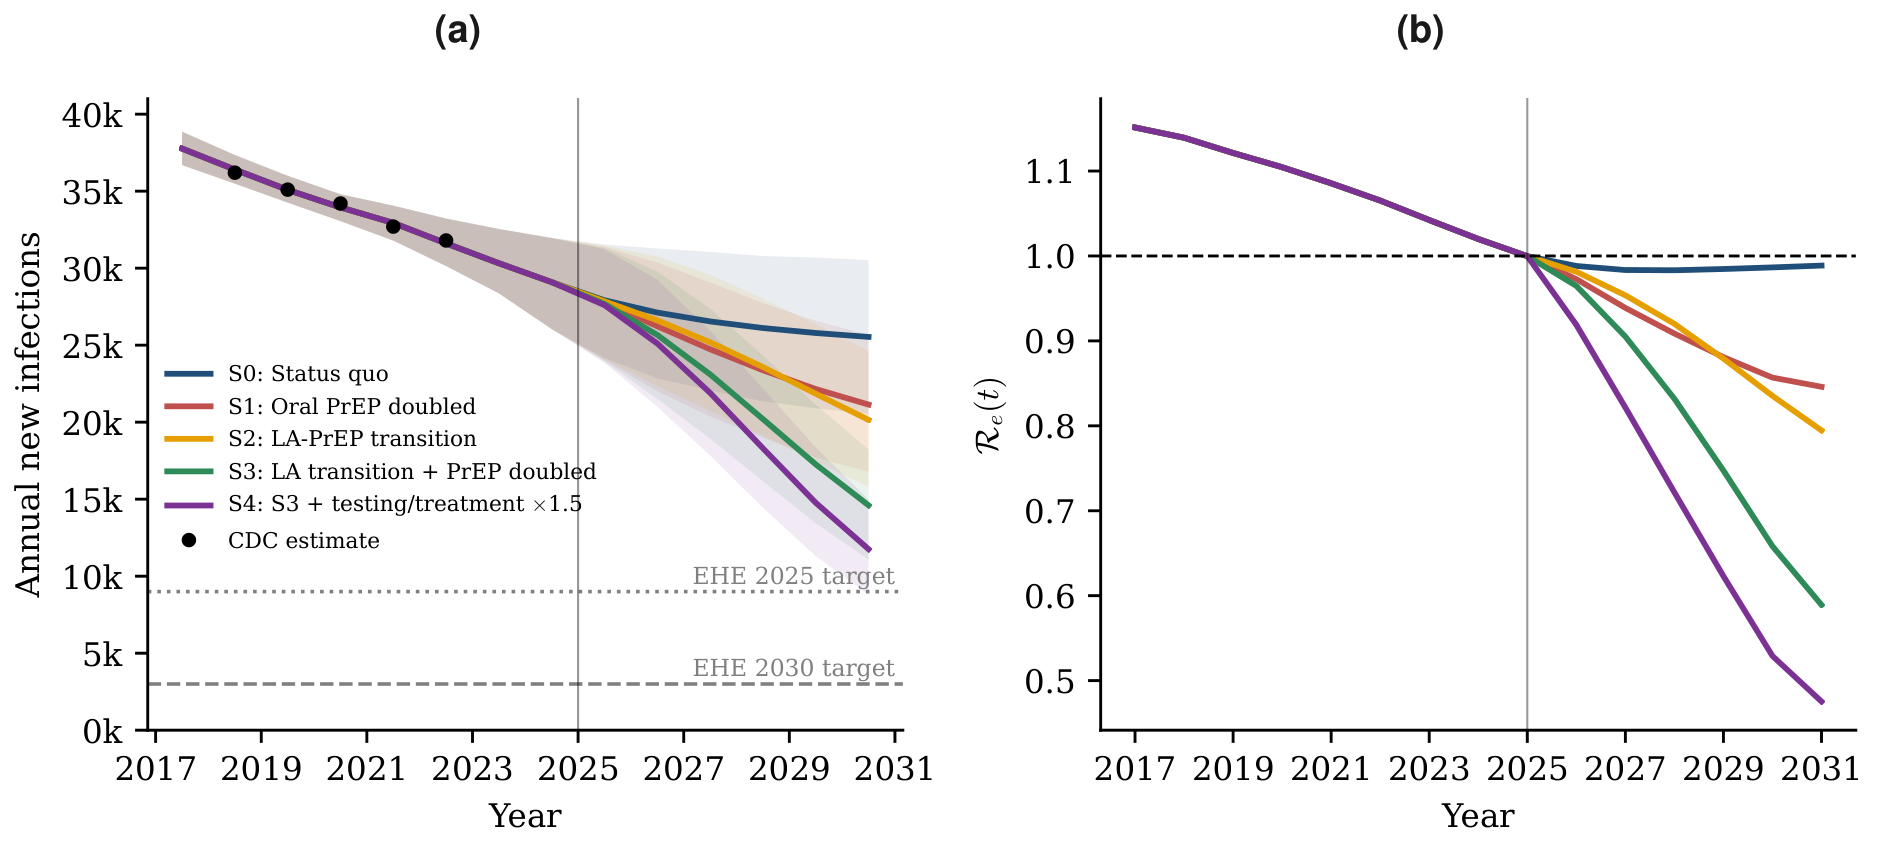
(a) Projected annual infections under scenarios S0–S4 (medians and 95% CrI), with EHE targets. (b) Effective reproduction number .
The fitted effective reproduction number declined from 1.16 in 2017 to 0.99 in 2024 (Figure 4b). Because the growing population of virally suppressed persons dilutes the force of infection, lies below . Under the status quo (S0), remains close to one and incidence approaches an endemic plateau: 25,500 (95% CrI 20,500–30,500) infections in 2030 and about 24,100 per year in the long run. The decline observed during 2017–2024 therefore does not continue on its own.
Shifting all initiations to long-acting PrEP (S2) at the current initiation rate raises coverage from 31% to 42% and averts 13,800 infections during 2025–2030. This matches doubling oral PrEP initiation (S1, 13,600 averted) under the assumed ; Section 5.4 shows that this depends on persistence. The long-term effect of S2 is larger: is 1.36 versus 1.65, and the long-run plateau is 13,200 versus 18,200. Combining the long-acting transition with doubled initiation (S3) brings the median below one (0.95), which is necessary for, and in simulations sufficient for, eventual elimination at the 2030 rates (Section 3). Its 95% CrI (0.75–1.14) spans the threshold, and the posterior probability of is 0.69. When uncertainty in and is also included (Section 5.4), this probability falls to 0.35. S3 should therefore be read as possibly, but not reliably, reaching an elimination trajectory. Only S4 achieves with high probability ( conditional on the baseline long-acting parameters; 0.72 including their uncertainty). Adding 1.5-fold increases in testing and suppression rates (S4) gives 11,800 (8800–15,000) infections in 2030, a 69% reduction from the model’s 2017 level, with .
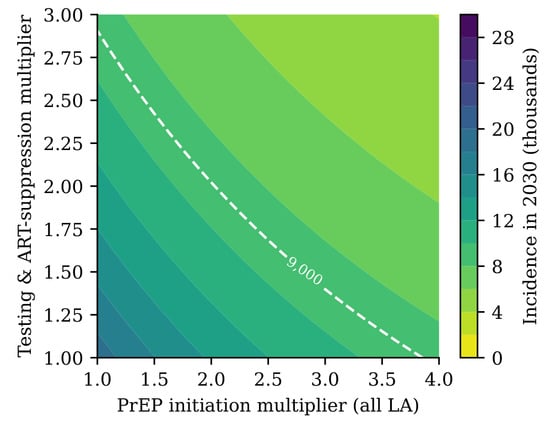
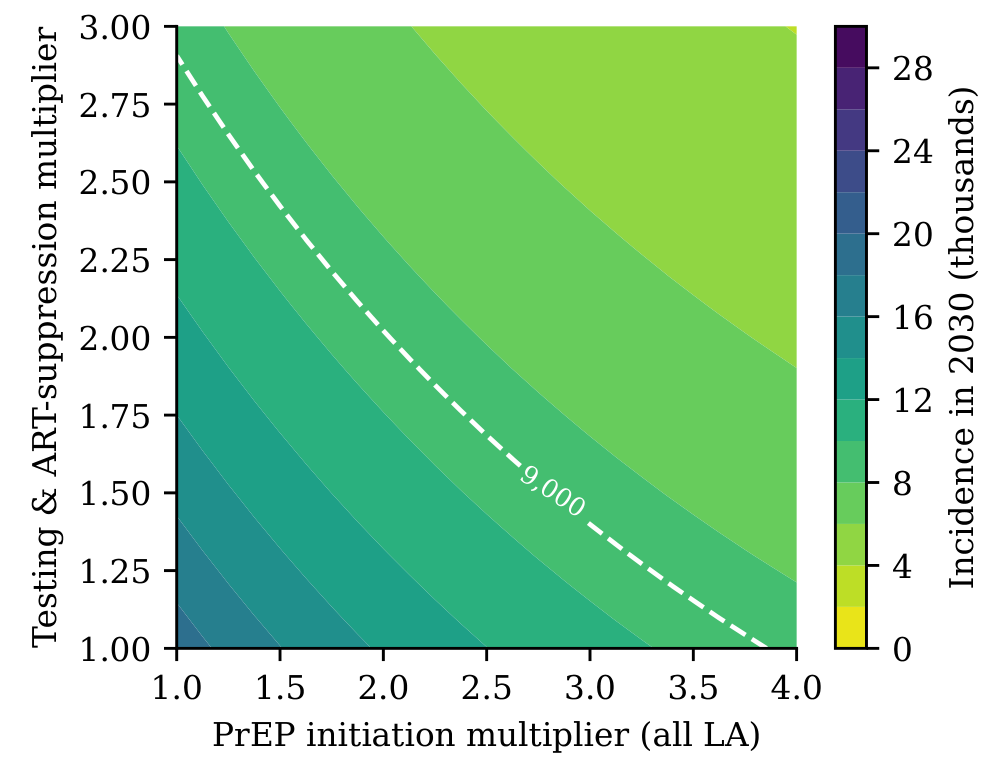
Figure 5 maps 2030 incidence over the PrEP initiation multiplier (all long-acting) and a joint multiplier of the testing and suppression rates. Reaching 9000 requires, for example, a 2.5-fold increase in long-acting PrEP initiation together with a 1.8-fold gain in testing and suppression, or a near-threefold gain in testing and suppression alone. The map shows diminishing returns along the PrEP axis: at baseline testing, raising the long-acting initiation multiplier from 1 to 2, 3, and 4 lowers 2030 incidence by 5400, 3100, and 1900, successively. PrEP coverage saturates, because additional initiations are offset by discontinuation and risk exit (coverage in 2030 rises only from 40% to 72%), and PrEP cannot reduce transmission from persons already infected. Gains in testing and suppression act directly on that pool and remain larger per unit of multiplier (6500 and 4000 for multipliers 2 and 3). No combination within the explored range (up to fourfold PrEP and threefold testing and suppression) reaches 3000 by 2030; the minimum is 4000. Within this model, the reason is structural: even when , incidence decays at a rate limited by the long infectious lifetime of persons who are diagnosed but not suppressed. This group generates 63% of new infections in 2030 under S0 and 70% under S4. Its long infectious lifetime is set by the loss of viral suppression ( per year), the suppression rate , long survival with HIV, and the residual infectiousness : at 2024 rates, a diagnosed person spends on average 18.4 years viremic over about five episodes, and this group accounts for 65% of . Halving (better retention in care) would lower 2030 incidence under S4 from 11,100 to 7800 (MLE). The infeasibility of 3000 by 2030 is specific to the interventions and parameter ranges examined, to linear scale-up by 2030, and to the homogeneous-mixing structure. Interventions beyond this set can reach the target: implementing the maximal combination immediately in 2025 gives 2300 infections in 2030, and halving the loss of viral suppression () together with the maximal combination scaled up linearly gives 2500. Crossing below is necessary for long-run elimination and, in all simulations, sufficient (Section 3). The 2030 incidence level, by contrast, depends on how quickly the existing infectious pool declines.
Figure 5.
Projected incidence in 2030 (MLE) as a function of the long-acting PrEP initiation multiplier and the joint testing and suppression multiplier, both reached linearly by 2030. The white dashed curve marks 9000 infections; no point in the explored range reaches 3000.
5.3. Sensitivity and Robustness
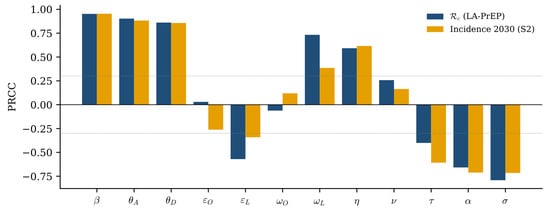
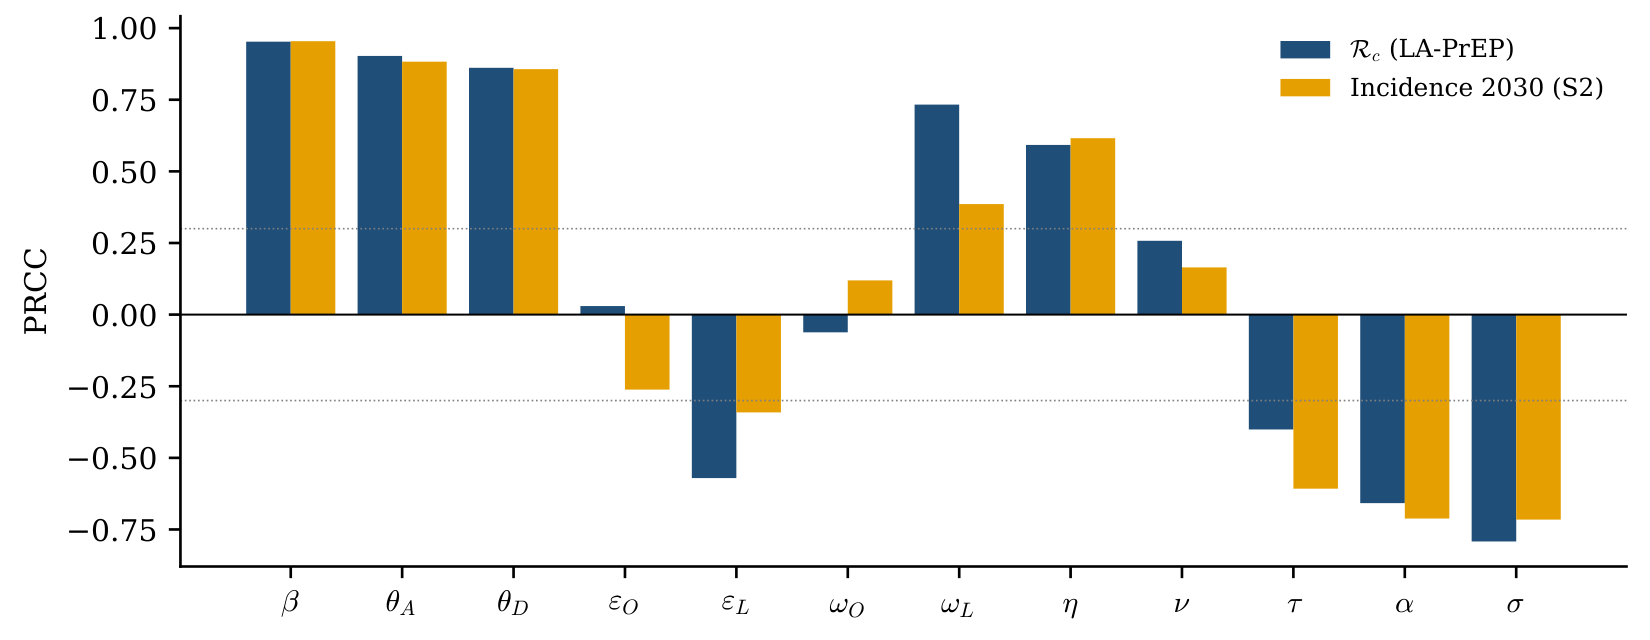
Partial rank correlation coefficients (PRCCs) [43,44] were computed from 1000 Latin hypercube samples. Each parameter was varied around its baseline, except , and . The outcomes were under all-long-acting PrEP and incidence in 2030 under S2 (Figure 6). Incidence in 2030 is most sensitive to the transmission rate and the infectiousness weights (PRCC ), followed by the suppression rate , the PrEP initiation rate , the testing rate (PRCC between and ), and the loss of suppression (0.62). For under long-acting PrEP, the discontinuation rate (0.73) is the most influential program parameter after (), ahead of the efficacy (). Persistence on long-acting PrEP therefore matters more for elimination than marginal gains in efficacy.
Figure 6.
PRCC of (all-long-acting PrEP) and of 2030 incidence under S2. Dotted lines mark .
Because is the least certain epidemiological input, the model was refitted with (the within-host value) and (the cohort estimate). Both refits remained consistent with the data (negative log-likelihoods 3.51 and 4.36, versus 3.63 at baseline). Projected 2030 incidence changed little: under S0 it was 24,500, 24,500, and 25,500 for , and under S4 it was 11,300, 11,100, and 10,500. The calibration re-allocates transmission between stages, so the policy conclusions are robust to the acute-phase uncertainty.
Refitting with only half or a quarter of persons with HIV in the mixing network (, ) gave fits of similar quality (negative log-likelihoods 3.53 and 3.46). Projected 2030 incidence changed by at most 4%. It was 24,200 and 24,000 under S0, 18,900 and 18,600 under S2, and 10,900 and 10,700 under S4, compared with 24,500, 19,200, and 11,100 at baseline (MLE). The value of , however, depends on the mixing structure. With partial mixing, is lower under every scenario (S2: 0.96 and 0.80, versus 1.30; S4: 0.53 and 0.44, versus 0.72), so the elimination thresholds reported under the baseline are conservative. Inflating all observation standard deviations by a common factor leaves the MLE unchanged and only widens credible intervals. To test the independence assumption, the model was instead refitted with a compound-symmetric error correlation of 0.5 among the seven estimates derived from the CDC CD4 back-calculation (incidence, prevalence, and knowledge of status). Parameter estimates changed by less than 1%, except for the jointly informed PrEP parameters and (). Projected 2030 incidence was then 25,000 (S0), 19,700 (S2), and 11,500 (S4), with under S4. The scenario ranking, the status-quo plateau, and the infeasibility of 3000 infections by 2030 are therefore robust to the mixing assumption and the error model. Refits with each of six further fixed parameters (, , , , , ) set to low and high values gave comparable fits; absorbed the perturbation ( to ), whereas projected 2030 incidence changed by at most 8%, and under S4 remained below one (0.56–0.89).
5.4. Persistence of Long-Acting PrEP
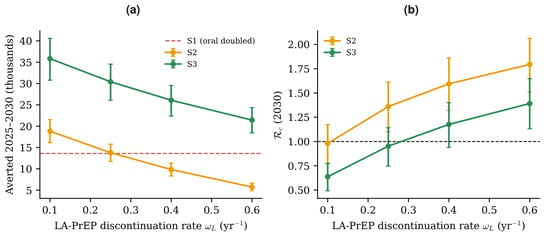
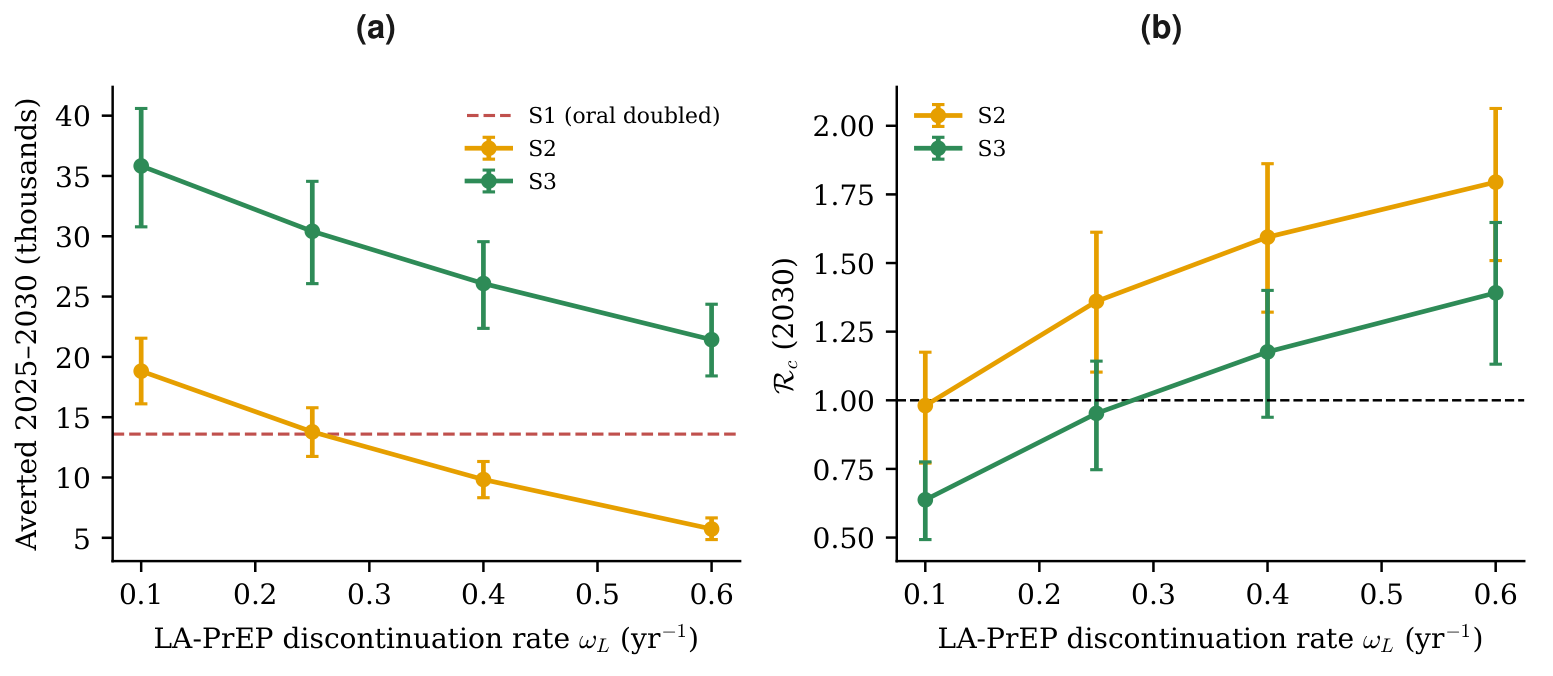
The discontinuation rate is assumed, because U.S. real-world persistence data for lenacapavir are not yet available. The baseline per year (78% one-year persistence) is consistent with lenacapavir trial retention, in which about 91% of PURPOSE 2 participants received their 26-week injection on time [11]; the range examined extends to the oral rate, close to real-world persistence on long-acting cabotegravir [15]. Since and act only after 2025, they do not affect calibration, and their uncertainty can be propagated exactly by combining posterior draws with alternative values. Table 4 and Figure 7 report outcomes for per year, where 0.60 equals the oral rate. The long-acting transition (S2) averts 18,800 infections at and 13,800 at the baseline , comparable to doubled oral PrEP (S1, 13,600). At , it averts 9800, fewer than S1. If persistence is no better than oral (), it averts 5700, reflecting the efficacy gain alone. A transition to long-acting PrEP without additional initiations therefore matches or exceeds a doubling of oral PrEP only if per year, that is, about 78% or more of users still on long-acting PrEP after one year. For S3, the probability that falls from at to at . When and are sampled jointly with the posterior, the 95% predictive interval for 2030 incidence widens to 16,100–26,900 under S2 and 8600–17,100 under S4, with (S3) and 0.72 (S4). Varying alone between 0.89 and 0.999 changes S2 outcomes much less (2030 incidence 19,600–21,100). The comparison between oral and long-acting PrEP is therefore driven by persistence, which should be monitored as lenacapavir is rolled out. Increasing initiations (S3) is beneficial at every examined. Taken together, the sensitivity analyses show that the status-quo plateau, the benefit of increased initiation (S3), the need to combine PrEP with gains in testing and suppression (S4), and the front-loaded optimal strategy are robust to posterior uncertainty, refitting, scale-up timing, and the full ranges of and . Efficacy has little influence within its trial range, whereas persistence determines whether a long-acting transition alone matches doubled oral PrEP.
Table 4.
Sensitivity of long-acting PrEP scenarios to the discontinuation rate (posterior medians and 95% CrI; averted infections relative to S0 over 2025–2030).
Figure 7.
Effect of the long-acting PrEP discontinuation rate on (a) infections averted during 2025–2030 relative to S0 and (b) in 2030 (medians and 95% CrI). The dashed line in (a) is doubled oral PrEP (S1).
5.5. Optimal Control
Two controls are added for (calendar years 2025–2030, matching Table 3): , additional long-acting PrEP initiation (added to ), and , additional testing (added to ), with . Both controls are per-capita rates (): is the number of additional long-acting initiations per year, and is the number of additional diagnoses per year. The bound is about 1.6 times the 2024 oral initiation rate and twice the 2024 diagnosis rate, a generous upper limit on program expansion. The objective is to minimize
which weighs new infections against quadratic implementation costs. Baseline rates are frozen at their values at , exactly as in scenario S0, evaluated at the MLE. The weights have units of infections·yr, so each cost term is expressed in infection-equivalents per year. For example, with , a sustained (about 140,000 additional initiations per year) is valued at 4000 infections averted per year. The quadratic form represents increasing marginal cost of expansion. Time-dependent control functions are widely used to compare interventions in transmission models [45], and quadratic costs are standard in epidemic optimal control [46]; they make the Hamiltonian strictly convex in the controls and yield the smooth interior characterization in Theorem 6. Alternative formulations involving linear intervention costs or explicit budget constraints may yield different optimal-control structures, including bang–bang solutions under suitable conditions. A rigorous investigation of these alternatives is beyond the scope of the present study. Because costs are not monetized, the weights are varied over a 16-fold range of ratios and a 4-fold range of scales (Table 5). The baseline weights were chosen so that the optimal intensities are of the same order as current program rates. The ratio influences the relative allocation between the two controls, while the absolute magnitudes of the weights also affect intervention intensities and outcomes. Thus, Table 5 illustrates the sensitivity of the optimal strategies to both relative and absolute intervention costs.
Table 5.
Optimal control under alternative cost weights and bounds (MLE; 2025–2030). Extra LA initiations is and extra diagnoses is .
Theorem 6.
An optimal pair exists. With adjoint variables satisfying (A1) in Appendix A and ,
Proof.
Existence follows from Fleming and Rishel [47]. The control set is closed and convex, the state equations are linear in u, solutions are bounded (Theorem 1), and the integrand is convex in u and bounded below by . The characterization (7) follows from Pontryagin’s principle [48]: and , projected onto the admissible interval [46]. □
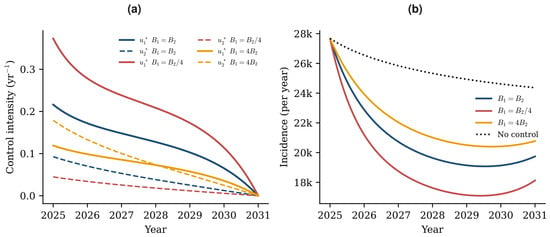
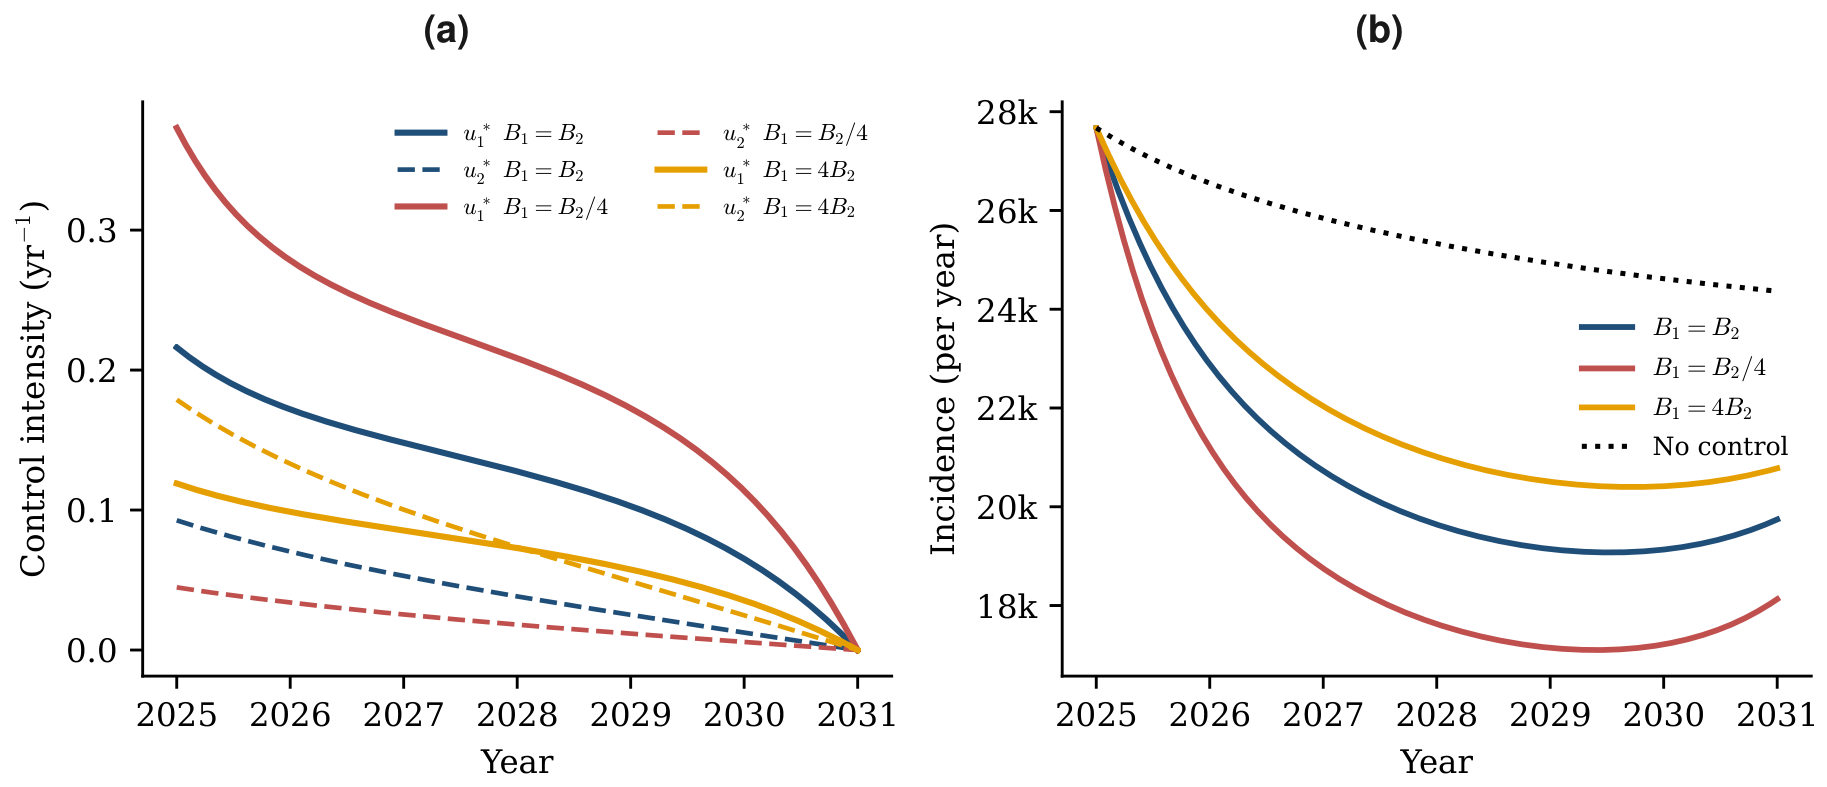
The optimality system was solved by a forward–backward sweep with fourth-order Runge–Kutta (1200 steps) and relaxation [46]. The symbolic adjoint was verified against (A1) to machine precision. The sweep was stopped when the relative change in both controls fell below , which took 12–13 iterations in all cases. Doubling the mesh to 2400 steps changed J by a relative . With the control system is identical to scenario S0 at the same parameter point (the MLE), with the same rates, initial state at , and calendar-time convention. Numerically, the uncontrolled trajectory (RK4, 1200 steps) and S0 (LSODA) agree to a relative difference of in both cumulative 2025–2030 infections and 2030 incidence. The uncontrolled baseline therefore gives 153,200 infections in 2025–2030 and 24,500 in 2030. These are slightly below the posterior medians in Table 3 (25,500 in 2030) because the median of a nonlinear functional over the posterior differs from its value at the MLE. Figure 8 shows the result. With equal cost weights (), both controls are front-loaded and decline to zero at , as the transversality condition requires. Long-acting PrEP initiation starts at 0.22 per year, about two-thirds of the 2024 oral rate, and testing intensification starts at 0.093 per year. The optimal strategy averts 28,600 of the 153,200 infections expected over 2025–2030 and lowers 2030 incidence from 24,500 to 19,400, using about 528,800 additional long-acting initiations and 24,500 additional diagnoses over the horizon. When PrEP delivery is relatively cheaper (), the optimum shifts towards long-acting PrEP and averts 39,400 infections; when testing is cheaper (), testing intensification dominates and 21,500 infections are averted. Halving or doubling both weights changes the number averted to 41,600 and 18,100, respectively. The bounds were never active, so results are identical for and . Solving the problem for 40 posterior draws, five perturbed initial states in 2025 and the alternative cost ratios gave the same qualitative result in every case: both controls were front-loaded, the bounds were never active, and the optimal strategy averted 16–22% of infections over 2025–2030. Front-loading is optimal because each early infection averted also prevents its onward transmission. The qualitative conclusions (front-loading, and a mix that shifts with ) hold across all weights examined, whereas the absolute numbers averted scale with the assumed costs.
Figure 8.
Optimal control, 2025–2030 (). (a) Optimal long-acting PrEP initiation and testing intensification for three cost ratios. (b) Incidence without control and under optimal control.
6. Discussion
This study integrates mathematical analysis with national HIV surveillance data to evaluate the potential of long-acting PrEP in advancing the U.S. Ending the HIV Epidemic (EHE) initiative. The findings highlight the importance of PrEP persistence, its interaction with the HIV care continuum, and the distinction between reducing transmission below the epidemic threshold and achieving a specified incidence target.
The calibrated model indicates that the historical decline in HIV incidence is approaching an endemic plateau rather than continuing indefinitely. Although the effective reproduction number declined to approximately one by 2024, the status-quo scenario projects nearly 24,100 annual infections in the long run. This persistence of transmission coincides with limited progress in viral suppression, as the fitted suppression rate showed no significant improvement during 2017–2024, consistent with national surveillance [3]. These findings suggest that continued PrEP expansion without corresponding improvements in the HIV care continuum may be insufficient to sustain substantial reductions in incidence.
A central finding is the influence of PrEP persistence on transmission control. The factorization separates the contributions of the HIV care continuum and preventive protection. The critical-coverage condition in Corollary 1 demonstrates that, for equal efficacy, the initiation rate required to cross the transmission threshold scales with the sum of the discontinuation and risk-exit rates. Under the assumed discontinuation rates and per year, long-acting PrEP requires approximately 2.1 times fewer initiations than oral PrEP of equal efficacy. Consistent with this analytical result, transitioning new initiations to long-acting PrEP (S2) averts approximately as many infections as doubling oral PrEP initiation (S1), despite maintaining the original initiation rate. However, this advantage depends critically on persistence: the comparative benefit diminishes when exceeds approximately per year (Section 5.4). The global sensitivity analysis further identifies discontinuation as a major determinant of , emphasizing that sustained protection may be as important as expanding PrEP initiation.
The intervention projections also demonstrate the complementarity of prevention, diagnosis, and viral suppression. Increasing PrEP coverage reduces susceptibility, whereas improvements in diagnosis and treatment reduce the infectiousness-weighted duration of infection. This is consistent with existing estimates of transmission across the HIV care continuum [25]. Combining long-acting PrEP expansion with intensified testing and viral suppression (S4) reduces projected annual incidence to 11,800 in 2030 and yields a median control reproduction number of . Although the posterior probability of exceeds under the baseline long-acting PrEP assumptions, it decreases to when uncertainty in efficacy and persistence is included. Importantly, none of the examined interventions achieve the EHE target of 3000 annual infections by 2030. This distinction underscores that crossing the reproduction-number threshold does not guarantee rapid epidemic decline, particularly when a substantial infectious population persists.
The optimal control analysis provides additional insight into the timing and allocation of interventions. The resulting strategies favor early intensification of long-acting PrEP initiation and HIV testing, followed by gradual reductions in intervention intensity. This front-loaded allocation reflects the cumulative benefit of preventing infections early, thereby reducing subsequent transmission. The relative contributions of PrEP and testing depend on their assumed implementation costs, suggesting that intervention priorities should account for both epidemiological effectiveness and resource constraints. Because the cost weights are expressed in infection-equivalents rather than monetary units, these findings characterize optimal intervention patterns rather than directly prescribing budget allocations. Front-loaded investment is, however, in tension with how public health resources are typically allocated, since annual appropriations, procurement, and workforce expansion tend to produce gradual scale-up; optimal controls with budget or rate-of-change constraints that reflect these institutional realities are a natural extension.
The present framework extends existing HIV modeling approaches by integrating persistence-dependent PrEP dynamics, analytical transmission thresholds, national surveillance calibration, and optimal control. While the findings are qualitatively consistent with recent static-cohort projections of lenacapavir [22], the dynamic formulation additionally captures indirect effects arising from onward transmission. The within-host analysis also highlights an important modeling consideration: plasma viral dynamics alone yield a relative acute-stage infectiousness of approximately , substantially below some cohort-based estimates. This discrepancy suggests that additional biological and behavioral mechanisms, including genital-tract shedding and partner dynamics, are needed when translating within-host viral dynamics into population-level infectiousness. Nevertheless, the refitting analysis indicates that the main intervention conclusions remain robust across the examined range of acute-stage infectiousness. These results have direct implications for national planning: without new gains, incidence levels off near 24,000 infections per year; one-year persistence, with a threshold of about 78%, should be a primary metric of long-acting PrEP rollout; sustained viral suppression is the binding constraint for the 2030 target; and early investment yields the largest returns. Among the analytical results, well-posedness, , the critical coverage, global stability for , the forward bifurcation, and the uniqueness of the endemic equilibrium are proved, the last two under explicit conditions verified at the calibrated parameters; global convergence for and the projections are numerical (Section 3).
7. Conclusions
A surveillance-calibrated transmission model with rigorous threshold analysis indicates that, under current conditions, U.S. HIV incidence is approaching an endemic plateau rather than continuing to decline. Twice-yearly long-acting PrEP can lower that plateau substantially, mainly by improving persistence. Even when combined with substantial improvements in diagnosis and viral suppression, the long-acting PrEP strategies examined do not achieve the 2030 EHE target. The explicit critical-coverage condition and the optimal control solution provide quantitative targets for national HIV prevention planning.
The projections should be read as a national baseline. They are conservative in two respects: current oral PrEP users are not switched directly to long-acting PrEP, and full participation of persons with HIV in the risk network yields higher than partial participation (Section 5.3). The model assumes homogeneous mixing within the national elevated-risk population and therefore does not explicitly capture geographic, racial, ethnic, or age-related heterogeneity in HIV transmission and PrEP access [2,13]. Although alternative mixing assumptions yield qualitatively similar projections, more detailed population stratification could alter intervention requirements. The PrEP-indicated population is based on a fixed historical estimate, while real-world persistence on long-acting lenacapavir remains insufficiently characterized. Moreover, PrEP initiation trends are informed by only two national observations, contributing to uncertainty in long-term projections. Several surveillance estimates also share underlying data sources, introducing potential correlations in observational errors. Finally, the intervention scenarios exclude funding disruptions, treatment costs, and heterogeneous program implementation. Stratified sub-population or network models are urgently needed to evaluate equity-focused intervention allocations; future extensions should also incorporate updated PrEP persistence data and explicit cost-effectiveness analysis.
Author Contributions
Conceptualization, M.M.K., and M.J.U.; Methodology, M.M.K., M.J.U., A.A., I.M.A., and M.A.; Software, M.M.K., M.J.U., and I.M.A.; Validation, M.J.U., A.A., and M.A.; Formal analysis, M.M.K., M.J.U., A.A., I.M.A., and M.A.; Investigation, M.M.K., A.A., I.M.A., and M.A.; Resources, M.M.K., and A.A.; Data curation, M.A.; Writing—original draft, M.M.K., M.J.U., A.A., I.M.A., and M.A.; Writing—review and editing, M.M.K., M.J.U., and I.M.A.; Visualization, M.M.K.; Supervision, M.J.U.; Funding acquisition, I.M.A. All authors have read and agreed to the published version of the manuscript.
Funding
This research work was funded by Umm Al-Qura University, Saudi Arabia under grant number: 26UQU4340243GSSR08.
Data Availability Statement
The aggregate data analyzed in this study are publicly available from the CDC (https://www.cdc.gov/hiv-data/) (accessed on 12 November 2026), Healthy People 2030 (https://health.gov/healthypeople) (accessed on 12 November 2026), JAMA (https://doi.org/10.1001/jama.2024.21493) (accessed on 12 November 2026), and AIDSVu (https://aidsvu.org/) (accessed on 12 November 2026). PrEP user counts are the published IQVIA-based estimates reported in JAMA and AIDSVu.
Declaration of Generative AI Use
ChatGPT (OpenAI, GPT-6) was used to assist with language editing and improving the clarity and readability of the manuscript. The authors reviewed and approved the final content.
Acknowledgments
The authors extend their appreciation to Umm Al-Qura University, Saudi Arabia for funding this research work through grant number: 26UQU4340243GSSR08.
Conflicts of Interest
The authors declare no conflicts of interest.
Appendix A. Adjoint System
Let and let be the vector of infectiousness weights. The Hamiltonian is , and gives
with .
Appendix B. Initial Conditions
All compartments on 1 January 2017 are constructed from the fitted , and fixed quantities as follows: , , , (2017 incidence times mean acute duration), , and the diagnosed population split as and with , the suppressed fraction at the end of 2016 implied by the 2017 surveillance value. Table A1 lists the values at the MLE. The implied total is . The implied knowledge of status, , is lower than CDC estimates for that period [2]. Because only the 2022 value (87.2%) enters the likelihood, the fit can trade a larger initial undiagnosed pool against a lower initial diagnosis rate; this is the strong posterior correlation between and (Figure A2). The 2022 value and all diagnosis data are matched (Figure 2 and Figure A1).
Table A1.
Initial conditions on 1 January 2017 at the MLE.
Appendix C. Goodness-of-Fit and Posterior Diagnostics
Figure A1.
Standardized residuals at the MLE for all 22 observations. Dotted lines mark .
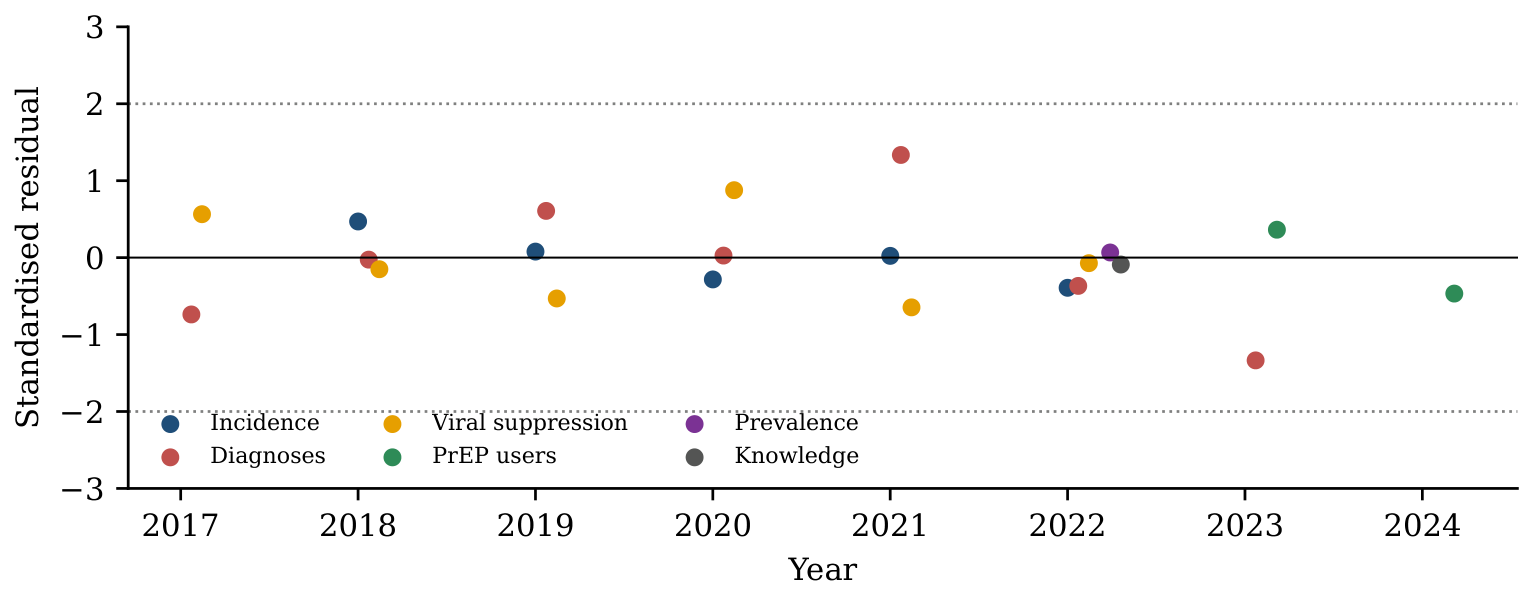
Figure A2.
Posterior correlation matrix of the ten fitted parameters.
Appendix D. Profile Likelihoods
Figure A3.
Profile likelihoods for the ten estimated parameters. The dashed line is the 95% threshold (3.84); the dot marks the MLE.
References
- Fauci, A.S.; Redfield, R.R.; Sigounas, G.; Weahkee, M.D.; Giroir, P.B. Ending the HIV epidemic: A plan for the United States. JAMA 2019, 321, 844–845. [Google Scholar] [PubMed]
- Centers for Disease Control and Prevention. Estimated HIV Incidence and Prevalence in the United States, 2018–2022; HIV Surveillance Supplemental Report, Number 1; CDC: Atlanta, GA, USA, 2024; Volume 29. Available online: https://stacks.cdc.gov/view/cdc/156513 (accessed on 12 November 2026).
- Office of Disease Prevention and Health Promotion. Healthy People 2030, Objective HIV-05: Increase Viral Suppression. 2026. Available online: https://health.gov/healthypeople (accessed on 24 October 2026).
- Cohen, M.S.; Chen, Y.Q.; McCauley, M.; Gamble, T.; Hosseinipour, M.C.; Kumarasamy, N.; Hakim, J.G.; Kumwenda, J.; Grinsztejn, B.; Pilotto, J.H.S.; et al. Prevention of HIV-1 infection with early antiretroviral therapy. N. Engl. J. Med. 2011, 365, 493–505. [Google Scholar] [CrossRef] [Scilit] [PubMed]
- Rodger, A.J.; Cambiano, V.; Bruun, T.; Vernazza, P.; Collins, S.; van Lunzen, J.; Corbelli, G.M.; Estrada, V.; Geretti, A.M.; Beloukas, A.; et al. Sexual activity without condoms and risk of HIV transmission in serodifferent couples when the HIV-positive partner is using suppressive antiretroviral therapy. JAMA 2016, 316, 171–181. [Google Scholar] [CrossRef] [Scilit] [PubMed]
- Grant, R.M.; Lama, J.R.; Anderson, P.L.; McMahan, V.; Liu, A.Y.; Vargas, L.; Goicochea, P.; Casapía, M.; Guanira-Carranza, J.V.; Ramirez-Cardich, M.E.; et al. Preexposure chemoprophylaxis for HIV prevention in men who have sex with men. N. Engl. J. Med. 2010, 363, 2587–2599. [Google Scholar] [CrossRef] [Scilit] [PubMed]
- Mann, L.M.; Zhu, W.; Huang, Y.-L.A.; Kourtis, A.P.; Fanfair, R.N.; Hoover, K.W. Trends in oral and injectable HIV preexposure prophylaxis prescriptions in the US, 2013–2023. JAMA 2024, 332, 1580–1583. [Google Scholar] [CrossRef] [Scilit] [PubMed]
- Coy, K.C.; Hazen, R.J.; Kirkham, H.S.; Delpino, A.; Siegler, A.J. Persistence on HIV preexposure prophylaxis medication over a 2-year period among a national sample of 7148 PrEP users, United States, 2015 to 2017. J. Int. Aids Soc. 2019, 22, e25252. [Google Scholar] [CrossRef] [Scilit] [PubMed]
- Landovitz, R.J.; Donnell, D.; Clement, M.E.; Hanscom, B.; Cottle, L.; Coelho, L.; Cabello, R.; Chariyalertsak, S.; Dunne, E.F.; Frank, I.; et al. Cabotegravir for HIV prevention in cisgender men and transgender women. N. Engl. J. Med. 2021, 385, 595–608. [Google Scholar] [CrossRef] [Scilit] [PubMed]
- Bekker, L.G.; Das, M.; Abdool Karim, Q.; Ahmed, K.; Batting, J.; Brumskine, W.; Gill, K.; Harkoo, I.; Jaggernath, M.; Kigozi, G.; et al. Twice-yearly lenacapavir or daily F/TAF for HIV prevention in cisgender women. N. Engl. J. Med. 2024, 391, 1179–1192. [Google Scholar] [CrossRef] [Scilit] [PubMed]
- Kelley, C.F.; Acevedo-Quiñones, M.; Agwu, A.L.; Avihingsanon, A.; Benson, P.; Blumenthal, J.; Brinson, C.; Brites, C.; Cahn, P.; Cantos, V.D.; et al. Twice-yearly lenacapavir for HIV prevention in men and gender-diverse persons. N. Engl. J. Med. 2025, 392, 1261–1276. [Google Scholar] [CrossRef] [Scilit] [PubMed]
- Gilead Sciences. Yeztugo (Lenacapavir) Is Now the First and Only FDA-Approved HIV Prevention Option Offering 6 Months of Protection [Press Release]; Gilead Sciences: Foster City, CA, USA, 2025. [Google Scholar]
- Managed Healthcare Executive. Lenacapavir Made Up 1% of U.S. PrEP Use in the First Six Months, Study Finds (AIDS 2026); Managed Healthcare Executive: Cranbury, NJ, USA, 2026. [Google Scholar]
- KFF. Access Uncertain for New Injectable PrEP as the Affordable Care Act’s (ACA) Open Enrollment Begins. Available online: https://www.kff.org/hiv-aids/access-uncertain-for-new-injectable-prep-as-the-affordable-care-acts-aca-open-enrollment-begins/ (accessed on 18 November 2025).
- Koh, S.H.E.; Huang, W.; Hall, E.W.; Jones, J.; Zang, X.; Yarbrough, C.R.; Corbin-Gutierrez, E.E.; Sullivan, P.S.; Siegler, A.J. Long-Acting Injectable Cabotegravir Use and Persistence Over 2 Years. JAMA Netw. Open 2026, 9, e2620699. [Google Scholar] [CrossRef] [Scilit] [PubMed]
- Ho, D.D.; Neumann, A.U.; Perelson, A.S.; Chen, W.; Leonard, J.M.; Markowitz, M. Rapid turnover of plasma virions and CD4 lymphocytes in HIV-1 infection. Nature 1995, 373, 123–126. [Google Scholar] [CrossRef] [Scilit] [PubMed]
- Perelson, A.S.; Neumann, A.U.; Markowitz, M.; Leonard, J.M.; Ho, D.D. HIV-1 dynamics in vivo: Virion clearance rate, infected cell life-span, and viral generation time. Science 1996, 271, 1582–1586. [Google Scholar] [CrossRef] [Scilit] [PubMed]
- Perelson, A.S.; Nelson, P.W. Mathematical analysis of HIV-1 dynamics in vivo. SIAM Rev. 1999, 41, 3–44. [Google Scholar] [CrossRef] [Scilit]
- Stafford, M.A.; Corey, L.; Cao, Y.; Daar, E.S.; Ho, D.D.; Perelson, A.S. Modeling plasma virus concentration during primary HIV infection. J. Theor. Biol. 2000, 203, 285–301. [Google Scholar] [CrossRef] [Scilit] [PubMed]
- Granich, R.M.; Gilks, C.F.; Dye, C.; De Cock, K.M.; Williams, B.G. Universal voluntary HIV testing with immediate antiretroviral therapy as a strategy for elimination of HIV transmission: A mathematical model. Lancet 2009, 373, 48–57. [Google Scholar] [CrossRef] [Scilit] [PubMed]
- Jenness, S.M.; Goodreau, S.M.; Rosenberg, E.; Beylerian, E.N.; Hoover, K.W.; Smith, D.K.; Sullivan, P. Impact of the Centers for Disease Control’s HIV preexposure prophylaxis guidelines for men who have sex with men in the United States. J. Infect. Dis. 2016, 214, 1800–1807. [Google Scholar] [CrossRef] [Scilit] [PubMed]
- Moore, M.; Lee, S.; Matrajt, L.; Stansfield, S.E.; Tao, L.; Yang, J.; Mezzio, D.; Jarrett, J.; Coaquira Castro, J.; Hsiao, A.; et al. Modelling the 5-year impact of twice-yearly injectable lenacapavir for HIV pre-exposure prophylaxis in the United States. J. Int. AIDS Soc. 2026, 29, e70188. [Google Scholar] [CrossRef] [Scilit] [PubMed]
- Smith, D.K.; Van Handel, M.; Wolitski, R.J.; Stryker, J.E.; Hall, H.I.; Prejean, J.; Koenig, L.J.; Valleroy, L.A. Vital signs: Estimated percentages and numbers of adults with indications for preexposure prophylaxis to prevent HIV acquisition—United States, 2015. Morb. Mortal. Wkly. Rep. 2015, 64, 1291–1295. [Google Scholar] [CrossRef] [Scilit] [PubMed]
- Marks, G.; Crepaz, N.; Janssen, R.S. Estimating sexual transmission of HIV from persons aware and unaware that they are infected with the virus in the USA. AIDS 2006, 20, 1447–1450. [Google Scholar] [CrossRef] [Scilit] [PubMed]
- Skarbinski, J.; Rosenberg, E.; Paz-Bailey, G.; Hall, H.I.; Rose, C.E.; Viall, A.H.; Fagan, J.L.; Lansky, A.; Mermin, J.H. Human immunodeficiency virus transmission at each step of the care continuum in the United States. JAMA Intern. Med. 2015, 175, 588–596. [Google Scholar] [CrossRef] [Scilit] [PubMed]
- Viguerie, A.; Song, R.; Johnson, A.S.; Lyles, C.M.; Hernandez, A.; Farnham, P.G. Isolating the effect of COVID-19-related disruptions on HIV diagnoses in the United States in 2020. J. Acquir. Immune Defic. Syndr. 2023, 92, 293–299. [Google Scholar] [CrossRef] [Scilit] [PubMed]
- Fraser, C.; Hollingsworth, T.D.; Chapman, R.; de Wolf, F.; Hanage, W.P. Variation in HIV-1 set-point viral load: Epidemiological analysis and an evolutionary hypothesis. Proc. Natl. Acad. Sci. USA 2007, 104, 17441–17446. [Google Scholar] [CrossRef] [Scilit] [PubMed]
- Quinn, T.C.; Wawer, M.J.; Sewankambo, N.; Serwadda, D.; Li, C.; Wabwire-Mangen, F.; Meehan, M.O.; Lutalo, T.; Gray, R.H. Viral load and heterosexual transmission of human immunodeficiency virus type 1. N. Engl. J. Med. 2000, 342, 921–929. [Google Scholar] [CrossRef] [Scilit] [PubMed]
- Hollingsworth, T.D.; Anderson, R.M.; Fraser, C. HIV-1 transmission, by stage of infection. J. Infect. Dis. 2008, 198, 687–693. [Google Scholar] [CrossRef] [Scilit] [PubMed]
- Bellan, S.E.; Dushoff, J.; Galvani, A.P.; Meyers, L.A. Reassessment of HIV-1 acute phase infectivity: Accounting for heterogeneity and study design with simulated cohorts. PLoS Med. 2015, 12, e1001801. [Google Scholar] [CrossRef] [Scilit] [PubMed]
- van den Driessche, P.; Watmough, J. Reproduction numbers and sub-threshold endemic equilibria for compartmental models of disease transmission. Math. Biosci. 2002, 180, 29–48. [Google Scholar] [CrossRef] [Scilit] [PubMed]
- Smith, H.L. Monotone Dynamical Systems: An Introduction to the Theory of Competitive and Cooperative Systems; Mathematical Surveys and Monographs 41; American Mathematical Society: Providence, RI, USA, 1995. [Google Scholar]
- Zhao, X.-Q. Dynamical Systems in Population Biology; CMS Books in Mathematics; Springer: New York, NY, USA, 2003. [Google Scholar]
- Thieme, H.R. Convergence results and a Poincaré–Bendixson trichotomy for asymptotically autonomous differential equations. J. Math. Biol. 1992, 30, 755–763. [Google Scholar] [CrossRef] [Scilit]
- Brauer, F. Backward bifurcations in simple vaccination models. J. Math. Anal. Appl. 2004, 298, 418–431. [Google Scholar] [CrossRef] [Scilit]
- Castillo-Chavez, C.; Song, B. Dynamical models of tuberculosis and their applications. Math. Biosci. Eng. 2004, 1, 361–404. [Google Scholar] [CrossRef] [Scilit] [PubMed]
- Song, R.; Hall, H.I.; Green, T.A.; Szwarcwald, C.L.; Pantazis, N. Using CD4 Data to Estimate HIV Incidence, Prevalence, and Percent of Undiagnosed Infections in the United States. J. Acquir. Immune Defic. Syndr. 2017, 74, 3–9. [Google Scholar] [CrossRef] [Scilit] [PubMed]
- Centers for Disease Control and Prevention. Diagnoses, Deaths, and Prevalence of HIV in the United States and 6 Territories and Freely Associated States, 2023; HIV Surveillance Report; CDC: Atlanta, GA, USA, 2025; Volume 36. Available online: https://stacks.cdc.gov/view/cdc/177772 (accessed on 12 November 2026).
- AIDSVu. AIDSVu Releases 2024 PrEP Use Data Showing Growing Use Across the U.S. 2025. Available online: https://aidsvu.org (accessed on 24 October 2026).
- Goodman, J.; Weare, J. Ensemble samplers with affine invariance. Commun. Appl. Math. Comput. Sci. 2010, 5, 65–80. [Google Scholar] [CrossRef] [Scilit]
- Foreman-Mackey, D.; Hogg, D.W.; Lang, D.; Goodman, J. emcee: The MCMC hammer. Publ. Astron. Soc. Pac. 2013, 125, 306–312. [Google Scholar] [CrossRef] [Scilit]
- Raue, A.; Kreutz, C.; Maiwald, T.; Bachmann, J.; Schilling, M.; Klingmüller, U.; Timmer, J. Structural and practical identifiability analysis of partially observed dynamical models by exploiting the profile likelihood. Bioinformatics 2009, 25, 1923–1929. [Google Scholar] [CrossRef] [Scilit] [PubMed]
- Blower, S.M.; Dowlatabadi, H. Sensitivity and uncertainty analysis of complex models of disease transmission: An HIV model, as an example. Int. Stat. Rev. 1994, 62, 229–243. [Google Scholar] [CrossRef] [Scilit] [PubMed]
- Marino, S.; Hogue, I.B.; Ray, C.J.; Kirschner, D.E. A methodology for performing global uncertainty and sensitivity analysis in systems biology. J. Theor. Biol. 2008, 254, 178–196. [Google Scholar] [CrossRef] [Scilit] [PubMed]
- Padder, A.; Qureshi, S.; Matouk, A.E.; Dehingia, K. Dynamical analysis of a vector-borne disease model with control function strategies. Discov. Appl. Sci. 2025, 7, 1031. [Google Scholar] [CrossRef] [Scilit]
- Lenhart, S.; Workman, J.T. Optimal Control Applied to Biological Models; Chapman & Hall/CRC: Boca Raton, FL, USA, 2007. [Google Scholar]
- Fleming, W.H.; Rishel, R.W. Deterministic and Stochastic Optimal Control; Springer: New York, NY, USA, 1975. [Google Scholar]
- Pontryagin, L.S.; Boltyanskii, V.G.; Gamkrelidze, R.V.; Mishchenko, E.F. The Mathematical Theory of Optimal Processes; Wiley: New York, NY, USA, 1962. [Google Scholar]

Disclaimer/Publisher’s Note: The statements, opinions and data contained in all publications are solely those of the individual author(s) and contributor(s) and not of MDPI and/or the editor(s). MDPI and/or the editor(s) disclaim responsibility for any injury to people or property resulting from any ideas, methods, instructions or products referred to in the content. |
© 2026 by the authors. Licensee MDPI, Basel, Switzerland. This article is an open access article distributed under the terms and conditions of the Creative Commons Attribution (CC BY) license.