


Abstract
Background: Identifying diabetes phenotypes in electronic health records is challenging when repeated admissions and diagnosis-derived variables can bias evaluation. Methods: We reconstructed an ICD-audited diabetes phenotype from MIMIC-IV v3.1 and compared LightGBM with trajectory-aware probability stacking and a conservative contextual-bandit reliability gate. Patient-level separation, out-of-fold feature generation, independent gate development, and a common upstream Base model were used. Results: On the primary held-out split (51,400 records), Full SAG-RS achieved accuracy 0.926654, F1 0.889579, AUC 0.961288, and Brier 0.059649. Across five patient-level splits, mean accuracy was 0.928021 ± 0.002217. The gate improved primary-split accuracy over Stack-only by 0.000233 (95% paired confidence interval −0.000078 to 0.000548); net corrections were positive in three of five splits. Conclusions: Trajectory-aware stacking provided most of the gain over admission-level LightGBM. The gate offered limited, variable correction rather than a demonstrated independent performance gain. Findings are restricted to retrospective internal validation; external validation and full-pipeline replication remain outstanding.
Keywords:
diabetes phenotype identification; MIMIC-IV; trajectory-aware stacking; offline contextual bandit; LightGBM MSC:
68T05; 68T09; 92B15
1. Introduction
Diabetes phenotype identification is a core task in electronic health records (EHRs), medical big-data research and health-informatics modeling. Its key objective is to obtain reliable diabetes phenotype labels, which are indispensable for cohort construction, disease surveillance, model development, and downstream clinical analyses. MIMIC-IV provides a large de-identified critical-care EHR resource in which diabetes-related evidence is distributed across diagnoses, laboratory measurements, medication records, procedures and repeated hospital encounters rather than being contained in a single clean variable [1]. This distributed nature arises from the inherently multi-source definition of diabetes, in which coded disease concepts must be integrated with metabolic evidence such as glucose and glycated hemoglobin (HbA1c) measurements [2].
Several studies have used heterogeneous electronic health record (EHR) variables to investigate diabetes risk prediction and care support; however, their practical effectiveness is highly sensitive to label definitions, data quality, and clinical context [3]. Moreover, substantial differences in input modalities, outcome definitions, and validation strategies increase the difficulty of cross-dataset reproducibility [4].
Although medical AI (artificial intelligence) can integrate high-dimensional clinical variables and capture nonlinear patterns, a high-performing empirical model does not automatically constitute a trustworthy phenotyping model. Reviews of artificial intelligence in health and medicine have emphasized that real-world deployment depends on appropriate data governance, transparent evaluation, and clearly defined task boundaries [5]. For EHR-based phenotyping, recent reviews of machine learning have further indicated that choices regarding feature construction, validation design, and reporting practices may substantially affect phenotype portability [6].
The longitudinal structure of EHR data represents another unresolved challenge. Prediction models using longitudinal EHR data must explicitly define how repeated visits, temporal patterns, and visit-level features are represented [7]. A recent scoping review focusing on machine learning and deep learning with longitudinal EHR data also noted that the performance of early detection and prevention tasks often depends on how patients’ medical histories are summarized [8]. In this study, repeated admissions can provide useful trajectory evidence; however, if records from the same patient are incorrectly split between the training and test sets, model performance may be artificially inflated.
Therefore, structured EHR data require not only predictive modeling but also control over the evidence pathways. Reviews of multimodal machine learning suggest that integrating heterogeneous clinical inputs can improve predictive performance, but the value of each modality depends on the specific task and the reliability of the input source [9]. Integrated frameworks for medical artificial intelligence similarly advocate a model that connects data auditing, representation learning, model fusion, and task-specific evaluation, rather than treating prediction scores as a black box [10].
When handling structured tabular EHR variables, modern neural networks have attracted growing attention; nevertheless, tree-based models and gradient-boosting methods remain strong baselines because they can effectively handle heterogeneous variables and missingness patterns [11]. Large-scale evidence from diabetes prediction studies also indicates that gradient-boosting decision trees can provide reliable probability estimates in big-data settings [12].
Reinforcement-learning concepts provide a concise framework for formalizing state-dependent evidence selection; however, when applied in the medical domain, clinical treatment strategies must be strictly distinguished from internal model-control strategies [13]. Medical reinforcement learning requires meaningful actions, reliable rewards, and valid evaluation before clinical claims can be made [14]. Recent research on federated offline reinforcement learning further demonstrates that offline policy learning must address distribution shift and limited action support [15]. The main contributions are as follows:
- First, we reconstructed an ICD-audited diabetes phenotype label from row-level diagnosis evidence, while excluding diagnosis-derived and future-boundary variables from the predictors.
- Second, we designed a trajectory-aware probability stacking pipeline to combine evidence from repeated admissions under a patient-level split.
- Third, we introduced an offline contextual-bandit reliability policy. In this setup, trajectory summaries are the states, evidence paths are the actions, whether an action is correct is the one-step reward, and the learned selector is the policy.
- Fourth, we evaluated a conservative gated fusion approach through a primary comparison, component-configuration analysis, policy-switch analysis, calibration, decision-curve analysis, and sensitivity analysis.
2. Related Work
2.1. EHR Phenotyping and Leakage Control
EHR phenotyping aims to convert heterogeneous clinical records into reproducible disease labels or cohorts. Recent machine-learning phenotyping research stresses that feature selection, temporal aggregation and validation design can substantially affect phenotype transportability [6]. For diabetes, this is especially important because ICD codes provide explicit disease evidence, whereas laboratory and treatment variables may reflect different stages of disease recognition and clinical care.
Methodological guidance for clinical prediction modeling emphasizes explicit separation of outcome definition from predictor construction, strict isolation of held-out data, and transparent reporting of preprocessing decisions [16,17]. In phenotyping studies where diagnosis codes define the reference label, predictors derived from the same diagnosis fields or from downstream outcomes require particular scrutiny because they may encode the target by construction.
2.2. Longitudinal EHR Representation
Medical AI has been widely applied to diabetes risk prediction, complication screening, and clinical decision support [3]. For structured tabular data, although modern neural networks have attracted considerable attention, tree-based models and gradient-boosting methods remain strong baseline models because of their ability to effectively handle heterogeneous variables and missingness patterns [11]. A large-scale diabetes prediction study has demonstrated that gradient-boosting decision trees can provide reliable probability estimates in big-data settings [12]. Meanwhile, recent reviews of clinical AI have also cautioned that superficial high performance cannot replace the need for clinical contextualization, bias assessment, and transparent evaluation.
Beyond tabular models, longitudinal EHR methods have increasingly represented repeated visits as ordered patient sequences. RETAIN uses recurrent modeling with reverse-time attention to identify influential prior visits while retaining interpretability [18]. Transformer-based approaches such as BEHRT learn contextual representations from longitudinal EHR sequences [19], while Med-BERT adapts BERT-style pretraining to large-scale structured EHR data for downstream disease prediction [20]. These representative approaches motivate explicit comparison with recurrent and Transformer-based baselines when evaluating longitudinal EHR representations.
2.3. Contextual Bandits and Reliability-Oriented Selection
Reinforcement learning provides a formal framework for state-dependent decision-making through states, actions, rewards, and policies [13]. In the medical domain, reinforcement learning has been explored for treatment optimization, glycemic management, and dynamic decision support; however, such applications require clinically meaningful actions, longitudinal state transitions, reliable reward signals, and support for offline policy evaluation [14]. Recent studies on federated offline reinforcement learning further indicate that offline policy learning must address distribution shift and limited action support [15].
Contextual bandits differ from full sequential reinforcement learning in that each decision is made from a current context without modeling long-horizon state transitions. In healthcare-oriented applications, this distinction is useful for one-step selection among candidate options rather than treatment optimization; however, the semantics of actions and rewards, the construction of offline feedback, and the evaluation protocol still require explicit reporting and careful interpretation [13,14,15].
2.4. Research Gap and Study Positioning
Existing studies on diabetes phenotype identification still have clear limitations in label auditing, trajectory representation, and the interpretability of evidence pathways. Stepwise development guidelines for clinical prediction models emphasize that data processing, modeling choices, and evaluation must be strictly separated from the held-out test set [21]. Evaluation guidelines further indicate that discrimination, calibration, and clinical usefulness address distinct questions and should not be reduced to a single statement of accuracy [22]. In addition, external validation is indispensable, because performance observed in a single database may not necessarily transfer to other electronic health record systems [23]. Recent guidance on the evaluation of predictive artificial intelligence recommends that performance metrics should be selected according to the intended healthcare decision-making context [24]. Calibration studies have also shown that even when discrimination appears acceptable, deployed machine-learning models may still suffer from bias or poor calibration [25]. Systematic reviews of reporting practices for machine-learning prediction models further warn that selective reporting and inappropriate interpretation may exaggerate model value when limitations are not clearly described [26]. General discussions of clinical artificial intelligence likewise remind us that apparent performance must be interpreted within the intended clinical use context [27]. Trustworthy artificial intelligence and implementation frameworks explicitly require attention to fairness, usability, robustness, transparency, generalizability, and applicability assessment before making deployment claims [28,29]. Frameworks for long-term impact assessment emphasize that retrospective performance alone is insufficient to establish real-world clinical benefit [30]. Recommendations on dataset transparency also note that, when health data are used for artificial intelligence development, population coverage and risks of bias should be documented [31]. Critical appraisal studies of artificial intelligence prediction models show that external validation and interpretability assessment remain central to determining whether performance gains are truly meaningful [32]. In addition, discussions of proactive and reactive healthcare machine learning caution that models may fail when the intended use case does not match the deployment environment [33].
Three issues remain important for this task: leakage-controlled phenotype construction, representation of repeated patient encounters, and transparent assessment of how different evidence pathways contribute to model predictions. The present study addresses these issues in a retrospective MIMIC-IV setting by combining audited predictor construction with trajectory-aware probability stacking and a conservative contextual-bandit reliability layer. The framework is evaluated as an internal evidence-selection architecture rather than as a clinical reinforcement-learning intervention system, as shown in Table 1.
Table 1.
Research status, limitations and corresponding design response.
3. Methods
SAG-RS is formulated as a leakage-audited, trajectory-aware framework with an offline contextual-bandit reliability selector. The model does not learn a clinical treatment policy. Instead, it uses a one-step contextual-bandit abstraction to decide which internal evidence source should be trusted for phenotype probability fusion.
3.1. Definitions
Definition 1:
Audited phenotype and input. The phenotype label is reconstructed from diagnosis evidence, and the model input is restricted to leakage-audited structured EHR variables.
Here, Di denotes the ICD diagnosis-code set for record i, CDMaudit is the audited diabetes ICD code set, and yi is the ICD-audited diabetes phenotype label. Ei denotes the original EHR variable set, LDM contains diagnosis, outcome, mortality, discharge, temporally unavailable and label-proximal variables, and Phi denotes the feature-construction operator.
Definition 2:
Probability and state. The admission-level learner produces a raw probability, and repeated-record probabilities are summarized into a trajectory-derived state.
The function hθ is the admission-level LightGBM learner. piraw is the probability for the current record after leakage-controlled feature construction. The index s(i) identifies the subject-level trajectory, and zi contains trajectory summaries such as mean probability, upper-quartile probability, maximum probability, probability range, trajectory length and blended current-trajectory summaries.
Definition 3:
Stacking path. The default stacking path fuses current-record and trajectory evidence through a supervised stacking learner.
The function gψ is the stacking learner, and pi_stack is the default stacking output. The stacking objective L_stack is binary cross-entropy against the ICD-audited phenotype label.
Definition 4:
Offline contextual-bandit policy. Evidence-path selection is expressed as a one-step contextual-bandit reliability problem.
The set A contains internal evidence-path actions, not clinical treatment actions. For each action, a binary correctness reward is computed using that action’s classification threshold estimated on development-side evidence. The selected-action reliability model Q estimates whether an action is correct; this is distinct from the downstream gate’s probability of a correction relative to the stacking decision. The thresholds applied to the individual action paths were learned on the training-side portion of each fold (rather than fixed uniformly at 0.50).
Definition 5:
Conservative fusion. The final output defaults to the stacking probability and changes to the selected action only when an independently trained correction-switch score exceeds the pre-specified gate threshold. The selected-action reliability Q alone does not trigger the switch.
The correction-gate threshold τ = 0.66 was fixed before the held-out evaluation and was not selected using test outcomes. Figure S1 presents a separate exploratory threshold analysis conducted under an earlier evaluation protocol; it does not establish the optimality of τ for the final analysis. For the final evaluation, 15% of development subjects were reserved for gate fitting. The reserved development set and held-out test set were scored using the same core-fitted Base model and preprocessing steps. Q validation used subject-separated folds with lower-stage features reconstructed without labels from the validation fold. The key variables and model notation as shown in Table 2.
Table 2.
Key variables and model notation.
3.2. SAG-RS Model
SAG-RS uses a one-step offline contextual-bandit formulation for internal evidence-path selection. It does not model sequential clinical state transitions, cumulative treatment rewards, or a clinical intervention policy. Accordingly, the term “reinforcement-learning-inspired” refers only to the state–action–reward–policy abstraction used for reliability-oriented evidence selection; technically, the implemented decision module is an offline contextual bandit rather than a full sequential reinforcement-learning system.
3.2.1. State
The state is zi, a trajectory-derived probability summary. It is constructed from repeated-record probabilities for the same subject and includes mean, upper-quartile, maximum, range, length and blended summaries. These state variables are derived from predicted probabilities rather than outcome labels, so they represent evidence configuration rather than direct label information.
3.2.2. Action
The action set A contains internal evidence paths: raw admission-level evidence, subject-level mean evidence, subject-level upper-quartile evidence, subject-level maximum evidence and blended variants. These are not medication, intervention or treatment actions. They indicate which probability source the model may trust for final phenotype fusion. The internal evidence-path actions and reward interpretation are listed in Table 3.
Table 3.
Internal evidence-path actions and one-step reward interpretation.
3.2.3. Reward
The one-step action reward is a binary indicator of correctness relative to the ICD-audited phenotype label. For each action a, its probability is converted to a decision using a threshold estimated on the corresponding development-side training partition. These thresholds are separately computed within the folds used for action-Q modeling. Neither rewards nor thresholds were fitted with held-out test labels. The policy selects among internal prediction paths; it does not prescribe clinical actions.
3.2.4. Policy
The reliability estimator Qω(zi,a) predicts the probability that action a will receive a positive one-step reward under state zi. The policy πω chooses the action with maximum estimated reliability. Because the task has no sequential treatment transitions, the policy is an offline contextual-bandit evidence selector rather than a full treatment-control reinforcement-learning policy.
3.2.5. Reliability Model Training
The final audited implementation uses two distinct LightGBM reliability estimators. Seven action-specific Q models estimate the class-1 probability that an action’s thresholded decision is correct; each uses 45 estimators, 12 leaves, learning rate 0.045, unrestricted maximum depth, minimum child samples 80, and L2 regularization 1.0. The gate G estimates a different event: selected-action correct AND default stacking prediction wrong. Its inputs include trajectory state, stacking and action scores, probability margins and disagreement, and it uses 90 estimators, 15 leaves, the same learning rate, minimum child samples and L2. Q diagnostics use subject-grouped outer validation folds with lower-stage features generated only from the outer-fold training subjects; the saved audit supplemented 84 Q-only diagnostic fits for the other four seeds. These diagnostic models do not feed the frozen formal outputs. Gate G is fitted on the independent 15% reserved development subjects. The repaired gate-development and test inputs use the same core-fitted Base instance and encoder, avoiding the earlier separate-fitted-Base discrepancy. Class-1 probability orientation was audited. Training-architecture and data-separation principles agree across all five splits, but Seed42 and the remaining four splits use two documented random-state offset schemes; the final meta-estimator objects for four splits were not fully retained. No held-out test labels were used for model fitting or threshold selection.
3.2.6. Gate
The stacking path remains the default. The Q policy selects the action with the largest estimated correctness probability; a separate gate score G estimates the probability of correcting a wrong stacking prediction. The selected-action probability replaces stacking only when G ≥ τ = 0.66. In the final seed-42 test cohort, the gate triggered 44 prediction changes, correcting 28 errors and introducing 16 errors (net +12). The difference in accuracy relative to Stack-only was +0.000233, with a paired confidence interval crossing zero.
3.3. Algorithm
Algorithm 1 summarizes the final audited subject-separated evidence flow. Base, Stack and Q are fitted from core-development subjects; a disjoint 15% subset trains the correction gate. During Q diagnostic validation, the lower-stage training features are rebuilt inside subject-held-out outer folds, and held-out-fold labels are not used to fit the lower-stage inputs. Gate-development and final test data are transformed and scored with the same fitted core Base and preprocessing object. Held-out test labels are used only for frozen evaluation. The repaired formal predictions were not altered by the additional Q diagnostic fits. The two documented random-state offset schemes and incomplete preservation of all fitted final objects are identified as reproducibility limitations rather than leakage evidence.
| Algorithm 1. SAG-RS with Offline Contextual-Bandit Reliability Selection | |
| Input: Audited EHR matrix X; ICD-audited label y; subject index s(i); action set A; thresholds κ and τ. | |
| Output: Final phenotype probability and phenotype prediction. | |
| 1 | Construct the ICD-audited phenotype label. |
| 2 | Remove leakage-prone variables and construct audited predictors. |
| 3 | Divide development subjects into core (85%) and disjoint gate-development (15%) subsets; fit the admission-level learner using only core subjects. |
| 4 | Generate nested subject-grouped OOF admission probabilities within core subjects; obtain core-only predictions for reserved gate-development and held-out subjects. |
| 5 | For each subject trajectory, construct probability-summary state variables using mean, q75, max, range and length. |
| 6 | Train the stacking learner and obtain the default stacking-path probability. |
| 7 | Calculate each candidate action probability and development-fold correctness reward using action-specific thresholds estimated without the held-out fold. |
| 8 | Fit Q on core-derived action correctness labels; diagnose Q folds using lower-stage features refitted exclusively within each outer-fold training partition. |
| 9 | Select the evidence action by Q; score gate-development and final held-out test with one shared fitted core-only Base and identical preprocessing. |
| 10 | Train G on reserved gate-development subjects to predict selected-action-correct AND stack-wrong; switch only when G ≥ 0.66 (fixed), otherwise retain Stack. |
| 11 | Return the final phenotype probability and prediction. |
4. Experiments
4.1. Setup
The modeling data were derived from MIMIC-IV v3.1, a publicly available de-identified critical-care EHR resource. The database is available to credentialed users through PhysioNet at https://physionet.org/content/mimiciv/3.1/ (accessed on 4 September 2026). The unit of analysis was a hospital/ICU-linked record. Internal training and testing were separated by subject_id so that records from the same patient did not appear in both subsets. The final training set contained 290,764 records and the test set contained 51,400 records. After leakage screening, 556 predictors were retained for model-training. The dataset and experimental setting are shown in Table 4.
Table 4.
Dataset and experimental setting.
The ICD-only label was reconstructed from row-level diagnosis records. ICD-9 code family 250.xx and ICD-10 code families E08, E09, E10, E11 and E13 were treated as diabetes-positive evidence, consistent with the diagnostic code definitions introduced in the literature background. In the raw diagnosis table, the rule identified 180,320 diabetes ICD rows, 133,450 diabetes-positive admissions and 46,312 diabetes-positive subjects. ICD variables were not used as model predictors. The ICD-only label reconstruction summary is presented in Table 5.
Table 5.
ICD-only label reconstruction summary.
Before model-training, all 594 source columns were audited for direct label evidence, diagnosis-derived information, identifiers, outcomes, discharge information, temporally unavailable information, and non-model fields. The final modeling pipeline removed 38 columns and retained 556 predictors. Twenty-seven exclusions were captured by the original broad rule-based audit, while 11 additional exclusions were identified in the fitted preprocessing pipeline: one identifier (id), two timestamp-boundary fields (admittime and intime), three future/outcome fields (los_hospital, dod, and survival_days_num), one diagnosis-derived comorbidity field (charlson), and four high-cardinality text fields (aki_time, microbiology, 51301_last, and wbc_last). The complete feature accounting is summarized in Table 6.
Table 6.
Feature leakage audit summary.
The result Section 4.2 is organized to test distinct claims. The main comparison evaluates whether SAG-RS improves internal classification and probability quality over traditional baselines. Component-configuration analysis verifies that the stacking path, action path and gate have distinct roles rather than being renamed outputs. Gate-switch analysis examines when the conservative gate switches and whether those switches produce net correction. Calibration and decision-curve analysis evaluate probability reliability and threshold utility beyond accuracy. Sensitivity analysis defines the empirical boundary of the method, particularly the dependence on trajectory information and treatment-related variables. The evaluation logic and purpose of each result block are summarized in Table 7.
Table 7.
Evaluation logic and purpose of each result block.
4.1.1. Preprocessing
All preprocessing was performed inside the subject-level development split to avoid information leakage. Missing-like tokens, empty strings and non-informative placeholders were normalized before modeling. Numeric predictors were cast to numeric values, with non-convertible entries treated as missing. Categorical variables were mapped using dictionaries learned from the training data only; unseen levels in held-out testing were assigned to an unknown category. For models requiring dense numeric inputs, imputation, indicator construction, encoding and scaling were fitted on the training set and then applied unchanged to the held-out test set. Tree-based learners were allowed to use their internal missing-value handling when supported by the implementation.
Feature screening was deliberately rule-based rather than outcome-optimized. ICD codes, diagnosis titles, diagnosis-derived diabetes flags, mortality indicators, discharge fields, length-of-stay variables, temporally unavailable fields, identifier-like fields and strong label-proximal variables were excluded before model development. The retained predictor set therefore represented structured EHR evidence available for retrospective phenotype identification after removal of direct label surrogates. The preprocessing and leakage-control steps are summarized in Table 8.
Table 8.
Preprocessing steps.
4.1.2. Model Training
Patients were assigned to subject-disjoint development and held-out test sets. Within each development set, 15% of subjects were reserved for gate fitting. The final pipeline generated grouped out-of-fold predictions using core-development data and applied the same core-fitted Base model and preprocessing to the gate-development and test partitions. For validation of the Q estimators, lower-stage features were reconstructed inside subject-held-out folds. Additional Q diagnostics on the four non-primary splits did not change the final model predictions. Reconstructed patient overlaps were zero and evaluation metrics were reproduced from saved predictions. The random-state offsets for the primary split and the other four splits were documented separately; fitted final meta-model objects were not fully retained for the latter, limiting independent model-object replay.
Trajectory summaries were constructed from predicted probabilities rather than outcome labels. Per subject, the mean, upper quartile, maximum, dispersion, range, history length and current-trajectory blends were computed separately in core-development, reserved gate-development and held-out test groups. The default stacking learner combines admission-level probability and those trajectory summaries. The selected-action Q estimators use correctness labels based on thresholds learned on the core development data or corresponding fold-training partitions. The separate gate is trained to identify cases in which the chosen action would correct a stacking error, with a fixed switching threshold τ = 0.66. For the ordinary LightGBM comparator, classification uses a fixed probability threshold of 0.50; the stacking decision uses a core-development threshold. The retained Temporal Transformer is a retrospective full-sequence comparator without a demonstrated causal attention mask. Table 9 summarizes the training stages.
Table 9.
Model-training protocol.
4.1.3. Evaluation
Ordinary LightGBM, Stack-only and Full SAG-RS were evaluated on subject-disjoint internal held-out data using an audited 556-feature set. The final primary test split (seed 42) contained 51,400 records from 21,327 subjects; four other grouped splits were evaluated using seeds 52, 62, 72 and 82. All formal results in this revision use the final audited frozen predictions, and no outcome labels from the held-out test set were used to choose model hyperparameters or τ. Formal metric values were independently reconciled with saved predictions. Paired subject-clustered bootstrap confidence intervals (B = 2000) were computed separately within each seed for accuracy, F1, recall, AUC and Brier using identical subject-level resamples for the three models. These intervals describe each split’s frozen predictions, not uncertainty for the five-split mean. Complete raw-to-results reproducibility remains limited by unavailable credentialed inputs and incomplete final fitted-object archives.
Predictive performance was assessed with classification (accuracy, precision, recall and F1), discrimination (AUC and average precision), and probability-quality (Brier and ECE-10) metrics. Earlier exploratory decision-curve and calibration figures are identified separately and not interpreted as plots regenerated from the final audited predictions. For the final audited version, Table 10 reports seed-42 subject-clustered paired intervals and the supplemental CSV records all 75 paired comparisons (five seeds × three model pairs × five metrics). Each bootstrap replicated subjects with replacement, retaining their within-subject admissions and applying identical draws to both model predictions. A positive Brier delta is worse, and no five-split aggregate confidence interval is claimed.
Table 10.
Evaluation metrics.
4.1.4. Computational Environment and Reproducibility
Experiments were performed on Windows 11 using Python 3.12.10, an Intel Core i9-14900HX CPU, 32 GB RAM and an NVIDIA GeForce RTX 4060 GPU (8 GB) at Hunan Women’s University. Principal packages included NumPy 2.5.2, pandas 3.0.5, SciPy 1.18.1, scikit-learn 1.9.1, LightGBM 4.6.0, joblib 1.6.0, Matplotlib 3.11.1 and PyTorch 2.13.0+cu126. CUDA was used for the GRU and Transformer baselines. The primary test-subject membership was held fixed; four additional grouped patient splits used seeds 52, 62, 72 and 82 alongside seed 42. Stochastic components and their actual seed offsets are documented with the supporting code.
4.2. Results
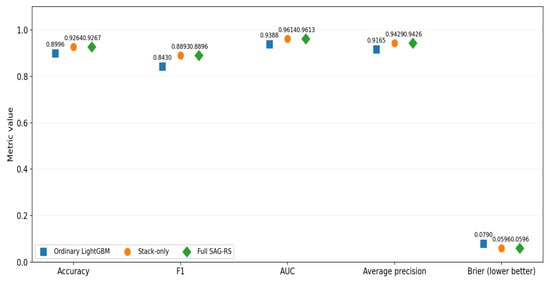
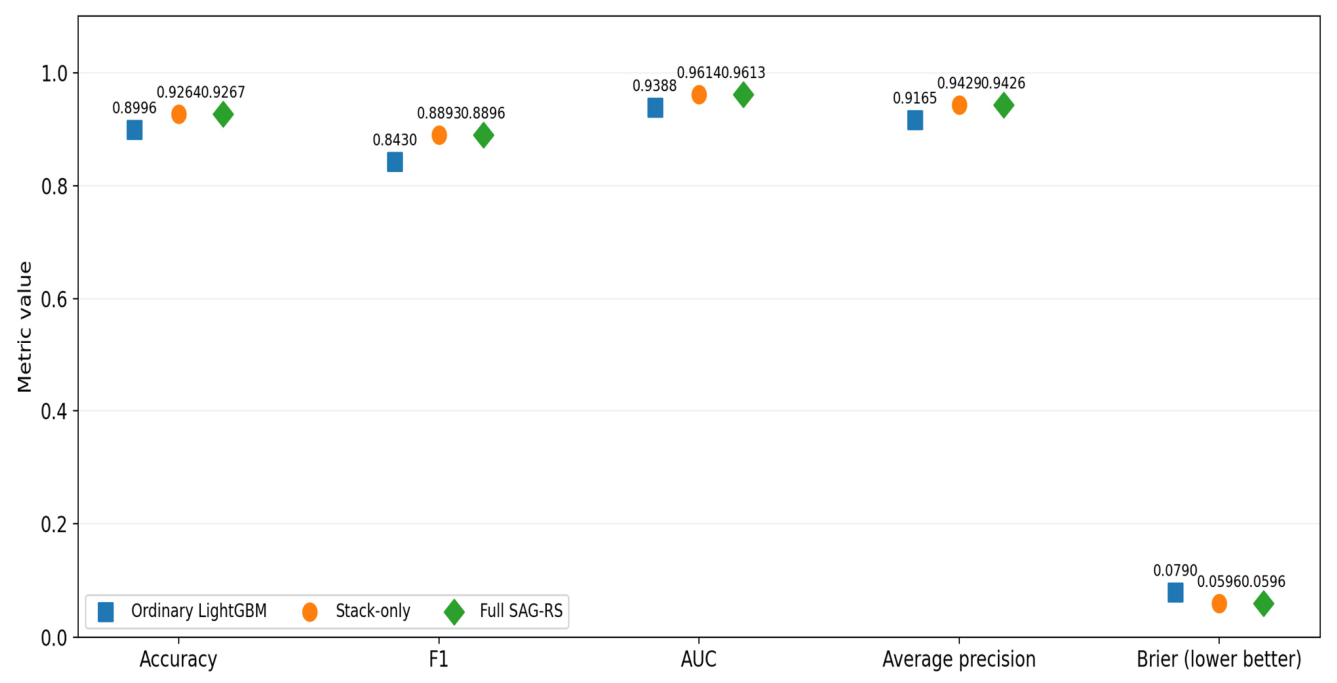
Table 11 and Figure 1 report the final primary comparison using the same held-out patients (seed 42). Full SAG-RS achieved an accuracy of 0.926654, precision of 0.919082, recall of 0.861910, F1 of 0.889579, AUC of 0.961288, average precision of 0.942572 and Brier score of 0.059649. LightGBM achieved an accuracy of 0.899553, F1 of 0.843017, AUC of 0.938754 and Brier score of 0.078966; Stack-only achieved an accuracy of 0.926420, F1 of 0.889260 and AUC of 0.961365. The Full–LightGBM paired differences (95% patient-clustered percentile CI) were +0.027101 [0.024530, 0.029896] for accuracy, +0.046561 [0.042506, 0.050866] for F1, +0.075089 [0.068870, 0.081908] for recall, +0.022534 [0.020497, 0.024672] for AUC and −0.019318 [−0.020809, −0.017940] for Brier, as shown in Table 12. The trajectory-aware stack accounted for most of the gain, while the gate made a small additional contribution. Paired intervals used 2000 patient-level bootstrap resamples without changing predictions or thresholds.
Table 11.
Primary held-out performance of Ordinary LightGBM, trajectory-aware Stack-only and Full SAG-RS (seed 42; 51,400 records from 21,327 patients).
Figure 1.
Performance of the three models on the primary held-out test set (seed 42). Values are from the updated protocol. Lower Brier scores indicate more accurate probability estimates.
Table 12.
Paired performance differences (Full SAG-RS minus Ordinary LightGBM) on the primary test split (seed 42). Brackets show 95% percentile confidence intervals from 2000 patient-clustered bootstrap replicates; precision and AP have point estimates only. The supplementary statistics include the corresponding results for all five splits and three model pairs.
4.3. Component-Configuration Analysis
Table 13 compares final audited Base, Stack-only and Full configurations under the same seed-42 protocol. The Full-minus-Stack-only accuracy difference was +0.000233 [−0.000078, +0.000548]; paired intervals for AUC (−0.000077 [−0.000222, +0.000009]), F1 (+0.000319 [−0.000126, +0.000770]), recall (+0.000057 [−0.000349, +0.000480]) and Brier (+0.000043 [−0.000030, +0.000150]) also contain zero. Earlier exploratory intermediate-component diagnostics remain in Supplementary Table S3 and are not interpreted as final-protocol controlled ablations. These results characterize the gate as a sparse, auditable control, not the primary source of the gain over LightGBM.
Table 13.
Component comparison under the updated primary test protocol (seed 42). Earlier intermediate-component analyses are presented separately in Supplementary Table S3.
4.4. Policy Analysis
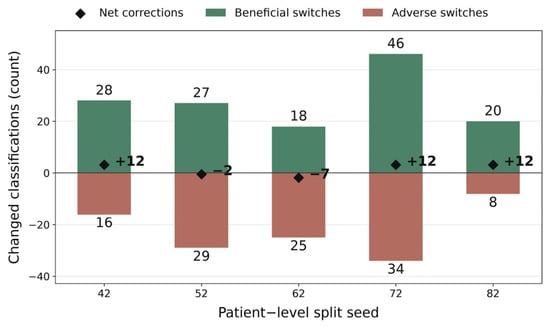
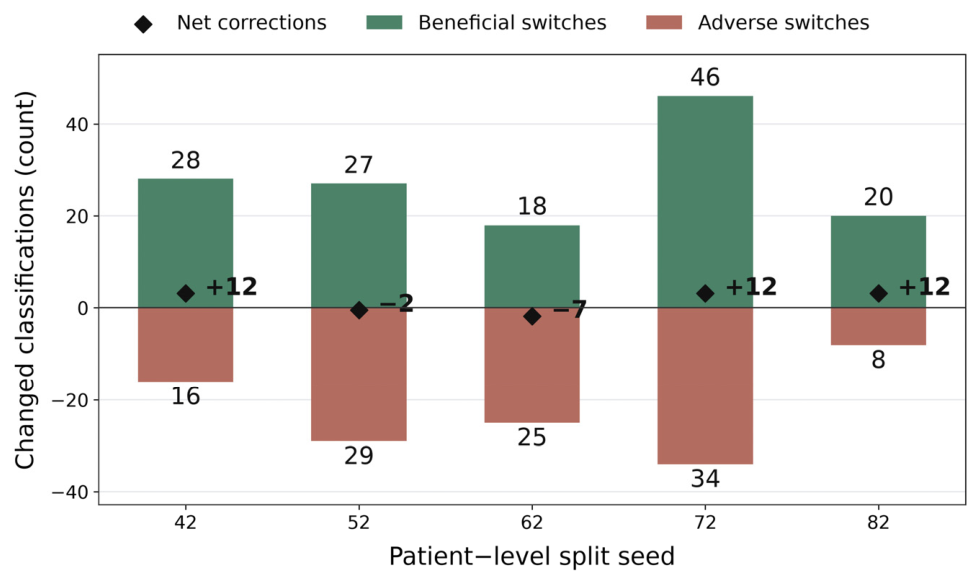
The final seed-42 gate triggered 44 changes among 51,400 test records: 28 beneficial and 16 adverse switches, for net +12 correct predictions. In splits 52, 62, 72 and 82, the numbers of changed predictions were 56, 43, 80 and 28; the corresponding net corrections were −2, −7, +12 and +12. The gate therefore improved classification in three of five splits, but the mean Full-versus-Stack-only accuracy gain was only approximately +0.000105 across splits. The original 20-switch (10 beneficial, 10 adverse) seed-42 results belong to the earlier exploratory protocol and are not current primary findings. Table 14 contains the final primary switch audit, while earlier exploratory action distributions in Supplementary Table S5 remain labeled separately.
Table 14.
Final audited seed-42 gate-switch outcomes (44 changed predictions, 28 beneficial and 16 adverse; net +12). Historical rule-gate/oracle diagnostics are separated as exploratory supplementary information.* is not archived.
The final primary gate-switch outcomes in Table 14 were derived directly from frozen seed-42 predictions; per-seed gate activation and outcome counts for all five splits are provided in the accompanying CSV. The earlier exploratory action-distribution table (Supplementary Table S5) is not a final-protocol action counterfactual.
Figure 2 shows the number of beneficial and adverse Gate-induced classification changes in each of the five final patient-level splits. Net corrections were +12, −2, −7, +12, and +12, respectively; these small counts should not be interpreted as evidence of a consistently significant predictive improvement.
Figure 2.
Gate-switch outcomes under the final audited protocol for the five held-out patient-level splits. Positive bars show beneficial switches, negative bars show adverse switches, and diamond markers show the net number of corrected classifications. Counts are derived from the frozen five-split predictions; neutral gate triggers are excluded from the changed-classification bars.
4.5. Calibration
Prediction-level analysis evaluates score separation, calibration, decision utility and error structure. These analyses supplement accuracy and F1 score by testing whether predicted probabilities are numerically stable and whether the model has threshold-dependent utility in an internal decision-curve setting.
On final seed-42 frozen predictions, Full SAG-RS achieved Brier score 0.059649 and ECE-10 0.016263; the updated confusion-matrix counts appear in Table 15. Figure S3 is an earlier exploratory calibration and decision-curve panel and was not regenerated from the final test predictions. It is not evidence of final protocol decision utility or prospective clinical usefulness.
Table 15.
Confusion matrix of Full SAG-RS on the primary held-out test split (seed 42; n = 51,400), with actual positive in the first row.
4.6. Sensitivity
The primary comparison and five repeated patient-level splits were evaluated using the final audited pipeline. The first-admission and treatment-related sensitivity analyses were performed under an earlier exploratory protocol. Their results are reported separately to explain the limits of retrospective trajectories and are not used as matched performance estimates for the final pipeline.
The first-admission subgroup analysis used retrospective trajectories assembled from the complete available patient history. For some indexed first admissions, these trajectories included subsequent admissions. The reported subgroup figures therefore describe an exploratory retrospective restriction, not a prospective prediction at a patient’s first encounter. Differences obtained under distinct earlier thresholds or analysis subsets are not interchangeable with the final primary results.
4.7. Robustness and Stability Analysis
4.7.1. Subject-Level Split Stability
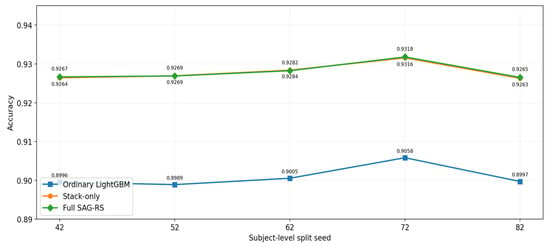
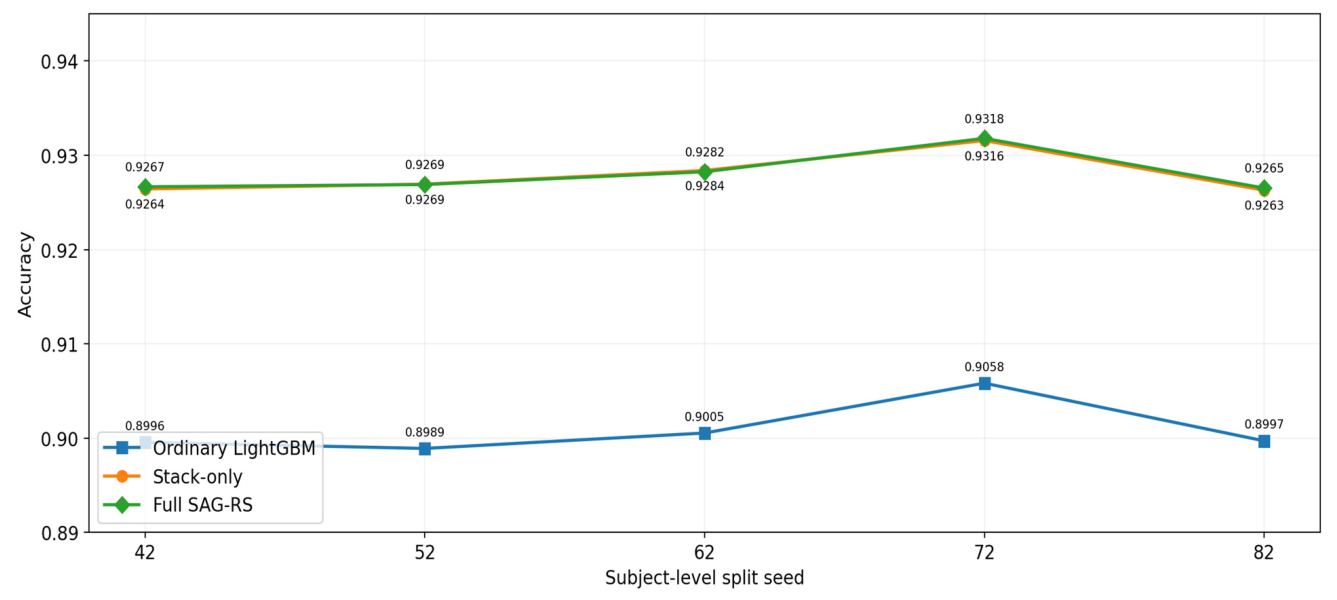
As shown in Table 16, the final pipeline was fitted for five subject-level grouped splits (seeds 42, 52, 62, 72, 82), with Q-fold diagnostics and a core-fitted upstream Base shared by gate development and test prediction. Full SAG-RS achieved accuracy 0.928021 ± 0.002217, F1 0.892338 ± 0.003753, AUC 0.963989 ± 0.002083 and Brier 0.057557 ± 0.001704 (five-split mean ± sample SD). Ordinary LightGBM achieved accuracy 0.900910 ± 0.002812, F1 0.846240 ± 0.004754, AUC 0.940677 ± 0.002364 and Brier 0.077804 ± 0.001930; Stack-only achieved accuracy 0.927916 ± 0.002198 and F1 0.892126 ± 0.003721. These descriptive five-split statistics are not patient-bootstrap intervals, and the different downstream random-state offset rules and fitted-object archival limits are described in Section 5.3. Figure 3 displays frozen split-specific results.
Table 16.
Model performance across five patient-level splits (mean ± sample standard deviation).
Figure 3.
Accuracy of Ordinary LightGBM, trajectory-aware Stack-only and Full SAG-RS across five independent patient-level splits (seeds 42, 52, 62, 72 and 82).
4.7.2. Class-Distribution Robustness
The retained class-prevalence sensitivity exercise is an earlier exploratory reweighting analysis, not a final test. It reweighted earlier frozen predictions to target positive prevalences of 0.20, 0.30, 0.40 and 0.50, with observed exploratory prevalence 0.3428. This exercise is descriptive: it neither retrains models nor supports claims about independent population prevalence or final audited performance. The unadjusted earlier exploratory observed-prevalence row therefore differs from the final primary F1 results in Table 11.
4.7.3. Trajectory-Construction Robustness
Trajectory-construction robustness was examined in the earlier exploratory analysis by rebuilding chronological summaries using the current and up to the previous K admissions. These results are retained as secondary evidence about the graded contribution of longitudinal history; they do not replace the final primary refit and do not establish prospective causal availability.
4.8. Comparison with Longitudinal Neural Baselines
To expand the comparison with modern longitudinal EHR representations [18,19,20], the manuscript retains the GRU and Temporal Transformer comparison using the same audited 556 predictors, the same primary subject split, chronological subject sequences and development-only validation for early stopping. These neural baselines were not retrained in the final audited reserved-gate repair. The Temporal Transformer remains a retrospective full-sequence baseline because the implementation used padding masks but no causal attention mask; therefore, the comparison does not establish chronological causal prediction. The comparison supports the value of the trajectory-aware tabular representation without implying universal superiority over all longitudinal architectures.
5. Discussion
5.1. Predictive Contribution of Trajectory-Aware Stacking
The final audited primary comparison supports a substantial benefit from trajectory-derived probability features and stacking. Relative to Ordinary LightGBM, Stack-only improved accuracy from 0.899553 to 0.926420 and F1 from 0.843017 to 0.889260. Adding the gate increased seed-42 accuracy to 0.926654, with a paired improvement over Stack-only of +0.000233 [−0.000078, +0.000548]; the interval spans zero. Across five splits, mean Full accuracy was 0.928021 versus 0.927916 for Stack-only, with positive net gate correction in only three of five seeds. The available archive lacks complete final-protocol Raw-only and trajectory-summary-only ablations; those historical component diagnostics remain protocol-qualified in Supplementary Table S3. The primary predictive contribution therefore remains with the trajectory-aware stack, not a statistically established independent improvement from the gate.
5.2. Contextual-Bandit Reliability Control
Q and gate G optimize distinct events: action correctness and potential correction of a wrong stacking prediction, respectively. The fixed τ = 0.66 applies to G, not to Q. For final seed 42 the gate changed 44 predictions, correcting 28 and harming 16, with a net +12. Across five splits, net corrections were +12, −2, −7, +12 and +12; this sparse effect is not uniform. The one-step offline contextual-bandit formulation describes internal evidence-path selection and should not be interpreted as clinical sequential reinforcement learning. The audited Q-fold isolation and common fitted Base pathway address previously identified protocol issues, subject to the source/evidence boundaries described below.
5.3. Limitations
This study was evaluated retrospectively using internal MIMIC-IV data. No external institutional test, prospective clinical evaluation, clinician-adjudicated reference standard or real-world deployment was performed. Some complete-patient trajectories contain information from admissions after an indexed first encounter, so the study does not demonstrate first-encounter prediction. In the final protocol, Q validation features were constructed without the corresponding validation-fold labels, and one core-trained Base model with common preprocessing was used for gate development and testing. No subject overlap was found in the reconstructed partition checks. The Q diagnostics for the remaining four splits did not change the fitted formal models or predictions. However, random-state offset rules were recorded differently for seed 42 and the other four splits, and the final fitted Stack, Q and gate models for those four splits were not completely archived. The supplied code also requires credentialed local MIMIC-derived inputs and does not independently rebuild the initial wide table. Separate exploratory analyses of prevalence, trajectory length, calibration, decision curves and neural baselines were not rerun using the final protocol and are not directly comparable with the main results. Gate corrections were sparse and varied across splits, and the primary paired accuracy interval included zero. As shown in Table 17.
Table 17.
Claim boundary of the current manuscript.
5.4. Future Work
Future work will prioritize external validation using independent EHR databases with harmonized phenotype definitions and predictor mappings. The primary transportability protocol will preserve the MIMIC-IV-trained model without refitting, harmonize the ICD phenotype definition, predictor units, and coding conventions in the target database, prespecify handling of unavailable predictors, and evaluate discrimination, calibration, subgroup performance, and subject-level uncertainty. Any recalibration or model updating will be reported as a secondary analysis rather than replacing the primary external-validation assessment. A second direction is continuous EHR integration, including incremental data ingestion, temporal model updating, drift monitoring, and prospective assessment of workflow effects. Future research should also examine whether the reliability-control layer provides greater value under distribution shift or cross-institutional deployment, where evidence-path uncertainty may be more pronounced.
6. Conclusions
The final five-split protocol supports the usefulness of trajectory-aware probability stacking for retrospective ICD-audited diabetes phenotype identification in MIMIC-IV. On the primary held-out split, Full SAG-RS achieved an accuracy of 0.926654 and AUC of 0.961288; mean accuracy across five splits was 0.928021 ± 0.002217. The principal gain over admission-level LightGBM arose from trajectory-derived stacking. The Q validation design and the common Base estimator for gate development and testing were checked using patient-separated data. Gate-switching yielded small and variable benefits, with no statistically established accuracy increment over Stack-only on the primary split. Different documented random-state offset rules and incomplete storage of final fitted estimators limit independent replay. The approach has not been externally validated and should not be interpreted as a real-time clinical diagnosis or treatment system.
Supplementary Materials
The following supporting information can be downloaded at: https://www.mdpi.com/article/10.3390/math14213978/s1, Exploratory sensitivity analyses conducted under earlier settings are distinguished in the manuscript from the final comparative results. Supplementary Figures S1–S6 and Tables S1–S9 are provided in SAG_RS_Supplementary_Exploratory_Analyses_Final.docx. These historical diagnostics were computed under earlier exploratory protocols, are separated from the final-model comparisons, and are not interpreted as estimates from the final audited protocol.
Author Contributions
Conceptualization, H.L., Y.C., S.L. and X.P.; Methodology, H.L., Y.C., Q.R., C.C. and Y.Z.; Software, H.L., Q.R., C.C. and Y.Z.; Validation, H.L., Y.C., Q.R. and S.L.; Formal analysis, H.L., Y.C. and Q.R.; Investigation, H.L.; Resources, Y.C., S.L. and X.P.; Data curation, H.L., C.C. and Y.Z.; Writing—original draft, H.L. and C.C.; Writing—review & editing, Y.C.; Visualization, H.L. and Q.R.; Supervision, S.L. and X.P.; Project administration, Y.C.; Funding acquisition, Y.C., Q.R., S.L. and X.P. All authors have read and agreed to the published version of the manuscript.
Funding
This work was supported by the Hunan Provincial Natural Science Foundation of China (2026JJ90123), the Scientific Research Fund of Hunan Provincial Education Department (25B0933, 25B0931, 24A0711), the Hunan Provincial Natural Science Foundation of China (2026JJ30113), the China University Industry–University–Research Innovation Foundation (2022MU089), the Key Project of the 14th Five-Year Plan of Education Science of Hunan Province (XJK23AJD016), Hunan Province “Four New” Research and Practice Project: Exploration and Practice of the “Four-Dimension and Three-Stage” Cross-Cultivation Path for Innovation and Entrepreneurship Ability in the Digital Intelligence Technology Professional Cluster, and Hunan Provincial Teaching Reform Research Project in Higher Education (202502001779, 202401001712, 202502001790).
Institutional Review Board Statement
The original collection, de-identification and sharing of MIMIC-IV were reviewed by the Institutional Review Board of Beth Israel Deaconess Medical Center, which approved the data-sharing initiative and waived informed consent. This study involved secondary analysis of the credentialed-access de-identified database without direct patient contact.
Informed Consent Statement
Informed consent was waived for the collection and sharing of the original de-identified MIMIC-IV resource, as reported by PhysioNet. No identifiable patient information was collected or reported in this secondary analysis.
Data Availability Statement
MIMIC-IV v3.1 is available to credentialed users through PhysioNet (https://physionet.org/content/mimiciv/3.1/, accessed on 4 September 2026) under its data-use agreement. The supplementary code-and-results archive contains the available final-analysis scripts, configuration records, predictor names and aggregate evaluation outputs. Restricted patient-level inputs, predictions, subject identifiers, training caches and fitted models are not redistributed. Independent execution of the available scripts requires authorized locally prepared MIMIC-derived input data.
Conflicts of Interest
The authors declare that they have no conflicts of interest, financial or otherwise. The authors also declare that there are no relationships or activities that could appear to have influenced the submitted work.
References
- Johnson, A.E.W.; Bulgarelli, L.; Shen, L.; Gayles, A.; Shammout, A.; Horng, S.; Pollard, T.J.; Hao, S.; Moody, B.; Gow, B.; et al. MIMIC-IV, a freely accessible electronic health record dataset. Sci. Data 2023, 10, 1. [Google Scholar] [CrossRef] [Scilit]
- American Diabetes Association Professional Practice Committee. 2. Diagnosis and classification of diabetes: Standards of Care in Diabetes—2024. Diabetes Care 2024, 47, S20–S42. [Google Scholar] [CrossRef] [Scilit]
- Wang, S.C.Y.; Nickel, G.; Venkatesh, K.P.; Raza, M.M.; Kvedar, J.C. AI-based diabetes care: Risk prediction models and implementation concerns. npj Digit. Med. 2024, 7, 36. [Google Scholar] [CrossRef] [Scilit]
- Mohsen, F.; Al-Absi, H.R.H.; Yousri, N.A.; El Hajj, N.; Shah, Z. A scoping review of artificial intelligence-based methods for diabetes risk prediction. npj Digit. Med. 2023, 6, 197. [Google Scholar] [CrossRef] [Scilit]
- Rajpurkar, P.; Chen, E.; Banerjee, O.; Topol, E.J. AI in health and medicine. Nat. Med. 2022, 28, 31–38. [Google Scholar] [CrossRef] [Scilit]
- Yang, S.; Varghese, P.; Stephenson, E.; Tu, K.; Gronsbell, J. Machine learning approaches for electronic health records phenotyping: A methodical review. J. Am. Med. Inform. Assoc. 2023, 30, 367–381. [Google Scholar] [CrossRef] [Scilit]
- Carrasco-Ribelles, L.A.; Llanes-Jurado, J.; Gallego-Moll, C.; Cabrera-Bean, M.; Monteagudo-Zaragoza, M.; Violán, C.; Zabaleta-Del-Olmo, E. Prediction models using artificial intelligence and longitudinal data from electronic health records: A systematic methodological review. J. Am. Med. Inform. Assoc. 2023, 30, 2072–2082. [Google Scholar] [CrossRef] [Scilit]
- Swinckels, L.; Bennis, F.C.; Ziesemer, K.A.; Scheerman, J.F.M.; Bijwaard, H.; de Keijzer, A.; Bruers, J.J. The use of deep learning and machine learning on longitudinal electronic health records for the early detection and prevention of diseases: Scoping review. J. Med. Internet Res. 2024, 26, e48320. [Google Scholar] [CrossRef] [Scilit]
- Kline, A.; Wang, H.; Li, Y.; Dennis, S.; Hutch, M.; Xu, Z.; Wang, F.; Cheng, F.; Luo, Y. Multimodal machine learning in precision health: A scoping review. npj Digit. Med. 2022, 5, 171. [Google Scholar] [CrossRef] [Scilit]
- Soenksen, L.R.; Ma, Y.; Zeng, C.; Boussioux, L.; Villalobos Carballo, K.; Na, L.; Wiberg, H.M.; Li, M.L.; Fuentes, I.; Bertsimas, D. Integrated multimodal artificial intelligence framework for healthcare applications. npj Digit. Med. 2022, 5, 149. [Google Scholar] [CrossRef] [Scilit]
- Borisov, V.; Leemann, T.; Seßler, K.; Haug, J.; Pawelczyk, M.; Kasneci, G. Deep neural networks and tabular data: A survey. IEEE Trans. Neural Netw. Learn. Syst. 2024, 35, 7499–7519. [Google Scholar] [CrossRef] [Scilit]
- Seto, H.; Oyama, A.; Kitora, S.; Toki, H.; Yamamoto, R.; Kotoku, J.; Haga, A.; Shinzawa, M.; Yamakawa, M.; Fukui, S.; et al. Gradient boosting decision tree becomes more reliable than logistic regression in predicting probability for diabetes with big data. Sci. Rep. 2022, 12, 15889. [Google Scholar] [CrossRef] [Scilit]
- Yu, C.; Liu, J.; Nemati, S.; Yin, G. Reinforcement learning in healthcare: A survey. ACM Comput. Surv. 2023, 55, 1–36. [Google Scholar] [CrossRef] [Scilit]
- Jayaraman, P.; Desman, J.; Sabounchi, M.; Nadkarni, G.N.; Sakhuja, A. A primer on reinforcement learning in medicine for clinicians. npj Digit. Med. 2024, 7, 337. [Google Scholar] [CrossRef] [Scilit]
- Zhou, D.; Zhang, Y.; Sonabend-W, A.; Wang, Z.; Lu, J.; Cai, T. Federated offline reinforcement learning. J. Am. Stat. Assoc. 2024, 119, 3152–3163. [Google Scholar] [CrossRef] [Scilit]
- de Hond, A.A.H.; Leeuwenberg, A.M.; Hooft, L.; Kant, I.M.J.; Nijman, S.W.J.; van Os, H.J.A.; Aardoom, J.J.; Debray, T.P.A.; Schuit, E.; van Smeden, M.; et al. Guidelines and quality criteria for artificial intelligence-based prediction models in healthcare: A scoping review. npj Digit. Med. 2022, 5, 2. [Google Scholar] [CrossRef] [Scilit]
- Collins, G.S.; Moons, K.G.M.; Dhiman, P.; Riley, R.D.; Beam, A.L.; Van Calster, B.; Ghassemi, M.; Liu, X.; Reitsma, J.B.; van Smeden, M.; et al. TRIPOD+AI statement: Updated guidance for reporting clinical prediction models that use regression or machine learning methods. BMJ 2024, 385, e078378. [Google Scholar] [CrossRef] [Scilit]
- Choi, E.; Bahadori, M.T.; Kulas, J.A.; Schuetz, A.; Stewart, W.F.; Sun, J. RETAIN: An interpretable predictive model for healthcare using reverse time attention mechanism. In Advances in Neural Information Processing Systems 29; Neural Information Processing Systems Foundation, Inc.: La Jolla, CA, USA, 2016; pp. 3504–3512. [Google Scholar]
- Li, Y.; Rao, S.; Solares, J.R.A.; Hassaine, A.; Ramakrishnan, R.; Canoy, D.; Zhu, Y.; Rahimi, K.; Salimi-Khorshidi, G. BEHRT: Transformer for electronic health records. Sci. Rep. 2020, 10, 7155. [Google Scholar] [CrossRef] [Scilit]
- Rasmy, L.; Xiang, Y.; Xie, Z.; Tao, C.; Zhi, D. Med-BERT: Pretrained contextualized embeddings on large-scale structured electronic health records for disease prediction. npj Digit. Med. 2021, 4, 86. [Google Scholar] [CrossRef] [Scilit]
- Efthimiou, O.; Seo, M.; Chalkou, K.; Debray, T.; Egger, M.; Salanti, G. Developing clinical prediction models: A step-by-step guide. BMJ 2024, 386, e078276. [Google Scholar] [CrossRef] [Scilit]
- Collins, G.S.; Dhiman, P.; Ma, J.; Schlussel, M.M.; Archer, L.; Van Calster, B.; Harrell, F.E., Jr.; Martin, G.P.; Moons, K.G.M.; van Smeden, M.; et al. Evaluation of clinical prediction models (part 1): From development to external validation. BMJ 2024, 384, e074819. [Google Scholar] [CrossRef] [Scilit]
- Riley, R.D.; Archer, L.; Snell, K.I.E.; Ensor, J.; Dhiman, P.; Martin, G.P.; Bonnett, L.J.; Collins, G.S. Evaluation of clinical prediction models (part 2): How to undertake an external validation study. BMJ 2024, 384, e074820. [Google Scholar] [CrossRef] [Scilit]
- Van Calster, B.; Collins, G.S.; Vickers, A.J.; Wynants, L.; Kerr, K.F.; Barreñada, L.; Varoquaux, G.; Singh, K.; Moons, K.G.M.; Hernandez-Boussard, T.; et al. Evaluation of performance measures in predictive artificial intelligence models to support medical decisions: Overview and guidance. Lancet Digit. Health 2025, 7, 100916. [Google Scholar] [CrossRef] [Scilit]
- Liou, L.; Scott, E.; Parchure, P.; Ouyang, Y.; Egorova, N.; Freeman, R.; Hofer, I.S.; Nadkarni, G.N.; Timsina, P.; Kia, A.; et al. Assessing calibration and bias of a deployed machine learning malnutrition prediction model within a large healthcare system. npj Digit. Med. 2024, 7, 149. [Google Scholar] [CrossRef] [Scilit]
- Andaur Navarro, C.L.; Damen, J.A.A.; Takada, T.; Nijman, S.W.J.; Dhiman, P.; Ma, J.; Collins, G.S.; Bajpai, R.; Riley, R.D.; Moons, K.G.M.; et al. Systematic review finds “spin” practices and poor reporting standards in studies on machine learning-based prediction models. J. Clin. Epidemiol. 2023, 158, 99–110. [Google Scholar] [CrossRef] [Scilit]
- Haug, C.J.; Drazen, J.M. Artificial intelligence and machine learning in clinical medicine, 2023. N. Engl. J. Med. 2023, 388, 1201–1208. [Google Scholar] [CrossRef] [Scilit]
- Lekadir, K.; Frangi, A.F.; Porras, A.R.; Glocker, B.; Cintas, C.; Langlotz, C.P.; Weicken, E.; Asselbergs, F.W.; Prior, F.; Collins, G.S.; et al. FUTURE-AI: International consensus guideline for trustworthy and deployable artificial intelligence in healthcare. BMJ 2025, 388, e081554. [Google Scholar] [CrossRef] [Scilit]
- Wells, B.J.; Nguyen, H.M.; McWilliams, A.; Pallini, M.; Bovi, A.; Kuzma, A.; Kramer, J.; Chou, S.-H.; Hetherington, T.; Corn, P.; et al. A practical framework for appropriate implementation and review of artificial intelligence (FAIR-AI) in healthcare. npj Digit. Med. 2025, 8, 514. [Google Scholar] [CrossRef] [Scilit]
- Jacob, C.; Brasier, N.; Laurenzi, E.; Heuss, S.; Mougiakakou, S.-G.; Cöltekin, A.; Peter, M.K. AI for IMPACTS framework for evaluating the long-term real-world impacts of AI-powered clinician tools: Systematic review and narrative synthesis. J. Med. Internet Res. 2025, 27, e67485. [Google Scholar] [CrossRef] [Scilit]
- Alderman, J.E.; Palmer, J.; Laws, E.; McCradden, M.D.; Ordish, J.; Ghassemi, M.; Pfohl, S.R.; Rostamzadeh, N.; Cole-Lewis, H.; Glocker, B.; et al. Tackling algorithmic bias and promoting transparency in health datasets: The STANDING Together consensus recommendations. Lancet Digit. Health 2025, 7, e64–e88. [Google Scholar] [CrossRef] [Scilit]
- van Smeden, M.; Heinze, G.; Van Calster, B.; Asselbergs, F.W.; Vardas, P.E.; Bruining, N.; de Jaegere, P.; Moore, J.H.; Denaxas, S.; Boulesteix, A.-L.; et al. Critical appraisal of artificial intelligence-based prediction models for cardiovascular disease. Eur. Heart J. 2022, 43, 2921–2930. [Google Scholar] [CrossRef] [Scilit]
- Luo, Y.; Wunderink, R.G.; Lloyd-Jones, D. Proactive vs reactive machine learning in health care: Lessons from the COVID-19 pandemic. JAMA 2022, 327, 623–624. [Google Scholar] [CrossRef] [Scilit]

Disclaimer/Publisher’s Note: The statements, opinions and data contained in all publications are solely those of the individual author(s) and contributor(s) and not of MDPI and/or the editor(s). MDPI and/or the editor(s) disclaim responsibility for any injury to people or property resulting from any ideas, methods, instructions or products referred to in the content. |
© 2026 by the authors. Licensee MDPI, Basel, Switzerland. This article is an open access article distributed under the terms and conditions of the Creative Commons Attribution (CC BY) license.