


Abstract
As electric buses become increasingly integrated into urban public transport systems, research on their role in transfer networks remains limited. Passengers often encounter extended waiting times during transfers, raising equity concerns. This study formulates a multi-objective mixed-integer quadratic programming (MIQP) model to optimise electric-bus transfer-station planning, considering station-level transfer equity, the surrounding built environment, multimodal transfers involving metro services and taxis, and the operational characteristics of electric buses. The model aims to (1) minimise passenger transfer-time burden, (2) reduce system operating costs, and (3) improve station-level horizontal transfer equity. Sensitivity analyses are conducted for time cost and preference parameters. The Harbin case study shows that, compared with the original scheme, the optimised scheme reduces total transfer time by 11.25%, decreases the variance-based equity indicator by 25.52%, reduces the maximum transfer utility by 14.99%, and lowers annual operating costs by 206,700 CNY. This study provides crucial insights for optimising electric-bus deployment in the broader context of public transport electrification.
MSC:
90C11; 90C29
1. Introduction
Urbanisation requires sustainable urban development through integrated urban design and transportation planning [1]. Multimodal transportation, encompassing buses, subways, and taxis, mitigates congestion but requires optimised transfer strategies to overcome system coverage limitations. Current research predominantly focuses on bus–subway interconnectivity, neglecting built-environment heterogeneity and passenger transfer distances. The integration of public transportation with land use is crucial to minimise passenger inconvenience. Additionally, the predominant focus on fuel-powered buses in public transport transfer research overlooks the rapidly expanding use of electric buses.
Electric vehicles (EVs), especially buses, are gaining prominence as viable alternatives to reduce emissions and achieve net-zero commitments [2]. Despite their maturity [3], electric buses face challenges such as battery life, energy density, charging infrastructure, and operational range. Recent studies have therefore increasingly focused on bus-fleet electrification strategies and the coordinated optimisation of vehicle operation, charging schedules, and charging infrastructure under battery and operational constraints [4,5,6,7]. More broadly, recent advances in edge perception and data-driven condition monitoring also illustrate the expanding role of intelligent sensing and artificial intelligence in transportation and engineering systems [8,9]. However, their increasing implementation necessitates a new wave of research to address these technological shifts [10,11,12,13]. This study investigates integrated transfer optimisation involving electric buses, metro services, and taxis, which is an essential aspect of future electrified transportation. Optimising transfer stations and distances will enhance public transport efficiency and passenger experience.
Passengers transferring between modes may experience substantial differences in waiting and walking times across transfer stations. In this study, equity is interpreted as horizontal equity in transfer-service conditions: passengers using the same multimodal public transport system should not be exposed to disproportionately different transfer-time burdens solely because of where they transfer. Accordingly, waiting and walking times are treated as components of transfer-time burden, while the dispersion of this burden across transfer stations is used to characterise equity [14].
In the next section, we summarise the existing research on public transport transfers, passenger transfer environments, and passenger travel equity. Section 2 formulates the electric--bus transfer optimisation model. The base case study and scenarios for the subsequent numerical analysis are presented in Section 3. Section 4 summarises the main conclusions drawn from the results of the preceding scenarios and comparisons.
1.1. Literature Review
Intermodal transportation, integrating various modes of transport, has significantly enhanced overall transport accessibility. In recent years, multimodal public transport integration has garnered significant attention. Existing research on multimodal public transport integration has primarily focused on transfer-related issues. Therefore, we first review transfers between buses and other modes of transport, followed by an examination of passenger transfer environments, and, finally, we discuss passenger equity in transfers.
1.1.1. Transfers Between Public Transport and Other Modes of Travel
Bus access to rapid-transit service in eight large U.S. cities (excluding New York) represents on average a non-trivial 19.1% of system-wide access mode share [15]. Wu et al. [16] used multiple data sources from Shenzhen to identify subway and bus transfer behaviours. They employed Ordinary Least Squares (OLS) regression and Geographic Weighted Regression (GWR) to investigate the influence of weather and built environment on the transfer rates between bus and subway systems. Chen et al. [17] incorporated the spatial heterogeneity of the built environment into a nonlinear model to explore the linear impact of the built environment on public transport system passenger flows at the regional scale. Nassir et al. [18] developed a heuristic algorithm through the study of multi-stage travel patterns and route choices of public transport passengers, thereby enhancing the accuracy of identifying public transport system transfers. Aldaihani et al. [19] studied passenger transfers between conventional buses and demand-responsive modes of transport, where on-demand services connect bus stops with their surrounding environments. More recently, Kim and Schonfeld [20,21] extended the original model to scenarios where different areas of service are interconnected through a central hub where users transfer. These contributions introduce the operation with mixed fleets and the transfer coordination between bus services in the analysis. Along similar lines, Guo et al. [22] evaluate a dynamic switching strategy where these two alternatives are interchangeable along the day to better adapt services to variations in passenger demand.
Existing bus transfer studies commonly employ discrete optimisation approaches to optimise transit networks under discrete travel demand. These studies mainly focus on bus–metro integration, without considering the simultaneous consideration of taxis in multimodal transfers. Related research primarily focuses on the transfer issues of traditional fuel-powered buses, paying less attention to the transfer issues of electric buses, especially regarding the optimisation of electric-bus transfers considering the urban built environment.
1.1.2. Passenger Transfer Environments
Crowley et al. [23] found that built-environment characteristics affect accessibility and the perceived convenience of walking. Environments suitable for walking constitute a vital part of a successful public transport system and potentially an attractive urban environment as well [24]. Schlossberg and Brown [25] define walkability as a simple dichotomy of a pedestrian-friendly or pedestrian-hostile network and assign these classifications based on a variety of factors and measures such as population density, land-use mix, roadway connectivity, and building design. In studying the shift from private car travel to public transport, these authors point out that, for public transport to be well connected and competitive, and to facilitate mode shift, high-quality public transport must be easily accessible at both ends. Recent empirical studies further indicate that built-environment, accessibility, and transport-service characteristics influence both general bus-use behaviour and bus–metro intermodal demand [26,27].
In summary, the mediating role of land use and the built environment in walking and other travel behaviours has garnered attention and has been confirmed in specific contexts. However, current research primarily focuses on major hub stations, and there is a relative lack of investigation into this aspect at public transit transfer stations.
1.1.3. Passenger Travel Equity
Public transport transfers unavoidably involve walking a certain distance. The prevailing consensus in current research, as evidenced by studies such as that by Park et al. [28], highlights the paramount importance of minimising both total travel distance and travel time as fundamental factors in devising pedestrian routes. Deng et al. [29] constructed a hybrid city bus model. They established a model to quantify the level of traffic service provision within Traffic Analysis Zones (TAZs), as well as a methodology to compute the demand disparities among TAZs, with the objective of representing equity. Perugia et al. [30] introduced a multi-objective model incorporating equity considerations through temporal windows governing bus arrival times at stops. Han et al. [31] jointly optimised train stopping plans and timetables under dynamic passenger demand, further demonstrating the importance of incorporating time-dependent passenger conditions into public transport service optimisation. Ruiz et al. [32] proposed a bus frequency optimisation methodology. Equity in each district was evaluated based on the level of service, the resident population, and the rate of need for public transport.
The aforementioned studies have aimed at minimising time consumption and socioeconomic indicator disparities, respectively, but have not examined inequalities in passenger transfer time in depth. To the best of the authors’ knowledge, transit equity has rarely been explicitly incorporated into bus-system design and planning, and there is a lack of clarity in both defining equity and determining how it should be integrated into planning processes [33]. Studies on the relationship between equity and travel efficiency have generally found that enhancing equity could potentially reduce travel efficiency. However, the benefits in terms of equity and cost savings may outweigh the associated loss in travel efficiency in terms of passenger travel efficiency [34]. Recent studies have further extended equity-oriented optimisation to battery-electric-bus network design and hierarchical multimodal public transport networks, demonstrating that equity can be incorporated directly into network design and service-allocation decisions rather than being evaluated only after planning [35,36].
1.2. Contributions
This study integrates station-level transfer equity, the built environment around bus stations, and electric-bus operational characteristics into a MIQP framework for transfer-station planning. The main contributions are as follows:
- (1)
- Horizontal Transfer-Equity Framework: Building on Shao et al. [34], this study characterises station-level horizontal equity through the distribution of transfer-time burden, defined as the sum of waiting and walking times. The variance of transfer utility across stations is adopted as the primary disparity indicator, while the worst-case transfer utility and the distribution of high-burden transfer levels are used as complementary validation measures. In addition, a method for identifying passenger flows between buses and subways and between buses and taxis is developed.
- (2)
- Multi-objective Electric-Bus Transfer-Station Optimisation: The proposed MIQP jointly minimises passenger transfer-time burden, operating cost, and station-level transfer disparity while incorporating electric-bus operational constraints, including SoC limits, energy conservation, charging requirements, transfer-mode selection, and vehicle capacity. The framework considers both bus–metro and bus–taxi transfers.
- (3)
- SDM-Informed Spatial Integration: The SDM is used to estimate the direct and spillover effects of built-environment and transport-service characteristics on transfer demand. These spatial effects are subsequently summarised into station-specific transfer-demand impact coefficients , which are treated as fixed exogenous inputs to the MIQP.
Taken together, the novelty of this study lies in integrating station-level horizontal transfer equity, SDM-derived spatial demand effects, and electric-bus operational feasibility within a unified multimodal transfer-station optimisation framework. The contribution is not limited to introducing these components individually, but to linking them sequentially so that spatial heterogeneity in transfer demand informs the optimisation while battery, charging, and SoC constraints preserve operational feasibility. The Harbin case study further demonstrates the practical value of this integration: compared with the original scheme, the optimised scheme reduces total transfer time by 11.25%, decreases annual operating cost by 206,700 CNY, and reduces the variance-based equity indicator by 25.52%. The maximum transfer utility is also reduced by 14.99%, providing complementary evidence that the improvement in equity is accompanied by a reduction in the worst transfer burden.
2. Methodological Framework
2.1. Problem Statement
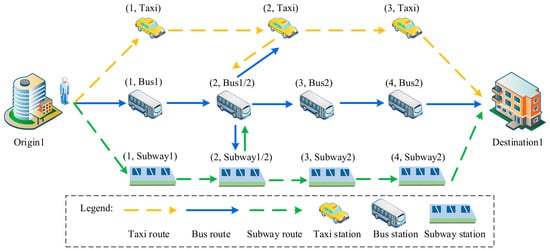
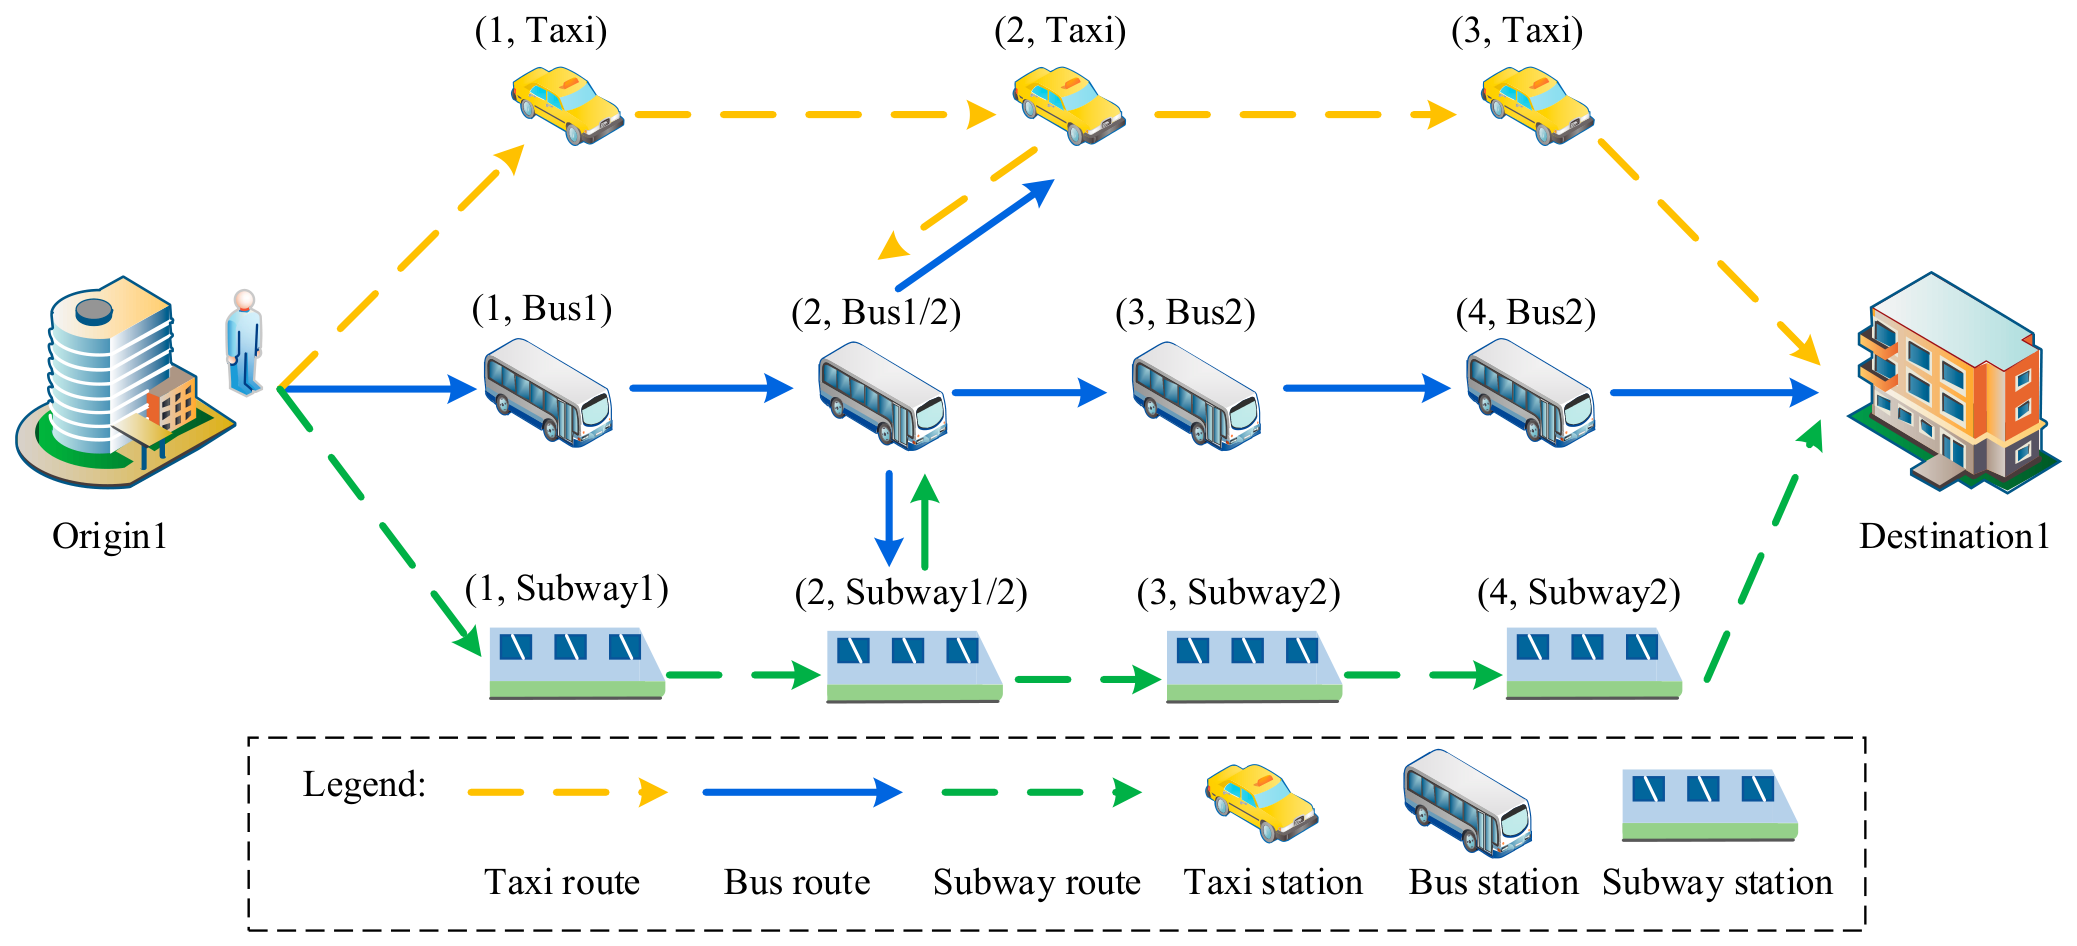
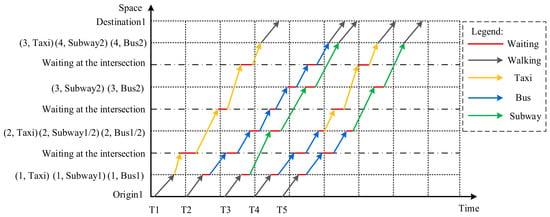
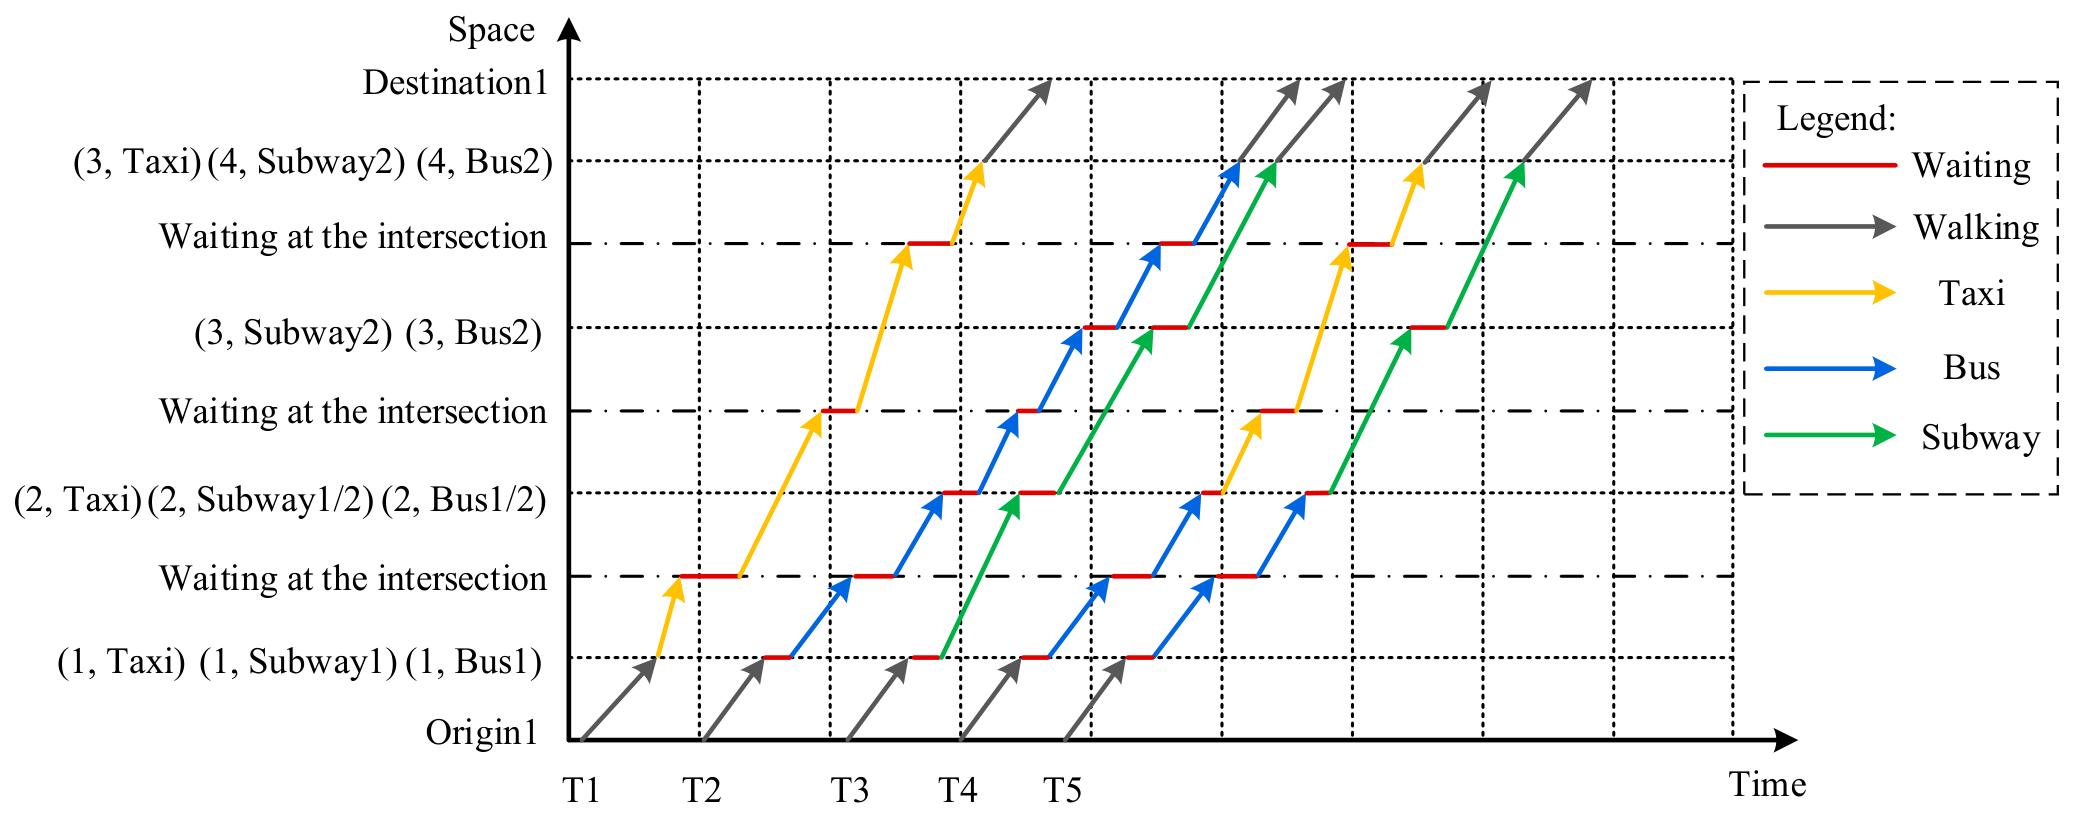
Transfer is a complex issue that requires consideration from both spatial and temporal perspectives. In practice, an urban multimodal public transport system can be represented as a set of mode-specific networks connected through transfer points. Passengers can choose to complete their journey within one mode of travel or reach their destination by transferring between different modes. Consider a transportation corridor with four nodes, where (1, Bus 1) denotes the node number, representing the first bus station of Bus Route 1. As shown in Figure 1, passengers travel from Origin 1 to Destination 1. Along the route, there are two bus routes: Bus Route 1 passes through Bus Stations 1–2, and Bus Route 2 passes through Bus Stations 2–3–4. Additionally, there are two subway lines: Subway Line 1 serves Subway Stations 1–2, and Subway Line 2 serves Subway Stations 2–3–4. Furthermore, there are flexible point-to-point taxi services. Figure 2 illustrates the possible travel paths. Paths T1, T2, and T3 represent trips completed within a single transport system, including a direct taxi trip, a trip involving transfers between bus routes, and a trip involving transfers between metro lines, respectively, or first taking Bus Line 1 and transferring at Bus Station 2 to Bus Line 2, or first taking Subway Line 1 and transferring at Metro Station 2 to Subway Line 2. Paths T4 and T5 involve transfers between different transport systems; T4 is a bus-to-taxi transfer, and T5 is a bus-to-subway transfer. Passengers may therefore experience different travel patterns involving different transport modes and transfer processes. This study focuses on transfers among bus, metro, and taxi services, with the aim of improving multimodal transfer performance and passenger service quality.
Figure 1.
Multimodal public transport travel mode combinations.
Figure 2.
Multimodal public transport travel time combinations.
Recent direct-demand transit ridership modelling and passenger rail studies that explore the potential influence of land use and built environment (LU-BE) tend to focus on areas surrounding rapid-transit stations (e.g., TODs) but overlook the potential influence of the same LU-BE attributes in areas surrounding feeder bus stations. This is a noteworthy omission since many scholars have found favourable LU-BE factors around rapid-transit stations and bus stops to have a statistically significant and positive association with higher boarding counts [37]. This study investigates how the built environment around bus transfer stations in Harbin affects the number of passengers transferring at bus stations.
Bus transfer optimisation is not only an efficiency problem but also a resource-allocation problem. When the objective is limited to minimising total transfer time, improvements may be concentrated at high-demand stations, while passengers at other stations may still experience disproportionately long waiting or walking times [38]. In this study, we therefore focus on horizontal equity in transfer-service conditions rather than broader socioeconomic or vertical equity. Specifically, the transfer-time burden at station i is defined as the sum of waiting time and walking time, i.e., . These two components directly capture the out-of-vehicle time experienced during an interchange and are affected by station layout, transfer distance, and service coordination.
Several indicators can be used to represent distributional equity. A min–max formulation emphasises the worst-served station [39], whereas distribution-based measures such as the Gini coefficient or mean absolute deviation can describe inequality across the full set of stations. Following Shao et al. [34], this study uses the variance of station-level transfer utility because it accounts for all transfer stations and places a larger penalty on stations whose transfer-time burden deviates substantially from the system average. A lower variance therefore indicates more homogeneous transfer conditions across stations.
It should be noted that a lower variance alone does not necessarily imply a higher absolute level of service, because uniformly long transfer times could also produce a small variance. Therefore, the variance-based equity objective is not used independently in this study. Instead, it is jointly optimised with the total transfer-time objective, so that solutions achieving apparent equity by uniformly worsening transfer conditions are penalised through the transfer-time component. In the numerical analysis, the variance-based result is further examined using the maximum transfer utility and the distribution of high-burden transfer levels as complementary indicators.
where and denote, respectively, the waiting time and walking time associated with transfers at station i. The walking time is calculated as the transfer walking distance divided by the average pedestrian walking speed. denotes the station-level transfer utility, or equivalently the transfer-time burden, and denotes the mean transfer utility across the fixed evaluation set S, calculated as . Here, S is the fixed set of stations used to evaluate transfer-service performance, and N = |S| is therefore constant throughout the optimisation. The number of stations ultimately configured as intermodal transfer stations is treated separately as an optimisation-dependent quantity.
In transfer studies, few have considered the characteristics of electric buses and passenger equity, such as energy consumption limitations, charging demands, charging costs, etc. However, these aspects are fundamental issues in the development of electrified public transport. This study aims to fill this gap.
2.2. Assumptions and Definition of the Research Question
To facilitate the model implementation, the following assumptions are introduced:
Assumption 1.
A homogeneous bus type is assumed throughout the operating period.
Assumption 2.
Travellers select the path with the lowest travel time cost based on the traffic operation information obtained and their personal travel preferences.
Assumption 3.
Passenger-load-dependent energy consumption and power-grid operating constraints are not modelled explicitly. Electric-bus energy consumption is represented at the route level through the distance-based energy consumption term and the additional energy consumption term associated with speed variations, while charging power and electricity prices are treated as exogenous inputs.
Assumption 4.
Vehicles will be fully charged at the depot after finishing all tasks for the day to ensure that vehicles have enough power for the next day’s operation. Charging resources at the depot are assumed sufficient [40].
These assumptions are introduced to keep the optimisation focused on transfer-station planning and electric-bus operational feasibility rather than on detailed vehicle-energy or distribution-grid modelling. Their implications should nevertheless be recognised. Neglecting passenger-load-dependent energy consumption may underestimate energy use on heavily loaded services and may therefore slightly overestimate the available SoC margin. Similarly, treating grid capacity as exogenous assumes that the specified charging demand can be supplied without local distribution-network constraints; where grid capacity is limited, feasible charging opportunities may be fewer than those represented in the model. Therefore, the results should be interpreted as planning outcomes under given charging-power availability and route-level energy consumption parameters rather than as a detailed representation of vehicle-load dynamics or distribution-grid operation.
The parameter definitions of the model are listed in Table 1.
Table 1.
Definition of the model’s parameters.
2.3. Factors Influencing Public Transport Passenger Transfer: A Built-Environment Perspective
Point of Interest (POI) data serve as a critical component of the built environment and provide useful information on urban land-use functions and the intensity of land development [41]. The built-environment elements within the influence range of bus stations were extracted using the buffer tool in ArcGIS 9.2. Among these, seven categories of POIs potentially associated with transfer behaviour were selected: catering, residential, shopping, hospitals, schools, companies, and government agencies. The selected built-environment indicators capture both differences in the surrounding environment within the direct and indirect catchment areas of stations and differences in accessibility across the public transport network. Additionally, it must reflect the varying urban design and layout across different stations. Based on the relevant literature [16,41,42] and the requirements of the present analysis, 14 indicators were selected to characterise the built environment and transfer conditions.
- 1.
- Density Indicators
The density indicators include the density of POIs for dining services (CSD), residential housing (), shopping services (), hospitals (), schools (), companies (), and government agencies ().
- 2.
- Distance Indicators
Distance is represented by the distance from the destination to the Central Business District (CBD), denoted as , and the distance between transfer stations, denoted as .
- 3.
- Land-Use Mix
The land-use mix (LM) is chosen as a measure of land-use diversity. The LM is calculated using the Herfindahl–Hirschman Index (HHI) principle [43], with the calculation formula given in Equation (3).
where is the total number of POIs within the mth grid. is the number of POIs of the kth category within the mth grid.
- 4.
- Transfer convenience
The convenience of transfers is characterised by the number of bus routes, the number of bus stations, the number of interchangeable subway lines, and the number of interchangeable taxis, denoted as , , , and , respectively. The number of interchangeable subway lines is determined by the number available within a radius of 500 m, and the number of interchangeable taxis is determined by the number available within a radius of 100 m.
Spatial dependence in transfer passenger flows may arise through two conceptually different channels. First, transfer demand in one traffic zone may be associated with transfer demand in neighbouring zones because adjacent zones are connected through the same public transport network. Second, built-environment and transport-service characteristics in one zone may influence transfer demand in nearby zones, generating exogenous spatial spillovers [44]. Therefore, a spatial specification capable of representing both endogenous interaction in transfer demand and spillover effects of explanatory variables is required.
The Spatial Durbin Model (SDM) is adopted as a general spatial specification because it simultaneously includes the spatial lag of the dependent variable and spatially lagged explanatory variables. In contrast, a spatial autoregressive model (SAR) omits spatially lagged explanatory variables, while a spatial error model (SEM) represents spatial dependence through the disturbance process rather than explicitly estimating covariate spillovers. This distinction is particularly relevant to the present study because the subsequent optimisation framework uses the estimated direct and spillover effects of built-environment attributes.
where denotes the bus transfer passenger flow in traffic zone i at time t, and denotes the kth explanatory variable in that zone. is an element of the spatial weight matrix W, which represents the spatial relationship between zones i and j. The coefficient captures endogenous spatial interaction in transfer passenger flows through the spatially lagged dependent variable WY, while measures the effects associated with spatially lagged explanatory variables WX. The coefficient represents the local effect of the explanatory variable, and is the disturbance term.
The SDM also provides a general framework that contains several commonly used spatial specifications as restricted cases. If = 0, the SDM reduces to the SAR model because spatially lagged explanatory variables are excluded. If = 0, the specification corresponds to a spatial lag of X (SLX) model. Under the common-factor restriction = −, the SDM can be transformed into an SEM representation. Therefore, retaining the unrestricted SDM avoids imposing these restrictions a priori and allows both endogenous spatial dependence and exogenous built-environment spillovers to be examined within a unified framework.
To derive the direct and spillover effects, the SDM is further expressed in matrix form following Ref. [45], as shown in Equations (5) and (6).
where denotes the n × n identity matrix. , . The matrix transformation of Equation (6) is presented as Equation (7).
By analysing the diagonal of Equation (7), the average direct effect , average total effect , and average spillover effect can be obtained, as shown in Equation (8).
The SDM and the subsequent transfer-station optimisation are implemented sequentially rather than estimated simultaneously. After the SDM is estimated, each transfer station is associated with the 0.5 km × 0.5 km spatial analysis unit in which it is located. The direct- and spillover-effect information associated with that spatial unit is summarised as the station-level direct-effect score and spillover-effect score , respectively. These two components are subsequently combined to construct the station-specific transfer-demand impact coefficient , as defined in Equation (13). Once obtained from the SDM stage, is treated as a fixed exogenous input in the optimisation stage and is not re-estimated as the transfer-station decisions change.
2.4. Electric-Bus Transfer Optimisation Model
In this study, three objectives are jointly considered: passenger transfer-time burden Z1, bus operating cost Z2, and station-level horizontal transfer disparity Z3. Because these objectives have different physical units and numerical scales, the coefficients applied to the raw objective values should not be interpreted directly as dimensionless weights. In the model, α1, α2, and α3 are used to specify the preference structure among the three objectives, while κ is introduced only as a numerical scaling coefficient for the equity term. The resulting weighted objective remains quadratic because Z3 contains squared deviations; therefore, the model is formulated as a MIQP problem.
For comparison and interpretation across objectives with different units, an equivalent normalised representation is introduced. Let R1, R2, and R3 denote fixed reference values of the three objectives obtained from the original transfer-station scheme. The dimensionless objective measures are defined as . The raw weighted objective can then be represented by the corresponding normalised objective contributions. This normalisation is used to interpret the relative influence of the three objectives, while the underlying optimisation results remain unchanged because the reference values are fixed constants.
- 1.
- Passenger transfer time
Passenger transfer time consists of two components: the time spent waiting for the connecting service and the time spent walking between transfer points. The station-level transfer utility, waiting time, and walking time are defined in Equations (10)–(12), respectively.
The SDM output enters the optimisation through the station-specific transfer-demand impact coefficient . For each station i, the local direct-effect component and the neighbouring spillover-effect component obtained from the preceding spatial analysis are combined as shown in Equation (13). A higher value of indicates that the spatial context surrounding station i is associated with a stronger influence on transfer demand. Importantly, does not alter the waiting time WTi or walking time WDTi themselves; rather, it adjusts the contribution of the corresponding station-level transfer-time burden to the objective Z1. Thus, stations associated with stronger SDM-estimated transfer-demand influence receive greater emphasis when transfer-time performance is optimised.
Accordingly, the passenger transfer-time objective can be interpreted as an SDM-informed objective in which 1 + serves as a station-specific spatial adjustment factor. The baseline term 1 preserves the original transfer-time contribution when the SDM-derived impact coefficient is zero, whereas differentiates the relative importance of transfer-time improvements across spatial locations. Because is determined before the optimisation and subsequently held fixed, this coupling does not introduce an additional endogenous relationship between the SDM and the MIQP. The SDM therefore provides upstream spatial information, while the MIQP determines the transfer-station configuration subject to the operational and equity objectives and constraints.
- 2.
- Bus operation cost
The operating costs of electric-bus services encompass driver wages, mileage expenses, charging fees, passenger time costs, and maintenance costs of charging infrastructures, as depicted by Equation (14).
- 3.
- Station-level horizontal transfer equity
The equity objective Z3 is defined as the variance of station-level transfer utility across the fixed evaluation set S, as shown in Equation (15). A lower value indicates smaller disparities in transfer-time burden among stations. Because variance alone does not represent the absolute level of service, Z3 is jointly optimised with the transfer-time objective Z1. This joint formulation prevents a solution with uniformly poor but equal transfer conditions from being preferred solely because of its low variance.
The variance term in Equation (15) is retained in its exact quadratic form and is not linearised. Because the evaluation set S is fixed and N = |S| is constant, Equation (15) can equivalently be written as . Therefore, Z3 is a quadratic function of the station-level transfer utilities. In matrix form, its quadratic coefficient matrix is proportional to , which is positive semidefinite. Hence, the variance-based equity objective is convex. Accordingly, the weighted optimisation model is classified as an MIQP rather than an MILP.
The constraints of the optimisation model primarily encompass the characteristic constraints of electric buses, constraints of transfer modes, and passenger capacity constraints within the vehicles.
- 1.
- Electric-bus characteristic constraints
Battery SoC constraints: To prevent battery overcharging and over-discharging, the SoC of each BEB is constrained to remain within the specified operating range. This SoC range also contributes to the robust operation of the BEB system. Equations (16) and (17) represent the lower and upper limits of the battery SoC, respectively.
where is the SOC value of route l for vehicle a at station i. represents the final SOC value obtained after the bus is charged again at the end of the previous day’s operation.
Energy conservation constraint: During operation, electric buses consume energy due to both travel distance and speed variations. Equation (19) represents the conservation of energy consumption and replenishment for electric buses.
Charging constraints: Equation (20) ensures that the charging time is not negative. Equation (21) represents the total time a vehicle spends charging at a charging station. Equation (22) ensures that only one type of charging facility is installed at a charging station.
The charging-time coefficient is treated as a prescribed input parameter, as defined in Table 1; therefore, Equation (21) remains linear in the decision variables.
These battery and charging constraints define the operationally feasible region of the transfer-station optimisation rather than serving as additional penalty terms in the objective function. Equations (16)–(18) prevent the battery SoC from falling outside its allowable operating range, Equation (19) links route-level energy consumption to the required energy replenishment, and Equations (20)–(22) restrict charging time and charging-facility availability. Consequently, transfer-station configurations that would otherwise appear attractive from the perspectives of transfer time, operating cost, or equity may become infeasible if the associated electric-bus operations cannot satisfy the battery-energy requirements.
- 2.
- Transfer-mode constraints
There are two transfer modes: bus-to-subway and bus-to-taxi. The specific selection criteria are as follows:
- Scenario 1: If > , passengers choose to transfer to the subway.
- Scenario 2: If = , passengers may choose to transfer either by subway or by taxi.
- Scenario 3: If < , passengers choose to transfer to a taxi.
The calculation method for the generalised cost of transferring from bus to subway is given by Equation (23), and the calculation method for the generalised cost of transferring from bus to taxi is given by Equation (24).
where represents the transfer utility from bus to subway and represents the transfer utility from bus to taxi.
- 3.
- Identification of transfer passenger flow
Bus–taxi transfer passenger flows are identified through a combination of taxi GPS trajectories, bus-stop locations, bus operating schedules, and field-survey information. First, valid taxi pick-up and drop-off events near bus stops are extracted from the cleaned trajectory records and spatially matched to the nearest bus stop using ArcGIS. The timestamps of these events are then cross-checked against the operating periods of the bus services serving the matched stops. This spatial–temporal matching identifies taxi activities that are potentially related to bus transfers. Because not every taxi pick-up or drop-off near a bus stop represents an intermodal transfer, field-survey information is further used to estimate the proportion of taxi activities that correspond to taxi–bus transfers. This survey-derived proportion is applied as an aggregate correction factor, as expressed in Equation (25).
where denotes the survey-derived proportion of taxi pick-up and drop-off activities near bus stops that are associated with taxi–bus transfers. is the estimated number of taxi–bus transfer passengers at station i, and is the total number of taxi passengers boarding or alighting near station i.
Bus–metro transfer flows are identified using both spatial proximity and temporal consistency criteria. For metro-to-bus transfers, bus stops located within a 500 m radius of a metro station are first regarded as spatially feasible transfer candidates. For each candidate pair, the time interval between metro exit and bus boarding is calculated, and the 95th percentile of the empirical transfer-time distribution is used as the temporal threshold following the procedure adopted in Ref. [46]. Only records satisfying both the spatial and temporal criteria are classified as potential metro-to-bus transfers.
For bus-to-metro transfers, the absence of bus alighting records requires an additional inference step. Candidate alighting stops are first inferred from consecutive AFC records and their proximity to metro stations. The nearest feasible bus stop within 500 m of the metro station is selected as a candidate, after which the bus operating record is checked to confirm that the corresponding service passed the candidate stop within a temporally feasible interval, following the procedure in Ref. [47]. The time interval between the inferred bus alighting event and metro entry is then evaluated, and the 95th percentile of the corresponding empirical distribution is used as the transfer-time threshold. The two directional transfer-flow estimates are subsequently combined.
The reliability of the transfer-identification procedure is supported by multiple consistency checks rather than by a single spatial threshold. Taxi-related transfers are screened using GPS location, pick-up/drop-off status, bus-stop proximity, bus operating time, and field-survey proportions. Bus–metro transfers are identified using a combination of spatial proximity, empirically derived temporal thresholds, and service-schedule consistency. The 500 m search radius restricts candidate transfer locations, while the 95th-percentile temporal criterion excludes observations with unusually long interchange intervals. Therefore, a record is retained as a potential transfer only when multiple spatial and temporal conditions are jointly satisfied.
Nevertheless, the procedure remains rule-based and cannot completely eliminate transfer misclassification. A larger spatial search radius may introduce false-positive transfer pairs, whereas a more restrictive radius may exclude legitimate transfers. Similarly, the temporal threshold may affect the balance between false-positive and false-negative classifications. Such identification errors would first affect the estimated station-level transfer passenger flows, which are subsequently used in the SDM. They may therefore influence the estimated direct and spillover effects and, through the SDM-derived coefficient , indirectly affect the relative contribution of each station to the transfer-time objective in the MIQP. By contrast, these identification uncertainties do not directly alter the battery, charging, SoC, or vehicle-capacity constraints.
- 4.
- In-vehicle passenger capacity constraint
Constraint 4 ensures that the maximum vehicle load (i.e., the left-hand side of (26)) does not exceed the vehicle capacity K (patrons/vehicle).
In this study, and are input quantities obtained from passenger-flow estimation and the observed service schedule, respectively, rather than decision variables in the transfer-station optimisation [48].
3. Numerical Studies
3.1. Basic Data Preparation
To evaluate the proposed framework, it was applied to a case study of the public transport system in Harbin, China. The case study uses more than one million POI records from December 2021, obtained from the Baidu Maps Developer Platform. Additionally, data on bus card swipes, subway card swipes, taxi GPS data, and several manually surveyed data points were acquired through related research projects conducted in 2021. The data was cleaned and mapped using Python 3.9 and ArcMap 10.2. Data analysis and visualisation were conducted using SPSS Statistics 25 and Origin 2023b, yielding the datasets used to analyse 25 bus routes. The resulting MIQP model was solved using Gurobi Optimizer on a Windows personal computer equipped with an Intel i7-9700 3.0 GHz CPU and 8 GB RAM.
The baseline coefficients were set to α1 = α2 = α3 = 1/3 to define a neutral initial preference scenario in which none of the three objectives is excluded a priori. These coefficients should not be interpreted as implying equal numerical contributions of the raw objectives because the objectives have different units and scales. The coefficient is used only for numerical scale adjustment of the equity term and does not represent an additional preference weight. The robustness of the optimisation results to alternative preference structures is examined in Section 3.4.
Table 2 presents the basic information of the selected bus lines within the case study area, including route length, daily mileage, number of drivers, daily operating hours, and average daily transfer passenger flow.
Table 2.
Basic information for the selected bus lines.
Time-of-use electricity prices were considered when calculating electric-bus charging costs. Table 3 presents the electricity prices during peak, flat, and valley periods [49].
Table 3.
Time-of-use electricity prices for charging.
Table 4 summarises the input parameters used in the optimisation model. The charging efficiency of the charging facilities is assumed to be 90%, with a minimum charging time of 0.5 min. Together with the time-of-use electricity prices presented in Table 3, these parameters are used to calculate the objective function values.
Table 4.
Input parameters.
To examine whether the electric-bus energy constraints are non-trivial for the case study, a route-level feasibility screening was conducted using the retained mileage and energy consumption parameters. Assuming a vehicle starts daily operation at the maximum allowable SoC of 90% and receives no intermediate charging, the approximate daily battery depletion for route l can be evaluated as 12.5% + 0.56% dl, where dl is the daily mileage reported in Table 2. Under the minimum allowable SoC of 20%, Routes 63, 150, and 363 would reach approximately 17.86%, 3.29%, and 3.41% SoC, respectively, and would therefore violate the lower SoC bound without energy replenishment. Routes 66, 218, and 377 would remain only slightly above the lower bound, at approximately 21.65%, 22.93%, and 23.19%, respectively. This screening confirms that the battery, charging, and SoC constraints are active from an operational-feasibility perspective for a non-negligible subset of the studied routes and therefore cannot be removed without changing the feasible solution space.
This calculation is intended as a feasibility check rather than as a re-optimisation without battery constraints; it isolates the physical relevance of the energy restrictions using the same parameter values adopted in the optimisation model.
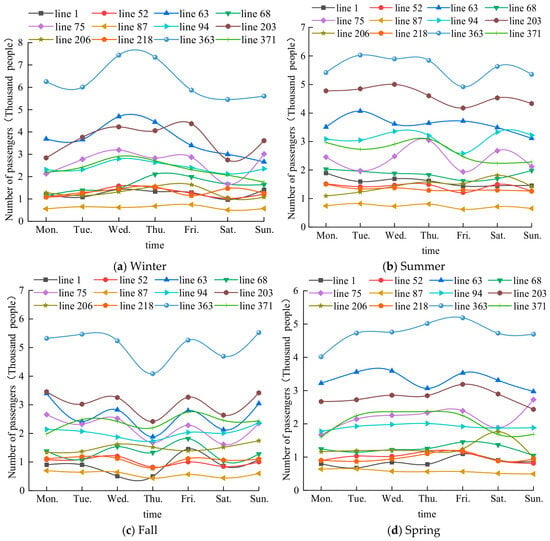
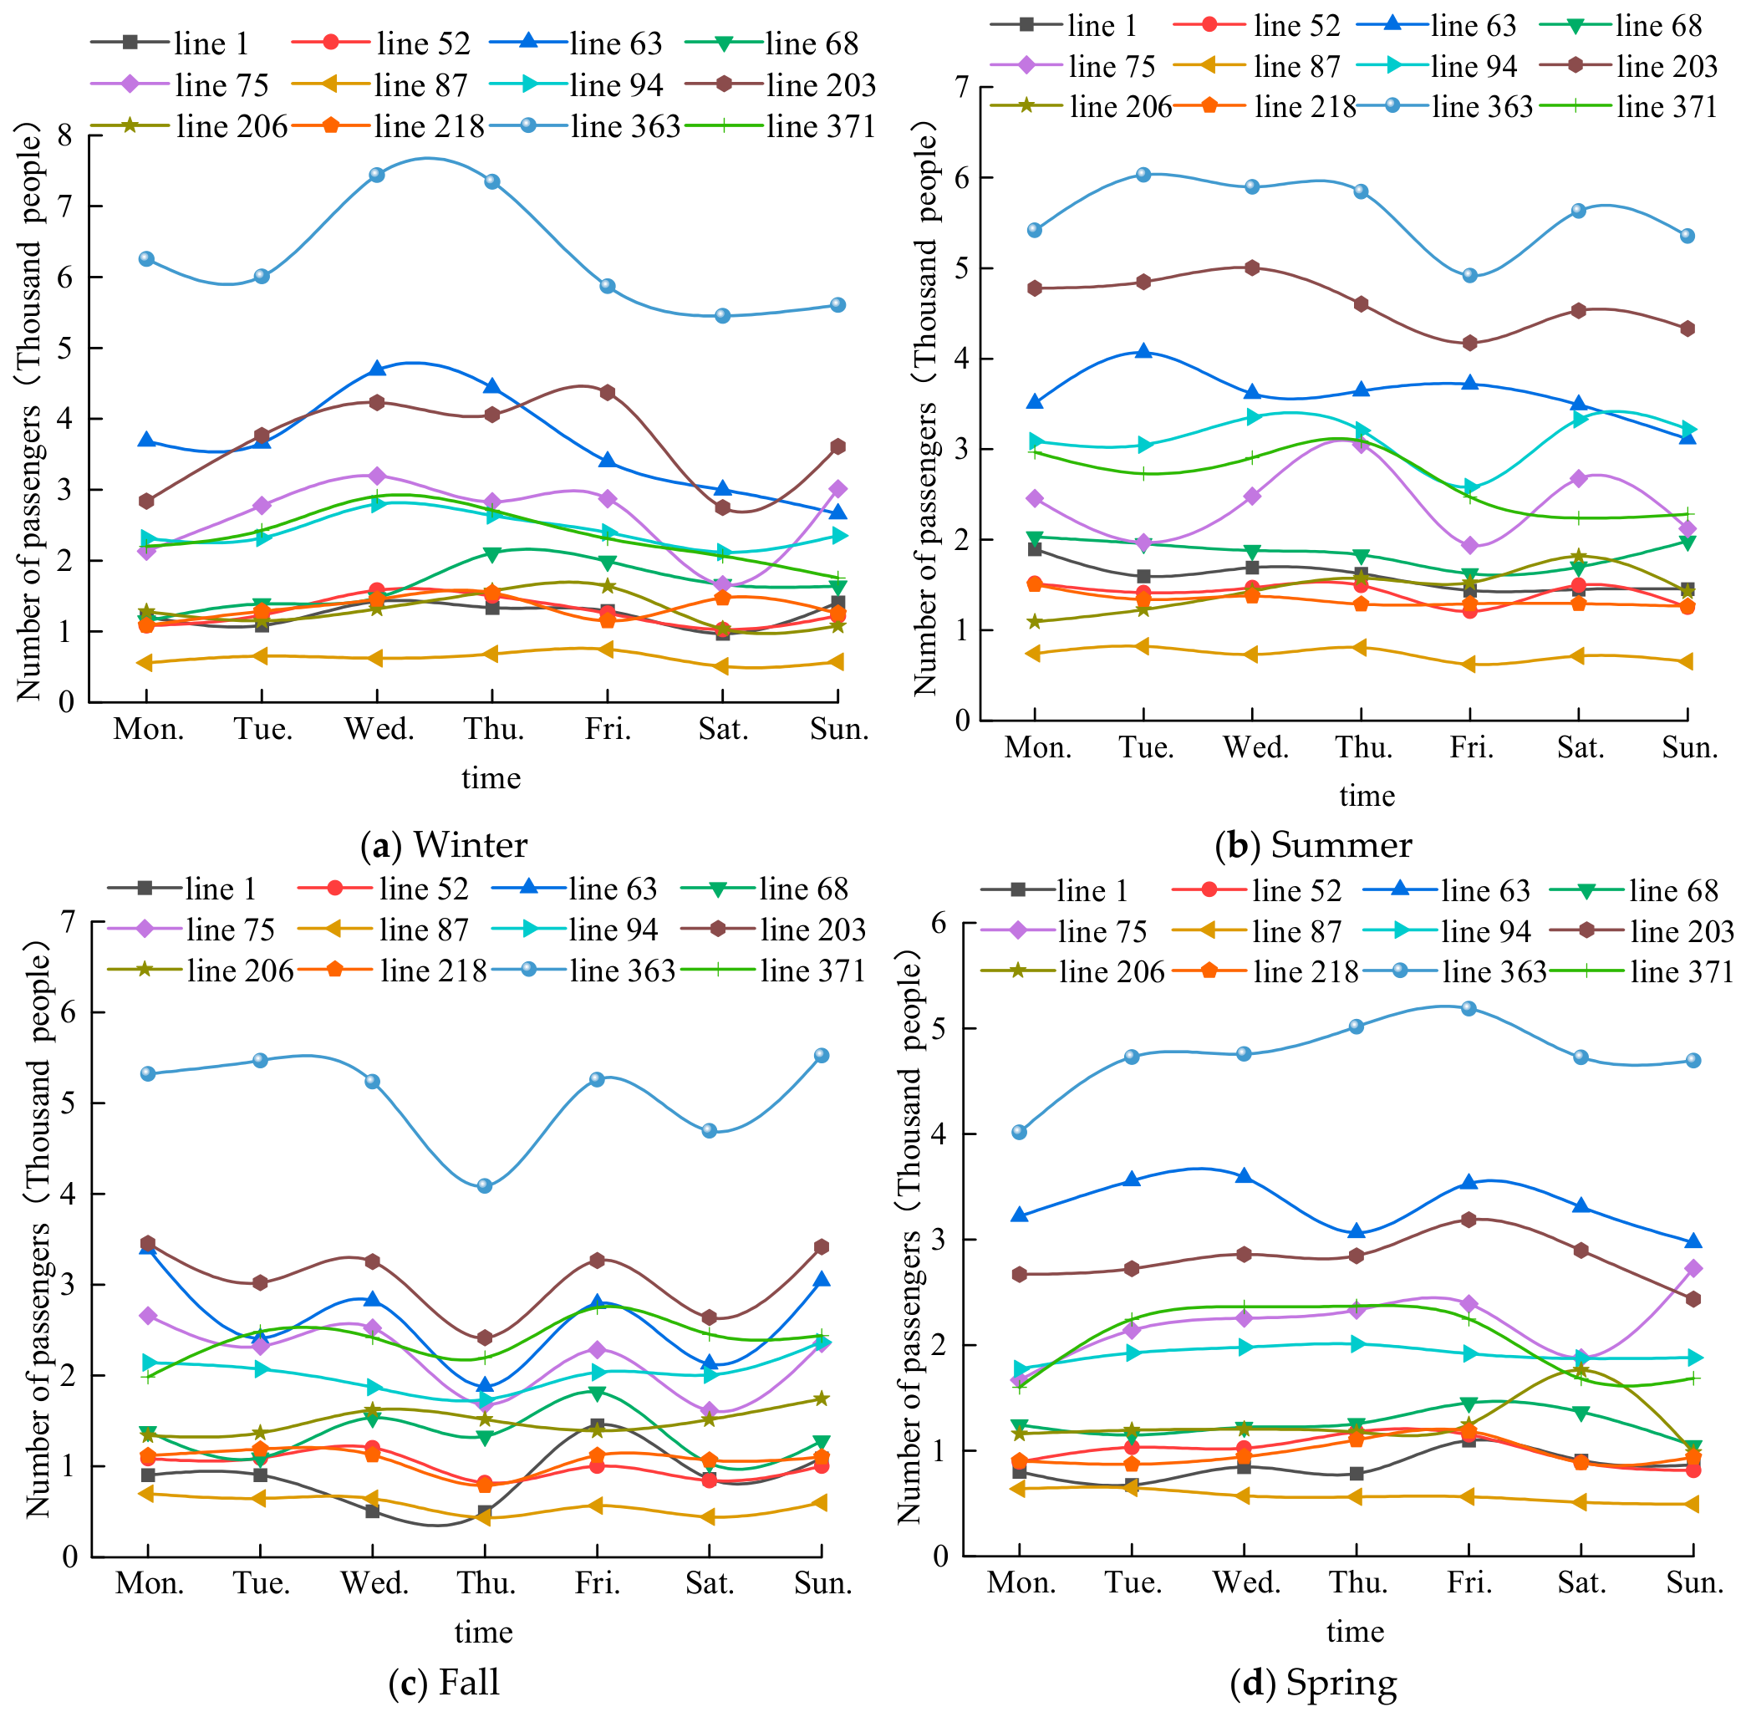
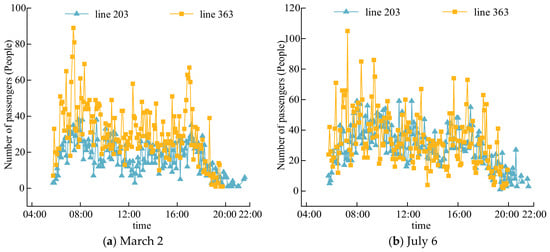
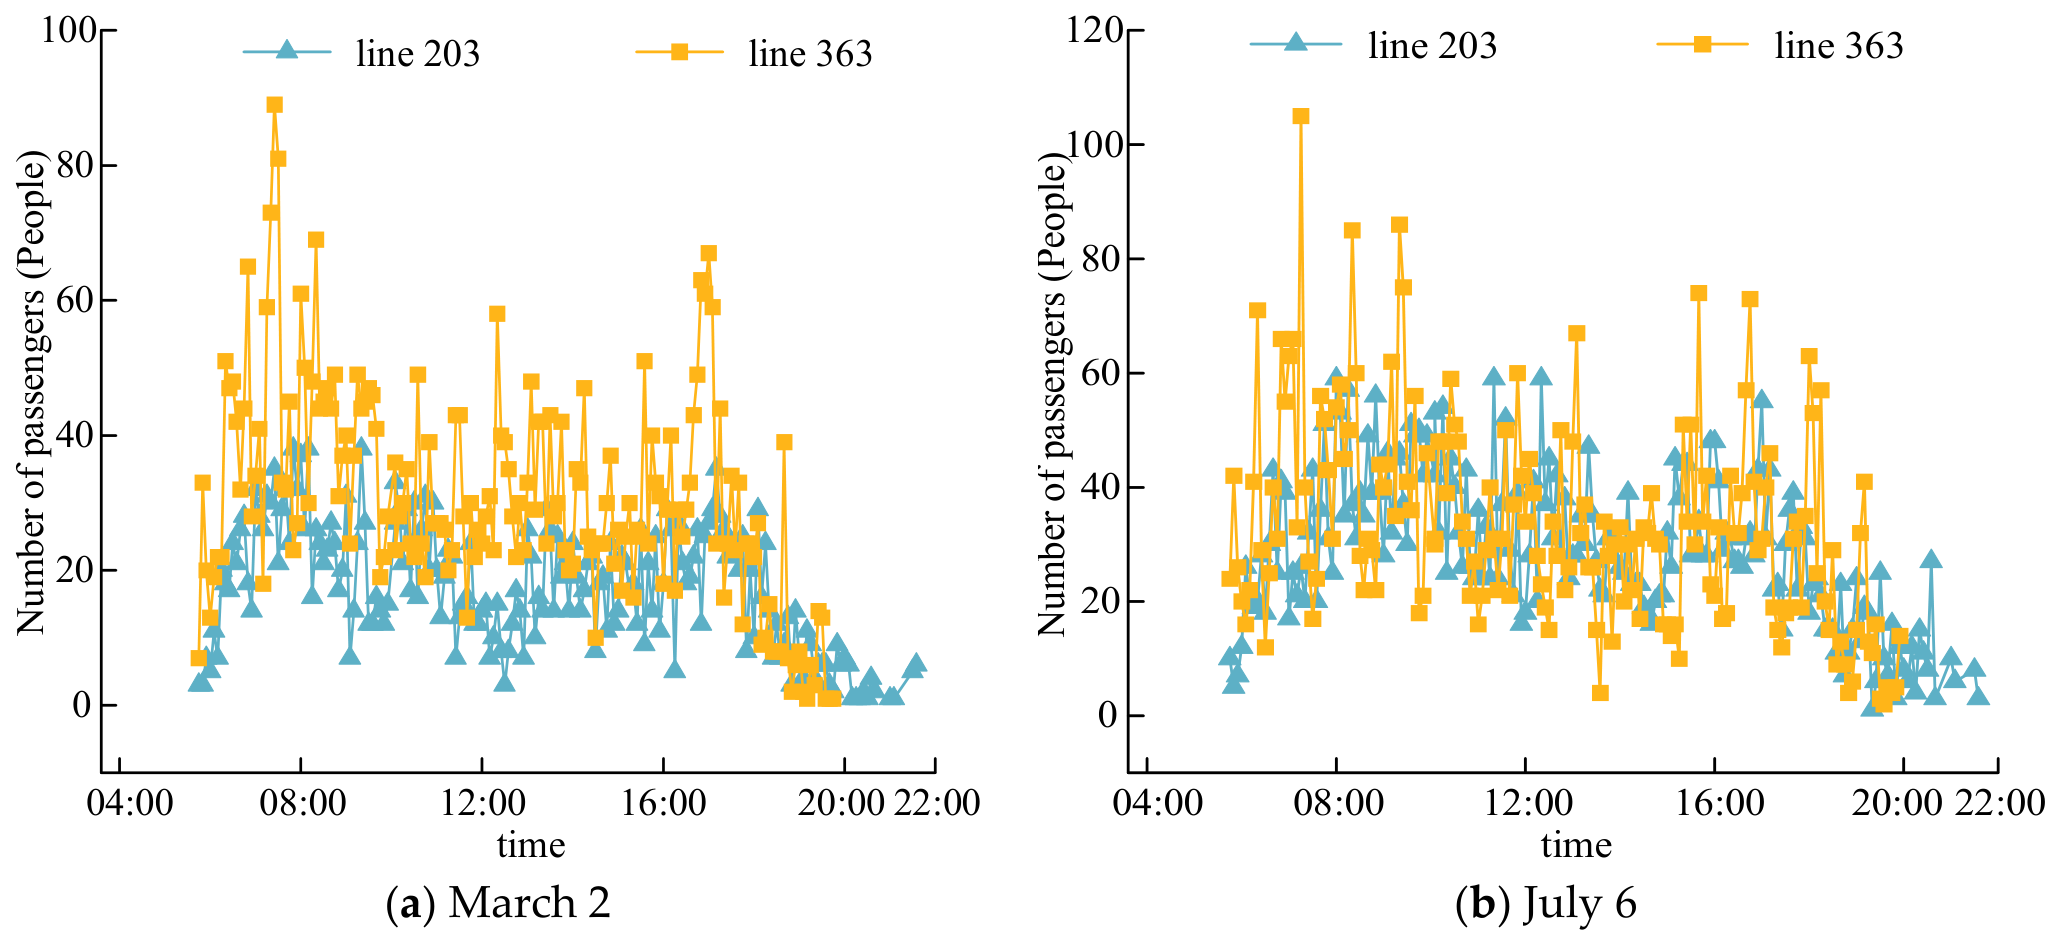
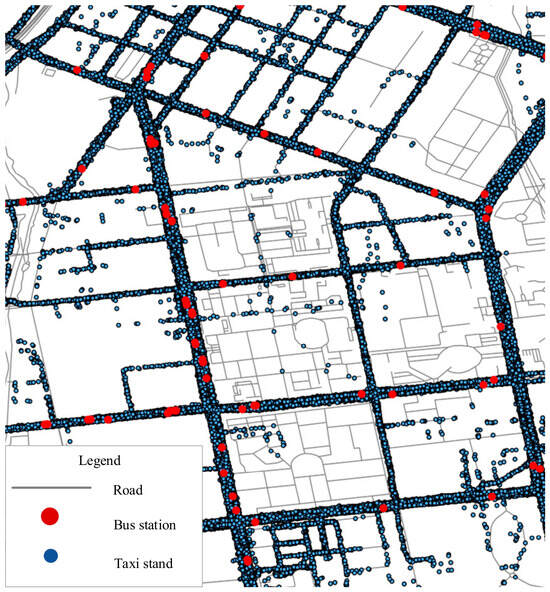
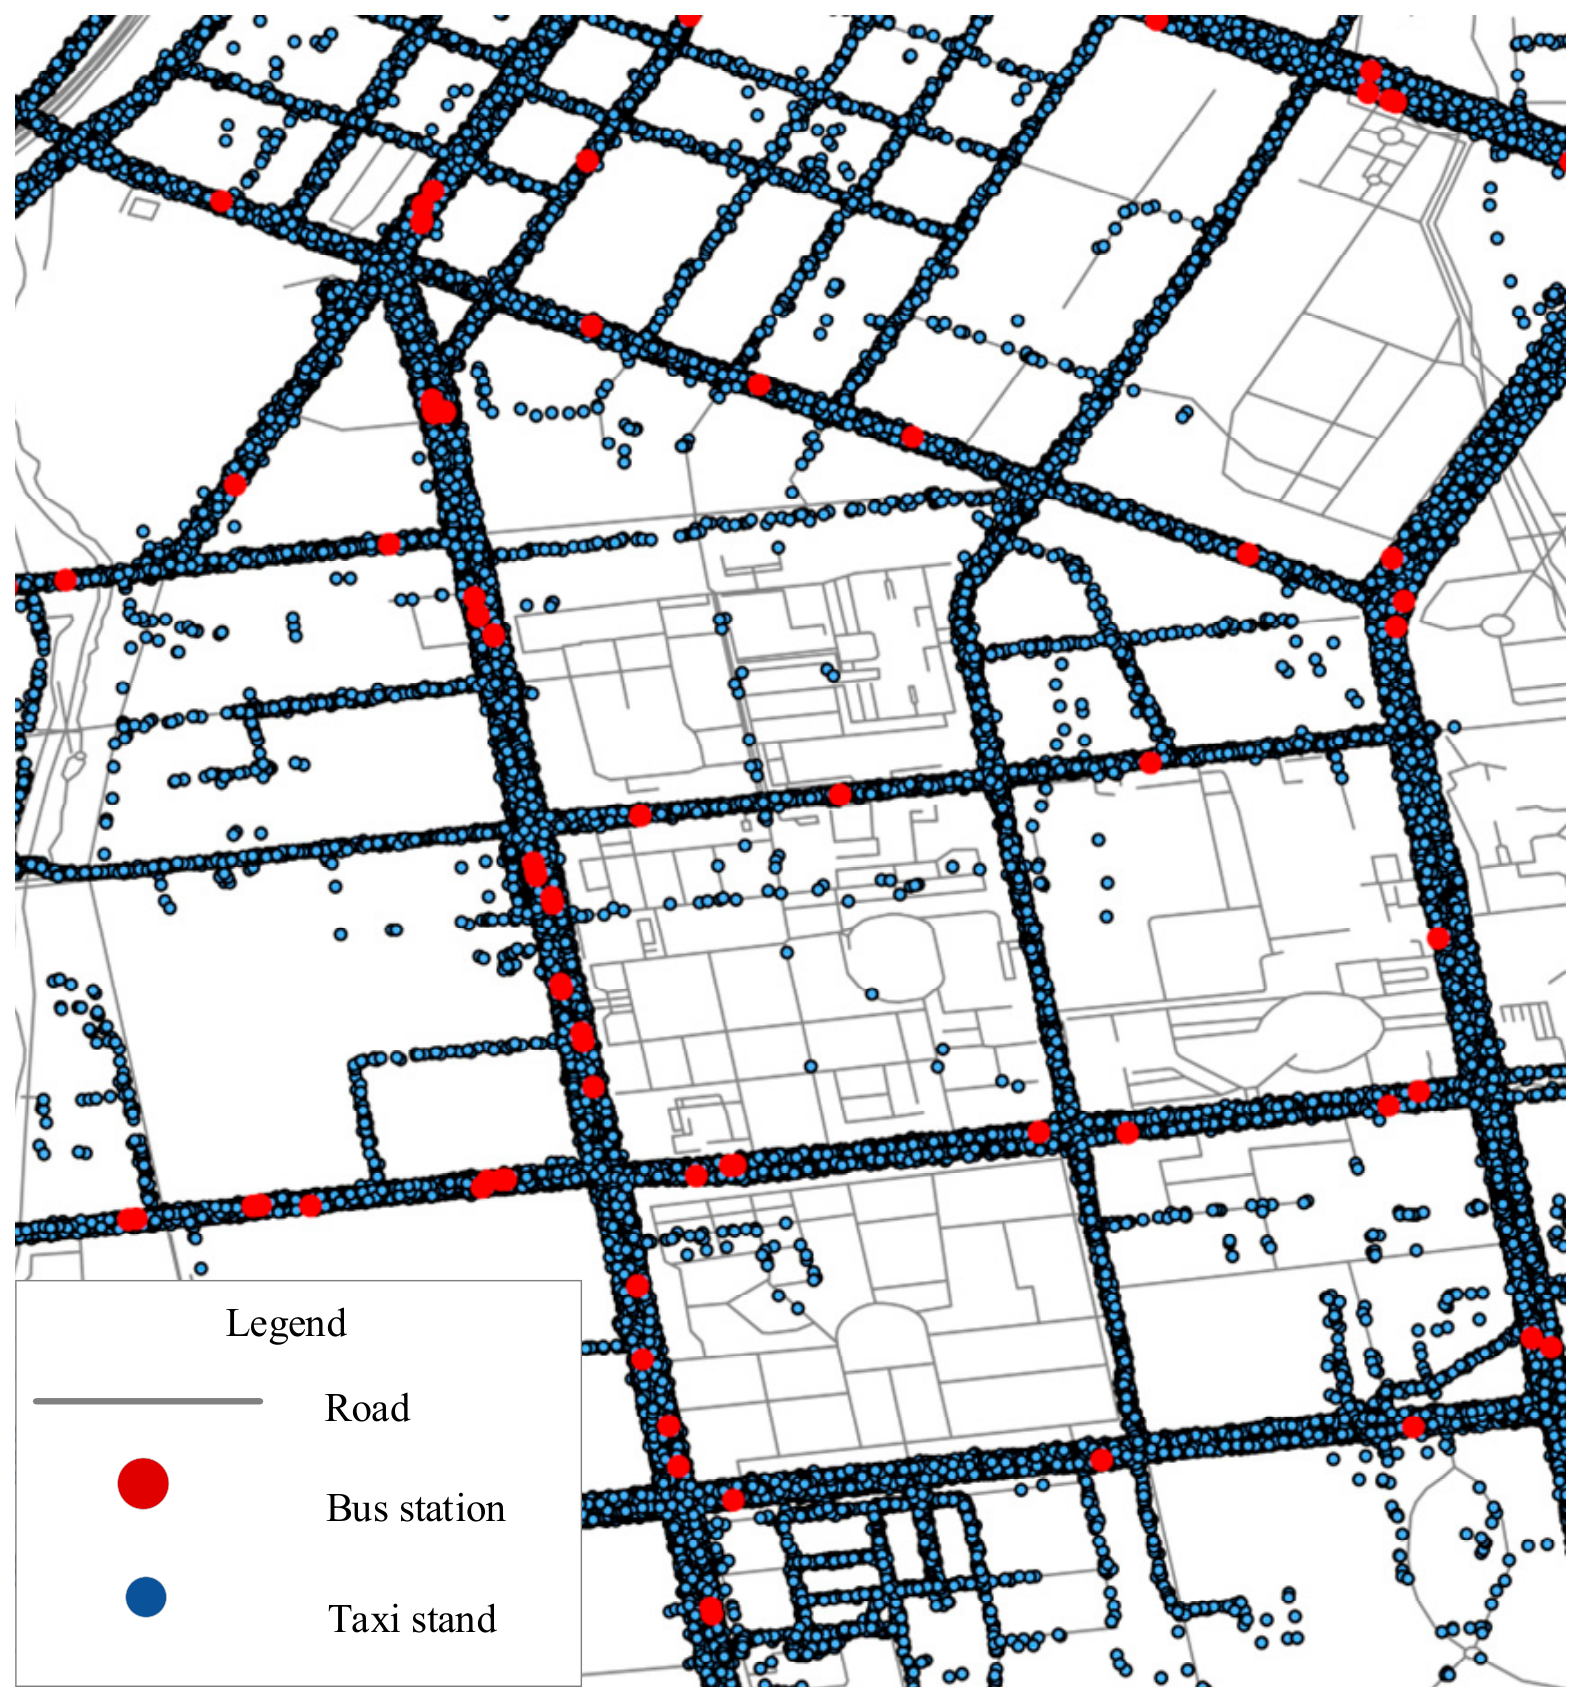
Figure 3, Figure 4, Figure 5, Figure 6 and Figure 7 and Table 5 present representative bus passenger-flow, metro passenger-flow, and taxi trajectory records used in the analysis. Before transfer identification, the datasets were checked for missing values, abnormal observations, and duplicate records; missing values were imputed and abnormal records were corrected or removed as appropriate. Figure 7 illustrates the spatial alignment between bus stops and taxi trajectories, while Table 5 provides an example of the 30 s taxi trajectory records used to detect pick-up and drop-off events. For example, the change in vehicle status between records 8 and 9 indicates a passenger pick-up event. These cleaned and temporally ordered records form the basis of the spatial–temporal matching procedure described in Section 2.4.
Figure 3.
Weekly distribution of bus passenger numbers.
Figure 4.
Hourly distribution of bus passenger numbers.
Figure 5.
Weekly distribution of subway transfer passenger flow.
Figure 6.
Hourly distribution of subway passenger-flow data (data collected between 6:00 and 21:00 Beijing Time daily).
Figure 7.
Schematic representation of the alignment between bus stops and taxi trajectory data.
Table 5.
Example of taxi trajectory data with a 30 s time interval.
3.2. Analysis of Factors Affecting Passenger Transfer
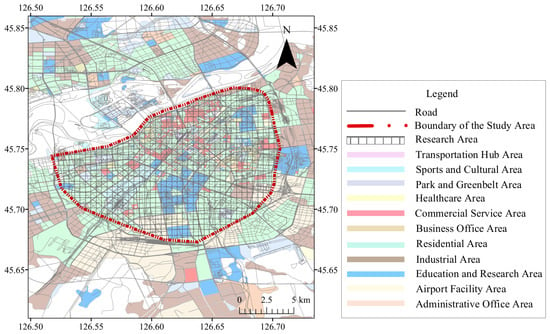
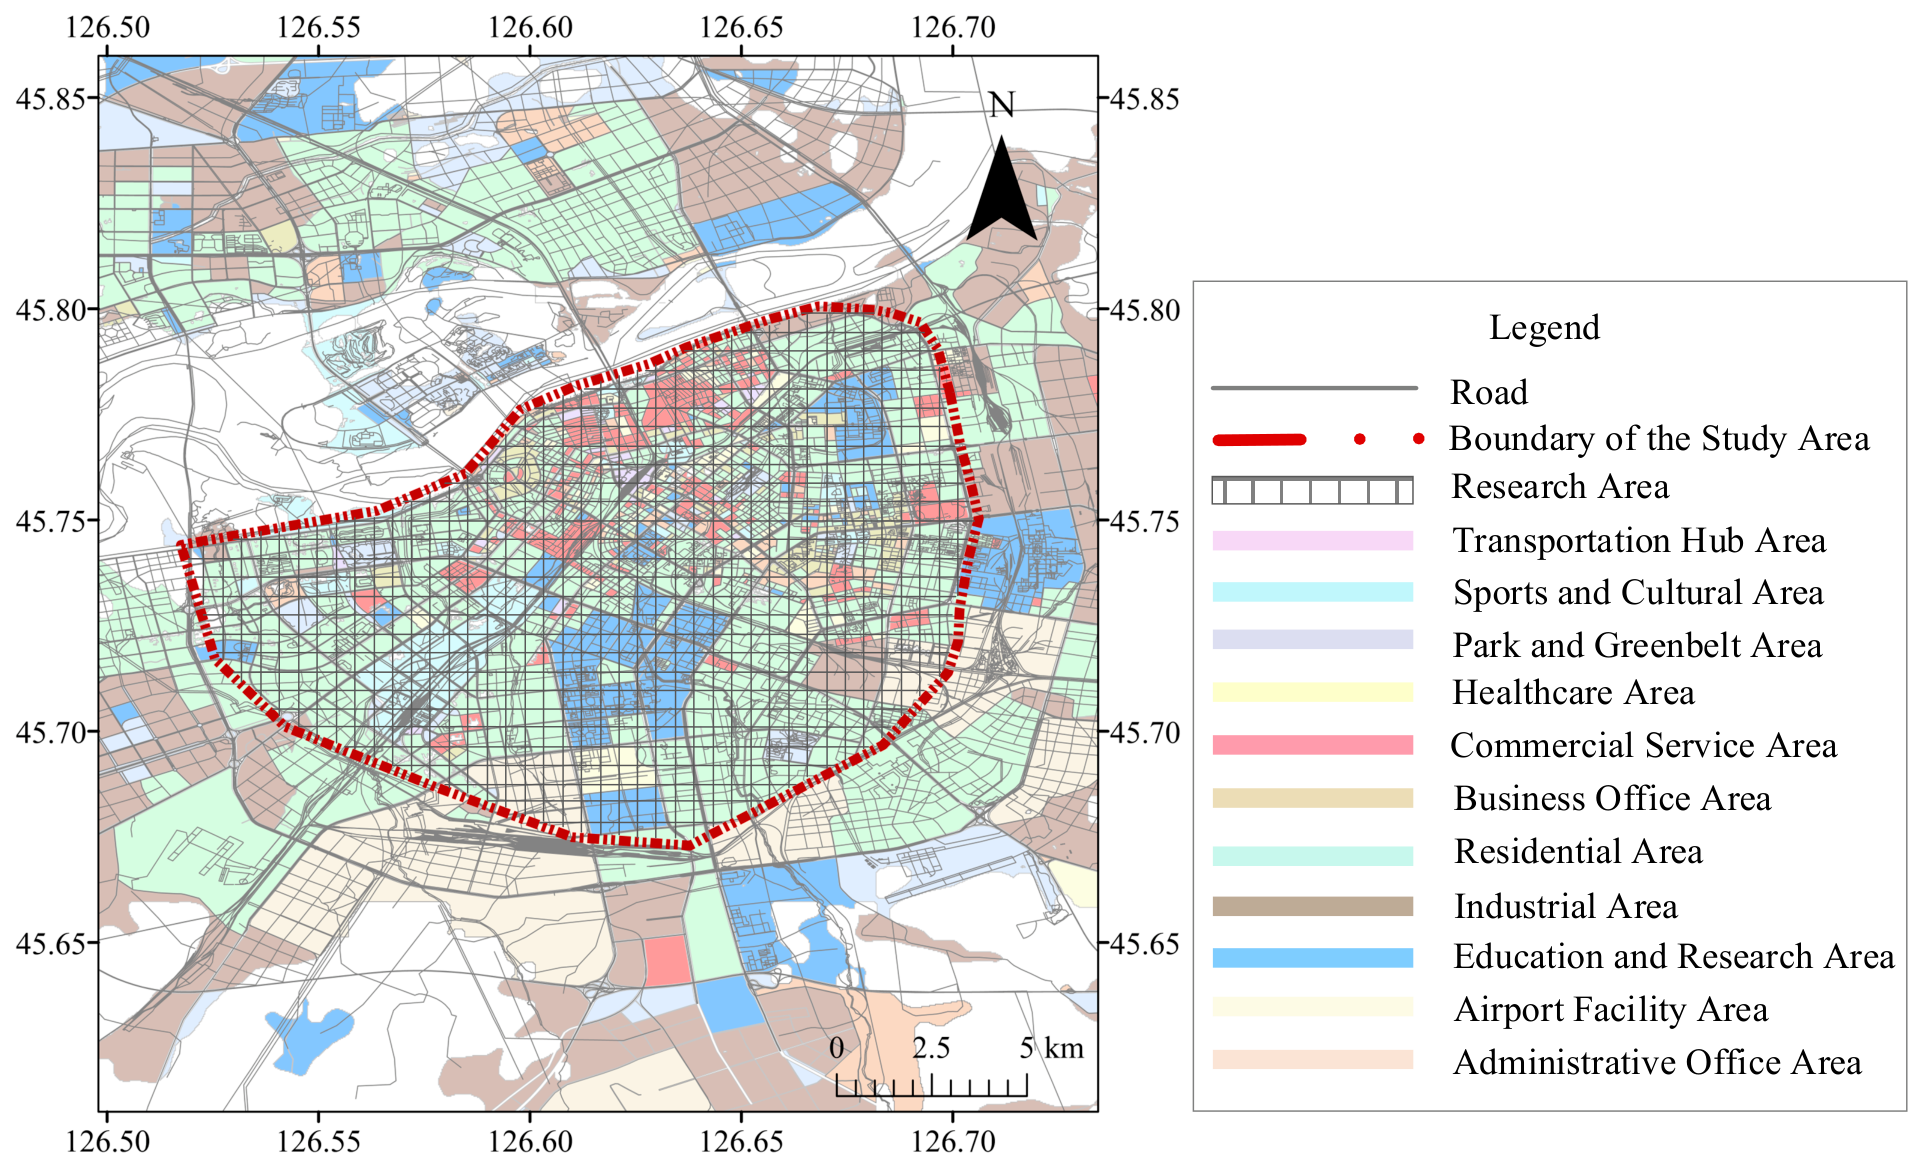
The study area was divided into 0.5 km × 0.5 km grid cells for spatial analysis. Coordinate transformation and map matching were then performed for the bus AFC, metro AFC, taxi GPS, and POI datasets. Figure 8 illustrates the division of the study area into grid cells.
Figure 8.
Schematic diagram of the grid division within the study area.
Before estimating the spatial model, global Moran’s I was calculated for the 14 selected built-environment and transfer-convenience variables to examine whether these explanatory variables exhibit spatial clustering across the 0.5 km × 0.5 km analysis units. Moran’s I is used here only as a diagnostic of spatial structure and not as a criterion for selecting a specific spatial econometric model. As reported in Table 6, all 14 variables have positive Moran’s I values, and 11 variables are marked as statistically significant according to the significance annotations reported in the original analysis. These results indicate that spatial structure is present in most explanatory variables and support the use of a spatial modelling framework. The selection of the SDM itself, however, is based on the modelling considerations described in Section 2.3 rather than on Moran’s I alone.
Table 6.
Global Moran’s I statistics for the selected built-environment and transfer-convenience variables.
The presence of spatial autocorrelation alone does not distinguish among SAR, SEM, SLX, and SDM specifications. In the present study, the unrestricted SDM is retained because the research question requires explicit estimation of both endogenous spatial interaction in transfer flows and exogenous spillover effects associated with neighbouring built-environment characteristics. A SAR restriction (θ = 0) would exclude the latter mechanism, whereas an SEM formulation would attribute spatial dependence primarily to the disturbance process and would not directly provide the covariate-specific spillover effects required for the subsequent optimisation stage. Thus, the SDM is used as the general specification for effect decomposition rather than being selected solely on the basis of the Moran’s I results.
Based on the above specification rationale, the unrestricted SDM was estimated to quantify the direct, spillover, and total effects of the 14 selected factors on bus transfer passenger flows. The resulting effect estimates are reported in Table 7.
Table 7.
Output results of the SDM.
The SDM results also show that the estimated spatial spillover components are not uniformly zero. In particular, Table 7 reports non-zero spillover estimates for multiple built-environment and transport-service variables, with starred spillover coefficients reported for variables such as SSD and CBD. This empirical pattern is consistent with retaining spatially lagged explanatory variables rather than imposing the SAR restriction (θ = 0).
From Table 7, it can be observed that, except for the HD, GAD, and factors, all other factors exhibit positive effects. The number of bus routes and stations has the most significant impact on bus transfer passenger flows. This is because a higher number of transfer stations and bus routes enhance the accessibility between origins and destinations, attracting more passenger traffic. Reducing the distance between transfer stations decreases the transfer-time cost, thereby promoting bus transfer passenger flows. The degree of land-use mix has a relatively minor impact on bus transfer passenger flows, indicating that the level of land development has a limited influence on transfer passenger flows.
Bus passengers transferring to other modes appear to be more strongly associated with spatial accessibility and transport-service availability than with the level of surrounding socioeconomic activity. This suggests that, for intermodal transfers, service availability and network accessibility may play a more important role than the general intensity of surrounding land development. Instead, the availability of vehicles and the level of transportation services are more crucial.
The SDM results are used as upstream information for the optimisation rather than as optimisation decision variables. Specifically, the spatial effect information is matched to the transfer stations according to their corresponding analysis units, and the resulting direct and spillover components are combined into the station-specific coefficient according to Equation (13). This coefficient is then fixed before the MIQP is solved. Table 7 is therefore used to characterise the direction and relative importance of the built-environment effects, whereas the SDM–MIQP linkage itself is implemented through the station-specific transfer-demand impact coefficient .
3.3. Analysis of Optimisation Results for Electric-Bus Transfer Stations
3.3.1. Passenger Equity Performance
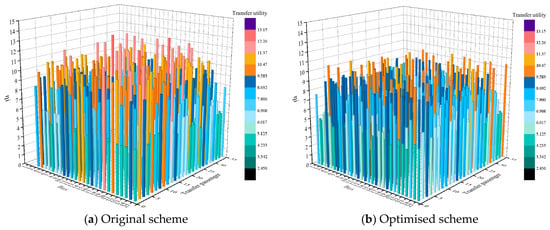
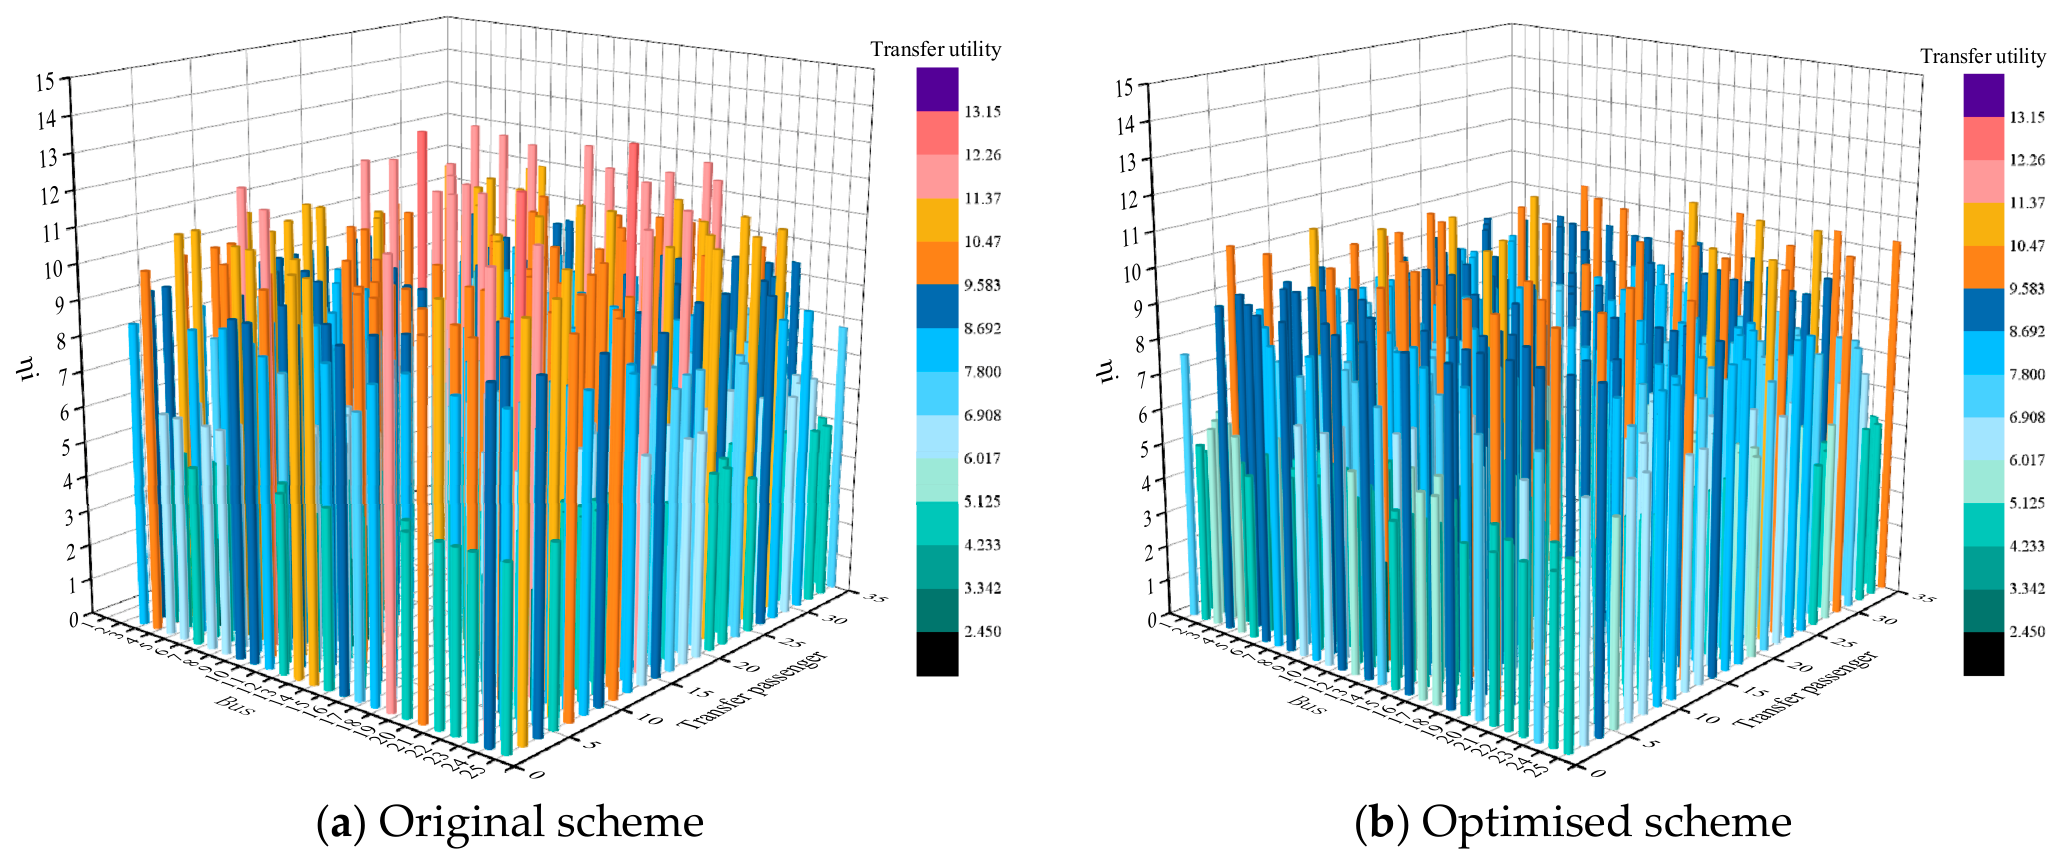
To assess station-level horizontal equity, Figure 9 compares the distribution of transfer utility before and after optimisation. The maximum transfer utility decreases from 13.14 to 11.17 min, corresponding to a 14.99% reduction in the worst-case transfer-time burden. Meanwhile, the variance-based equity indicator Z3 decreases from 5.3515 to 3.9856, representing a 25.52% reduction. These two indicators are directionally consistent: the optimised scheme reduces both the dispersion of transfer-time burden across stations and the burden experienced under the worst transfer condition. Therefore, the reduction in variance is not achieved by uniformly worsening transfer conditions.
Figure 9.
Passenger transfer-utility values.
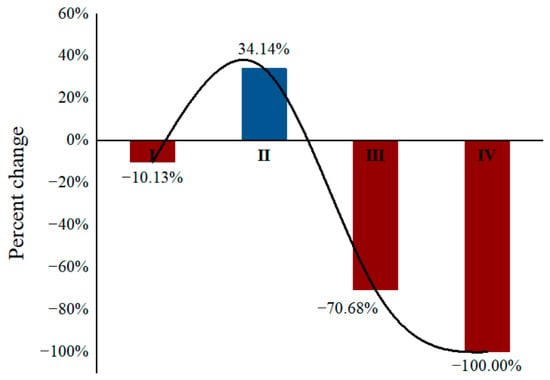
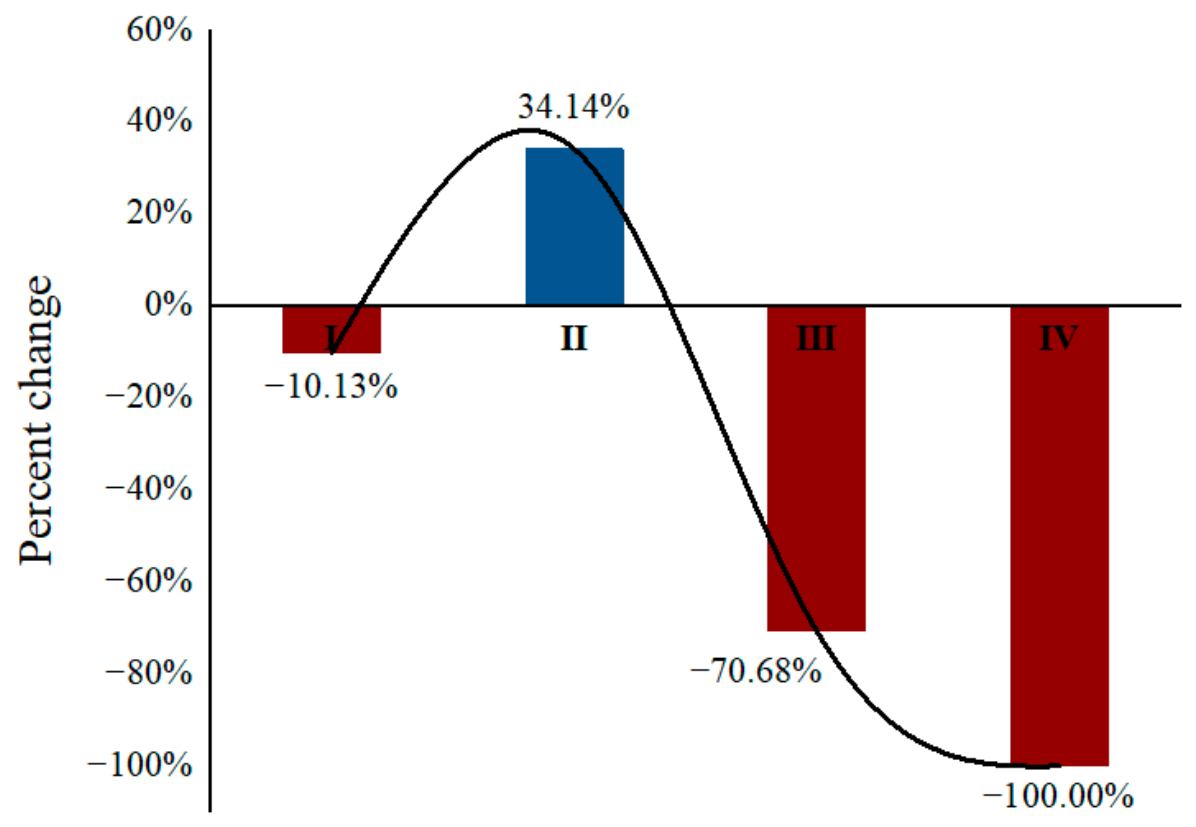
To complement the variance-based indicator, Table 8 and Figure 10 further examine the distribution of transfer utility across four burden levels: Level I, [0, 5) min; Level II, [5, 10) min; Level III, [10, 12) min; and Level IV, >12 min. Relative to the original scheme, the number of transfer passengers in Level III decreases by 70.68%, while Level IV is completely eliminated. Meanwhile, Level I decreases by 10.13% and Level II increases by 34.14%, indicating a redistribution of transfer conditions towards the moderate-burden range. Most importantly, the substantial contraction of Levels III and IV demonstrates that the optimisation reduces the high-burden tail of the distribution. Together with the 14.99% reduction in maximum transfer utility, these results provide complementary evidence of improved horizontal equity beyond the variance measure alone. These complementary indicators are used as ex post validation measures rather than additional optimisation objectives; their consistency with the variance-based indicator reduces the likelihood that the observed equity improvement is an artefact of a single equity metric.
Table 8.
The levels of transfer-utility value.
Figure 10.
Percentage change in transfer passengers at each utility level under the optimised scheme.
3.3.2. The Value of the Objective Function
Table 9 compares the three individual performance objectives between the original and optimised schemes. The total transfer-time objective Z1 decreases from 4727 to 4195 min/day, corresponding to an 11.25% reduction. The annual operating cost decreases from 245.4153 × 10⁶ to 245.2086 × 10⁶ CNY, representing an annual saving of 206,700 CNY. Meanwhile, the variance-based equity indicator Z3 decreases from 5.3515 to 3.9856, corresponding to a 25.52% reduction. Reporting the three objectives separately avoids interpreting a composite value that combines quantities with different physical units.
Table 9.
Original objective values and optimised objective values.
These case study comparisons support the main methodological contribution of the proposed framework: spatially informed transfer-station optimisation can simultaneously improve transfer efficiency and station-level equity while maintaining the operational requirements of electric-bus services.
Although Figure 10 indicates that some passengers shift from Level I to Level II, this redistribution occurs simultaneously with a reduction in system-wide transfer time and a substantial contraction of Levels III and IV. The optimisation therefore primarily reduces extreme transfer-time burdens while maintaining, and on average improving, overall transfer efficiency. This result is consistent with the purpose of jointly considering efficiency and horizontal equity within the optimisation framework.
The optimised scheme contains 417 transfer stations, with average bus–metro and bus–taxi transfer distances of 300.7 m and 99.7 m, respectively. The detailed number of transfer stations and average transfer distances for each individual route are presented in Table 10. Notably, no suitable bus–taxi transfer distances were identified for Routes 63 and 218, suggesting that taxi transfers are less suitable for these two routes under the model assumptions.
Table 10.
Number of transfer stations and average transfer distances per route.
3.4. Parameter Sensitivity and Robustness Analysis
In real-world transfer scenarios, it is challenging to achieve simultaneous optimisation of multiple objectives. Moreover, parameter values may significantly affect the model outputs of interest. Therefore, we conducted a sensitivity analysis on the unit time cost and equity indicators. To examine the sensitivity of the optimisation results to the unit time cost, the baseline value of 0.67 CNY/min/person reported in Table 4 was increased and decreased by 20%. Table 11 reports the resulting changes in the weighted objective F. Because F is a scaled composite objective, only its relative changes are interpreted in this sensitivity analysis.
Table 11.
Variation in the weighted objective F with unit time cost.
The change in unit time cost primarily affects the parameters of bus transfer utility and the average number of passengers per bus on trips within the weighted objective F. As indicated in Table 11, when the unit time cost is reduced by 20%, the weighted objective F decreases by 2.3%. Conversely, when the unit time cost is increased by 20%, the weighted objective F increases by 5.3%. The weighted objective F exhibits the same trend as the unit time cost, but the total objective values obtained from the aforementioned discussions are all lower than the original objective value.
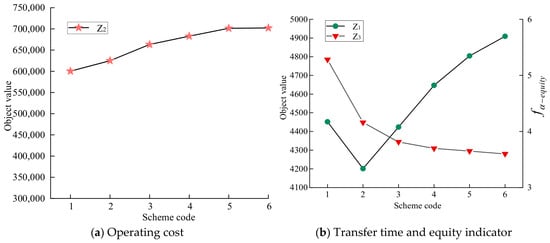
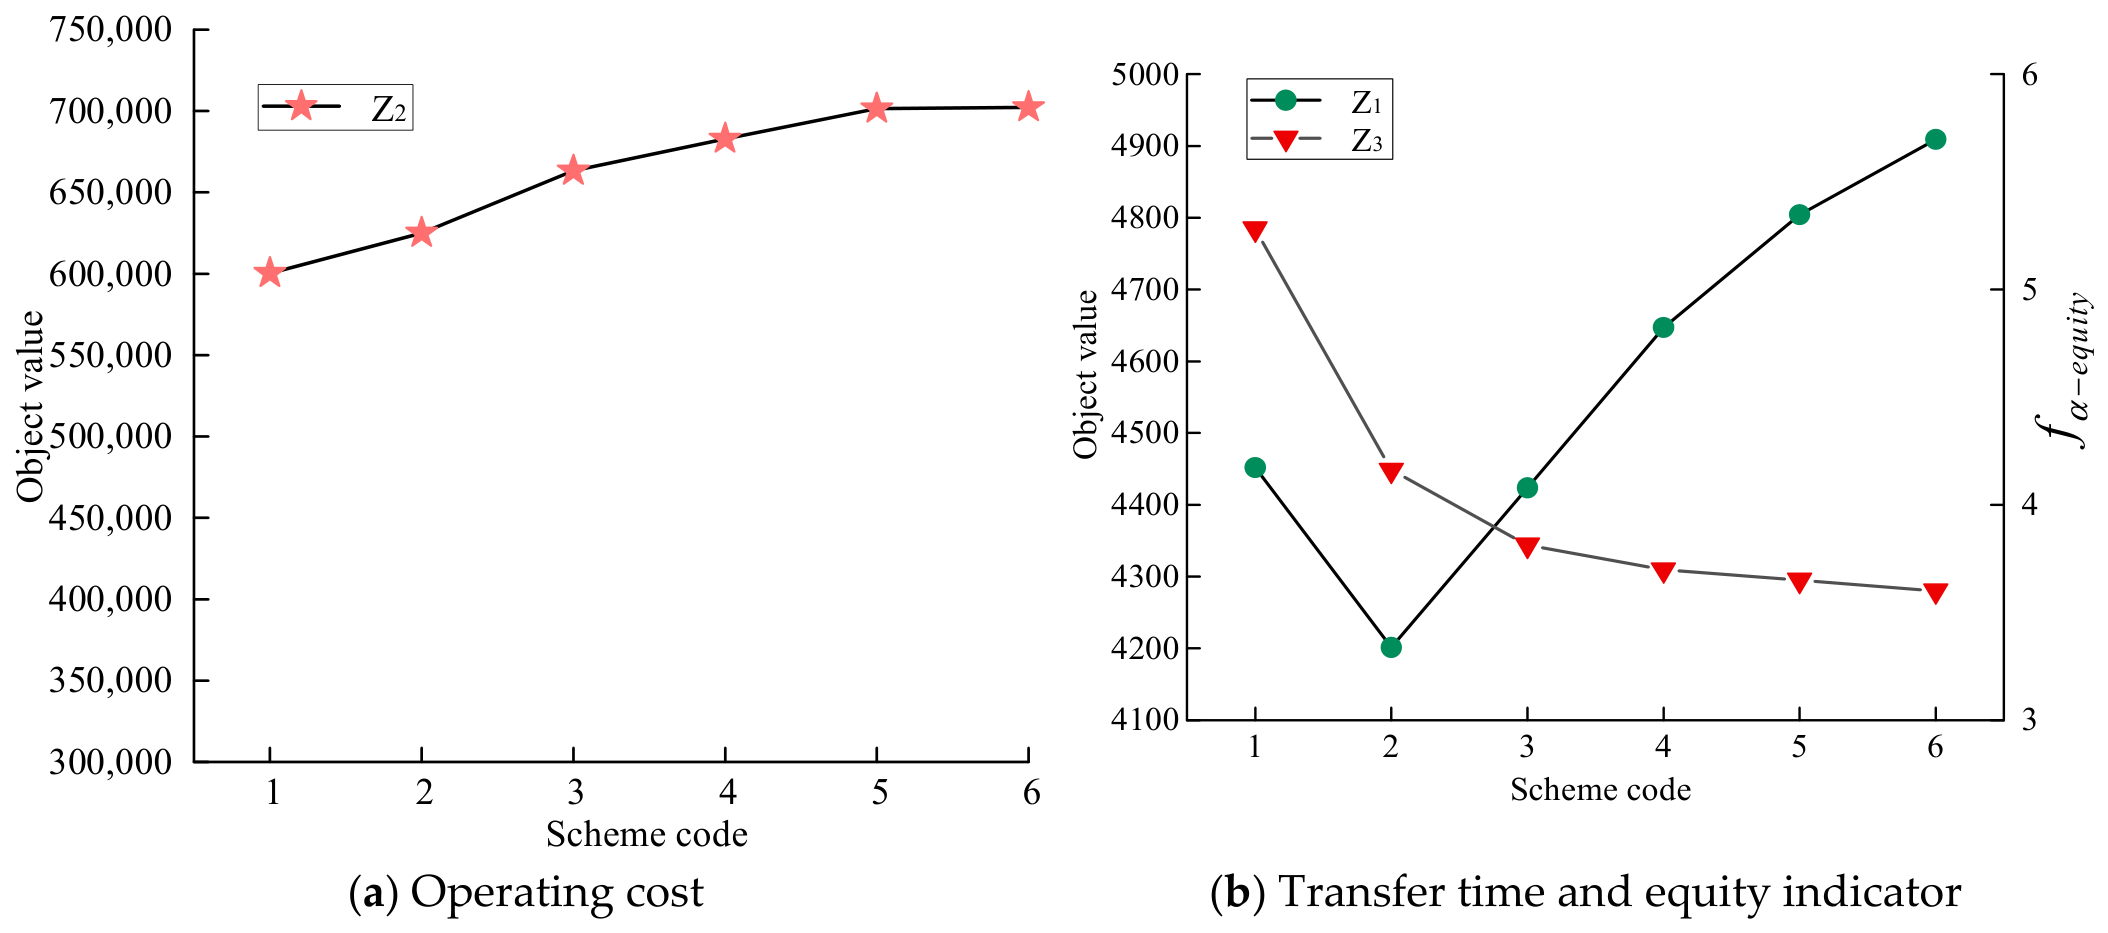
To evaluate the robustness of the optimisation results under alternative preference structures, the equity preference coefficient α3 was varied from 0 to 1 in increments of 0.2. For each value of α3, the remaining preference was divided equally between transfer time and operating cost, i.e., α1 = α2 = (1 − α3)/2. These coefficients represent alternative preference scenarios, while the individual objective values are reported separately to avoid direct comparison of quantities with different physical units. The corresponding results are presented in Table 12, and the variations in the three objective values are illustrated in Figure 11.
Table 12.
Variation in objective values with equity weighting.
Figure 11.
Sensitivity of individual objective outcomes to alternative preference coefficients.
The results show a clear and consistent trade-off pattern. When α3 increases from 0 to 0.2, the variance-based equity indicator decreases from 5.2821 to 4.1615, corresponding to a 21.22% improvement. During the same change, transfer time decreases from 4452 to 4201 min/day, a reduction of 5.64%, while operating cost increases from 600,334 to 625,070 CNY/day, an increase of 4.12%. Thus, introducing a moderate equity preference substantially improves equity without deteriorating transfer efficiency.
When the equity preference is increased further from α3 = 0.2 to α3 = 1.0, the equity indicator decreases by a further 13.46%, whereas transfer time and operating cost increase by 16.85% and 12.35%, respectively. This indicates diminishing marginal equity gains as the preference for equity becomes dominant. Therefore, the qualitative conclusion is robust across alternative weighting schemes: moderate consideration of equity yields substantial reductions in transfer disparity, whereas excessive emphasis on equity leads to progressively higher time and operating-cost penalties.
As an additional baseline check, Scheme 1 in Table 12, for which α3 = 0, is treated as an equity-free optimisation benchmark. Compared with this benchmark, introducing a moderate equity preference in Scheme 2 (α3 = 0.2) reduces the variance-based equity indicator from 5.2821 to 4.1615, corresponding to a 21.22% improvement. At the same time, transfer time decreases from 4452 to 4201 min/day (5.64%), while operating cost increases from 600,334 to 625,070 CNY/day (4.12%). This comparison shows that the observed equity improvement is not merely a consequence of comparing the optimised solution with the original network configuration; it remains evident when the proposed equity-aware formulation is compared with an otherwise similar optimisation that excludes the equity objective. Together with the maximum-transfer-utility and high-burden-level comparisons in Section 3.3.1, these results provide complementary baseline and metric-based validation of the proposed framework.
3.5. Managerial Implications
The findings provide several practical insights for public transport authorities and operators. First, transfer-station planning should consider not only overall transfer efficiency but also the distribution of transfer-time burdens across stations. In the Harbin case, the reductions in transfer-utility variance and maximum transfer utility, together with the decrease in high-burden transfer levels, suggest that improving conditions at poorly served transfer locations can complement conventional efficiency-oriented planning. The SDM-derived spatial demand effects can further assist in identifying stations that warrant closer examination, while specific interventions should consider local passenger demand, walking accessibility, and existing transfer facilities. Moreover, the absence of suitable bus–taxi transfer distances for Routes 63 and 218 indicates that transfer arrangements should be adapted to route-specific conditions rather than applying the same modal integration strategy to all routes.
Second, the sensitivity results provide a basis for evaluating trade-offs among transfer equity, efficiency, and operating costs. Compared with the equity-free benchmark, introducing a moderate equity preference (α3 = 0.2) reduces the variance-based equity indicator by 21.22% and transfer time by 5.64%, while increasing daily operating costs by 4.12%. This finding does not imply that a particular preference coefficient is universally optimal. Instead, it suggests that transport authorities can compare alternative preference scenarios and select a suitable balance between equity improvements and budget constraints according to local planning priorities.
Third, transfer-station planning should be coordinated with the operational requirements of electric buses. The route-level feasibility screening shows that Routes 63, 150, and 363 would violate the minimum SoC requirement without intermediate charging under the specified assumptions. This highlights the importance of assessing charging availability and route-level energy requirements before implementing transfer-station adjustments. Furthermore, the optimised station configuration and average transfer distances obtained for Harbin should be interpreted as case-specific planning outcomes rather than universal design standards. Their practical implementation would require further verification using local operating conditions and charging-infrastructure capacity.
4. Conclusions
This study develops a multimodal electric-bus transfer-station planning framework that integrates station-level horizontal equity, SDM-derived spatial demand effects, and electric-bus operational feasibility within an MIQP formulation. The SDM provides upstream information on the direct and spillover effects of the built environment and transport-service characteristics, while the MIQP jointly considers passenger transfer-time burden, operating cost, transfer disparity, and electric-bus operational constraints.
The Harbin case study results in an optimised configuration with 417 transfer stations, with average bus–metro and bus–taxi transfer distances of 300.7 m and 99.7 m, respectively. Compared with the original scheme, total transfer time decreases by 11.25%, annual operating cost decreases by 206,700 CNY, the variance-based equity indicator decreases by 25.52%, and the maximum transfer utility decreases by 14.99%. The preference-sensitivity analysis further shows that moderate consideration of equity produces substantial reductions in transfer disparity, whereas increasingly equity-dominant preferences yield diminishing equity gains at higher time and cost penalties. From a managerial perspective, these findings suggest that transfer-station planning should prioritise reducing excessive transfer-time burdens, explicitly evaluate trade-offs among equity, efficiency, and operating costs, and ensure consistency with electric-bus charging requirements. The resulting station configurations and preference scenarios should be interpreted in the context of local transport demand, operational conditions, and resource constraints. Future studies could extend the framework by incorporating passenger-load-dependent energy consumption, grid-side charging-capacity constraints, and alternative charging modes.
Author Contributions
Conceptualisation, Y.W.; methodology, J.Z.; software, X.X.; validation, J.Z.; formal analysis, J.Z.; investigation, X.X.; resources, S.X.; data curation, C.D.; writing—original draft preparation, J.Z.; writing—review and editing, S.X.; visualisation, J.Z.; supervision, Y.W.; project administration, C.D.; funding acquisition, Y.W. All authors have read and agreed to the published version of the manuscript.
Funding
This research was funded by “Ningde Normal University Innovation Team for Artificial Intelligence and Industrial Safety”, grant number 2026T02, “the Key Project of National Natural Science Foundation of China”, grant number 51638004, and “the Science and Technology Project of Heilongjiang Provincial Department of Transportation”, grant number HJK2025B001.
Data Availability Statement
The original contributions presented in this study are included in the article. Further inquiries can be directed to the corresponding authors.
Conflicts of Interest
The authors declare no conflicts of interest.
References
- Klinger, T. Moving from monomodality to multimodality? Changes in mode choice of new residents. Transp. Res. Part A Policy Pract. 2017, 104, 221–237. [Google Scholar] [CrossRef] [Scilit]
- United Nations Environment Programme. Emissions Gap Report 2022. 2022. Available online: https://www.unep.org/resources/emissions-gap-report-2022 (accessed on 26 July 2026).
- Sustainable-Bus Electric Bus, Main Fleets and Projects Around the World. 6 February 2019. Available online: https://www.sustainable-bus.com/electric-bus/electric-bus-public-transport-main-fleets-projects-around-world/ (accessed on 26 July 2026).
- Zhang, J.; Pei, Y.; Sun, J.; Lai, Y.; Wang, S.; Easa, S.M. Achieving bus electrification: Strategy for bus fleet replacement in cold region. Transp. Res. Part D Transp. Environ. 2025, 145, 104825. [Google Scholar] [CrossRef] [Scilit]
- Sui, X.; Yan, H.; Pan, S.; Li, X.; Gu, X. Bus system optimization for timetables, routes, charging, and facilities: A summary. Digit. Transp. Saf. 2025, 4, 1–9. [Google Scholar] [CrossRef] [Scilit]
- Ahmed, S.; Wang, S. Systematic review of the impacts of electric vehicles on evolving transportation systems. Digit. Transp. Saf. 2024, 3, 220–232. [Google Scholar] [CrossRef] [Scilit]
- Zhang, M.; Mohamed, M.; Foda, A.; Guo, Y. Optimal electric bus charging scheduling with multiple vehicle and charger types considering compatibility. Sustainability 2025, 17, 3294. [Google Scholar] [CrossRef] [Scilit]
- Xiao, S.; Zhu, T.; Song, M.; Lai, G.; Wang, Y.; Cai, Z.; Liu, C. A supervised fault diagnosis model based on evolutionary wavelet kernels and multilayer perceptrons. Measurement 2026, 290, 123029. [Google Scholar] [CrossRef] [Scilit]
- Zhang, J.; Zhang, Y.; Easa, S.M.; Xie, B.; Lin, L.; Zhou, X.; Zeng, N.; Zhang, W.; Song, M. E2-Former: An edge-enhanced transformer for UAV-based small object detection. IEEE Internet Things J. 2026, 13, 30974–30992. [Google Scholar] [CrossRef] [Scilit]
- Martínez-Díaz, M.; Soriguera, F.; Pérez, I. Autonomous driving: A bird’s eye view. IET Intel. Transp. Syst. 2019, 13, 563–579. [Google Scholar] [CrossRef] [Scilit]
- Milakis, D.; Van Arem, B.; Van Wee, B. Policy and society related implications of automated driving: A review of literature and directions for future research. J. Intell. Transp. Syst. 2017, 21, 324–348. [Google Scholar] [CrossRef] [Scilit]
- Shareef, H.; Islam, M.M.; Mohamed, A. A review of the stage-of-the-art charging technologies, placement methodologies, and impacts of electric vehicles. Renew. Sustain. Energy Rev. 2016, 64, 403–420. [Google Scholar] [CrossRef] [Scilit]
- Fagnant, D.J.; Kockelman, K. Preparing a nation for autonomous vehicles: Opportunities, barriers and policy recommendations. Transp. Res. Part A Policy Pract. 2015, 77, 167–181. [Google Scholar] [CrossRef] [Scilit]
- Litman, T. Evaluating transportation equity. World Transp. Policy Pract. 2002, 8, 50–65. [Google Scholar] [CrossRef] [Scilit]
- Ramos-Santiago, L.E. Towards a better account and understanding of bus/rapidtransit interactions: The case of Los Angeles. Case Stud. Transp. Policy 2021, 9, 1167–1179. [Google Scholar] [CrossRef] [Scilit]
- Wu, P.; Xu, L.; Zhong, L.; Gao, K.; Qu, X.; Pei, M. Revealing the determinants of the intermodal transfer ratio between metro and bus systems considering spatial variations. J. Transp. Geogr. 2022, 104, 103415. [Google Scholar] [CrossRef] [Scilit]
- Chen, E.; Ye, Z.; Wu, H. Nonlinear effects of built environment on intermodal transit trips considering spatial heterogeneity. Transp. Res. Part D Transp. Environ. 2021, 90, 102677. [Google Scholar] [CrossRef] [Scilit]
- Nassir, N.; Hickman, M.; Ma, Z.-L. Activity detection and transfer identification for public transit fare card data. Transportation 2015, 42, 683–705. [Google Scholar] [CrossRef] [Scilit]
- Aldaihani, M.M.; Quadrifoglio, L.; Dessouky, M.M.; Hall, R. Network design for a grid hybrid transit service. Transp. Res. Part A Policy Pract. 2004, 38, 511–530. [Google Scholar] [CrossRef] [Scilit]
- Kim, M.E.; Schonfeld, P. Integrating bus services with mixed fleets. Transp. Res. Part B Methodol. 2013, 55, 227–244. [Google Scholar] [CrossRef] [Scilit]
- Kim, M.E.; Schonfeld, P. Integration of conventional and flexible bus services with timed transfers. Transp. Res. Part B Methodol. 2014, 68, 76–97. [Google Scholar] [CrossRef] [Scilit]
- Guo, Q.-W.; Chow, J.Y.; Schonfeld, P. Stochastic dynamic switching in fixed and flexible transit services as market entry-exit real options. Transp. Res. Procedia 2017, 23, 380–399. [Google Scholar] [CrossRef] [Scilit]
- Crowley, D.F.; Shalaby, A.S.; Zarei, H. Access walking distance, transit use, and transit-oriented development in North York City Center, Toronto, Canada. Transp. Res. Rec. J. Transp. Res. Board 2009, 2110, 96–105. [Google Scholar] [CrossRef] [Scilit]
- Lindelöw, D.; Svensson, Å.; Sternudd, C.; Johansson, M. What limits the pedestrian? Exploring perceptions of walking in the built environment and in the context of every-day life. J. Transp. Health 2014, 1, 223–231. [Google Scholar] [CrossRef] [Scilit]
- Schlossberg, M.; Brown, N. Comparing transit-oriented development sites by walkability indicators. Transp. Res. Rec. J. Transp. Res. Board 2004, 1887, 34–42. [Google Scholar] [CrossRef] [Scilit]
- Liu, Q.; Liu, Y.; Yin, H.; Xu, X. Which factors impact bus travel, and the potential of replacing car travel with bus travel: An empirical study from a Chinese third-tier city. Digit. Transp. Saf. 2025, 4, 195–206. [Google Scholar] [CrossRef] [Scilit]
- Zhang, H.; Qu, K. How does the built environment affect intermodal demand between bus and metro: An ensemble explainable machine learning analysis. ISPRS Int. J. Geo-Inf. 2026, 15, 269. [Google Scholar] [CrossRef] [Scilit]
- Park, S.; Kang, J.; Choi, K. Finding determinants of transit users’ walking and biking access trips to the station: A pilot case study. KSCE J. Civ. Eng. 2014, 18, 651–658. [Google Scholar] [CrossRef] [Scilit]
- Deng, J.; Chen, P.; Chen, X.; Li, T.; Yuan, Q. Financial sustainability versus social equity: Design and performance of a hybrid city bus system. J. Public Transp. 2023, 25, 100044. [Google Scholar] [CrossRef] [Scilit]
- Perugia, A.; Moccia, L.; Cordeau, J.-F.; Laporte, G. Designing a home-to-work bus service in a metropolitan area. Transp. Res. Part B Methodol. 2011, 45, 1710–1726. [Google Scholar] [CrossRef] [Scilit]
- Han, J.; Xue, Q.; Yuan, Y.; Yang, X.; Wu, J. Integrated optimization of train stopping plans and timetabling for urban rail transit based on dynamic demand. Digit. Transp. Saf. 2025, 4, 42–49. [Google Scholar] [CrossRef] [Scilit]
- Ruiz, M.; Segui-Pons, J.M.; Mateu-Lladó, J. Improving Bus Service Levels and social equity through bus frequency modelling. J. Transp. Geogr. 2017, 58, 220–233. [Google Scholar] [CrossRef] [Scilit]
- Linovski, O.; Baker, D.M.; Manaugh, K. Equity in practice? Evaluations of equity in planning for bus rapid transit. Transp. Res. Part A Policy Pract. 2018, 113, 75–87. [Google Scholar] [CrossRef] [Scilit]
- Shao, J.; Xu, Y.; Sun, L.; Kong, D.; Lu, H. Equity-oriented integrated optimization of train timetable and stop plans for suburban railways system. Comput. Ind. Eng. 2022, 173, 108721. [Google Scholar] [CrossRef] [Scilit]
- Zheng, M.; Liu, F.; Guo, X. Optimization of multimodal public transit networks considering spatial equity. Systems 2026, 14, 947. [Google Scholar] [CrossRef] [Scilit]
- Yan, Y.; Du, W.; Tong, P.; Li, J. Equity-considered design method for battery electric bus networks. Sustainability 2025, 17, 10149. [Google Scholar] [CrossRef] [Scilit]
- Ramos-Santiago, L.E. Does walkability around feeder bus-stops influence rapid-transit station boardings? J. Public Transp. 2022, 24, 100026. [Google Scholar] [CrossRef] [Scilit]
- Alonso, B.; Barreda, R.; Dell’olio, L.; Ibeas, A. Modelling user perception of taxi service quality. Transp. Policy 2018, 63, 157–164. [Google Scholar] [CrossRef] [Scilit]
- Wu, J.; Liu, M.; Sun, H.; Li, T.; Gao, Z.; Wang, D.Z. Equity-based timetable synchronization optimization in urban subway network. Transp. Res. Part C Emerg. Technol. 2015, 51, 1–18. [Google Scholar] [CrossRef] [Scilit]
- Wei, R.; Liu, X.; Ou, Y.; Fayyaz, S.K. Optimizing the spatio-temporal deployment of battery electric bus system. J. Transp. Geogr. 2018, 68, 160–168. [Google Scholar] [CrossRef] [Scilit]
- Su, S.; Zhao, C.; Zhou, H.; Li, B.; Kang, M. Unraveling the relative contribution of TOD structural factors to metro ridership: A novel localized modeling approach with implications on spatial planning. J. Transp. Geogr. 2022, 100, 103308. [Google Scholar] [CrossRef] [Scilit]
- Cardozo, O.D.; García-Palomares, J.C.; Gutiérrez, J. Application of geographically weighted regression to the direct forecasting of transit ridership at station-level. Appl. Geogr. 2012, 34, 548–558. [Google Scholar] [CrossRef] [Scilit]
- Rhoades, S.A. The herfindahl-hirschman index. Fed. Res. Bull. 1993, 79, 188–199. [Google Scholar]
- Qi-lin, L.I.; Ying-rong, L.U.; Chuan, D. Analysis of the impact of built environment on taxi travel demand considering spatial spillover effect. J. Transp. Syst. Eng. Inf. Technol. 2016, 16, 39. [Google Scholar]
- Dong, Y.; Wang, S.; Li, L.; Zhang, Z. An empirical study on travel patterns of internet based ride-sharing. Transp. Res. Part C Emerg. Technol. 2018, 86, 1–22. [Google Scholar] [CrossRef] [Scilit]
- Fei, P.; Guo-hua, S.; Shan, Z. A Method for Extracting Commuting Trips of Frequent Passengers in Urban Public Transportation. J. Transp. Syst. Eng. Inf. Technol. 2021, 21, 158–165+172. [Google Scholar]
- Li, X.; Qi-peng, Y.; Chen, L. Impact of Built Environment on Flow of Transfer Passengers Between Subway and Bus Considering Spatial Heterogeneity. J. Transp. Syst. Eng. Inf. Technol. 2023, 23, 100–110. [Google Scholar]
- Luo, X.; Fan, W. Joint design of electric bus transit service and wireless charging facilities. Transp. Res. Part E Logist. Transp. Rev. 2023, 174, 103114. [Google Scholar] [CrossRef] [Scilit]
- Wang, X.; Song, Z.; Xu, H.; Wang, H. En-route fast charging infrastructure planning and scheduling for battery electric bus systems. Transp. Res. Part D Transp. Environ. 2023, 117, 103659. [Google Scholar] [CrossRef] [Scilit]
- Badia, H.; Jenelius, E. Design and operation of feeder systems in the era of automated and electric buses. Transp. Res. Part A Policy Pract. 2021, 152, 146–172. [Google Scholar] [CrossRef] [Scilit]
- Hadjar, A.; Marcotte, O.; Soumis, F. A branch-and-cut algorithm for the multiple depot vehicle scheduling problem. Oper. Res. 2006, 54, 130–149. [Google Scholar] [CrossRef] [Scilit]
- China Statistical Yearbook. Employment, Hours, and Earnings from the Current Employment Statistics Survey (National). 2023. Available online: http://www.stats.gov.cn/sj/ndsj/2023/indexch.htm (accessed on 1 September 2023).
- Kunith, A.; Mendelevitch, R.; Goehlich, D. Electrification of a city bus network—An optimization model for cost-effective placing of charging infrastructure and battery sizing of fast-charging electric bus systems. Int. J. Sustain. Transp. 2017, 11, 707–720. [Google Scholar] [CrossRef] [Scilit]
- Rogge, M.; Wollny, S.; Sauer, D.U. Fast charging battery buses for the electrification of urban public transport—A feasibility study focusing on charging infrastructure and energy storage requirements. Energies 2015, 8, 4587–4606. [Google Scholar] [CrossRef] [Scilit]
- Mohamed, M.; Farag, H.; El-Taweel, N.; Ferguson, M. Simulation of electric buses on a full transit network: Operational feasibility and grid impact analysis. Electr. Power Syst. Res. 2017, 142, 163–175. [Google Scholar] [CrossRef] [Scilit]
- Zhang, L.; Liu, Z.; Wang, W.; Yu, B. Long-term charging infrastructure deployment and bus fleet transition considering seasonal differences. Transp. Res. Part D Transp. Environ. 2022, 111, 103429. [Google Scholar] [CrossRef] [Scilit]
- Liu, J.; Pei, Y.; Dong, C.; He, Q.; Wang, Z. Optimizing electric bus charging infrastructure deployment under two charging modes considering seasonal differences. Transp. Lett. 2023, 16, 1126–1139. [Google Scholar] [CrossRef] [Scilit]
- Buchmann, I. Battery University: Electric Vehicle (EV). 2019. Available online: https://batteryuniversity.com/learn/article/electric_vehicle_ev (accessed on 21 December 2019).
- Li, W.; Ding, H.; Xu, N.; Zhang, J. Toward carbon-neutral transportation electrification: A comprehensive and systematic review of eco-driving for electric vehicles. IEEE Trans. Transp. Electrif. 2023, 10, 6340–6360. [Google Scholar] [CrossRef] [Scilit]

Disclaimer/Publisher’s Note: The statements, opinions and data contained in all publications are solely those of the individual author(s) and contributor(s) and not of MDPI and/or the editor(s). MDPI and/or the editor(s) disclaim responsibility for any injury to people or property resulting from any ideas, methods, instructions or products referred to in the content. |
© 2026 by the authors. Licensee MDPI, Basel, Switzerland. This article is an open access article distributed under the terms and conditions of the Creative Commons Attribution (CC BY) license.