


Abstract
Perpetual futures account for approximately 93% of cryptocurrency futures trading volume, yet funding rate dynamics across fragmented markets remain understudied. We construct a high-frequency panel dataset comprising 35.7 million one-minute observations across 26 cryptocurrency exchanges (11 centralized, 15 decentralized) spanning 749 symbols over eight consecutive days. Using time-series econometrics, correlation analysis, and Granger causality tests, we characterize funding rate dynamics, market integration, and information flow. We find evidence of a two-tiered market structure: centralized exchanges (CEX) dominate price discovery with 61% higher integration than decentralized exchanges (DEX), and all significant information flow runs CEX-to-DEX with zero reverse causality. While 17% of observations exhibit economically significant arbitrage spreads (≥20 basis points), only 40% of top opportunities generate positive returns after transaction costs and spread reversals. Delta-neutral portfolio simulations reveal that successful arbitrage requires both high spreads and sufficient duration before inevitable reversals, with forced exits occurring in 95% of opportunities. The findings show that cryptocurrency derivatives markets exhibit a persistent two-tiered structure in which centralized platforms dominate price discovery while transaction costs and spread reversal risks prevent arbitrage from eliminating large mispricings between platforms, resolving the apparent paradox of substantial price fragmentation coexisting with market efficiency.
Keywords:
cryptocurrency risk management; statistical arbitrage; funding rate modeling; portfolio optimization; quantitative finance MSC:
91G15
1. Introduction
Perpetual futures have become the dominant derivative instrument in cryptocurrency markets, accounting for approximately 93% of cryptocurrency futures trading volume and over $90 trillion in cumulative trading volume [1]. Unlike traditional contracts with fixed expiration dates, these instruments remain open indefinitely; they employ what practitioners call a funding rate mechanism (periodic payments between long and short positions) to anchor the perpetual price to the underlying spot price. Without natural convergence through expiration, this funding rate serves as the primary tool for maintaining price parity, though how well it actually works varies considerably across different market contexts. This makes it a critical component of market microstructure in cryptocurrency derivatives, albeit one that remains surprisingly understudied.
Trading activity in cryptocurrency perpetual futures markets is highly fragmented. Dozens of exchanges differ fundamentally in organizational structure and market design. Centralized exchanges (CEX), such as Binance and OKX, operate traditional order book mechanisms with centralized custody; decentralized exchanges (DEX), including platforms like HyperLiquid and Drift, employ on-chain settlement with permissionless access. These structural differences affect liquidity provision, price discovery, and transaction costs. Yet remarkably little is known about how funding rates compare across exchange types or whether persistent arbitrage opportunities exist between them. In theory, arbitrage pressures should eliminate such discrepancies, but whether this holds in practice remains unclear.
Three fundamental questions about funding rate dynamics in fragmented cryptocurrency markets drive this paper. First, what are the time-series properties of funding rate spreads across exchanges? Do they exhibit mean reversion, volatility clustering, and predictable persistence patterns? Second, what are the risk-adjusted returns of delta-neutral arbitrage portfolios that exploit funding rate differentials; how do spread convergence patterns affect optimal holding periods? Third, which exchanges lead funding rate price discovery, and how does market integration differ between centralized and decentralized platforms?
To address these questions, we construct a high-frequency panel dataset comprising one-minute granularity funding rate observations across 26 cryptocurrency exchanges (11 centralized and 15 decentralized) over eight consecutive days. This yields 35.7 million observations spanning 749 cryptocurrency symbols. The findings appear to make three contributions, though their novelty will depend on how the literature evolves. First, we build a statistical framework characterizing funding rate dynamics through time-series econometrics and transaction cost accounting. This framework provides evidence consistent with existing theoretical work on perpetual futures pricing by documenting how real-world market frictions create exploitable yet risky arbitrage opportunities [2,3]. Second, methodologically, we introduce a normalization procedure for comparing funding rates across heterogeneous platforms and demonstrate how to construct risk-managed multi-venue arbitrage portfolios. Third, from a practical standpoint, our results might provide guidance for traders implementing funding rate arbitrage strategies (optimal exchange selection, position sizing, and risk management protocols).
The remainder of this paper is organized as follows. Section 2 reviews related literature on perpetual futures pricing, cryptocurrency market microstructure, and portfolio optimization. Section 3 describes our data sources, normalization methodology, and econometric approach. Section 4 presents our main empirical findings on funding rate dynamics, arbitrage opportunities, and information flow across exchanges. Section 5 discusses the economic mechanisms underlying our findings. Final conclusions are drawn in Section 6.
2. Literature Review
The theoretical foundation for perpetual futures originates with [4], who proposed perpetual claims on economic indicators with funding rates dependent on observable cash flows. Recent work has adapted this framework to cryptocurrency markets. Ref. [2] derive explicit no-arbitrage prices for linear, inverse, and quanto perpetual futures. This provides much of the theoretical foundation for understanding perpetual contract valuation. Ref. [3] extend this analysis by characterizing no-arbitrage prices in frictionless markets and establishing pricing bounds when trading costs are present. While these studies establish the theoretical properties of perpetual futures pricing, they largely abstract from institutional heterogeneity across trading venues. This paper complements the literature by examining how funding rates differ across exchange types and testing whether real-world frictions generate persistent deviations from theoretical parity. Whether such deviations are more transient than the literature suggests remains to be seen.
A separate strand of literature examines cross-sectional patterns in cryptocurrency returns and market structure. Ref. [5] identify three common factors (cryptocurrency market, size, momentum) that appear to capture expected returns in the cross-section of cryptocurrencies, analogous to traditional asset pricing factors. Recent work on decentralized finance (DeFi) highlights structural differences between CEX and DEX platforms. DEX platforms typically employ automated market maker (AMM) mechanisms rather than traditional order books, potentially affecting price discovery and arbitrage efficiency. The magnitude of these effects remains somewhat unclear. Ref. [6] analyze arbitrage dynamics on decentralized exchanges, demonstrating how AMM design affects arbitrage profitability and optimal trading strategies. Empirical studies document what seems to be substantial arbitrage activity between CEX and DEX platforms. Ref. [7] find that searchers extracted approximately $233.8 million from over 7.2 million arbitrages on Ethereum alone between August 2023 and March 2025. These studies focus on spot price arbitrage rather than funding rate arbitrage; systematic comparisons of funding rates across exchange types have not yet been conducted.
Volatility and risk dynamics in cryptocurrency markets. Understanding volatility is essential for risk management in cryptocurrency derivatives trading. Ref. [8] demonstrates that GARCH models appear to capture the time-varying volatility in Bitcoin returns effectively, with asymmetric specifications providing superior fit. Ref. [9] document that cryptocurrency volatility exhibits distinct clustering patterns and responds asymmetrically to positive and negative shocks, suggesting the need for sophisticated volatility modeling for accurate risk assessment. Ref. [10] show that long-volatility strategies in cryptocurrency markets can provide substantial risk-adjusted returns. This highlights the importance of volatility dynamics for portfolio construction.
Portfolio optimization and risk management. The application of modern portfolio theory to cryptocurrency markets has gained increasing attention. Ref. [11] apply mean-variance optimization to cryptocurrency portfolios, finding that optimal portfolios may significantly outperform naive diversification strategies. The stability of these results remains an open question, however. Ref. [12] demonstrate that cryptocurrency-enhanced portfolios appear to improve risk-adjusted returns for traditional investors; the magnitude of benefits depends heavily on rebalancing frequency and transaction costs. Ref. [13] examine the stability of Sharpe ratios in cryptocurrency markets, documenting substantial time variation that challenges static portfolio allocation rules. Our study extends this literature by applying portfolio evaluation techniques specifically to funding rate arbitrage strategies.
Market efficiency and price discovery. The efficiency of cryptocurrency markets and the speed of information incorporation remain active research questions. Ref. [14] test market efficiency in Bitcoin using variance ratio tests, finding evidence of time-varying efficiency with periods of both efficiency and inefficiency. Ref. [15] document what appear to be substantial and persistent cross-exchange Bitcoin price deviations; they attribute these to segmented capital flows, regulatory frictions, and sophisticated arbitrageur behavior, though alternative explanations might also be plausible. Ref. [16] analyze price discovery in Bitcoin spot and futures markets, finding that futures markets contribute significantly to price formation. These findings motivate our investigation of funding rate integration across exchanges and our tests of mean reversion and information flow using Granger causality.
Against this backdrop, our study investigates three fundamental questions. First, what are the time-series properties of funding rate spreads across exchanges? Second, what are the risk-adjusted returns of delta-neutral arbitrage portfolios exploiting these differentials? Third, which exchanges lead funding rate price discovery, and how does market integration differ between centralized and decentralized platforms?
Research Gap and Contribution
The existing literature exhibits two critical gaps that our study addresses. First, empirical studies of funding rates focus primarily on single exchanges or aggregate data. They neglect what may be substantial heterogeneity across trading venues. Ref. [2] analyze aggregate Bitcoin perpetual futures data but do not examine cross-exchange variation or institutional differences. Second, despite the rapid growth of decentralized perpetual futures platforms, no study systematically compares CEX and DEX funding rate dynamics.
We address these gaps through the first high-frequency analysis of funding rates to simultaneously encompass both centralized (11 CEX) and decentralized (15 DEX) cryptocurrency exchanges. Our one-minute granularity panel dataset enables high-frequency analysis of funding rate dynamics that no prior study has systematically examined across both exchange types. The analysis enables us to: (1) characterize time-series properties of funding rate spreads using stationarity tests, autocorrelation analysis, and GARCH volatility models; (2) quantify arbitrage opportunities and construct delta-neutral portfolios with transaction cost adjustments; (3) examine information flow across exchanges via Granger causality; and (4) assess market integration across exchange types.
3. Methodology
This section presents the framework for analyzing funding rate dynamics and constructing risk-managed arbitrage portfolios. The approach comprises five components: data collection; time-series statistical analysis; cross-sectional market integration assessment; arbitrage opportunity identification; and delta-neutral portfolio construction with risk management.
3.1. Data
3.1.1. Data Sources and Collection
We collect funding rate data using APIs of the examined exchanges and a software tool which aggregates and stores real-time perpetual futures data. Our dataset consists of continuous one-minute granularity observations collected over eight consecutive days (8–15 November 2025). This yields 35.7 million observations across 749 symbols with multi-exchange coverage (minimum 2 exchanges per symbol). The high-frequency panel structure enables both cross-sectional analysis of market fragmentation and time-series analysis of funding rate dynamics, persistence, and convergence patterns.
For each exchange–symbol–timestamp observation, we record: (1) funding rate (in basis points, bps, where 1 bps = 0.01%), (2) funding rate interval (1-h, 4-h, or 8-h), (3) Open Interest (OI) rank as a liquidity proxy, and (4) timestamp with millisecond precision. Our sample includes 11 centralized exchanges (BINANCE, BYBIT, OKX, KUCOIN, MEXC, GATEIO, BITGET, BINGX, PHEMEX, CRYPTOCOM, HTX) and 15 decentralized exchanges (HYPERLIQUID, DRIFT, PARADEX, KUMA, VEST, BLUEFIN, PACIFICA, LIGHTER, EXTENDED, EDGEX, HIBACHI, ETHEREAL, VARIATIONAL, ASTER, WOOFI).
Data quality protocols: API rate limits required staggered requests with 100–200 ms delays between calls to avoid throttling across exchanges. Missing data from brief exchange downtimes totaled < 0.01% of expected observations (as reported in Table 1). We handle missing observations via forward-filling for gaps ≤ 5 min, treating longer gaps as structural NA where symbols are not offered. Some exchanges report funding rates only at discrete intervals (1, 4, or 8 h) rather than continuously; we carry forward the most recent rate until the next update. This forward-fill approach accurately reflects information available to traders at each timestamp, though it introduces autocorrelation by construction for exchanges with infrequent updates.
3.1.2. Funding Rate Normalization
Different exchanges report funding rates over heterogeneous time intervals (1-h, 4-h, or 8-h). This makes raw rates non-comparable. We normalize all funding rates to 8-h equivalents using linear scaling:
where is the funding rate over interval h hours. This yields multipliers of 8, 2, and 1 for 1-h, 4-h, and 8-h intervals respectively. We choose 8-h as the standard because it aligns with industry convention [2,3]. This choice involves some degree of arbitrariness, of course.
To facilitate economic interpretation, we convert normalized 8-h rates to annualized percentage yields:
where is in basis points. For example, a spread of 20 bps per 8-h period corresponds to approximately 219% APY.
3.1.3. Sample Filters
Two primary filters are applied: (1) Multi-exchange filter: We store data only for symbols traded on exchanges, reducing the sample from 1417 to 731 symbols with arbitrage potential. (2) Major cryptocurrency subsample: For detailed time-series analysis, we define major cryptocurrencies as the top 10 by Open Interest rank. OI rank directly measures perpetual futures market activity and remains more stable than market capitalization. For portfolio analysis (Section 3.5), we focus on the top 20 arbitrage opportunities ranked by spread magnitude rather than OI rank, as these represent the most economically significant mispricings. (3) Outlier filter: We apply a conservative outlier threshold to remove data quality errors. Funding rates exceeding ±5000 bps (equivalent to ±54,750% APY) are flagged as likely API errors or flash crashes and excluded from analysis. This threshold is set well beyond the 99.9th percentile of observed rates (maximum 2401 bps in our sample) to retain legitimate extreme values while removing obvious anomalies. This filter removed 47 observations (0.0001% of the sample).
3.2. Time-Series Statistical Analysis
3.2.1. Stationarity and Mean-Reversion Testing
Augmented Dickey-Fuller (ADF) tests [17] investigate whether funding rate spreads experience mean-reverting behaviour. A negative and statistically significant coefficient on the lagged spread level suggests mean reversion, potentially meaning that spreads are temporary and markets are relatively efficient. For spreads exhibiting mean reversion, we estimate the half-life (the time required for spreads to decay by 50% toward their long-run mean):
where is estimated from exponential decay regressions. We confirm stationarity using KPSS tests [18] as a check.
3.2.2. Autocorrelation and Persistence Analysis
We compute autocorrelation functions (ACFs) and partial autocorrelation functions (PACFs) up to 48 lags to assess predictability. Significant positive autocorrelation may indicate persistent arbitrage opportunities; rapid decay suggests more efficient markets. We formally test for serial correlation using Ljung–Box Q-statistics [19] and estimate autoregressive AR(p) models where appropriate.
3.2.3. Volatility Modeling
Funding rate volatility directly impacts arbitrage strategy risk profiles. After confirming autoregressive conditional heteroskedasticity via Engle ARCH-LM tests [20], we model time-varying volatility using GARCH(1,1) models [21]:
where is the conditional variance and are parameters estimated via maximum likelihood (with for stationarity). Estimated conditional volatility characterizes time-varying arbitrage risk.
3.2.4. Information Flow and Granger Causality
To understand which exchanges might lead to changes in funding rates and how information flows between CEX and DEX platforms, we estimate bivariate vector autoregression (VAR) models for strategically selected exchange pairs representing different market structures [22]. Exchange Granger-causes exchange if past values of ’s funding rate help predict ’s current rate beyond what ’s own history predicts. We select optimal lag lengths using the Akaike Information Criterion (AIC) [23] with a maximum of 10 lags, balancing model fit against parameter proliferation. For most exchange pairs, AIC selects 1–3 lags, reflecting rapid information transmission in high-frequency markets. We test this using F-tests on the VAR coefficients and compute orthogonalized impulse response functions to trace how shocks propagate across exchanges. We perform these tests for five representative exchange pairs (BINANCE-HYPERLIQUID, BINANCE-BYBIT, DRIFT-HYPERLIQUID, BINANCE-OKX, and KUCOIN-MEXC) to construct an information flow network and specifically test directional causality between CEX and DEX platforms. To address potential microstructure noise and timestamp misalignment at high frequencies, we conduct robustness checks by resampling data to 5-min and 15-min intervals and re-running Granger causality tests. Results remain qualitatively consistent across all three frequencies: CEX platforms consistently Granger-cause DEX platforms, while the reverse is rarely observed. This robustness suggests our main findings reflect genuine information flow patterns rather than artifacts of 1-min sampling frequency.
3.3. Cross-Sectional Analysis and Market Integration
3.3.1. Descriptive Statistics by Exchange Type
For each exchange type , we compute mean, median, standard deviation, and interquartile range of funding rates, pooling all observations across time and symbols. To examine cross-sectional patterns while controlling for time-varying factors, we also compute time-averaged funding rates for each exchange–symbol pair:
where 10,080 min (7-day). This eliminates temporal variation and enables cleaner cross-sectional comparison.
We test for statistically significant differences between CEX and DEX using: (1) two-sample t-tests for differences in means [24], (2) Levene’s tests for equality of variances, and (3) Mann–Whitney U tests as non-parametric alternatives resilient to outliers. We compute statistics for the full sample and major cryptocurrencies.
3.3.2. Correlation Analysis and Market Integration
Correlation matrices are used to examine co-movement of funding rates across exchanges. For each pair of exchanges offering the same symbol s, we compute Pearson correlations across the time series. Then we calculate average correlations within exchange types (intra-CEX, intra-DEX) and across exchange types (CEX-DEX). High within-type correlations suggest relatively integrated markets where arbitrage forces may align funding rates; low across-type correlations indicate market fragmentation and potentially persistent cross-platform opportunities.
3.4. Arbitrage Opportunity Identification
The funding rate spread is defined as the difference between the maximum and minimum rates, across exchanges, for each symbol s at time t:
where is the set of exchanges offering symbol s. We classify an arbitrage opportunity as economically significant
This threshold represents 219% annualized returns, which substantially exceeds typical transaction costs (4–8 bps).
The arbitrage strategy is delta-neutral, involving equal and opposite positions: a long position of notional value N on the exchange with the lowest funding rate, and a short position of N on the exchange with the highest funding rate. This hedges against price movements; profit derives from the funding rate differential:
It is important to mention that, while delta-neutral in principle, the strategy faces execution, liquidity, margin, exchange-specific, and timing risks. These risks are accounted in this study and we discuss them later in the portfolio analysis.
Arbitrage opportunities are classified by: (1) exchange type pairing (CEX-CEX, DEX-DEX, CEX-DEX), and (2) temporal persistence measured as cumulative duration above threshold (in days and hours) and percentage of total time period. For each opportunity, we characterize liquidity (OI rank), exchange coverage, volatility, and directional bias (DEX vs. CEX rates).
Duration measurement: Opportunity duration (reported in Table 3) measures the cumulative time (sum of all one-minute intervals) when spread ≥ 20 bps. This accounts for non-contiguous episodes; if a spread exceeds the threshold, falls below it, then rises above it again, all qualifying minutes are counted. The percentage of time represents this cumulative duration relative to the total observation period for that symbol. This differs from portfolio holding duration (Section 3.5), which measures continuous time from entry until spread turns negative, with no re-entry permitted after forced exit.
3.5. Delta-Neutral Portfolio Construction and Risk Management
3.5.1. Portfolio Strategy and Transaction Costs
For each identified arbitrage opportunity (spread ≥ 20 bps), we construct a delta-neutral portfolio by taking simultaneous long and short positions of equal notional value across the two exchanges with the most extreme funding rates. We simulate portfolios with equal position sizing of $10,000 per arbitrage opportunity.
Transaction costs: The costs charged at position entry and exit are critical for the net profitability. We adjust gross profits for:
- (1)
- Taker fees (0.01–0.05% across exchanges in our sample, conservatively estimated at 0.05% in our simulations),
- (2)
- Slippage (conservatively estimated as 0.1% for liquid pairs with OI rank < 50, and 0.5% for illiquid pairs), and
- (3)
- Gas costs for DEX transactions, which are negligible as most DEX in our sample operate on low-cost blockchains (Solana, Arbitrum, Optimism) with costs < $0.01 per trade.
For our base case position size of $10,000 per side, transaction costs are:
- Liquid markets (OI rank < 50): Entry costs of $30 (2 positions × $10,000 × 0.15%) plus exit costs of $30, totaling $60 per round-trip
- Illiquid markets (OI rank ≥ 50): Entry costs of $110 (2 positions × $10,000 × 0.55%) plus exit costs of $110, totaling $220 per round-trip
Funding payments accrue continuously based on the instantaneous spread. While funding rates are expressed as 8-h rates (the standard payment interval), we calculate per-minute accrual by dividing the 8-h rate by 480 min, then sum across the holding period. We construct a comprehensive fee table for all 26 exchanges based on published schedules as of November 2025.
3.5.2. Spread Dynamics and Convergence Patterns
For each symbol exhibiting a significant spread, we track its evolution to understand arbitrage sustainability. We examine whether spreads converge smoothly toward zero or reverse suddenly (where exchanges swap relative positions). Spread reversals create particular risk; arbitrageurs holding positions through a reversal experience losses as the previously profitable spread turns negative.
For converging spreads, we measure: time for the spread to fall below the 20 bps threshold, half-life (time to reach 50% of the initial spread from Equation (3)), and time to near-complete convergence (10 bps). These metrics may inform optimal holding periods.
3.5.3. Forced Exit Protocol
Our portfolio simulations employ a conservative forced exit protocol: positions are immediately closed when the funding rate spread turns negative (spread < 0 bps). This threshold is chosen to strictly prevent losses from adverse spread reversals, where the previously favorable funding differential begins working against the arbitrageur. While this conservative approach limits downside risk, it may trigger premature exits when spreads temporarily turn negative before recovering. Alternative exit thresholds (e.g., −5 bps or −10 bps with tighter stop-loss rules) could potentially improve profitability by tolerating brief negative excursions, but we adopt the zero-threshold approach to establish a baseline risk-minimizing strategy. This methodological choice significantly affects the profitability results reported in Section 4.6; readers should interpret the portfolio performance metrics as conditional on this specific exit protocol rather than as general statements about funding rate arbitrage profitability.
3.5.4. Risk-Adjusted Performance Metrics
Portfolio performance is evaluated using risk-adjusted metrics [25,26]. We compute Sharpe ratios (excess return per unit risk) and maximum drawdowns (largest peak-to-trough decline) to assess whether arbitrage opportunities generate acceptable risk-return profiles.
4. Results
4.1. Data Overview and Sample Characteristics
The dataset comprises 35.7 million one-minute observations spanning 749 symbols across 26 exchanges (11 CEX, 15 DEX) over 8–15 November 2025. Table 1 provides summary statistics. After normalizing funding rates to 8-h equivalents, we identify symbols with average spreads ≥ 20 bps (219% APY); roughly 17% of observations exceed this threshold (mean spread 14.3 bps, max 2401 bps). The top 10 symbols by OI ranking (BTC, ETH, SOL, BNB, XRP, ZEC, DOGE, HYPE, ASTER, SUI) have 24–26 exchange coverage each.
Table 1.
Dataset summary statistics. Funding rates are normalized to 8-h equivalents measured in basis points (bps). Data collected 8–15 November 2025 at one-minute granularity.
4.2. Descriptive Statistics: CEX vs. DEX Comparison
Table 2 compares funding rates between CEX and DEX platforms. CEX observations (27.9M, representing 78% of the sample) and DEX observations (7.8M, 22%) exhibit similar mean rates (CEX: bps, DEX: bps, difference 0.18 bps, ), though the economic magnitude of this difference appears negligible. CEX shows higher dispersion (SD 22.82 vs. 17.24 bps, Levene , ). Most rates cluster near zero (IQR: CEX 1.20, DEX 1.60 bps). Market frictions appear to manifest in cross-platform spreads, not in average levels.
Table 2.
Descriptive statistics of funding rates by exchange type (CEX vs. DEX). Funding rates are normalized to 8-h equivalents and measured in basis points. All differences are statistically significant at due to the large sample size, though economically negligible for central tendency measures.
4.3. Arbitrage Opportunities and Market Fragmentation
We find 665,251 observations (17% of the sample) exceeding the 20 bps threshold (mean 51.6 bps, max 2401 bps). Most of these opportunities (84%) involve CEX-DEX pairings (average 52.4 bps, persisting 91% of observation time); roughly 16% involve CEX-CEX pairs (47.2 bps, 92% duration), while essentially no DEX-DEX opportunities appear (30.3 bps, 62% duration). Looking at top opportunities (Table 3): INTC leads with a remarkable 472 bps spread, though its brief 0.7% duration is noteworthy. AIA and 0G maintain spreads for approximately half the observation period (50.2% and 51.6% respectively), while LSK persists for 38.0% and MERL for 21.3% of the time.
Table 3.
Top 10 arbitrage opportunities ranked by average funding rate spread. Duration indicates cumulative time with spread above 20 bps.
4.4. Time-Series Properties of Funding Rate Spreads
Stationarity: Only ETH exhibits what appears to be clear stationarity (ADF , KPSS , ). Three symbols (BNB, ZEC, ASTER) appear non-stationary; six show mixed evidence (Table 4).
Table 4.
Stationarity tests for funding rate spreads of top 10 cryptocurrencies. ADF tests for unit root (non-stationarity); KPSS tests for stationarity. Conflicting results indicate near-unit-root behavior with slow mean reversion.
Autocorrelation and persistence: Spreads exhibit extremely high persistence across all symbols. First-order autocorrelations range from 0.966 to 0.998; current spreads strongly predict next-period spreads. Even at lag 8, autocorrelations remain above 0.80 for all symbols. Ljung-Box Q-tests overwhelmingly reject the null of no autocorrelation (), with Q-statistics ranging from 39,970 to 51,736. This strong autocorrelation implies slow adjustment to shocks and potential predictability, though it also means that large spreads tend to persist for extended periods.
Mean reversion: ETH spreads revert rapidly with a half-life of approximately 20 min (AR(1) coefficient 0.966, ). This seems consistent with active arbitrage. Other symbols show minimal or negligible mean reversion (AR(1) coefficients exceeding 0.96, implying half-lives exceeding hours or even days). This heterogeneity may suggest varying arbitrage efficiency; ETH appears to attract sophisticated arbitrageurs who rapidly eliminate mispricings, while less liquid symbols exhibit considerably slower correction.
Volatility: GARCH(1,1) models for BTC, ETH, and SOL all exhibit what appears to be integrated GARCH (IGARCH) with persistence (Table 5). BTC shows , (suggesting short-term shocks dominate); SOL displays , (where past volatility dominates); ETH falls somewhere in between (, ). IGARCH suggests that shocks to volatility may be permanent; conditional variance follows what resembles a unit-root process, complicating risk management as volatility does not revert to a long-run mean. Note that our 8-day observation window may be insufficient to distinguish true IGARCH from near-integrated processes; this finding should be interpreted cautiously.
Table 5.
GARCH(1,1) parameter estimates for BTC, ETH, SOL funding rate spreads. Persistence () near 1.0 indicates integrated GARCH (IGARCH) with permanent volatility shocks.
Implications: The extreme persistence (autocorrelations exceeding 0.96), limited stationarity (only ETH), and IGARCH volatility together indicate that funding rate spreads exhibit slow-moving dynamics with potentially permanent volatility shocks. ETH’s rapid 20-min mean reversion suggests that short-horizon arbitrage might profitably exploit transient mispricings with limited risk. For other symbols, slow reversion implies arbitrageurs must tolerate extended holding periods or accept persistent adverse spreads. IGARCH dynamics appear to require continuous risk monitoring; arbitrageurs cannot rely on volatility declines to reduce exposure.
4.5. Information Flow and Price Discovery
Granger causality tests (Table 6) examine information flow across five strategically selected exchange pairs representing different market structures: BINANCE-HYPERLIQUID (major CEX-DEX), BINANCE-BYBIT (major CEX-CEX), DRIFT-HYPERLIQUID (DEX-DEX), BINANCE-OKX (major CEX-CEX alternative), and KUCOIN-MEXC (mid-tier CEX-CEX). Testing these pairs across the top 10 cryptocurrencies yields 92 bidirectional tests; 57 exhibit statistically significant causality (62%).
Table 6.
Selected Granger causality test results from 92 bidirectional tests across five exchange pairs and ten cryptocurrencies. CEX to DEX causality: 14 significant; DEX to CEX causality: 0 significant.
CEX platforms dominate price discovery: The directional pattern appears unambiguous. Among the 14 CEX-DEX exchange pairs tested across our symbol set, all 14 significant relationships show CEX to DEX causality; zero show DEX to CEX causality. For instance, BINANCE Granger-causes HYPERLIQUID for 7 of 9 tested symbols, with F-statistics ranging from 4.23 to 127.83 (all ). This asymmetry provides what seems to be strong evidence that centralized exchanges lead funding rate price discovery, with innovations originating on CEX platforms before propagating to DEX.
Intra-CEX integration: Centralized platforms exhibit pervasive bidirectional causality (35 significant CEX-CEX relationships observed). BINANCE and BYBIT Granger-cause each other for 9 of 10 symbols. This suggests tight integration and rapid information transmission within the CEX ecosystem.
Limited DEX influence: Only 8 significant DEX-DEX relationships emerge, concentrated between DRIFT and HYPERLIQUID. HYPERLIQUID appears as the dominant decentralized platform, Granger-causing DRIFT for 5 symbols. The limited DEX-DEX causality may reflect fragmentation among decentralized platforms operating with less integrated liquidity infrastructure.
The absence of any DEX to CEX causality suggests that centralized exchanges lead funding rate discovery. Decentralized exchanges appear to operate as price takers, adjusting rates in response to CEX innovations rather than independently driving discovery.
Robustness to sampling frequency: To address potential microstructure noise and timestamp misalignment at high frequencies, we re-estimate all Granger causality tests at 5-min and 15-min sampling intervals. Table 7 summarizes results across the three frequencies. The directional asymmetry remains consistent: CEX platforms Granger-cause DEX platforms in all tested cases at every frequency (14 of 14 at 1-min, 7 of 7 at 5-min, 6 of 6 at 15-min), while the reverse - DEX causing CEX is never observed at any frequency. The number of CEX→DEX pairs tested varies across frequencies because some exchange pairs fail stationarity requirements at coarser time scales. Nonetheless, the complete absence of DEX→CEX causality across all frequencies confirms that CEX price leadership reflects genuine structural information flow rather than high-frequency sampling artifacts.
Table 7.
Granger causality robustness checks across sampling frequencies. The table reports the number of statistically significant () causal relationships by direction and frequency. Total tests: 92 bidirectional tests across 5 exchange pairs and 10 cryptocurrencies at each frequency.
4.6. Market Integration and Cross-Exchange Correlations
Pairwise Pearson correlations of funding rates across the top 10 cryptocurrencies yield 2194 unique correlations spanning 26 exchanges (Table 8), categorized as CEX-CEX (both centralized), DEX-DEX (both decentralized), or CEX-DEX (mixed).
Table 8.
Average pairwise correlations of funding rates by exchange pair type. Correlations computed across 2194 exchange pairs for top 10 cryptocurrencies by Open Interest rank. Statistical tests confirm CEX-CEX correlations significantly exceed both DEX-DEX and CEX-DEX correlations ().
CEX platforms exhibit higher integration: CEX-CEX correlations average 0.246 (median 0.203) across 576 pairs, while DEX-DEX correlations average 0.153 (median 0.124) across 477 pairs. CEX integration appears 61% higher, calculated as . Cross-platform CEX-DEX correlations average 0.175 (median 0.131) across 1,141 pairs, falling somewhere in between within-type correlations. Statistical tests confirm significance: CEX-CEX vs. DEX-DEX (, ), CEX-CEX vs. CEX-DEX (, ). DEX-DEX vs. CEX-DEX shows no significant difference (, ).
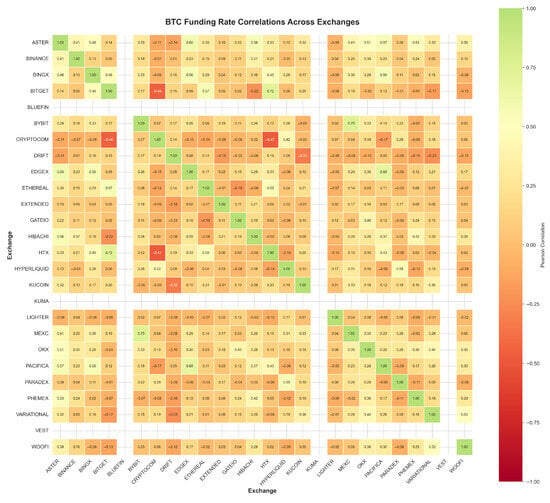
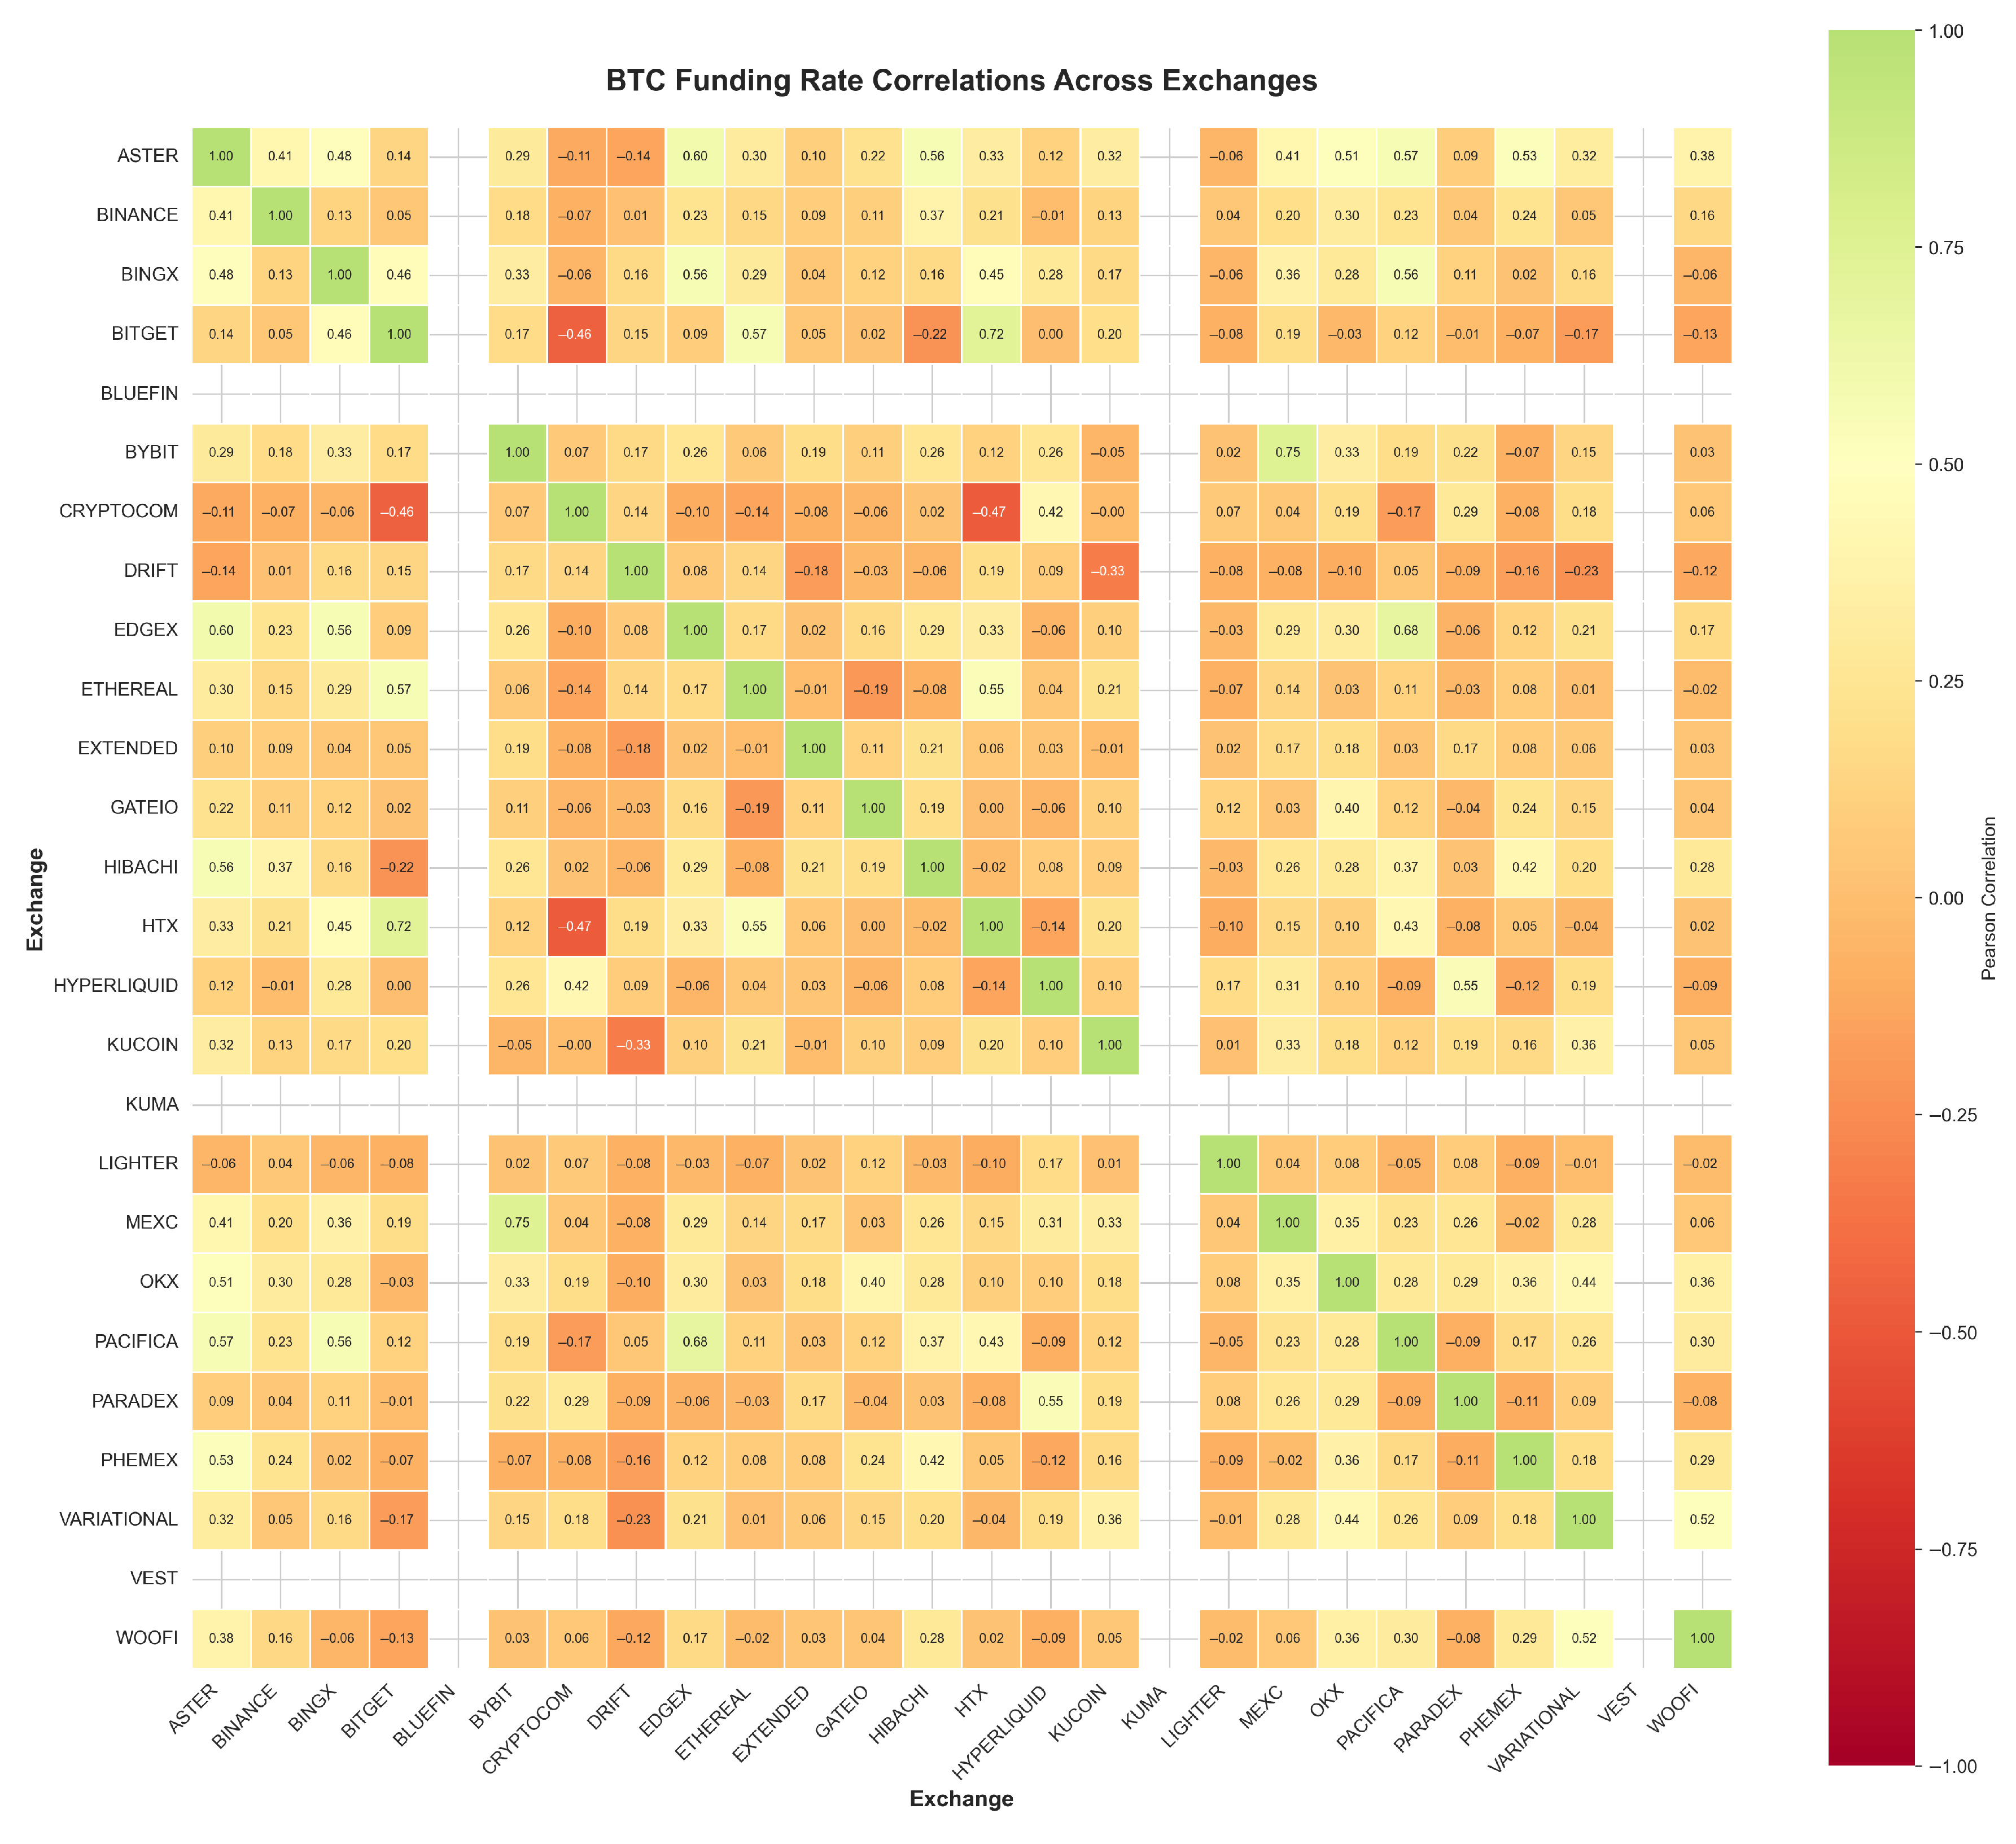
The Bitcoin correlation heatmap on Figure 1 reveals what appears to be clear clustering: CEX platforms (BINANCE, BYBIT, OKX) exhibit correlations exceeding 0.4 with each other, indicating strong co-movement. DEX platforms (HYPERLIQUID, DRIFT, PARADEX) display weaker correlations (0.1–0.3 range) with CEX; several DEX-DEX pairs show near-zero or even negative correlations.
Figure 1.
The Bitcoin correlation heatmap.
The two-tiered market structure that the analysis has shown is directly supported by this visual pattern. The fragmented, low-correlation patterns among DEX platforms and across the CEX-DEX boundary (cooler colours in the middle sections) contrast sharply with the clear clustering of high correlations among CEX platforms (seen as the warm-colored blocks in the upper-left and lower-right quadrants). Thus, the heatmap shows that while decentralised platforms continue to be structurally distinct, centralised exchanges function as an integrated tier, resulting in the ongoing arbitrage opportunities we find.
Structural interpretation: The 61% higher CEX correlation provides evidence of differential market integration. CEX platforms may benefit from shared liquidity, sophisticated market-making, and institutional arbitrage maintaining synchronized funding rates. By contrast, DEX platforms face structural frictions (blockchain settlement delays, cross-chain interoperability, smart contract risks) that appear to impede cross-platform arbitrage. The moderate CEX-DEX correlation (0.175) suggests partial but incomplete integration, creating the persistent CEX-DEX arbitrage opportunities documented earlier. These data suggest what might be defined as a two-tiered market: a highly connected CEX tier with efficient arbitrage, and a more fragmented DEX tier with slower information transmission.
4.7. Delta-Neutral Arbitrage Portfolio Performance
Delta-neutral portfolios for the top 20 arbitrage opportunities are simulated by simultaneously longing perpetuals on the lowest-rate exchange and shorting on the highest-rate exchange ($10,000 per side). We assess net profitability after accounting for transaction costs detailed in Section 3.5.
Spread reversal risk: We define “forced exit” as the point at which spreads turn negative, requiring position closure to prevent accumulating losses (as the previously profitable funding differential now works against the arbitrageur). When we classify convergence patterns, 95% of portfolios (19 of 20) exhibit reversal patterns where exchanges swap funding rate positions. Forced exits occurred for 12 of 20 portfolios when spreads turned negative. The eight profitable portfolios (AIA, ASML, MERL, 0G, PARTI, KAVA, GODS, LAYER) demonstrate that opportunities with sufficient spread magnitude and duration can overcome transaction costs despite market volatility, though success is far from guaranteed.
Profitability: Under our conservative forced exit protocol (spread < 0 bps), eight portfolios generate positive net returns while twelve incur losses (Table 9). The best performer AIA yields $1,433 profit over 2 days. Average net P&L across all 20 portfolios is $22. This suggests that while transaction costs create a high profitability threshold, opportunities with sufficient spread magnitude and duration can overcome these frictions, though profitability is highly sensitive to the exit strategy employed.
Table 9.
Delta-neutral arbitrage portfolio performance ordered by profitability. Position size: $10,000 per side. Gross P&L shows funding accrual before transaction costs; Net P&L deducts transaction costs (entry and exit fees). Results based on forced exit at spread < 0 bps; profitability highly sensitive to exit threshold choice.
Transaction cost burden: Transaction costs are charged at entry and exit only; for illiquid markets (most top opportunities), this totals roughly $220 per round-trip. Funding accrues per-minute (8-h rate divided by 480 min); this requires sustained spreads over extended durations to overcome fixed costs. Consider that a 20 bps spread with this trade size accrues just $0.042 per minute ($10,000 × 20 bps/10000/480), requiring 5263 min (3.7 days) to generate enough funding to cover transaction costs. Opportunities with either (1) high average spreads or (2) long durations appear capable of overcoming the threshold.
Risk-adjusted performance: Average Sharpe ratio is −7.40; even the best performing portfolio (AIA) achieves a Sharpe of just −2.73. Average Sortino is −1.93. Maximum drawdowns average −$117 (−1.17% of position size). The modest drawdowns may reflect the protection offered by dynamic exit management when spreads turn negative, preventing what could otherwise be more severe losses.
We should note that portfolio durations (Table 9) may be substantially shorter than the total time spreads remain above threshold (Table 3) due to our no-reentry policy. Once a portfolio experiences a forced exit (spread < 0), we do not re-enter even if spreads later rise above 20 bps. This conservative approach reflects realistic trading constraints; transaction costs and execution risks make repeated entry/exit cycles unprofitable. For example, PYR maintained spreads > 20 bps for 4 d 20 h cumulatively across multiple episodes, but the portfolio exited after just 2 min when the initial spread reversed, missing subsequent opportunities. This is because Table 3 includes the time after forced exit when you’re no longer in the position. This means the portfolio results might be further improved by examining further the reversal patterns and choosing more strategic threshholds for exiting the trade; these are things that are not in the scope of the current study, but will be outlined for future directions.
5. Discussion
Drawing on our analysis of funding rate observations across 26 cryptocurrency exchanges, we uncover what appears to be a two-tiered market structure. Centralized exchanges appear to dominate price discovery with zero evidence of reverse information flow from decentralized platforms. While roughly 17% of observations exhibit economically significant arbitrage spreads, most top opportunities prove unprofitable under our conservative exit strategy after accounting for transaction costs and spread reversals. Cross-platform market integration varies dramatically by exchange type; CEX-CEX correlations exceed DEX-DEX correlations by 61%. These results may help reconcile the apparent paradox of persistent large spreads with market efficiency. They suggest that visible mispricings reflect equilibrium outcomes consistent with binding frictions (particularly transaction costs and limited duration before spread reversals) rather than purely exploitable inefficiencies.
5.1. The Two-Tiered Market Structure
Our Granger causality analysis reveals what seems to be an unambiguous directional pattern. Centralized exchanges lead funding rate innovations while decentralized platforms operate as price takers. Among 14 CEX-DEX pairs tested, all significant relationships run from CEX to DEX; none run the reverse direction. The 61% higher correlation among CEX-CEX pairs (0.246) relative to DEX-DEX pairs (0.153) quantifies the integration gap between exchange types. This may arise from DEX-specific frictions including blockchain settlement delays, gas fee volatility, and fragmented liquidity across automated market maker protocols. This asymmetry likely reflects three structural mechanisms that favor CEX price leadership.
First, liquidity depth: Trading volume on perpetual futures concentrates overwhelmingly on centralized platforms. During our observation period, the CEX exchanges account for approximately 75–80% of total perpetual futures trading volume across major cryptocurrencies [27]. While the DEX-to-CEX perpetuals ratio has grown significantly throughout 2025 (rising from 3.7% to 11.7% over the year), CEX platforms still maintain dominant market share. This liquidity concentration means that large traders and institutional arbitrageurs preferentially operate on CEX platforms where they can execute sizable positions without material price impact. In contrast, DEX platforms operate with substantially lower aggregate liquidity, limiting their ability to influence market-wide price discovery.
Second, execution speed: CEX platforms process transactions via centralized matching engines with microsecond-level latency, enabling near-instantaneous price updates when market conditions change. DEX platforms require blockchain transaction confirmation, introducing settlement delays even on high-throughput chains. While most DEX platforms in our sample operate on fast Layer-1 blockchains (Solana) or Layer-2/Layer-3 Ethereum solutions with sub-second to few-second settlement times, this still represents orders of magnitude slower execution compared to CEX microsecond latency. This speed differential means CEX rates adjust to new information before DEX platforms complete transaction settlement, establishing CEX as the information source.
Third, cross-platform arbitrage infrastructure: Sophisticated arbitrageurs monitoring funding rate differentials typically maintain their primary operations on CEX platforms due to superior liquidity, lower operational friction, and faster execution. When these arbitrageurs observe CEX funding rate changes, they execute trades that propagate information from CEX to DEX. However, the reverse flow is limited because few arbitrageurs monitor DEX-originated information signals given DEX’s smaller market share and higher operational friction. This creates asymmetric information transmission favoring CEX leadership.
Together, these mechanisms create a tiered market structure where CEX platforms function as price leaders while DEX platforms operate as price followers in the funding rate discovery process. This pattern holds robustly across 1-min, 5-min, and 15-min sampling frequencies (as documented in our robustness checks), confirming that CEX price leadership reflects structural market differences.
This fragmentation somewhat mirrors the cross-exchange Bitcoin price deviations documented by [15], who attribute persistent spreads to segmented capital flows, regulatory frictions, and sophisticated arbitrageur behavior.
This integration gap translates directly into arbitrage opportunity sets. Most economically significant spreads (84%) involve CEX-DEX pairings, emerging precisely because cross-type integration remains incomplete. Rather than being a secondary finding, this pattern appears to define the fundamental structure of funding rate arbitrage markets; the primary opportunity set exists at the boundary between centralized and decentralized platforms, not within either ecosystem. For practitioners, this suggests that successful arbitrage strategies must navigate the frictions inherent in cross-platform operations rather than focusing solely on intra-CEX or intra-DEX opportunities.
5.2. Arbitrage Opportunities: Reconciling Perception with Reality
The finding that most top arbitrage opportunities generate negative returns under our conservative exit protocol challenges the “free money” narrative pervading popular discussions of cryptocurrency funding rate arbitrage. While our analysis identifies 596 symbols with average spreads exceeding 20 basis points (superficially suggesting widespread profit potential), portfolio simulations reveal that transaction costs and spread reversals systematically prevent profitability for most opportunities when positions are exited immediately upon spread reversal.
This apparent contradiction between opportunity prevalence (17% of observations) and limited realized profitability may arise because visible spreads represent equilibrium mispricings consistent with binding frictions. These findings align with [3]’s theoretical prediction that trading costs create pricing bounds within which mispricings can persist in equilibrium. Markets appear more efficient than gross spreads imply; the persistence of 20–50 bps differentials does not necessarily indicate market failure but rather may reflect that these spreads generate insufficient funding accrual to overcome transaction cost thresholds before spreads reverse. Only opportunities with exceptional characteristics (combining high average spreads with sufficient duration) generate cumulative returns exceeding transaction cost thresholds.
We note that the observed IGARCH behavior may partly reflect our sampling structure, where 8-h funding rates are observed every minute, rather than pure economic persistence. Distinguishing true unit-root processes from near-integrated dynamics typically requires months or years of data. Given our 8-day sample window, we interpret these results as evidence of strong short-term persistence rather than permanent shocks.
For practitioners during our observation period, our results might provide a decision framework emphasizing that both high spreads and sufficient duration matter. Consider the comparison between AIA and INTC. AIA’s 732.5 bps average spread maintained for 2 days before forced exit generates $0.57 per minute in funding accrual, accumulating to $1653 in gross payments over the holding period; after transaction costs, net profit reaches $1433 (representing 12,953% APY). In stark contrast, INTC’s 6.57 bps average spread over 6 days 6 h generates only $180 in gross funding, insufficient to overcome transaction cost thresholds, resulting in a $40 loss. This demonstrates that neither high spreads alone nor long duration alone guarantee profitability; both factors must align. Successful arbitrage appears to require identifying opportunities with sufficiently high spreads combined with adequate duration before inevitable spread reversals force exit.
Dynamic risk management is imperative. The prevalence of spread reversals (affecting 95% of opportunities) highlights a critical operational requirement; passive delta-neutral positions become loss-makers when spreads turn negative. Profitable arbitrage seems to demand immediate exit protocols triggered when spreads reverse to negative territory. Rather than passive “set-and-forget” positions, practitioners must implement active monitoring featuring: (1) real-time spread tracking to detect when spreads approach zero, (2) immediate position unwinding when spreads turn negative to prevent accumulating losses, and (3) realistic profit expectations. The contrast between profitable (AIA, KAVA, MERL, ASML) and unprofitable portfolios reveals that success requires not just identifying high spreads initially, but actively exiting when spreads turn negative via disciplined exit execution.
From an academic perspective, these findings may help reconcile the prior literature documenting large cryptocurrency arbitrage spreads [15] with market efficiency theory. The persistence of visible mispricings confirms that arbitrage forces operate subject to real-world frictions. Our contribution lies in quantifying these frictions more precisely; transaction costs combined with limited duration before spread reversals create profitability thresholds that filter most opportunities, potentially explaining why spreads persist despite attracting arbitrage attention.
6. Conclusions
This study offers the first systematic cross-platform examination of cryptocurrency funding rates, analyzing observations across centralized and decentralized exchanges over eight days. The findings suggest a two-tiered market structure where centralized exchanges appear to dominate price discovery while decentralized platforms operate largely as price takers (CEX-CEX correlations exceed DEX-DEX correlations by 61%). This structural divide creates what we observe as the primary arbitrage setting; most economically significant funding rate spreads emerge at the CEX-DEX boundary. These spreads may reflect incomplete cross-platform integration rather than purely exploitable inefficiencies.
The paradox of large and widespread spreads coexisting with limited profitability might be resolved through equilibrium mispricing under binding frictions. Though roughly 17% of observations exhibit high spreads (exceeding 20 basis points), profitability under conservative exit protocols proves elusive for most opportunities after transaction costs and spread reversals. Transaction costs combined with our zero-tolerance exit threshold create profitability barriers that filter most opportunities, though alternative exit strategies may yield different results.
For practitioners during our observation period, these findings challenge the “free money” narrative while potentially offering direction. Successful funding rate arbitrage appears to require several elements: high spreads combined with sufficient duration to overcome transaction cost thresholds; focus on CEX-DEX opportunities where structural integration gaps persist; immediate exit protocols when spreads turn negative to prevent losses. Realistic profit expectations matter. The contrast between profitable and unprofitable strategies demonstrates something important; passive delta-neutral positions tend to fail. Success appears to require active exit management when spreads turn negative.
From an academic perspective, our findings provide evidence supporting the limits-to-arbitrage framework in cryptocurrency derivatives markets. Observable mispricings do not necessarily signify market inefficiency; they might represent equilibrium pricing among heterogeneous frictions. The effective integration within CEX environments, but fragmented cross-platform arbitrage between CEX and DEX, improves our understanding of how market design influences price formation in hybrid centralized-decentralized financial systems. The absence of evidence for DEX-to-CEX information flow suggests that centralized platforms retain control over the microstructure of the derivative market, even as decentralized finance expands. This could influence systemic risk assessment and regulatory oversight approaches.
Future research should extend our eight-day observation window across bull, bear, and high-volatility setups. Identifying whether the two-tiered structure persists under varying market conditions would clarify whether it represents a fundamental feature or a context-specific phenomenon. Developing predictive models to forecast spread reversals (using machine learning and order flow imbalances) can potentially transform passive arbitrage into dynamic, risk-managed strategies. As the boundary between centralized and decentralized finance continues to evolve, understanding the frictions that sustain persistent mispricings remains essential. In addition, the analysis in this study employs a conservative forced exit threshold (spread < 0 bps), which limits losses but may exit prematurely when spreads temporarily turn negative before recovering. Sensitivity analysis of alternative exit thresholds (e.g., −5 bps or −10 bps with tighter stop-loss rules) could identify more profitable exit strategies that balance downside protection against premature position closure.
Funding
This study is financed by the European Union-NextGenerationEU, through the National Recovery and Resilience Plan of the Republic of Bulgaria, project number BG-RRP-2.013-0001. The work was partially supported by the Centre of Excellence in Informatics and ICT under the Grant No BG16RFPR002-1.014-0018, financed by the Research, Innovation and Digitalization for Smart Transformation Programme 2021-2027 and co-financed by the European Union and by the Bulgarian National Science Fund under Project KP-06-N52/5 “Efficient methods for modeling, optimization and decision making”.
Data Availability Statement
The data presented in this study are openly available in [Lloris tools] at [https://loris.tools/funding/historical, accessed on 15 November 2025].
Conflicts of Interest
The authors declare no conflict of interest. The funders had no role in the design of the study; in the collection, analyses, or interpretation of data; in the writing of the manuscript, or in the decision to publish the results.
References
- Kim, J.; Park, H. Designing Funding Rates for Perpetual Futures in Cryptocurrency Markets. arXiv 2025, arXiv:2506.08573. [Google Scholar] [CrossRef] [Scilit]
- Ackerer, D.; Hugonnier, J.; Jermann, U. Perpetual Futures Pricing; NBER Working Paper No. 32936; National Bureau of Economic Research: Cambridge, MA, USA, 2024. [Google Scholar]
- He, S.; Manela, A.; Ross, S.; von Wachter, A. Fundamentals of Perpetual Futures. arXiv 2024, arXiv:2212.06888. [Google Scholar] [CrossRef] [Scilit]
- Shiller, R.J. Macro Markets: Creating Institutions for Managing Society’s Largest Economic Risks; Oxford University Press: Oxford, UK, 1993. [Google Scholar]
- Liu, Y.; Tsyvinski, A.; Wu, X. Common Risk Factors in Cryptocurrency. J. Financ. 2022, 77, 1133–1177. [Google Scholar] [CrossRef] [Scilit]
- He, X.D.; Yang, C.; Zhou, Y. Arbitrage on Decentralized Exchanges. arXiv 2024, arXiv:2507.08302. [Google Scholar] [CrossRef] [Scilit]
- Neuder, M.; Zheng, D.; Yadav, R.; Kar, S.; Salman, T. Measuring CEX-DEX Extracted Value and Searcher Profitability: The Darkest of the MEV Dark Forest. arXiv 2024, arXiv:2507.13023. [Google Scholar]
- Katsiampa, P. Volatility Estimation for Bitcoin: A Comparison of GARCH Models. Econ. Lett. 2017, 158, 3–6. [Google Scholar] [CrossRef] [Scilit]
- Baur, D.G.; Dimpfl, T. Asymmetric Volatility in Cryptocurrencies. Econ. Lett. 2018, 173, 148–151. [Google Scholar] [CrossRef] [Scilit]
- Conrad, C.; Custovic, A.; Ghysels, E. Long- and Short-Term Cryptocurrency Volatility Components: A GARCH-MIDAS Analysis. J. Risk Financ. Manag. 2018, 11, 23. [Google Scholar] [CrossRef] [Scilit]
- Brauneis, A.; Mestel, R. Cryptocurrency-Portfolios in a Mean-Variance Framework. Financ. Res. Lett. 2019, 28, 259–264. [Google Scholar] [CrossRef] [Scilit]
- Platanakis, E.; Urquhart, A. Portfolio Management with Cryptocurrencies: The Role of Estimation Risk. Econ. Lett. 2020, 177, 76–80. [Google Scholar] [CrossRef] [Scilit]
- Grobys, K.; Ahmed, N.; Sapkota, J. On the Stability of Stablecoins. J. Empir. Financ. 2021, 64, 207–223. [Google Scholar] [CrossRef] [Scilit]
- Nadarajah, S.; Chu, J. On the Inefficiency of Bitcoin. Econ. Lett. 2017, 150, 6–9. [Google Scholar] [CrossRef] [Scilit]
- Makarov, I.; Schoar, A. Trading and Arbitrage in Cryptocurrency Markets. J. Financ. Econ. 2020, 135, 293–319. [Google Scholar] [CrossRef] [Scilit]
- Alexander, C.; Choi, J.; Park, H.; Sohn, S. BitMEX Bitcoin Derivatives: Price Discovery, Informational Efficiency, and Hedging Effectiveness. J. Futur. Mark. 2020, 40, 23–43. [Google Scholar] [CrossRef] [Scilit]
- Dickey, D.A.; Fuller, W.A. Distribution of the Estimators for Autoregressive Time Series with a Unit Root. J. Am. Stat. Assoc. 1979, 74, 427–431. [Google Scholar]
- Kwiatkowski, D.; Phillips, P.C.B.; Schmidt, P.; Shin, Y. Testing the Null Hypothesis of Stationarity against the Alternative of a Unit Root. J. Econom. 1992, 54, 159–178. [Google Scholar] [CrossRef] [Scilit]
- Ljung, G.M.; Box, G.E.P. On a Measure of Lack of Fit in Time Series Models. Biometrika 1978, 65, 297–303. [Google Scholar] [CrossRef]
- Engle, R.F. Autoregressive Conditional Heteroscedasticity with Estimates of the Variance of United Kingdom Inflation. Econometrica 1982, 50, 987–1007. [Google Scholar] [CrossRef] [Scilit]
- Bollerslev, T. Generalized Autoregressive Conditional Heteroskedasticity. J. Econom. 1986, 31, 307–327. [Google Scholar] [CrossRef] [Scilit]
- Granger, C.W.J. Investigating Causal Relations by Econometric Models and Cross-Spectral Methods. Econometrica 1969, 37, 424–438. [Google Scholar] [CrossRef] [Scilit]
- Akaike, H. A New Look at the Statistical Model Identification. IEEE Trans. Autom. Control. 1974, 19, 716–723. [Google Scholar] [CrossRef] [Scilit]
- Cameron, A.C.; Gelbach, J.B.; Miller, D.L. Robust Inference with Multiway Clustering. J. Bus. Econ. Stat. 2011, 29, 238–249. [Google Scholar] [CrossRef] [Scilit]
- Jorion, P. Value at Risk: The New Benchmark for Managing Financial Risk, 3rd ed.; McGraw-Hill: New York, NY, USA, 2007. [Google Scholar]
- Sharpe, W.F. The Sharpe Ratio. J. Portf. Manag. 1994, 21, 49–58. [Google Scholar] [CrossRef] [Scilit]
- CoinGecko. State of Crypto Perpetuals Market, CoinGecko Research Report. December 2025. Available online: https://www.coingecko.com/research/publications/dex-to-cex-ratio (accessed on 11 January 2026).

Disclaimer/Publisher’s Note: The statements, opinions and data contained in all publications are solely those of the individual author(s) and contributor(s) and not of MDPI and/or the editor(s). MDPI and/or the editor(s) disclaim responsibility for any injury to people or property resulting from any ideas, methods, instructions or products referred to in the content. |
© 2026 by the author. Licensee MDPI, Basel, Switzerland. This article is an open access article distributed under the terms and conditions of the Creative Commons Attribution (CC BY) license.