


Abstract
Early insolvency prediction in Small and Medium-sized Enterprises (SMEs) is a critical challenge for financial stability, credit risk management, and public policy-making. Traditional approaches often rely on isolated predictive models that, despite achieving competitive performance, typically lack semantic integration, contextual adaptability, and operational transparency. This paper proposes a cooperative strategy for an Automated Decision-Making (ADM) system that integrates multiple survival analysis methods to estimate insolvency risk over a defined temporal horizon. The system is structured into three functional layers: (i) an input manager responsible for standardizing financial and non-financial indicators; (ii) a multi-model decision core based on heterogeneous survival architectures, whose outputs are harmonized through a semantic integration layer; and (iii) a fuzzy-based Contextual Modulator that calibrates technical risk estimates by modeling regulatory, sectoral, and socioeconomic criteria as fuzzy linguistic variables. This fuzzy logic approach allows the system to capture the inherent uncertainty and structural vulnerability of SMEs, incorporating contextual information beyond strict model-based risk estimates. The architecture is implemented through an interactive interface and incorporates Explainable Artificial Intelligence (XAI) techniques to ensure traceability, enhance interpretability, and facilitate the understanding of model outputs by decision-makers. The results show that the proposed cooperative strategy improves robustness through model cooperation compared with monolithic models and provides dynamic, fuzzy-calibrated risk curves that support contextualized intervention prioritization. This work contributes to the transition from isolated prediction models toward collaborative decision ecosystems aligned with the operational requirements of financial institutions and public policy organizations.
Keywords:
cooperative automated decision-making; insolvency prediction; survival analysis; fuzzy logic; fuzzy contextual modulation; explainable artificial intelligence (XAI) MSC:
90B50; 68T37; 62N02; 68T05
1. Introduction
Small and medium-sized enterprises (SMEs) represent the backbone of the productive fabric in most economies. In the European Union, for example, they account for more than 99% of all companies and generate approximately two thirds of business employment [1,2,3]. However, their financial structure, lower capacity to absorb macroeconomic shocks, and limited diversification of revenue streams make them particularly vulnerable. International statistics and regulatory reports indicate that more than 50% of SMEs face insolvency difficulties during their first five years of operation [4,5]. In this context, the early detection of insolvency signals is not merely an exercise in financial modeling, but a strategic necessity for the stability of the credit system, the efficient allocation of public rescue funds, and the preservation of employment.
Traditionally, insolvency prediction has been addressed through isolated models that operate independently. These approaches include classical statistical methods, supervised machine learning techniques, and, more recently, survival analysis models, which allow the probability that a company remains solvent over a given time horizon to be estimated [6,7]. Although these models have demonstrated solid predictive performance in controlled environments, their implementation in real-world contexts reveals significant structural limitations. First, they often behave as isolated entities or silos, preventing the semantic integration of heterogeneous outputs and the compensation of individual biases. Second, they lack explicit mechanisms for incorporating external contextual factors, such as regulatory frameworks, economic cycles, or socioeconomic impact criteria, which are decisive for the operational feasibility of an intervention. Finally, many of these systems operate as black boxes, which hinders the traceability of recommendations, increases the cognitive burden on human decision-makers, and can hamper institutional acceptance and auditing processes, especially in environments where accountability and regulatory compliance are critical requirements [8,9].
Recent literature on decision support systems (DSS) and automated decision-making (ADM) has begun to shift from the optimization of individual models towards the engineering of cooperative ecosystems. Conceptual frameworks such as CADEMAS [10] have shown that cooperation among heterogeneous agents, mediated by semantic integration layers and contextual modulation, can generate more robust and explainable decisions, better adapted to operational requirements. Nevertheless, the application of these principles to the domain of SME insolvency, particularly through the coordination of multiple survival analysis architectures and the incorporation of explainable artificial intelligence (XAI) techniques, remains an open challenge.
With this in mind, this article proposes a cooperative strategy for an automated decision-making system aimed at predicting the insolvency of SMEs. The proposed strategy is structured into three interconnected functional layers:
The mathematical contribution of the proposed approach does not lie in introducing a new survival estimator: the individual predictive models integrated into the cooperative core are established methods from the survival analysis literature. Rather, the methodological novelty resides in the formalization of a unified decision transformation that connects heterogeneous survival predictions with contextual fuzzy information within a common risk space. Specifically, the proposed strategy comprises: (i) the integration of heterogeneous survival functions into a common technical risk signal ; (ii) the construction of a contextual vulnerability measure from fuzzy membership degrees associated with complementary non-predictive dimensions; (iii) scale alignment between technical and contextual risk to prevent either information source from mechanically dominating the final decision; and (iv) a convex calibration mechanism governed by a parameter , producing the contextualized risk index . Thus, the contribution is mathematical and decision-theoretic rather than algorithm-specific: the framework defines how structurally heterogeneous predictive outputs and contextual information are transformed, aligned, aggregated, and calibrated into a single auditable decision quantity.
- Input Manager: Responsible for the preprocessing, validation, and standardization of financial and non-financial indicators, ensuring that the information entered is coherent and suitable for consumption by multiple models.
- Cooperative Decision Core: Composed of a set of heterogeneous survival analysis models (Cox Proportional Hazards, Random Survival Forests, and Deep Survival Networks). Their outputs are harmonized through a semantic integration layer that normalizes risk curves and combines them using weighted ensemble strategies, mitigating dependence on a single algorithmic paradigm.
- Contextual Modulator: Adjusts technical risk estimates according to exogenous criteria, including regulatory, sectoral, social impact, and public intervention capacity factors, thereby incorporating complementary contextual criteria alongside statistical evidence and prioritizing companies for which intervention is both technically and operationally feasible.
In addition, the system incorporates Explainable Artificial Intelligence (XAI) techniques into the decision-making flow, enabling end users to understand the factors driving each risk estimate and facilitating the interpretation of complex models. The architecture is implemented in an interactive prototype that visualizes dynamic survival curves, contextual priority indices, and local explanations of predictions.
The main contributions of this work are:
- A cooperative decision-making framework that goes beyond the paradigm of isolated models, facilitating the integration of semantically distinct outputs and the mitigation of individual algorithmic biases.
- A strategy for harmonizing survival models that combines statistical, tree-based, and deep learning perspectives to generate temporally consistent and robust risk estimates.
- A formal mathematical mechanism for contextual risk calibration, in which heterogeneous predictive signals are aggregated into a technical risk measure, contextual vulnerability is represented through fuzzy membership degrees, both components are aligned to a comparable scale, and their relative contribution to the final risk is explicitly controlled through a calibration parameter. This separates predictive estimation from contextual decision adjustment while maintaining complete mathematical traceability.
- The formalization of a Contextual Modulator that incorporates regulatory constraints and socioeconomic criteria into the intervention prioritization process, aligning technical outputs with operational feasibility.
- The integration of XAI into the decision-making cycle, promoting transparency and traceability of the decision-making process for human decision-makers without sacrificing predictive performance.
- Validation through a functional prototype that demonstrates the feasibility of the cooperative strategy and its potential for deployment in financial institutions and public policy organizations.
The remainder of this article is organized as follows: Section 2 presents the state of the art and the theoretical foundations of cooperative decision-making systems and survival analysis applied to insolvency. Section 3 details the methodology and the proposed architecture. Section 4 describes the experimental results, the analysis of the cooperative strategy, and the behavior of the Contextual Modulator. Section 5 discusses the practical implications, limitations, and future research directions. Finally, Section 6 summarizes the conclusions of the study.
2. State of the Art
The transition from isolated predictive models to cooperative decision-making ecosystems requires a critical synthesis of existing methodologies, their operational limitations, and emerging architectural paradigms that enable context-sensitive integration. This section reviews the methodological evolution of insolvency prediction in SMEs, the maturation of cooperative algorithmic strategies, and the role of Explainable Artificial Intelligence (XAI) in bridging technical outputs with managerial actionability.
2.1. Predictive Modeling and Survival Analysis in SME Insolvency
Traditionally, financial distress prediction has been addressed through multivariate statistical techniques such as Multiple Discriminant Analysis (MDA) and logistic regression, which assume linear relationships and require complete historical datasets [11,12,13]. Although these methods achieve acceptable accuracy in controlled environments, they face difficulties in capturing the nonlinear dynamics, structural breaks, and high dimensionality characteristic of SME financial data. The emergence of machine learning (ML) and deep learning has substantially improved predictive performance through algorithms such as Random Forest, XGBoost, and LSTM networks, which are capable of modeling complex interactions among variables [14,15]. Nevertheless, these approaches usually frame insolvency as a static binary classification task, thereby overlooking the temporal dimension of financial deterioration.
In response, survival analysis has become established as a well-suited alternative for early-warning systems. By modeling the time-to-event distribution and handling censored observations, techniques such as the Cox Proportional Hazards model, Random Survival Forests, and deep survival networks—e.g., DeepSurv and Cox-Time—generate dynamic survival curves and hazard functions that explicitly quantify how the probability of insolvency evolves over time [7,16]. Despite their predictive richness, these models are usually deployed in isolation, lacking mechanisms to reconcile their outputs with other modeling paradigms or to adjust their recommendations in response to exogenous institutional constraints.
2.2. Algorithmic Cooperation: From Ensembles to Multi-Agent Systems and Cooperative Strategies
To mitigate the variance and bias inherent in single models, the literature has extensively explored cooperative strategies through ensemble learning. Techniques such as bagging, boosting, stacking, and majority voting consistently outperform individual classifiers by aggregating heterogeneous decision signals [17,18,19]. In the context of financial distress, multiclass stacking schemes and learning frameworks for imbalanced data—e.g., EasyEnsemble—have demonstrated robustness across diverse economic sectors [20,21]. In parallel, research on Multi-Agent Systems (MAS) has investigated distributed architectures for monitoring bankruptcy contagion and optimizing financial decisions in networked environments, reducing communication overhead and improving systemic resilience [22,23].
However, both ensembles and MAS present structural limitations. The former generally assume homogeneous input/output spaces and optimize statistical accuracy exclusively, neglecting the semantic misalignment among models with different representational ontologies. Moreover, they rarely incorporate explicit contextual modulation, operating instead as closed optimization loops that cannot adapt in real time to regulatory changes, sectoral policies, or socioeconomic intervention criteria. To overcome this determinism, a paradigm shift toward structured cooperative ecosystems has emerged, such as the Cooperative Automated Decision-Making System (CADEMAS) framework [10], which comprises several interoperable layers: an Input Manager that standardizes heterogeneous data, a core of independent Automated Decision-Making (ADM) units, and a Decision Integration Layer linked to a Contextual Modulator.
Unlike classical voting or stacking mechanisms, CADEMAS decouples signal generation from decision synthesis, enabling interactive cooperation among methodologically heterogeneous models, such as econometric panels, sequential networks, and survival architectures. Thus, the Contextual Modulator filters and calibrates technical recommendations according to ethical, operational, and public-interest criteria using tools such as fuzzy logic, rule-based systems, and language models, among others, preventing algorithmic determinism in highly sensitive domains such as the prioritization of financial rescue interventions for SMEs [10,24].
2.3. Explainable Artificial Intelligence (XAI) and Human-Centered Decision Support
The operational deployment of cooperative predictive systems is fundamentally constrained by the “black-box” nature of advanced ML and survival architectures. Explainable Artificial Intelligence (XAI) has emerged as a critical enabler of trust, accountability, and regulatory compliance in high-impact financial decision-making. Post hoc interpretation methods, such as LIME (Local Interpretable Model-agnostic Explanations) and SHAP (SHapley Additive exPlanations), alongside counterfactual reasoning frameworks, translate the outputs of complex models into user-comprehensible feature attributions [9,25,26].
Recent integrations of XAI into web-based Decision Support Systems (DSS) that utilize interactive environments such as Streamlit demonstrate that transparency does not compromise predictive performance; rather, it reduces managerial cognitive load, facilitates auditing, and transforms probabilistic outputs into actionable intervention strategies [25,27]. Similarly, the literature on Group Decision Support Systems (GDSS) emphasizes that cooperative decision-making tools must balance computational sophistication with user-centered design, structured facilitation, and iterative training to ensure effective organizational adoption [27,28].
2.4. Identified Gaps and Positioning of the Present Work
Despite the aforementioned advances, three critical gaps persist in the literature: (1) survival analysis models remain largely isolated and are rarely integrated into cooperative decision-making architectures; (2) existing ensembles and multi-agent systems lack explicit layers of semantic harmonization and contextual modulation tailored to institutional or regulatory constraints; and (3) the practical deployment of XAI-enhanced cooperative DSS for SME insolvency prediction remains scarce, particularly regarding interactive prototypes that align technical risk estimation with managerial usability.
The present work addresses these gaps by proposing a cooperative strategy specifically designed for SME insolvency prediction. This system integrates heterogeneous survival models into a unified decision core, implements multiple transparent aggregation strategies at the integration layer, and incorporates a Contextual Modulator alongside XAI techniques to ensure traceability, adaptability, and operational relevance.
3. Materials and Methods
This section describes the components, data flow, cooperative architecture, and evaluation protocols employed in the development of the Decision Support System (DSS) aimed at predicting insolvency in SMEs. The methodology is grounded in the theoretical framework of Cooperative Automated Decision-Making Systems (CADEMAS) [10], generalizing the notion of the classical ensemble toward a structured, contextually aligned, and technically explainable form of cooperation.
3.1. Data Source and Preprocessing
The study utilizes a comprehensive longitudinal dataset obtained from the Spanish Commercial Registry (https://www.registradores.org/ accessed on 24 May 2023), spanning a 22-year period (1999–2020) and comprising annual financial and non-financial records. The sample consists of 117,052 small and medium-sized enterprises (SMEs), evenly balanced between 58,524 firms that had been declared in concurso legal de acreedores—the Spanish legal proceeding for insolvency—during the analyzed period and 58,528 that had not. Each firm-year record is characterized by 43 original attributes, comprising 15 non-financial descriptors and 28 financial ratios. After removing variables that exceeded the predefined missing-data threshold, 41 variables were retained for preprocessing. Of these, 33 were treated as numerical variables and 8 as categorical variables; the latter were subsequently expanded into 27 binary indicators through one-hot encoding. Because the study adopts a longitudinal survival framework, each firm may contribute multiple annual risk intervals before censoring or the occurrence of the insolvency event. Consequently, the number of longitudinal observations used for model estimation is larger than the number of unique firms. After preprocessing and conversion to the start–stop survival format, the analytical dataset comprised 1,548,060 firm-year/interval observations corresponding to the 117,052 unique SMEs. The firm-level 80/20 split generated 93,641 firms in the training set and 23,411 firms in the test set, corresponding to 1,240,136 and 307,924 longitudinal observations, respectively. These counts refer to different analytical units and should therefore not be interpreted as alternative sample sizes of unique firms. Furthermore, each individual model training script applies an additional inner 80/20 validation split at the CIF level within the training set: 80% of the 93,641 training CIFs (approximately 74,913 firms) are used for model fitting, yielding approximately 992,109 longitudinal observations, while the remaining 20% (approximately 18,728 firms, 248,027 observations) serve as the internal validation set during hyperparameter tuning. The CoxPH model was therefore fitted on this inner training subset of approximately 992,000 observations, and the Schoenfeld residuals test was applied to the same estimation subsample.
The firm-level sample was constructed to contain approximately equal numbers of SMEs that experienced legal insolvency at some point during the observation period and SMEs that did not. This sampling balance should not be interpreted as the event probability at a specific survival horizon. In the longitudinal survival representation, firms contribute multiple intervals and may be censored before a given horizon; therefore, horizon-specific cumulative insolvency probabilities are estimated from the time-to-event process rather than from the simple proportion of insolvent firms in the original case-control sample.
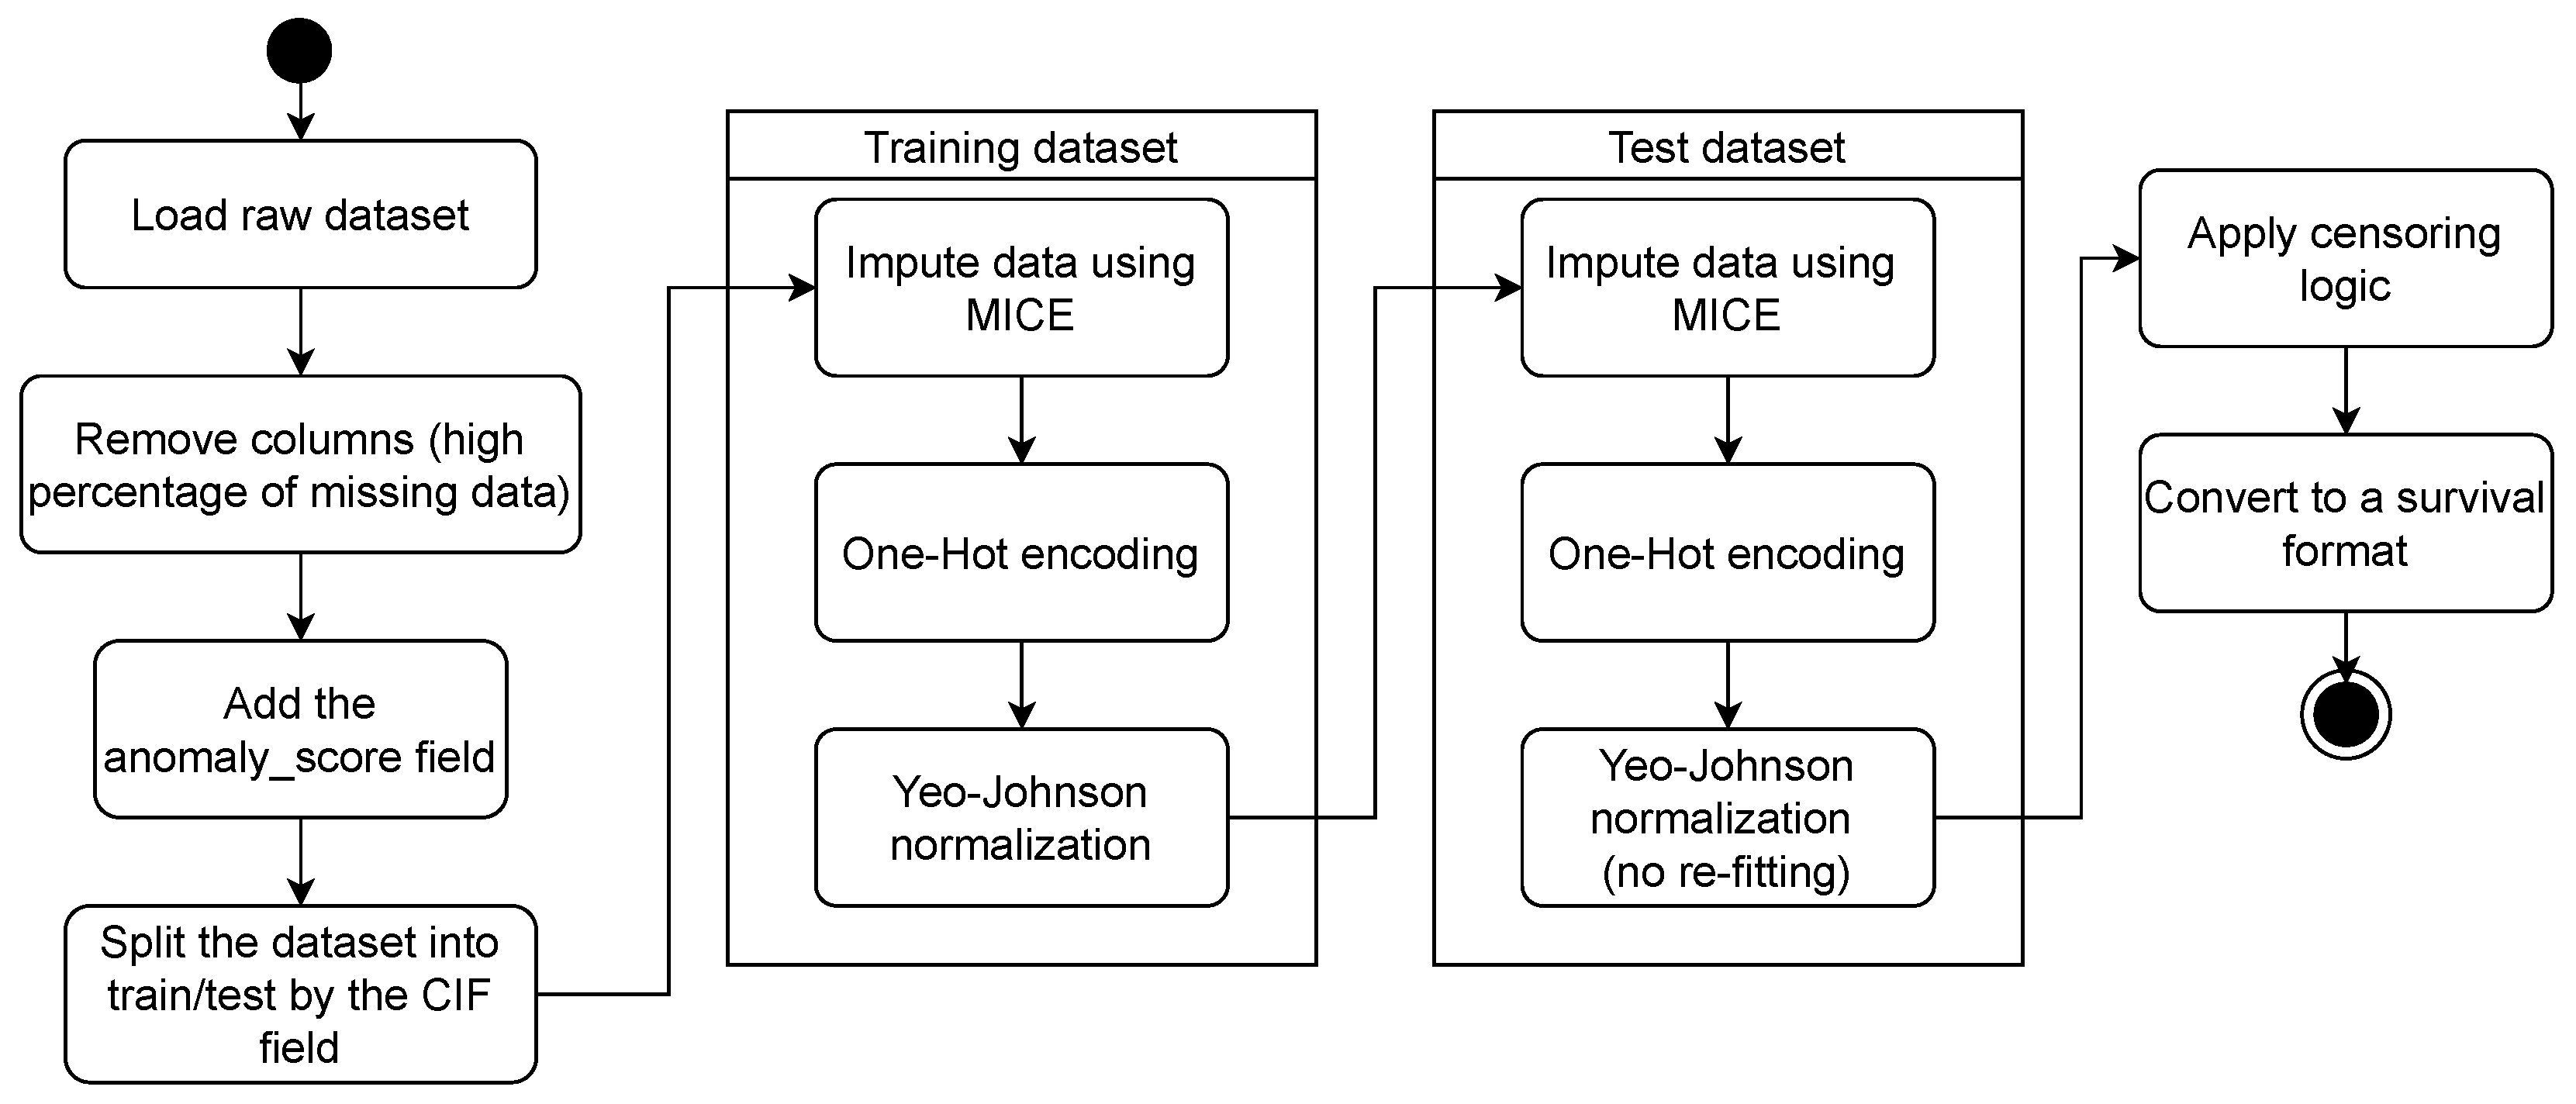
The preprocessing procedure for this dataset included the following steps (Figure 1):
- Column removal: columns with a high proportion of missing values were removed, specifically those with more than 87% missing values.
- Anomaly score (optional): an anomaly score was incorporated from an external file and matched according to row order.
- Train/test split: an 80/20 partition was performed, stratified by CIF, to prevent the same firm from appearing in both sets.
- MICE imputation: missing values in the 33 numerical variables were imputed using IterativeImputer(BayesianRidge, max_iter=3), fitted exclusively on the training set.
- One-Hot Encoding: the 8 categorical variables (N3, N4, N5, N8, N9, N10, N11, N15) were encoded into 27 binary columns; unknown categories in new data produce a zero vector.
- Yeo–Johnson normalization: the 33 numerical variables were transformed using PowerTransformer(yeo-johnson, standardize=True) to obtain a mean ≈0 and a standard deviation ≈1, fitted only on the training set.
- Censoring: FCA (stands for “Fecha de Concurso de Acreedores,” which means the date of insolvency filing) denotes the year in which the firm was officially declared insolvent. If the difference between FCA and the last observed year exceeded 3 years, the firm was considered censored (); otherwise, it was marked as an event () in its last record.
- Survival format: observations after the first event were removed, and the intervals and were computed for each firm.
Figure 1.
Steps followed in data preprocessing. The black circle represents the start of the process, and the circle with a white stripe represents the end.
3.2. Proposed Cooperative Architecture
The proposed architecture is formalized through the multidimensional tuple specified by the CADEMAS conceptual framework [10]:
where:
- IM (Input Manager): Manages data ingestion, validation, and routing. It separates the training/calibration flow (offline) from the inference flow (online), ensuring that each decision unit receives compatible representations.
- (Set of ADMs): A layer composed of heterogeneous survival analysis models. Each operates independently during inference and generates partial signals, namely, survival functions and hazard rates .
- OM (Output Manager/Integration Layer): Performs the semantic harmonization of heterogeneous outputs and aggregates them into a unified decision object D. It does not assume structural homogeneity among the models.
- (Contextual Modulator): Adjusts the technical decision D through rules, institutional constraints, or socioeconomic interest criteria, producing a contextualized final decision .
This architecture can operate in an indirect mode, in which each model contributes its signal without internal communication, or in a direct mode, involving the exchange of intermediate representations. In this implementation, the indirect mode is prioritized to ensure reproducibility and traceability.
3.3. Selected Survival Analysis Models
Six survival approaches were integrated, covering different levels of complexity, assumptions, and temporal modeling capabilities:
- CoxPH: A classical semi-parametric model that estimates the instantaneous risk of insolvency under the proportional hazards assumption and provides interpretable coefficients regarding the effect of covariates [29].
- DeepSurv: A deep neural network-based extension of the Cox model that captures nonlinear relationships between financial features and insolvency risk without relying on linearity assumptions [30].
- Cox-CC: A computationally efficient variant of the Cox model that employs case-control sampling to approximate the partial likelihood, facilitating its application to large-scale cohorts [16].
- Cox-Time: A time-dependent proportional hazards model that relaxes the strict proportionality assumption, allowing the effect of predictor variables to evolve over the prediction horizon [16].
- DeepHit: A discrete-time deep learning architecture that directly predicts the probability distribution of the time to event through the joint optimization of likelihood and ranking, without assuming proportional hazards [31].
- Random Survival Forest: A non-parametric method based on ensembles of survival trees that estimates cumulative hazard functions through bootstrap averaging, is robust to complex interactions, and provides intrinsic measures of variable importance [32].
The selection follows a criterion of structural complementarity: linear versus nonlinear models, classical versus flexible assumptions, and high interpretability versus high predictive capacity.
3.4. Integration and Aggregation Strategy
Since the models produce continuous functions rather than discrete labels, the OM layer operates in the space of survival probabilities. The following strategies were implemented and compared:
- Simple average:
- Performance-weighted average (inverse-IBS): Let denote the survival probability generated by model j and let denote its Integrated Brier Score estimated on the validation partitions of the temporal cross-validation. The cooperative survival estimate is defined aswith , , and , where M is the number of models. Inverse-IBS weighting assigns greater influence to models exhibiting better probabilistic calibration while preserving contributions from heterogeneous predictive architectures. Importantly, this weighting scheme is not claimed to be an analytical optimizer of prediction error or survival probability; it is a transparent performance-based aggregation heuristic.
- Stacking: Training of a meta-model that uses the individual predictions as input features.
- Product of Probabilities (Naive Bayes-style): Assuming conditional independence among the models:
- Voting/Ranking Consensus: Ordinal aggregation based on the relative position of each model within the risk distribution.
To distinguish heuristic weighting from explicit optimization, an additional constrained optimization benchmark was evaluated (Brier Opt). In this approach, the ensemble weights are obtained by directly minimizing the validation Integrated Brier Score subject to and , which constitutes a convex optimization problem in the weights. Comparing both strategies allows us to determine whether explicit error minimization produces a genuinely cooperative solution or collapses toward the strongest individual model. The aggregated technical risk signal used in Section 3.5 is derived from the selected cooperative estimate. In the experimental phase, the performance-weighted average was selected as the baseline strategy due to its balance between transparency, stability, and empirical performance, as shown in Section 4.2.
3.5. Contextual Modulator and Explainability (XAI)
Insolvency prediction based exclusively on financial survival models presents inherent limitations in the context of SMEs: such models tend to generate false positives by penalizing transitory liquidity crises in operationally viable businesses, and false negatives by omitting early collapse signals that are not yet reflected in financial statements, such as opacity or critical dependence on the supply chain.
To mitigate these biases, the proposed cooperative strategy incorporates a Contextual Modulator (C), which acts as a risk calibration layer. Rather than overriding the prediction according to predefined rescue-policy rules, this module assesses the firm’s structural vulnerability and adjusts the initial technical estimate (R) to produce a Calibrated Insolvency Risk Index (P).
Following the formalization of contexts through fuzzy logic [24], each contextual risk dimension is modeled as a fuzzy linguistic variable whose membership value represents the degree of structural vulnerability. The modeling is structured into two levels.
Level 1—Membership functions for observable variables: Each variable is transformed into a fuzzy value through a membership function. For continuous numerical variables, standardized during preprocessing, transformations based on empirical percentiles over the reference population are used. Before describing them, it is worth recalling the classical parametric fuzzy membership functions used in conventional fuzzy systems. These commonly represent linguistic concepts through parametric shapes, including triangular, trapezoidal, Gaussian, or sigmoidal functions. Such formulations are particularly appropriate when meaningful semantic breakpoints can be established a priori through expert knowledge, or when the distribution of the underlying variable can be adequately represented by predefined parametric shapes.
In the present application, however, the continuous financial variables exhibit heterogeneous scales, skewness, outliers, and substantially different empirical distributions. Defining common triangular or Gaussian parameters would require variable-specific expert thresholds and could introduce additional arbitrary calibration choices. For this reason, the proposed modulator uses empirical rank-based membership mappings:
- higher_is_riskier(x): —the higher the original value, the greater the risk.
- lower_is_riskier(x): —the lower the original value, the greater the risk.
These functions can be interpreted as empirical, monotonic membership mappings based on the relative position of an observation within the reference population. They preserve ordinal information, are bounded in , require no assumption about the parametric form of the underlying financial variable, and are robust to differences in scale.
Thus, the use of rank-based membership does not imply that classical membership functions are unsuitable. Rather, it reflects the empirical characteristics of the present dataset and the objective of minimizing arbitrary variable-specific thresholds. Triangular, trapezoidal, Gaussian, or expert-defined membership functions constitute relevant alternatives when validated semantic thresholds are available.
The categorical variable , audit opinion, encoded using one-hot encoding, uses a fixed mapping based on expert judgment (see Table 1):
Table 1.
Risk mapping for the audit opinion ().
Based on these membership functions, three dimensions of contextual risk are defined:
- Governance and Opacity Risk (): This dimension evaluates the likelihood of sudden collapse not explained by financial ratios. It is composed of the audit opinion (), the number of days of delay in filing annual accounts () through higher_is_riskier, and the absence of formal corporate governing bodies () through higher_is_riskier.
- Operational Inviability Risk (): This dimension distinguishes between temporary financial difficulties and erosion of the business model. It is composed of cash-generation capacity (: CF/Revenues) and operating margins (: EBITDA/Revenues) through lower_is_riskier, and short-term debt pressure (: CL/NCL) through higher_is_riskier.
- Supply-Chain Fragility Risk (): This dimension measures exposure to external shocks and domino-effect risk. It is composed of dependence on trade financing (: Financial debt/Trade debt) and coverage capacity (: EBITDA/Trade debt), both through lower_is_riskier.
Level 2—Intra-dimensional aggregation: Within each dimension, variables are aggregated using the max operator, so that the most critical vulnerability determines the profile of the dimension without being diluted by healthier variables:
The overall contextual risk aggregates the three dimensions using the same disjunctive operator, ensuring that any critical vulnerability, whether related to governance, operations, or supply-chain fragility, has a direct and non-diluted impact on the final index. Under this “early-warning” logic, the system does not allow an apparently healthy financial situation to compensate for a severe structural weakness:
Fuzzy Rule Base and Inference Mechanism. The contextual aggregation can be equivalently expressed through an explicit fuzzy rule base. The three contextual dimensions represent independent sources of structural vulnerability, and the early-warning principle of the system is formalized through the following rules:
- R1:
- IF Governance and Opacity Risk is High THEN Contextual Risk is High.
- R2:
- IF Operational Inviability Risk is High THEN Contextual Risk is High.
- R3:
- IF Supply-Chain Fragility Risk is High THEN Contextual Risk is High.
For each firm i, the corresponding rule activation strengths are , , and . Because the three rules are connected through an OR-type early-warning logic, their consequents are aggregated using the standard fuzzy disjunction operator:
Accordingly, Equation (4) is not merely an arithmetic aggregation of membership values but the compact mathematical representation of this explicit fuzzy rule base. The inference mechanism is deliberately non-compensatory: strong activation of any individual rule is sufficient to produce a high contextual vulnerability degree.
The proposed mechanism differs from a conventional multi-output Mamdani system requiring a subsequent centroid defuzzification step. Here, is itself the required contextual vulnerability degree, subsequently combined with the technical risk in Equation (6); therefore, no additional transformation into a crisp contextual variable is necessary before calibration.
This compact rule structure was selected to maximize transparency and auditability. More complex rule interactions—for example, rules involving combinations of moderate governance and operational vulnerabilities—could be incorporated in future extensions when sufficiently validated expert knowledge is available.
The aggregation of the rule consequents through the maximum operator is deliberate and follows the non-compensatory early-warning interpretation of the Contextual Modulator. In fuzzy set theory, the maximum operator is the standard t-conorm associated with the logical disjunction OR. Consequently, Equation (4) represents the proposition that a firm exhibits high contextual vulnerability whenever at least one of the considered structural dimensions presents a high degree of membership in the risk set.
This choice differs from compensatory aggregation operators such as the arithmetic mean or weighted averaging. Under an averaging operator, a severe vulnerability in one dimension could be offset by low membership values in the remaining dimensions. Such compensation is undesirable in the present early-warning setting because severe governance opacity, operational inviability, or supply-chain fragility can independently constitute a relevant warning signal.
The maximum operator therefore implements a conservative aggregation rule: improvements in one contextual dimension cannot neutralize a critical vulnerability detected in another. This design prioritizes sensitivity to structural warning signals over compensation among dimensions. Alternative fuzzy aggregation operators may be appropriate in decision environments where trade-offs among contextual dimensions are substantively justified, and constitute an interesting direction for comparative future research.
The final calibrated insolvency risk index synthesizes statistical evidence and structural reality:
where is the technical risk aggregated by the Decision Integration layer (OM), is the contextual risk factor defined in Equation (4), and is a hyperparameter that balances the historical evidence provided by the survival models with current structural signals. By default, , which assigns a majority weight (60%) to the survival model estimates as the primary source of evidence, while the context acts as a corrective mechanism (40%) that complements —rather than replaces— the statistical estimate.
Since is derived from fuzzy membership degrees over the reference population whereas is a survival-based estimate, both quantities may follow markedly different scales. To prevent either component from mechanically dominating the calibrated index, the contextual factor is rescaled to match the first two moments of the technical risk, preserving the distribution shape (skewness and tails) while aligning magnitudes (variance-matching, VarMatch):
where and are the mean and standard deviation of C, and and are those of R. The calibrated contextual factor is thus expressed in the same dispersion units as , allowing the linear combination to preserve the rare-event calibration without the context artificially dominating the estimate. The empirical impact of this transformation is examined in Section 4.3.
Because the matching of the first moments guarantees , the mean of the calibrated index coincides with the mean technical risk, , for any value of ; in practice, the projection of onto the unit interval introduces deviations below . The contextual term therefore modulates the ordering of firms without inflating the aggregate incidence of the event. In these terms, acts as a reference operating point rather than an intrinsically optimal constant: the limiting cases recover the purely technical estimate () and the purely contextual signal (), and intermediate values interpolate between both. The sensitivity of the calibrated risk to this parameter is examined in Section 4.3.3.
Integration of Explainable Artificial Intelligence (XAI) for Calibration. The incorporation of the Contextual Modulator requires an additional level of traceability because the final risk estimate results from both the predictive models and the contextual adjustment. To prevent the system from being perceived as a “black box” that arbitrarily modifies predicted risk, the proposed architecture implements a two-level explainability mechanism.
At the first level, the technical risk estimate () is explained using a surrogate ElasticNet model combined with SHAP-based feature attribution. The surrogate model approximates the behavior of the cooperative predictive core in a computationally tractable and interpretable form, allowing the contribution of the main financial and non-financial predictors to the baseline insolvency risk to be identified. This approach is particularly useful when the cooperative core includes complex survival architectures for which direct model-agnostic explanations may be computationally demanding.
At the second level, the contextual calibration from to is explained through structured natural-language statements derived directly from the contextual dimensions and their corresponding membership values. These explanations identify the dominant contextual vulnerability—governance and opacity, operational inviability, or supply-chain fragility—and the variables responsible for the adjustment. For example: “The baseline technical risk is moderate (), but the final calibrated risk is high () due to severe operational inviability risk (), driven by weak operating cash flow () and insufficient EBITDA margins ()”.
This two-level mechanism distinguishes between the factors explaining the underlying predictive signal and those explaining its contextual adjustment. Consequently, the final output is not merely a predicted probability but an auditable risk profile in which both the technical estimate and the contextual calibration can be traced by the decision-maker [9,25].
3.6. Evaluation Protocol and Metrics
The evaluation is conducted at two levels: technical-predictive and cooperative-decisional.
- Survival metrics: Time-dependent concordance index (C-index), integrated Brier Score (IBS) for probabilistic calibration, and calibrated survival curves compared against the observed reality (Kaplan–Meier).
- Cooperation metrics: Comparison of the performance of the cooperative ensemble against each isolated and against a monolithic reference model.
- Temporal cross-validation: Random mixing of annual records is avoided in order to preserve temporal causality. Each fold respects the chronological order of the observations.
3.7. Implementation Environment
The prototype was developed in Python 3.10+ using the lifelines (0.30.0), scikit-survival(0.25.0), and pycox(0.3.0) libraries for survival models, together with lime(0.2.0.1), shap(0.49.1), scikit-learn(1.7.2), and streamlit(1.50.0). The models were trained in an environment equipped with an 8-core CPU and 16 GB of RAM, with no requirement for GPU acceleration given the tabular and longitudinal nature of the data. The source code, preprocessing scripts, and pipeline configuration are made available in a public repository to ensure reproducibility and external auditability (https://github.com/aavazquez-go/cooperative_automated_DM_with_contextual_modulation accessed on 22 September 2026).
4. Results
4.1. Predictive Performance and Computational Characterization of Individual Models
This subsection establishes the technical baseline of the system, evaluating the discriminatory capacity, probabilistic accuracy, and computational efficiency of each survival architecture before their integration into the cooperative decision layer. The analysis demonstrates that algorithmic heterogeneity is not a limitation, but a structural resource that the Output Manager(OM) layer of the CADEMAS framework exploits to compensate for individual biases and stabilize risk estimates.
4.1.1. Discrimination and Predictive Error
Table 2 summarizes the evaluation metrics obtained on the test set, which contains 307,924 longitudinal firm-year/interval observations corresponding to 23,411 unique SMEs. The time-dependent concordance index (time-dependent C-index) and the integrated Brier Score (IBS) were selected as primary indicators, given their suitability for the censored and longitudinal nature of financial data.
Table 2.
Predictive performance metrics of individual survival models on the test set.
DeepHit achieves the best overall performance, with a time-dependent C-index of 0.9373 and the lowest IBS (0.0179), reflecting its ability to directly model the discrete distribution of time-to-event without assuming proportional hazards. RSF and Cox-Time show competitive and robust behavior (C-td > 0.90), standing out for their flexibility with nonlinear interactions and time-varying effects, respectively. Conversely, CoxPH maintains solid but moderate discrimination (C-td = 0.8530), while DeepSurv and Cox-CC exhibit inferior performance in this specific configuration, attributable to the sensitivity of deep optimizers to the scale of financial ratios and the case-control approximation in highly time-imbalanced cohorts. This dispersion of performance supports the central premise of CADEMAS: no single paradigm consistently dominates all risk regimes, justifying the need for a semantic integration layer.
4.1.2. Computational Efficiency and Training/Inference Trade-Off
The operational viability of a financial DSS critically depends on the relationship between training cost and inference latency. Table 3 reports the mean times obtained on an 8-core CPU environment (without GPU acceleration), reflecting realistic deployment conditions for institutions with standard infrastructure.
Table 3.
Comparison of training and inference times (mean ± standard deviation).
Neural network-based models (DeepHit, DeepSurv, Cox-CC) exhibit substantially higher training costs due to iterative optimization of partial likelihood or ranking functions, but, once trained, can provide very efficient inference. DeepHit illustrates this trade-off particularly clearly, with the highest training time (3450.4 s) but an inference time of only 0.57 s over the complete test set. CoxPH presents the lowest training cost (56.8 s) and also maintains low inference latency (0.97 s), whereas Cox-CC and DeepSurv achieve slightly faster inference times (0.50 s and 0.51 s, respectively). RSF, although comparatively efficient during training, exhibits the highest inference latency (20.91 s) because prediction requires traversal of multiple survival trees. These heterogeneous computational profiles allow the Input Manager (IM) to route flows according to operational urgency—fast models for real-time screening and deep architectures for batch strategic planning—and enable the computational burden to be managed differently during offline training and online inference, reinforcing the modularity of the tuple .
4.1.3. Assumption Validity and Temporal Behavior
The CoxPH model assumes proportional hazards (PH), a condition frequently violated in longitudinal financial data. The Schoenfeld residuals test was applied to the CoxPH estimation sample, comprising approximately 992,000 longitudinal firm-year/interval observations and 30,504 observed insolvency events (corresponding to the inner 80% CIF-based training subset described in Section 3, from which the CoxPH model was fitted). This analysis (Figure 2) revealed that 37 of the 60 covariates exhibit statistically significant violations (p < 0.05). However, the slope analysis indicates maximum deviations below 0.10 (see Table 4), and the residual plots against time (Figure 3) show mostly flat or gently sloping trends.
Figure 2.
Distribution of p-values from the Schoenfeld residuals test for the 60 variables of the CoxPH model. The red dashed line indicates = 0.05. Thirty-seven of sixty variables violate the proportional hazards assumption (p < 0.05), although with slopes below 0.10 in absolute magnitude.
Table 4.
Main violations of the proportional hazards assumption (Schoenfeld test).
Figure 3.
Schoenfeld residuals against time for the 12 variables with the greatest statistical violation of the PH assumption—(top) variables 1–6, (bottom) variables 7–12. Each panel shows individual residuals (blue points) and the smoothed trend (red line). Slopes are consistently small (<0.10), indicating that the practical magnitude of the violation is limited despite the statistical significance.
This discrepancy between statistical significance and practical relevance is explained by the large sample size, which amplifies noise detections as formal violations. Nevertheless, the systematic presence of these deviations justifies the inclusion of non-parametric (RSF) and time-dependent (Cox-Time, DeepHit alternatives in layer A, ensuring that risk estimation is not compromised by structural breaks in economic cycles or corporate debt dynamics.
4.1.4. Probabilistic Calibration Across the Time Horizon
While the C-index evaluates discriminatory capacity (risk ranking), calibration measures the agreement between predicted probabilities and observed event rates, which is essential for quantitative risk interpretation and intervention prioritization. Calibration was assessed using calibration curves at five time horizons (1, 3, 5, 10, and 15 years) and the Integrated Brier Score (IBS) as a global probabilistic accuracy metric.
Calibration over time. Figure 4, Figure 5, Figure 6, Figure 7 and Figure 8 show the calibration curves for each model at different horizons. In the short term (t = 1 year) (Figure 4), DeepHit and RSF exhibit the best alignment with the perfect calibration diagonal, with deviations below 5% in the extreme risk terciles. CoxPH maintains acceptable calibration but tends to slightly underestimate risk in the high-risk group (slope ≈ 0.92). DeepSurv and Cox-CC show systematic risk overestimation, particularly in firms with stable financial profiles.
Figure 4.
Calibration curves at 1 year. The panel shows predicted survival probability (X-axis) versus observed (Y-axis) stratified by deciles. The dashed line indicates perfect calibration. DeepHit and RSF show the best alignment at this horizon.
Figure 5.
Calibration curves at 3 years. The panel shows predicted survival probability (X-axis) versus observed (Y-axis) stratified by deciles. The dashed line indicates perfect calibration. DeepHit and RSF show the best alignment at this horizon.
Figure 6.
Calibration curves at 5 years. Progressive degradation is observed in CoxPH and DeepSurv, while DeepHit maintains stability. Cox-Time shows intermediate adaptation.
Figure 7.
Calibration curves at 10 years. Progressive degradation is observed in CoxPH and DeepSurv, while DeepHit maintains stability.
Figure 8.
Calibration curves at 15 years. Deviations are pronounced for most models. DeepHit preserves the best calibration, followed by RSF. CoxPH and DeepSurv present severe underestimation of cumulative risk.
As the horizon extends (t = 3–5 years) (Figure 5 and Figure 6), distinct patterns emerge. DeepHit preserves its calibration robustly, maintaining slopes close to 1.0 up to the fifth year, reflecting its ability to directly model the temporal distribution of the event without relying on proportionality assumptions. RSF also demonstrates stability, although it begins to show slight underestimation of cumulative risk at the 5-year horizon (deviation ≈ 8%). Cox-Time, specifically designed to capture time-varying effects, shows notable adaptation in this intermediate range, partially correcting the deviations observed in CoxPH.
At long-term horizons (t = 10–15 years) (Figure 7 and Figure 8), calibration degradation accelerates for most models. CoxPH presents severe risk underestimation (slope ≈ 0.71 at 10 years), a direct consequence of the proportional hazards assumption violation detected in the Schoenfeld test. DeepSurv exhibits erratic behavior, with oscillations between overestimation and underestimation depending on the risk stratum, suggesting instability in extracting deep temporal patterns with sparse data in the right tail of the distribution. Cox-CC, although maintaining acceptable discrimination (global C-index = 0.9316), shows systematic miscalibration due to the case-control approximation, which distorts absolute probabilities.
DeepHit emerges as the best-calibrated model across all horizons, with maximum deviations of 12% even at 15 years, followed by RSF (deviation ≈ 15% at 15 years). This superiority is explained by its discrete-time formulation, which avoids parametric extrapolation and explicitly models competing risks.
4.1.5. Visual Analysis of Survival Curves
Figure 9 compares the observed survival curves (Kaplan–Meier) against those predicted by each model, stratified by risk terciles (High, Medium, Low). DeepHit and RSF better preserve the separation between strata across the 20-year horizon, while CoxPH and DeepSurv tend to compress the curves at intermediate horizons, underestimating cumulative risk in the high-impact group. Cox-Time shows notable adaptation in the late phase (>12 years), capturing financial maturation effects that static models miss. No architecture perfectly reproduces the observed dynamics across all three strata simultaneously, confirming that cooperation does not seek to replace weak models but to synthesize their complementary strengths through the Output Manager layer.
Figure 9.
Observed survival curves (Kaplan–Meier, solid line) versus predicted by each model (dashed lines) stratified by risk (High, Medium, Low). X-axis: years since first observation; Y-axis: survival probability. DeepHit and RSF better preserve the separation between strata across the time horizon.
4.1.6. Synthesis and Transition to Cooperative Integration
The results of this subsection empirically support the design of layer A in CADEMAS. The heterogeneity in discrimination (C-td: 0.50–0.94), calibration (IBS: 0.018–0.042), and computational efficiency (train/infer ratio: 4×–6053×) demonstrates that each ADM contributes a partial signal with distinct structural biases. This diversity is not a modeling flaw but an exploitable architectural property: the semantic integration layer (Output Manager, OM) will receive outputs that, although divergent in magnitude, are consistent in risk direction, enabling weighted aggregation that reduces variance and mitigates algorithmic determinism. The following subsection (Section 4.2) quantifies how this cooperative strategy outperforms monolithic approaches and generates a unified, calibrated risk signal ready for contextual modulation.
4.2. Performance of the Cooperative Integration Strategy
This subsection evaluates the effectiveness of the Output Manager(OM) layer of the CADEMAS framework when integrating the signals from the individual models described in Section 4.1. The aim is to demonstrate that the cooperative strategy not only averages errors but also stabilizes variance, mitigates the risk of model-specific performance degradation, and generates a unified risk signal with superior calibration and discrimination.
4.2.1. Variance Stabilization Through Cross-Validation
To evaluate system stability under perturbations in the training data, the behavior of individual models and ensemble methods was compared using stratified cross-validation (5 folds). Figure 10 and Figure 11 illustrate the distribution of the time-dependent concordance index (C-index td) and the Integrated Brier Score (IBS), respectively.
Figure 10.
Distribution of C-index (time-dependent) per fold. Individual models (blue) show high variance, especially Cox-Time and Cox-CC. Ensembles (orange) stabilize the prediction, reducing inter-fold variance. The best individual model reaches 0.9355, while the best ensemble obtains 0.9325.
Figure 11.
Distribution of Integrated Brier Score (IBS) per fold. Ensembles maintain consistent calibration, mitigating the extreme errors of models like Cox-Time. The best individual model reaches 0.0190, while the best ensemble obtains 0.0187.
Discrimination (C-index). As observed in Figure 10, individual models exhibit high volatility. In particular, Cox-CC and Cox-Time present extremely wide interquartile ranges (oscillating between 0.50 and 0.90 across different folds), indicating strong dependence on the data partition and susceptibility to overfitting or sample sensitivity. In contrast, cooperative methods (Simple Average, Weighted Avg, Product) collapse this variance, concentrating their distributions in a narrow, high range (∼0.92–0.93). This validates that the OM layer acts as a noise filter: even if an individual model (such as Cox-CC) fails in a specific fold due to an atypical distribution, the group consensus maintains stable global performance.
Calibration (IBS). Figure 11 reveals that DeepHit is the most robust individual model in calibration (IBS ≈ 0.0190), while Cox-Time and DeepSurv show elevated and dispersed errors. The integration strategies maintain a consistently low IBS (<0.028), significantly outperforming weak models. Notably, the Brier optimization (Brier Opt) converges to the same level as DeepHit (IBS ≈ 0.0187), suggesting that, for this specific metric, DeepHit’s signal is so dominant that the optimizer assigns full weight to this model.
4.2.2. Comparison of Aggregation Strategies on the Test Set
Table 5 presents the final performance of the different integration strategies applied to the test set (307,924 observations), compared with the best individual models.
Table 5.
Comparative performance of integration strategies on the test set.
Analysis of results:
- DeepHit Dominance and Brier Opt Collapse: The Brier Opt method (constrained convex optimization of IBS) achieved the best absolute results. However, weight analysis revealed that the optimizer assigned 100% weight to DeepHit, discarding the other models. This indicates that DeepHit already captures the optimal signal for probabilistic calibration in this domain, and that no linear combination of the remaining models can improve its IBS.
- Success of the Multiplicative Strategy: Despite the collapse of Brier Opt, the Weighted Avg and Product methods (weighted by inverse IBS) managed to outperform DeepHit individually in C-index (0.9396 vs 0.9373), albeit with a slight cost in IBS. This demonstrates that cooperative integration is effective for improving discrimination (risk ranking) by leveraging the complementary strengths of models like RSF or Cox-Time, which can capture nonlinear patterns that DeepHit overlooks.
- Stacking Failure: The Stacking strategy (CoxPH meta-model trained on the outputs of the base models) showed inferior performance (IBS = 0.0353). This is attributed to the reduction in available training space (50% for meta-training) and the potential collinearity among the survival curves of the base models, which hindered meta-model convergence. Consequently, Stacking is discarded as a base strategy for deploying our cooperative approach.
4.2.3. Statistical Validity of the Cooperative Improvement
To confirm that the observed differences are not due to chance, pairwise significance tests were applied with Bonferroni correction (): a bootstrap paired z-test on the global C-index and a paired Wilcoxon test on the IBS. Table 6 summarizes the 95% confidence intervals obtained via bootstrap (20,000 samples, 500 iterations).
Table 6.
Confidence intervals (95%) and significance ranking for the main methods.
Table 6 reports bootstrap 95% confidence intervals for the global concordance index and the Integrated Brier Score of the principal individual and cooperative strategies. The C-index shown in this table is the global concordance measure calculated within each bootstrap resample and should not be confused with the time-dependent C-index reported in Table 2. Higher C-index values indicate better discrimination, whereas lower IBS values indicate better probabilistic calibration.
The confidence intervals quantify the uncertainty associated with each performance estimate. Statistical comparisons between methods were conducted separately using a bootstrap paired z-test (global C-index) and a paired Wilcoxon test (IBS), both with Bonferroni multiplicity correction. Consequently, Table 6 should be interpreted jointly with the corresponding pairwise significance tests rather than as a stand-alone ranking based only on overlap between confidence intervals.
The results statistically confirm that:
- DeepHit/Brier Opt is significantly superior in calibration (IBS) to any other method (p < 0.001).
- The cooperative ensembles (Product, Weighted Avg) are statistically indistinguishable from each other in discrimination, but significantly outperform unstable individual models (Cox-Time, Cox-CC) in consistency.
- There is an inherent trade-off: while Cox-CC can achieve high C-index peaks, its calibration is poor and volatile. Our cooperative strategy marginally sacrifices the theoretical maximum C-index to guarantee a reliable and stable survival probability, an indispensable requirement for financial decision-making.
4.2.4. Synthesis: Cooperation as a Robustness Guarantee
The experiments support the central hypothesis of the CADEMAS framework: semantic integration of heterogeneous models mitigates the risk of dependence on a single algorithmic paradigm. Although DeepHit emerges as the strongest individual model, the cooperative architecture enables the following:
- Resilience If DeepHit fails in a new context or with shifted data (concept drift), the weighted ensemble (Weighted Avg) maintains stable performance by redistributing the load to models like RSF or CoxPH.
- Transparency in aggregation: Unlike Stacking (black box), methods like Product (1/IBS) allow tracing each model’s contribution to the final risk, facilitating auditor review.
- Readiness for the Contextual Modulator: The resulting ensemble signal () presents smoothed calibration free of spurious peaks, facilitating the subsequent application of the Contextual Modulator (Layer C) without amplifying technical errors.
The experiments support the central rationale of the cooperative architecture: semantic integration of heterogeneous survival models reduces dependence on any single algorithmic paradigm. Although DeepHit provides the strongest individual performance under the observed test distribution, this does not imply that it will remain uniformly dominant under changes in temporal, sectoral, or economic conditions. The cooperative strategy therefore introduces diversification at the model level. Models such as RSF, Cox-Time, and CoxPH rely on different assumptions and representations of the survival process, so their errors need not respond identically to distributional changes. By combining these heterogeneous signals, the system reduces the risk that the deterioration of one model propagates directly to the final decision.
Accordingly, the principal advantage of cooperation is not necessarily a higher point estimate of predictive performance than the best individual model, but greater robustness, stability, and traceability of the resulting risk signal. This trade-off is especially relevant in high-stakes financial decision-making, where excessive dependence on a single predictive architecture may create operational vulnerability when the data-generating environment changes. This design principle is consistent with the CADEMAS framework’s core premise: moving from isolated predictive models toward cooperative decision ecosystems whose outputs remain reliable, auditable, and operationally useful even when individual components face novel or degraded data scenarios.
This subsection has demonstrated that the cooperative strategy overcomes the limitations of isolated models, providing a sound technical basis for the contextual modulation presented in Section 3.5.
4.3. Impact of the Contextual Modulator on Intervention Prioritization
Once the predictive performance of model cooperation has been validated (Section 4.2), the impact of the Contextual Modulator on intervention prioritization is assessed. To this end, the technical estimate —obtained from cooperative aggregation— is fused with non-financial structural vulnerability signals through the contextual factor , generating a calibrated risk . This section analyzes how this calibration alters the risk distribution, the prioritization ranking, and the traceability of resulting decisions.
4.3.1. Scale Calibration and Alignment
As formalized in Section 3.5, the contextual risk is derived from three fuzzy dimensions: Governance and Opacity (), Operational Unviability (), and Supply Chain Fragility (). Since membership values are derived from empirical percentiles over the reference population, the distribution of reflects the actual prevalence of structural vulnerabilities in the Spanish business fabric. A critical methodological challenge arises when combining and , which follow markedly different scales (Section 3.5). Given that the insolvency event rate in the dataset is extremely low (global interval event rate ), the mean technical risk is . In contrast, structural vulnerabilities are prevalent, yielding a mean .
A direct aggregation (Original method) causes the term to dominate the equation, artificially inflating to values near – for almost all firms, regardless of their . Conversely, Z-score standardization (Standardised) amplifies noise and generates spurious extreme values. To avoid this scale dominance, the variance-matching (VarMatch) transformation defined in Equation (7) is applied, which rescales the contextual factor to the first two moments of the technical risk while preserving the distribution shape.
Figure 12 provides a global view of the effect of the Contextual Modulator on the 61,584 observations of the test set used to calibrate the dynamic threshold. As observed, all points lie above the identity line , empirically confirming that for 100% of observations. This systematic elevation is not a model bias but a deliberate design feature: since insolvency is a rare event (global per-observation event rate ), the technical risk is marginal (mean ), and any detected structural vulnerability () acts as a risk elevation factor.
Figure 12.
Effect of the Contextual Modulator on technical risk. Each point represents an SME from the test set. The dashed line indicates (no calibration). All points lie above the diagonal (). Colors: dominant fuzzy dimension (Governance: orange, Operational Unviability: light blue, Supply Chain Fragility: green).
The concentration of points in the left region of the plot () reflects the rarity of the insolvency event captured by the survival models. However, the Contextual Modulator “decompresses” this scale, distributing the values across a much wider range (0.15–0.45), enabling differentiation of firms with distinct structural vulnerabilities that would otherwise appear indistinguishable.
4.3.2. Analysis of Representative Cases and Risk Divergence
Table 7 details the modulator’s behavior in the same three representative SMEs from the test set, anonymized consistently throughout the manuscript as Company-A, Company-B, and Company-C. Their local SHAP-based explanations and the corresponding natural-language justifications are provided in Section 4.4 These cases were selected to illustrate the three dominant contextual vulnerability profiles: governance and opacity, operational inviability, and supply-chain fragility, respectively. A consistent finding is that the Contextual Modulator always increases the risk estimate (). This is not a model bias but a deliberate design feature: since insolvency is a rare event, the baseline risk is marginal, and any detected structural vulnerability () acts as a risk elevation factor.
Table 7.
Representative examples of contextual calibration of our cooperative strategy (, VarMatch method).
As observed, all three firms present practically null technical risk () (≈0.001–), which would classify them as “safe” in a monolithic system. However, the modulator identifies critical vulnerabilities: Company-A suffers from severe information opacity (unfavorable audit opinion); Company-B presents operational unviability (negative cash flow); and Company-C shows high dependence on trade credit. The increase acts as an “early warning signal” that transcends historical financial ratios, aligning the prediction with the firm’s observed structural and operational conditions.
4.3.3. Sensitivity Analysis, Orthogonality, and Dynamic Thresholding
To assess the robustness of the integration, a sweep of the hyperparameter (from to ) was performed at a 5-year horizon. Because the VarMatch transformation preserves the mean technical risk by construction ( regardless of ), the calibrated index does not require a prevalence adjustment at the aggregate level; only modulates the contribution of the contextual signal to each firm-specific estimate.
Table 8 quantifies this sensitivity. As decreases from 1 to 0, the ranking of firms rotates smoothly from the purely technical ordering () toward the context-driven ordering ( at ), without introducing abrupt changes in the risk structure. The dynamic high-risk classification remains stable throughout the sweep, with agreement against the reference operating point above 98% and a high-risk fraction equal to the observed event rate by construction. Accordingly, is adopted as a reference operating point for the present application rather than an intrinsically optimal value: it assigns majority weight to the validated survival-based technical risk while retaining a sufficiently large contextual component to identify structural vulnerabilities not captured by the predictive models, preserving the model’s discriminative utility.
Table 8.
Sensitivity of the calibrated risk to at the 5-year horizon (VarMatch). is the Spearman correlation between the calibrated risk index and the technical risk; Agreement is the percentage of firms sharing the same high-risk label under the dynamic threshold as the reference operating point .
A notable statistical finding is the low Spearman correlation between technical and contextual risk ( at the 5-year horizon, ranging from to depending on the horizon). This demonstrates that both information sources are nearly orthogonal:the modulator does not merely replicate or amplify what the survival models already know, but provides new and complementary information about structural fragility. Despite this adjustment, the relative ranking of firms is well preserved ( between rankings of different scaling methods: –), ensuring stability in prioritization.
Finally, applying a fixed risk threshold (e.g., ) is ineffective in this domain due to event rarity ( rarely exceeds with ). Therefore, the system implements a dynamic threshold based on the observed event rate via the Kaplan–Meier estimator on the test set. The percentages reported in Table 9 correspond to horizon-specific cumulative insolvency probabilities estimated from the survival data, calculated as where is the Kaplan–Meier survival function evaluated on the test set. They are conceptually different from the proportion of insolvent firms used to construct the original firm-level sample. For example, the value of 5.59% at the 15-year horizon means that the estimated cumulative probability of insolvency by year 15 is 0.0559; this should not be interpreted as the proportion of insolvent firms in the original balanced sample. As detailed in Table 9, the alert threshold automatically adjusts to the time horizon:
Table 9.
Observed event rates and dynamic thresholds of calibrated risk () by time horizon.
This dynamic thresholding strategy ensures that intervention alerts are statistically significant and operationally actionable for decision-makers (e.g., financial entities or public bailout agencies), marking as “high risk” only the percentile of firms whose calibrated probability equals or exceeds the actual historical failure rate for that specific horizon. This structurally justified increment lays the groundwork for the traceability detailed in the following section through XAI techniques.
4.4. XAI Integration and Decision Traceability
The implementation of deep survival analysis models (such as DeepHit or Cox-Time) in financial decision-making environments poses an inherent challenge: their “black box” nature. For a Decision Support System (DSS) to be adopted by financial analysts and regulators, transparency must not compromise predictive performance, but rather reduce the decision-maker’s cognitive load and facilitate system auditing [9,25].
To address this, this proposal implements a two-level post hoc explainability strategy, ensuring traceability of contextual calibration without resorting to generative language models that could introduce hallucinations or lack of reproducibility.
4.4.1. Global Explainability of Technical Risk ()
Given the prohibitive computational cost of applying methods like SHAP Kernel directly on ensembles of neural networks with 60 features and over 300,000 samples, a surrogate model approach was adopted. An ElasticNet logistic regression model was trained to predict the binarized technical risk from the original features. This glass-box model achieved a mean cross-validated AUC of 0.958, demonstrating that it accurately captures the behavior of the complex ensemble. LinearSHAP was then applied to this surrogate, providing exact Shapley values for linear models [33].
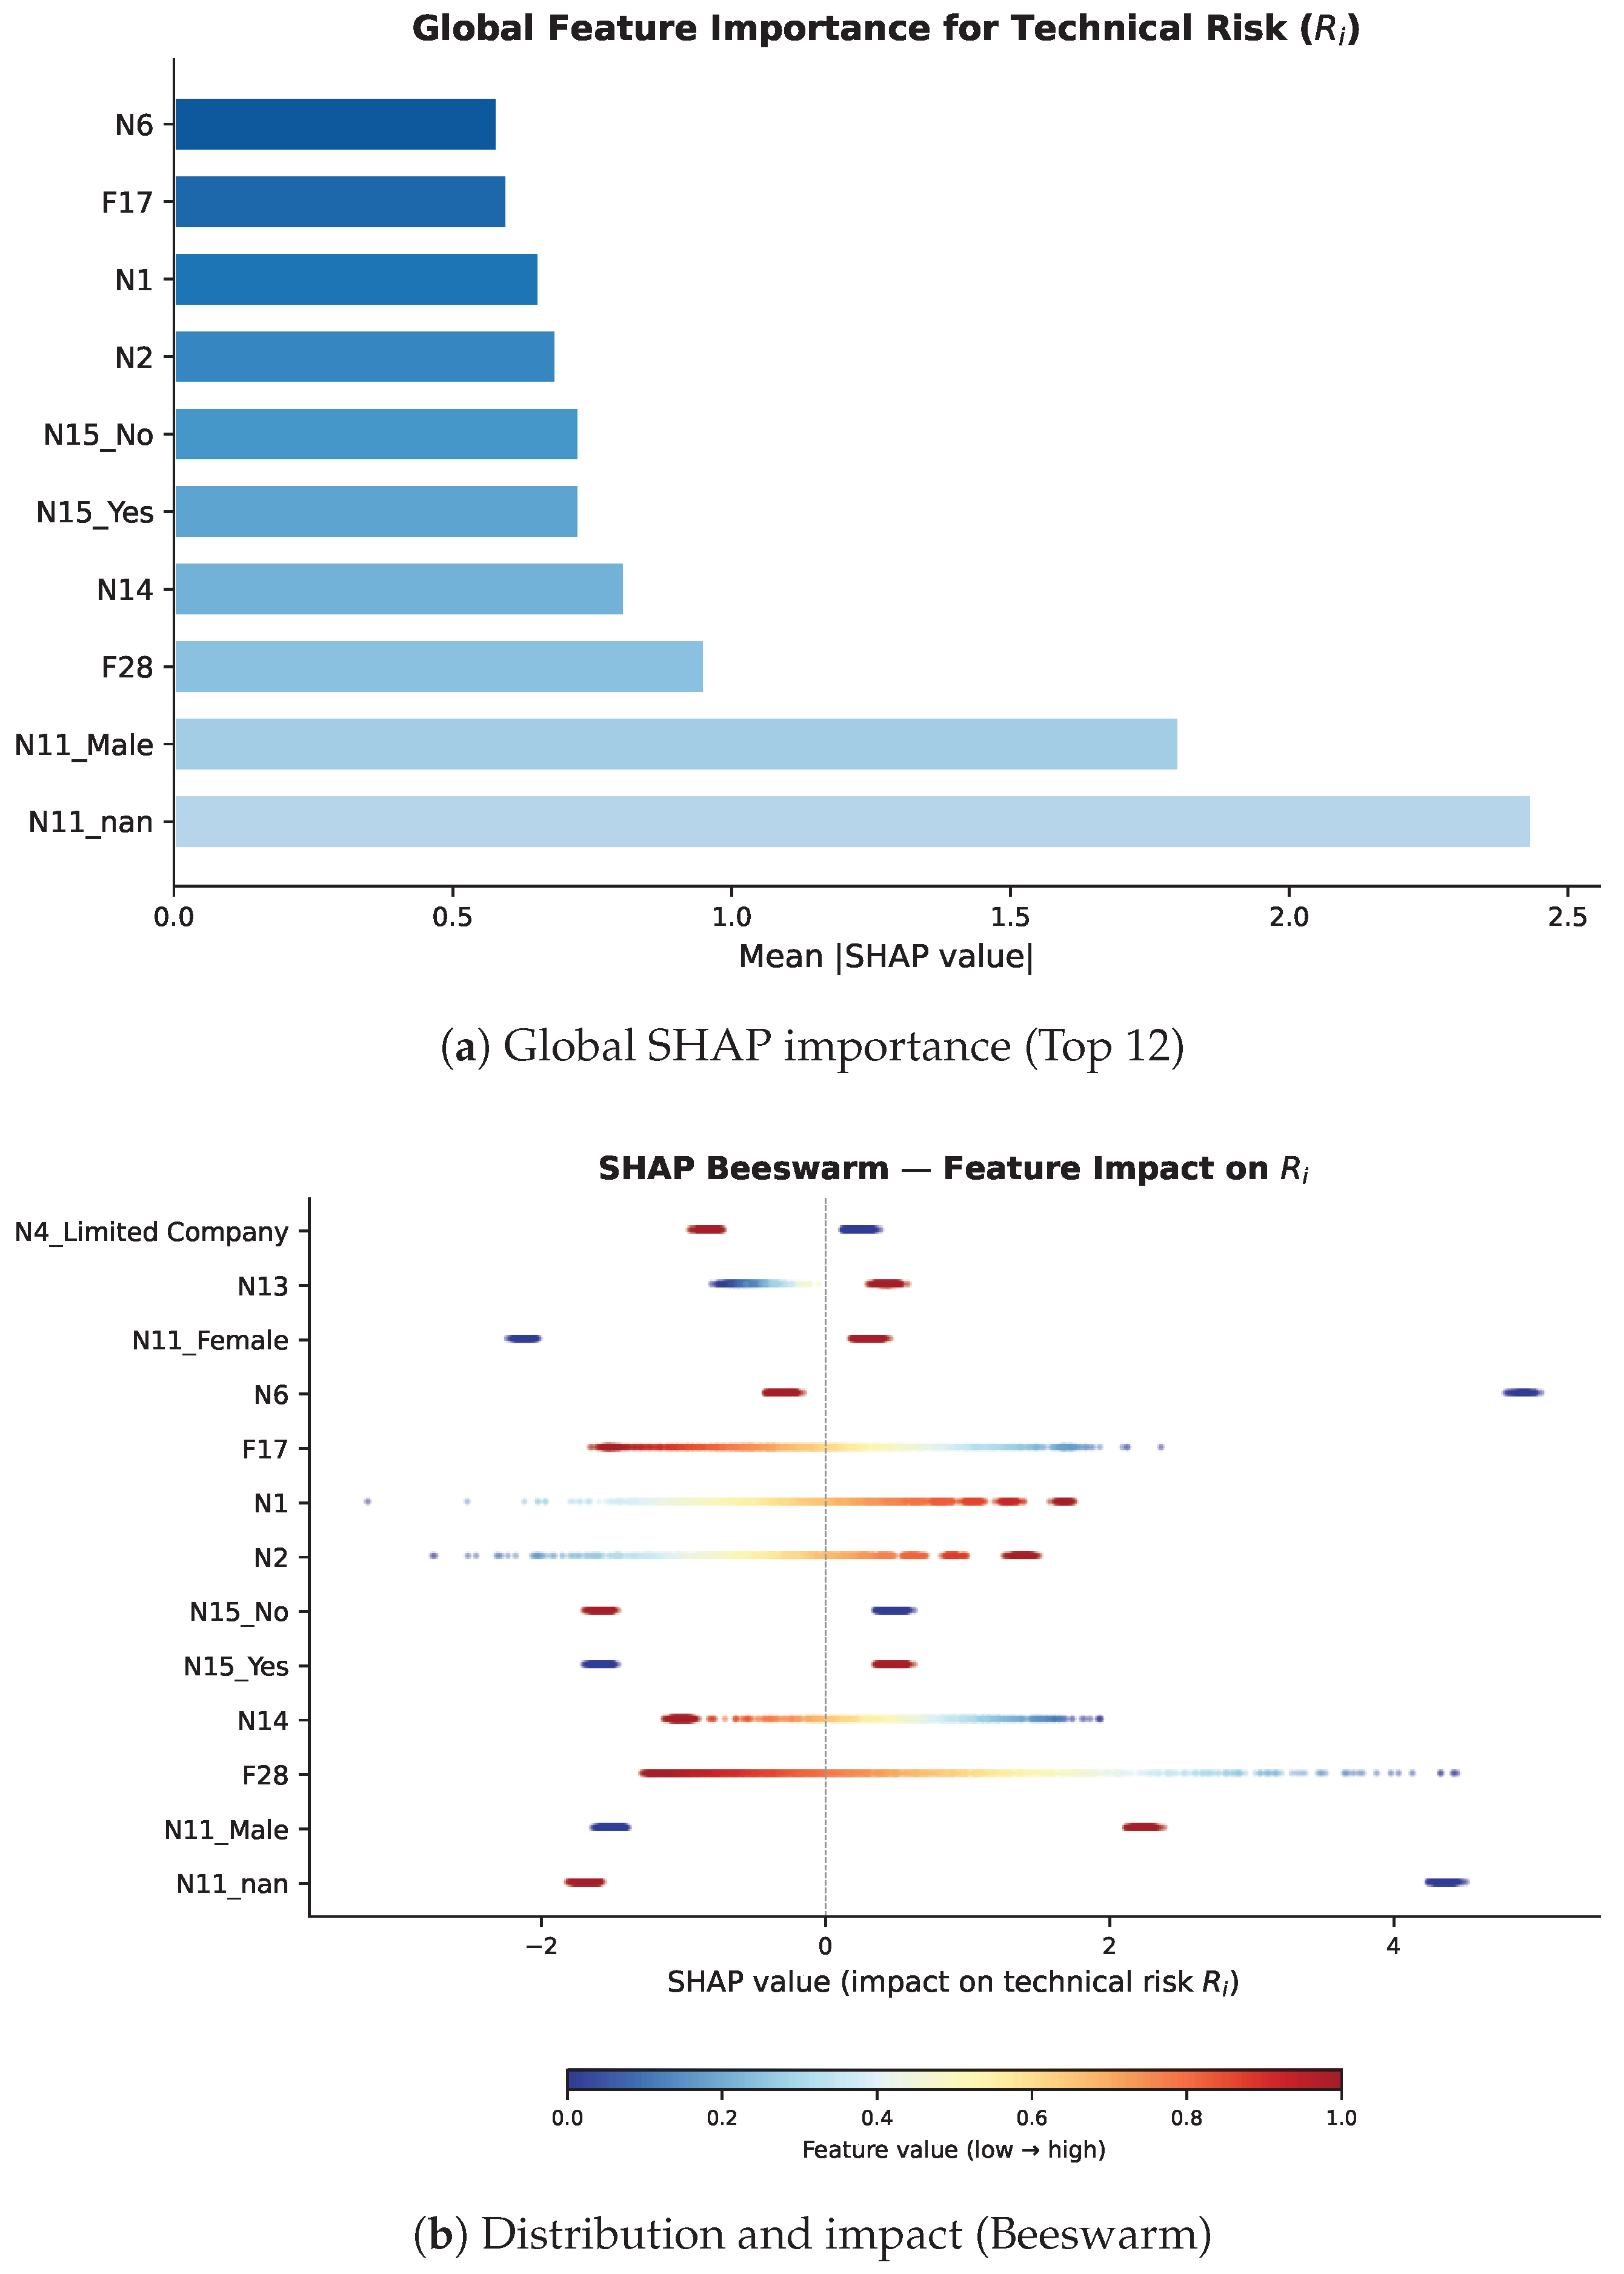
Figure 13 illustrates the global importance of predictors. The analysis reveals remarkable coherence with financial and corporate governance theory:
- Information opacity: The absence of legal representative data (N11_nan) is the most influential predictor (mean|SHAP| = 2.43), acting as a strong risk signal.
- Protective factors: Firm age (N2) and employee size (N1) consistently reduce risk, aligning with the liability of newness theory. Likewise, belonging to a business group (N15_Yes) mitigates risk.
- Warning signals: Aggressive asset growth (F28) and delay in filing accounts (N14) increase risk.
- Counterintuitive finding: A high acid-test ratio (F17) is associated with higher risk. This is consistent with the hoarding effect, where firms in distress retain liquidity as a defense mechanism against impending insolvency.
Figure 13.
Global explainability of technical risk () via the ElasticNet surrogate model. In (a), bar length indicates each feature’s mean |SHAP value|, and the blue gradient reflects this magnitude (darker blue = higher importance). In (b), colors in the Beeswarm indicate feature value (red: high, blue: low).
4.4.2. Local Explainability and Contextual Justification ()
While SHAP explains the base technical risk (), the decision-maker needs to understand why the final calibrated risk () deviates from this baseline. The Output Manager of our cooperative strategy translates contextual calibration into natural-language justifications through structured templates. This links each calibration component () with the specific variables that motivate it, ensuring deterministic traceability.
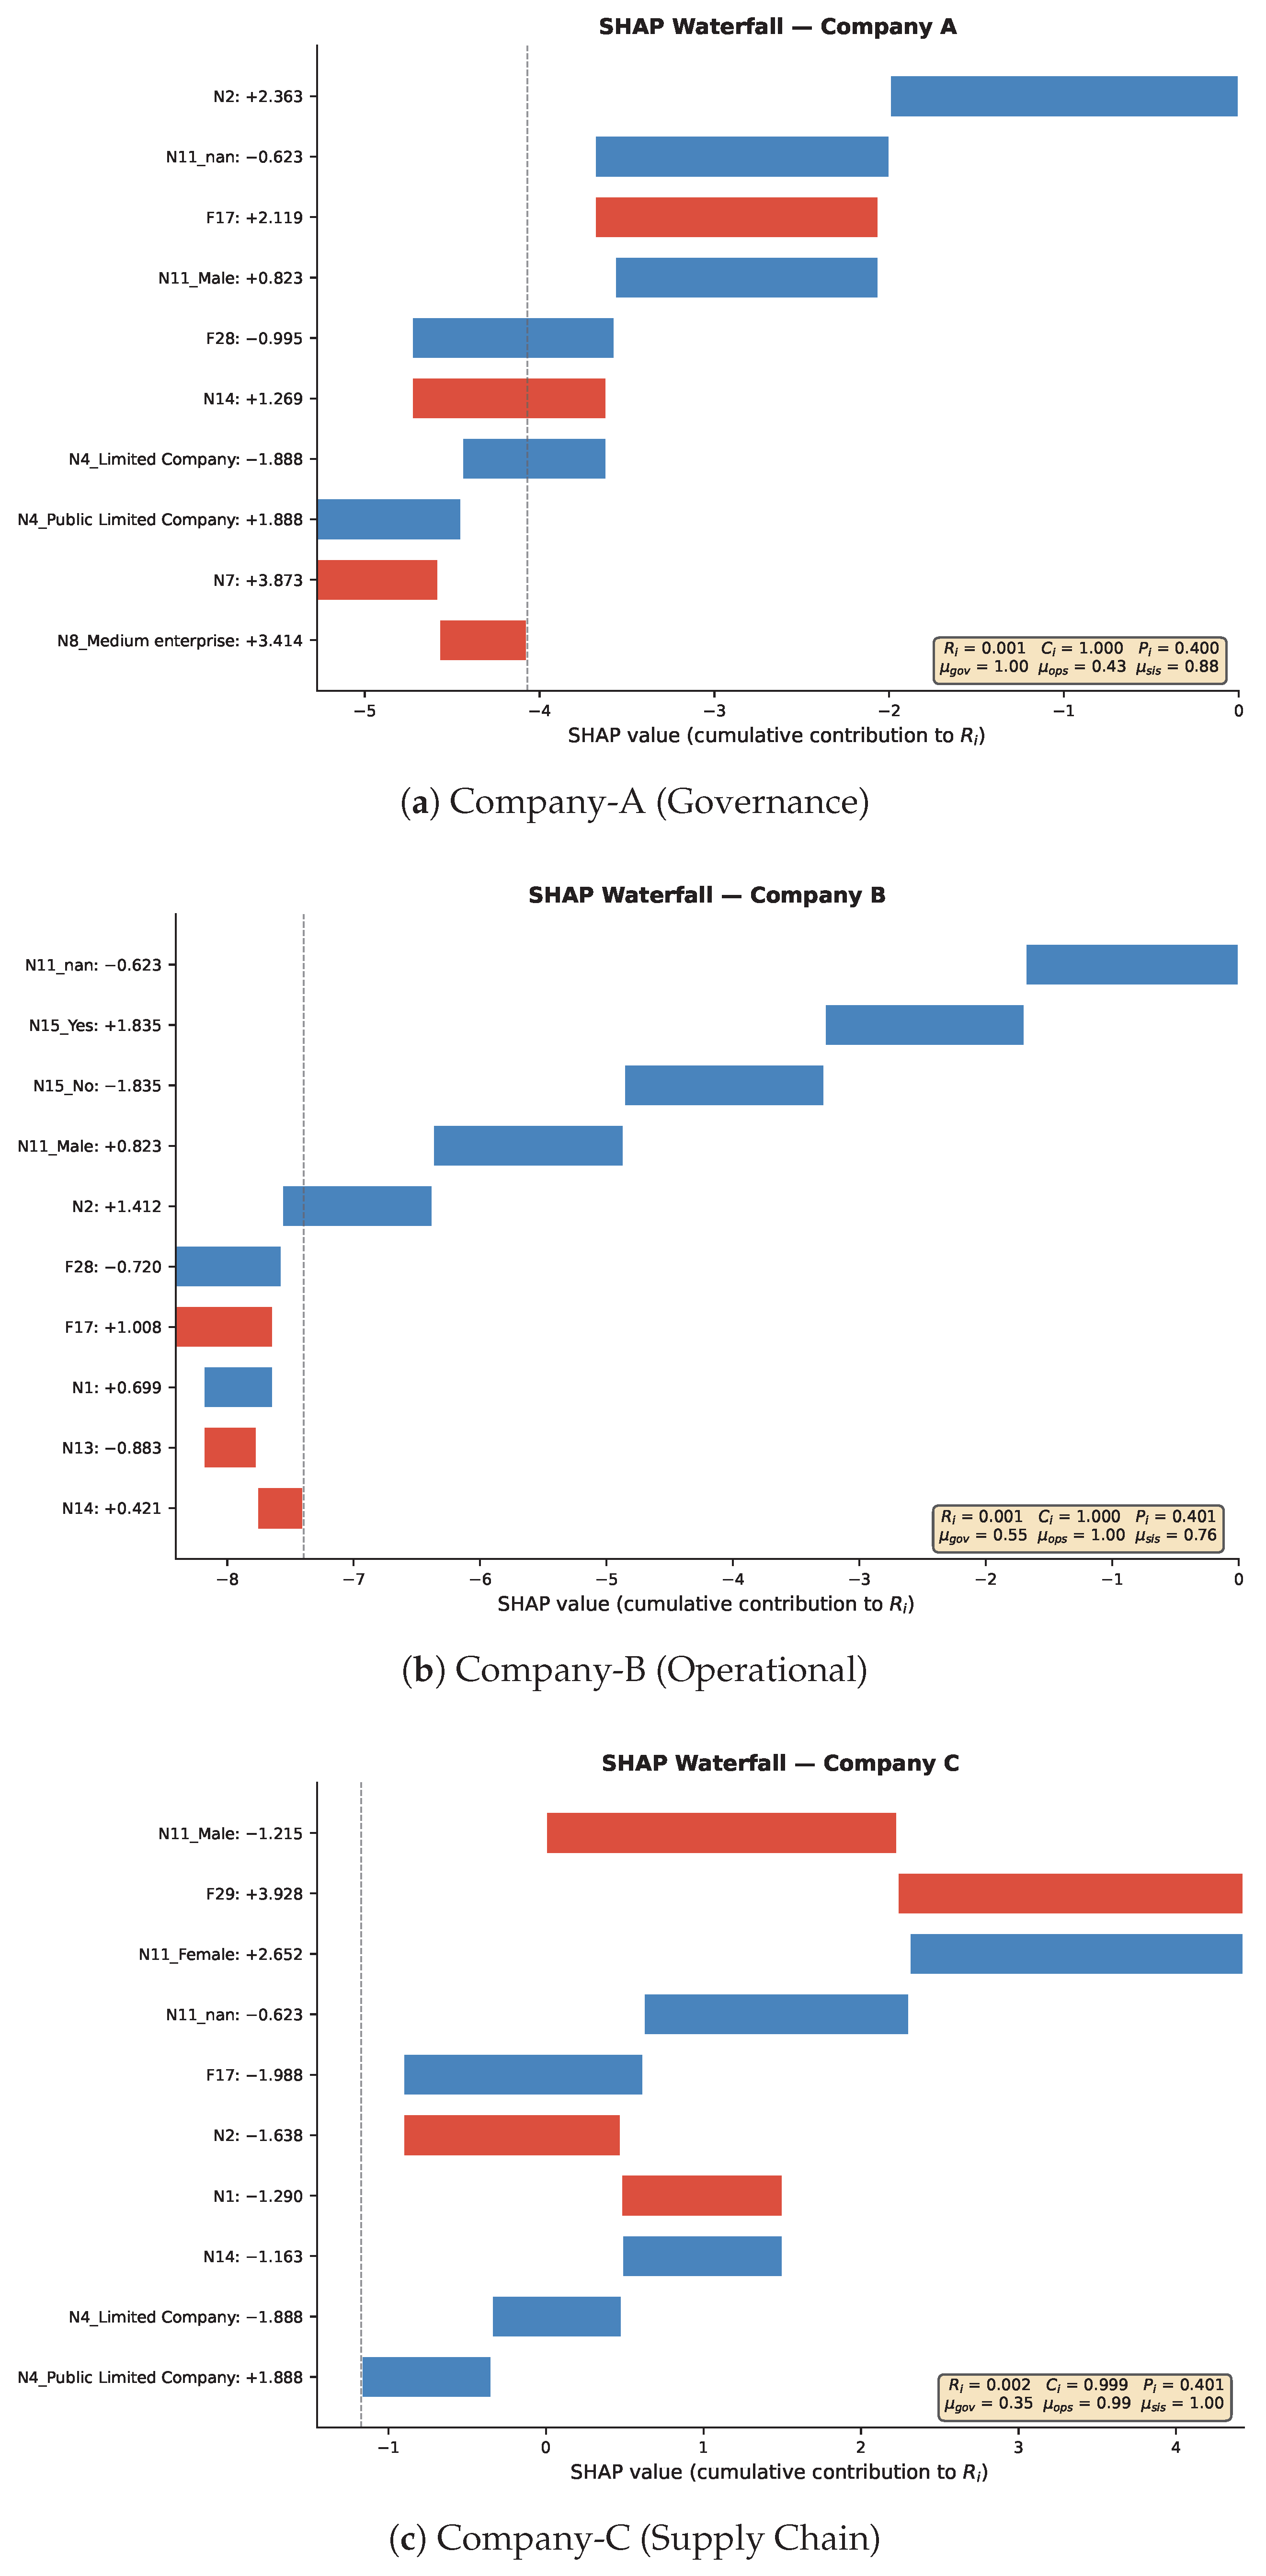
Table 7 presents three representative cases where the technical risk is marginal (≈0.001), which in a monolithic system would classify the firm as “safe”. However, the Contextual Modulator raises the calibrated risk to ≈0.400 due to specific structural vulnerabilities.
Figure 14 show the local SHAP decomposition for these three firms. Red bars indicate positive contributions to risk and blue bars indicate negative contributions.
- Company-A (Governance dominant): Despite a low , the system detects severe opacity. The generated justification is: “The base technical risk is low (), but the final calibrated risk is 0.400 due to governance and opacity risk (severe information opacity or unfavorable audit opinion)”.
- Company-B (Operational dominant): The system identifies negative cash flow. Justification: “…due to operational unviability risk and supply chain fragility (negative operating cash flow, insufficient EBITDA margins)”.
- Company-C (Supply chain dominant): High dependence on trade credit is detected, 903 elevating the risk despite historical technical solvency.
Figure 14.
Local SHAP decomposition (Waterfall) for three dominant contextual vulnerability profiles.
4.4.3. Implications for AI Governance and Traceability
The integration of this two-level explainability scheme places our cooperative strategy in strict compliance with emerging Artificial Intelligence governance requirements. In particular, Regulation (EU) 2024/1689 (Artificial Intelligence Act) [34] classifies credit evaluation and financial risk systems as “high-risk”, demanding high levels of transparency, technical robustness, comprehensive documentation, and effective human oversight [9].
By providing both global explainability (via the surrogate model and SHAP) and local contextual explainability (via structured justifications), the system not only satisfies the growing “right to explanation” but also proactively mitigates the risk of algorithmic biases and facilitates external auditing. A key design choice of this implementation is the decision to avoid generative language models (LLMs) for drafting justifications. While LLMs offer fluency, they introduce risks of hallucination and lack of deterministic reproducibility. Instead, the use of structured templates directly linked to the Contextual Modulator outputs () ensures complete and auditable traceability of each decision.
From a human–computer interaction perspective, this duality transforms the system output: it is no longer an abstract probability, but a calibrated and justifiable risk profile. This significantly reduces the cognitive load of the financial analyst or public manager, who can validate the system’s recommendation by contrasting the natural language justification with their expert domain knowledge [25]. Thus, the XAI layer acts as the bridge between the computational complexity of the cooperative decision core and the operational need for trust, legitimacy, and accountability, laying the groundwork for the discussion of the real adoption of these systems in regulated environments addressed in Section 5.
5. Discussion
The results of this study provide empirical support for the central hypothesis that the transition from monolithic predictive models toward cooperative decision ecosystems, grounded in the CADEMAS framework, significantly improves robustness, contextual adaptability, and traceability in SME insolvency prediction. Below, these findings are discussed in light of the existing literature, their practical implications, the study’s limitations, and future research directions.
5.1. Interpretation of Algorithmic Cooperation and Predictive Robustness
Unlike traditional ensemble learning approaches, which merely seek to maximize statistical accuracy by averaging errors, the Decision Integration Layer (OM) in our architecture acts as a structural variance stabilizer. Although deep models such as DeepHit dominate in probabilistic calibration (IBS ≈ 0.0179), they are expected to be more sensitive to data perturbations; the cooperative strategy (especially the inverse IBS-weighted average and the product of probabilities) is designed to mitigate this vulnerability by leveraging the orthogonality of individual biases: while a tree-based model (RSF) captures nonlinear interactions, a time-dependent proportional hazards model (Cox-Time) adjusts for financial maturation dynamics. We note that a formal stress test under observed concept shift was not conducted in the present study and therefore remains an open question for future work.
Importantly, the value of cooperation should not be interpreted solely in terms of outperforming the strongest individual model under the same test distribution. DeepHit achieves the best individual predictive performance in the present dataset, but reliance on a single architecture creates vulnerability to model-specific failure when the underlying data-generating process changes. The cooperative strategy addresses this limitation by combining models with different structural assumptions and inductive biases. Consequently, if the performance of one component deteriorates under novel data regimes or structural distributional shifts, the remaining models can partially compensate for that degradation. In this sense, cooperation acts as a robustness mechanism rather than merely as a performance-maximization strategy. The resulting ensemble therefore trades a marginal loss in peak discrimination, when compared with the best-performing individual model, for greater stability, diversification of model risk, and reduced dependence on a single algorithmic paradigm. This trade-off is consistent with the CADEMAS framework’s core premise: moving from isolated predictive models toward cooperative decision ecosystems whose outputs remain reliable, auditable, and operationally useful even when individual components face novel or degraded data scenarios.
The failure of the Stackingstrategy observed in our experiments echoes the literature’s warnings about collinearity in meta-models when the outputs of base models are highly correlated [10]. By opting for transparent aggregation strategies, our cooperative strategy marginally sacrifices the theoretical maximum discrimination peak (C-index) in exchange for a stable calibration guarantee. This trade-off is essential and often overlooked in high-stakes financial decision-making, where consistency is more valuable than extreme local optimization.
The comparative evidence also helps position the proposed strategy with respect to previous bankruptcy-prediction research. Studies based on machine-learning classifiers and stacking ensembles have generally emphasized gains in discriminatory accuracy relative to classical statistical models [14,15,17,19]. Our results are consistent with this broader literature in showing that nonlinear and ensemble-based approaches can outperform conventional specifications. However, the present findings also reveal an important limitation of an accuracy-centered comparison: the method with the highest local discrimination is not necessarily the one offering the best combination of calibration, stability, transparency, and model diversification.
This distinction is particularly visible in the comparison between DeepHit, Brier Opt, and the cooperative aggregations. DeepHit provides the strongest individual calibration, while direct optimization of the Brier objective collapses to DeepHit alone. In contrast, inverse-IBS weighted averaging and probability-product aggregation retain contributions from heterogeneous models and achieve slightly higher discrimination than DeepHit, at the cost of a modest deterioration in IBS. Relative to conventional ensemble approaches, the contribution of the cooperative framework therefore lies not only in combining predictions but in explicitly managing the trade-off between predictive performance, diversification of model risk, and traceability.
5.2. The Critical Role of Contextual Modulation
The most distinctive finding of this work lies in the behavior of the Contextual Modulator (Layer C). In the traditional literature, insolvency is treated as a purely financial-historical event. However, our results demonstrate that technical risk () and contextual risk () are statistically orthogonal ( at the 5-year operating horizon). This confirms that the modulator does not merely amplify the noise of survival models, but provides new and complementary information about the firm’s structural fragility.
The contextual component also differentiates the proposed approach from conventional insolvency models that rely exclusively on historical financial information. The low correlation between technical and contextual risk indicates that governance opacity, operational inviability, and supply-chain fragility contribute information that is not merely a reformulation of the survival-model signal. This result supports the use of a separate contextual layer rather than incorporating all contextual variables indiscriminately into a single black-box predictor. In this respect, the proposed architecture shifts the role of contextual information from improving statistical fit to supporting an explicitly auditable adjustment of the technical decision.
The application of the variance-matching transformation (VarMatch) was essential to prevent the prevalence of structural vulnerabilities from artificially dominating the risk equation. Under this recalibration, firms exhibiting adverse structural signals receive upward adjustments (), whereas firms whose contextual profile is benign relative to the reference population receive downward corrections (), leaving the mean risk essentially unchanged. In an environment where bankruptcy is a rare event (global interval event rate ), the mean technical risk is marginal, so any detected signal of information opacity or operational inviability must act as a risk elevation factor for the affected firm. This early-warning property helps prevent serious false negatives, aligning the system’s output with the observed structural and operational conditions and overcoming the algorithmic determinism criticized in automated decision frameworks [10,24].
From an operational perspective, these findings should be interpreted together with the scope and computational characteristics of the proposed system. The cooperative architecture is conceptually transferable, but the contextual layer reflects the institutional and empirical characteristics of the environment in which it is calibrated. Consequently, international deployment would require local recalibration of contextual variables and membership functions. Similarly, the current modulator is deliberately static and auditable rather than dynamically learned from unstructured information. Finally, although some of the survival architectures involve substantial offline training costs, routine inference remains computationally inexpensive. These characteristics define the current boundary between predictive sophistication, contextual adaptability, transparency, and operational feasibility.
5.3. Explainability (XAI) as a Bridge Between Complexity and Ease of Use for Management
The integration of XAI via a surrogate model (ElasticNet) [35] successfully addressed the computational barrier of applying methods such as SHAP Kernel [33] directly on ensembles of deep neural networks. Beyond technical validation, local explainability revealed financially counterintuitive yet logical patterns, such as the association between a high acid-test ratio and increased risk (hoarding effect or defensive cash accumulation).
As noted by Almtrf (2025) and Kostopoulos et al. (2024) [9,25], mere accuracy does not guarantee the adoption of a Decision Support System (DSS). By translating contextual calibration into natural language justifications through structured templates (deliberately avoiding the use of generative LLMs that could introduce hallucinations), the system reduces the analyst’s cognitive load [27]. This transforms the output from an abstract probability into an auditable risk profile, satisfying the transparency requirements and the “right to explanation” demanded by emerging regulatory frameworks, such as the EU Artificial Intelligence Act.
5.4. Practical Implications
The proposed cooperative strategy has several practical implications for financial institutions, credit-risk analysts, auditors, and public-policy organizations. First, the system separates predictive estimation from contextual decision adjustment. This allows institutions to retain validated quantitative survival models while making the effect of non-financial structural vulnerabilities explicit rather than embedding them invisibly within a single opaque predictor.
Second, the cooperative layer reduces operational dependence on one model architecture. In practice, this is relevant when model performance changes across sectors, time periods, or economic conditions. The final decision is based on a diversified set of survival signals, and the contribution of each model remains traceable under transparent aggregation strategies.
Third, the Contextual Modulator can support prioritization rather than automatic decision replacement. A firm with low historical technical risk but severe governance, operational, or supply-chain vulnerability can be flagged for additional human review. The system should therefore be interpreted as a decision-support mechanism that identifies cases requiring attention rather than as an autonomous substitute for professional judgment.
Finally, the two-level explainability mechanism provides an audit trail for both the predictive and contextual components of the decision. This is particularly relevant in regulated financial environments, where institutions must be able to explain why a firm was classified as risky, which variables contributed to the technical estimate, and which contextual vulnerability caused any subsequent adjustment. These characteristics may facilitate model governance, internal validation, and communication with human decision-makers.
5.5. Limitations of the Study
Despite the promising results, this study has certain limitations that must be acknowledged for a correct interpretation of the findings:
- Geographic and Institutional Generalizability: The empirical validation relies exclusively on data from the Spanish Commercial Registry. Therefore, although the cooperative architecture itself is designed to be transferable across institutional contexts, the parametrization of the Contextual Modulator should not be assumed to generalize automatically to other economies. In particular, the contextual variables, membership functions, thresholds, and relative weights may reflect specific characteristics of the Spanish regulatory framework, reporting practices, and SME structure. Deployment in other countries would consequently require recalibration using local empirical distributions and, where appropriate, expert knowledge reflecting the corresponding institutional, regulatory, and socioeconomic environment. Accordingly, the present results demonstrate the feasibility and performance of the proposed architecture in the Spanish context rather than universal validity of its current contextual parametrization.
- Static Nature of the Contextual Modulator: In its current implementation, the contextual dimensions (, , ) and their membership functions are defined ex ante using structured variables, empirical percentiles, and limited expert knowledge, which intervenes only in the mapping of (Table 1) and the conceptual definition of the dimensions. Consequently, the Contextual Modulator does not dynamically learn new contextual relationships or automatically update its configuration in response to newly available information. In particular, unstructured sources such as financial news, free-text audit reports, judicial decisions, or regulatory announcements are not currently incorporated into the modulation process. The present implementation therefore prioritizes transparency, reproducibility, and auditability over adaptive contextual learning. This design choice facilitates the interpretation of the resulting adjustments but limits the system’s capacity to react automatically to emerging qualitative information that may anticipate changes in an SME’s risk profile.
- Computational Cost and Retraining Requirements: The computational profile of the proposed system differs substantially between the training and operational phases. Complex architectures such as DeepHit require considerably greater computational effort during model estimation than during inference. However, training and calibration are performed offline and do not need to be repeated for each prediction, whereas inference constitutes the online operational stage of the DSS. Therefore, the principal computational limitation concerns periodic model updating rather than routine prediction. This distinction makes the architecture operationally feasible in settings in which models are retrained periodically. Nevertheless, environments characterized by rapid concept drift, frequent data updates, or requirements for continuous model recalibration could impose substantial computational demands. In such settings, the cost of retraining complex survival architectures may constitute a barrier for institutions with limited IT infrastructure.
5.6. Future Work Directions
To address these limitations and expand the scope of our cooperative strategy, future research will focus on three main directions:
- Integration of Unstructured Data and Dynamic Context Updating: Future research will investigate Natural Language Processing (NLP) mechanisms for extracting relevant contextual signals from unstructured sources, including financial news, free-text audit reports, judicial decisions, and regulatory information. These signals could be transformed into dynamic contextual variables and incorporated into the modulation layer, allowing the contextual risk profile () to evolve as new information becomes available. Such an extension would enable the system to complement periodically reported accounting information with more timely qualitative evidence. An important methodological requirement will be to preserve the transparency and traceability of the contextual adjustment, so that increased adaptiveness does not compromise the auditability of the decision process.
- User Experience (UX) Validation in Real Environments: Conduct empirical usability studies with risk analysts and public managers to quantify the reduction in cognitive load and improvement in decision-making speed when using the interactive prototype, following the GDSS evaluation protocols proposed by Sakka et al. (2019) [27].
- Extension to Other Temporal Decision Domains: Adapt the cooperative strategy of survival integration and contextual modulation to other high-impact problems, such as patient churn prediction in healthcare systems (clinical churn) or risk management in perishable supply chains, demonstrating the versatility of the tuple .
Cross-country validation will therefore constitute an important extension of this research. Future studies should evaluate the stability of the cooperative predictive architecture across different economies while separately recalibrating the contextual layer to reflect country-specific institutional and regulatory conditions.
6. Conclusions
This study develops and empirically evaluates a cooperative decision-support strategy for SME insolvency prediction that combines heterogeneous survival models, transparent aggregation, fuzzy contextual modulation, and two-level explainability.
The empirical results show substantial heterogeneity across the individual survival models. DeepHit achieved the strongest individual time-dependent discrimination (C-index = 0.9373) and the lowest IBS (0.0179), while Cox-Time and RSF also obtained time-dependent C-index values above 0.90. Cooperative integration produced a different performance profile. Inverse-IBS weighted averaging and the probability-product strategy achieved time-dependent C-index values of approximately 0.94, slightly above DeepHit, although with a modest deterioration in probabilistic calibration. Conversely, direct Brier-score optimization produced the best calibration but assigned all weight to DeepHit, illustrating the tension between single-model optimization and cooperative diversification.
The Contextual Modulator adds a second source of information to the technical survival signal. Technical and contextual risk showed a low Spearman correlation (approximately at the 5-year operating horizon, ranging from to across horizons), indicating that the contextual dimensions capture information that is largely complementary to the predictive models. The variance-matching transformation was required to align the scales of both components before calibration, and the sensitivity analysis of supports the use of 0.6 as a reference operating point for the present application rather than as a universally optimal value.
The XAI layer complements these results by providing separate explanations for the technical and contextual components of the decision. A surrogate ElasticNet model achieved a mean cross-validated AUC of 0.958 when approximating the technical risk signal, enabling efficient SHAP-based interpretation, while deterministic natural-language templates make the contextual adjustment traceable to the underlying vulnerability dimensions.
These findings indicate that the main benefit of the proposed architecture is not simply to maximize a single predictive metric. Rather, it provides a structured mechanism for combining heterogeneous predictive evidence, contextual vulnerability, and explainability within an auditable decision-support process. The system should therefore be interpreted as a tool for risk assessment and prioritization under human oversight rather than as an autonomous decision-maker.
Several limitations remain. The empirical validation is restricted to Spanish SMEs, so the contextual parametrization requires recalibration before application to other institutional settings. The current contextual mechanism relies on static structured variables and does not yet learn dynamically from unstructured information. Complex survival models also involve non-negligible offline retraining costs, which may constrain deployment in environments requiring frequent model updates. In addition, the current empirical study does not constitute a direct stress test under observed concept drift or a prospective evaluation with financial decision-makers.
Future research should therefore validate the framework across countries and economic periods, compare alternative fuzzy membership and aggregation mechanisms, incorporate dynamic contextual signals from unstructured information, evaluate computational strategies for efficient retraining, and conduct prospective user studies with analysts and public managers. These extensions would provide stronger evidence on the generalizability, operational value, and long-term robustness of the cooperative decision framework.
Author Contributions
Conceptualization, A.A.V.-S. and D.B.-C.; Methodology, A.A.V.-S. and D.B.-C.; Software, A.A.V.-S.; Validation, A.A.V.-S., D.B.-C., and C.C.C.; Formal analysis, A.A.V.-S. and D.B.-C.; Investigation, D.B.-C. and C.C.C.; Resources, C.C.C.; Data curation, A.A.V.-S.; Writing—original draft, A.A.V.-S.; Writing—review and editing, D.B.-C. and C.C.C.; Visualization, A.A.V.-S.; Supervision, D.B.-C. and C.C.C.; Project administration, C.C.C.; Funding acquisition, C.C.C. All authors have read and agreed to the published version of the manuscript.
Funding
This work was supported by project PID2023-146575NB-I00, funded by MICIU/AEI/10.13039/501100011033, including the European Regional Development Fund (ERDF), EU.
Data Availability Statement
The study utilizes a comprehensive longitudinal dataset obtained from the Spanish Commercial Registry (https://www.registradores.org/ accessed on 24 May 2023.) The source code, preprocessing scripts, and pipeline configuration are made available in a public repository to ensure reproducibility and external auditability (https://github.com/aavazquez-go/cooperative_automated_DM_with_contextual_modulation accessed on 22 September 2026).
Acknowledgments
We gratefully acknowledge the support of the Asociación Universitaria Iberoamericana de Postgrado (AUIP) and the Junta de Andalucía, España, for their institutional and financial support, which made this research possible.
Conflicts of Interest
The authors declare no conflicts of interest.
Abbreviations
The following abbreviations are used in this manuscript:
| ADM | Automated Decision-Making |
| AUC | Area Under the Curve |
| C-index | Concordance Index |
| CADEMAS | Cooperative Automated Decision-Making System |
| CADM | Cooperative Automated Decision-Making |
| Cox-CC | Cox Case-Control |
| CoxPH | Cox Proportional Hazards |
| Cox-Time | Cox Time-Dependent |
| DeepSurv | Deep Survival Networks |
| DSS | Decision Support System |
| EBITDA | Earnings Before Interest, Taxes, Depreciation, and Amortization |
| FCA | Fecha de Concurso de Acreedores (Date of Insolvency Filing) |
| GDSS | Group Decision Support System |
| IBS | Integrated Brier Score |
| IM | Input Manager |
| LIME | Local Interpretable Model-agnostic Explanations |
| LLM | Large Language Model |
| LSTM | Long Short-Term Memory |
| MAS | Multi-Agent System |
| MDA | Multiple Discriminant Analysis |
| MICE | Multiple Imputation by Chained Equations |
| ML | Machine Learning |
| NBLL | Negative Breslow Log-Likelihood |
| NLP | Natural Language Processing |
| OM | Output Manager |
| PH | Proportional Hazards |
| RSF | Random Survival Forest |
| SHAP | SHapley Additive exPlanations |
| SME | Small and Medium Enterprise |
| EU | European Union |
| XAI | Explainable Artificial Intelligence |
References
- CEPYME. Indicador CEPYME sobre la Situación de la Pyme; Technical Report; Confederación Española de la Pequeña y Mediana Empresa (CEPYME): Madrid, Spain, 2025; Available online: https://cepyme.es/storage/2025/10/indicador-cepyme-2T_2025_DEF.pdf (accessed on 16 September 2026).
- Ministerio de Industria, Comercio y Turismo. Cifras PYME. Datos junio 2023; Ministerio de Industria, Comercio y Turismo: Madrid, Spain, 2023. Available online: https://ipyme.org/Publicaciones/Cifras%20PYME/CifrasPYME-junio2023.pdf (accessed on 2 June 2023).
- Ministerio de Industria, Comercio y Turismo. Cifras PYME. Datos abril 2024; Ministerio de Industria, Comercio y Turismo: Madrid, Spain, 2024. Available online: https://ipyme.org/Publicaciones/Cifras%20PYME/CifrasPYME-abril2024.pdf (accessed on 23 April 2024).
- Gómez Asensio, C. La Directiva (UE) 2019/1023 Sobre Marcos de Reestructuración Preventiva y Su Futura Transposición al Ordenamiento Jurídico Español. Actual. Jur. Iberoam. 2020, 12, 472–511. [Google Scholar]
- World Bank Group. Report on the Treatment of MSME Insolvency (English); Technical Report; World Bank Group: Washington, DC, USA, 2017. [Google Scholar] [CrossRef] [Scilit]
- Devi, S.S.; Radhika, Y. A Survey on Machine Learning and Statistical Techniques in Bankruptcy Prediction. Int. J. Mach. Learn. Comput. 2018, 8, 133–139. [Google Scholar] [CrossRef] [Scilit]
- Wang, P.; Li, Y.; Reddy, C.K. Machine Learning for Survival Analysis: A Survey. ACM Comput. Surv. 2019, 51, 110:1–110:36. [Google Scholar] [CrossRef] [Scilit]
- Coussement, K.; Abedin, M.Z.; Kraus, M.; Maldonado, S.; Topuz, K. Explainable AI for Enhanced Decision-Making. Decis. Support Syst. 2024, 184, 114276. [Google Scholar] [CrossRef] [Scilit]
- Kostopoulos, G.; Davrazos, G.; Kotsiantis, S. Explainable Artificial Intelligence-Based Decision Support Systems: A Recent Review. Electronics 2024, 13, 2842. [Google Scholar] [CrossRef] [Scilit]
- Novoa-Hernández, P.; Pelta, D.A.; Godz, M.; Verdegay, J.L.; Buendía Carrillo, D. CADEMAS—A Framework for Cooperative Automated Decision-Making Systems. In Proceedings of the IEEE IV Conference on Artificial Intelligence (CAI); IEEE: New York, NY, USA, 2026; pp. 756–761. [Google Scholar] [CrossRef] [Scilit]
- Oh, N.K. Financial Distress Prediction Models for Wind Energy SMEs. Int. J. Contents 2014, 10, 75–82. [Google Scholar] [CrossRef] [Scilit]
- Ma’aji, M.M.; Abdullah, N.A.H.; Khaw, K.L.H. Predicting Financial Distress among Smes in Malaysia. Eur. Sci. J. 2018, 14, 91–102. [Google Scholar] [CrossRef] [Scilit]
- Navarro Galera, A.; Gómez Miranda, M.E.; Lara Rubio, J.; Buendía Carrillo, D. Empirical Research to Identify Early Warning Indicators of Insolvency in Small and Medium-Sized Enterprises (SMEs). Rev. Contab. 2024, 27, 344–356. [Google Scholar] [CrossRef] [Scilit]
- Shetty, S.; Musa, M.; Brédart, X. Bankruptcy Prediction Using Machine Learning Techniques. J. Risk Financ. Manag. 2022, 15, 35. [Google Scholar] [CrossRef] [Scilit]
- H, M.K.; N, V.; V, A.; Hemprasad, M.S.; Sharatkumara. FINNET: A Hybrid Deep Learning Network Analysis and Ensemble Learning Model for Financial Distress Prediction. Int. Res. J. Adv. Eng. Hub (IRJAEH) 2025, 3, 4187–4195. [Google Scholar] [CrossRef] [Scilit]
- Kvamme, H.; Borgan, Ø.; Scheel, I. Time-to-Event Prediction with Neural Networks and Cox Regression. J. Mach. Learn. Res. 2019, 20, 1–30. [Google Scholar]
- Muslim, M.A.; Dasril, Y. Company Bankruptcy Prediction Framework Based on the Most Influential Features Using XGBoost and Stacking Ensemble Learning. Int. J. Electr. Comput. Eng. (IJECE) 2021, 11, 5549–5557. [Google Scholar] [CrossRef] [Scilit]
- Chen, X.; Wu, C.; Zhang, Z.; Liu, J. Multi-Class Financial Distress Prediction Based on Stacking Ensemble Method. Int. J. Financ. Econ. 2025, 30, 2369–2388. [Google Scholar] [CrossRef] [Scilit]
- Muniappan, M.; Paruvachi Subramanian, N.D. A Majority Voting Mechanism-Based Ensemble Learning Approach for Financial Distress Prediction in Indian Automobile Industry. J. Risk Financ. Manag. 2025, 18, 197. [Google Scholar] [CrossRef] [Scilit]
- Liu, W.; Suzuki, Y.; Du, S. Ensemble Learning Algorithms Based on Easyensemble Sampling for Financial Distress Prediction. Ann. Oper. Res. 2025, 346, 2141–2172. [Google Scholar] [CrossRef] [Scilit]
- Gnip, P.; Kanasz, R.; Zoričak, M.; Drotar, P. An Experimental Survey of Imbalanced Learning Algorithms for Bankruptcy Prediction. Artif. Intell. Rev. 2025, 58, 104. [Google Scholar] [CrossRef] [Scilit]
- Zhang, J.; Cheng, L.; Wang, H. A Multi-Agent-Based Decision Support System for Bankruptcy Contagion Effects. Expert Syst. Appl. 2012, 39, 5920–5934. [Google Scholar] [CrossRef] [Scilit]
- Fnu, H.; Kaushik, K.; Gaur, P.; Saratchandran, D.V.; Thapliyal, A.G.; Sidhu, K.S.; Singh, V. Multi-Agent Systems for Collaborative Financial Decision-Making over Distributed Network Architectures. In Proceedings of the 2025 3rd International Conference on Advancement in Computation & Computer Technologies (InCACCT); IEEE: New York, NY, USA, 2025; pp. 939–944. [Google Scholar] [CrossRef] [Scilit]
- Pérez-Cañedo, B.; Porras, C.; Pelta, D.A.; Verdegay, J.L. Modeling Contexts as Fuzzy Propositions in Optimization Problems. IEEE Trans. Fuzzy Syst. 2023, 31, 1474–1483. [Google Scholar] [CrossRef] [Scilit]
- Almtrf, A.A. Integrating Explainable AI (XAI) into Decision Support Systems: A Framework for Enhancing Transparency and Trust in Managerial Decision-Making. Int. J. Manag. Stud. Res. 2025, 13, 9–22. [Google Scholar] [CrossRef] [Scilit]
- Ando, R.; Kawamata, Y.; Takeda, T.; Okada, Y. An Explainable Framework Based on Counterfactual Explanations for Multi-Class Financial Distress Prediction of Small and Medium Enterprises. In Proceedings of the 2024 IEEE International Conference on Big Data (BigData); IEEE: New York, NY, USA, 2024; pp. 2269–2274. [Google Scholar] [CrossRef] [Scilit]
- Sakka, A.; Bosetti, G.; Grigera, J.; Camilleri, G.; Fernández, A.; Zaraté, P.; Bimonte, S.; Sautot, L. UX Challenges in GDSS: An Experience Report. In Proceedings of the Group Decision and Negotiation: Behavior, Models, and Support; Morais, D.C., Carreras, A., de Almeida, A.T., Vetschera, R., Eds.; Lecture Notes in Business Information Processing; Springer: Cham, Switzerland, 2019; Volume 351, pp. 67–79. [Google Scholar] [CrossRef] [Scilit]
- Carneiro, J.; Alves, P.; Marreiros, G.; Novais, P. Group Decision Support Systems for Current Times: Overcoming the Challenges of Dispersed Group Decision-Making. Neurocomputing 2021, 423, 735–746. [Google Scholar] [CrossRef] [Scilit]
- Cox, D.R. Regression Models and Life-Tables. J. R. Stat. Soc. Ser. B (Methodol.) 1972, 34, 187–202. [Google Scholar] [CrossRef] [Scilit]
- Katzman, J.L.; Shaham, U.; Cloninger, A.; Bates, J.; Jiang, T.; Kluger, Y. DeepSurv: Personalized Treatment Recommender System Using a Cox Proportional Hazards Deep Neural Network. BMC Med. Res. Methodol. 2018, 18, 24. [Google Scholar] [CrossRef] [Scilit] [PubMed]
- Lee, C.; Zame, W.; Yoon, J.; van der Schaar, M. DeepHit: A Deep Learning Approach to Survival Analysis With Competing Risks. Proc. AAAI Conf. Artif. Intell. 2018, 32, 2314–2321. [Google Scholar] [CrossRef] [Scilit]
- Ishwaran, H.; Kogalur, U.B.; Blackstone, E.H.; Lauer, M.S. Random Survival Forests. Ann. Appl. Stat. 2008, 2, 841–860. [Google Scholar] [CrossRef] [Scilit]
- Lundberg, S.M.; Lee, S.I. A Unified Approach to Interpreting Model Predictions. In Proceedings of the Advances in Neural Information Processing Systems; Curran Associates Inc.: Red Hook, NY, USA, 2017; Volume 30, pp. 4765–4774. Available online: https://proceedings.neurips.cc/paper_files/paper/2017/file/8a20a8621978632d76c43dfd28b67767-Paper.pdf (accessed on 16 September 2026).
- European Parliament and the Council. Regulation (EU) 2024/1689 of the European Parliament and of the Council of 13 June 2024 Laying down Harmonised Rules on Artificial Intelligence and Amending Regulations (EC) No 300/2008, (EU) No 167/2013, (EU) No 168/2013, (EU) 2018/858, (EU) 2018/1139 and (EU) 2019/2144 and Directives 2014/90/EU, (EU) 2016/797 and (EU) 2020/1828 (Artificial Intelligence Act) (Text with EEA Relevance). Off. J. Eur. Union 2024, L 2024/1689, 1–144. [Google Scholar]
- Zou, H.; Hastie, T. Regularization and variable selection via the elastic net. J. R. Stat. Soc. Ser. B Stat. Methodol. 2005, 67, 301–320. [Google Scholar] [CrossRef] [Scilit]
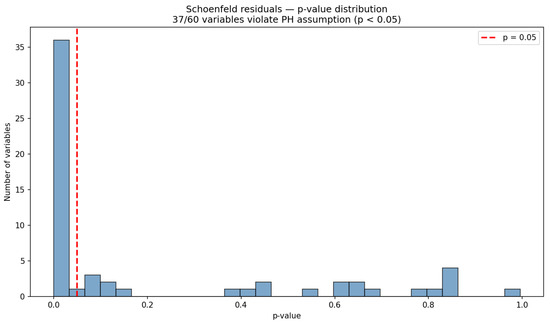
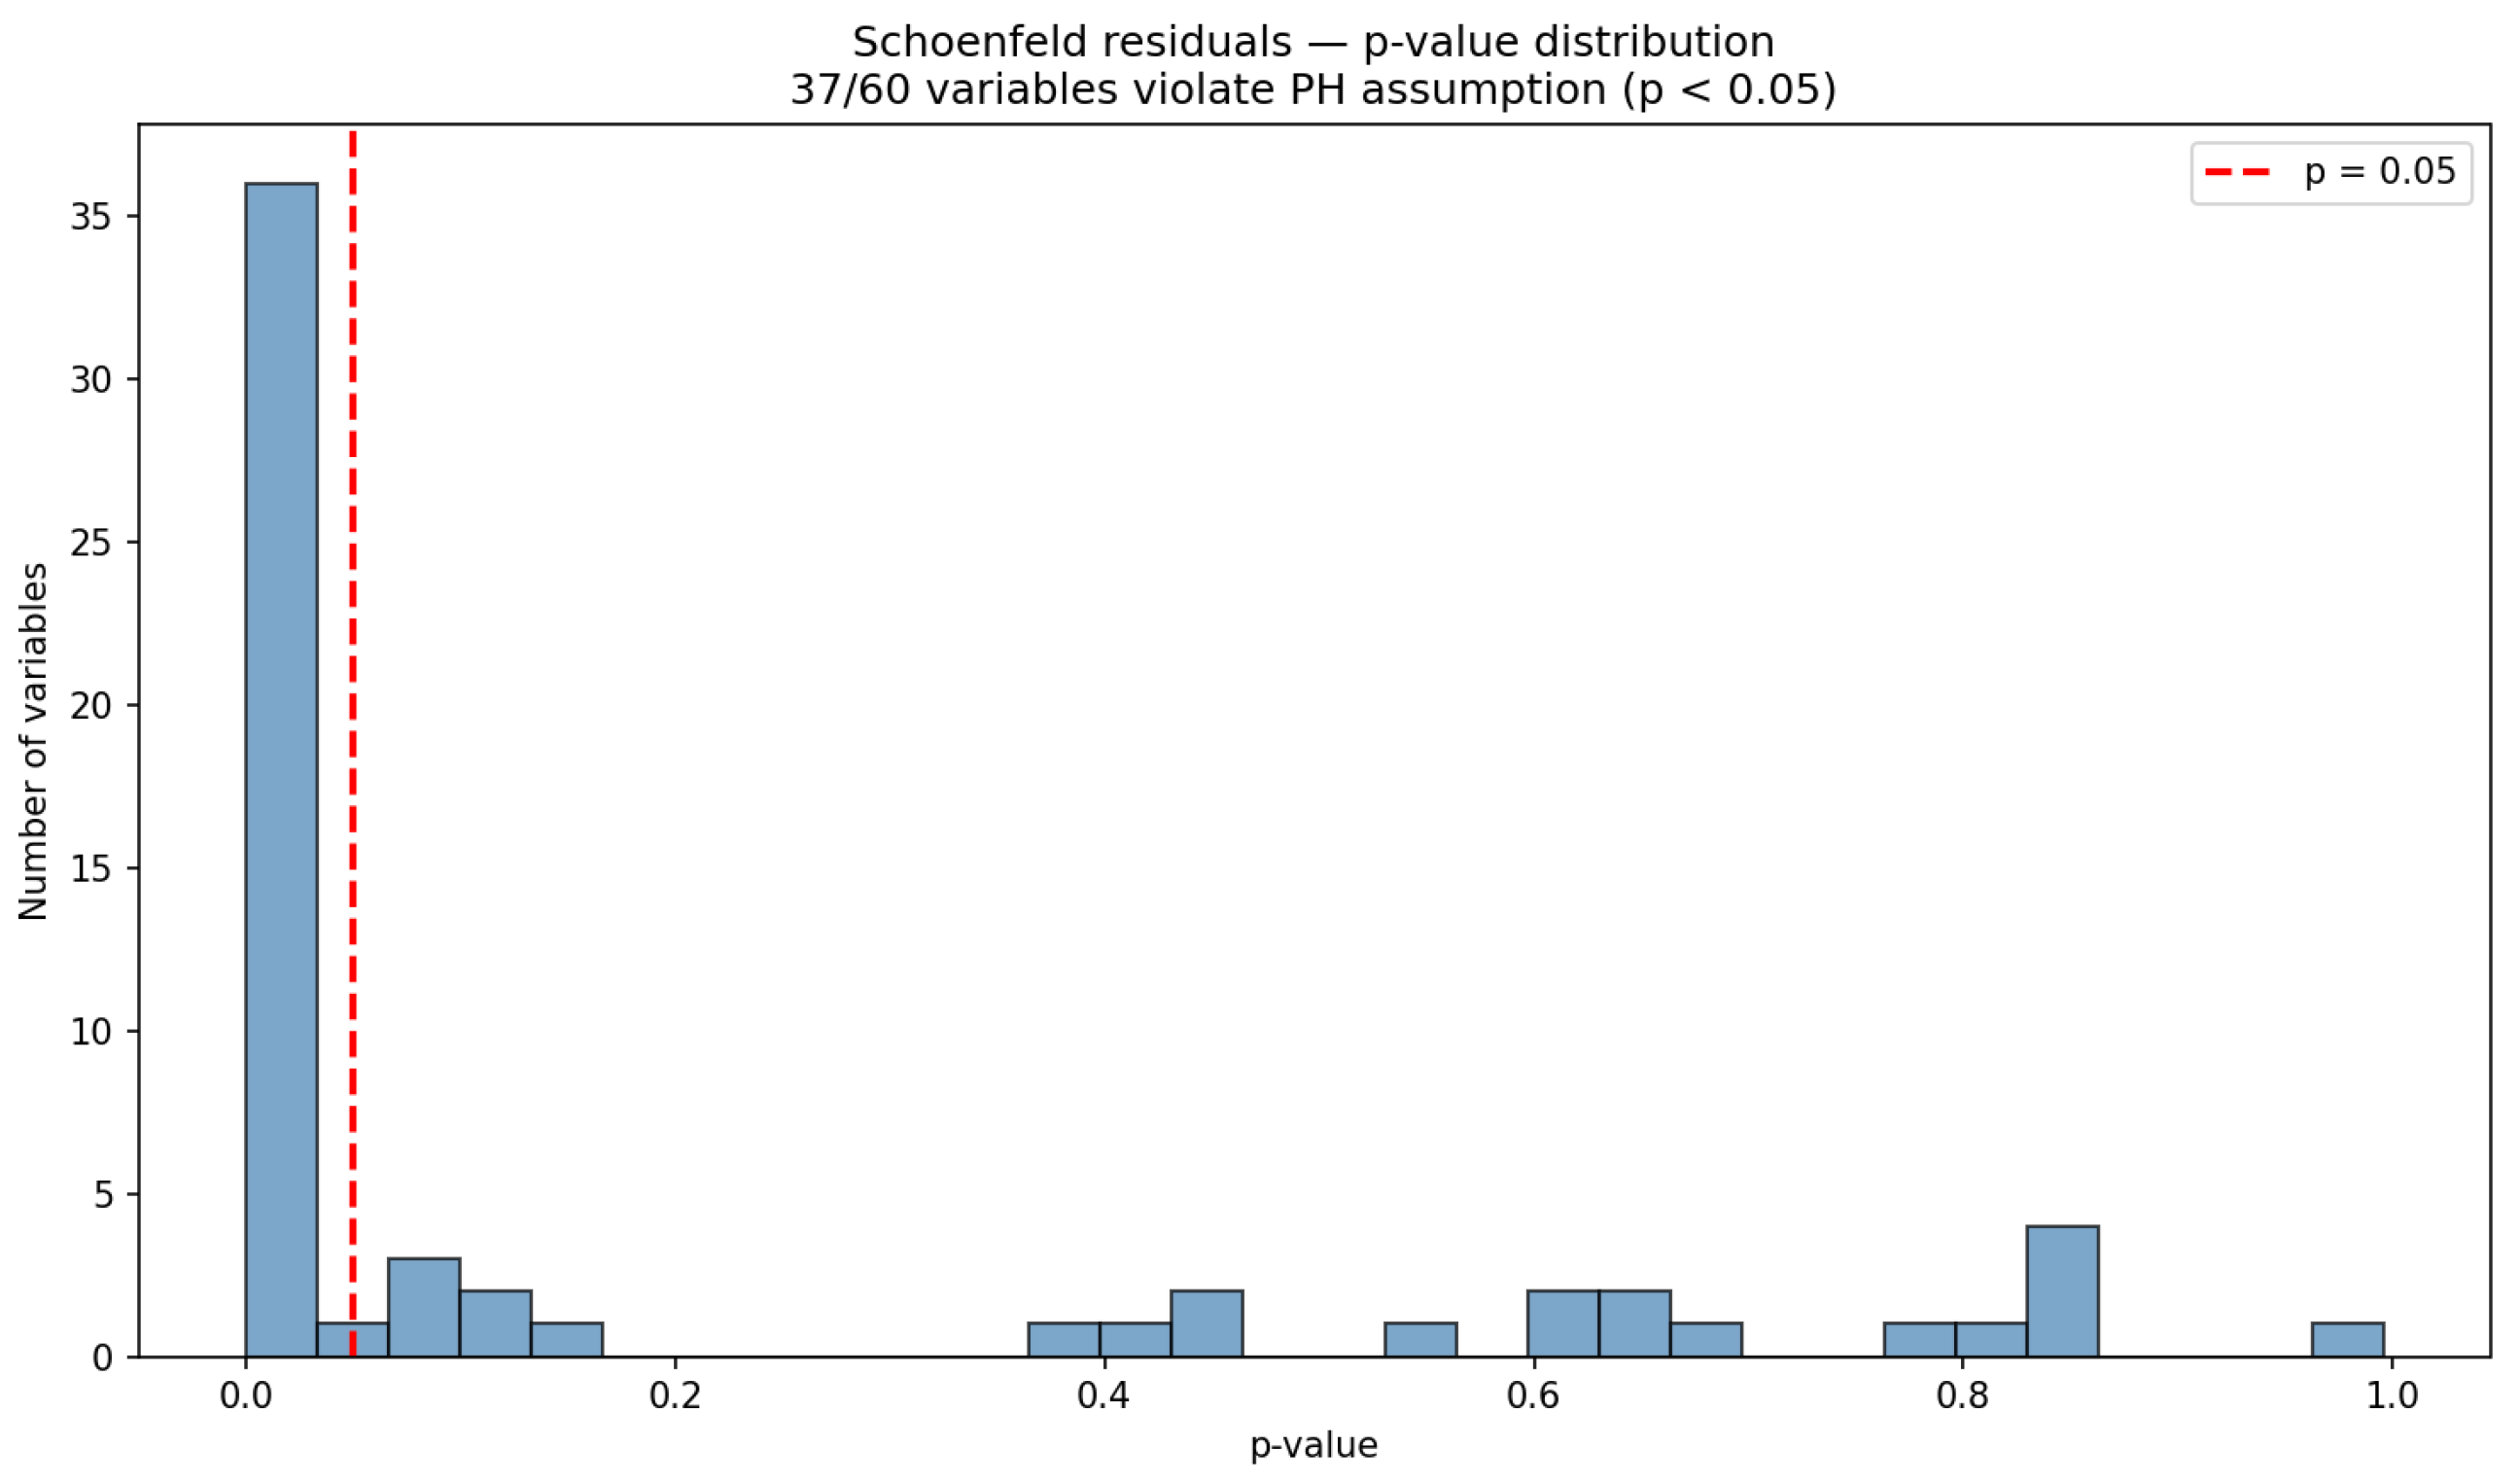
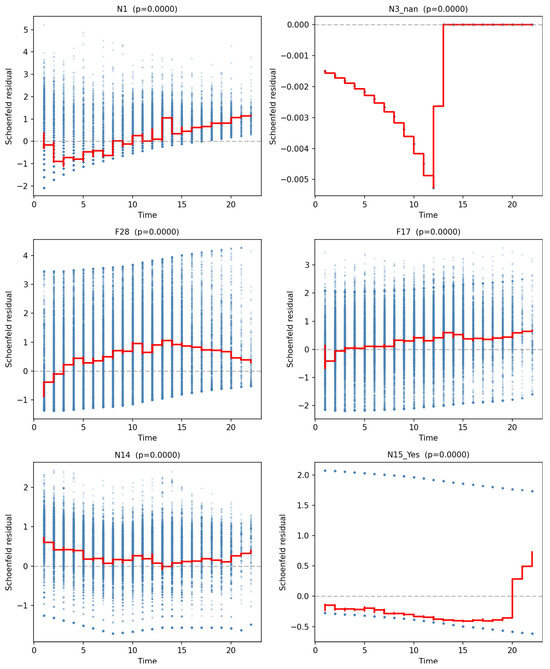
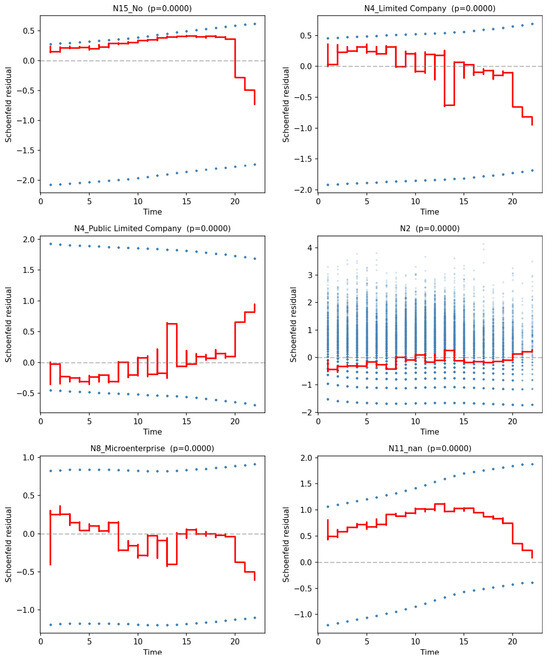
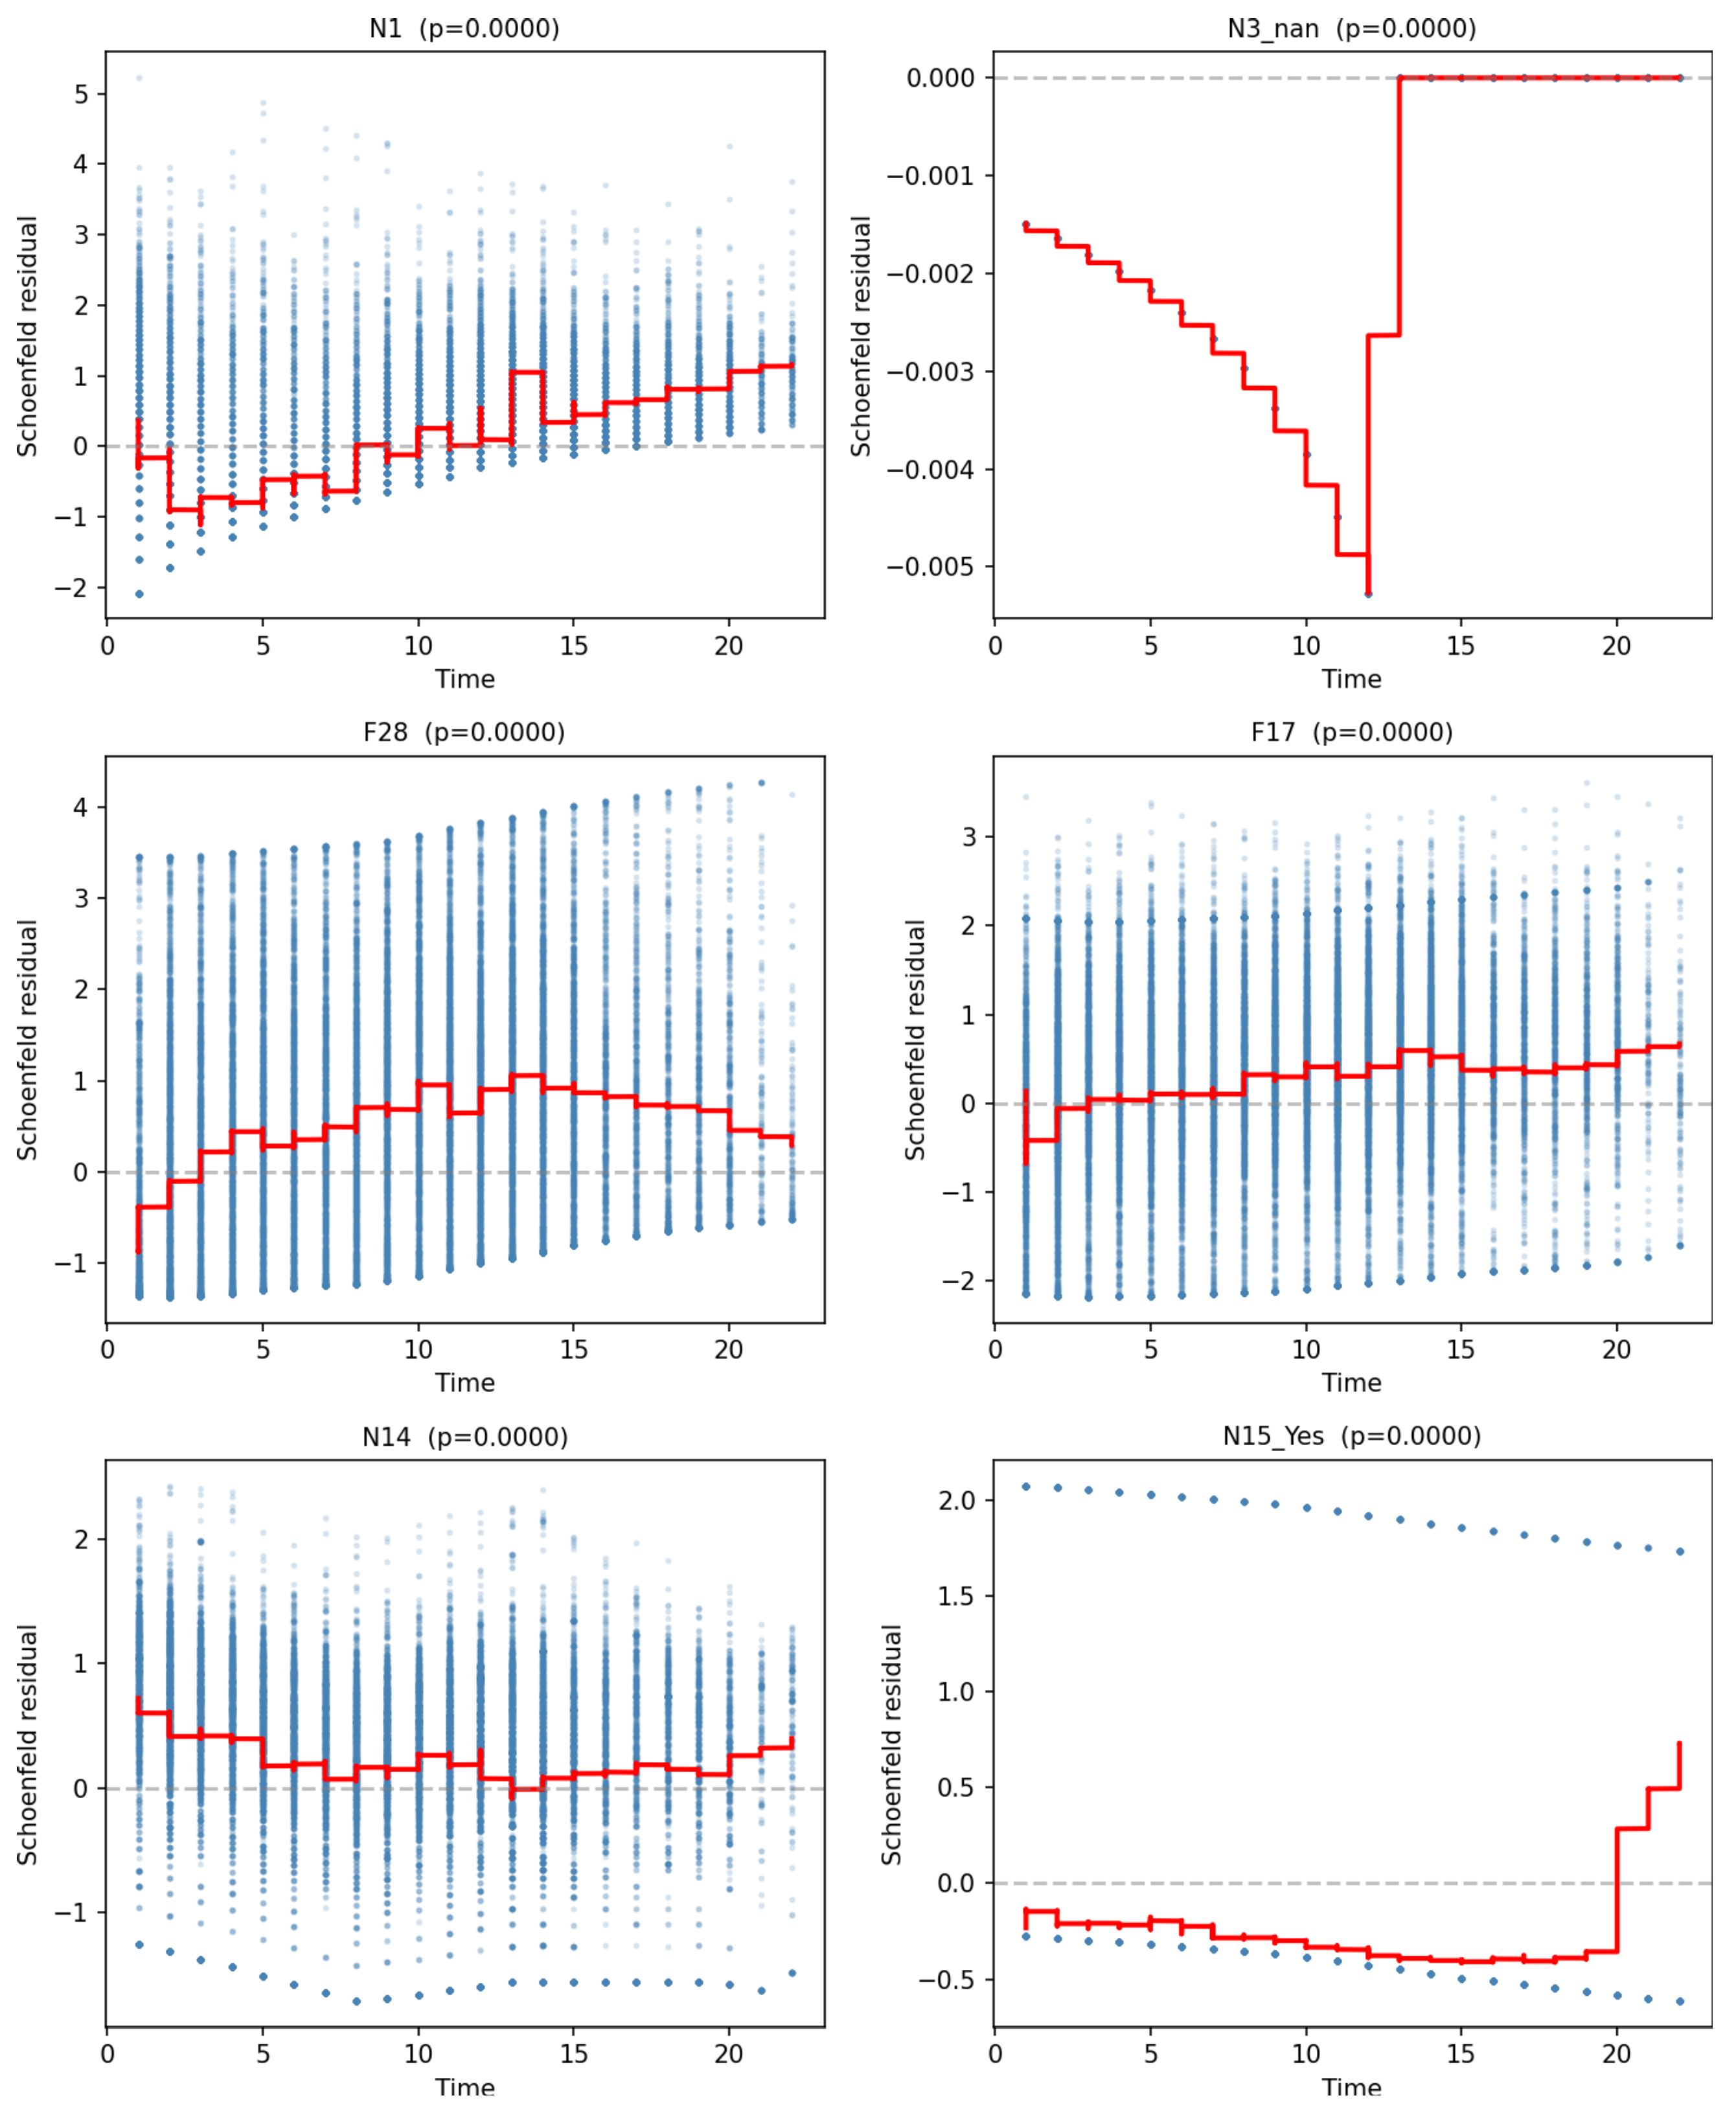
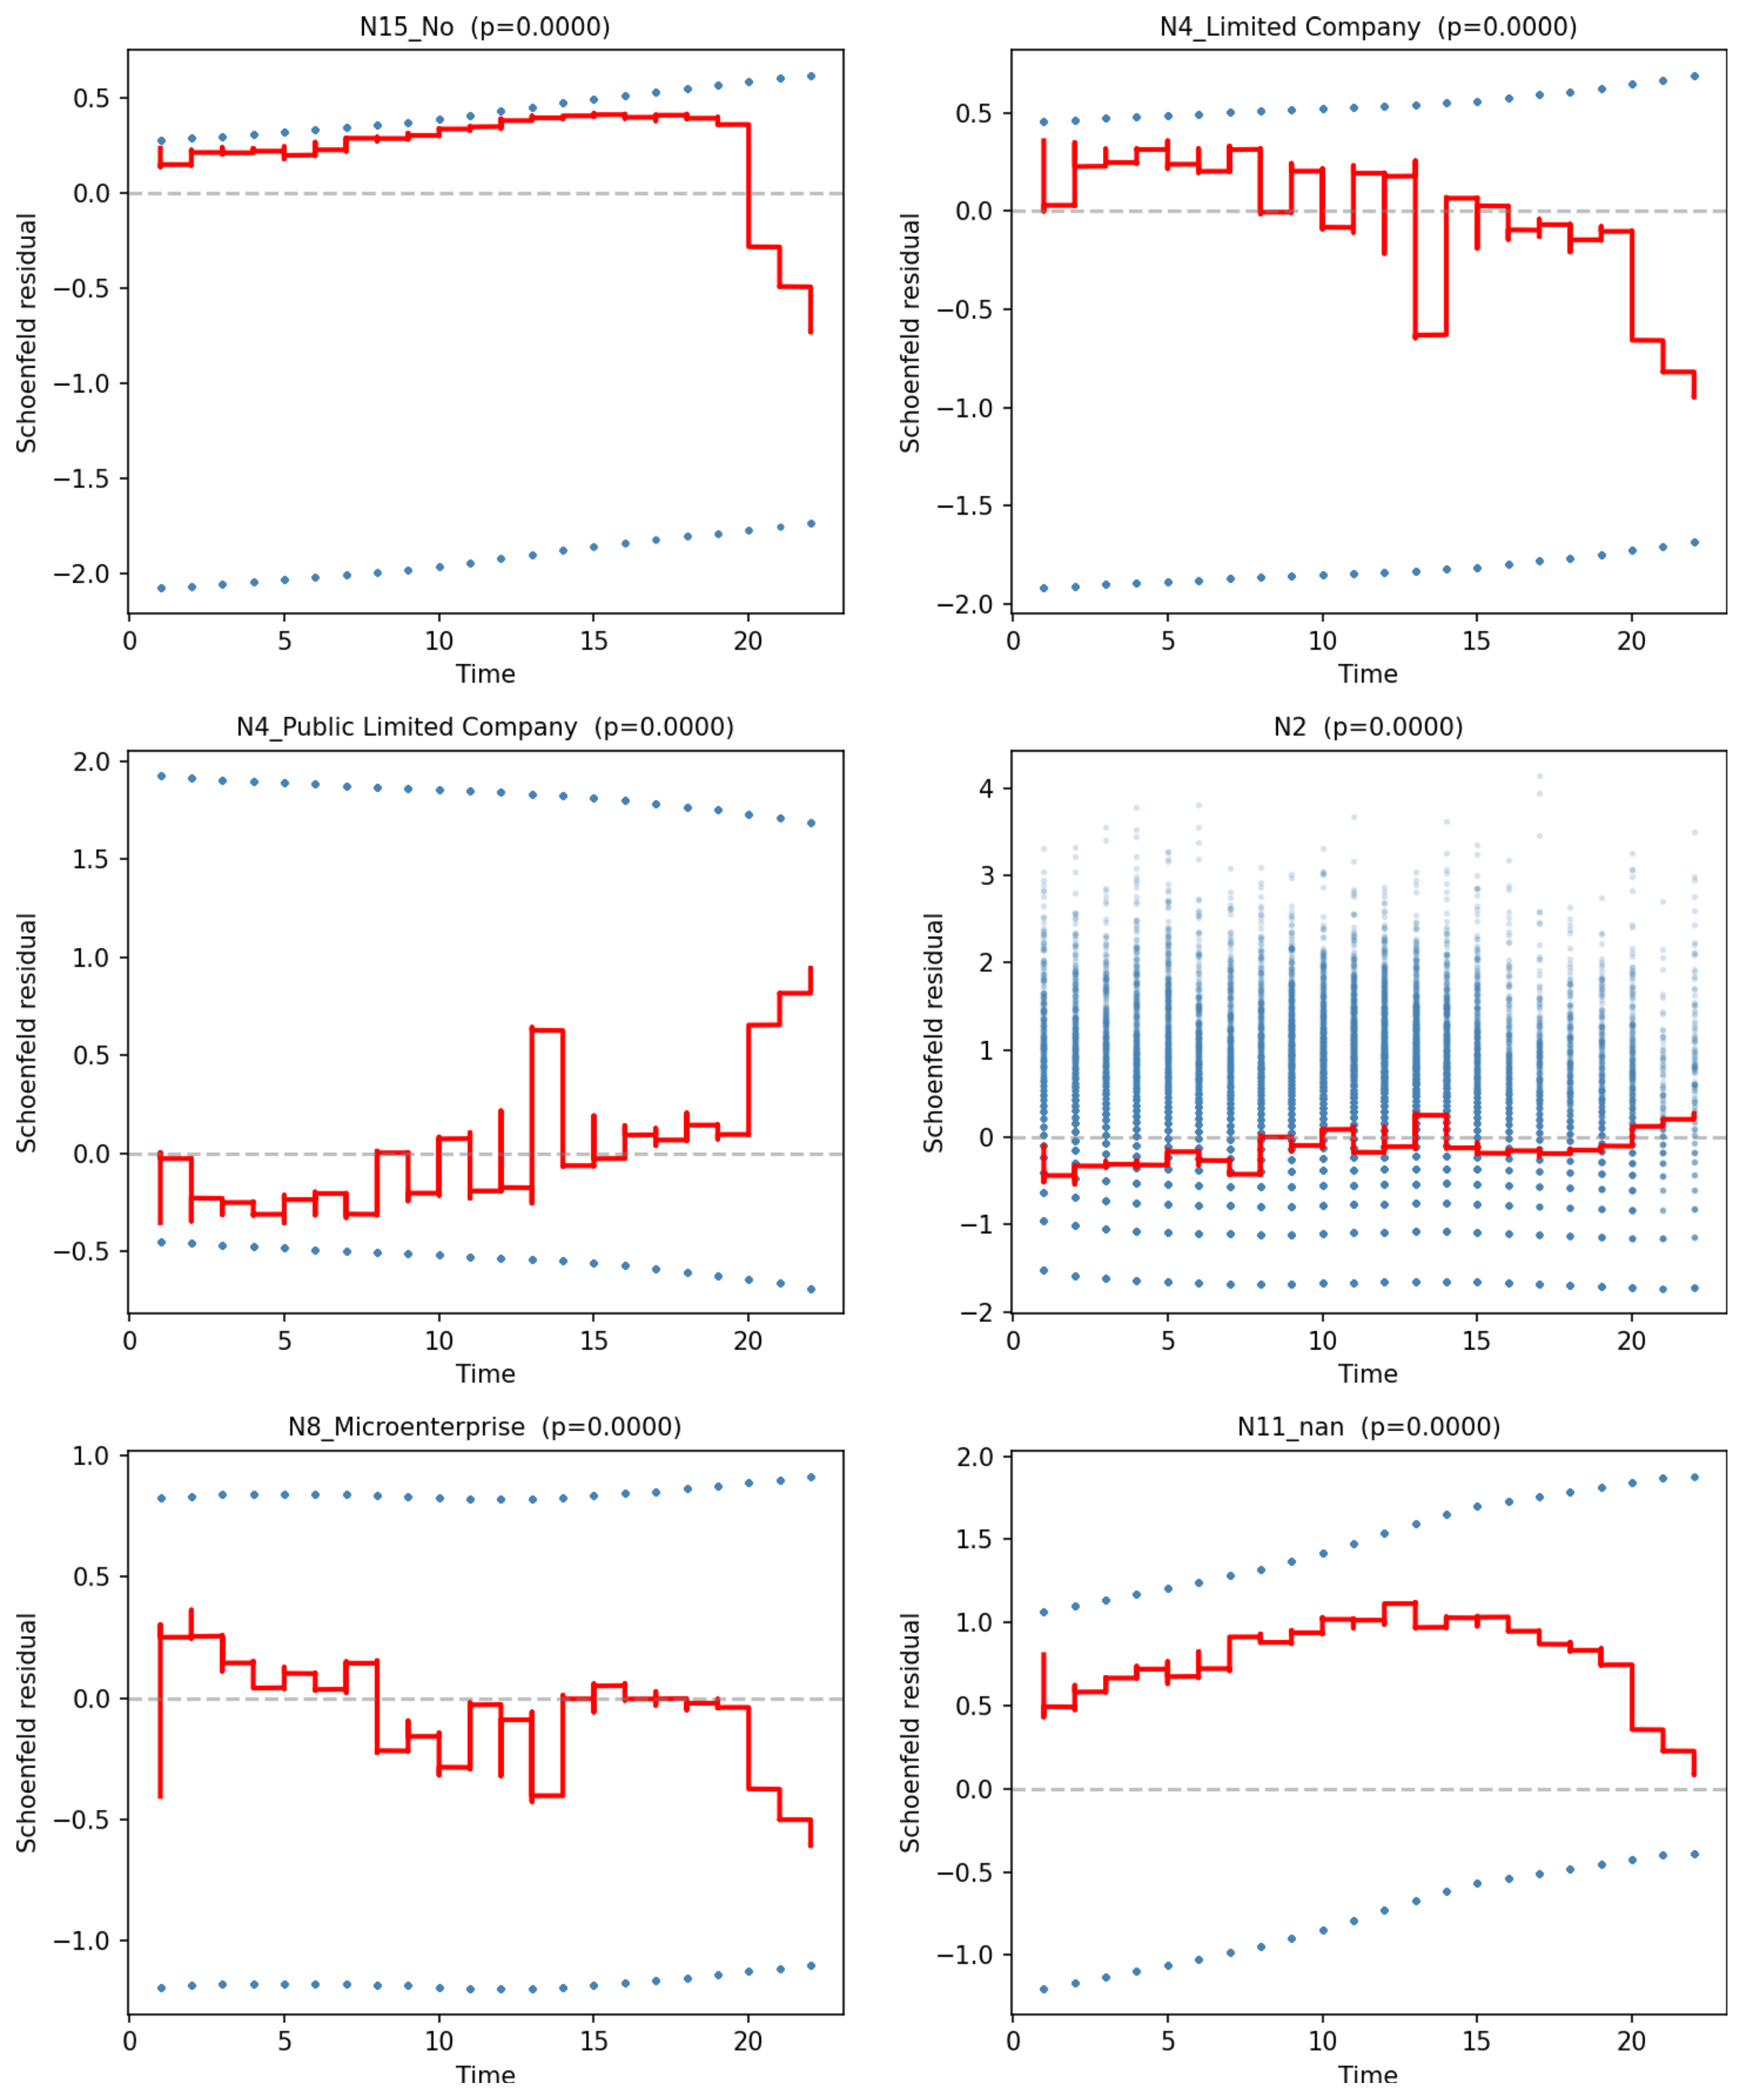
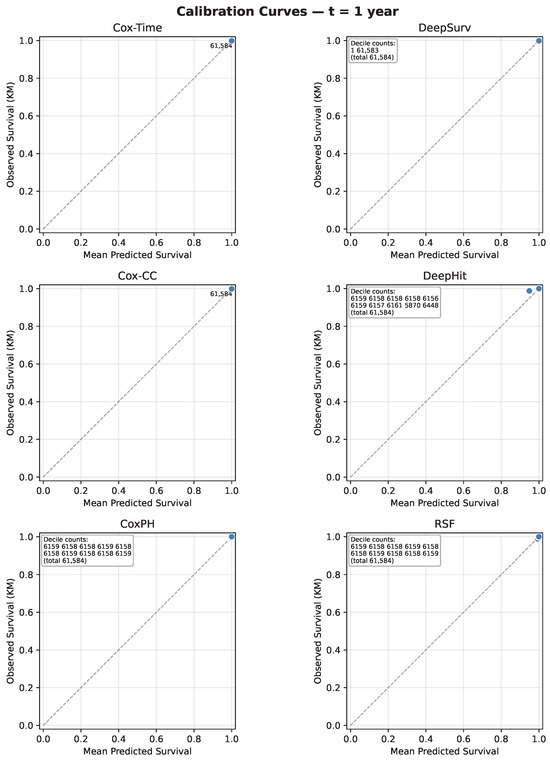
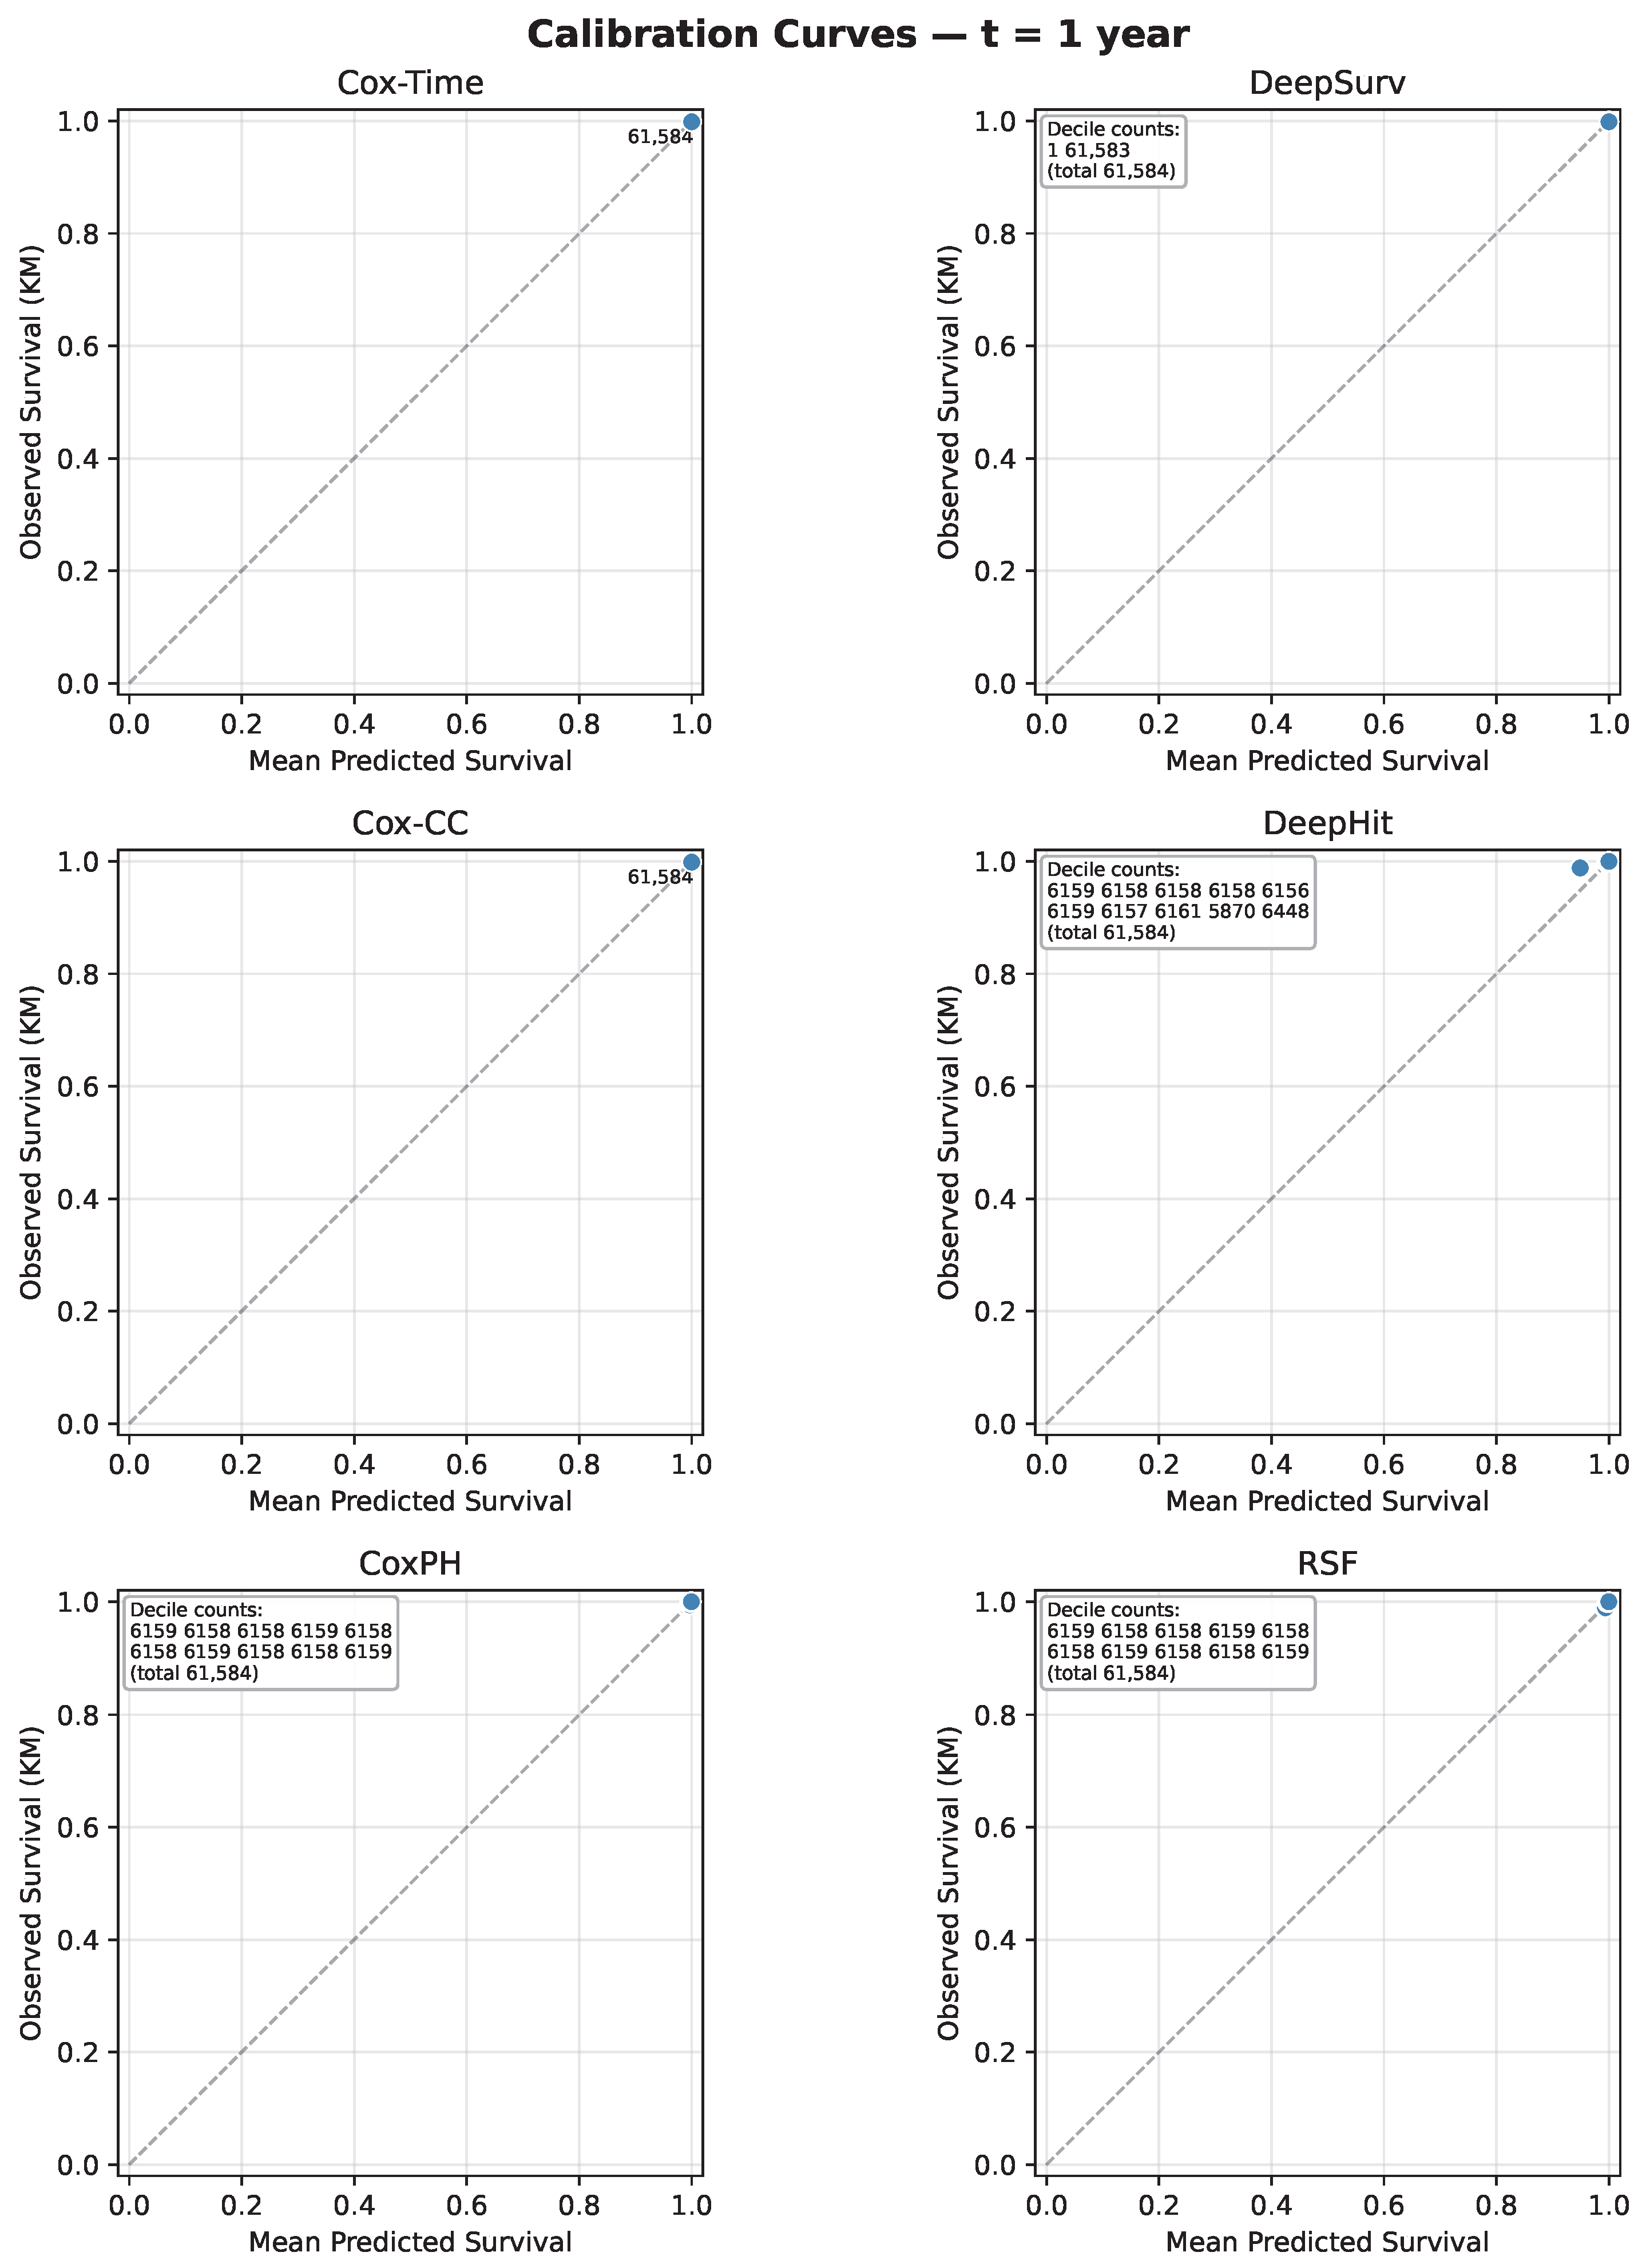
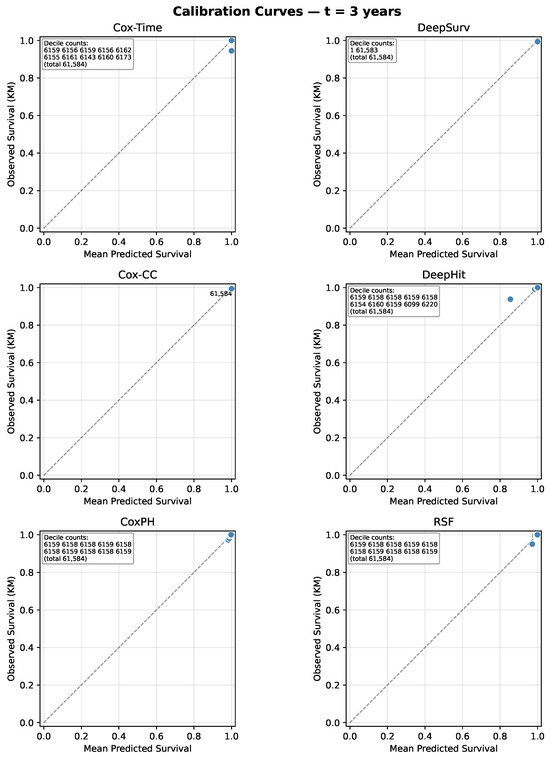
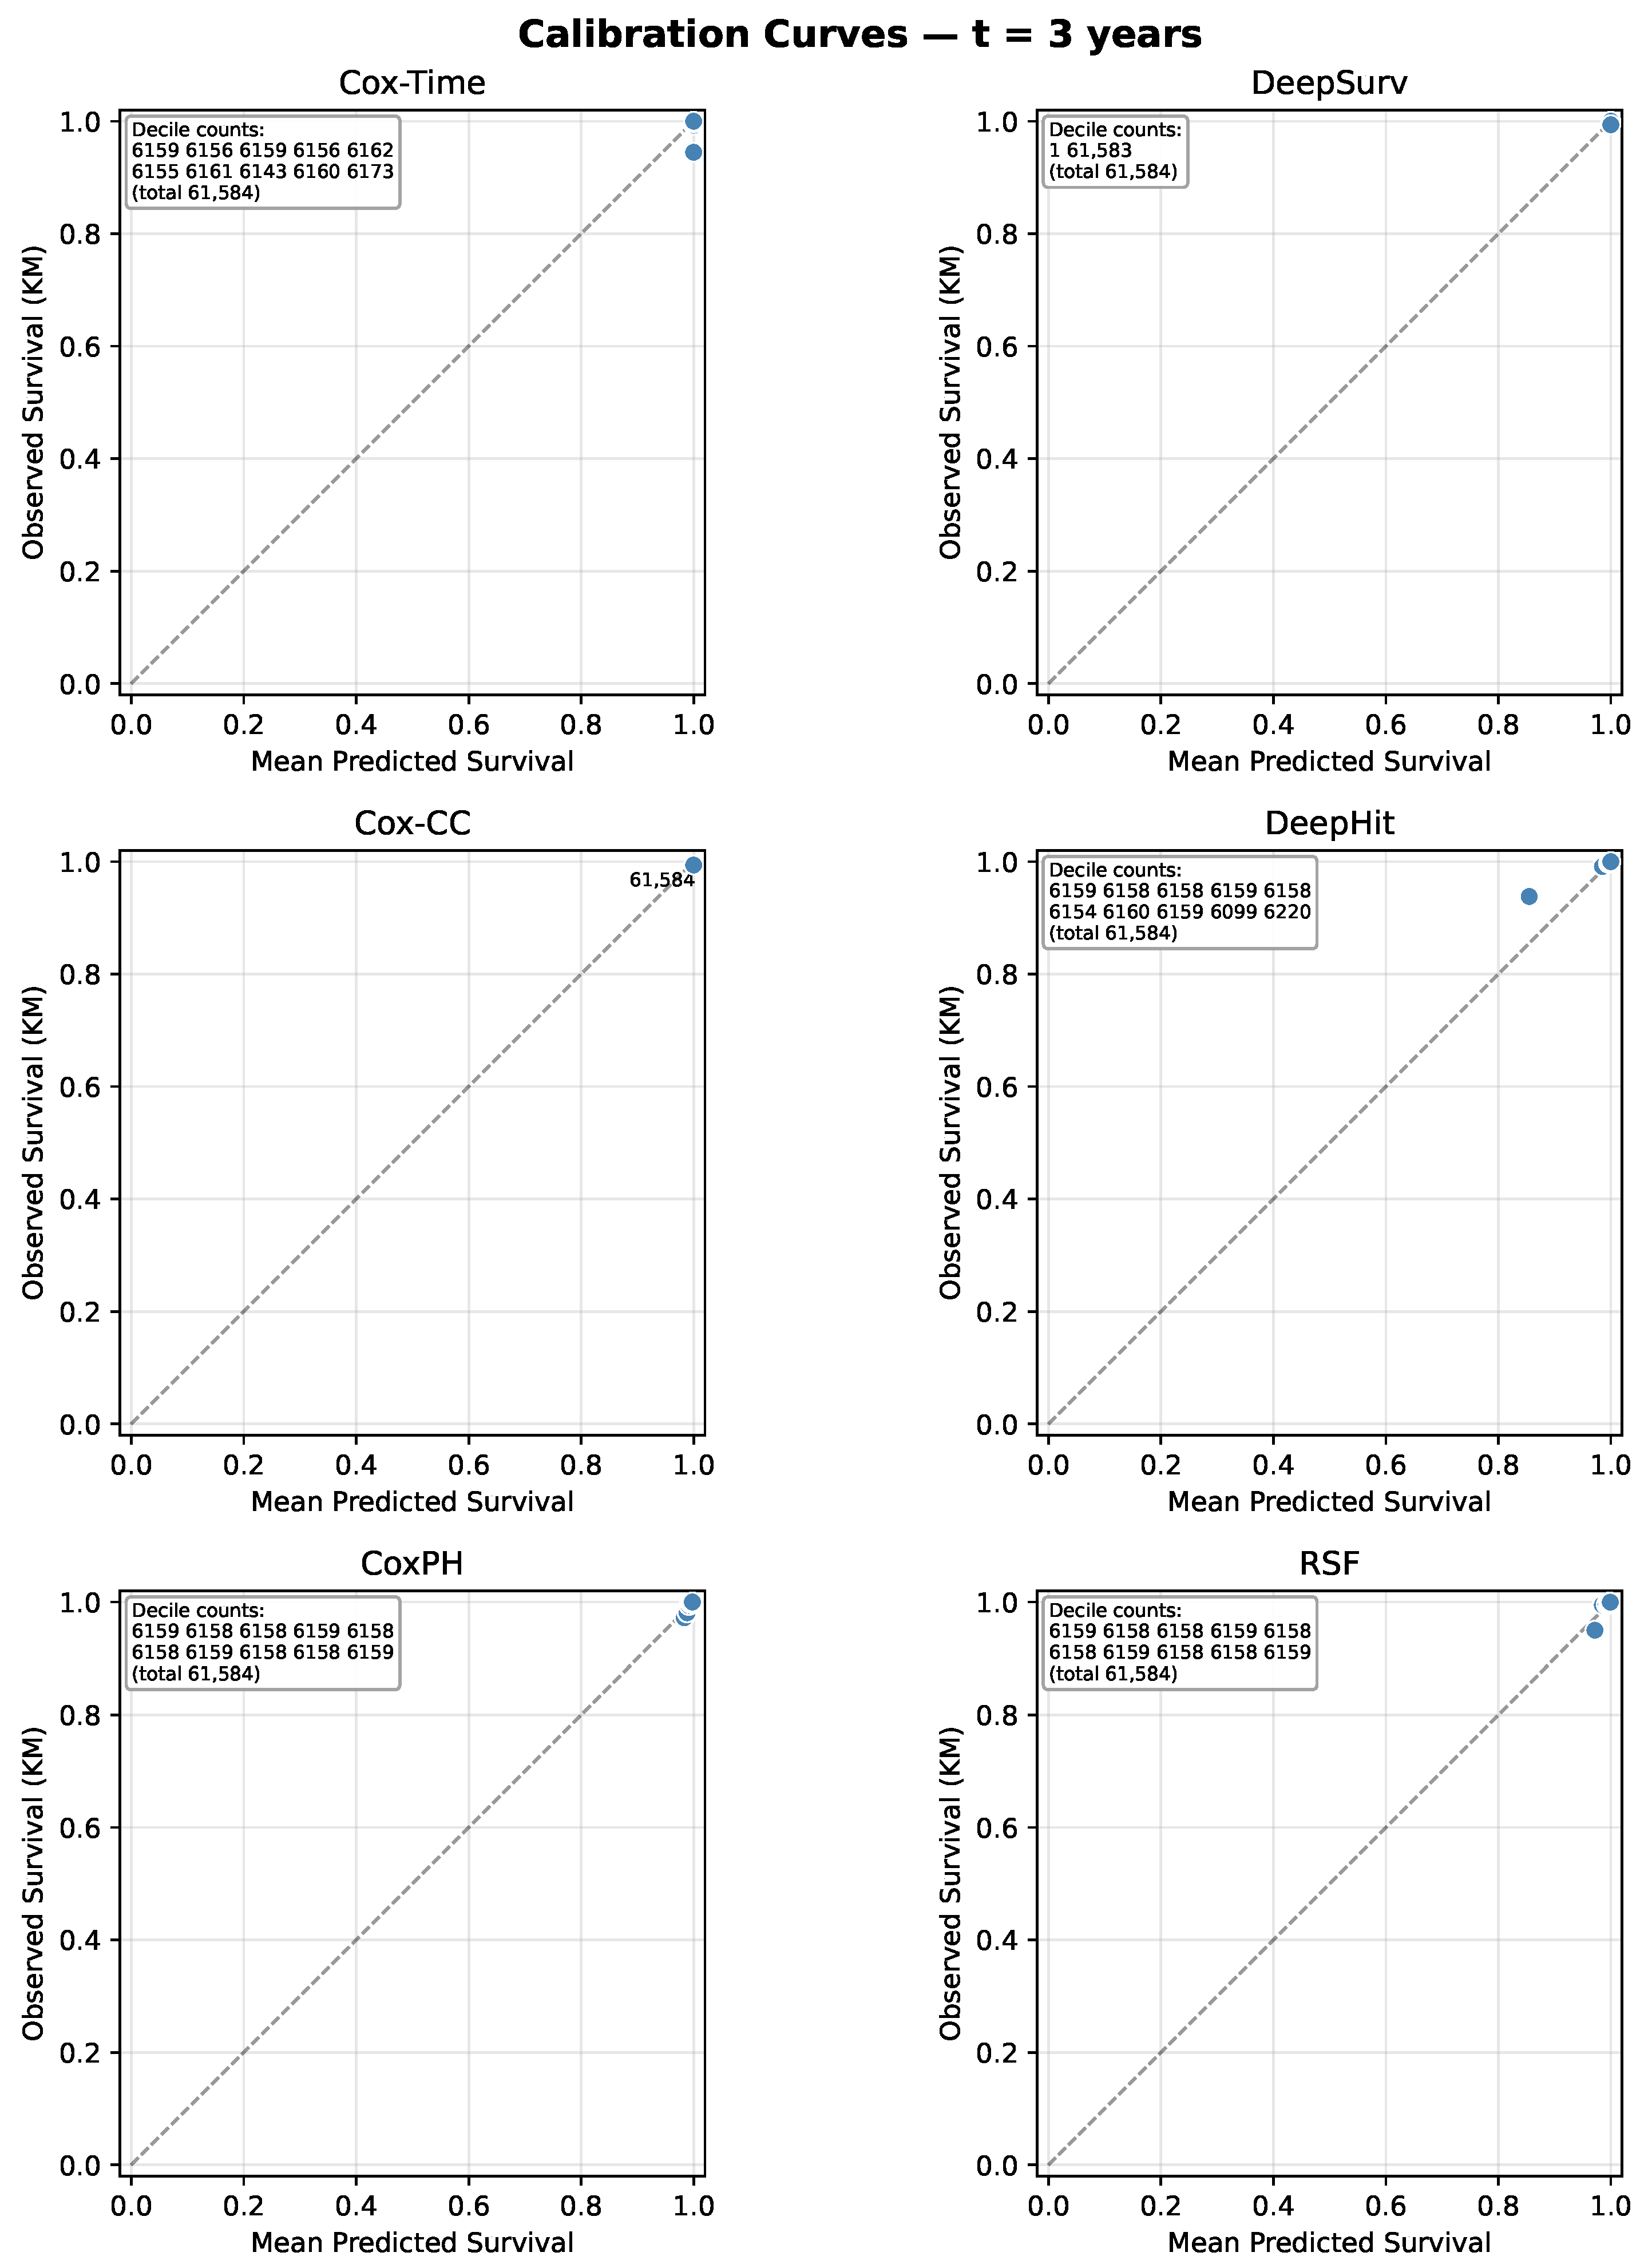
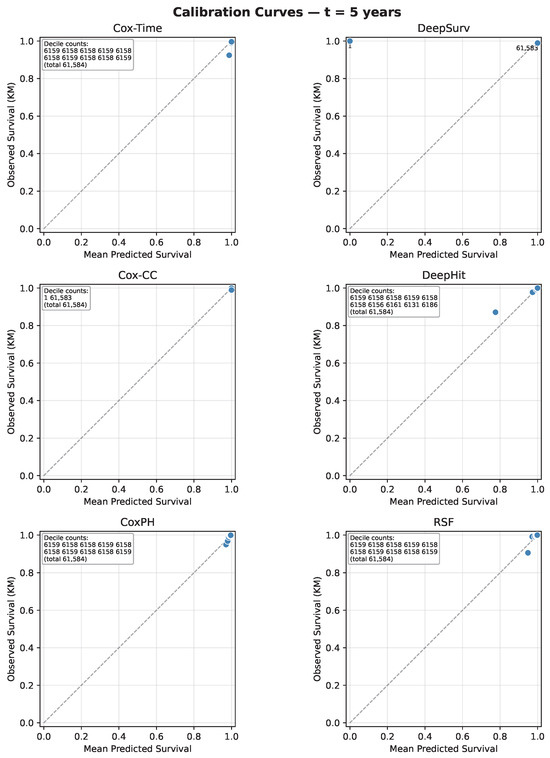
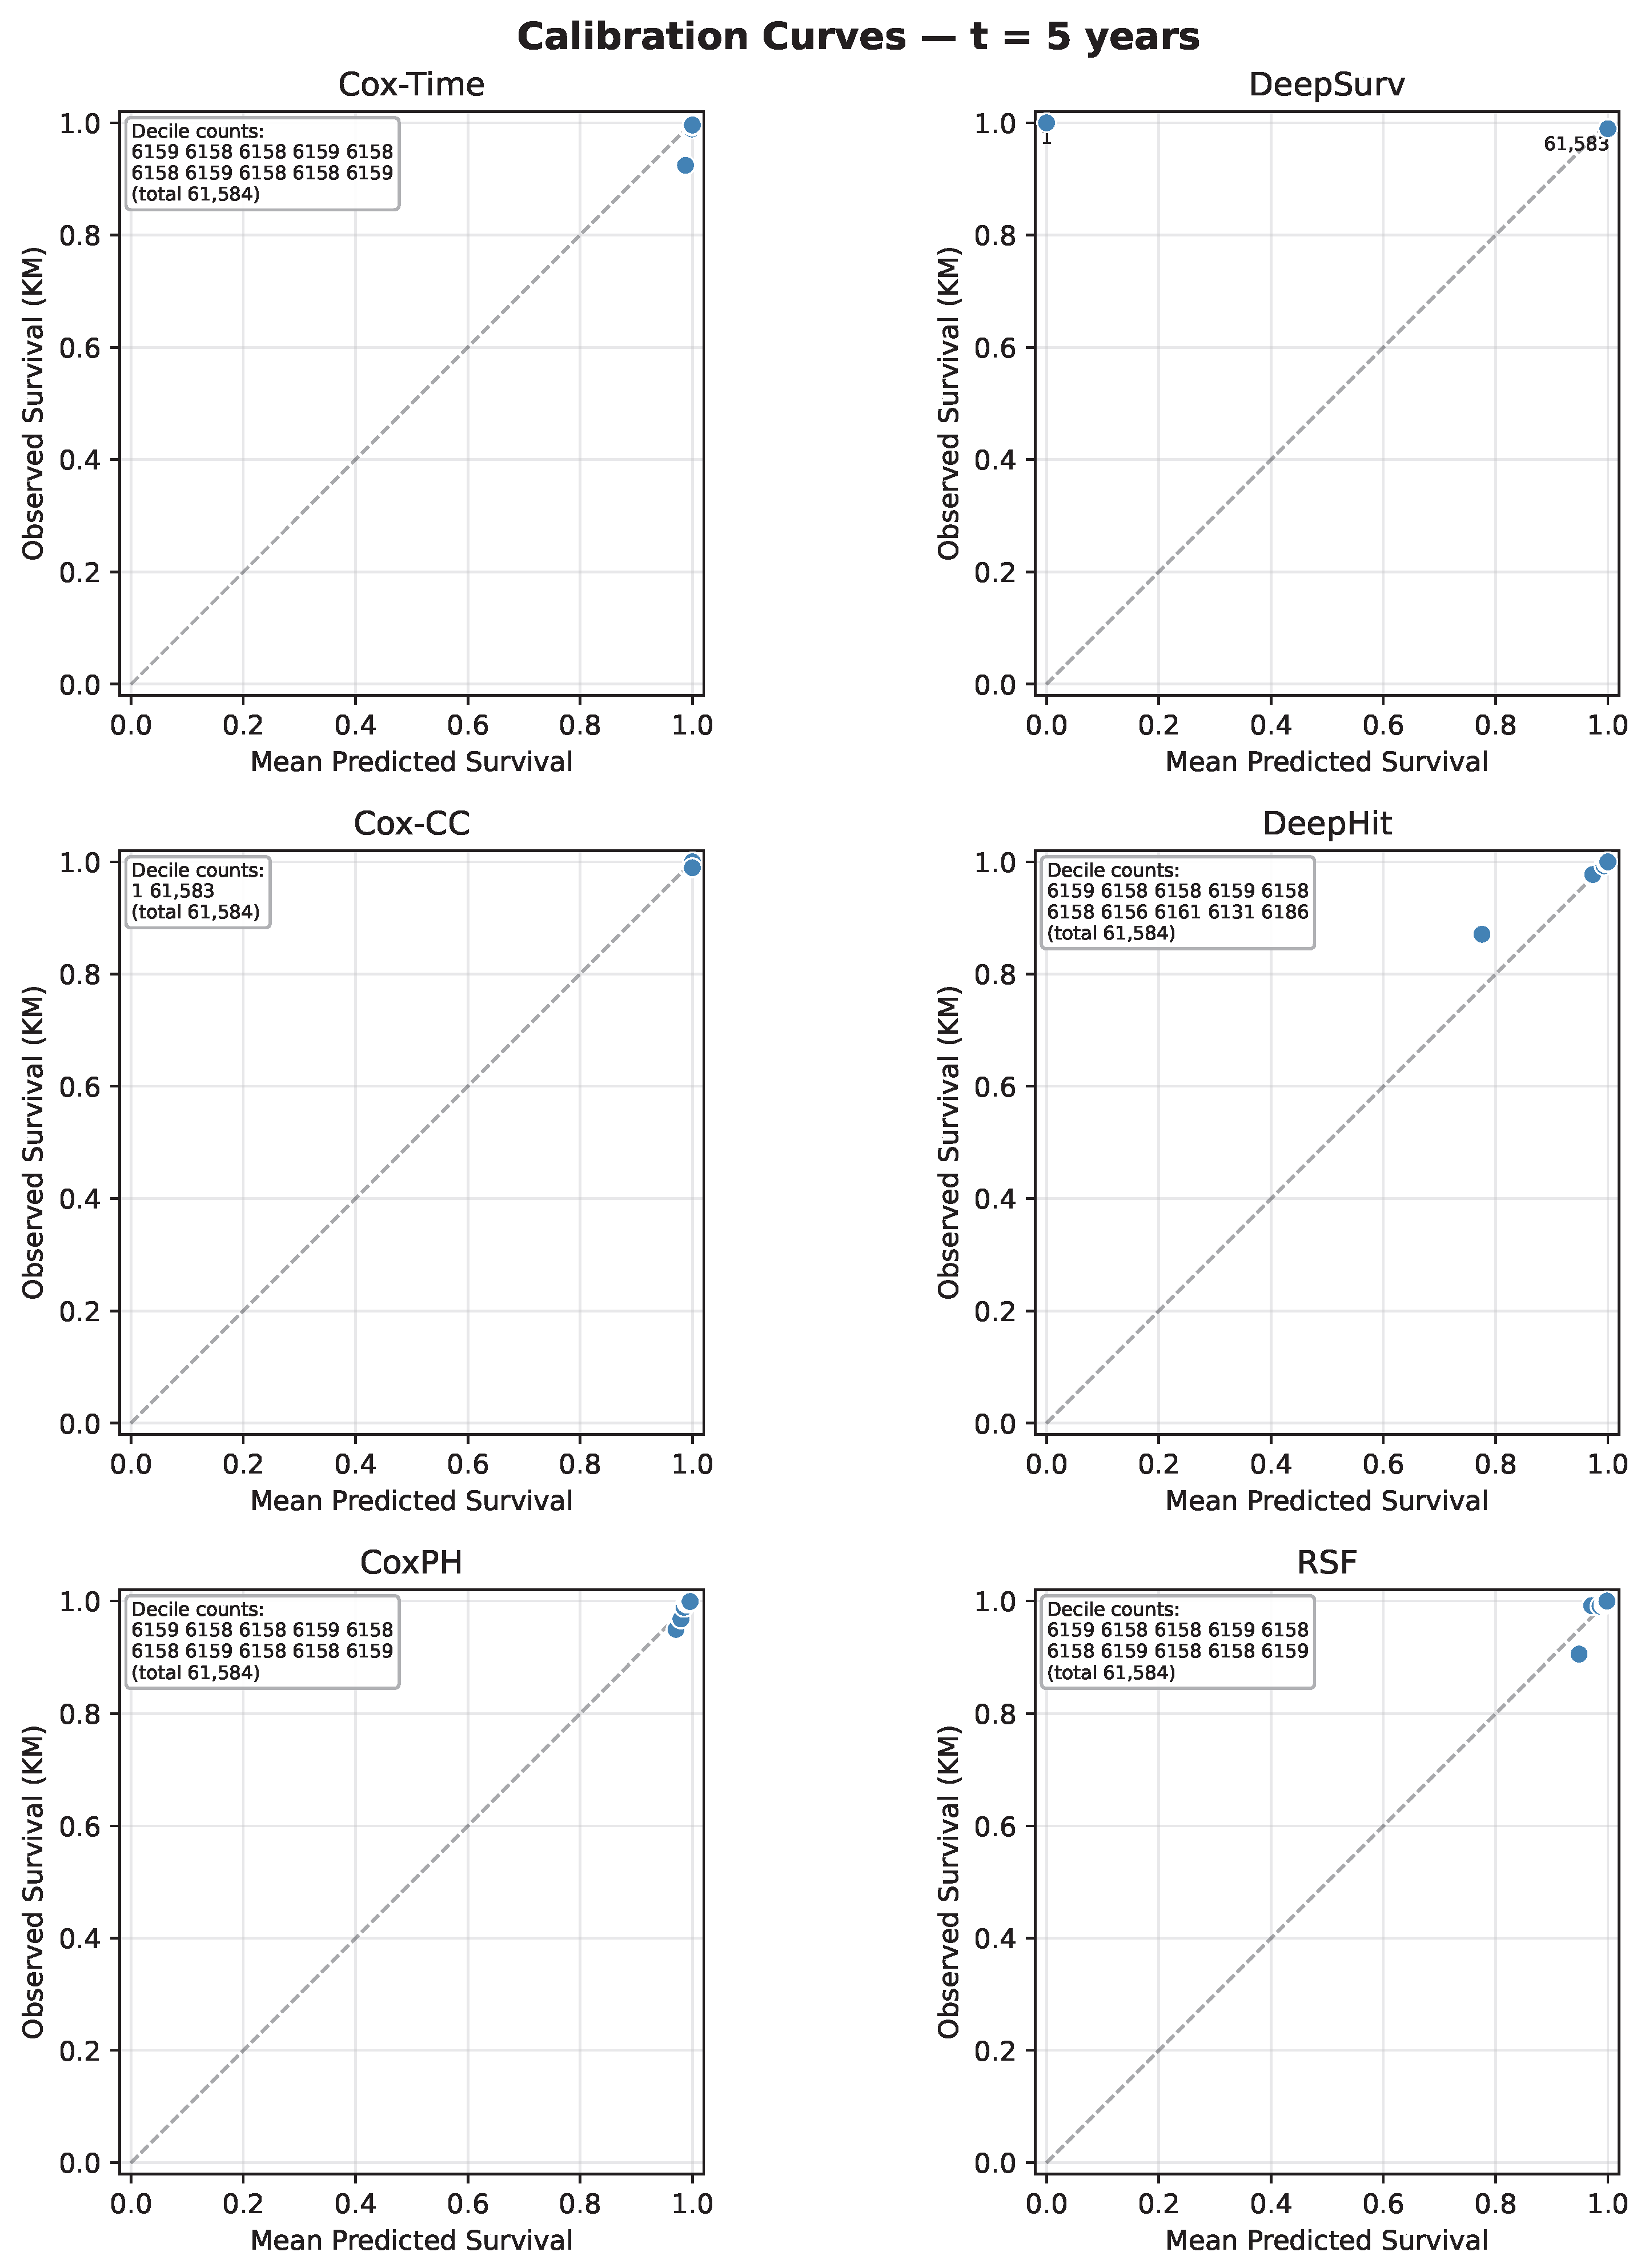
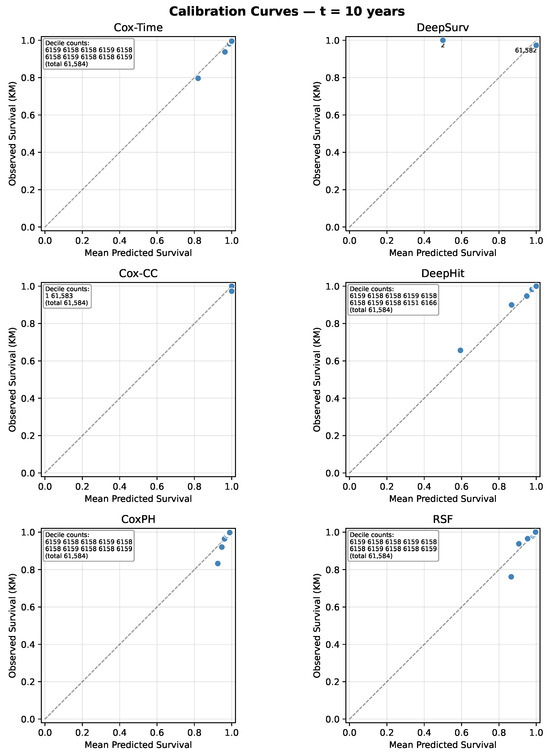
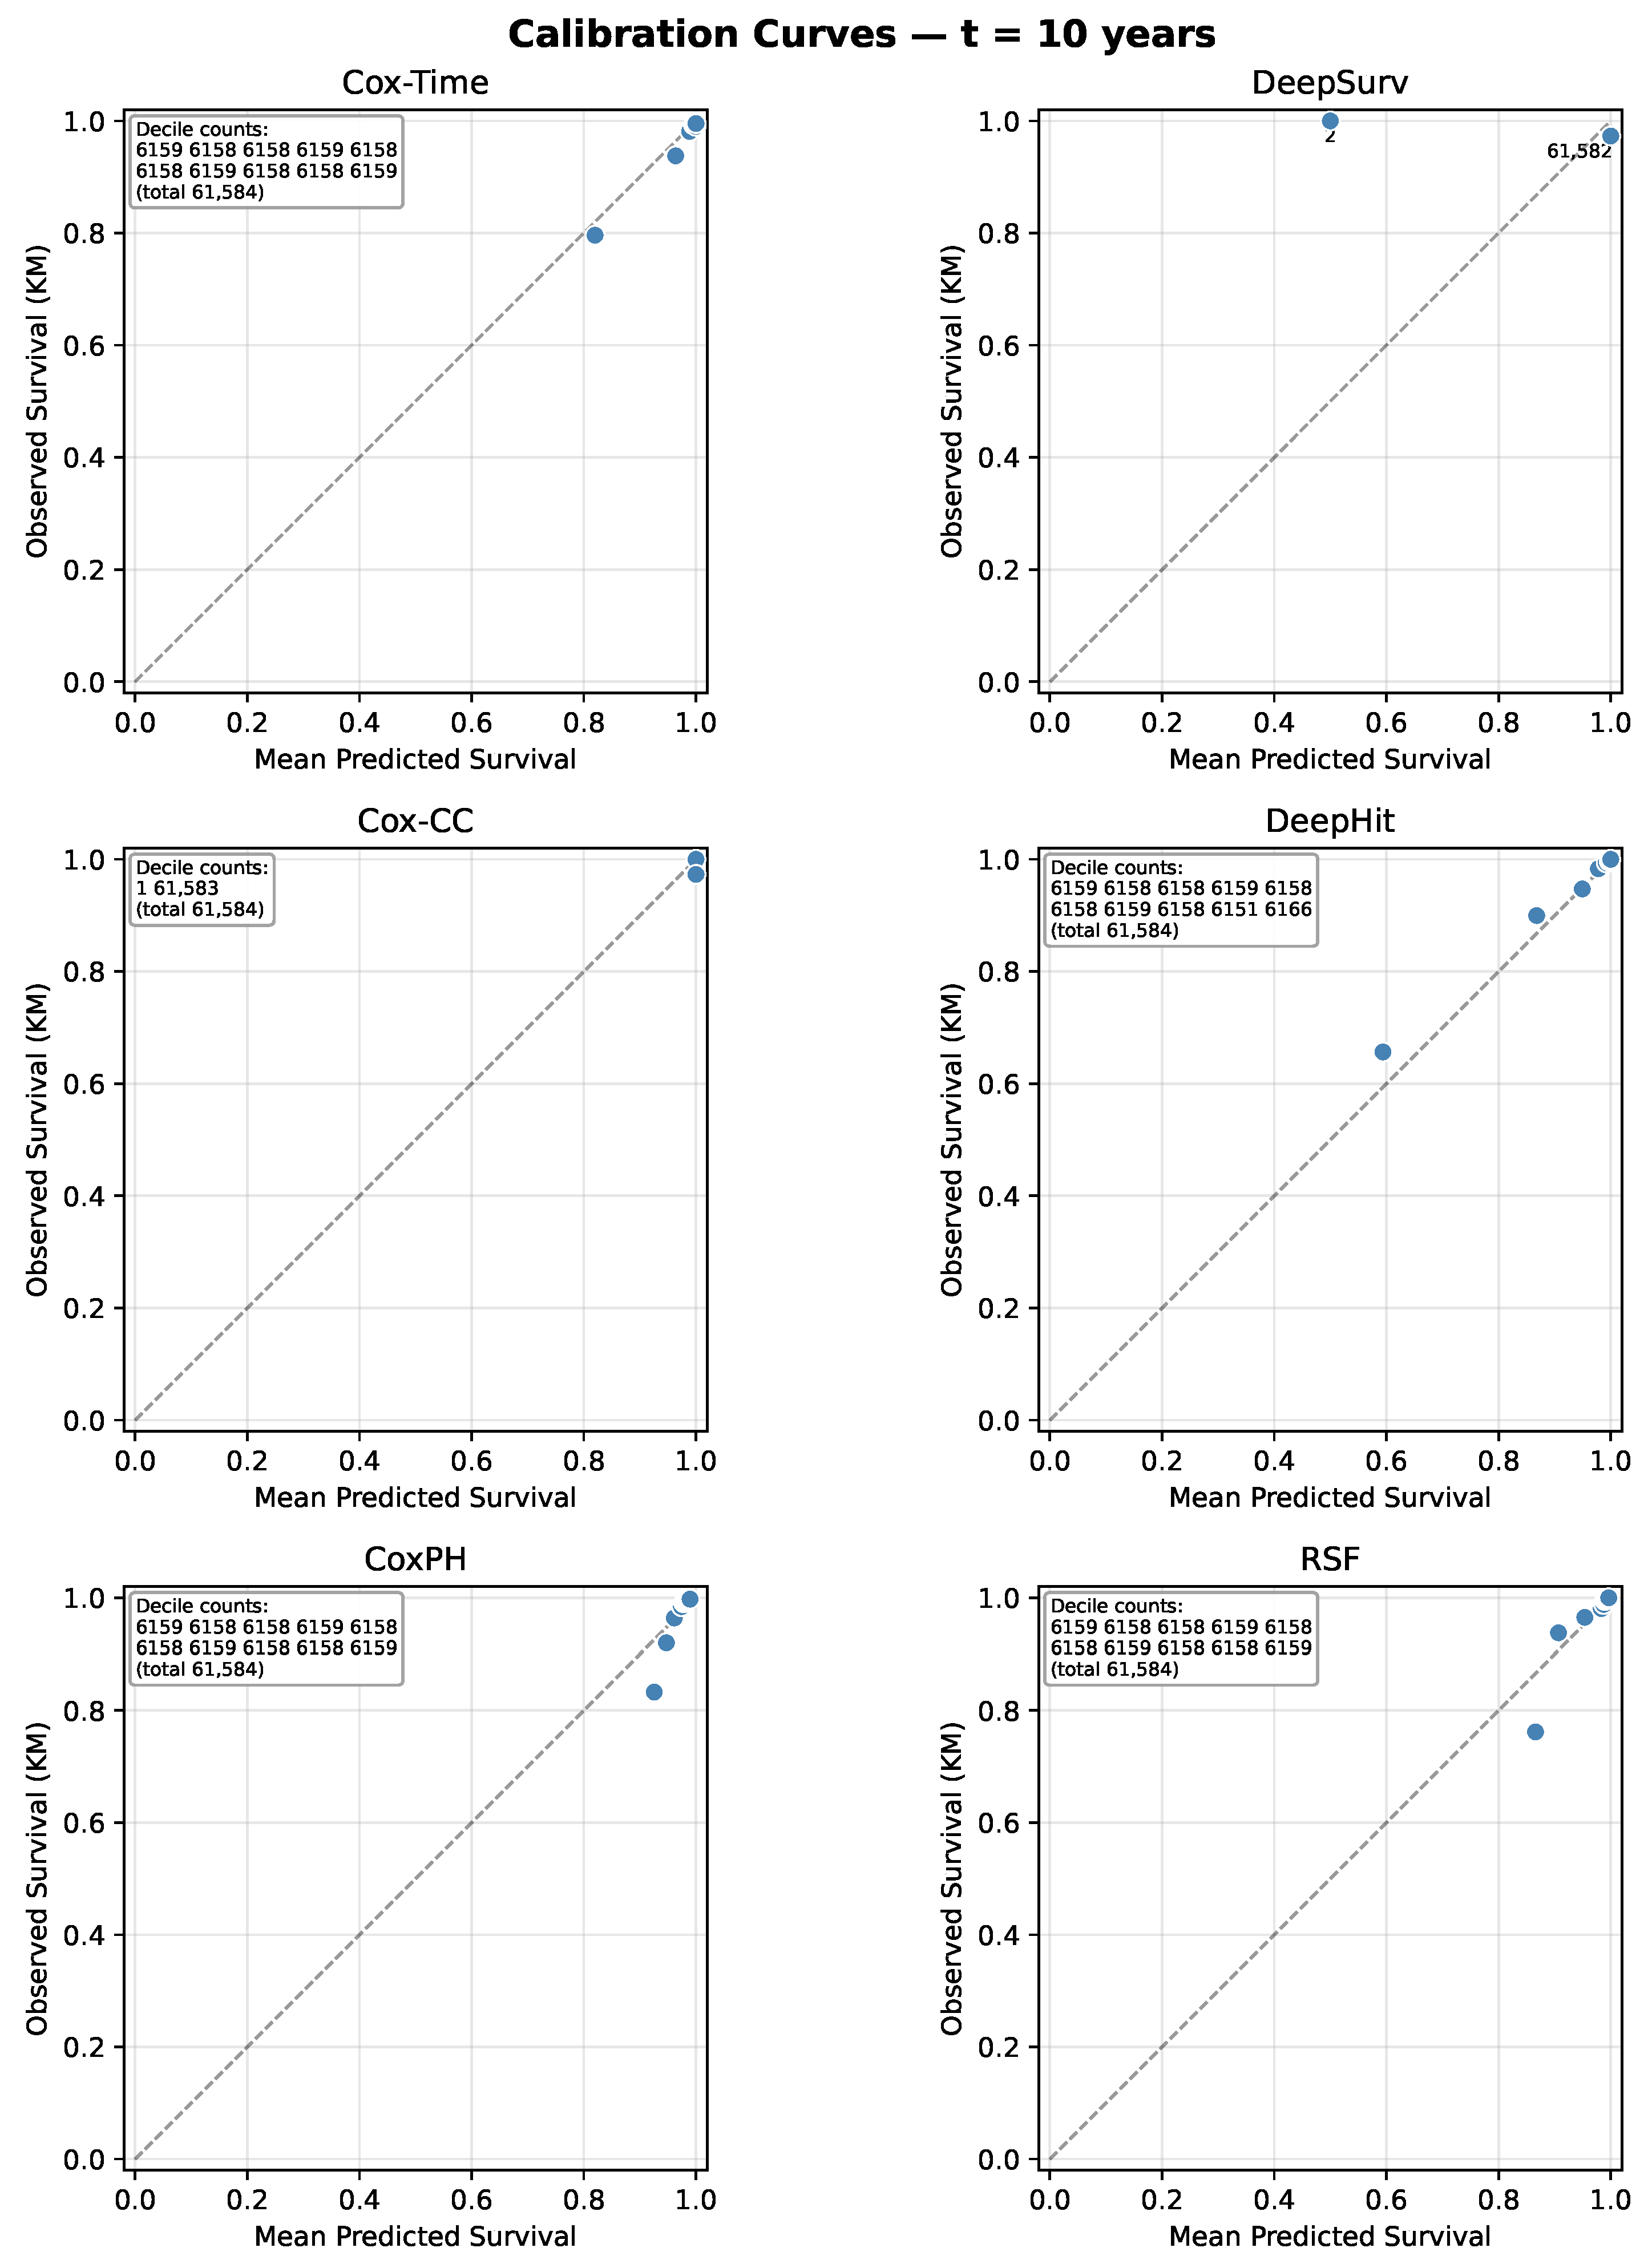
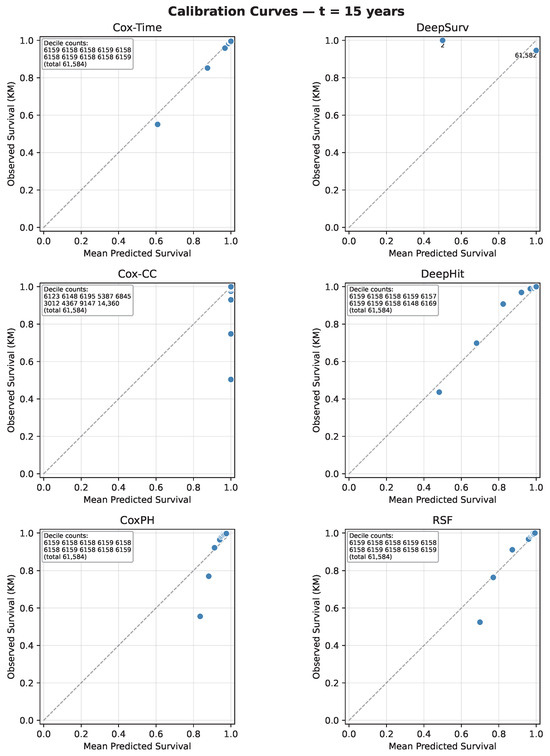
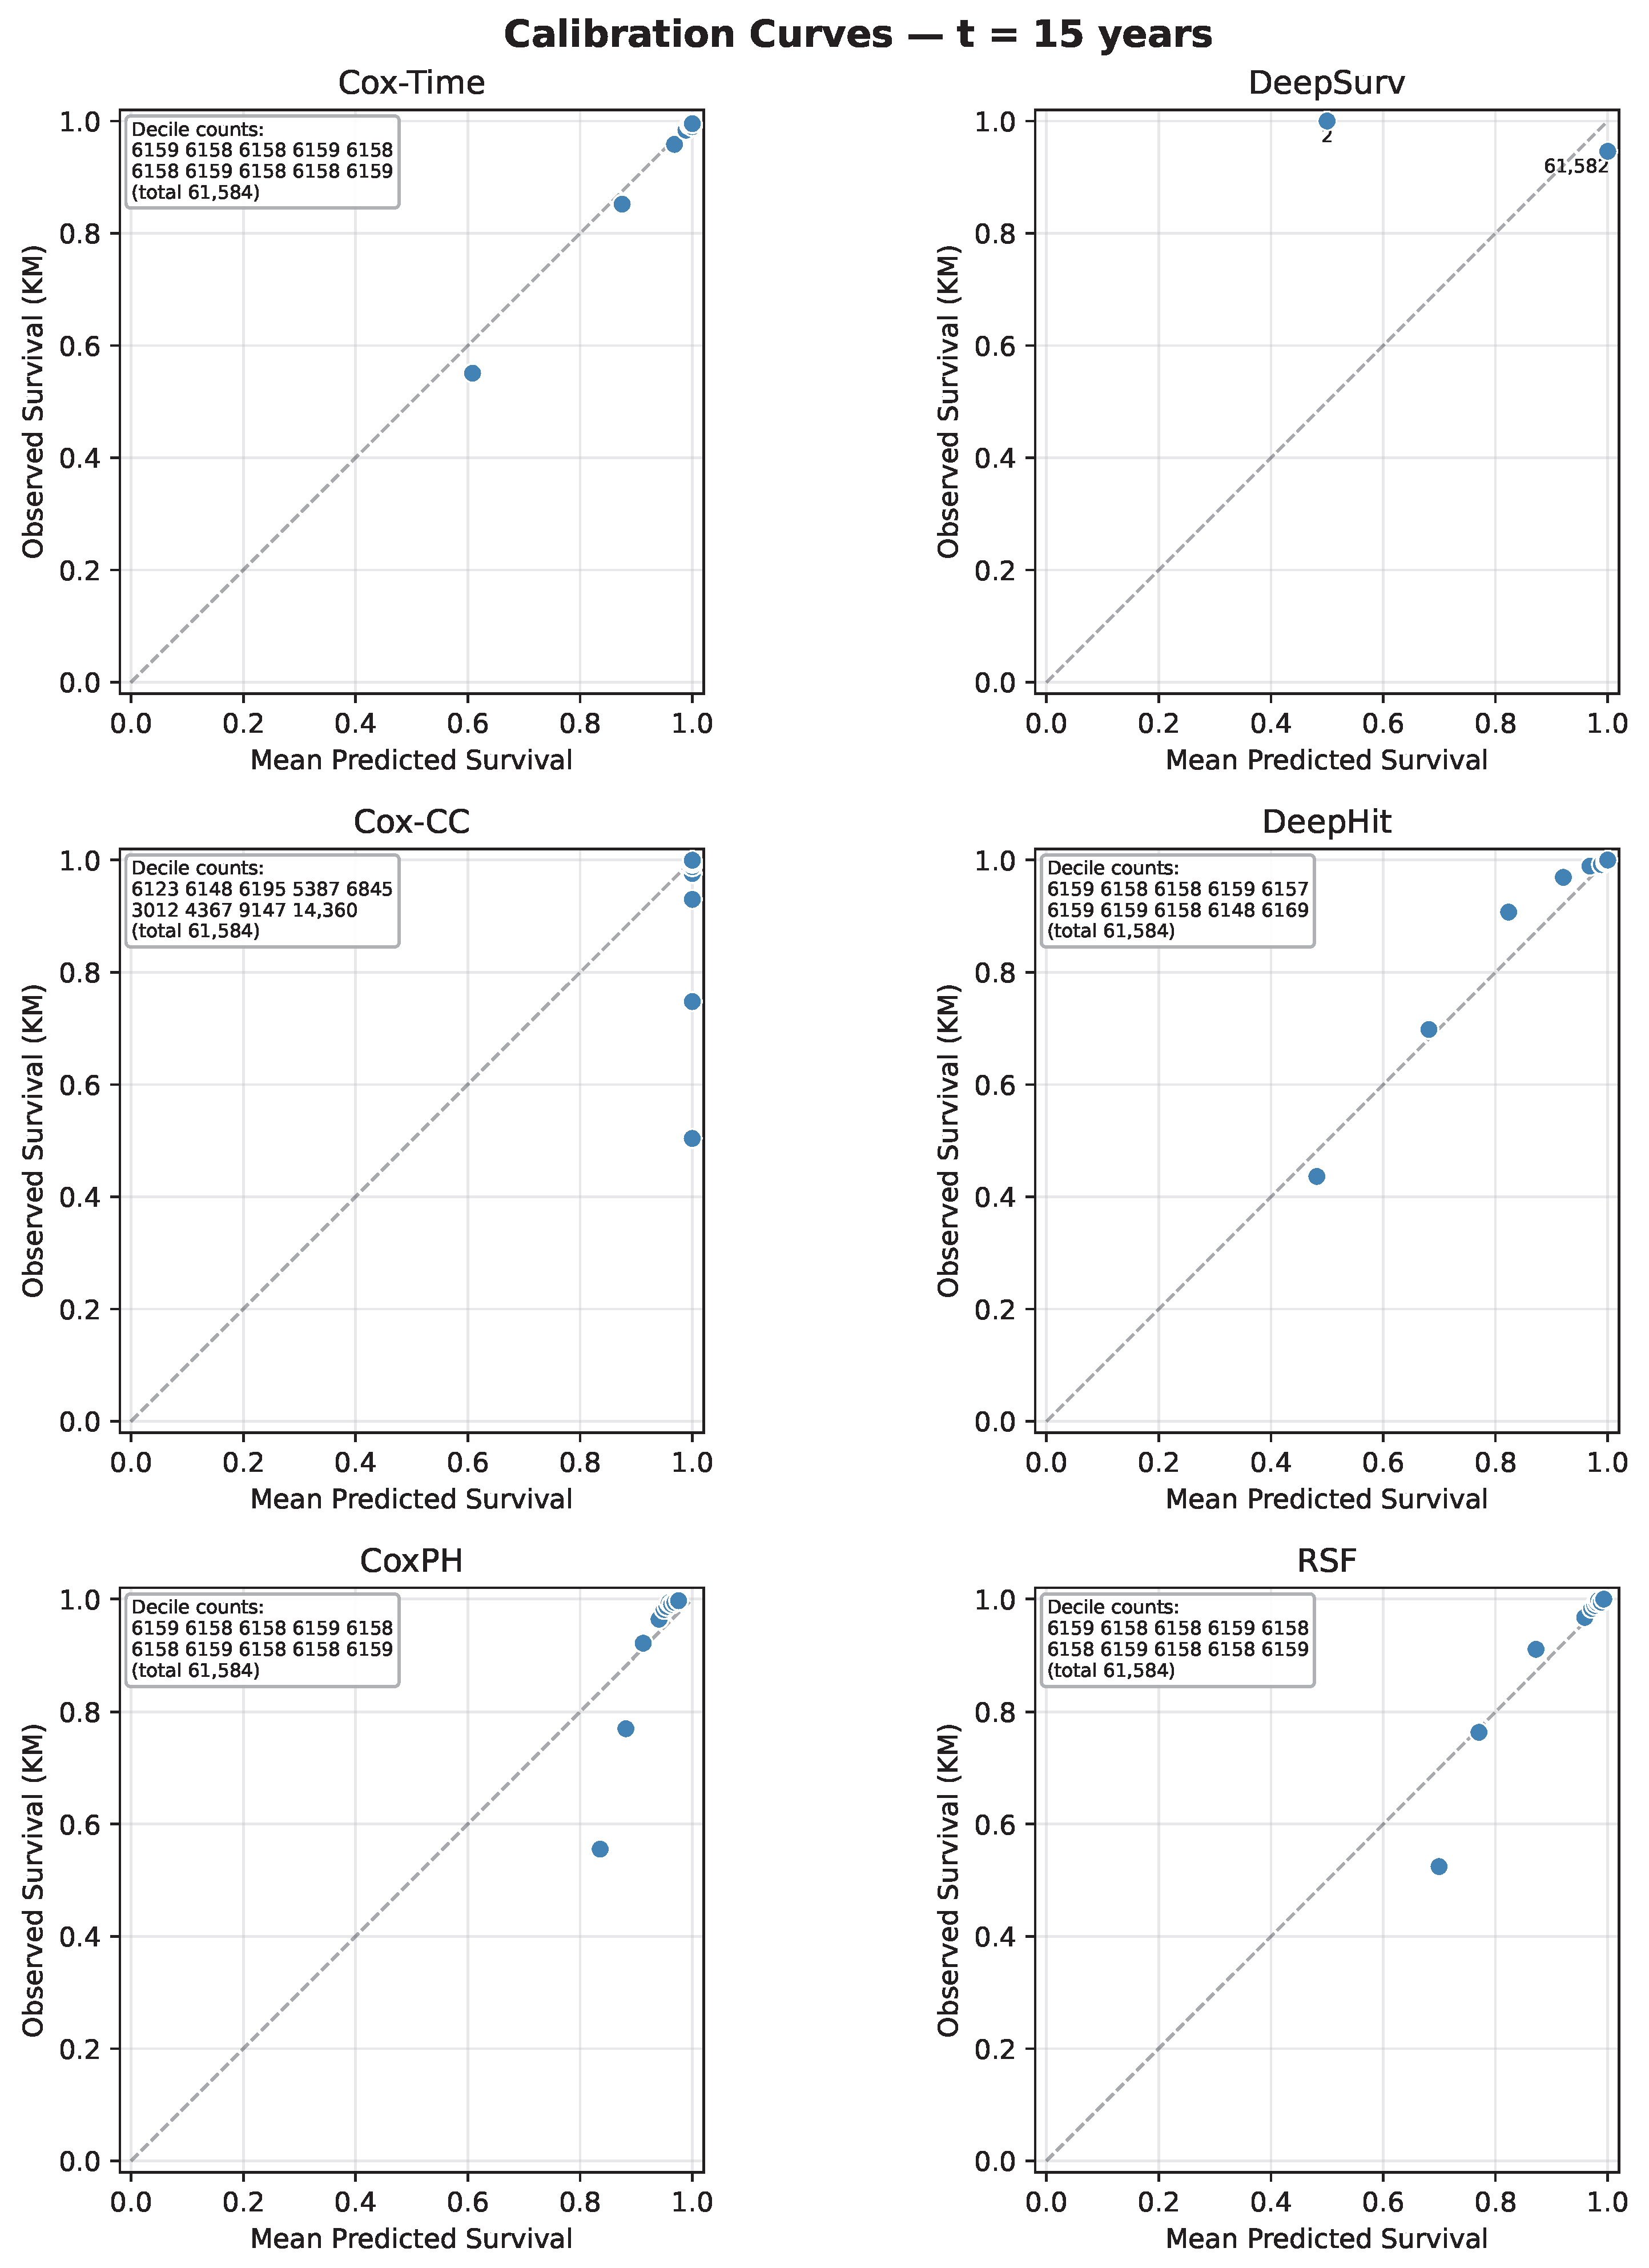
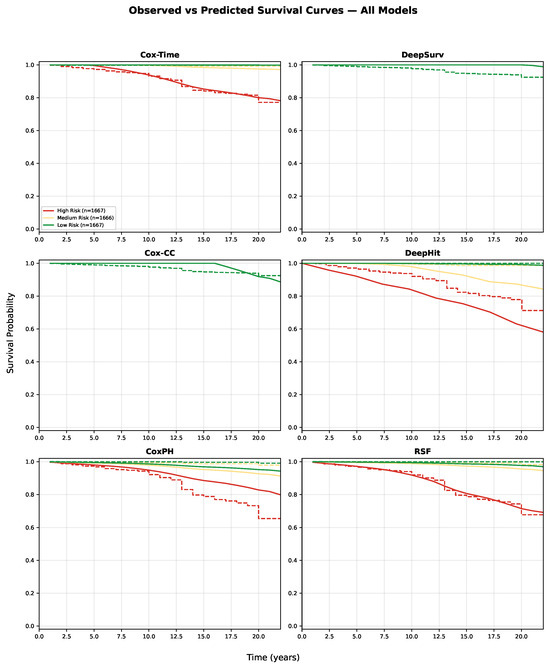
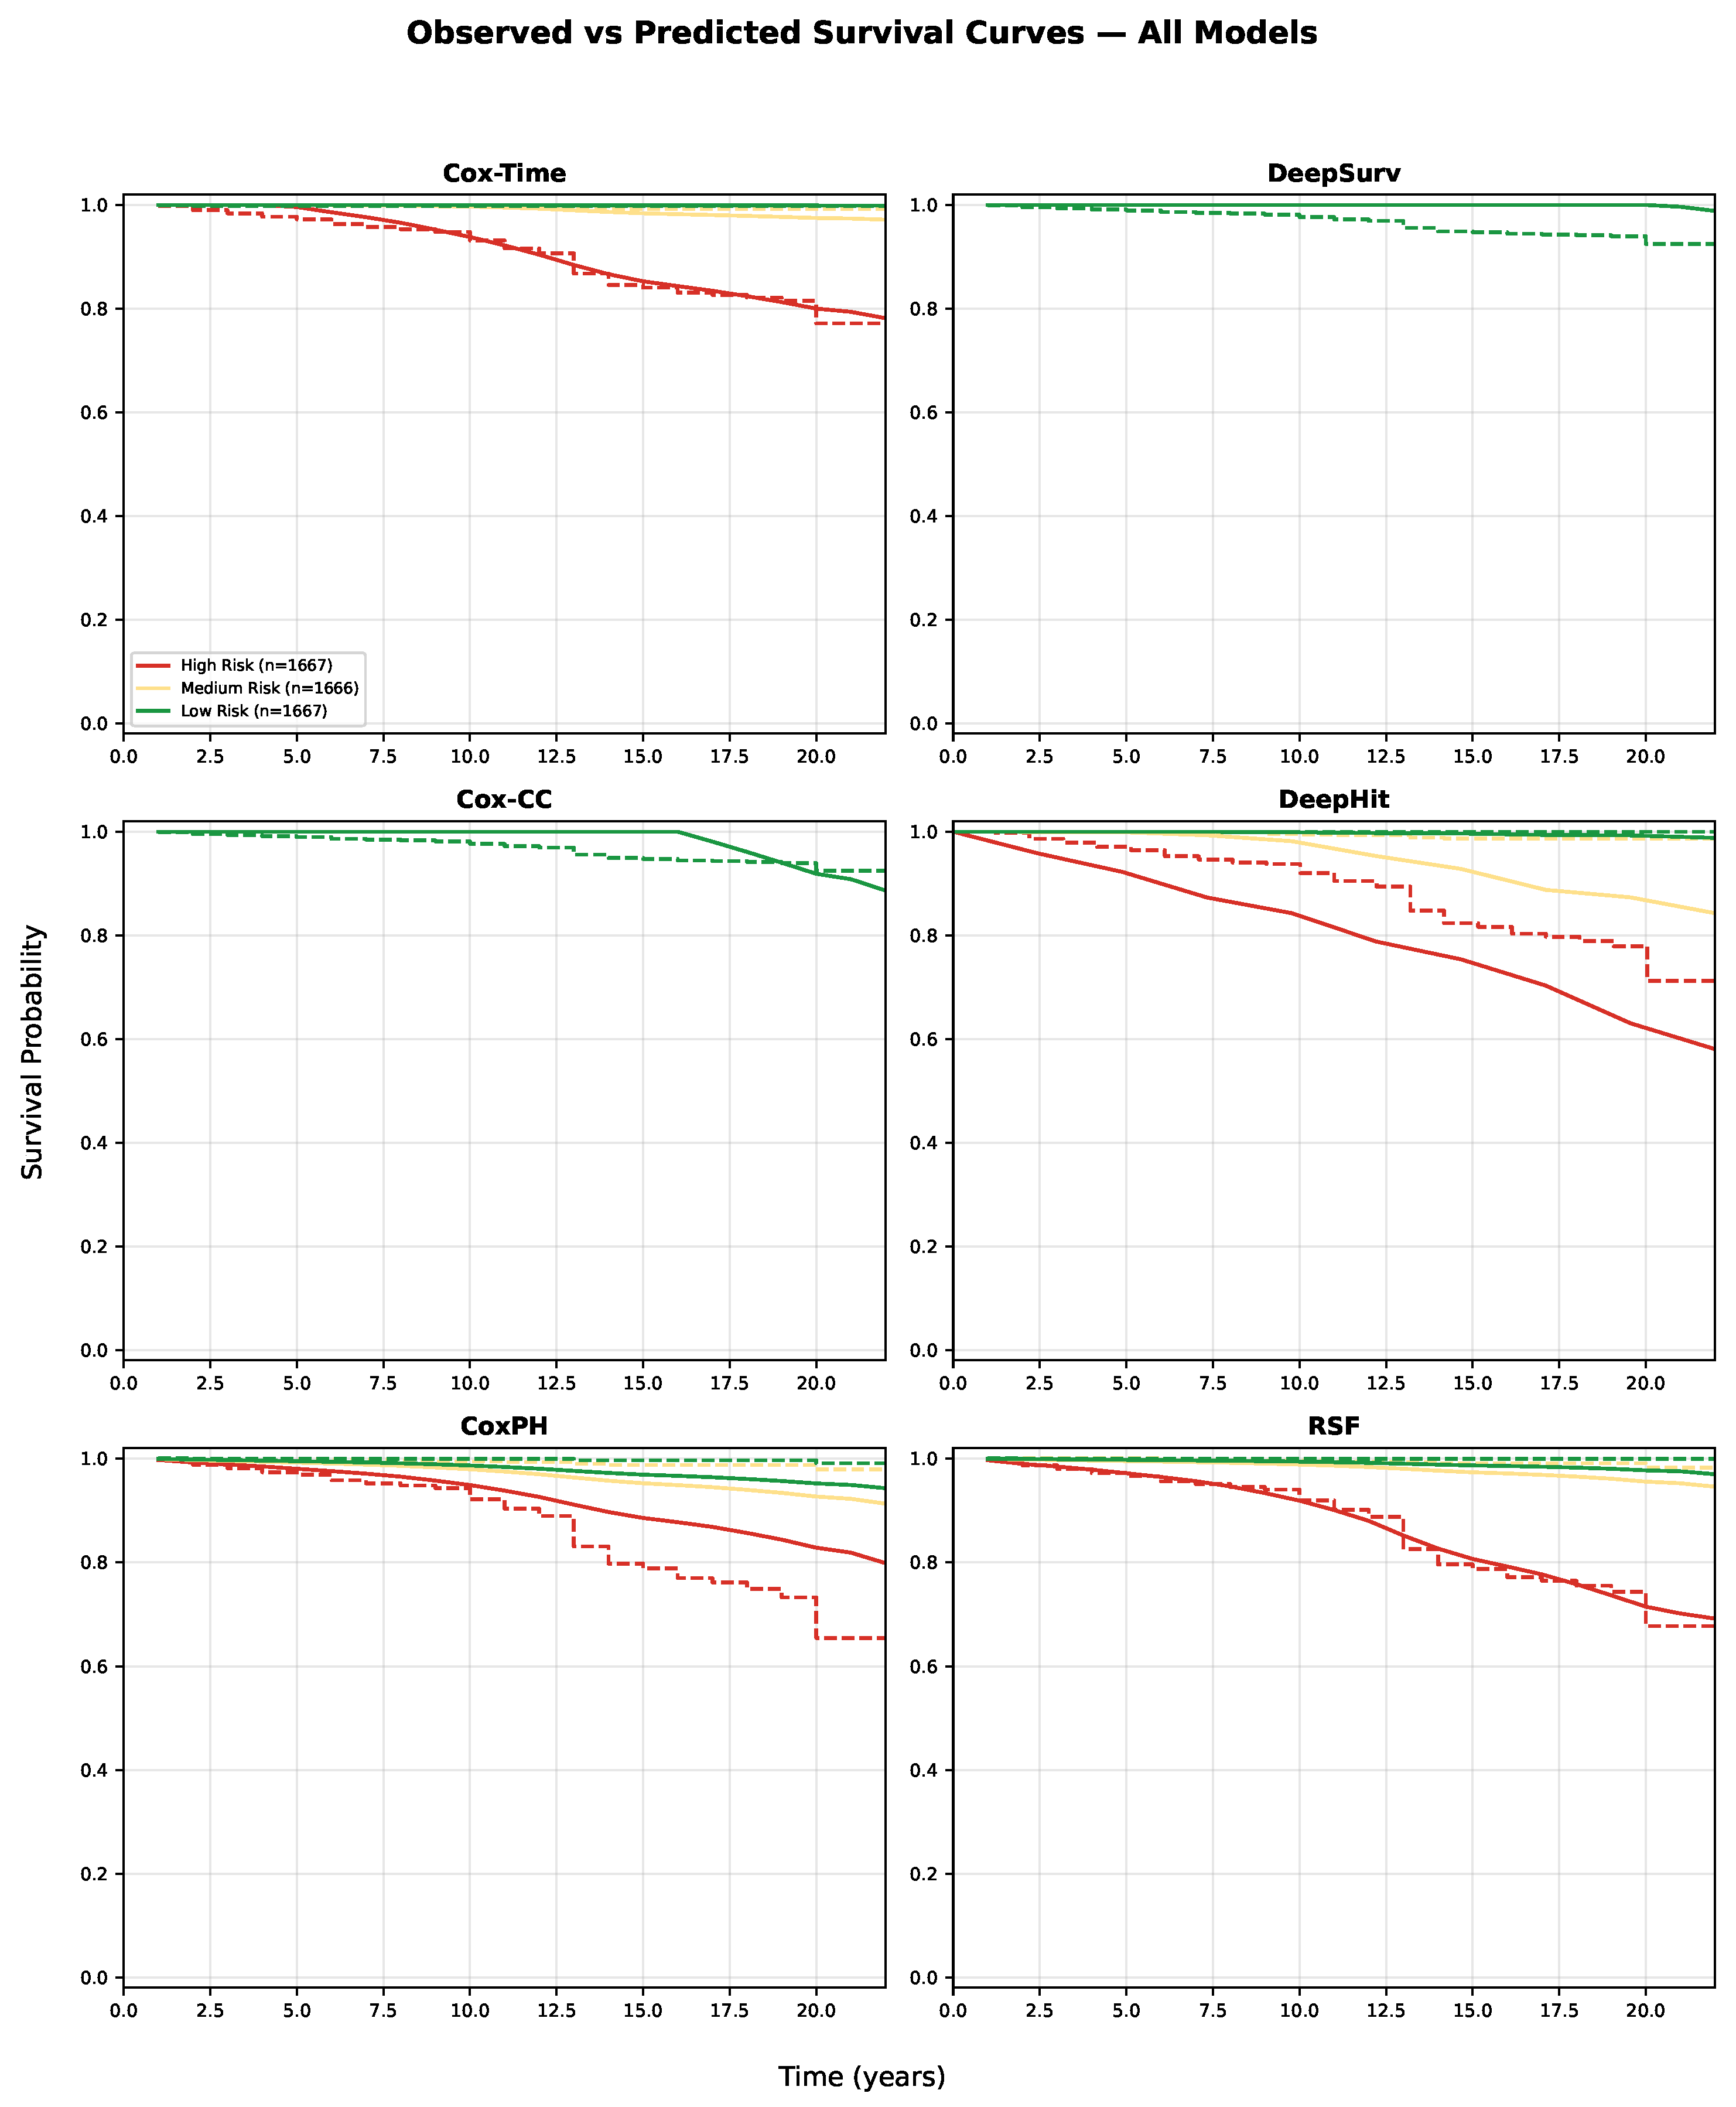
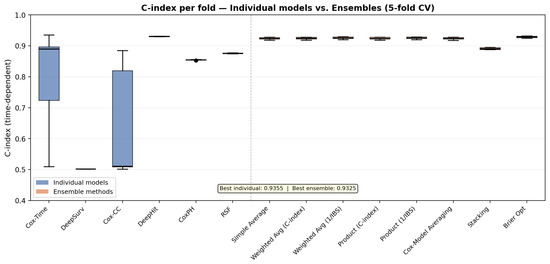
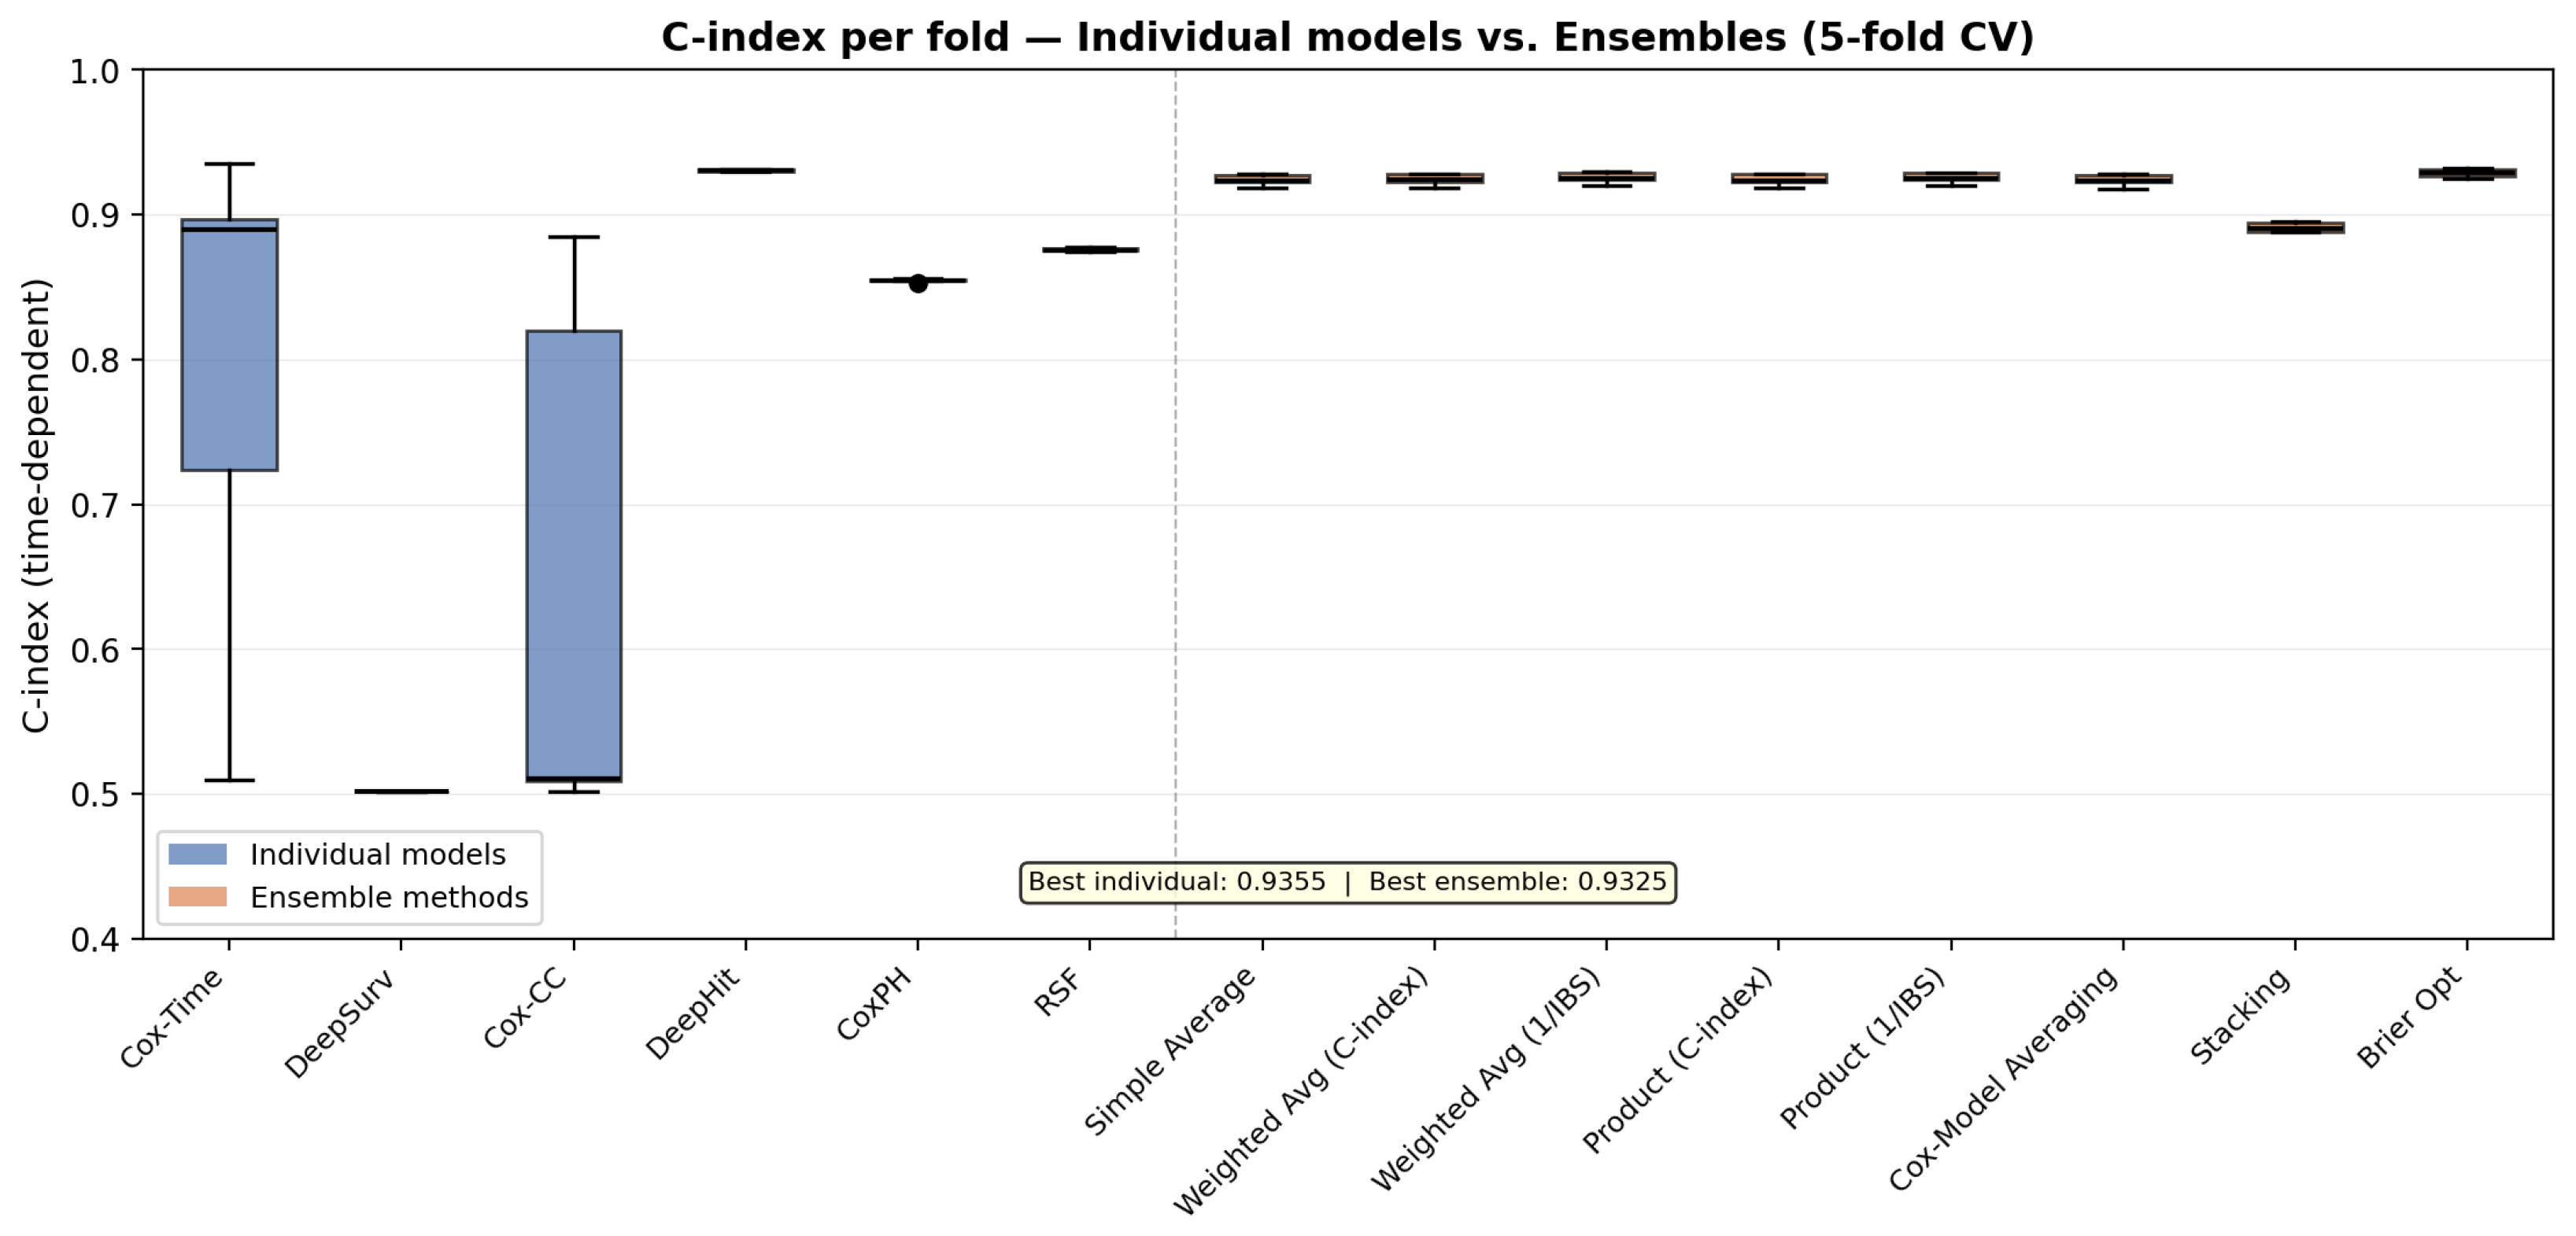
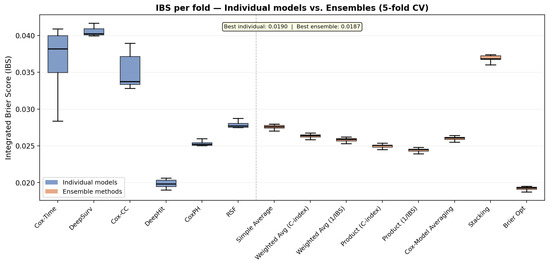
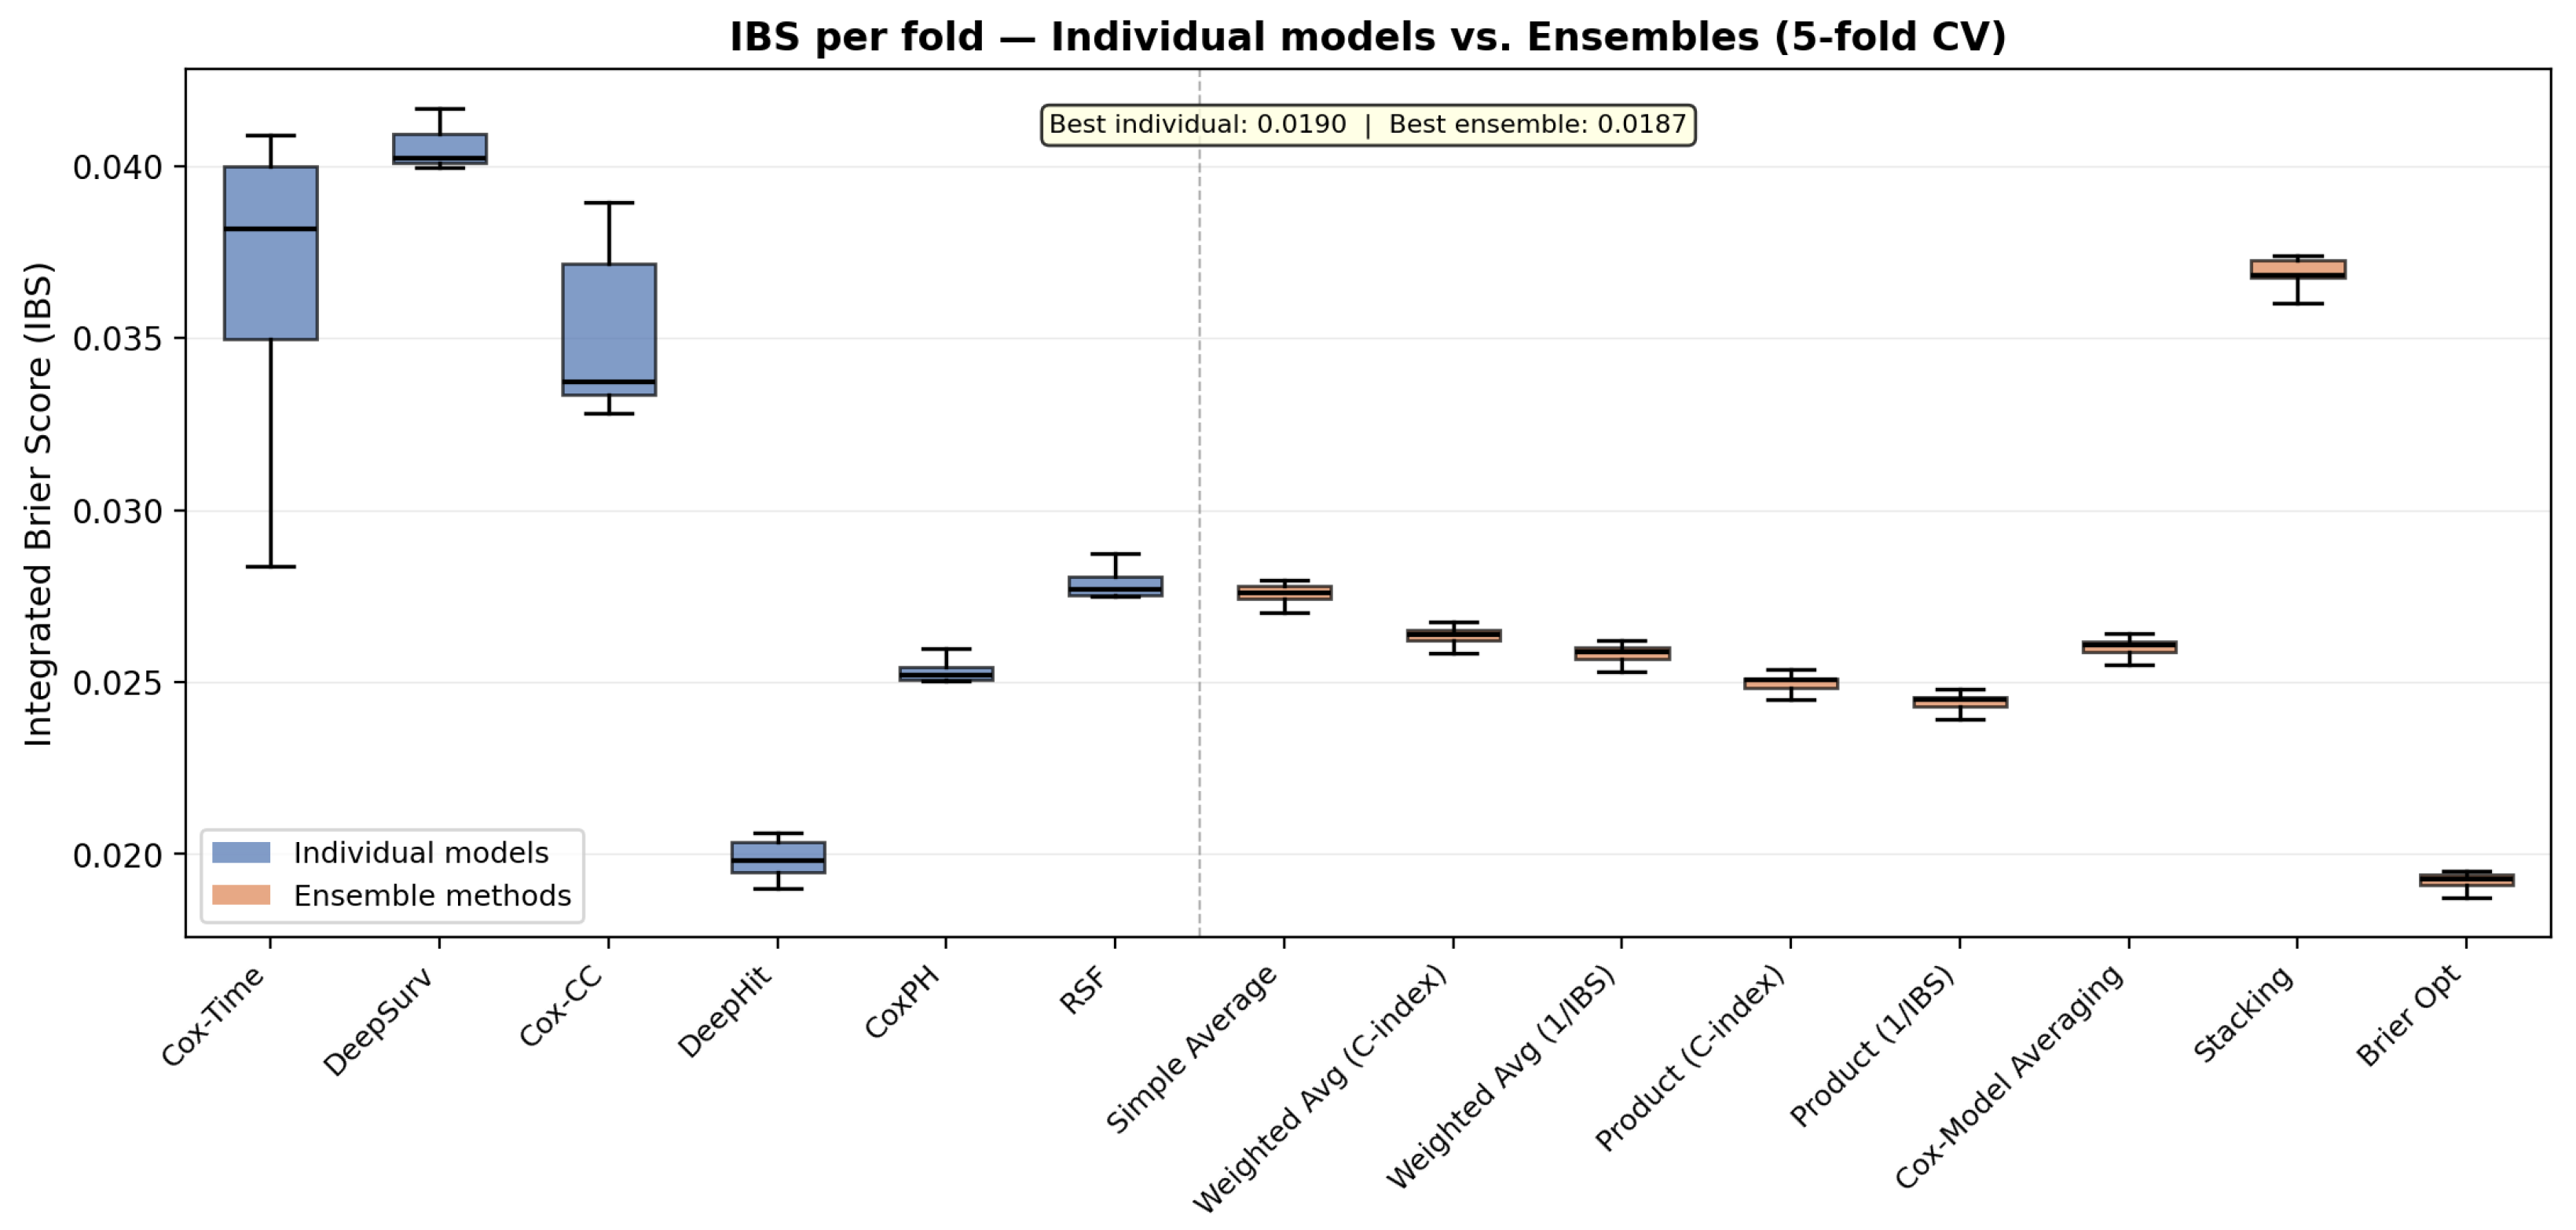
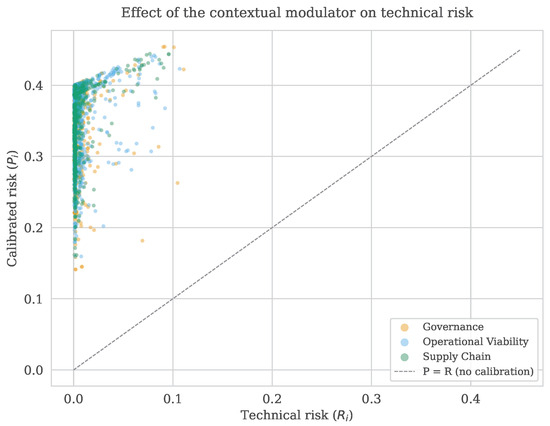
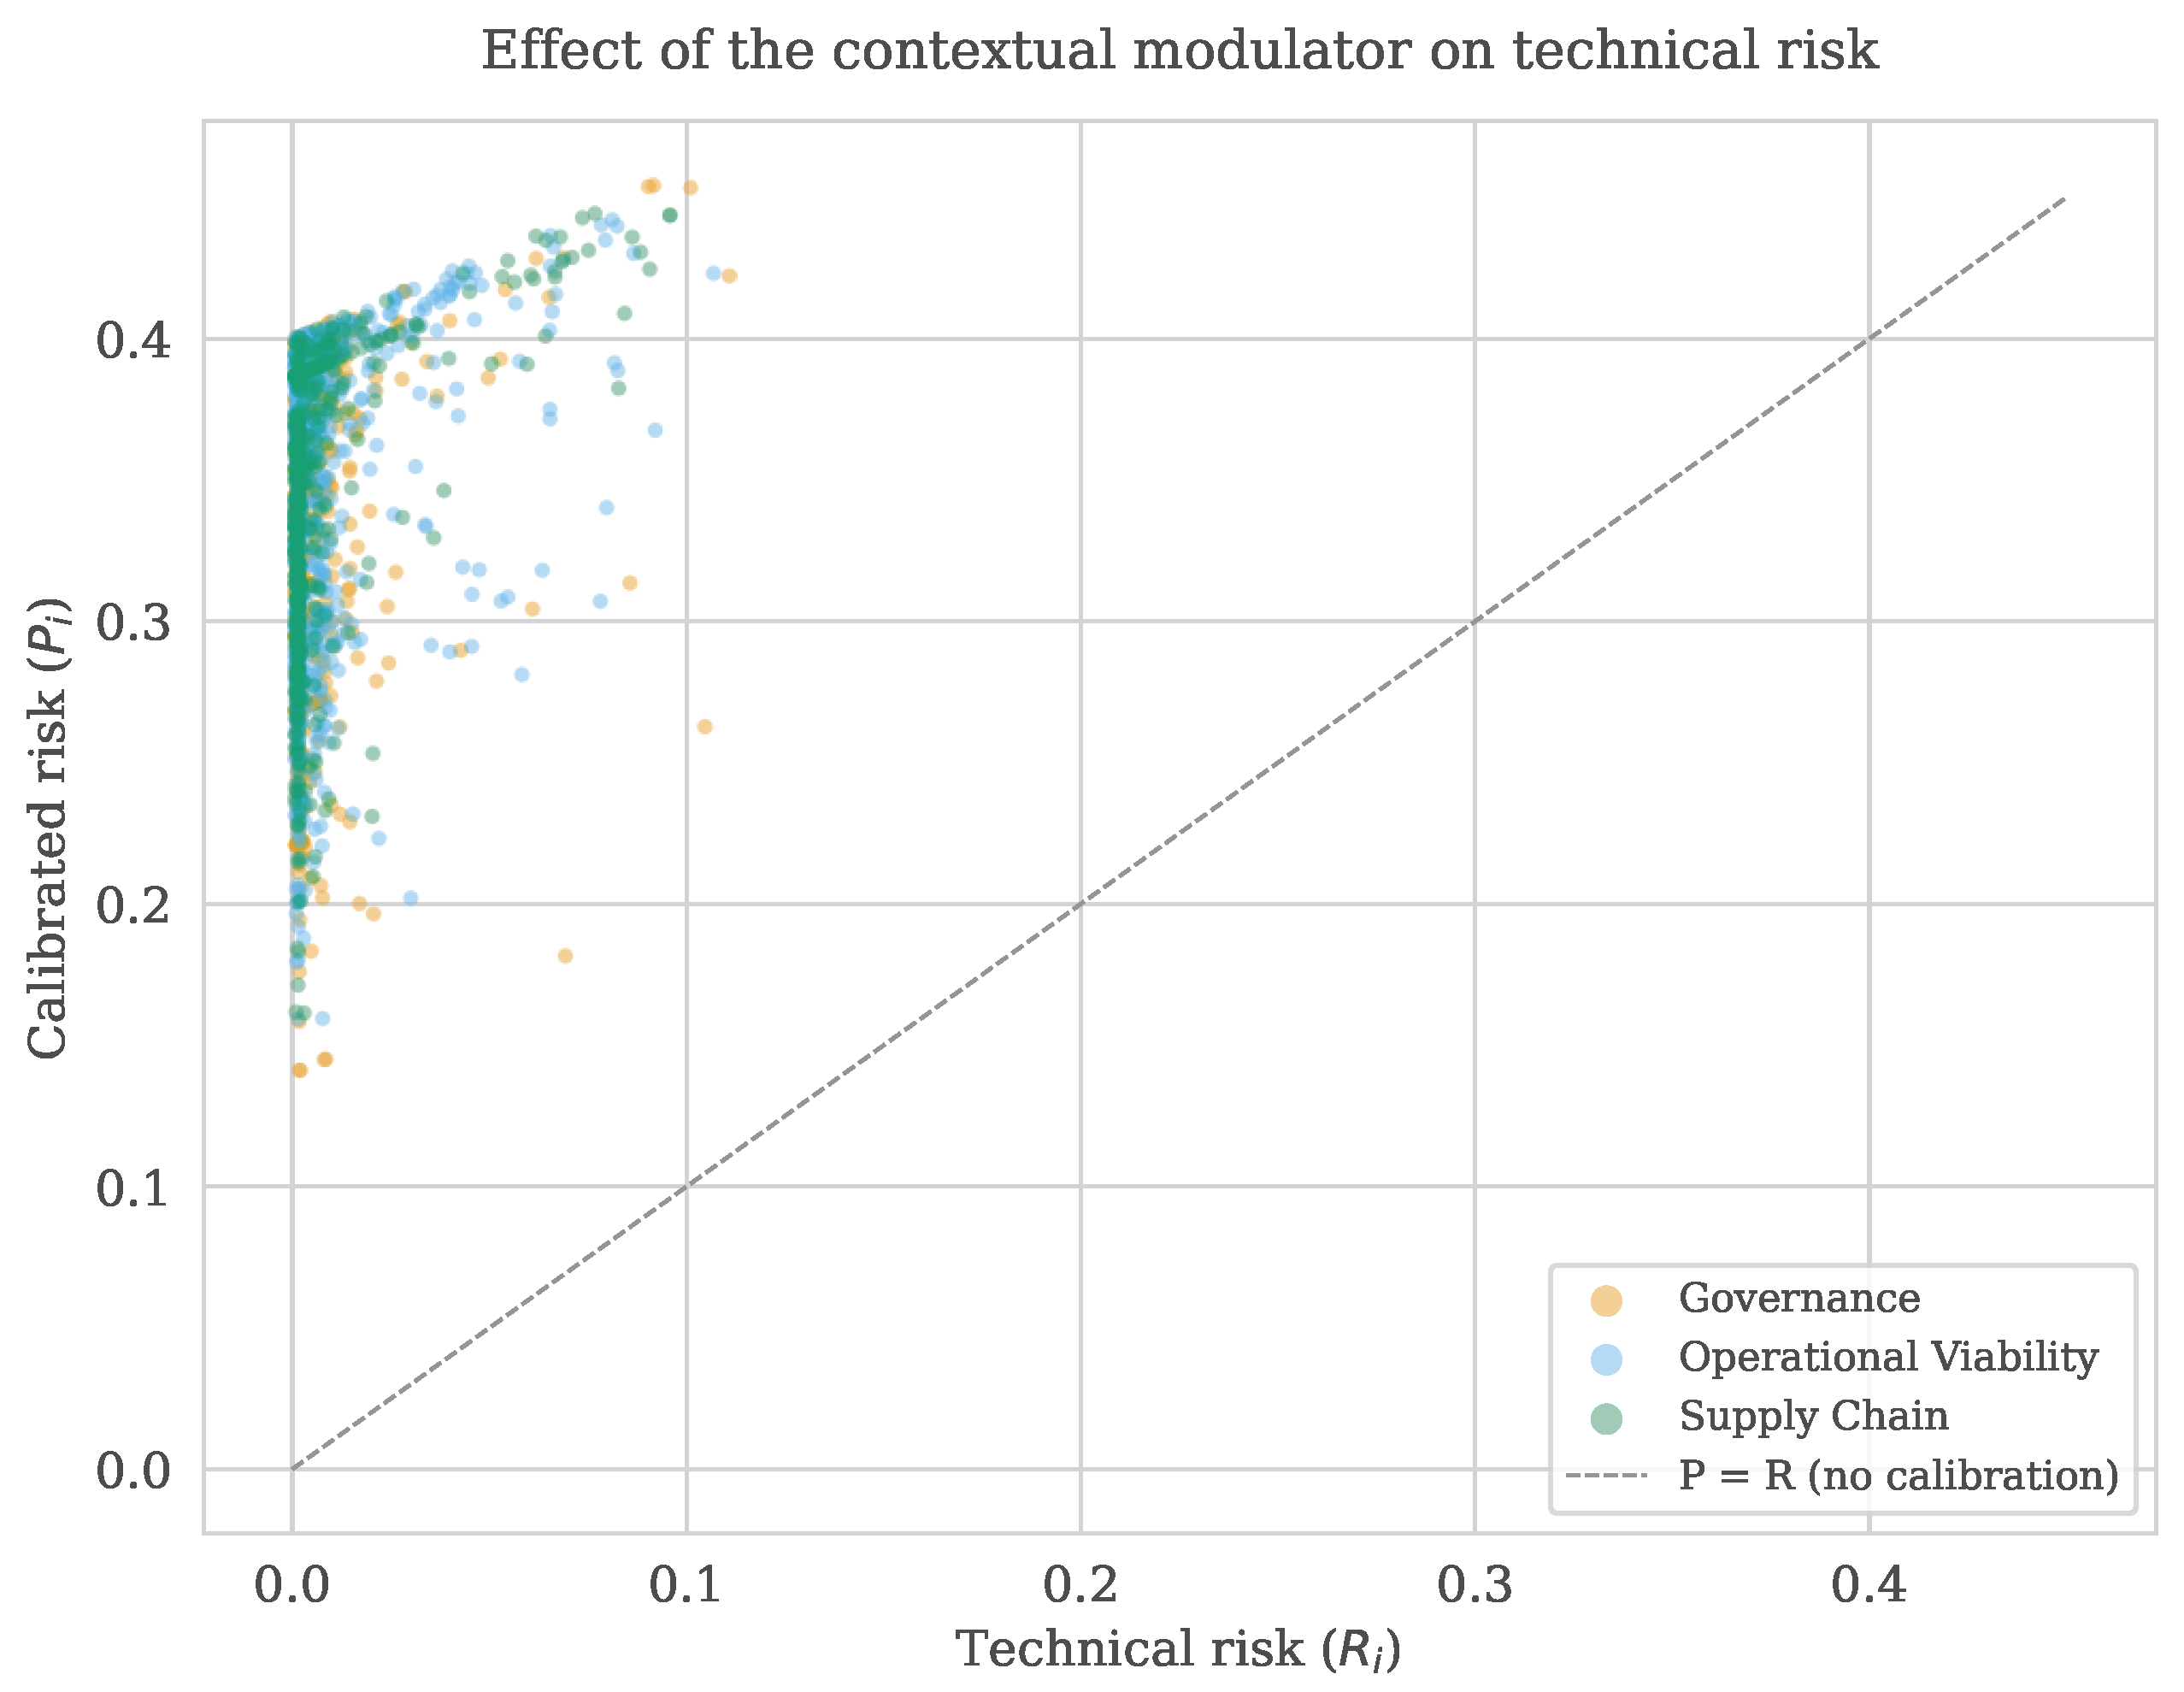

Disclaimer/Publisher’s Note: The statements, opinions and data contained in all publications are solely those of the individual author(s) and contributor(s) and not of MDPI and/or the editor(s). MDPI and/or the editor(s) disclaim responsibility for any injury to people or property resulting from any ideas, methods, instructions or products referred to in the content. |
© 2026 by the authors. Licensee MDPI, Basel, Switzerland. This article is an open access article distributed under the terms and conditions of the Creative Commons Attribution (CC BY) license.