


Abstract
Retrieval-augmented fine-tuning (RAFT) can improve small language models (sLMs) on retrieval-grounded question answering, but the synthetic training data produced by commercial large language models (LLMs) vary in quality. This paper contributes a quality-aware selection protocol—rather than a new RAFT or QLoRA method—that scores LLM-generated alternatives along four embedding-based dimensions (question relevance, answer faithfulness, QA coherence, and semantic similarity) and selects one alternative per task before parameter-efficient fine-tuning. Under pre-specified paired-bootstrap contrasts with Holm correction, the parameter-free faithfulness-based selector only-AF significantly exceeds random selection on Gemma-2-9B-IT (ΔF1 = +0.106, 95% CI [+0.043, +0.174], Holm-corrected p = 0.019), and its pre-specified weighted companion af-70 (wAF = 0.70) shows the same confirmed pattern (Holm-corrected p = 0.002). Both effects persist under a Korean character-level F1 that removes particles and punctuation (Holm-corrected p = 0.004 and p = 0.042), indicating robustness to the choice of lexical metric. Relative to training on the full 150-row augmented pool, the quality-selected 50-row sets are statistically indistinguishable while using one third of the training data, which we interpret as data efficiency rather than superiority. Across six instruction-tuned models (2B–27B), a significant selector-by-model interaction indicates that the optimal quality axis is model-dependent, and the two smallest models show no benefit from selection. The study’s confirmatory contrasts use a small controlled Korean corpus under a transductive design; two pre-registered validation experiments probe external validity. On an independent five-fold larger corpus with a passage-level train/test split, fine-tuning transfers strongly and the selected one-third subsets show no significant difference from the full pool, while the advantage over random selection is directionally positive but small and not significant; under controlled corruption of 35% of the pool, the metrics detect the damaged rows, and for the score-sum selector the selection-versus-random benefit is significantly larger than on the clean pool (difference-in-differences p = 0.0014; directionally consistent but not significant for the faithfulness selectors). Within this scope, quality-aware selection is a promising, data-efficient safeguard for synthetic RAFT data—performing comparably to full-pool training at one third of the cost, with growing value as pool quality degrades—and larger-scale external validation remains future work.
Keywords:
retrieval-augmented generation; retrieval-augmented fine-tuning; small language models; data selection; quality metrics; QLoRA; parameter-efficient fine-tuning; natural language processing MSC:
68T50; 68T07; 68T05
1. Introduction
Large language models (LLMs) frequently suffer from hallucinations when queried about specific knowledge domains not covered during pre-training. To ensure factuality, the retrieval-augmented generation (RAG) framework—which provides external document chunks as context—has become a standard methodology. However, small language models (sLMs) often lack the instruction-following capabilities required to accurately extract information from multiple retrieved passages. This limitation is especially severe in low-resource or specialized domains, where open-source sLMs are unlikely to have received sufficient pre-training coverage and are therefore prone to distraction by irrelevant passages and to hallucination [1,2].
To overcome these limitations in instruction following and evidence grounding, retrieval-augmented fine-tuning (RAFT) has gained attention. Unlike standard fine-tuning, RAFT trains models to derive answers through an explicit chain-of-thought process over both gold passages and distractors [3], improving noise filtering and evidence grounding. However, using commercial LLMs to synthesize this training data in low-resource domains presents a paradox: although such models are introduced precisely to curb hallucination, the chain-of-thought paths they generate can themselves be noisy or imprecise when their prior knowledge is mismatched to a specialized domain. This risk is especially problematic in resource-constrained settings, where even a small amount of low-quality supervision can distort the learning trajectory of an sLM. Accordingly, two underexplored questions become central: (1) whether quality-based selection of synthetic samples can outperform raw quantity scaling, and (2) whether one quality axis is universally dominant or instead model-dependent.
To address these challenges, this study proposes a quality-aware selection framework for synthetic RAFT training data. Given multiple LLM-generated alternatives per task, the framework scores each candidate along four embedding-based quality dimensions—question relevance (QR), answer faithfulness (AF), QA coherence (QC), and semantic similarity (SS)—using sentence-embedding similarity and BERTScore [4], then selects one alternative per task under a family of selection strategies. While the primary contribution of this study is the selection protocol and its empirical evaluation rather than the automation of RAFT itself, the study nevertheless implements the full workflow—augmentation, scoring, selection, and QLoRA fine-tuning—as a reproducible end-to-end experimental procedure.
These questions structure the study as four numbered research questions. RQ1 (metric discriminability): Do the four embedding-based quality axes meaningfully separate the augmented alternatives within each task? RQ2 (selection versus random): Do quality-aware selectors outperform size-matched random selection? RQ3 (selection versus the full pool): Can a quality-selected subset match training on the full augmented pool while using a fraction of the data? RQ4 (cross-model universality): Is any single quality axis universally optimal across model families and scales? Section 5 reports the results in this order: Section 5.1 addresses RQ1, Section 5.2.1, Section 5.2.2, Section 5.2.3 and Section 5.2.4 address RQ2, Section 5.2.5 addresses RQ3, and Section 5.3, Section 5.4 and Section 5.5 address RQ4. Section 5.9 and Section 5.10 then report two pre-registered external-validation experiments: an independent-corpus study with a train/test split and a controlled pool-corruption study.
In answering these research questions, this paper makes three contributions, all centered on the selection protocol rather than on RAFT or QLoRA, as such:
- (1)
- A quality-aware selection protocol for synthetic RAFT data. We define four deterministic, embedding-based quality dimensions (QR, AF, QC, SS) and a family of selection strategies—unweighted summation (sum-top1), single-axis rules (only-X), leave-one-out rules (loo-X), and convex combinations including a pre-specified AF-emphasis weighting (af-70)—for choosing one augmented alternative per base task before QLoRA fine-tuning. The per-axis scores are interpretable, computed without LLM judges at selection time, and are shown to discriminate among alternatives within tasks (RQ1). The end-to-end workflow from seed corpus to fine-tuned model is fully scripted for reproducibility, but the scientific claim is the selection protocol and its evaluation design, not pipeline automation, RAFT, or QLoRA themselves.
- (2)
- A pre-specified statistical evaluation design with confirmatory evidence that quality-aware selection outperforms random selection. The main contrasts are fixed in advance and tested with paired-bootstrap resampling and Holm correction for multiple comparisons. On Gemma-2-9B-IT, the parameter-free only-AF and its pre-specified weighted companion af-70 significantly exceed the random-selection mean under both whitespace token F1 (Holm-corrected p = 0.019 and p = 0.002) and a Korean character-level F1 (Holm-corrected p = 0.004 and p = 0.042), and subsampling analyses preserve the sign of these contrasts in at least 99.8% of resamples (RQ2). Relative to the full augmented pool alt150, the quality-selected sets are statistically indistinguishable while training on one third of the data, which we frame as data efficiency rather than superiority (RQ3).
- (3)
- A cross-model testing framework for universal-axis assumptions. Across six instruction-tuned models from 2B to 27B parameters, a mixed-effects analysis with per-question random effects detects a significant selector-by-model interaction (likelihood-ratio test, p = 2.2 × 10⁻⁷ for token F1 and p = 0.011 for character F1), establishing statistically that the optimal quality axis is model-dependent (RQ4). One directional falsification is tested explicitly—only-QC exceeds only-AF on Qwen2.5-14B under token F1—while per-model axis rankings beyond this contrast are treated as exploratory (descriptive and hypothesis-generating) observations. On the two smallest models, no selection track yields a measurable benefit, delimiting an empirical capacity floor for the protocol. The framework also contrasts deterministic embedding-based selection with an LLM-as-judge baseline.
Taken together, these contributions provide a reproducible protocol for testing when quality-based selection helps under fixed retrieval, prompting, and decoding settings, with all claims scoped to the small controlled Korean corpus and the 2B–27B instruction-tuned models examined. Two further pre-registered experiments—an independent-corpus validation with a train/test split and a controlled pool-corruption study (Section 5.9 and Section 5.10)—test this scope directly, and their outcomes, including the null ones, are reported in full.
The remainder of this paper is organized as follows. Section 2 reviews related work on the cognitive limitations of sLMs in RAG, RAFT, synthetic data synthesis and validation, data selection, and parameter-efficient fine-tuning. Section 3 details the proposed quality-aware selection framework and its implementation as a reproducible RAFT protocol. Section 4 describes the experimental setup. Section 5 reports the empirical results and analysis. Section 6 discusses the findings, scope, and limitations, and Section 7 concludes.
2. Related Work
This section reviews the foundational research underlying this study, categorized into five primary areas: cognitive limitations of sLMs in RAG contexts, retrieval-augmented fine-tuning (RAFT) methodologies, synthetic data synthesis and validation, data selection for training, and parameter-efficient fine-tuning (PEFT) techniques. It highlights the critical challenges of processing multi-passage contexts under resource constraints and motivates the proposed quality-aware selection framework for synthetic RAFT data.
2.1. Cognitive Limitations of sLMs in RAG
Retrieval-augmented generation (RAG) has become a standard methodology for addressing hallucinations by providing external knowledge to models. However, recent studies have identified significant cognitive bottlenecks when applying RAG to sLMs. Notably, the “Lost in the Middle” phenomenon has been empirically demonstrated, where models struggle to utilize information located in the center of long contexts [1]. Furthermore, research has confirmed that sLMs are easily distracted by irrelevant documents (distractors), leading to a sharp decline in reasoning accuracy [2].
These findings suggest that simply providing retrieved context is insufficient; instead, sLMs must be explicitly trained to distinguish between relevant and irrelevant information within a multi-document environment.
2.2. Retrieval-Augmented Fine-Tuning (RAFT)
To overcome these cognitive limitations, the retrieval-augmented fine-tuning (RAFT) methodology was proposed, which trains models to derive answers through an explicit chain-of-thought (CoT) process amid a mix of gold passages and distractors [3]. This approach enables models to ignore noise and prioritize evidence found within the provided context.
While RAFT has proven effective in improving the noise-filtering capabilities of sLMs, existing studies have primarily relied on pre-existing, human-curated English datasets. When RAFT training data are instead synthesized by commercial LLMs for resource-constrained, non-English domains, the resulting alternatives vary in quality; yet, how to select among them has received little attention. This motivates a quality-based criterion for choosing which synthetic alternatives to train on, rather than relying on the full unfiltered pool.
2.3. Synthetic Data Synthesis and Validation
Synthetic data generation via LLMs has become a common remedy for data scarcity in specialized domains; for example, Self-Instruct [5] bootstraps instruction-following data from a small seed using a model’s own generations. However, synthetic data reliability remains a core challenge for RAFT, because noisy chain-of-thought supervision can distort the learning trajectory of small models. To estimate supervision quality without human labels, prior work relies on embedding-based similarity measures such as BERTScore [4] and on reference-free, retrieval-oriented evaluation frameworks such as RAGAS [6], which are typically applied post hoc for diagnostic reporting.
Recent work has systematized this concern beyond individual evaluation tools: surveys of LLM-driven synthetic data generation emphasize that curation and evaluation are integral to the generation loop rather than optional postprocessing [7], and evidence on model collapse shows that indiscriminate training on recursively generated data progressively degrades model quality [8]. These findings reinforce the premise of this study that synthetic supervision should be quality-controlled at selection time rather than merely accumulated.
A central design choice in this study is to repurpose such embedding-based signals from post hoc evaluation into an active, pre-fine-tuning selection criterion; how the resulting candidates are selected is the subject of Section 2.4. Because one judge model (gpt-4.1-mini) also participates in augmentation, the RAGAS diagnostics reported later in this study are treated strictly as supplementary rather than primary evidence.
2.4. Data Selection for Training
Beyond how data are generated, deciding which examples to train on has emerged as a decisive factor for fine-tuning quality. A growing body of work shows that small, carefully selected datasets can match or surpass much larger but noisier ones: LIMA [9] reached competitive instruction-following performance with only 1 K curated examples, and AlpaGasus [10] filtered Alpaca data with a quality classifier and retained comparable performance using 9 K of the original 52 K samples. More systematic criteria have since appeared; DEITA [11], for instance, scores instruction data jointly along complexity and quality to automate selection at scale. This study transfers the same quality-over-quantity principle from instruction tuning to the RAFT setting, where the unit of selection is a (question, chain-of-thought, answer) alternative grounded in a multi-passage context rather than a free-form instruction.
Subsequent work has broadened the space of selection signals: instruction-following difficulty scores derived from the student model itself [12], gradient-based influence estimation for targeted selection [13], LLM-derived quality ratings for large-scale corpora [14], weak-to-strong filtering in which a small model selects data for a larger one [15], and tag-based measures of instruction diversity and complexity [16]; see [17] for a comprehensive taxonomy. Most of these signals either are model-dependent or require additional LLM inference at selection time, whereas the present study deliberately restricts itself to deterministic, model-agnostic embedding scores so that a single scored pool can serve every student model.
A natural way to operationalize selection is to use a strong LLM as judge [18]. While conceptually attractive, LLM-as-judge has known limitations: severe positional and length biases, low inter-judge agreement across model families, and ceiling effects when scoring already high-quality, model-generated content. These limitations motivate a deterministic, embedding-based alternative. Rather than a single opaque judge score, this study defines four interpretable quality axes and compares the resulting selectors against an LLM-as-judge baseline in Section 4, so that the contribution of each quality dimension can be examined explicitly.
2.5. Parameter-Efficient Fine-Tuning (PEFT)
Fine-tuning sLMs requires substantial computational resources, making parameter-efficient fine-tuning (PEFT) techniques essential for practical optimization. Key methodologies include low-rank adaptation (LoRA), which drastically reduces the number of trainable parameters [19], and QLoRA, which further optimizes this process by allowing 4-bit quantized training on consumer-grade hardware [20]. Since these techniques are highly sensitive to the quality of training signals, the success of fine-tuning depends heavily on the purity of the dataset. This work leverages QLoRA as fixed infrastructure and studies how the quality of the selected training data affects downstream performance in resource-constrained environments.
Against this background, the present study does not claim novelty in automating RAFT training pipelines per se. Instead, it contributes a quality-aware selection protocol for choosing among synthetic RAFT alternatives and tests that protocol empirically under a fixed, reproducible experimental workflow.
3. Materials and Methods
This section describes the quality-aware selection framework and its implementation as a reproducible RAFT experimental protocol. The workflow consists of five sequential stages: (1) diverse synthetic data augmentation from a seed corpus using a commercial LLM, (2) embedding-based four-metric quality scoring of every augmented sample, (3) per-task selection of a single high-quality sample according to a family of selection strategies, (4) parameter-efficient fine-tuning of small LMs using QLoRA on the selected training set, and (5) a training-aligned evaluation protocol that reproduces the exact generation format used during fine-tuning. Each stage is described in turn.
3.1. Overall Pipeline
The input to the proposed pipeline is a seed corpus, structured as a set of base records. Each base record contains a question, a chain-of-thought rationale, a gold answer, and a retrieved multi-passage context that combines one gold passage with several distractor passages of similar surface form.
The pipeline transforms the seed corpus into three artifacts: (i) a synthetically augmented sample pool produced by a commercial large language model, (ii) per-sample quality scores along four embedding-based dimensions, and (iii) a compact selected training set obtained by applying one of several selection rules to the scored pool. Stages corresponding to artifacts (i) through (iii) are independent of the downstream model and are executed once; only the fine-tuning and evaluation stages are repeated per base model. Figure 1 summarizes the end-to-end pipeline, and Algorithm 1 in Section 3.4 states the complete selection procedure in pseudocode.
Figure 1.
End-to-end method pipeline used in this study (generation, scoring, selection, fine-tuning, and paired evaluation).
3.2. Diverse Synthetic Data Augmentation
For each base record, the pipeline generates multiple synthetic alternatives by prompting a commercial large language model with the multi-passage context and asking it to produce a fresh (question, chain-of-thought, answer) tuple that is grounded in the context. The same fixed prompt and instruction are reused for every alternative; diversity within a task is induced solely by varying the decoding temperature and random seed across calls, so that the within-task variation reflects the model’s natural generation diversity rather than handcrafted style templates. This yields a sample pool in which each base record is associated with several semantically grounded but linguistically distinct alternatives. These alternatives pose diverse new questions drawn from the shared passage pool rather than paraphrases of the base question, and the fifty original base questions reserved for evaluation never appear among the training alternatives. Each alternative answer is generated to be supported by the passages, so the pool offers varied yet grounded supervision to select from.
To verify that generated alternatives are genuinely diverse rather than near-paraphrases, the pipeline computes two within-task diagnostic statistics: average pairwise Jaccard token similarity (answer/CoT/question) and standard deviation of generated lengths. These diagnostics are not used as selector features; they are used only to validate that augmentation introduces enough variation for quality-based ranking to be meaningful. The realized values on the 150-row pool are reported explicitly in the Section Augmentation Diversity Diagnostics.
3.3. Four-Metric Quality Scoring Framework
Each augmented sample (q, c, a) is scored along four embedding-based quality dimensions, all bounded to the [−1, 1] range:
Question relevance (QR). The maximum cosine similarity between the sentence embedding of the question q and the embedding of any retrieved context chunk. QR captures whether the generated question is grounded in the provided passages rather than referring to unrelated knowledge.
Answer faithfulness (AF). The maximum cosine similarity between the embedding of the answer a and the embedding of any context chunk. AF captures whether the answer can be supported by some passage in the context, providing a lightweight proxy for hallucination filtering.
QA coherence (QC). The cosine similarity between the embeddings of the question q and the answer a. QC captures whether the generated answer actually addresses the generated question, independent of the context.
Semantic similarity (SS). The BERTScore F1 [4] between the answer a and the context chunk most similar to it (the chunk c* of Equation (4)). SS captures a finer-grained token-level alignment between the answer and its supporting passage that complements the coarser cosine measure used by AF.
In this implementation, the sentence encoder E used for the cosine-similarity metrics (QR, AF, QC) is the Hugging Face checkpoint sentence-transformers/paraphrase-multilingual-MiniLM-L12-v2, and BERTScore for SS uses bert-base-multilingual-cased as the contextual backbone. A separate, larger encoder, intfloat/multilingual-e5-large, is used only to construct the top-5 retrieved multi-passage contexts and plays no role in quality scoring. All four metrics are deterministic given these fixed checkpoints, and the complete per-alternative scores used for every selection in this study are archived in the public repository. For each augmented sample the pipeline also stores the unweighted sum Ssum = QR + AF + QC + SS as a default aggregate score used by sum-based selectors (Equation (5)).
Construct validity of the four axes rests on protocol separation rather than on the downstream scores. The metrics QR, AF, QC, and SS are computed at augmentation time purely from question–answer–context relations, before any fine-tuning or evaluation, and the selector never observes the evaluation answers or optimizes token-F1 directly. Because the scoring stage is defined independently of the downstream metric, it cannot trivially encode that metric, which distinguishes the proposed embedding-based criterion from a circular, outcome-driven score.
The four axes (Equations (1)–(4)) are designed to measure the supervision quality of each generated (question, chain-of-thought, answer) alternative; they are not designed to measure properties of the retrieval configuration itself, such as the hardness of the distractor passages that the RAFT format prepends during training. Because all alternatives within a task share the same fixed passage pool, distractor hardness is a property of the task rather than of the candidate being scored. Section 5.7 verifies post hoc that this design boundary does not confound the selector comparisons in the present corpus, and Section 6.1 records it as a limitation.
3.4. Selection Strategies
The four axes are not an arbitrary scoring bundle: each is chosen as a lightweight, embedding-computable proxy for a distinct, well-documented failure mode of synthetic QA supervision. QR targets topic drift—generated questions that are not grounded in the provided passages and therefore train the student on off-corpus knowledge. AF targets hallucinated or ungrounded answers—content that no context chunk supports, the failure mode most directly harmful to a retrieval-augmented student. QC targets question–answer mismatch—fluent answers that do not actually address their paired question, which corrupts the instruction-following signal. SS targets surface-level alignment—finer-grained token-level agreement between the answer and its supporting chunk that the coarser cosine of AF can miss. Because the four failure modes are conceptually distinct (and empirically only partially correlated), scoring each sample along all four axes provides complementary rather than redundant filters over the augmentation pool.
Given the four-metric scores for the three alternatives within each task group, we study a family of selection strategies that share a single mathematical form. Let At = {at,1, at,2, at,3} denote the alternatives generated for base task t ∈ T, and let m(a) = (QR(a), AF(a), QC(a), SS(a)) ∈ [−1, 1]4 denote the metric vector of alternative a, whose components are the four scores of Equations (1)–(4) evaluated for a with its question and retrieved context. Every selector in this study is an argmax rule parameterized by a non-negative weight vector w = (wQR, wAF, wQC, wSS ) each alternative receives the scalar score
and the selected alternative for task t is the argmax of this score over its task group,
so that the selected training set is D* = {a*t: t ∈ T}. Unless otherwise noted, each strategy selects a single alternative per task, yielding a compact training set of 50 samples; the only exception is sum-top2, which retains the two highest-ranked alternatives per task (100 samples). The individual strategies differ only in the choice of w, as follows.
Sum selection (sum-top1/sum-top2). Setting w = (1, 1, 1, 1) recovers ranking by the unweighted sum Ssum of Equation (5). The default compact recipe, sum-top1, keeps the single highest-scoring alternative per task (50 rows); sum-top2 instead keeps the two highest-ranked alternatives per task (100 rows) and serves as a probe for whether adding the second-ranked alternative helps. Both are compared so that the effect of keeping one versus two alternatives per task can be isolated.
Single-axis selection (only-X for X ∈ {QR, AF, QC, SS}). Setting w to the unit vector eX—for example, w = (0, 1, 0, 0) for only-AF—ranks alternatives by a single metric in isolation. These strategies serve as ablations that isolate the contribution of each quality dimension.
Leave-one-out selection (loo-X). Setting w = 1 − eX, that is, the all-ones vector with a zero in position X—for example, w = (1, 0, 1, 1) for loo-AF—ranks alternatives by the sum of the three metrics other than X. The drop in downstream performance between sum-top1 and loo-X measures the marginal contribution of metric X.
Weighted selection. Here, w is a convex combination with non-negative weights summing to one. The pre-specified AF-emphasis setting af-70 uses w = (0.1, 0.7, 0.1, 0.1), that is, wAF = 0.70 with the remaining mass split evenly over QR, QC, and SS. We emphasize that such convex weightings are heuristic scalarizations of the four quality axes rather than solutions of a mathematical optimization problem; deriving w by optimizing evaluation performance would introduce exactly the circularity that the protocol is designed to avoid, so the sensitivity of downstream performance to wAF is instead reported descriptively in Section 5.2.3. Finally, the worst-quality control anti-sum replaces the argmax with an argmin under w = (1, 1, 1, 1), selecting the lowest-scoring alternative within each task.
For comparison, the pipeline also supports a large-language-model-as-judge baseline. In this baseline, one or more commercial language models independently score each alternative on a numeric quality rubric, and the alternative with the highest averaged judge score is selected for the task. This baseline is intended to test whether direct LLM quality evaluation can replace embedding-based metric scoring.
All embedding-based strategies above are instances of a single procedure (Equations (6) and (7)), differing only in the weight vector w (and, for sum-top2, in retaining the top two ranked alternatives; for anti-sum, in replacing the argmax with an argmin). Algorithm 1 summarizes the complete quality-aware selection workflow from the base task set to the fine-tuned model.
| Algorithm 1 Quality-Aware RAFT Data Selection |
| Input: base task set T = {t1, …, tn} with multi-passage contexts; LLM generator G; quality metrics {QR, AF, QC, SS}; weight vector w ∈ ℝ4, w ≥ 0; alternatives per task k |
| Output: selected training set D*; fine-tuned adapter θ* |
| 1: for each task t ∈ T do |
| 2: At ← {G(t; τj, seedj): j = 1, …, k} ▷ generate k alternatives (k = 3; Section 3.2) |
| 3: for each alternative a ∈ At do |
| 4: m(a) ← (QR(a), AF(a), QC(a), SS(a)) ▷ embedding-based quality scoring (Section 3.3) |
| 5: end for |
| 6: sw(a) ← w · m(a) for all a ∈ At ▷ selector score |
| 7: rank At by sw in descending order ▷ ranking |
| 8: a*t ← argmaxa ∈ At sw(a) ▷ top-1 selection |
| 9: end for |
| 10: D* ← ⋃t ∈ T {a*t} ▷ merge selected samples (|D*| = n) |
| 11: θ* ← QLoRA-FineTune(base model, D*) ▷ parameter-efficient fine-tuning (Section 3.5) |
| 12: return D*, θ* |
3.5. RAFT with QLoRA
Each selected training set is converted to the RAFT training format [3]. Following the standard RAFT construction, every training instance mixes one gold (oracle) passage with several distractor passages, and the model receives (i) the original question, (ii) the multi-passage context concatenating the gold passage with the distractor passages in shuffled order, and (iii) a target sequence consisting of an explicit chain-of-thought block followed by a final-answer block, separated by fixed section headers. This format encourages the model to reason explicitly over the multi-passage context before committing to a final answer and to remain robust to the presence of distractor passages.
Fine-tuning is performed parameter-efficiently using QLoRA. The base model is loaded with 4-bit weight quantization, and low-rank adaptation modules are inserted into the projection matrices of the attention and feed-forward layers, while the remaining weights are kept frozen. Optimization uses the AdamW algorithm with a cosine learning-rate schedule and a short warmup phase. The same training procedure and the same hyperparameter settings are used for every selected training set and for every base model, so that downstream differences can be attributed to the choice of training data rather than to per-model tuning. Exact hyperparameter values and the hardware configuration are reported in Section 4.
3.6. Training-Aligned Evaluation Protocol
Throughout this study, a training-aligned inference protocol is adopted. Under this protocol, every RAFT-fine-tuned model is prompted in the same format used during training: the prompt ends with the chain-of-thought header, and the model first autoregressively generates the chain-of-thought and then the final-answer block. The final answer is then deterministically extracted by locating the last occurrence of the final-answer header in the generation and truncating at the subsequent section boundary or sentence terminator. This deterministic extraction procedure is used for every model.
All RAFT models, together with a baseline retrieval-augmented generation (RAG) condition that uses the un-fine-tuned base model with retrieval-augmented prompting, are evaluated on the same held-out evaluation set. Token-level F1 is the primary reporting metric. To assess statistical reliability of pairwise comparisons, we compute paired-bootstrap 95% confidence intervals [21] for mean per-item F1 differences and report Cohen’s dz effect sizes [22]. Comparisons whose 95% interval excludes zero are treated as statistically reliable; intervals including zero are interpreted as directional evidence only.
3.7. Reproducibility and Control Design
To make selector comparisons reproducible, all non-selector factors are held fixed: the same fifty base tasks, the same augmentation pool (three alternatives per task), the same retrieval setting (top-5), the same deterministic answer-extraction rule, and the same 512-token decoding budget for the reported main runs. This ensures that track-level differences are attributable to data selection rather than to prompt-format or decoding confounds.
The pipeline stages are also separated by role: augmentation and metric scoring are executed once to produce a shared candidate pool, while fine-tuning is repeated per model-track cell under identical training hyperparameters. This separation prevents hidden interactions between data construction and model-specific tuning from being mistaken for selector effects.
4. Experimental Setup
This section describes the experimental setup used to evaluate the proposed pipeline. The setup is organized into the seed corpus and base records, the augmentation configuration, the quality-scoring models, the inventory of selection strategies under comparison, the student models and their fine-tuning configuration, the evaluation protocol, the evaluation metrics, and the statistical analysis procedure. Throughout this section we describe only the experimental conditions; the resulting numbers and their analysis are reported in Section 5.
4.1. Datasets
All experiments use a fixed seed corpus of ten Korean encyclopedic passages about the Republic of Korea, constructed for this study rather than extracted from an external source corpus; Table 1 summarizes the dataset specification and Table 2 lists the ten seed topics.
Table 1.
Dataset specification for the controlled RAFT benchmark.
Table 2.
Ten seed-corpus topics (Korean passages constructed for this study).
From these passages we build fifty base records—each with a question, a chain-of-thought rationale, a gold answer, and a retrieved multi-passage context (one oracle passage plus four distractors)—and three LLM-generated alternatives per task (150 scored rows in total).
Evaluation is transductive: the same fifty base tasks seed augmentation and form the held-out test set. Training uses alternative surface forms, not the evaluation gold answers, and no track optimizes token-F1 directly. All comparisons are therefore read as controlled relative effects among selectors under a shared protocol; generalization to disjoint task pools is tested directly in the pre-registered independent-corpus experiment of Section 5.9 (see also Section 6.1). A direct leakage check in Section 5.6 confirms that selected training answers do not approximate the gold answers.
4.2. Augmentation Configuration
For each of the fifty base records, three synthetic alternatives are generated, producing an augmented pool of 150 alternatives in total. Generation is performed by querying the commercial model gpt-4.1-mini through the OpenAI API (Python SDK: v2.12.0). The three alternatives for the same base record are obtained from three independent calls with decoding temperatures of 0.9, 1.0, and 1.1 and random seeds of 11, 23, and 47, respectively. The maximum number of generated tokens per call is 600, and parsing failures are retried up to three times. A single fixed prompt and instruction are used for all three calls; the alternatives differ only because each call uses a different temperature and seed, producing temperature-induced diversity rather than handcrafted stylistic variation.
4.3. Quality-Scoring Models
The first three quality dimensions (QR, AF, QC) are computed from cosine similarities between sentence embeddings from the Hugging Face checkpoint sentence-transformers/paraphrase-multilingual-MiniLM-L12-v2 [23]. The fourth dimension (SS) is BERTScore F1 [4] computed with bert-base-multilingual-cased as the contextual backbone [24]. The retrieval stage that assembles each five-passage context uses intfloat/multilingual-e5-large [25]; this retrieval encoder is not part of the quality-scoring stage. All four metrics are bounded to [−1, 1], and the same fixed scorers are used across all selector tracks.
4.4. Selection Strategy Inventory
The selection strategies are organized into six families (Table 3). Data scaling uses alt150 (all 150 rows). Balanced score-sum uses sum-top1 (top-1 per task) and sum-top2 (top-2 per task). Per-axis selectors (only-QR/AF/QC/SS) and leave-one-out selectors (loo-QR/AF/QC/SS) isolate metric contributions. Weighted selection uses a single AF-emphasis setting, af-70. Control selectors include anti-sum (the lowest Ssum alternative per task, worst-quality control) and random-seed23/41/53; random-mean denotes the arithmetic mean of these three random runs. As a non-embedding baseline, judge-avg selects alternatives by averaging two independent LLM-judge scores (gpt-4.1-mini and gpt-4o).
Table 3.
Selection strategy inventory and row budget in the experimental matrix.
All selectors except alt150 produce a training set of exactly fifty examples (one alternative per base record). The alt150 condition is therefore the only condition in which the model is exposed to three times as many training examples as the per-axis or weighted selectors, and serves as the data scaling reference.
As shown in Figure 2, the framework compares RAG-only, alt150 scaling, score-based selectors, and random controls under one unified evaluation protocol.
Figure 2.
Experimental track framework used in this study.
4.5. Student Models
Six instruction-tuned student models of varying capacities are considered: Gemma-2-2B-IT (Google), Gemma-2-9B-IT (Google), Gemma-2-27B-IT (Google), Llama-3.2-3B-Instruct (Meta), Llama-3.1-8B-Instruct (Meta), and Qwen2.5-14B-Instruct (Alibaba) [26,27,28]. Gemma-2-9B-IT is used as the primary student model for full selector ablation; the remaining models are used for cross-model validation. All models are loaded with 4-bit NF4 quantization and double quantization, with compute dtype set to float16.
4.6. Fine-Tuning Configuration
Fine-tuning is carried out with QLoRA. Low-rank adaptation matrices are attached to the seven projection modules q_proj, k_proj, v_proj, o_proj, gate_proj, up_proj, and down_proj, with rank r = 16, scaling factor α = 64, and dropout 0.1.
Training uses a per-device batch size of one with gradient accumulation over four steps, giving an effective batch size of four. The optimizer is paged AdamW (paged_adamw_32bit) with learning rate 1 × 10⁻⁴, weight decay 0.01, a cosine learning-rate schedule with five percent warmup, and gradient clipping at a maximum norm of 0.3. Training runs for twelve epochs over the selected training set. The training data are split ninety/ten into training and in-training evaluation portions; the in-training evaluation is used only for monitoring loss, not for model selection. The final adapter checkpoint after twelve epochs is used for downstream evaluation. All fine-tuning and evaluation runs are executed on a single NVIDIA A100 80 GB PCIe GPU.
Each cell of the experimental matrix (one student model × one selection strategy) corresponds to an independently fine-tuned adapter and an independently evaluated checkpoint. The base model parameters are never updated; only the LoRA adapter weights are learned.
4.7. Evaluation Protocol
Evaluation is conducted on a fixed set of fifty base questions. The same fixed set is reused across all tracks and student models so that comparisons remain paired and protocol-consistent; claims are interpreted as controlled relative effects rather than as broad out-of-domain generalization.
Two prompt formats are used. Under the RAG condition the prompt contains the question and the retrieved context, followed by a final-answer marker, and the un-fine-tuned base model is asked to produce only a final answer. Under the RAFT condition the prompt has the same structure as during training: the question, the retrieved context, an empty chain-of-thought marker, and an empty final-answer marker. The fine-tuned model first generates a chain-of-thought sentence and then a final answer; this is the training-aligned inference protocol described in Section 3.6.
Decoding uses sampling with temperature 0.1 and top-p 0.95. For all main comparative runs reported in this study, the maximum number of generated tokens is fixed to 512. The final answer used for scoring is extracted deterministically from the concatenation of the prompt and the model generation. We locate the last occurrence of the final-answer marker (### Final Answer:), take the text that follows it, and truncate at the next section header (###) when one appears; otherwise, we truncate at the first sentence period. For RAFT outputs, if a chain-of-thought header (### Chain Of Thought) reappears inside the answer span, only the text before that header is kept. The same rule is applied to the RAG baseline and to every RAFT track.
4.8. Evaluation Metrics
The primary evaluation metric is token-level F1. Predicted and gold answers are first obtained with the extraction procedure in Section 4.7, then split on whitespace into token sequences. Let Ŷ and Y denote the predicted and reference token multisets (token types counted with multiplicity) and let |Ŷ ∩ Y| denote the multiset intersection size. Precision, recall, and F1 are defined as follows.
If either the predicted or the reference answer is empty after extraction, F1 is defined as 0. All reported token-F1 scores are macro-averaged over the fifty evaluation questions unless noted otherwise.
As a secondary metric that addresses the agglutinative morphology of Korean, we additionally report character-level F1. Whitespace tokenization can penalize predictions that differ from the reference only in attached particles (josa) or punctuation, so predicted and gold answers are first processed with the MeCab morphological analyzer to strip particles (POS tags J*) and punctuation marks, and F1 is then computed by the same formula as in Equation (8) over character multisets rather than whitespace tokens. Token-level F1 remains the primary metric; character-level F1 is used to test whether the pre-specified conclusions are robust to the choice of lexical unit (Section 4.9).
4.9. Statistical Analysis
To assess whether observed mean F1 differences exceed sampling variation on the fifty-question evaluation set, we use paired-bootstrap resampling [21] (20,000 draws). The pre-specified comparison family consists of five contrasts—only-AF vs. random-mean, af-70 vs. random-mean, sum-top1 vs. random-mean, only-AF vs. alt150, and af-70 vs. alt150, with Holm correction applied within this family. The parameter-free selector only-AF is the headline confirmatory setting; af-70 (wAF = 0.70) is included as its pre-specified weighted companion, and because its weight vector is fixed by hand rather than mathematically optimized, its point score is additionally read as an illustrative upper bound, while the wider weight grid reported in Section 5.2.3 remains exploratory sensitivity analysis only. Token-level F1 is the primary metric for all confirmatory decisions; character-level F1 (Section 4.8) is reported for every contrast as a robustness check, with Holm correction applied separately within the same five-contrast family, and we state explicitly whether each confirmed conclusion also holds under the character-level metric. Three supporting analyses complete the statistical protocol: (i) an appendix table reporting every track-versus-RAG contrast, and the four principal track-versus-alt150 contrasts (sum-top1, only-AF, only-QC, af-70), for all six student models with per-model Holm correction (Table A4); (ii) a subsampling stability analysis of the key contrasts over random question subsets (Table A5); and (iii) a mixed-effects model with question as a random effect that tests the track-by-model interaction (Section 5.3). The two external-validation experiments of Section 5.9 and Section 5.10 were likewise pre-registered—designs, primary contrasts, and decision rules fixed before any training run, with one logged amendment to a detection-gate formula in the corruption study disclosed in Section 5.10—and their analysis plans are described in the respective sections.
4.10. Experimental Matrix and Validity Controls
A central validity control is that the five pre-specified comparisons of Section 4.9 are fixed in advance (Section 4.9) rather than chosen after inspecting results, which guards against selective reporting among the many possible selector pairs.
Internal validity is strengthened by paired evaluation: for each question, compared tracks share the same retrieved context and the same extraction logic. Paired-bootstrap confidence intervals are therefore interpreted as selector-effect evidence under controlled protocol conditions rather than as broad claims of open-domain superiority.
4.11. Computational Cost Profile
To assess the practical overhead of the proposed workflow, Table 4 reports stage-level wall-clock times extracted from the timestamped experiment logs of the main runs, measured on the single NVIDIA A100 80 GB GPU described in Section 4.6. Two structural properties of the pipeline dominate its cost profile. First, all data-side stages—synthetic augmentation, four-metric scoring, and selection—are model-independent and are executed exactly once: augmentation requires 150 API calls to gpt-4.1-mini (three alternatives for each of the fifty base records, at most 600 generated tokens per call), scoring the entire 150-row pool along all four quality dimensions takes 0.9 min, and applying any selection rule to the stored score table is a negligible argmax operation. The same scored pool is then reused by every selector track and every student model, so the selection framework adds only a one-time preprocessing cost that is amortized across the more than fifty fine-tuning cells of the experimental matrix. Second, because every compact selector reduces the training set from 150 to 50 rows, selection cuts the recurring per-model fine-tuning cost by roughly a factor of three: twelve-epoch QLoRA fine-tuning on a 50-row selected set ranges from 5.0–5.5 min (Llama-3.2-3B) to 23.1–23.9 min (Gemma-2-27B), whereas fine-tuning on the full 150-row pool (alt150) takes approximately three times as long on the same hardware (29.1 min on Gemma-2-9B and 71.0 min on Gemma-2-27B). The only stage in which commercial-LLM usage scales with the number of scored candidates is the optional LLM-as-judge baseline (300 additional API calls, two judges per alternative), which the embedding-based selectors avoid entirely. Quality-aware selection therefore does not add meaningful overhead relative to quantity scaling; it replaces a threefold-larger recurring training cost with a sub-minute, model-agnostic scoring pass.
Table 4.
Stage-level computational cost of the pipeline, extracted from the experiment logs (single-A100 protocol of Section 4.6; API stages use commercial endpoints).
5. Results and Analysis
This section reports empirical results from the pipeline described in Section 3 and Section 4. Section 5.1, Section 5.2, Section 5.3, Section 5.4, Section 5.5, Section 5.6, Section 5.7 and Section 5.8 draw all numbers from the original experimental setup: fifty base tasks, three GPT-4.1-mini alternatives per task (150 augmented rows), post hoc scoring with the multilingual sentence encoder and BERTScore, and downstream evaluation on the same fifty-question held-out set under training-aligned inference. Section 5.9 and Section 5.10 report two pre-registered external-validation experiments on independent corpora; their setups are described in situ. Token-level F1 is used as the single primary evaluation metric.
Throughout this section, we distinguish confirmatory from exploratory findings using a single pre-registered criterion. A result is labeled confirmatory (C) only if (i) the comparison was pre-specified before inspecting downstream results (Section 4.9) and (ii) its paired-bootstrap p-value remains significant after Holm correction across the comparison family. All other results—including pre-specified contrasts that do not survive correction, post hoc contrasts, cross-model point estimates, and mean-rank summaries—are labeled exploratory (E) and are interpreted as descriptive, hypothesis-generating evidence only. These labels appear as an explicit C/E column or table note in the paired-bootstrap contrast table and the cross-model results tables of Section 5.2.4 and Section 5.3, and every figure in this section is referenced back to the label of the claim it illustrates. Under this criterion, the original-corpus experiments yield exactly two confirmatory contrasts, both on Gemma-2-9B-IT: the parameter-free only-AF versus random-mean, and its pre-specified weighted companion af-70 versus random-mean. Both contrasts remain Holm-significant when the primary token-level F1 metric is replaced by Korean character-level F1 with particles and punctuation removed (Holm p = 0.004 and p = 0.042, respectively; Section 5.2.4), so the confirmatory conclusions are robust to the choice of lexical metric. The pre-registered analyses of the two external-validation experiments are reported with their own decision rules in Section 5.9 and Section 5.10 and are not folded into the C/E labels.
5.1. Metric Discriminability at the Augmentation Pool (RQ1)
Before studying selectors, we ask whether the four quality dimensions discriminate among the three alternatives within each task. Across fifty task groups, answer faithfulness (AF) and QA coherence (QC) exhibit the largest within-task standard deviations (mean std 0.155 and 0.159; mean CV 0.402 and 0.347). Question relevance (QR) is moderate (mean std 0.084), while semantic similarity (SS) shows very little spread (mean std 0.033, CV 0.045). Thus, AF and QC provide the strongest ranking signal at selection time; SS acts mainly as a weak tie-breaker.
Figure 3 establishes the premise of RQ1: it shows that the four axes differ sharply in within-task dispersion, with AF and QC spreading the three alternatives widely while SS is nearly flat. This indicates which axes can, in principle, drive selection—an axis that assigns near-identical scores to all alternatives cannot rank them.
Figure 3.
Within-task discriminability of QR, AF, QC, and SS across fifty base tasks.
These diagnostics show that the four axes differ in how strongly they separate alternatives; the lexical-diversity check in the Section Augmentation Diversity Diagnostics further confirms that the alternatives are not near-duplicates, so the pool is a valid candidate set for downstream selection experiments.
Augmentation Diversity Diagnostics
The augmentation pool contains 150 rows (50 groups × 3 alternatives). Diversity diagnostics over each group show low lexical overlap and non-trivial length spread: answer Jaccard mean = 0.107, CoT Jaccard mean = 0.127, and question Jaccard mean = 0.152. Mean within-group standard deviation is 12.4 characters for answers and 25.9 characters for CoT sequences.
AF and QC show the largest within-task dispersion (Table 5), while SS is nearly flat. Metric correlations (Figure 4) indicate that AF and SS overlap strongly (r = 0.78), whereas QC is largely independent of SS (r = 0.08), so AF and QC form complementary selection axes.
Table 5.
Within-task discriminability statistics for the four metrics (fifty groups, three alternatives each).
Figure 4.
Pearson correlation among quality metrics.
Table 5 quantitatively confirms the visual pattern of Figure 3: AF and QC carry the strongest within-task ranking signal, QR is intermediate, and SS is close to constant. These statistics justify reading the single-axis ablations of Section 5.2 primarily through the AF and QC selectors.
Figure 4 shows that AF and SS are strongly correlated (r = 0.78) whereas QC is nearly independent of SS (r = 0.08); AF and QC therefore act as complementary, largely non-redundant selection axes. This correlation structure motivates both the failure-mode framing of Section 3.4 and the contrast between faithfulness-oriented and coherence-oriented selectors examined in Section 5.2 and Section 5.4.
5.2. Main-Model Ablation on Gemma-2-9B-IT: Quality-Aware Versus Random Selection (RQ2)
Gemma-2-9B-IT is the primary student model for the full selector inventory. Figure 5 summarizes token F1 for RAG, the quantity baseline alt150 (150 rows), the compact expansion track sum-top2 (100 rows), balanced sum-top1, the LLM-as-judge baseline judge-avg, single-axis selector only-X, and the AF-emphasized rule af-70 (wAF = 0.70).
Figure 5.
Gemma-2-9B-IT: token F1 by selector family (including judge-avg, 50 questions, and training-aligned inference).
Figure 5 provides the within-model overview for the primary student model: the faithfulness-oriented selectors only-AF (0.517) and af-70 (0.524) top the selector family, the LLM-as-judge baseline judge-avg (0.478) is essentially tied with the balanced default sum-top1 (0.479), and the single-axis QR and SS selectors trail. The figure is descriptive; the statistical status of each headline gap is established by the paired-bootstrap contrasts reported in Section 5.2.4.
5.2.1. Single-Axis and Leave-One-Out Effects
Among single-axis rules, only-AF achieves the highest F1 (0.517), exceeding sum-top1 (0.479) by +0.038; only-QC, only-SS, and only-QR fall below sum-top1. In the leave-one-out analysis of the unweighted sum, removing QR (loo-QR) yields the largest drop (F1 0.421; paired-bootstrap 95% CI for ΔF1 vs. sum-top1: [−0.110, −0.007], significant); loo-AF does not differ significantly from sum-top1 (Δ = +0.012, CI includes zero).
We therefore attribute AF dominance to the single-axis and weighted selectors (only-AF, af-70), not to an irreplaceable role of AF inside the uniform sum. Although only-AF exceeds sum-top1 by +0.038 points, sum-top1 remains the default balanced recipe because it combines all four axes without hand-tuning a single dimension.
5.2.2. Selection Overlap
Selectors based on different axes often choose different alternatives; only-AF and only-QC agree on only 58% of tasks (29/50), while sum-top1 and af-70 agree on 86%. This pattern supports complementary roles for faithfulness-oriented versus coherence-oriented axes.
Figure 6 verifies that the selectors are not interchangeable in what they select: only-AF and only-QC agree on the top-1 alternative in only 58% of tasks (29/50), while sum-top1 and af-70 agree on 86%. Downstream performance differences between axes can therefore be attributed to genuinely different training-row choices rather than to noise around near-identical selections.
Figure 6.
Top-1 agreement between selector pairs (Gemma-2-9B-IT).
5.2.3. AF-Weight Sensitivity
On Gemma-2-9B-IT, token F1 varies with the answer-faithfulness weight wAF (Table 6; for all rows except wAF = 0.60, the remaining mass is split evenly over QR, QC, and SS—see the Table 6 footnote for the realized wAF = 0.60 weights). Every setting with wAF ≥ 0.40 lies in the 0.49–0.53 band—except wAF = 0.90 (0.489)—and all exceed equal-weight sum-top1 (0.479). Motivated by the strong single-axis performance of only-AF (Section 5.2.1), we define a fixed AF-emphasis selector af-70 with w = (0.1, 0.7, 0.1, 0.1), that is, wAF = 0.70 with the remaining mass split evenly over QR, QC, and SS. This weight vector is not chosen by maximizing evaluation F1. Among the additional weights we evaluate for sensitivity, F1 is highest at wAF = 0.70 (0.524), consistent with the pre-specified af-70 setting but not statistically separable from only-AF (0.517). The confirmatory contrasts of this study rest on the pre-specified selectors only-AF and af-70, each versus random-mean (Section 5.2.4).
Table 6.
AF-weight sensitivity on Gemma-2-9B-IT. Unless noted in the table footnote, the remaining mass is split evenly over QR, QC, and SS.
Table 6 is read as a sensitivity analysis rather than a tuning result: every setting with wAF ≥ 0.40 except wAF = 0.90 lies in the 0.49–0.53 band and exceeds equal-weight sum-top1 (0.479), indicating a broad plateau of AF-emphasized weightings rather than a sharp, fragile optimum. The af-70 weight vector was fixed from this pre-specified grid before the confirmatory contrasts of Section 5.2.4 were run, not chosen by maximizing evaluation F1.
5.2.4. Random Baseline and Statistical Tests
Three random top-1 baselines (seeds 23, 41, 53) select one alternative per task without quality scores. Table 7 reports the five pre-specified contrasts under paired bootstrap on fifty questions, with Holm correction applied within the five-contrast family separately for each metric. Under the primary token-level F1, only-AF vs. random-mean (ΔF1 = +0.106, 95% CI [+0.043, +0.174], Holm p = 0.019) and af-70 vs. random-mean (ΔF1 = +0.113, Holm p = 0.002) remain significant after correction, whereas sum-top1 vs. random-mean (+0.068, CI [+0.004, +0.133], Holm p = 0.140), only-AF vs. alt150 (+0.079, CI [+0.014, +0.150], Holm p = 0.140), and af-70 vs. alt150 (Holm p = 0.111) are positive but do not survive correction. The character-level F1 columns reproduce this split exactly: only-AF vs. random-mean (+0.076, CI [+0.033, +0.119], Holm p = 0.004) and af-70 vs. random-mean (+0.070, CI [+0.017, +0.120], Holm p = 0.042) are again Holm-significant, while sum-top1 vs. random-mean (+0.030), only-AF vs. alt150 (+0.025), and af-70 vs. alt150 (+0.020) remain directionally positive but not significant (Holm p = 0.663 for all three). The robust conclusion is therefore metric-independent: the faithfulness-oriented selectors only-AF and af-70 significantly exceed random selection under both lexical granularities, while their advantage over the three-times-larger alt150 pool remains directional once multiplicity is taken into account. The practical reading of the alt150 contrasts is one of efficiency: the compact 50-row selected sets are statistically indistinguishable from—and directionally, though not significantly, higher than—training on the full 150-row pool, at one third of the fine-tuning cost. The confirmed contrasts are also stable under subsampling: across 5000 random subsets of 25 (respectively 40) of the fifty questions, the only-AF and af-70 advantages over random-mean remain positive in 100% of subsets under token-level F1 and in at least 99.8% under character-level F1 (Table A5).
Table 7.
Pre-specified paired-bootstrap contrasts on Gemma-2-9B-IT under token-level F1 and character-level F1 (50 questions; 20,000 draws; Holm correction within the five-contrast family per metric; character-level F1 computed after removing particles and punctuation, Section 4.8).
Table 7 is the confirmatory core of the study. It isolates the two contrasts that survive Holm correction—the parameter-free only-AF and its pre-specified weighted companion af-70, each against random-mean—from the remaining pre-specified contrasts (sum-top1 versus random-mean and the alt150 comparisons), which are directionally positive but exploratory. All in-domain headline claims in the Abstract and Conclusions rest on the C-labeled rows of this table; the external-validation statements rest on the pre-registered analyses of Section 5.9 and Section 5.10.
5.2.5. Data Selection Versus Data Scaling (RQ3)
RQ3 asks whether a quality-selected subset can match training on the full augmented pool while using a fraction of the data. The pre-specified statistical answer appears in Table 7 (Section 5.2.4): the contrasts against alt150 are positive but do not survive correction under either metric, so the selected 50-row sets are statistically indistinguishable from the full 150-row pool while training on one third of the rows and roughly one third of the fine-tuning time (Section 4.11). This subsection examines the scaling dimension itself—row count and the sum-top2 variant—together with the supplementary metrics.
Beyond token-F1, Exact Match is at floor for every track on Gemma-2-9B-IT (≤0.06) and is therefore uninformative, while ROUGE-L [29] is low and only weakly tracks token-F1, with only-AF the highest (0.160), while af-70 (0.140) does not separate from the RAG baseline (0.147); the full per-track Exact Match and ROUGE-L values are reported in Appendix A (Table A1). Reference-free RAGAS faithfulness increases under RAFT relative to the RAG baseline on four of the five models (for example, from 0.837 to 0.940 on Gemma-2-9B-IT; Table A2), consistent with improved evidence grounding, although these RAGAS values are treated only as supplementary diagnostics because one judge model (gpt-4.1-mini) also participates in augmentation.
The alt150 condition trains on 150 rows, sum-top2 on 100 rows, and compact selectors on 50 rows. On Gemma-2-9B-IT, sum-top2 reaches 0.454, below sum-top1 (0.479) and af-70 (0.524). Paired bootstrap shows no statistical separation for sum-top2 vs. sum-top1 (Δ = −0.0249, CI includes zero) or sum-top2 vs. alt150 (Δ = +0.0159, CI includes zero). In this dataset, increasing row count from top-1 to top-2 does not yield a confirmed gain.
5.3. Cross-Model Validation (RQ4)
The same protocol is applied to six instruction-tuned student models, including Gemma-2-2B-IT as a low-capacity stress case (Table 8). Cross-model entries are exploratory point estimates unless a paired-bootstrap contrast is explicitly reported (Section 5.4).
Table 8.
Cross-model token F1 on six student models (50 questions; af-70 uses wAF = 0.70). All entries are exploratory (E) point estimates; the only confirmatory (C) contrasts in this study are the Gemma-2-9B-IT comparisons against random-mean reported in Table 7.
RAG accuracy is not monotonic in model size (e.g., Gemma-2-27B-IT RAG 0.317 < Gemma-2-2B-IT 0.404), reflecting instruction-following differences rather than parameter count alone.
Table 8 documents the raw model-by-track matrix underlying Figure 7, Figure 8 and Figure 9: the best-performing track changes from model to model, and no track is uniformly best across the six student models. Its role is evidential for RQ4—demonstrating that a selection rule tuned on one student model does not automatically transfer—rather than inferential; per-cell differences are not individually tested.
Figure 7.
Cross-model token F1 heatmap. The star marks the highest token F1 within each row, i.e., the best-performing track for that model.
Figure 8.
Mean ΔF1 vs. RAG across five student models by track (excluding Gemma-2-2B-IT).
Figure 9.
Cross-model robustness: mean rank across five models (lower is better; Gemma-2-2B-IT excluded).
Figure 7 visualizes the full model-by-track token-F1 matrix: the best-performing track changes from row to row, and no single column dominates across all six models. This heatmap therefore illustrates, at a glance, the model dependence of the optimal quality axis that RQ4 formalizes; individual cells are exploratory point estimates rather than tested contrasts.
Figure 8 shows that the compact 50-row quality-aware selectors achieve positive mean gains over the RAG baseline across the five models above the 2B stress case (for example, +0.080 for sum-top1), comparable to the 150-row alt150 condition. This supports the data-efficiency reading of RQ3: selection attains statistically indistinguishable performance from the full pool while training on one third of the rows.
Table 9 and Figure 9 summarize cross-model robustness via mean within-model rank (lower is better; Gemma-2-2B-IT excluded). sum-top1 attains the best mean rank (2.40) and af-70 ranks first on three of five models, while only-QR and only-SS remain weakest on average. Ranks are computed over all eight tracks using full-precision scores; the complete per-model token-F1 for only-QR and only-SS is reported in Appendix A (Table A3). This aggregate retains Llama-3.2-3B-Instruct, a below-floor model on which no RAFT track beats RAG—excluding both below-floor models (Gemma-2-2B-IT and Llama-3.2-3B-Instruct) would raise the selectors’ mean ΔF1 vs. RAG further (for example, sum-top1 from +0.080 to +0.113), so the reported aggregate is the more conservative descriptive summary; these mean ΔF1 values are exploratory and are not individually significance-tested.
Table 9.
Cross-model mean rank, rank-1 counts, and mean ΔF1 vs. RAG over five models (excluding Gemma-2-2B-IT). All entries are exploratory (E) descriptive summaries of Table 8 and carry no inferential claim.
The cross-model conclusions are metric-robust but not metric-invariant. Spearman rank correlations between the token-level and character-level F1 orderings of the eight tracks are strong for Llama-3.1-8B (ρ = 0.881), Qwen2.5-14B (ρ = 0.857), Llama-3.2-3B (ρ = 0.833), and Gemma-2-9B (ρ = 0.738), but weaker for Gemma-2-27B (ρ = 0.333) and Gemma-2-2B (ρ = 0.476), with a mean of ρ = 0.687. Track orderings under the two metrics are therefore largely consistent but not identical, which is precisely why we verify that every confirmed contrast also holds under character-level F1 (Section 4.9).
To test formally whether selector effects depend on the student model, we fit a mixed-effects model of per-question F1 with question as a random effect and compare the additive specification (track + model) against the specification with a track-by-model interaction using a likelihood-ratio test. The interaction is significant under both metrics (token-level F1: LR = 78.2, df = 25, p = 2.2 × 10⁻⁷; character-level F1: LR = 44.1, df = 25, p = 0.011), providing direct statistical support for the claim that the optimal selection axis is model-dependent rather than universal within the examined range of 2B–27B instruction-tuned models. At the level of individual axes, however, a Friedman test of whether the per-question only-AF minus only-QC difference varies across the six models is not significant (token-level χ2 = 3.47, p = 0.628; character-level χ2 = 3.42, p = 0.636), so per-model axis rankings beyond the single tested Qwen2.5-14B contrast remain descriptive and exploratory.
Table 9 condenses Table 8 into rank-based summaries that are insensitive to per-model score scales: balanced sum-top1 attains the best mean rank (2.40) without being the single best track on most models, while af-70 ranks first on three of five models. Read together, the two columns support balanced compact selection (sum-top1) as a robust default and AF-emphasis (af-70) as the most frequent per-model winner—rank-1 on three of five models—though not the best on average.
Figure 9 shows that the balanced selector sum-top1 attains the best mean rank (2.40) and that af-70 ranks first on three of five models, while the single-axis selectors only-QR and only-SS remain weakest on average. The figure thus supports treating balanced compact selection as a robust default across models, while the spread of ranks across axes again argues against fixing any one axis globally; these rankings are exploratory (E) descriptive summaries.
5.4. Cross-Model Failure Analysis (RQ4)
Supplementary diagnostics focus on selector-axis mismatch and format stability rather than adding extra headline metrics. On Qwen2.5-14B, AF-emphasis tracks underperform only-QC and miss the final-answer marker more often—af-70 on 7 of 50 outputs and only-AF on 6 of 50, versus 3 of 50 for only-QC and 1 of 50 for sum-top1—suggesting that axis mismatch and output-format instability jointly affect performance under this protocol. The LLM-as-judge baseline judge-avg reaches token-F1 0.478 on Gemma-2-9B-IT (Table A1), essentially tied with sum-top1 (0.479) and below only-AF (0.517) and af-70 (0.524), so it does not outperform the embedding-based selectors. A paired bootstrap over the fifty evaluation questions confirms one direct falsification of a universal-axis assumption: on Qwen2.5-14B, only-QC exceeds only-AF by ΔF1 = +0.080 (95% CI [+0.009, +0.155]; two-sided p = 0.039, uncorrected; Cohen’s dz = 0.30) on the primary token-level metric. Under Korean character-level F1 with particles and punctuation removed, the difference remains directionally consistent (+0.052) but is not statistically significant (p = 0.15). We therefore state this contrast as significant on token-level F1 and directionally consistent on character-level F1, and we do not elevate it to the confirmatory (C) tier reserved for the pre-specified Holm-significant contrasts of Section 5.2.4.
We therefore conclude that no single axis can be fixed as universally optimal. As established in Section 5.3, the track-by-model interaction is significant under both lexical metrics, while the Friedman test on per-model AF-versus-QC differences is not; per-model axis rankings beyond the tested Qwen2.5-14B contrast are therefore treated as descriptive and hypothesis-generating.
Figure 10 depicts the single directly tested counterexample to a universal-axis rule: on Qwen2.5-14B, coherence-based selection (only-QC) outperforms faithfulness-based selection (only-AF and af-70) under the identical protocol that favors AF on Gemma-2-9B-IT. This is the empirical basis for our conclusion that the optimal quality axis is model-dependent and should be validated per target model.
Figure 10.
Qwen-14B case: QC-axis selection outperforms AF-emphasis in this setup.
5.5. Low-Capacity Diagnostic: Gemma-2-2B and Llama-3.2-3B (RQ4)
To explicitly report where selection does not help, we examine the two lowest-capacity models in a separate diagnostic. For both Gemma-2-2B-IT and Llama-3.2-3B-Instruct, no quality-selected RAFT track significantly exceeds the RAG baseline under the same protocol, and the numerically best RAFT condition is the unselected full pool alt150 rather than any quality-aware selector. The paired-bootstrap confidence interval for this best RAFT track against RAG includes zero on both models and under both lexical metrics: on token F1, ΔF1 = −0.010 (95% CI [−0.094, +0.074]) for Gemma-2-2B-IT and ΔF1 = −0.011 (95% CI [−0.101, +0.079]) for Llama-3.2-3B-Instruct; on character-level F1, the corresponding differences are +0.037 (95% CI [−0.037, +0.111]) and +0.054 (95% CI [−0.011, +0.121]). We therefore characterize the low-capacity regime as one in which quality-aware selection yields no measurable benefit, rather than one in which RAFT is uniformly harmful. Notably, on Llama-3.2-3B-Instruct the compact selected tracks fall significantly below alt150 (only-AF vs. alt150: Holm-corrected p = 0.001 on character F1 and p = 0.033 on token F1), indicating that at this scale raw data quantity matters more than per-sample quality. This pattern is consistent with prior evidence that small models are vulnerable to distractors and to long-context evidence placement effects [1,2].
In our study, the benefit of quality-aware selection appears only from 8B upward and extends to the 14B and 27B models, so the operative boundary is an empirical capacity interval (3B, 8B]: selection gains are absent at 3B and below, whereas from 8B upward at least one quality-aware selector exceeds RAG—Holm-significant on Gemma-2-9B-IT and Gemma-2-27B and nominal on Llama-3.1-8B—while which selector does so is model-dependent (on Qwen2.5-14B, for instance, only-QC and sum-top1 exceed RAG whereas af-70 falls below it; Table A4), and this capacity-floor characterization holds under both token-level and character-level F1. We prefer this interval statement to a fixed single-value threshold; localizing the floor more precisely would require intermediate-capacity models and is left to future work. Accordingly, claims of selection gains in this study are intentionally limited to model settings where selected tracks consistently surpass RAG in paired evaluation.
Table 10 documents the negative regime that bounds our claims: on both low-capacity models, no quality-selected track separates from the RAG baseline, and the numerically best RAFT condition is the unselected full pool alt150. This table is the empirical basis for restricting all selection-gain claims to the 8B-and-above settings and for the (3B, 8B] capacity-interval statement of Section 5.5.
Table 10.
Low-capacity model comparison (Gemma-2-2B and Llama-3.2-3B); the best track is selected over all reported tracks, including RAG.
Figure 11 shows that on the two lowest-capacity models, no quality-selected track achieves a significant gain over the RAG baseline; the best RAFT condition is the unselected full pool, and even its difference from RAG is not statistically separable in either token-level or character-level F1. The figure therefore localizes an empirical capacity floor in the interval (3B, 8B], below which quality-aware selection yields no measurable benefit.
Figure 11.
Low-capacity diagnostic: ΔF1 vs. RAG for Gemma-2-2B and Llama-3.2-3B.
5.6. Leakage Robustness Check (Validity of RQ2–RQ3)
Because the augmentation pool and the evaluation set share the same base tasks, this section tests whether selector gains could reflect proximity between the selected training answers and the evaluation gold answers, first at the lexical level (Table 11) and then at the semantic level (Table 12).
Table 11.
Leakage robustness check: lexical overlap of selected training answers with the evaluation gold answers.
Table 12.
Semantic leakage check: mean e5 cosine similarity between selected training answers and the evaluation gold answers (50 tasks), with paired-bootstrap contrasts against random-mean.
Selected training answers overlap with gold answers only at floor level (~0.03–0.05 token-F1), while model outputs reach 0.524; af-70 proximity (0.036) matches random selection (0.033). Lexical overlap therefore cannot explain the selector gains. Because lexical overlap alone could miss paraphrase-level leakage, we further measure semantic proximity as the cosine similarity, under the multilingual-e5-large encoder, between each selected training answer and the corresponding evaluation gold answer.
The semantic check corroborates the lexical one. The confirmed selectors are semantically no closer to the gold answers than random selection: af-70 averages 0.840 versus 0.834 for random-mean (Δ = +0.006, 95% CI [−0.001, +0.013], p = 0.107), and only-AF likewise shows no significant difference (Δ = +0.006, [−0.001, +0.014], p = 0.096). The worst-quality control anti-sum exhibits both the lowest proximity (0.823) and the weakest downstream performance, indicating that proximity co-varies with supervision quality rather than driving performance. For transparency, we note that one selector, sum-top1, is significantly closer to the gold answers than random selection (Δ = +0.009, [+0.002, +0.016], p = 0.014); this effect is small—about one percent of the 0.83 similarity scale—and does not extend to the confirmed selectors only-AF and af-70. More decisively, a memorization account predicts that higher proximity should yield higher scores, yet the per-question correlation between semantic proximity and F1 on af-70 is negative (Spearman ρ = −0.321, p = 0.023); questions whose selected training answer lies closer to the gold answer tend to score lower. Together with the floor-level lexical overlap in Table 11, these checks indicate that the selector advantage reflects supervision quality, not proximity of the training answers to the evaluation answers.
5.7. Post Hoc Check: Distractor Hardness
A reviewer-motivated post hoc analysis examines whether the four quality metrics overlook distractor hardness, a property central to the RAFT training format. For each of the fifty tasks, hardness is quantified as the maximum multilingual-e5-large cosine similarity between the task’s distractor passages and its oracle passage, so that higher values indicate distractors semantically closer to the true evidence. Two findings support the validity of the selector comparisons. First, hardness is nearly constant across the corpus by construction (mean 0.856, standard deviation 0.021, range [0.805, 0.889]), because every task draws its distractors from the same shared passage pool; the corpus therefore offers almost no hardness variation that a selection metric could exploit or be biased by. Second, hardness is statistically unrelated both to the quality scores and to the outcomes: its Spearman correlation with the per-task means of the four quality metrics never exceeds |ρ| = 0.13 and is never significant (QR +0.048, p = 0.740; AF −0.025, p = 0.862; QC +0.130, p = 0.368; SS −0.055, p = 0.706), and its correlation with per-question F1 is not significant on any Gemma-2-9B-IT track (ρ between +0.023 and +0.265, all p ≥ 0.062). Distractor hardness is thus unlikely to have distorted the reported selector comparisons in this corpus. At the same time, the near-constant hardness is a genuine design boundary: the present corpus cannot test whether quality-metric-guided selection remains effective when distractor hardness varies widely, and we record this explicitly as a limitation (Section 6.1).
5.8. Post Hoc Check: Semantic Answer-Quality Metrics
Because token- and character-level F1 are purely lexical, a further post hoc analysis tests whether the pre-specified contrasts persist under semantic metrics: BERTScore F1 computed with xlm-roberta-large [30] and the cosine similarity between each model output and the gold answer under the multilingual-e5-large encoder (Table A6). Under BERTScore, the headline contrast survives multiplicity correction: only-AF exceeds random-mean by +0.021 (95% CI [+0.005, +0.041], Holm p = 0.017), matching the confirmed lexical result in both direction and significance. The remaining four contrasts are not significant under BERTScore, and no contrast reaches significance under e5 cosine, although the headline contrast is again directionally positive there (only-AF vs. random-mean, +0.008, uncorrected p = 0.091). The limited discriminative power of the semantic metrics is expected for this task: gold answers are short Korean spans, and both semantic scores compress most track-level results into a narrow band of roughly 0.93–0.95 (a ceiling effect; the main exceptions are Qwen2.5-14B tracks whose output-format instability lowers BERTScore). This mirrors the low within-task variance of the SS axis observed in Section 5.1—embedding-based similarity saturates on short in-domain Korean text. For separating selectors on this task, lexical overlap metrics are therefore the more discriminative instrument, and the fact that the one semantic contrast with sufficient signal reproduces the only-AF result strengthens rather than weakens the lexical conclusions. A human expert evaluation, which could adjudicate semantic correctness beyond both metric families, was not conducted in this study and is acknowledged as a limitation (Section 6.1).
5.9. Pre-Registered Independent-Corpus Validation with a Train/Test Split
To probe whether the protocol’s effects extend beyond the transductive setting of Section 5.2, Section 5.3, Section 5.4 and Section 5.5, we conducted a pre-registered validation experiment on an independent task collection five times the size of the original corpus, with a strict train/test split. Fifty new Korean encyclopedic passages, on topics disjoint from the original corpus, were partitioned by passage into forty training passages and ten test passages before any data generation. Two hundred base tasks (five per training passage) were augmented threefold with the same generator and prompts as in Section 4.2, yielding a 600-row pool that was scored and selected under the identical four-metric protocol; the evaluation set comprises one hundred held-out questions drawn exclusively from the ten test passages, whose text never appears in any training context (training-side retrieval is restricted to the forty training passages, while evaluation retrieves over all fifty). Each track was fine-tuned on Gemma-2-9B-IT—the primary student model of Section 5.2—with the QLoRA configuration of Section 4.6 under three training seeds, and the analysis plan—two primary contrasts (only-AF and af-70 versus random-mean), seed-averaged paired bootstrap with Holm correction, and a fixed decision rule—was registered before any training run. Validation deliberately uses this single model: the confirmatory contrasts of Table 7 are claims about Gemma-2-9B-IT, so testing them on new data with the same model isolates data-level generalization from the model dependence already established in Section 5.3; extending the external validation to further student models is left to future work. These runs use a verified reimplementation of the pipeline (identical hyperparameters, prompts, retrieval, and scoring checkpoints) whose retrieval and RAG inference reproduce the stored original outputs exactly.
Three findings emerge (Table 13). First, retrieval-augmented fine-tuning itself transfers strongly: every RAFT track exceeds the RAG baseline on the held-out questions by wide margins (token-level ΔF1 +0.157 to +0.170 and character-level +0.075 to +0.089, all p < 0.001). Because the evaluation passages are disjoint from every training context, this transfer cannot be explained by memorization of evaluation material, complementing the leakage analyses of Section 5.6.
Table 13.
Pre-registered independent-corpus validation: three-seed mean F1 on 100 held-out questions (Gemma-2-9B-IT; per-seed means in parentheses). The corpus comprises fifty new passages with a passage-level train/test split; training contexts never contain test-passage text.
Second, the data-efficiency property replicates under the train/test split: the quality-selected 200-row sets are not significantly different from the full 600-row pool (only-AF versus alt600 +0.009, 95% CI [−0.021, +0.038]; af-70 +0.008; both not significant), at one third of the fine-tuning cost. No equivalence margin was pre-specified, so full-pool advantages smaller than roughly 0.04 cannot be ruled out; the efficiency claim is one of failure to detect a difference, stated as such. Random 200-row selection is likewise indistinguishable from the full pool (−0.005, not significant), indicating substantial redundancy in the augmented pool: on a clean pool of this kind, a one-alternative-per-task subset—however chosen—retains the value of the full pool.
Third, the selection-versus-random advantage is directionally positive but small and not significant: seed-averaged Δ = +0.013 (only-AF, 95% CI [−0.020, +0.044]) and +0.012 (af-70) under token-level F1 (both Holm p = 0.84); and +0.014 (only-AF, CI [−0.006, +0.033]) and +0.013 (af-70) under character-level F1 (both Holm p = 0.33), where the character-level differences are positive under all three training seeds for both selectors, while under the primary token-level metric the per-seed sign, is positive in only two of the three seeds for each selector. By the pre-registered decision rule, both primary contrasts are therefore null: the confirmed in-domain effect of Section 5.2.4 (+0.106) does not generalize at a detectable magnitude to this held-out setting, and if a true out-of-domain advantage exists, it is small (observed dz of 0.08 to 0.14, versus 0.45 in-domain), with per-seed training variance of comparable size.
We draw two conclusions. On clean pools, the protocol’s transferable, replicated value is efficiency—full-pool-level performance, within the resolution of this design, at one third of the cost—rather than superiority over random subsetting; second, claims about the magnitude of the selection-versus-random effect should remain scoped to the original confirmatory setting. Section 5.10 examines the complementary question of what happens when the pool is not clean.
5.10. Pre-Registered Study of Selection Under Controlled Pool Corruption
The clean-pool results above leave open when quality-aware selection should matter. To answer this causally, we ran a second pre-registered experiment in which pool quality itself was manipulated. On a further independent collection (twelve fresh passages, sixty base tasks, five alternatives per task, for a total of 300 rows, generated with the original prompts and the same reimplemented pipeline), we created two otherwise identical pools: a clean pool and a corrupted pool in which 35% of rows (105 of 300) were deliberately damaged in one of three modes—replacing the answer and reasoning with those of a different passage, replacing the answer with a different answer from the same passage, or swapping in a mismatched question. Ten tracks per condition (five random seeds, only-AF, af-70, sum-top1, the anti-sum control, and the full pool) were fine-tuned on Gemma-2-9B-IT and evaluated on the sixty base questions, with a difference-in-differences (DiD) analysis—does the selection benefit grow under corruption?—specified in advance. Evaluation in this study is transductive by design (the sixty evaluation questions are the base tasks of the pool), because the manipulated variable is pool quality with tasks held fixed; the corruption results therefore inherit the transductive scope of Section 5.2, Section 5.3, Section 5.4 and Section 5.5 rather than the train/test split of Section 5.9.
The quality metrics detect the injected corruption without any training: ranking rows by the four-metric sum separates corrupted from clean rows with an area under the ROC curve (AUROC) of 0.814, and the damage modes align with the axes designed for them (cross-passage answer replacement: AF 0.818, QC 0.874; question swapping: QC 0.808), while subtle same-passage answer replacement is hardest to detect (AF 0.672)—consistent with the design boundary discussed in Section 3.3. At the pick level the effect is direct: random selection absorbs 22 to 24 corrupted rows out of 60, the quality selectors absorb 9 to 12, and the full pool inherits all 105. For transparency, we note that the study’s pre-registered detection gate—AF-axis AUROC of at least 0.75 on the two answer-corruption modes combined—was narrowly missed (0.745), so the study proceeded on the pre-specified pick-level and dose–response evidence instead; this outcome, together with one amendment to the gate formula logged before the downstream analysis, is recorded in the registration document.
Downstream, training-set corruption is costly in a dose-dependent way: across the ten corrupted-condition tracks, the fraction of corrupted training rows correlates with F1 at Spearman ρ = −0.718 (p = 0.019), and the anti-sum control—trained predominantly on rows the metrics rank worst (46 of 60 corrupted)—collapses to 0.233, below even the un-fine-tuned RAG baseline (0.281). The pre-specified DiD analysis indicates that the value of selection is conditional on pool quality: the selection-versus-random benefit of sum-top1 is larger under corruption than on the clean pool by +0.095 (token-level, 95% CI [+0.036, +0.155], p = 0.0014) and +0.079 (character-level, CI [+0.036, +0.123], p = 0.0002), with the same direction for af-70 and only-AF (not significant). We decompose this transparently: sum-top1’s DiD is driven mainly by its clean-pool deficit versus random (−0.071, the only nominally significant clean-pool contrast) rather than by its corrupted-pool gain (+0.024, not significant), and the corrupted-condition head-to-head contrasts are directionally positive but not individually significant at n = 60 (only-AF versus random +0.053, 95% CI [−0.017, +0.122]). On the clean pool, conversely, the anti-sum control is not worse than the quality selectors (0.551 versus 0.516–0.540), reinforcing that on homogeneously good pools the four axes carry little downstream signal; their discriminative value emerges only when genuinely damaged rows are present. The mechanistic weight of the evidence therefore rests on the dose–response relation, the anti-sum collapse under corruption, and the pick-level filtering above, rather than on any single head-to-head contrast. Table 14 reports the token-level F1 of all tracks under both the clean and the corrupted pool.
Table 14.
Selection under controlled pool corruption: token-level F1 (Gemma-2-9B-IT) on the sixty base questions of an independent twelve-passage collection, for two pools identical except for the injected corruption of 105 of 300 rows.
Together, Section 5.9 and Section 5.10 locate the practical value of quality-aware selection. On clean, redundant pools, it is a cost device: one third of the fine-tuning cost at statistically indistinguishable performance. On degraded pools it becomes a safeguard, filtering the majority of damaged supervision that unselected or random use of the pool would absorb. This also offers a boundary-condition explanation for the alt150 result of Section 5.2.4 and Section 5.2.5: the original augmentation pool was homogeneously good (all 150 alternatives were rated 9 or 10 out of 10 by both LLM judges of the judge-avg baseline, Section 4.4), which is precisely the regime where no selection policy can separate from the full pool.
6. Discussion
This study evaluates metric-guided selection of synthetic RAFT alternatives under a fixed controlled protocol. The confirmed result on Gemma-2-9B-IT is that the faithfulness-oriented selectors only-AF and af-70 outperform random-mean and remain significant after Holm correction for multiple comparisons, and this conclusion is robust to the choice of evaluation metric: under a Korean character-level F1 that removes particles and punctuation, both contrasts remain Holm-significant (p = 0.004 and p = 0.042), and track rankings correlate across the two metrics (mean Spearman ρ = 0.687 across models). The differences in sum-top1 over random-mean and of the faithfulness selectors over the full augmented set alt150 are positive but do not survive correction under either metric (token F1: Holm-corrected p = 0.140 for sum-top1 versus random-mean, p = 0.140 for only-AF versus alt150, and p = 0.111 for af-70 versus alt150; character F1: none significant); we therefore read the alt150 comparison as evidence of data efficiency—statistically indistinguishable performance with one third of the training data and roughly one third of the fine-tuning time (10.2 versus 29 min on Gemma-2-9B-IT)—rather than of superiority. The pre-specified weighted companion af-70 attains the highest point F1 on Gemma-2-9B-IT (0.524) but does not differ significantly from only-AF; it belongs to the confirmed family against random-mean, and we report it as a companion to the parameter-free only-AF rather than as a separate finding. Across model families, the mixed-effects analysis with per-question random effects confirms a significant selector-by-model interaction (likelihood-ratio test, p = 2.2 × 10⁻⁷ for token F1 and p = 0.011 for character F1), so the optimal quality axis is model-dependent and should be validated per target model rather than fixed globally; at the same time, a Friedman test on the AF-versus-QC axis difference across models is not significant (p = 0.63), so individual per-model axis rankings remain exploratory.
The two pre-registered validation experiments (Section 5.9 and Section 5.10) sharpen this reading. On an independent corpus with a strict train/test split, the efficiency property replicates—quality-selected one-third subsets are not significantly different from the 600-row pool—while the selection-versus-random advantage, though directionally positive under both metrics, is roughly an order of magnitude smaller than the confirmed in-domain effect and not significant; under controlled corruption, selection filters the majority of damaged rows that random selection absorbs, and the selection-versus-random benefit is significantly larger under corruption for the score-sum selector (difference-in-differences p = 0.0014), directionally so for the faithfulness selectors. The protocol’s practical role is therefore that of a low-cost safeguard: it reduces per-model fine-tuning cost roughly threefold at negligible scoring cost, and its measurable benefit concentrates where pool quality degrades—whereas on homogeneously good pools no selection policy separates from the redundant full pool, and individual selectors can even trail it.
Two boundary patterns delimit the scope of the positive results. On Qwen2.5-14B-Instruct, only-QC (0.525) exceeds only-AF (0.445) under token F1 (uncorrected p = 0.039), and the same direction—though without significance—holds under character F1 (+0.052, p = 0.15); together with the higher marker-missing rates on AF-emphasis tracks, this single-model contrast suffices to reject a universally fixed axis while remaining, on its own, a model-specific observation. On Gemma-2-2B-IT and Llama-3.2-3B-Instruct, quality-selected tracks never significantly exceed the RAG baseline under either metric, and on Llama-3.2-3B the selected 50-row tracks fall significantly below the full pool alt150 (Holm-corrected p = 0.001). We interpret this low-capacity regime as an absence of selection benefit rather than as evidence that RAFT is harmful: under character F1 the best track (alt150) is nominally above the RAG baseline on these models, but the difference is not significant.
Beyond statistical significance, the practical magnitude of the confirmed effects merits explicit discussion because the absolute token-F1 differences may appear modest. On Gemma-2-9B-IT, the strongest selector raises token-F1 from 0.356 under the RAG baseline to 0.524 (af-70), a relative improvement of approximately 47%, and the confirmatory contrast only-AF versus random-mean corresponds to ΔF1 = +0.106 with Cohen’s dz = 0.45 (dz = 0.48 under the particle-stripped character-F1 metric), a small-to-medium paired effect size that is stable across both lexical metrics. These gains are obtained at low marginal cost: as quantified in Section 4.11, quality scoring is a one-time, model-independent preprocessing step of under one minute for the entire pool, while training on the selected 50-row set requires roughly one third of the fine-tuning time of the full 150-row pool. Even though the difference from alt150 is not confirmed after correction, the compact selectors deliver statistically indistinguishable performance from the full pool while consuming one third of the training data and compute, so the practical case for selection rests jointly on the confirmed superiority over uninformed (random) selection and on this efficiency margin, rather than on any single large absolute gain.
6.1. Limitations
The study uses fifty base tasks and fifty evaluation questions drawn from a small controlled Korean corpus constructed for this study; all claims are therefore restricted to this corpus and to the 2B–27B instruction-tuned models examined, and generalization to larger corpora, other domains, and other languages requires further work. Hyperparameters are held fixed across model families, which may disadvantage some architectures, and all main comparative runs are reported under a unified 512-token decoding budget. The primary metric is whitespace token F1, which is imperfect for Korean; this concern is mitigated by the character-level F1 companion analysis, under which the confirmed contrasts persist, but both remain lexical measures, and embedding-based output metrics show limited discriminative power on the short answers in this task.
A second, structural limitation is the transductive evaluation design: the training alternatives and the evaluation questions derive from the same fifty base tasks. All reported effects are therefore controlled relative comparisons among selectors under a fixed protocol, not demonstrations of open-domain generalization. Three quantitative checks argue against memorization as the source of the confirmed gains: lexical overlap between selected training answers and evaluation gold answers is at floor level (token F1 approximately 0.03–0.05; Table 11); embedding-level proximity between training answers and gold answers does not differ between af-70 and random selection (0.840 versus 0.834, not significant); and the per-question correlation between training-answer proximity and downstream F1 is negative for af-70 (Spearman ρ = −0.32, p = 0.02), the opposite of what a memorization account predicts. Nevertheless, these checks bound the leakage risk rather than remove the design limitation. The pre-registered independent-corpus experiment of Section 5.9 now provides a first external validation: the fine-tuning protocol and the efficiency property transfer, but the selection-versus-random advantage does not reach significance out of domain, so the confirmed contrast of Table 7 should be read as an in-domain result whose magnitude is not established beyond the original setting. The corruption study of Section 5.10, whose purpose is causal manipulation of pool quality rather than generalization, is likewise transductive by design. Larger-scale external validation—more tasks, additional languages and domains—remains the highest-priority direction for future work.
Two further limitations concern measurement scope. First, the four quality metrics score the supervision quality of each candidate alternative but do not measure distractor hardness; because hardness is nearly constant in this corpus (Section 5.7), the reported comparisons are unlikely to be confounded by it, but the effectiveness of quality-guided selection under widely varying distractor hardness remains untested. Second, answer quality is assessed with automatic metrics only—lexical F1 as the primary metric and semantic BERTScore and embedding-cosine checks post hoc (Section 5.8)—and no human expert evaluation was conducted; expert judgment of answer acceptability would be required to fully validate the semantic fidelity of the selected models’ outputs.
6.2. Future Work
The highest-priority direction is larger-scale external validation beyond the first independent-corpus study of Section 5.9—more tasks, additional languages and domains, and additional student models—together with a data-size scaling analysis that contrasts quality selection with random subsetting at varying task counts, particularly in the low-data regime where selection should matter most. Further directions include validation-set-driven axis diagnosis per target model, optimization-based selector weighting learned on an independent validation split, evaluation of intermediate-capacity (4–7B) models to localize the capacity floor, extension to larger task pools and additional model families, incorporation of a distractor-hardness dimension into the scoring vector, and pruning of SS given its low within-task variance. Combining the complementary axes AF and QC through explicit mixture selectors, rather than a single convex weight vector, may better exploit the 42% disagreement (58% agreement) between only-AF and only-QC.
7. Conclusions
This paper presented a quality-aware selection protocol for synthetic RAFT training data, together with a pre-specified statistical design for evaluating it; the contribution is the selection protocol and its evaluation, not RAFT or QLoRA themselves. Three conclusions are supported directly by the experiments. First, on Gemma-2-9B-IT the parameter-free faithfulness selector only-AF and its pre-specified weighted companion af-70 significantly outperform size-matched random selection and survive Holm correction under both whitespace token F1 and Korean character-level F1; this is the confirmatory result of the study. Second, relative to training on the full augmented pool, quality-selected sets achieve statistically indistinguishable performance with one third of the training data and roughly one third of the fine-tuning time, so selection is best characterized as data-efficient rather than strictly superior. Third, the optimal quality axis is model-dependent—a mixed-effects analysis confirms a significant selector-by-model interaction—so no single axis can be fixed universally; on the smallest models (2B–3B), selection yields no measurable benefit, placing an empirical capacity floor between roughly 3B and 8B parameters. Two pre-registered validation experiments bound these conclusions externally: on an independent train/test-split corpus, fine-tuning transfer and the efficiency property replicate while the selection-versus-random advantage is directionally positive but small and not significant; and under controlled pool corruption, the quality metrics filter the majority of damaged supervision and the selection-versus-random benefit grows significantly for the score-sum selector (directionally for the faithfulness selectors). Within the settings examined, quality-aware selection is therefore a promising, data-efficient safeguard for synthetic RAFT data—strongest where pool quality cannot be guaranteed—and larger-scale external validation remains the principal direction for future work.
Author Contributions
Conceptualization, S.C. and H.-Y.J.; methodology, S.C.; software, S.C.; validation, S.C. and H.-Y.J.; formal analysis, S.C.; investigation, S.C.; data curation, S.C.; writing—original draft preparation, S.C.; writing—review and editing, H.-Y.J.; visualization, S.C.; supervision, H.-Y.J.; project administration, H.-Y.J. All authors have read and agreed to the published version of the manuscript.
Funding
This work was supported by the IITP (Institute of Information & Communications Technology Planning & Evaluation) and ITRC (Information Technology Research Center) grant funded by the Korea government (Ministry of Science and ICT) (IITP-2026-RS-2020-II201808).
Data Availability Statement
The data presented in this study are openly available in GitHub at (available online: https://github.com/jellywon/raft_dataset, accessed on 18 June 2026); the independent-corpus validation and pool-corruption datasets added in this revision (Section 5.9 and Section 5.10), together with their registration documents and per-question outputs, are provided in the same repository (directories external_validation and corruption_study). The baseline retrieval-augmented fine-tuning follows the publicly available RAFT implementation of Zhang et al. [3] (available online: https://github.com/ShishirPatil/gorilla, accessed on 18 June 2026). Code implementing the quality-aware selection framework is available from the corresponding author upon reasonable request.
Acknowledgments
The authors used the commercial language models GPT-4.1-mini and GPT-4o (OpenAI) as experimental components for synthetic data augmentation and as an LLM-as-judge baseline, as described in Section 3 and Section 4. The authors additionally used an AI assistant (Claude Opus 4.8, Anthropic) to assist with language editing of the revised manuscript; the authors reviewed all edits and take full responsibility for the content of this publication.
Conflicts of Interest
The authors declare no conflicts of interest.
Abbreviations
The following abbreviations are used in this manuscript:
| RAG | Retrieval-Augmented Generation |
| RAFT | Retrieval-Augmented Fine-Tuning |
| sLM | Small Language Model |
| LLM | Large Language Model |
| CoT | Chain-of-Thought |
| QR | Question Relevance |
| AF | Answer Faithfulness |
| QC | QA Coherence |
| SS | Semantic Similarity |
| PEFT | Parameter-Efficient Fine-Tuning |
| LoRA | Low-Rank Adaptation |
| QLoRA | Quantized Low-Rank Adaptation |
| CI | Confidence Interval |
| CV | Coefficient of Variation |
Appendix A
Appendix A reports the complete per-track results underlying the main text. Table A1 lists the full Gemma-2-9B-IT selector inventory (token-F1, Exact Match, and ROUGE-L), including the judge-avg, anti-sum, and leave-one-out conditions. Table A2 reports reference-free RAGAS faithfulness and answer relevancy for the RAG baseline and RAFT (sum-top1). Table A3 gives the complete eight-track cross-model token-F1 used to compute the mean ranks in Table 9. Table A4 reports paired-bootstrap confidence intervals, uncorrected and Holm-corrected p-values, and Cohen’s dz for every track versus RAG, and for the four principal selectors (sum-top1, only-AF, only-QC, af-70) versus alt150, across all six student models, under both token-level and character-level F1. Table A5 reports the subsampling stability of the key contrasts. Table A6 reports the post hoc semantic–metric contrasts (BERTScore and embedding cosine; Section 5.8).
Table A1.
Gemma-2-9B-IT performance for all selector tracks (50 questions; token-F1, Exact Match, ROUGE-L), sorted by token-F1.
Table A2.
Reference-free RAGAS faithfulness and answer relevancy for the RAG baseline and RAFT (sum-top1). RAGAS uses gpt-4.1-mini as judge and is a supplementary diagnostic only.
Table A3.
Complete cross-model token-F1 over all eight tracks (50 questions), used to compute the mean ranks in Table 9.
Table A4.
Paired-bootstrap comparisons of every RAFT track against RAG, and of the four principal selectors (sum-top1, only-AF, only-QC, af-70) against alt150, for all six student models (50 questions; 20,000 draws; Δ = mean per-item difference; Holm correction applied within each model-by-metric family; * nominal p < 0.05, ** Holm p < 0.05). Part (a): Token-level F1. Part (b): Character-level F1 (particles and punctuation removed). Confidence intervals in this appendix are independently resampled and may differ in the final digit from those in Table 7.
Table A5.
Subsampling stability of the key contrasts: proportion of 5000 random question subsets of size m (drawn without replacement from the fifty evaluation questions) in which the mean difference remains positive, under token-level F1 and character-level F1 (particles and punctuation removed).
Table A6.
Post hoc semantic–metric contrasts on Gemma-2-9B-IT: paired-bootstrap comparisons of the five pre-specified contrasts under BERTScore F1 (xlm-roberta-large) and output-to-gold cosine similarity (multilingual-e5-large), with Holm correction within the five-contrast family per metric (50 questions; 20,000 draws).
References
- Liu, N.F.; Lin, K.; Hewitt, J.; Paranjape, A.; Bevilacqua, M.; Petroni, F.; Liang, P. Lost in the middle: How language models use long contexts. Trans. Assoc. Comput. Linguist. 2024, 12, 157–173. [Google Scholar] [CrossRef] [Scilit]
- Shi, F.; Chen, X.; Misra, K.; Scales, N.; Dohan, D.; Chi, E.H.; Schärli, N.; Zhou, D. Large language models can be easily distracted by irrelevant context. In Proceedings of the 40th International Conference on Machine Learning (ICML), Honolulu, HI, USA, 23–29 July 2023; pp. 31210–31227. [Google Scholar] [CrossRef] [Scilit]
- Zhang, T.; Patil, S.G.; Jain, N.; Shen, S.; Zaharia, M.; Stoica, I.; Gonzalez, J.E. RAFT: Adapting language model to domain specific RAG. In Proceedings of the 1st Conference on Language Modeling (COLM), Philadelphia, PA, USA, 7–9 October 2024. [Google Scholar] [CrossRef] [Scilit]
- Zhang, T.; Kishore, V.; Wu, F.; Weinberger, K.Q.; Artzi, Y. BERTScore: Evaluating text generation with BERT. In Proceedings of the International Conference on Learning Representations (ICLR), Addis Ababa, Ethiopia, 26–30 April 2020. [Google Scholar] [CrossRef] [Scilit]
- Wang, Y.; Kordi, Y.; Mishra, S.; Liu, A.; Smith, N.A.; Khashabi, D.; Hajishirzi, H. Self-Instruct: Aligning language models with self-generated instructions. In Proceedings of the 61st Annual Meeting of the Association for Computational Linguistics (ACL), Toronto, ON, Canada, 9–14 July 2023; pp. 13484–13508. [Google Scholar] [CrossRef] [Scilit]
- Es, S.; James, J.; Espinosa-Anke, L.; Schockaert, S. RAGAS: Automated evaluation of retrieval augmented generation. In Proceedings of the 18th Conference of the European Chapter of the Association for Computational Linguistics: System Demonstrations, St. Julians, Malta, 17–22 March 2024; pp. 150–158. [Google Scholar] [CrossRef] [Scilit]
- Long, L.; Wang, R.; Xiao, R.; Zhao, J.; Ding, X.; Chen, G.; Wang, H. On LLMs-Driven Synthetic Data Generation, Curation, and Evaluation: A Survey. In Proceedings of the Findings of the Association for Computational Linguistics: ACL 2024, Bangkok, Thailand, 11–16 August 2024. [Google Scholar]
- Shumailov, I.; Shumaylov, Z.; Zhao, Y.; Papernot, N.; Anderson, R.; Gal, Y. AI Models Collapse When Trained on Recursively Generated Data. Nature 2024, 631, 755–759. [Google Scholar] [CrossRef] [Scilit] [PubMed]
- Zhou, C.; Liu, P.; Xu, P.; Iyer, S.; Sun, J.; Mao, Y.; Ma, X.; Efrat, A.; Yu, P.; Yu, L.; et al. LIMA: Less is more for alignment. In Proceedings of the Advances in Neural Information Processing Systems (NeurIPS), New Orleans, LA, USA, 10–16 December 2023. [Google Scholar] [CrossRef] [Scilit]
- Chen, L.; Li, S.; Yan, J.; Wang, H.; Gunaratna, K.; Yadav, V.; Tang, Z.; Srinivasan, V.; Zhou, T.; Huang, H.; et al. AlpaGasus: Training a better Alpaca with fewer data. In Proceedings of the International Conference on Learning Representations (ICLR), Vienna, Austria, 7–11 May 2024. [Google Scholar] [CrossRef] [Scilit]
- Liu, W.; Zeng, W.; He, K.; Jiang, Y.; He, J. What makes good data for alignment? A comprehensive study of automatic data selection in instruction tuning. In Proceedings of the International Conference on Learning Representations (ICLR), Vienna, Austria, 7–11 May 2024. [Google Scholar] [CrossRef] [Scilit]
- Li, M.; Zhang, Y.; Li, Z.; Chen, J.; Chen, L.; Cheng, N.; Wang, J.; Zhou, T.; Xiao, J. From Quantity to Quality: Boosting LLM Performance with Self-Guided Data Selection for Instruction Tuning. In Proceedings of the 2024 Conference of the North American Chapter of the Association for Computational Linguistics (NAACL), Mexico City, Mexico, 16–21 June 2024. [Google Scholar]
- Xia, M.; Malladi, S.; Gururangan, S.; Arora, S.; Chen, D. LESS: Selecting Influential Data for Targeted Instruction Tuning. In Proceedings of the 41st International Conference on Machine Learning (ICML), Vienna, Austria, 21–27 July 2024. [Google Scholar]
- Wettig, A.; Gupta, A.; Malik, S.; Chen, D. QuRating: Selecting High-Quality Data for Training Language Models. In Proceedings of the 41st International Conference on Machine Learning (ICML), Vienna, Austria, 21–27 July 2024. [Google Scholar]
- Li, M.; Zhang, Y.; He, S.; Li, Z.; Zhao, H.; Wang, J.; Cheng, N.; Zhou, T. Superfiltering: Weak-to-Strong Data Filtering for Fast Instruction-Tuning. In Proceedings of the 62nd Annual Meeting of the Association for Computational Linguistics (ACL), Bangkok, Thailand, 11–16 August 2024. [Google Scholar]
- Lu, K.; Yuan, H.; Yuan, Z.; Lin, R.; Lin, J.; Tan, C.; Zhou, C.; Zhou, J. #InsTag: Instruction Tagging for Analyzing Supervised Fine-Tuning of Large Language Models. In Proceedings of the 12th International Conference on Learning Representations (ICLR), Vienna, Austria, 7–11 May 2024. [Google Scholar]
- Albalak, A.; Elazar, Y.; Xie, S.M.; Longpre, S.; Lambert, N.; Wang, X.; Muennighoff, N.; Hou, B.; Pan, L.; Jeong, H.; et al. A Survey on Data Selection for Language Models. arXiv 2024, arXiv:2402.16827. [Google Scholar]
- Zheng, L.; Chiang, W.-L.; Sheng, Y.; Zhuang, S.; Wu, Z.; Zhuang, Y.; Lin, Z.; Li, Z.; Li, D.; Xing, E.P.; et al. Judging LLM-as-a-judge with MT-Bench and Chatbot Arena. In Proceedings of the Advances in Neural Information Processing Systems (NeurIPS), Datasets and Benchmarks Track, New Orleans, LA, USA, 10–16 December 2023. [Google Scholar] [CrossRef] [Scilit]
- Hu, E.J.; Shen, Y.; Wallis, P.; Allen-Zhu, Z.; Li, Y.; Wang, S.; Wang, L.; Chen, W. LoRA: Low-rank adaptation of large language models. In Proceedings of the International Conference on Learning Representations (ICLR), Virtual, 25–29 April 2022. [Google Scholar] [CrossRef] [Scilit]
- Dettmers, T.; Pagnoni, A.; Holtzman, A.; Zettlemoyer, L. QLoRA: Efficient finetuning of quantized LLMs. In Proceedings of the Advances in Neural Information Processing Systems (NeurIPS), New Orleans, LA, USA, 10–16 December 2023. [Google Scholar] [CrossRef] [Scilit]
- Efron, B. Bootstrap methods: Another look at the jackknife. Ann. Stat. 1979, 7, 1–26. [Google Scholar] [CrossRef] [Scilit]
- Cohen, J. Statistical Power Analysis for the Behavioral Sciences, 2nd ed.; Lawrence Erlbaum Associates: Hillsdale, NJ, USA, 1988. [Google Scholar] [CrossRef] [Scilit]
- Reimers, N.; Gurevych, I. Sentence-BERT: Sentence Embeddings using Siamese BERT-Networks. In Proceedings of the 2019 Conference on Empirical Methods in Natural Language Processing (EMNLP), Hong Kong, China, 3–7 November 2019. [Google Scholar]
- Devlin, J.; Chang, M.-W.; Lee, K.; Toutanova, K. BERT: Pre-training of Deep Bidirectional Transformers for Language Understanding. In Proceedings of the NAACL-HLT 2019, Minneapolis, MN, USA, 2–7 June 2019. [Google Scholar]
- Wang, L.; Yang, N.; Huang, X.; Yang, L.; Majumder, R.; Wei, F. Multilingual E5 text embeddings: A technical report. arXiv 2024, arXiv:2402.05672. [Google Scholar] [CrossRef] [Scilit]
- Gemma Team; Google DeepMind. Gemma 2: Improving open language models at a practical size. arXiv 2024, arXiv:2408.00118. [Google Scholar] [CrossRef] [Scilit]
- Llama Team; AI @ Meta. The Llama 3 herd of models. arXiv 2024, arXiv:2407.21783. [Google Scholar] [CrossRef] [Scilit]
- Yang, A.; Yang, B.; Zhang, B.; Hui, B.; Zheng, B.; Yu, B.; Li, C.; Liu, D.; Huang, F.; Wei, H.; et al. Qwen2.5 technical report. arXiv 2024, arXiv:2412.15115. [Google Scholar] [CrossRef] [Scilit]
- Lin, C.-Y. ROUGE: A package for automatic evaluation of summaries. In Text Summarization Branches Out: Proceedings of the ACL-04 Workshop, Barcelona, Spain, 25–26 July 2004; Association for Computational Linguistics: Stroudsburg, PA, USA, 2004; pp. 74–81. Available online: https://aclanthology.org/W04-1013/ (accessed on 18 June 2026).
- Conneau, A.; Khandelwal, K.; Goyal, N.; Chaudhary, V.; Wenzek, G.; Guzmán, F.; Grave, E.; Ott, M.; Zettlemoyer, L.; Stoyanov, V. Unsupervised cross-lingual representation learning at scale. In Proceedings of the 58th Annual Meeting of the Association for Computational Linguistics (ACL), Online, 5–10 July 2020; pp. 8440–8451. [Google Scholar] [CrossRef] [Scilit]
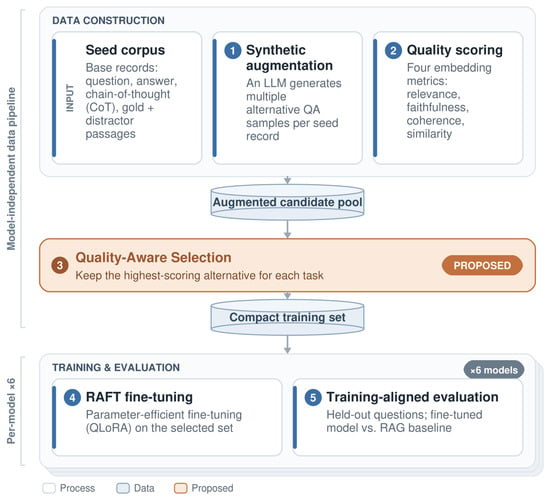
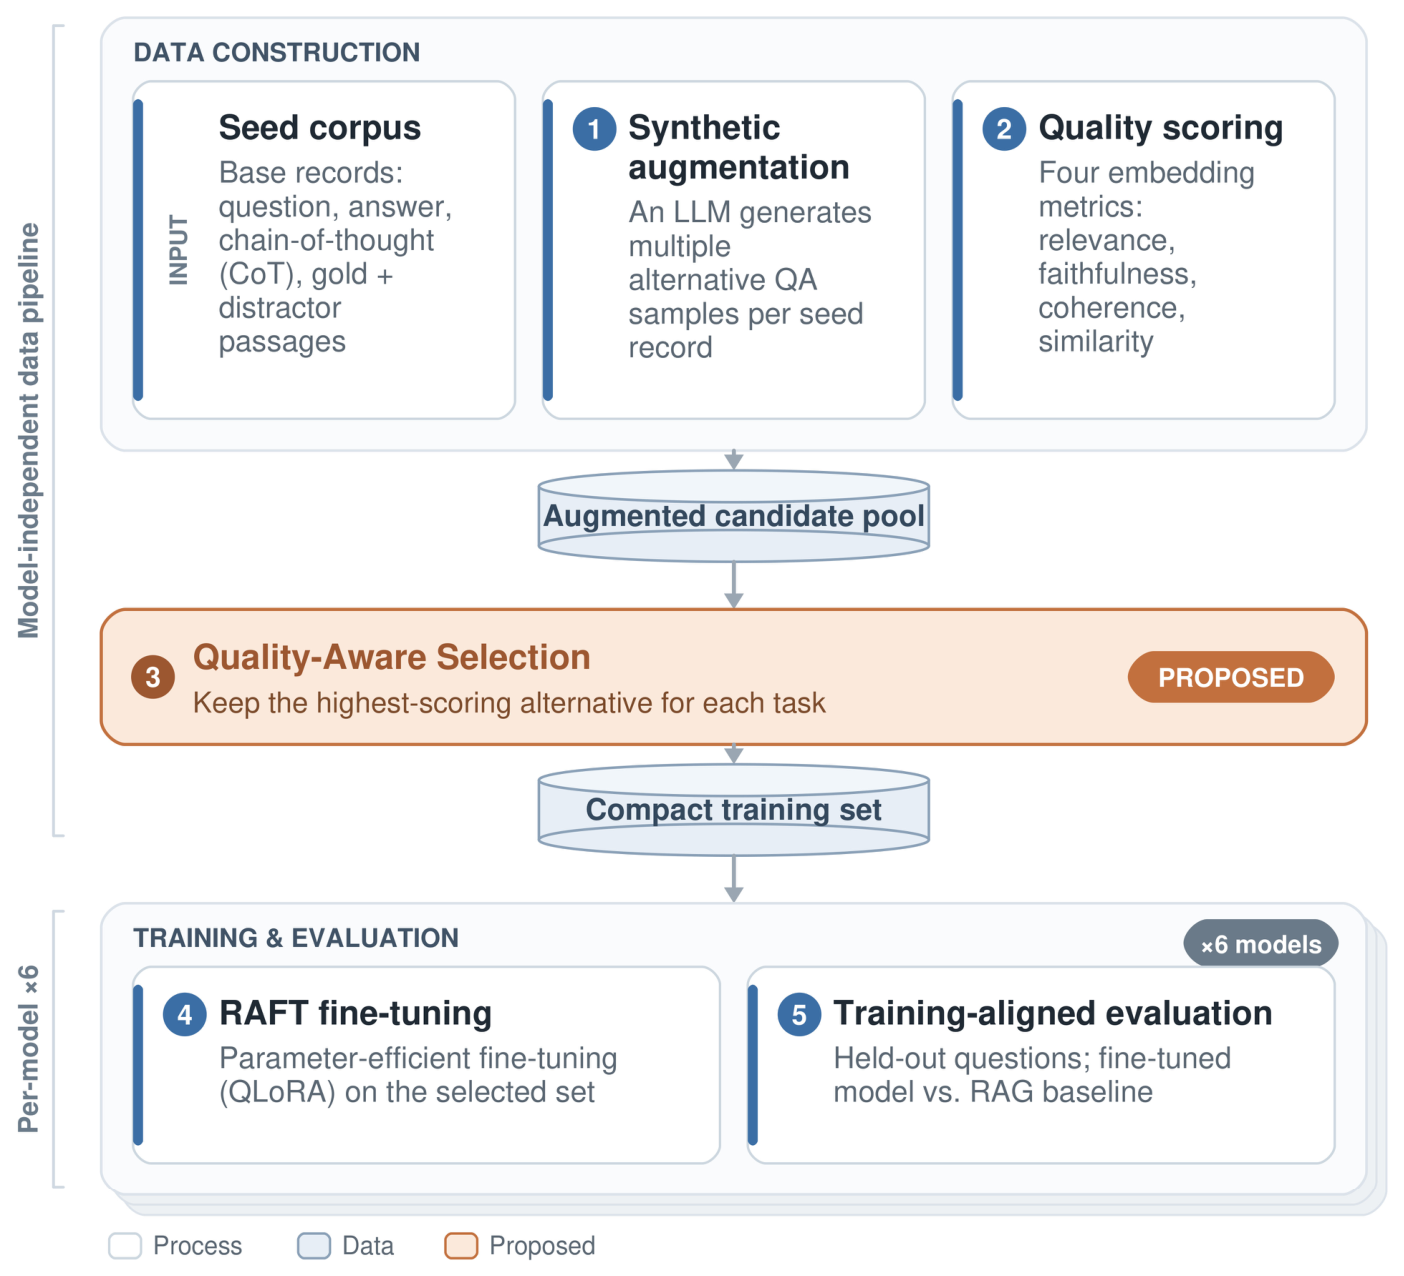
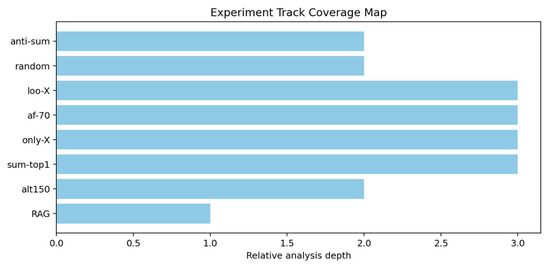
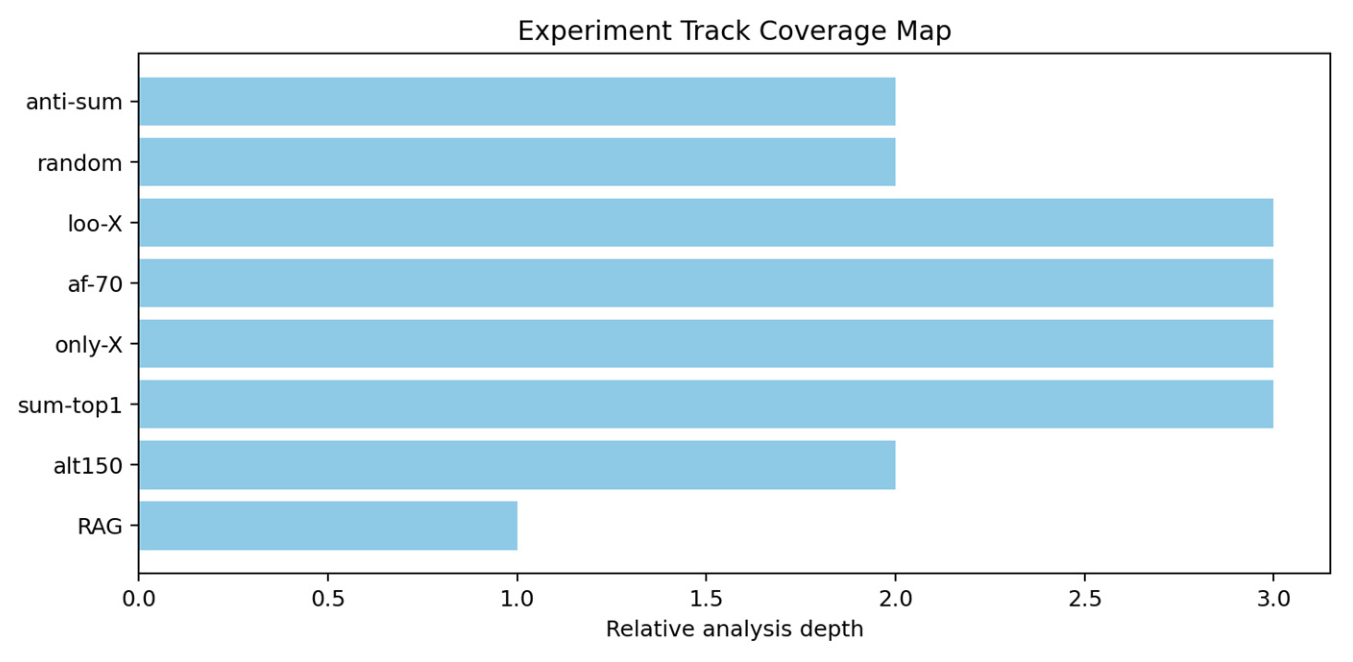
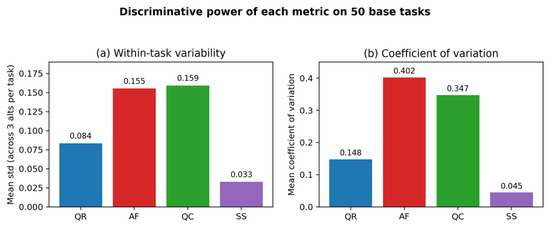
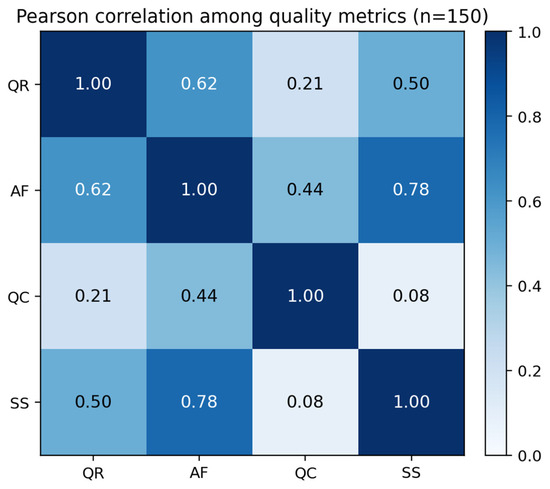
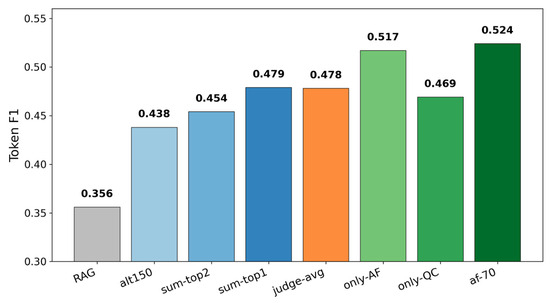
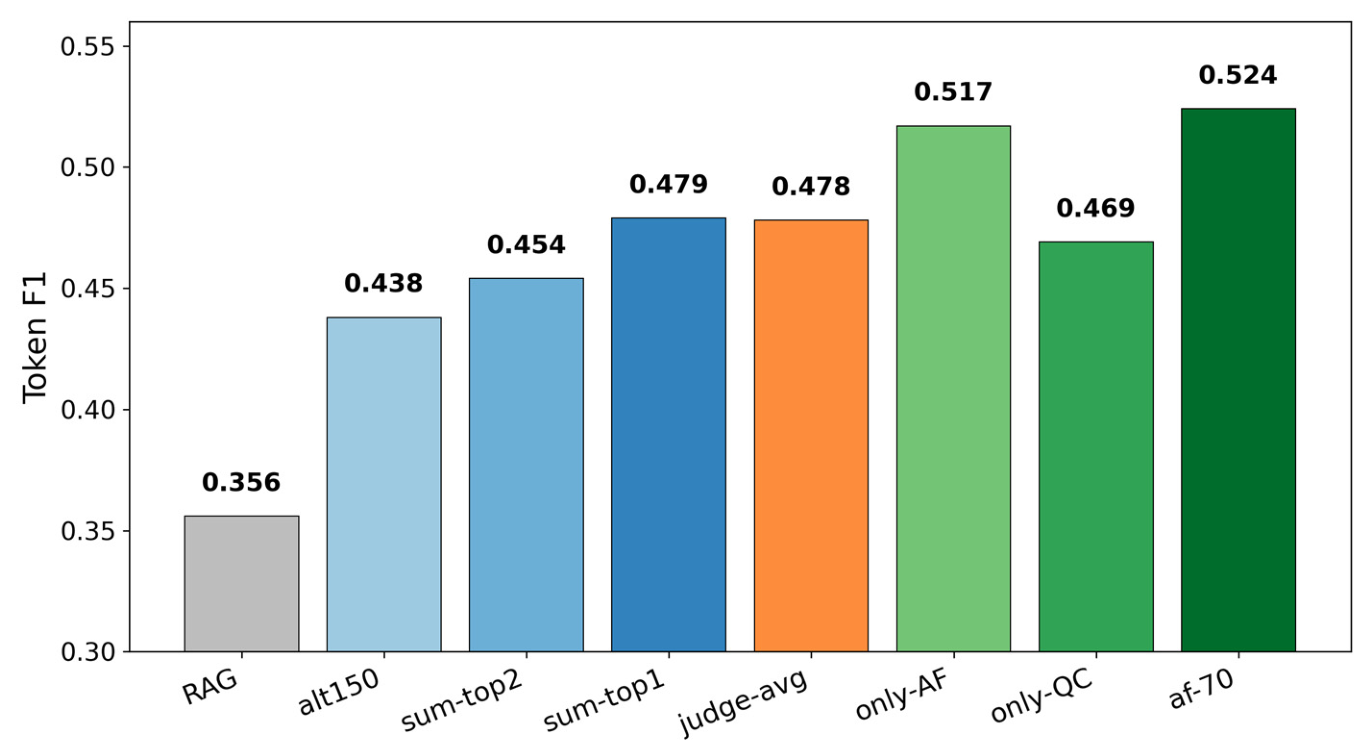
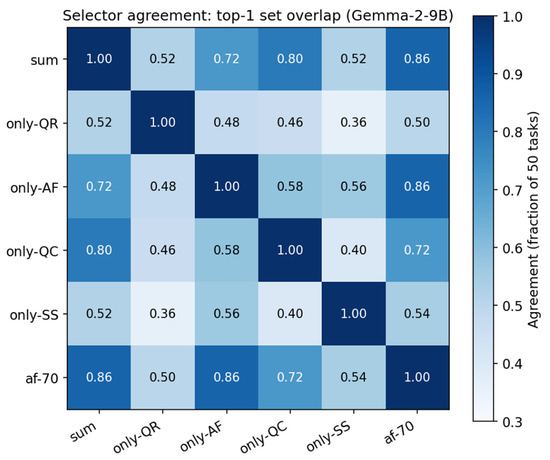
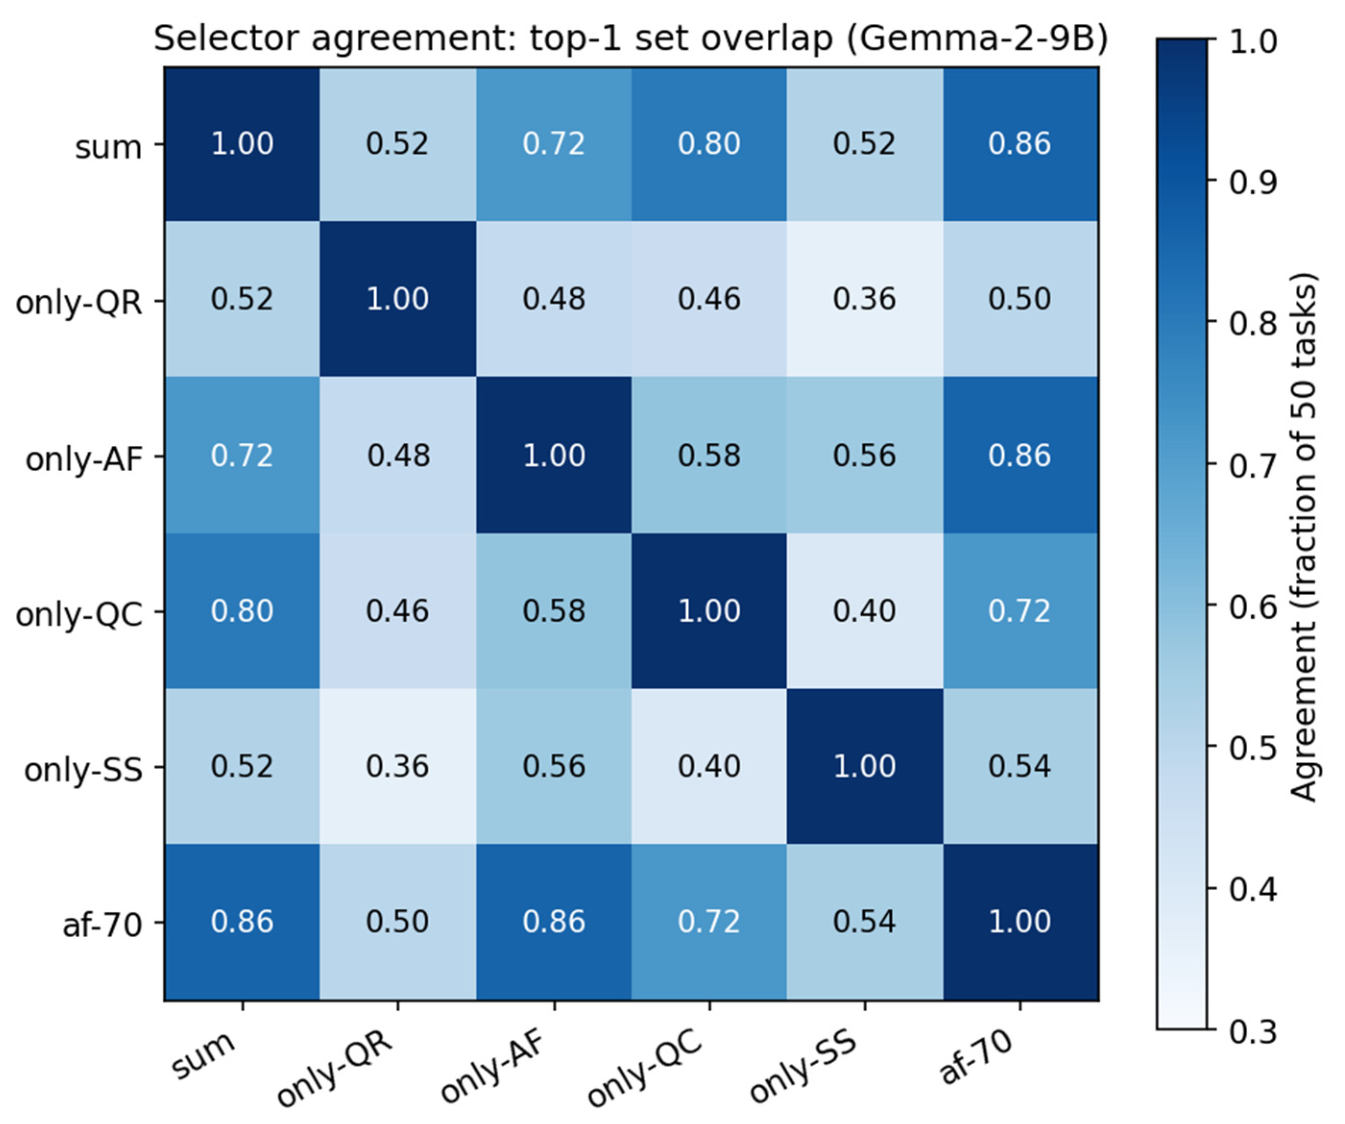
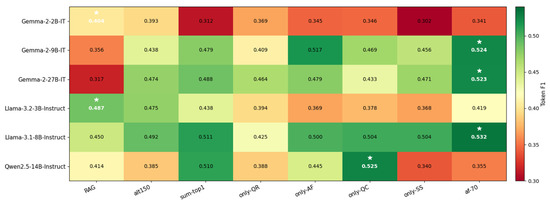
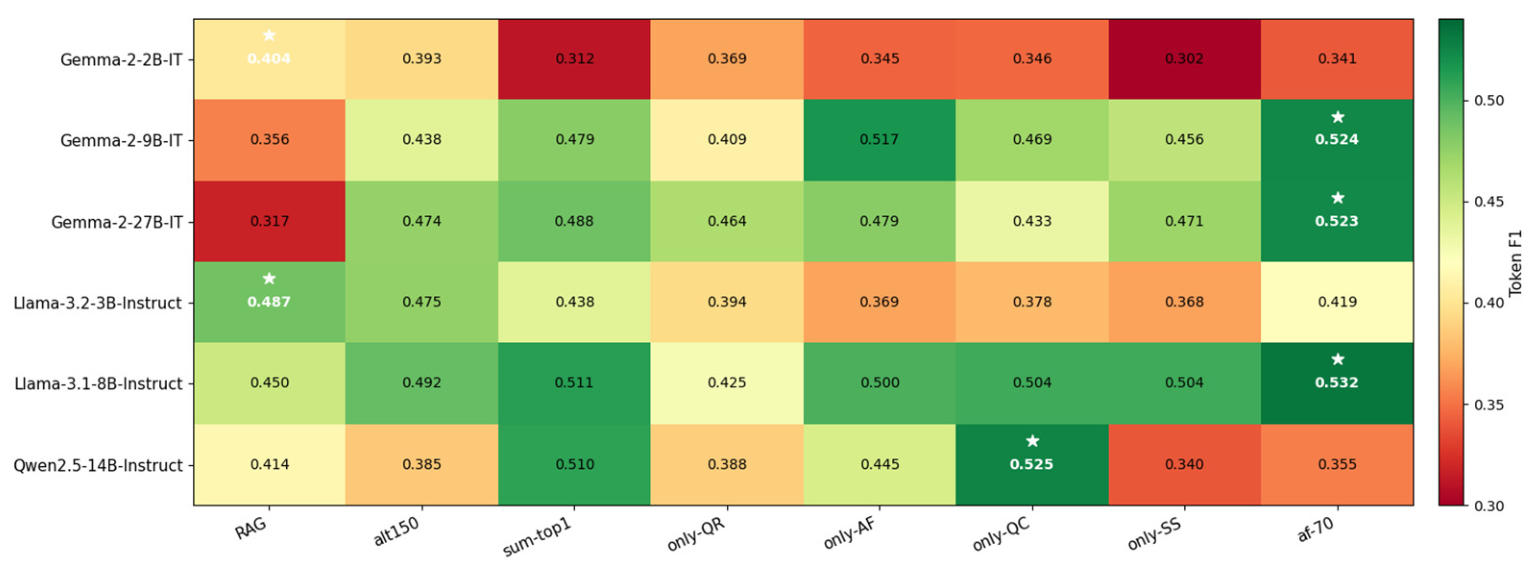
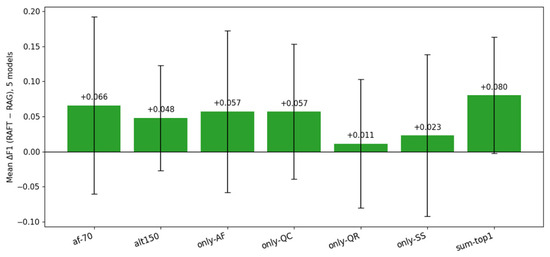
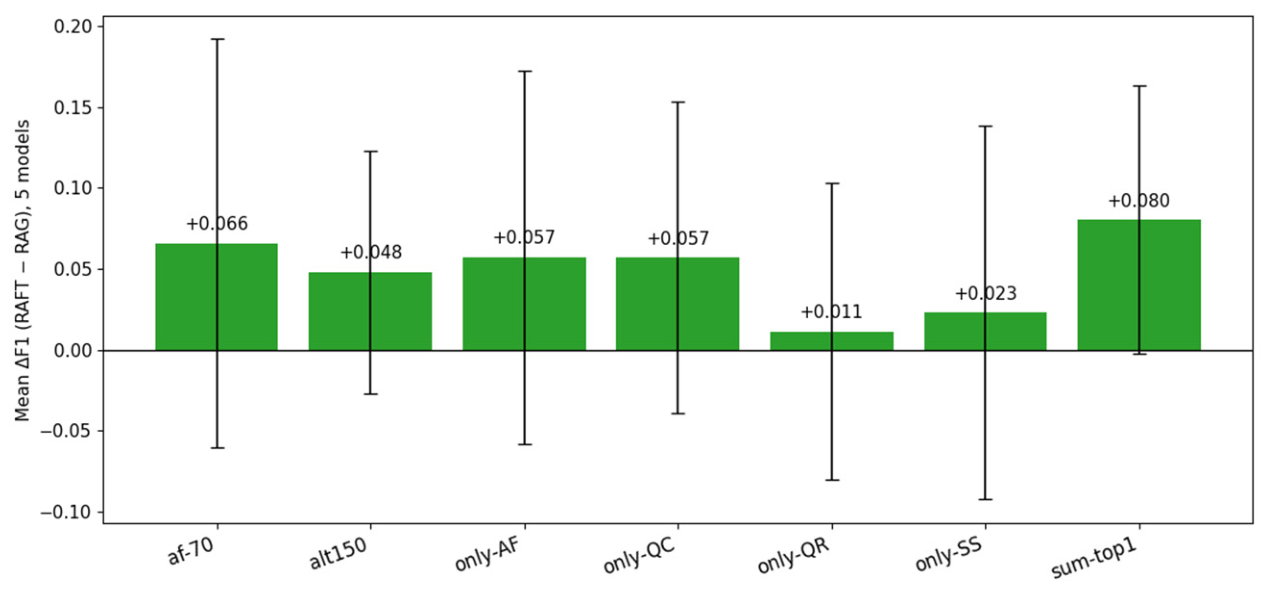
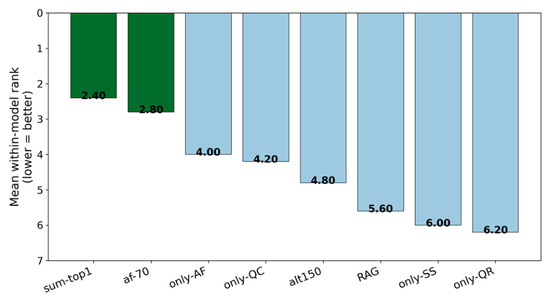
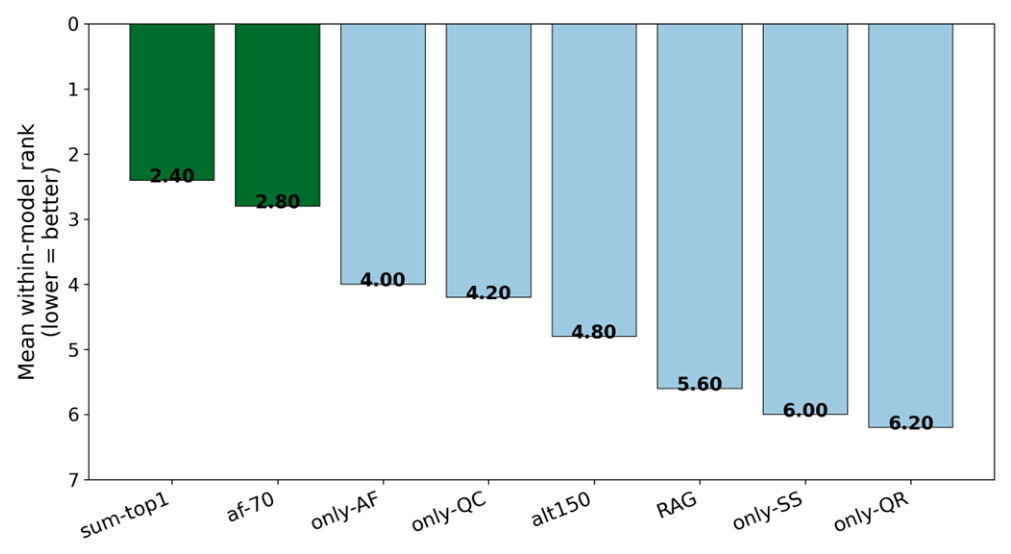
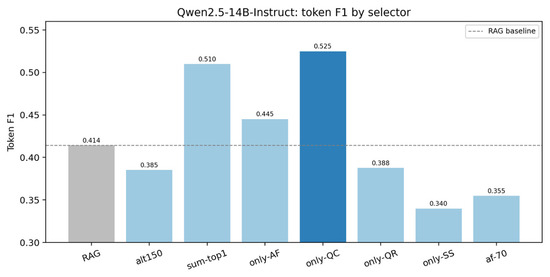
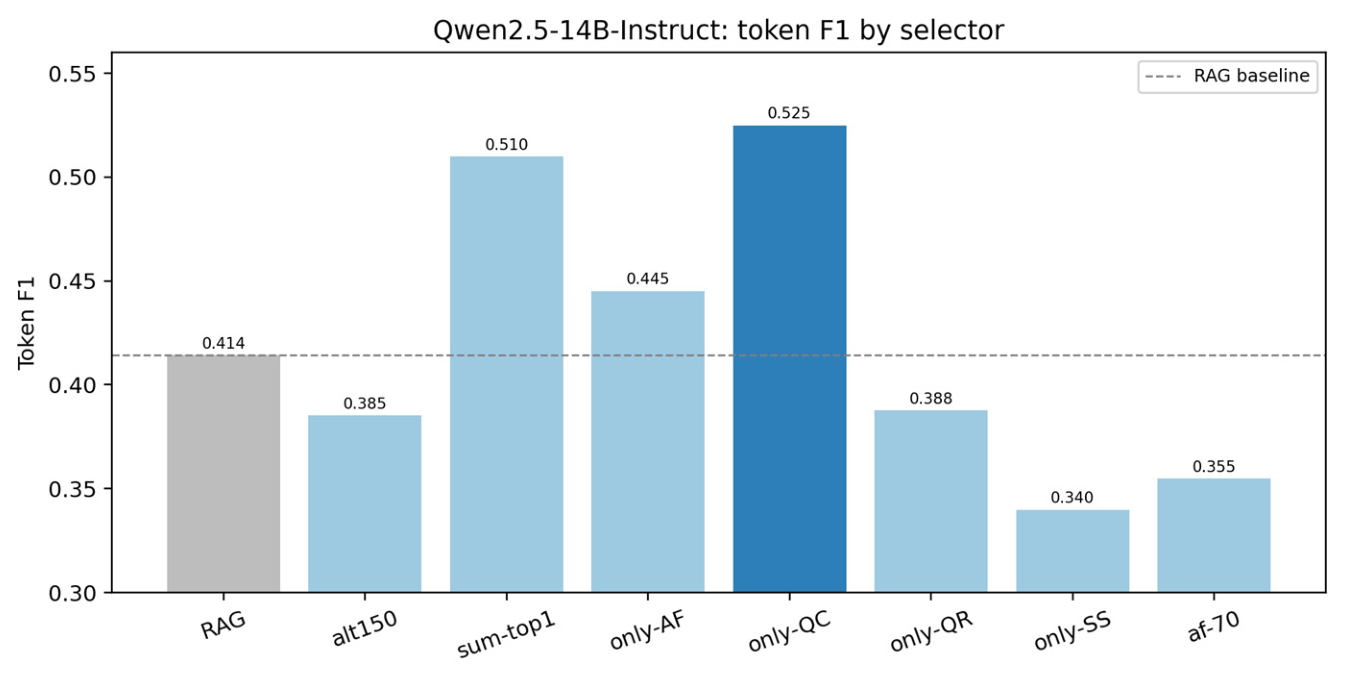
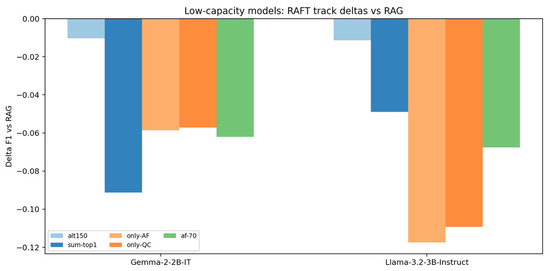
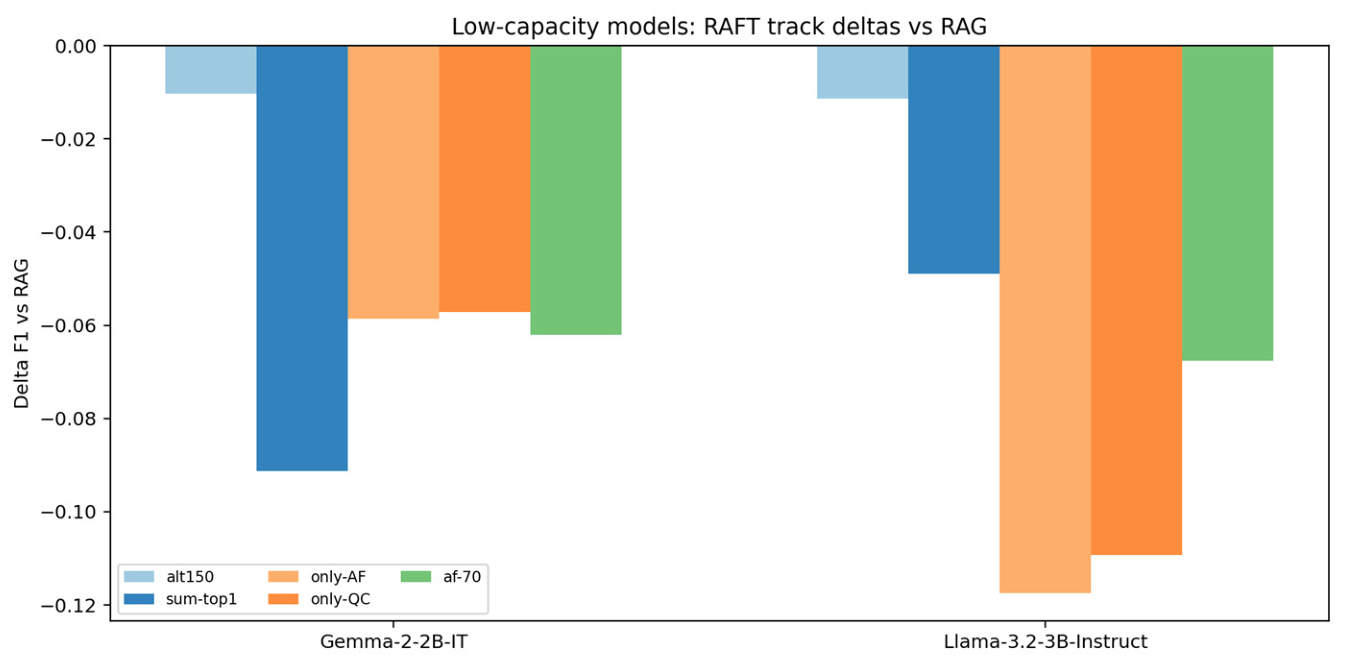

Disclaimer/Publisher’s Note: The statements, opinions and data contained in all publications are solely those of the individual author(s) and contributor(s) and not of MDPI and/or the editor(s). MDPI and/or the editor(s) disclaim responsibility for any injury to people or property resulting from any ideas, methods, instructions or products referred to in the content. |
© 2026 by the authors. Licensee MDPI, Basel, Switzerland. This article is an open access article distributed under the terms and conditions of the Creative Commons Attribution (CC BY) license.