


Abstract
Rubble management in Aleppo is a complex recovery planning problem because debris removal is closely linked to transport access, recycling capacity, reconstruction demand, disposal limits, and local acceptance. This study develops a multi-objective reverse-logistics model for managing post-conflict rubble in the city. The proposed network consists of 21 rubble source nodes, 5 collection and sorting sites, 4 recycling facilities, 5 reconstruction-demand nodes, and 2 disposal sites. The model is formulated as a weighted non-preemptive goal programming problem that considers four objectives: total cost, carbon emissions, dust/social acceptance penalty, and operational implementation risk. Because the last two objectives are strongly context-dependent, they were developed through a Delphi process with 13 experts, and the related subcriteria were weighted using fuzzy FUCOM. Four compromise formulations were tested: weighted goal programming (WGP), augmented max–min fuzzy goal programming (AMM-FGP), weighted additive fuzzy goal programming (WA-FGP), and Max–Min optimization. The resulting solutions were ranked using MARCOS and validated using CRADIS. WGP ranked first, with a MARCOS utility score of 0.697919, followed by Max–Min at 0.654658, AMM-FGP at 0.633123, and WA-FGP at 0.629647. The policy analysis also showed that a 30% recycling subsidy produced the largest improvement, reducing the WGP achievement value from 0.192 to 0.046. These results suggest that, for Aleppo, a rubble-management plan cannot be judged only by cost or emissions. Social nuisance, site operability, and policy support also affect whether a technically efficient network can be implemented in practice.
Keywords:
rubble management; reverse logistics; goal programming; fuzzy FUCOM; MARCOS; post-conflict recovery; Aleppo; Syria MSC:
90C29; 90B06; 90C70; 90C90
1. Introduction
Rubble management in severely damaged cities is not only a matter of debris removal. Systematic management of the collection, sorting, transport, recovery, and disposal of large accumulations of rubble can prevent blocked transport corridors, delays in restoring essential services, complications in reconstruction planning, and environmental and public health risks. Disaster waste management is, therefore, increasingly perceived as a planning and logistics challenge, rather than a routine municipal cleaning task. Disaster debris has been shown in previous studies to overwhelm the capacity of conventional waste management systems, and to interfere with both emergency response and longer-term recovery [1,2].
This challenge is particularly relevant in Syria, where years of conflict have resulted in large stocks of rubble, further compounded by earthquake damage and subsequent demolition activities. Aleppo is one of the most extreme cases. The World Bank’s Syria Joint Damage Assessment of Selected Cities estimated the volume of rubble in the city at 8,445,931 m3 under the low scenario and 12,948,944 m3 under the high scenario. The 2023 rapid damage and needs assessment also identified significant post-earthquake recovery needs against a backdrop of conflict-related destruction and accumulated debris [3,4]. These conditions make Aleppo a major case for city-wide rubble management planning, whether the material is from conflict damage, earthquake effects, or later demolition.
Rubble can also be a resource for potential reconstruction. If the collection, sorting, crushing, and delivery are well organized, some part of the material can be reused as recycled aggregate. This is especially important in a post-conflict city where reconstruction demand is high, and the procurement of new construction materials can be expensive and challenging. Kousa and Pottgiesser [5] discussed debris recovery and reuse in post-war reconstruction in Aleppo. Rashwani et al. [6] demonstrated the practical reuse potential of recycled concrete aggregate from war-damaged buildings in Syria. These findings imply the need to connect rubble management decisions with reconstruction demand, which is in line with the wider literature on construction and demolition waste, where reduction, reuse, and recycling are the cornerstones of sustainable waste planning [7].
Methodologically, this problem needs a reverse logistics and network design approach. Hu and Sheu [8] proposed a reverse-logistics model for managing post-disaster debris. Their model coordinates material flows through interconnected facilities, rather than isolated hauling decisions. This view was further extended by Habib and Sarkar [9], who developed a location allocation model for the management of temporary disaster debris under uncertainty. Further network design models considering facility location, capacity planning, recovery pathways, and uncertainty in the construction and demolition waste field were proposed by Rahimi and Ghezavati [10], Pan et al. [11], and Jahangiri et al. [12]. These studies collectively provide a strong foundation for modeling rubble management as a multi-echelon network that links generation points, intermediate facilities, recovery operations, reconstruction demand nodes, and final disposal sites.
However, there is an important gap regarding fragile post-conflict cities. Studies on the Syrian context are rare and have been mainly concerned with spatial suitability or material recovery. For example, Madi and Srour [13] proposed a GIS-based framework for emergency construction and demolition waste management in Syria and stressed the importance of spatial analysis in site selection and recycling decisions. However, they did not create an integrated city-scale reverse-logistics network that links rubble sources, collection and sorting sites, recycling facilities, reconstruction-demand nodes, and disposal sites in a single optimization model. More generally, the optimization literature has tended to focus on cost, emissions, capacity, and mathematical uncertainty, with less explicit consideration given to implementation conditions such as disrupted access, local nuisance, social acceptance, land feasibility, institutional operability, and site-level risk [13,14].
These characteristics call for a multi-objective, compromise-oriented approach. Conflicting objectives (total cost, carbon emissions, dust and social acceptance effects, and operational implementation risk) are measured in different units, and their individual optima cannot generally be attained within the same network configuration. Moreover, it is not possible to translate the social and operational dimensions into monetary values in a reliable way without making restrictive assumptions. This context is suitable for goal programming because it presents objectives as aspiration levels and looks for a compromise by minimizing undesirable deviations from those levels, thus allowing heterogeneous objectives to be considered in an integrated framework [15,16]. The main formulation is weighted non-preemptive goal programming since the four objectives need to be considered simultaneously without a strict priority hierarchy. Augmented max–min fuzzy goal programming, weighted additive fuzzy goal programming, and Max–Min optimization are also used to check whether the results are stable under different compensation and balancing structures.
This study has three main contributions. First, it builds a five-level reverse logistics network for Aleppo, linking rubble sources, collection and sorting sites, recycling facilities, reconstruction demand nodes, and final disposal sites. Second, it incorporates dust/social acceptance and operational implementation risk as explicit optimization objectives, with the underlying criteria developed through Delphi consultation and fuzzy FUCOM weighting. Third, the four compromise formulations are compared through MARCOS and CRADIS, and the final solution is checked by subsidy and sensitivity analyses. The proposed framework therefore fills the gap between mathematical efficiency and the social, institutional, and operational conditions that affect the practical implementation of rubble management plans in fragile cities.
The rest of the paper is organized as follows. Section 2 identifies the research gap and reviews the relevant literature. Section 3 provides the Aleppo case study and data structure. Section 4 details the expert-elicitation process, weighting procedure, mathematical model, and compromise formulations. Section 5 presents the optimization and ranking results, policy analysis, and sensitivity analysis. In Section 6, the findings are discussed, and practical and methodological implications are presented. Section 7 concludes the paper by discussing the study limitations and directions for future research.
2. Literature Review
The literature pertinent to this study can be categorized into four themes: disaster-debris recovery, reverse-logistics network design, modeling of uncertainty, and the handling of conflicting objectives. Examining these themes together helps to clarify where existing models are useful and where the assumptions of those models become restrictive in a fragile post-conflict setting.
2.1. Disaster-Debris Recovery and Reverse Logistics
The handling of disaster debris has evolved from simple removal and disposal to systems that involve sorting, treatment, recycling, reuse, and final disposal. Brown et al. [1] and the Joint UNEP/OCHA Environment Unit [2] demonstrated that debris generated in the wake of disasters can overwhelm municipalities’ ability to cope normally and hinder both emergency response and longer-term recovery.
Reverse logistics offers an appropriate framework to coordinate these activities. Hu and Sheu [8] developed a post-disaster debris model that considered logistics costs, environmental and operational risks, and psychological effects on affected residents. Their results showed that reducing logistics cost alone can worsen non-economic outcomes, which is important for recovery planning in damaged urban areas.
Habib and Sarkar [9] applied fuzzy possibilistic allocation to multi-criteria site selection for temporary disaster-debris management sites. They recognized in their framework that site selection is a function of regional, municipal, environmental, and legal settings. However, their framework focused mainly on temporary site selection and allocation, not a complete network of collection, recycling, reconstruction demand, and final disposal.
Using GIS, Madi and Srour [13] estimated the quantities of waste in Syria and identified suitable locations for recycling and landfills. Kousa and Pottgiesser [5] and Rashwani et al. [6] looked at the potential for recovery and reuse of debris generated by conflict. These studies establish the spatial and material relevance of rubble recovery in Syria but do not formulate an integrated city-scale network for the full movement of material from rubble sources to reconstruction use or disposal.
2.2. Reverse-Logistics Network Design and Uncertainty
Construction and demolition waste research has led to increasingly detailed reverse-logistics models. Rahimi and Ghezavati [10] developed a multi-period model that considers profit, environmental impact, and social effects under uncertain demand for recycled products and return on investment. Pan et al. [11] investigated the location of treatment plants and capacity expansion considering the interests of the contractors, recycling firms, and public authorities. Jahangiri et al. [12] introduced a robust bi-level network, in which the facility location and waste allocation were determined under uncertainty in the proportion of waste transported from generation points.
The studies improve network design by taking uncertainty into account in terms of quantities, demand, investment conditions, and material flows. However, the uncertainty they address is mostly parametric. Models typically assume that candidate sites, access routes, organizational arrangements, and basic services are in place while selected parameter values differ across scenarios. This assumption is more difficult to sustain in a post-conflict city. In Aleppo, the viability of a site can be compromised by damaged roads and uncertain access, limited utilities, land and legal constraints, institutional coordination, or local resistance. These factors do not just change the value of a parameter, but may determine whether a facility or route can be used at all.
The present study differentiates between numerical uncertainty and implementation conditions. Sensitivity analysis is performed to study the effects of rubble volume, recovery yield, disposal capacity, and transport cost. The operational implementation risk objective directly represents site-level access, land feasibility, utilities, institutional operability, and other related issues.
2.3. Trade-Offs Among Economic, Environmental, and Implementation Objectives
The second problem is the management of conflicting objectives. Some studies have extended beyond cost minimization. Rahimi and Ghezavati [10] considered the economic, environmental, and social dimensions, but their social indicators were mainly related to employment and working conditions. Pan et al. [11] found that higher recycling rates increase the transport costs of contractors and may reduce the profitability of recycling firms. These findings confirm that recycling, cost, and stakeholder interests do not always get better at the same time.
Chen and Liao [14] developed a collaborative routing model for C&DW transport considering economic cost, environmental pollution, and social impact. Their work offers a useful lens on sustainability, but the decision problem is still largely transport-focused. The key variables are time windows, vehicle capacity, and carbon taxation, but the social acceptance and practical operability of collection, recycling, and disposal facilities are not considered as separate site-level objectives.
A closer comparison is with the work of Hu and Sheu [8], as their model explicitly shows that a low-cost solution may have poor results in terms of risk and psychological burden. However, the social dimension is largely related to the waiting time and the psychological consequences after an abrupt disaster. In a longer-term rubble management problem, practical implementation also depends on dust exposure, traffic nuisance, proximity to sensitive locations, local acceptance, access reliability, legal feasibility, utility availability, and institutional capacity.
These trade-offs are important because a solution can be efficient in one way and difficult to implement in another. A shorter route could mean reduced costs and emissions but more trucks around residential areas. A cheap site may not have good access or services. A recycling facility may improve material recovery but generate dust and noise, leading to lower local acceptance. Hence, an optimum solution to a single objective may be mathematically elegant but not practical in the local context.
2.4. Critical Synthesis and Methodological Positioning
The literature offers a good background on reverse logistics, facility location and routing, stochastic programming, robust optimization, and multi-objective modeling. The last gap is the failure to integrate network efficiency with the social and operational conditions that determine whether a rubble management plan can be put into operation in a fragile city.
The Aleppo problem is a conflict of four objectives: total cost, carbon emissions, dust/social acceptance, and operational implementation risk. These objectives are measured in different units, and their individual optima cannot generally be achieved in the same network. The social and operational aspects also cannot be monetized without assumptions which might ruin their practical sense.
In that sense, goal programming is relevant since it employs aspiration levels and undesirable deviations to aggregate heterogeneous objectives into a common decision structure [15,16]. However, the study does not start out with the assumption that one compromise formulation is better. Four formulations are applied to the same physical network: weighted goal programming, augmented max-min fuzzy goal programming, weighted additive fuzzy goal programming, and Max-Min optimization. These formulations differ in the amount of compensation they allow and the degree to which they emphasize overall performance or the least-satisfied objective.
The resulting solutions are compared using MARCOS, and the ranking is validated using CRADIS. This procedure enables the selection of the preferred network based on the performance across all four objectives rather than on a previous methodological preference. Therefore, the contribution of this study is the combination of a city-scale reverse-logistics model with context-specific social and operational objectives, and the independent multi-criteria comparison of the resulting compromise solutions.
The study does not propose a new algorithm for Goal Programming or MCDM. For the problem at hand, existing techniques such as Goal Programming, Fuzzy FUCOM, MARCOS, and CRADIS have been adapted and integrated. The contribution is to develop a city-scale, five-level rubble management network that couples material recovery to reconstruction demand, while explicitly optimizing for dust/social acceptance and operational implementation risk. The contribution also includes generating four compromise solutions under the same physical network and evaluating them independently, instead of assuming in advance the superiority of one formulation. Thus, the resulting framework is an integrative and context-specific methodological contribution rather than a new standalone optimization algorithm.
3. Case Study and Model Notation
3.1. Aleppo Case Study and Network Data
The Aleppo case was used to translate the proposed reverse-logistics framework into a concrete post-conflict rubble management problem. Figure 1 shows the network designed to coordinate three interlinked tasks: clearing rubble from damaged areas, routing recoverable material to recycling facilities, and routing unusable residues to safe disposal sites.
Figure 1.
Five-level reverse-logistics network for rubble management.
Aleppo faces this problem under difficult recovery conditions. The city is strewn with vast amounts of conflict-related debris, and years of disruption have degraded municipal service capacity. A World Bank damage assessment estimates 8.45–12.95 million m3 of rubble in Aleppo (low–high scenarios), and notes that solid-waste capacity was degraded under conflict conditions and public-health risks increased [3]. Globally, disaster/conflict debris is a major obstacle to reconstruction, often complicated by hazardous materials and ad hoc dumping when systems are overstretched [2].
The modeled network includes 21 source nodes, 5 collection/sorting sites, 4 recycling/crushing facilities, 5 reconstruction demand nodes, and 2 disposal sites.
The numbers and locations of the candidate facilities were determined through field surveys and consultations with the relevant local authorities. In particular, the two final disposal locations were agreed upon by representatives of the governorate, environmental authority, cleaning directorate, and investment authority. Accordingly, the disposal-site structure was treated as an externally defined planning condition rather than an unrestricted location decision. Additional disposal locations were not considered institutionally feasible within the scope of the present study.
These counts and candidate locations were compiled from local authority communications and field surveys. The full list of source nodes, candidate facilities, reconstruction demand nodes, capacities, fixed costs, dust penalty coefficients, and operational risk scores is provided in Appendix B (Table A3, Table A4, Table A5, Table A6 and Table A7).
Road network distances were computed in GIS/ArcMap by building a road network dataset, running origin–destination cost-matrix and shortest-path analyses, and applying barriers or restrictions to damaged and inaccessible links. The resulting distance matrices for the source–collection, collection–recycling, recycling–demand, recycling–disposal, and source–disposal links are reported in Appendix C (Table A8, Table A9, Table A10, Table A11 and Table A12).
The sets, parameters, and decision variables used in the mathematical formulation are summarized in the following subsection.
3.2. Sets, Parameters, and Decision Variables
The notation is divided into network-related components and compromise-model components. The former describes the physical rubble flows and facility decisions, while the latter is used in the WGP, AMM-FGP, WA-FGP, and Max–Min formulations presented in Section 4.
Sets and indices:
- : source nodes of rubble generation;
- : collection and temporary sorting sites;
- : recycling and crushing facilities;
- : reconstruction demand nodes for recycled aggregate;
- : final disposal sites;
- g ∈ : objective index, where .
Parameters:
- : quantity of rubble generated at source node (t);
- : maximum recoverable fraction of rubble at source node ;
- : capacity of collection and temporary sorting site (t);
- : capacity of recycling and crushing facility (t);
- : capacity of disposal site (t);
- : recovery yield at recycling facility , representing the fraction converted into usable recycled aggregate;
- : residue fraction at recycling facility , representing the fraction requiring final disposal;
- : demand for recycled aggregate at reconstruction node (t);
- : transport distance from source node to collection site (km);
- : transport distance from collection site to recycling facility (km);
- : transport distance from recycling facility to reconstruction demand node (km);
- : transport distance from recycling facility to disposal site (km);
- : direct transport distance from source node to disposal site (km);
- : transportation cost per ton/kilometer (USD/t·km);
- : collection and temporary sorting cost per ton handled at collection sites (USD/t);
- : recycling and crushing processing cost per ton handled at recycling facilities (USD/t);
- : final disposal cost per ton handled at disposal sites (USD/t);
- : unit economic value or avoided procurement cost of recycled aggregate delivered to reconstruction node (USD/t);
- : fixed opening cost of collection site (USD);
- : fixed opening cost of recycling facility (USD);
- : fixed opening cost of disposal site (USD);
- : transport-related carbon emission factor per ton/kilometer
- : carbon emission factor for collection and temporary sorting per ton handled
- : carbon emission factor for recycling and crushing per ton handled
- : carbon emission factor for final disposal per ton handled
- : dust exposure or social acceptance penalty coefficient associated with collection site
- : dust exposure or social acceptance penalty coefficient associated with recycling facility
- : operational implementation risk coefficient associated with collection site ;
- : operational implementation risk coefficient associated with recycling facility
- : operational implementation risk coefficient associated with disposal site ;
- : aspiration level for total cost, obtained from the single-objective cost-minimization run;
- : aspiration level for total carbon emissions, obtained from the single-objective carbon-minimization run;
- : aspiration level for dust/social acceptance penalty, obtained from the single-objective social penalty minimization run;
- : aspiration level for operational implementation risk, obtained from the single-objective risk-minimization run;
- where is a very small augmentation coefficient;
- : relative weight assigned to the cost goal in the weighted goal programming model;
- : relative weight assigned to the carbon-emission goal in the weighted goal programming model;
- : relative weight assigned to the dust/social acceptance goal in the weighted goal programming model;
- : relative weight assigned to the operational-risk goal in the weighted goal programming model;
Network decision variables:
- : amount of rubble transported from source node to collection site (t);
- : amount of rubble transported directly from source node to disposal site (t);
- : amount of rubble transported from collection site to recycling facility (t);
- : amount of recycled aggregate transported from recycling facility to reconstruction demand node (t);
- : amount of process residue transported from recycling facility to disposal site (t);
- : binary variable equal to 1 if collection site is opened, and 0 otherwise;
- : binary variable equal to 1 if recycling facility is opened, and 0 otherwise;
- : binary variable equal to 1 if disposal site is activated, and 0 otherwise.
Compromise model variables:
- ;
- Where each is the satisfaction degree of one goal.
- 5.
- , where is the minimum achieved satisfaction among the four goals.
- 6.
- : positive deviation above the cost target;
- 7.
- : negative deviation below the cost target;
- 8.
- : positive deviation above the carbon emission target;
- 9.
- : negative deviation below the carbon emission target;
- 10.
- : positive deviation above the dust/social acceptance target;
- 11.
- : negative deviation below the dust/social acceptance target;
- 12.
- : positive deviation above the operational-risk target;
- 13.
- : negative deviation below the operational-risk target.
4. Methodology
The methodology followed an organized multistage framework. First, the case study of Aleppo was defined, and the required spatial and network data were prepared. Then, context-specific indicators related to dust/social acceptance and operational implementation risk were developed through expert consultation and weighted by fuzzy FUCOM, which was chosen to reduce the expert comparison burden while retaining linguistic uncertainty and an explicit consistency mechanism. Then, a multi-objective reverse-logistics model was developed to minimize the total cost, carbon emissions, social penalty, and operational risk. Four compromise solutions were then generated using WGP, AMM-FGP, WA-FGP, and Max–Min optimization. The alternatives were ranked using MARCOS and validated using CRADIS to find the best overall solution.
Finally, subsidy and sensitivity analyses were conducted to examine the performance of the selected compromise solution under alternative policy and planning assumptions. The complete methodological framework is summarized in Figure 2.
Figure 2.
Proposed methodology.
4.1. Development of the Dust/Social Acceptance and Operational Implementation Risk Indicators
In addition to the economic and environmental objectives, this study incorporated two context-sensitive goals that are particularly important in a fragile urban setting: dust/social acceptance penalty and operational implementation risk. Unlike cost and carbon emissions, these dimensions could not be derived reliably from a single secondary data source. They were therefore developed through a Delphi-based expert consultation process and weighted using fuzzy FUCOM.
The use of expert judgment was necessary because the two indicators represent context-dependent conditions for which consistent site-level secondary data were not available. Factors such as community acceptance, access reliability, land and legal feasibility, utility availability, and institutional operability cannot be represented adequately by transport distance or monetary cost alone. The expert process was, therefore, used to translate these qualitative conditions into structured and comparable site-level assessments. These assessments were not introduced directly into the model; they were aggregated through the Delphi procedure and combined with fuzzy FUCOM weights to construct the final coefficients.
A purposive criterion-based approach was used to form the expert panel. Eligible participants were required to have at least five years of professional experience in a field related to rubble management, construction and demolition waste, environmental management, transport and logistics, urban planning, public works, or post-conflict recovery. The selection also sought institutional diversity by including participants from government bodies, private-sector organizations, local non-governmental organizations, and technical or academic backgrounds. Experts with direct knowledge of Aleppo and the Syrian recovery context were included alongside specialists with experience in comparable international settings.
Thirteen experts satisfied the eligibility criteria and completed all three Delphi rounds. The panel size was determined through purposive coverage of the main technical and institutional perspectives rather than through statistical sampling.
Dust/social acceptance penalty: This indicator reflects the local nuisance caused by the activities of rubble collection, transport, sorting, and crushing. It has five sub-criteria. Residential proximity represents the exposure of neighboring households to dust, noise, and truck movement. Sensitive receptors reflect the proximity of schools, hospitals, markets, places of worship, and other vulnerable urban functions. Traffic nuisance represents congestion, safety concerns, and disruption caused by heavy vehicle movement. The severity of dust generation is the expected intensity of particulate emissions during loading, unloading, crushing, and transport. Local acceptance represents the likelihood that nearby communities would tolerate or oppose rubble handling activities. The corresponding subcriterion set is denoted by .
Operational implementation risk: This indicator relates to the practical difficulties in establishing and operating collection, recycling, or disposal facilities under the local conditions of Aleppo. It has six sub-criteria. Access reliability is the ability to reach a site via the road network considering damaged links, bottlenecks, and restrictions on heavy vehicles. Land/legal feasibility includes ownership, permitting, and land use constraints. Security/stability refers to the risk of operational disruption caused by instability or interference from outside. Utility availability is access to electricity, water, fuel, and maintenance support. Contamination complexity is an indication of the difficulty of handling mixed or hazardous rubble. Institutional operability is the capacity of the responsible actors to coordinate, supervise, and continue operations over time. The corresponding subcriterion set is denoted by .
4.2. Delphi-Based Expert Consensus
The Delphi method was used because the 13 experts represented different professional fields and did not have the same degree of familiarity with the Syrian operating context [17]. Each expert assessed the proposed subcriteria and candidate sites independently, and the responses were kept anonymous to reduce the influence of seniority, institutional position, or dominant individuals.
When large discrepancies occurred between the ratings, the experts were asked to briefly explain their judgments. The research team then produced an anonymized summary of the group ratings and the main reasons for the contrasting views. This feedback was passed on in the next round, and participants were allowed to re-evaluate their assessments in light of the arguments put forward by experts from other fields. Special attention was paid to clarifying differences between judgments based on direct knowledge of Aleppo and judgments based on experience in other geographical or institutional settings. The experts could revise or keep their first assessments.
Since the evaluations were judgment-based and ordinal, the median was used to aggregate the ratings for each site–subcriterion combination.
Each site was rated on a five-point ordinal scale, where 1 indicated the lowest level of nuisance or implementation risk, and 5 indicated the highest level.
Similarly, the aggregated score for the operational implementation risk dimension is given by:
The median was preferred because it is robust to extreme judgments and is more appropriate than the arithmetic mean when the underlying responses are collected on an ordinal Likert-type scale.
To assess the degree of expert agreement, the interquartile range (IQR) was computed for each site–subcriterion combination. For the dust/social acceptance dimension:
For the operational implementation risk dimension:
where:
Consensus was considered to be achieved when:
The IQR measures the spread of the middle 50% of expert ratings. On a five-point ordinal scale, an IQR ≤ 1 is commonly used to indicate acceptable consensus [18]. The stricter condition IQR < 1 was adopted in this study to require closer convergence before the median was accepted as representative of the group judgment.
Items that did not meet this threshold were returned to the panel together with the anonymized rating summary and the reasons submitted for the contrasting views. Experts could then revise or retain their assessments. The process was repeated until the required level of agreement was reached.
The Delphi process required three rounds, after which all retained evaluations satisfied the adopted consensus threshold.
4.3. Determination of Subcriterion Weights Using Fuzzy FUCOM
After consensus was reached on the subcriteria, their relative importance was determined using fuzzy FUCOM. The method was selected because it requires a limited number of structured comparisons. Once the criteria are ranked, experts compare only consecutive criteria in the ordered sequence. This was important in the present study because the panel consisted of 13 specialists from different professional backgrounds, not all of whom were familiar with detailed pairwise-comparison procedures. Reducing the number of judgments also shortened the consultation process and limited the need to repeat assessments in a recovery setting where expert availability was constrained.
The fuzzy extension was used because several experts found linguistic expressions of importance more natural than exact numerical ratios. Terms such as equal, weak, moderate, or strong importance were represented by triangular fuzzy numbers, allowing uncertainty and hesitation in the judgments to be retained during weight estimation. Compared with AHP, this approach avoids constructing a complete pairwise-comparison matrix and conducting a separate consistency-ratio revision process. BWM also reduces the number of comparisons, but it requires two reference-based comparison vectors centered on the best and worst criteria. FUCOM was more consistent with the elicitation procedure used here, in which experts first ranked the criteria and then compared adjacent criteria. Consistency was not ignored; it was incorporated into the FUCOM optimization model through the transitivity conditions and the deviation from full consistency measure [19,20].
Let denote the fuzzy FUCOM weight of dust/social acceptance subcriterion , and let denote the fuzzy FUCOM weight of operational implementation risk subcriterion .
After defuzzification, the final crisp normalized weights are denoted by , respectively, subject to:
These weights express the relative contribution of each subcriterion within its corresponding composite indicator.
The final site-level coefficients were obtained by combining the normalized fuzzy FUCOM weights with the median ratings from the Delphi process. For each facility, the dust/social acceptance coefficient was calculated as the weighted sum , while the operational implementation risk coefficient was calculated as . The dust/social calculation was applied to collection and recycling facilities, whereas the operational risk calculation was applied to collection, recycling, and disposal facilities. The resulting coefficients were used directly in the corresponding objective functions and are reported in Appendix B.
4.4. Building the Mathematical Model
An integrated reverse logistics network for rubble management in Aleppo is formulated as a multi-objective mixed-integer linear programming model. The numerical values used to instantiate the sets, capacities, costs, demand parameters, penalty coefficients, risk scores, and transport distances are summarized in Appendix B and Appendix C.
The network comprises source nodes, collection and temporary sorting sites, recycling/crushing facilities, reconstruction demand nodes for recycled aggregate, and final disposal sites. Material may flow from source nodes to collection sites, then to recycling facilities, and finally either to reconstruction demand nodes as recycled aggregate or to disposal sites as process residue. A direct flow from source nodes to disposal sites is also allowed for non-recoverable or contaminated material.
For baseline calibration, the Aleppo city rubble stock is defined using the low and high city-level estimates reported by the World Bank, namely 8,445,931 m3 and 12,948,944 m3. Their midpoint, 10,697,438 m3, is adopted as the medium scenario. Using a conversion factor of 1.60 t/m3, the baseline stock equals 17,115,900 t. The World Bank also reports a unit rubble management cost of approximately USD 9.5/t and a processing scenario in which 70% of processed debris is recovered as recycled aggregate and 30% is sent to disposal; these values are used as calibration anchors in the baseline model. Hazardous constituents justify the explicit treatment of environmental and social penalties within the proposed formulation.
The mathematical model is presented in three layers. The first layer defines the physical reverse logistics network and the material-flow constraints. The second layer defines the four performance objectives: total cost, carbon emissions, dust/social acceptance penalty, and operational implementation risk. The third layer applies four compromise formulations: WGP, AMM-FGP, WA-FGP, and Max–Min optimization. The resulting solutions are then compared using MARCOS and validated by CRADIS.
4.4.1. Objective Functions
Total cost:
Total carbon emissions:
Dust/social acceptance penalty:
Operational implementation risk:
4.4.2. Model Constraints
Source mass-balance constraint:
Recoverable share constraint:
Flow-conservation constraint at collection sites:
Collection-site capacity constraint:
Recycling facility capacity constraint:
Recovered aggregate balance at recycling facilities:
Residue balance at recycling facilities:
Demand satisfaction limit:
Disposal-site capacity constraint:
The existing recycling facility in Rammouseh was required to remain active in all model runs. Accordingly,
The primary disposal site was also required to remain active. Accordingly,
The set of disposal sites is restricted to the two locations approved by the relevant authorities. Therefore, the model determines their activation and flow allocation but does not generate additional disposal-site locations. Capacity expansion at the approved sites is examined separately through sensitivity analysis.
These linking constraints ensure that no flow is assigned to a closed facility.
4.5. Compromise Optimization Formulations
4.5.1. Weighted Goal Programming
Cost goal:
Carbon emission goal:
Dust/social acceptance goal:
Operational risk goal:
Weighted non-preemptive goal programming objective
Weight normalization constraint:
Non-negativity constraints:
4.5.2. Augmented Max–Min Fuzzy Goal Programming (AMM-FGP)
Fuzzy goal constraints: Because all four objectives are minimization-type objectives, each is represented as an upper-bound fuzzy goal. The fuzzy-goal logic is based on aspiration levels and admissible violations.
The augmented max–min fuzzy goal programming formulation was selected because rubble management planning in a fragile post-conflict setting requires protection against highly unbalanced solutions. A network that performs well in terms of cost or carbon emissions may remain practically unacceptable if its social acceptance or operational risk satisfaction is very low. The max–min component therefore maximizes the satisfaction level of the least-satisfied goal, preventing any single objective from being excessively sacrificed. However, the pure max–min operator may generate multiple solutions with the same minimum satisfaction level. To distinguish among such solutions, an augmentation term is added to improve the overall weighted satisfaction while retaining priority for the weakest goal. This formulation follows the augmented max–min logic introduced by Lai and Hwang [21] and subsequently developed for weighted fuzzy goal programming by Arıkan [22].
All four objectives are minimization-type goals. Their satisfaction levels are represented by the membership variables and The ideal values and admissible deviations derived from the payoff table are used to construct the following linear membership constraints.
The compact linear form is:
These equations mean:
- if the achieved value is at or below the ideal value, satisfaction can reach 1;
- as the achieved value moves away from the ideal, satisfaction declines;
- when the achieved value reaches , satisfaction drops to 0,
To define λ as the minimum satisfaction level, the following constraints are imposed:
where
The augmented max–min objective function is:
With:
This objective function ensures the following:
This objective first maximizes the satisfaction of the least-satisfied goal and then uses the weighted sum of memberships to distinguish between solutions with the same minimum satisfaction level.
4.5.3. Weighted Additive Fuzzy Goal Programming (WA-FGP)
Weighted additive fuzzy goal programming was implemented as an alternative FGP aggregation approach to assess whether the selected solution is sensitive to the treatment of compensation among the goals. Weighted additive FGP maximizes the total weighted satisfaction of the fuzzy goals rather than directly protecting the least-satisfied goal. It therefore allows strong performance on some objectives to compensate for weaker performance on another objective. This approach provides a useful contrast with the augmented max–min formulation and is consistent with the weighted additive FGP models examined by Yaghoobi et al. [23].
The weighted additive FGP objective is:
This objective is solved subject to the physical network constraints, the fuzzy membership constraints in Equations (38)–(41), the membership bounds in Equations (46)–(49), and the weight-normalization condition in Equation (52). Unlike AMM-FGP, the WA-FGP model does not contain the minimum satisfaction variable Consequently, it is more compensatory: a lower satisfaction level in one goal may be accepted when it generates sufficiently large improvements in the other weighted goals.
4.5.4. Max–Min Model
In addition to the weighted goal programming and fuzzy goal programming formulations, a max–min model was also implemented for comparison. The model uses the same payoff-based objective satisfaction degrees as the main framework. For each objective, the satisfaction degree was defined by normalizing the achieved value between the corresponding ideal and nadir-like values obtained from the payoff table. Since all four objectives in the Aleppo model are minimization goals, the satisfaction degree was calculated as relative closeness to the ideal value. The final max–min model maximizes the minimum satisfaction degree across all objectives, thereby yielding the most balanced compromise in terms of the worst-performing criterion.
Max–min objective function:
Max–min constraints:
Satisfaction-degree equations: Because all four objectives are minimization-type objectives, their satisfaction degrees are defined as follows:
- : the goal reaches its ideal value;
- : the goal is at the row-wise worst value from the payoff table;
- A higher means better performance.
4.6. Aspiration Levels
For each objective, the ideal value was obtained by solving the corresponding single-objective version of the model. A payoff table was then constructed by recording the values of all objectives under each single-objective solution. For each goal, a nadir-like value was taken as the worst observed value in the payoff table. The admissible violation of each fuzzy goal was defined as a fraction of the ideal–nadir spread, i.e., . The aspiration level for each objective was set equal to its ideal value. For the fuzzy formulations, was used for all objectives; therefore, the full observed ideal–nadir spread defined the interval over which satisfaction declined from 1 to 0.
4.7. MARCOS Method
MARCOS was selected to compare the four optimization solutions because it evaluates each alternative relative to both ideal and anti-ideal solutions and expresses the result through an overall utility measure. This is useful when the alternatives involve conflicting criteria with different units. CRADIS was used as a validation method because it applies a different distance-based ranking logic; agreement between the two methods therefore provides evidence that the ranking is not dependent on a single procedure. TOPSIS was not used because it ranks alternatives mainly through relative distances from ideal solutions, while VIKOR emphasizes a compromise between group utility and individual regret. PROMETHEE requires the specification of preference functions and thresholds, which would introduce additional subjective parameters. MARCOS and CRADIS were therefore selected as a concise main-ranking and validation pair rather than as universally superior methods.
MARCOS evaluates each alternative based on its distance from the ideal and anti-ideal solutions, and the final ranking is computed from utility functions that reflect the relative position of each alternative. Thanks to this structure, the method provides a clear and systematic approach for comparing alternatives under multiple criteria and for finding the most acceptable compromise solution [24].
Let denote the alternatives, donate the criteria, donate the weight of criterion , the set of benefit criteria, and the set of cost criteria.
MARCOS equations:
Finally, the alternatives are ranked according to the final utility function , and the alternative with the highest value is considered the best one.
5. Results
5.1. Single-Objective Results and Payoff Table
The payoff table obtained from the four single-objective optimization runs is shown in Table 1, and the corresponding normalized values are shown in Figure 3. Each objective was normalized to a [0, 1] range where 0 is the ideal value, and 1 is the worst value observed for that objective in the single-objective runs.
Table 1.
Payoff Table.
Figure 3.
Results of the single-objective optimization runs for cost, carbon emissions, social penalty, and operational risk.
As expected, the diagonal entries correspond to the ideal values obtained when each objective was minimized separately. The off-diagonal entries show the effect of each single-objective solution on the remaining criteria. Minimizing the social penalty produced the highest total cost, while the carbon- and social-minimization runs both resulted in an operational risk value of 33. The risk-minimization run produced the highest carbon-emission value. These results form the payoff structure used to define the aspiration levels and performance ranges of the compromise formulations.
5.2. Results of the Four Compromise Formulations
Table 2 reports the FUCOM-derived weights used in the four compromise formulations. Dust/social acceptance received the highest normalized weight, followed by operational implementation risk, total cost, and carbon emissions.
Table 2.
Results of FUCOM weights—group weights of 13 experts.
Table 3 and Figure 4 compare the solutions obtained from AMM-FGP, WA-FGP, WGP, and Max–Min. Max–Min produced the lowest total cost among the four compromise solutions. AMM-FGP achieved the lowest carbon emission value, whereas WGP achieved the lowest social penalty and reached the ideal operational risk value of 24. WA-FGP produced values close to those of AMM-FGP but did not provide the best result for any individual objective. Detailed facility allocation and material flow results are reported in Appendix D (Figure A1, Figure A2, Figure A3, Figure A4 and Figure A5).
Table 3.
Comparative objective performance of the AMM-FGP, WA-FGP, WGP, and Max–Min models.
Figure 4.
Relative gaps from the ideal values for the four compromise formulations.
5.3. MARCOS and CRADIS Ranking Results
MARCOS was used to evaluate the four compromise solutions generated by AMM-FGP, WA-FGP, WGP, and Max–Min. The detailed calculations are reported in the table in Appendix E.
WGP achieved the highest MARCOS utility score of 0.697919 and ranked first. Max–Min ranked second with a score of 0.654658, followed by AMM-FGP with 0.633123 and WA-FGP with 0.629647. The four alternatives were also evaluated using CRADIS, which produced the same ranking order. The experts’ individual rankings and fuzzy adjacent comparisons used in the weighting process are provided in the table in Appendix F.
5.4. Subsidy Policy Results
To examine the potential role of policy intervention in post-conflict rubble recovery, a recycling subsidy mechanism was introduced in addition to the baseline scenario. It represents a recovery subsidy that reduces the effective processing cost at recycling facilities by a policy rate . Thus, the original recycling cost parameter is replaced by , where . The targets and weights are kept fixed and only the effective recycling cost changes across scenarios. Therefore, a lower value indicates better overall achievement relative to the same benchmark. The results are presented in Table 4.
Table 4.
Subsidy policy analysis under the WGP model.
The WGP achievement value decreased from 0.192 in the baseline case to 0.191, 0.123, and 0.046 under the 10%, 20%, and 30% subsidy scenarios, respectively. The 30% subsidy produced the lowest total cost, social penalty, operational risk, and overall achievement value. The 10% scenario produced the lowest carbon emission value.
5.5. Sensitivity Analysis Results
The analysis examined rubble volume, disposal capacity, recovery yield, transport cost, expert-derived social and operational-risk coefficients, and alternative criterion-weight profiles. For the rubble volume, disposal capacity, recovery yield, and transport cost scenarios, the payoff table and aspiration ranges were recalculated before solving the WGP model. Consequently, WGP achievement values are not directly comparable across these scenarios, and the tables report the raw objective values instead. The sensitivity results for rubble volume, disposal capacity, recovery yield, and transport cost are presented in Table 5, Table 6, Table 7 and Table 8, respectively.
Table 5.
Sensitivity of the WGP solution to rubble-volume estimates.
Table 6.
Disposal capacity sensitivity under the high rubble-volume scenario.
Table 7.
Sensitivity of the WGP solution to recovery yield.
Table 8.
Sensitivity of the WGP solution to transport cost.
The model remained feasible under the low and medium rubble estimates. Under the high estimate, the original network was infeasible.
A combined capacity of 10.22 million tons was the lowest tested level that restored feasibility. The 11 million-ton scenario produced a higher total cost but lower EC, SP, and RK values.
The high-recovery scenario produced the lowest values for all four objectives. The low-recovery scenario also resulted in lower objective values than the baseline.
Both transport cost variations produced lower total cost and carbon emissions than the baseline. The −10% scenario also reduced the social penalty, with a small increase in operational risk, whereas the +10% scenario produced the highest social penalty and operational risk values.
To examine the dependence of the WGP solution on the expert-derived parameters, the dust/social acceptance and operational risk coefficients were varied separately by ±10%. All other parameters, objective weights, aspiration levels, and normalization ranges were held at their baseline values.
Table 9 shows that changes in the social coefficients affected the compromise solution. Reducing these coefficients by 10% lowered total cost by 8.44% and carbon emissions by 3.23%, while operational risk increased from 24 to 29. Increasing the social coefficients by 10% also reduced total cost and carbon emissions by 10.25% and 4.61%, respectively, but resulted in a higher social penalty value and the same operational risk value of 29. By contrast, changing the risk coefficients did not affect total cost, carbon emissions, or social penalty. The reported risk value changed proportionally from 24 to 21.6 and 26.4 under the −10% and +10% scenarios, respectively.
Table 9.
Local sensitivity of the WGP solution to changes in the expert-derived coefficients.
The stability of the final ranking was examined using four alternative preference profiles derived from the expert assessments. The achieved objective values of the four compromise solutions were kept unchanged, while MARCOS and CRADIS were recalculated using profiles emphasizing operational risk, dust/social acceptance, total cost, and carbon emissions.
As shown in Table 10, WGP remained the first-ranked solution under all five weight profiles in both MARCOS and CRADIS. The result indicates that the selection of WGP was not dependent only on the aggregated group weights and remained stable under the different expert preference structures considered.
Table 10.
Ranking stability under alternative expert-derived criterion-weight profiles.
6. Discussion
6.1. Objective Trade-Offs and Selection of the Compromise Solution
The payoff table confirms that the four objectives cannot be improved simultaneously. Minimizing the social penalty produced the highest total cost, while the carbon- and social-minimization solutions both led to the highest operational risk value. Conversely, the risk-minimization solution produced the highest carbon emissions. These results show that a solution based on one objective alone would shift a considerable burden to at least one of the remaining dimensions.
The four compromise formulations reflected different ways of handling these conflicts. Max–Min achieved the lowest total cost among the compromise solutions, while AMM-FGP produced the lowest carbon emissions. WGP performed best in the dust/social acceptance objective and reached the ideal operational risk value. WA-FGP produced results close to AMM-FGP but did not provide the best value for any individual criterion. No formulation, therefore, dominated the others across all four objectives.
WGP was not selected beforehand as the preferred method. The four solutions were first generated under the same physical network and were then evaluated using the FUCOM-derived criterion weights. Dust/social acceptance (0.28231) and operational risk (0.27594) had the highest weights, followed by total cost and carbon emissions. WGP, with its relatively strong performance on the two most highly weighted dimensions, achieved a higher overall MARCOS utility than the other candidates despite its less favorable cost and carbon results. Thus, it achieved the maximum MARCOS utility score, followed by Max–Min, AMM-FGP and WA-FGP. CRADIS produced the same ranking, showing that the final choice was not dependent on a single ranking procedure.
This finding is consistent with earlier disaster- and construction-waste studies. Hu and Sheu [8] proved that the minimization of logistics cost can increase the risk and psychological burdens. Pan et al. [11] found that recycling performance, transport cost, and stakeholder interests can be in conflict. The Aleppo results extend this argument by showing that social acceptance and operational feasibility may drive the preferred network even if a solution appears more attractive in terms of cost or carbon. In a fragile urban context, the best plan is not necessarily the cheapest one, but the one that offers an acceptable balance between efficiency and practical implementation.
6.2. Policy and Operational Implications
The subsidy analysis indicates that the financial support for recycling can enhance the overall performance of the rubble management network, but its effect is not proportional across the four objectives. The 30% subsidy produced the lowest WGP achievement value and the strongest overall result among the policy scenarios studied. Conversely, the 10% subsidy had the lowest carbon emission value but was less effective for social penalty and operational risk. This difference suggests that the recycling incentive affected the selected network decisions rather than merely reducing processing costs. Therefore, policy performance should be evaluated across economic, environmental, social, and operational criteria rather than just costs or emissions.
The rubble volume analysis also has an immediate operational implication. The high rubble estimate showed that the original combined disposal capacity of 8 million tons was inadequate. The lowest tested capacity that restored feasibility was approximately 10.22 Mt. The 11 Mt scenario provided additional capacity and lower emissions, social penalty and operational risk, but at a higher total cost. Expanding the capacity of these two disposal sites, which were identified and approved through consultation with the relevant authorities, is a more realistic option than new hypothetical locations. The result thus indicates a capacity planning problem rather than a need to reconsider the entire disposal-site structure.
The combined results show that policy incentives and infrastructure capacity should be coordinated. Recycling subsidies may increase the attractiveness of material recovery, but their benefits will remain limited unless disposal capacity, road access, site operability or local acceptance are also addressed simultaneously. Other instruments such as minimum recycled content requirements in reconstruction projects, landfill restrictions and standards for operational access can be added to a subsidy policy. These alternatives were not tested in the present model, but they provide relevant directions for a broader policy analysis.
6.3. Robustness, Model Behavior, and Relation to Previous Studies
The sensitivity analysis shows that the selected network is not equally stable under all assumptions. It remained feasible under the low and medium rubble estimates, but the high-volume case exceeded the original disposal capacity. Expanding the combined capacity of the two approved disposal sites restored feasibility. The analysis therefore does not suggest that one fixed network will remain suitable under every possible condition. Rather, it identifies the capacity and operating conditions that must be maintained for the network to remain workable.
This use of sensitivity analysis differs from the uncertainty treatments found in earlier C&DW network studies. Rahimi and Ghezavati [10] incorporated stochastic demand for recycled products and return on investment into a two-stage risk-averse model, while Jahangiri et al. [12] used scenario-based robust optimization for uncertainty in the proportion of waste transported from generation points. In the present study, uncertainty is not embedded directly in the optimization formulation. Instead, rubble quantity, recovery yield, disposal capacity, and transport cost are varied after the baseline formulation is established. The analysis therefore complements, rather than replaces, stochastic or robust optimization by showing how the selected compromise solution responds to changes in key planning assumptions.
Recovery yield had a particularly strong effect on the results. Increasing the yield from 70% to 80% improved all four objectives because a larger share of processed rubble became usable recycled aggregate and less residue required disposal. The low-recovery scenario also produced lower objective values than the baseline, but this should not be interpreted as evidence that lower recovery is preferable. Under the current formulation, recycled aggregate demand is an upper bound, direct disposal is permitted, and no minimum recycling level is imposed. When recovery becomes less efficient, the lower objective values may reflect reduced recycling activity, greater use of direct disposal, or a different facility configuration. The result reveals an important feature of the model: good values for cost, emissions, social penalty, and operational risk do not necessarily imply strong circular economy performance. Pan et al. [11] similarly showed that recycling network performance depends on treatment capacity and the conflicting interests of contractors, recycling firms, and public authorities. The present findings add that an explicit recovery requirement may be needed when policy makers wish to prevent economically attractive solutions from relying excessively on disposal.
The transport cost scenarios also produced a non-linear response. The non-linear objective values suggest that changes in the unit transport cost affected routing, material allocation, or facility selection decisions. Since facility opening decisions are binary, a relatively small parameter change may lead to a different network configuration rather than a proportional change in the same solution. Chen and Liao [14] likewise showed that transport-related conditions, including vehicle capacity, time windows, and carbon taxation, influence the preferred C&DW routing plan. The Aleppo model extends this observation from routing to the wider network-design level, where transport changes can also affect facility activation, social exposure, and operational risk.
The local coefficient analysis indicates that the solution was more sensitive to the social acceptance parameters than to a uniform change in the operational risk coefficients. Perturbing the social coefficients changed the cost–emission–risk trade-off: both the −10% and +10% scenarios produced lower cost and emissions but increased operational risk from 24 to 29. This suggests that changes in the social penalty specification can lead the model toward a different network configuration, with economic and environmental gains accompanied by greater implementation difficulty. Since the model contains binary facility decisions, the response need not be proportional to the parameter change.
In contrast, the ±10% changes in the risk coefficients left total cost, emissions, and social penalty unchanged. The risk value itself changed by exactly the same percentage as the coefficients, indicating that the selected solution remained stable and that the observed difference was mainly a rescaling of the risk measure. The baseline solution therefore appears locally stable under uniform changes in the operational risk coefficients, but more sensitive to the specification of the social acceptance coefficients. As this was a one-at-a-time local test, the findings should not be interpreted as evidence of global robustness.
The criterion-weight analysis further supports the stability of the final selection. Although the alternative profiles placed greater emphasis on different objectives, WGP remained first under both MARCOS and CRADIS in every case. This suggests that its preferred position was not driven by one particular weighting structure, but by its overall performance across the four criteria. The analysis tests ranking stability rather than changes in the underlying network, since the achieved objective values were held fixed.
These results suggest that the framework is most useful as a planning and comparison tool rather than as a fixed prescription. Disposal capacity, recovery policy, and transport conditions should be reviewed as implementation progresses. Future extensions could incorporate uncertain road availability and rubble quantities directly through stochastic or robust formulations, as well as minimum recovery constraints to ensure that improved objective values are not achieved through an unintended shift toward direct disposal.
7. Conclusions
The model developed in this study is an integrated reverse-logistics model for rubble management in Aleppo that links collection, recycling, reconstruction demand, and final disposal in one optimization model. The case was treated not only as a debris clearance problem, but also as a recovery planning problem in which cost, carbon emissions, dust/social acceptance, and operational risk interact. The payoff table results revealed clear conflicts between these objectives, supporting the notion that a single-objective approach would give only a partial view of the problem.
WGP was selected as the best solution among the four tested compromise solutions under the FUCOM-weighted MARCOS evaluation. Its advantage was not that it dominated every objective, but that it performed well on the higher-weighted social and operational risk dimensions. The MARCOS ranking placed WGP first, followed by Max-Min, AMM-FGP and WA-FGP, and the same order was obtained through CRADIS validation. This supported the final selection of WGP as the most suitable compromise for the Aleppo case.
The subsidy analysis suggested that policy incentives could have a significant impact on system performance. The 30% recycling subsidy gave the best overall outcome under WGP, and the 10% subsidy scenario performed best only in terms of carbon emissions. The result suggests that support for recycling should not be based only on cost or emissions. Policy options in the management of post-conflict rubble need to be evaluated simultaneously on economic, environmental, social, and operational criteria.
Sensitivity analyses indicated that disposal capacity is a key factor under the high rubble volume scenario. The alternative expert-derived criterion-weight profiles did not change the final WGP ranking.
The study has some limitations. The numerical results are specific to Aleppo and depend on the adopted assumptions, cost values, distance matrices, facility capacities, and policy scenarios. The model is also deterministic, so it does not fully represent uncertainty in security conditions, reconstruction demand, fuel prices, road access, or facility operation. In addition, social and operational conditions were represented through aggregate penalty and risk parameters, which are useful for optimization but cannot fully capture the complexity of field conditions.
Future work can extend the model to robust or stochastic optimization, use the framework in other Syrian cities, or consider a multi-period version in which the quantities of rubble, demand, and use of facilities change over time. Further work may also refine the social and operational dimensions through participatory weighting, more detailed expert elicitation, or deeper integration with GIS-based spatial analysis. These extensions would make the framework more useful for practical recovery planning in fragile urban settings.
Author Contributions
Conceptualization, J.H. and A.H.A.H.; methodology, J.H.; software, A.H.A.H.; validation, A.H.A.H.; formal analysis, J.H.; investigation, A.H.A.H.; resources, A.H.A.H.; data curation, A.H.A.H.; writing—original draft preparation, J.H.; writing—review and editing, A.H.A.H.; visualization, J.H.; supervision, J.H.; project administration, A.H.A.H.; funding acquisition, A.H.A.H. All authors have read and agreed to the published version of the manuscript.
Funding
This work was supported by the Deanship of Scientific Research, Vice Presidency for Graduate Studies and Scientific Research, King Faisal University, Saudi Arabia, under Grant KFU263437.
Institutional Review Board Statement
Not applicable.
Data Availability Statement
The data required to reproduce the optimization model are included in the manuscript appendices. Appendix B presents the case study nodes and input parameters; Appendix C provides the distance matrices; Appendix D reports the optimal network allocation and flow results; Appendix E presents the MCDM ranking and validation results; and Appendix F reports the experts’ individual rankings and fuzzy adjacent comparisons. Additional implementation details are available from the corresponding author upon reasonable request.
Conflicts of Interest
The authors declare no conflict of interest.
Appendix A. Comparison of Previous Studies
Table A1.
Methodological and contextual comparison of previous studies.
Table A2.
Gap-positioning comparison.
Appendix B. Case-Study Nodes and Input Parameters
Table A3.
Source nodes and rubble quantities.
Table A4.
Candidate collection/sorting sites.
Table A5.
Candidate recycling facilities.
Table A6.
Reconstruction demand nodes.
Table A7.
Candidate disposal sites.
Appendix C. Distance Matrices
Table A8.
Distance matrix from source nodes to collection sites.
Table A9.
Distance matrix from collection sites to recycling facilities.
Table A10.
Distance matrix from recycling facilities to reconstruction demand nodes.
Table A11.
Distance matrix from recycling facilities to disposal sites.
Table A12.
Distance matrix from source nodes to disposal sites.
Appendix D. Optimal Network Allocation and Flow Results
Figure A1.
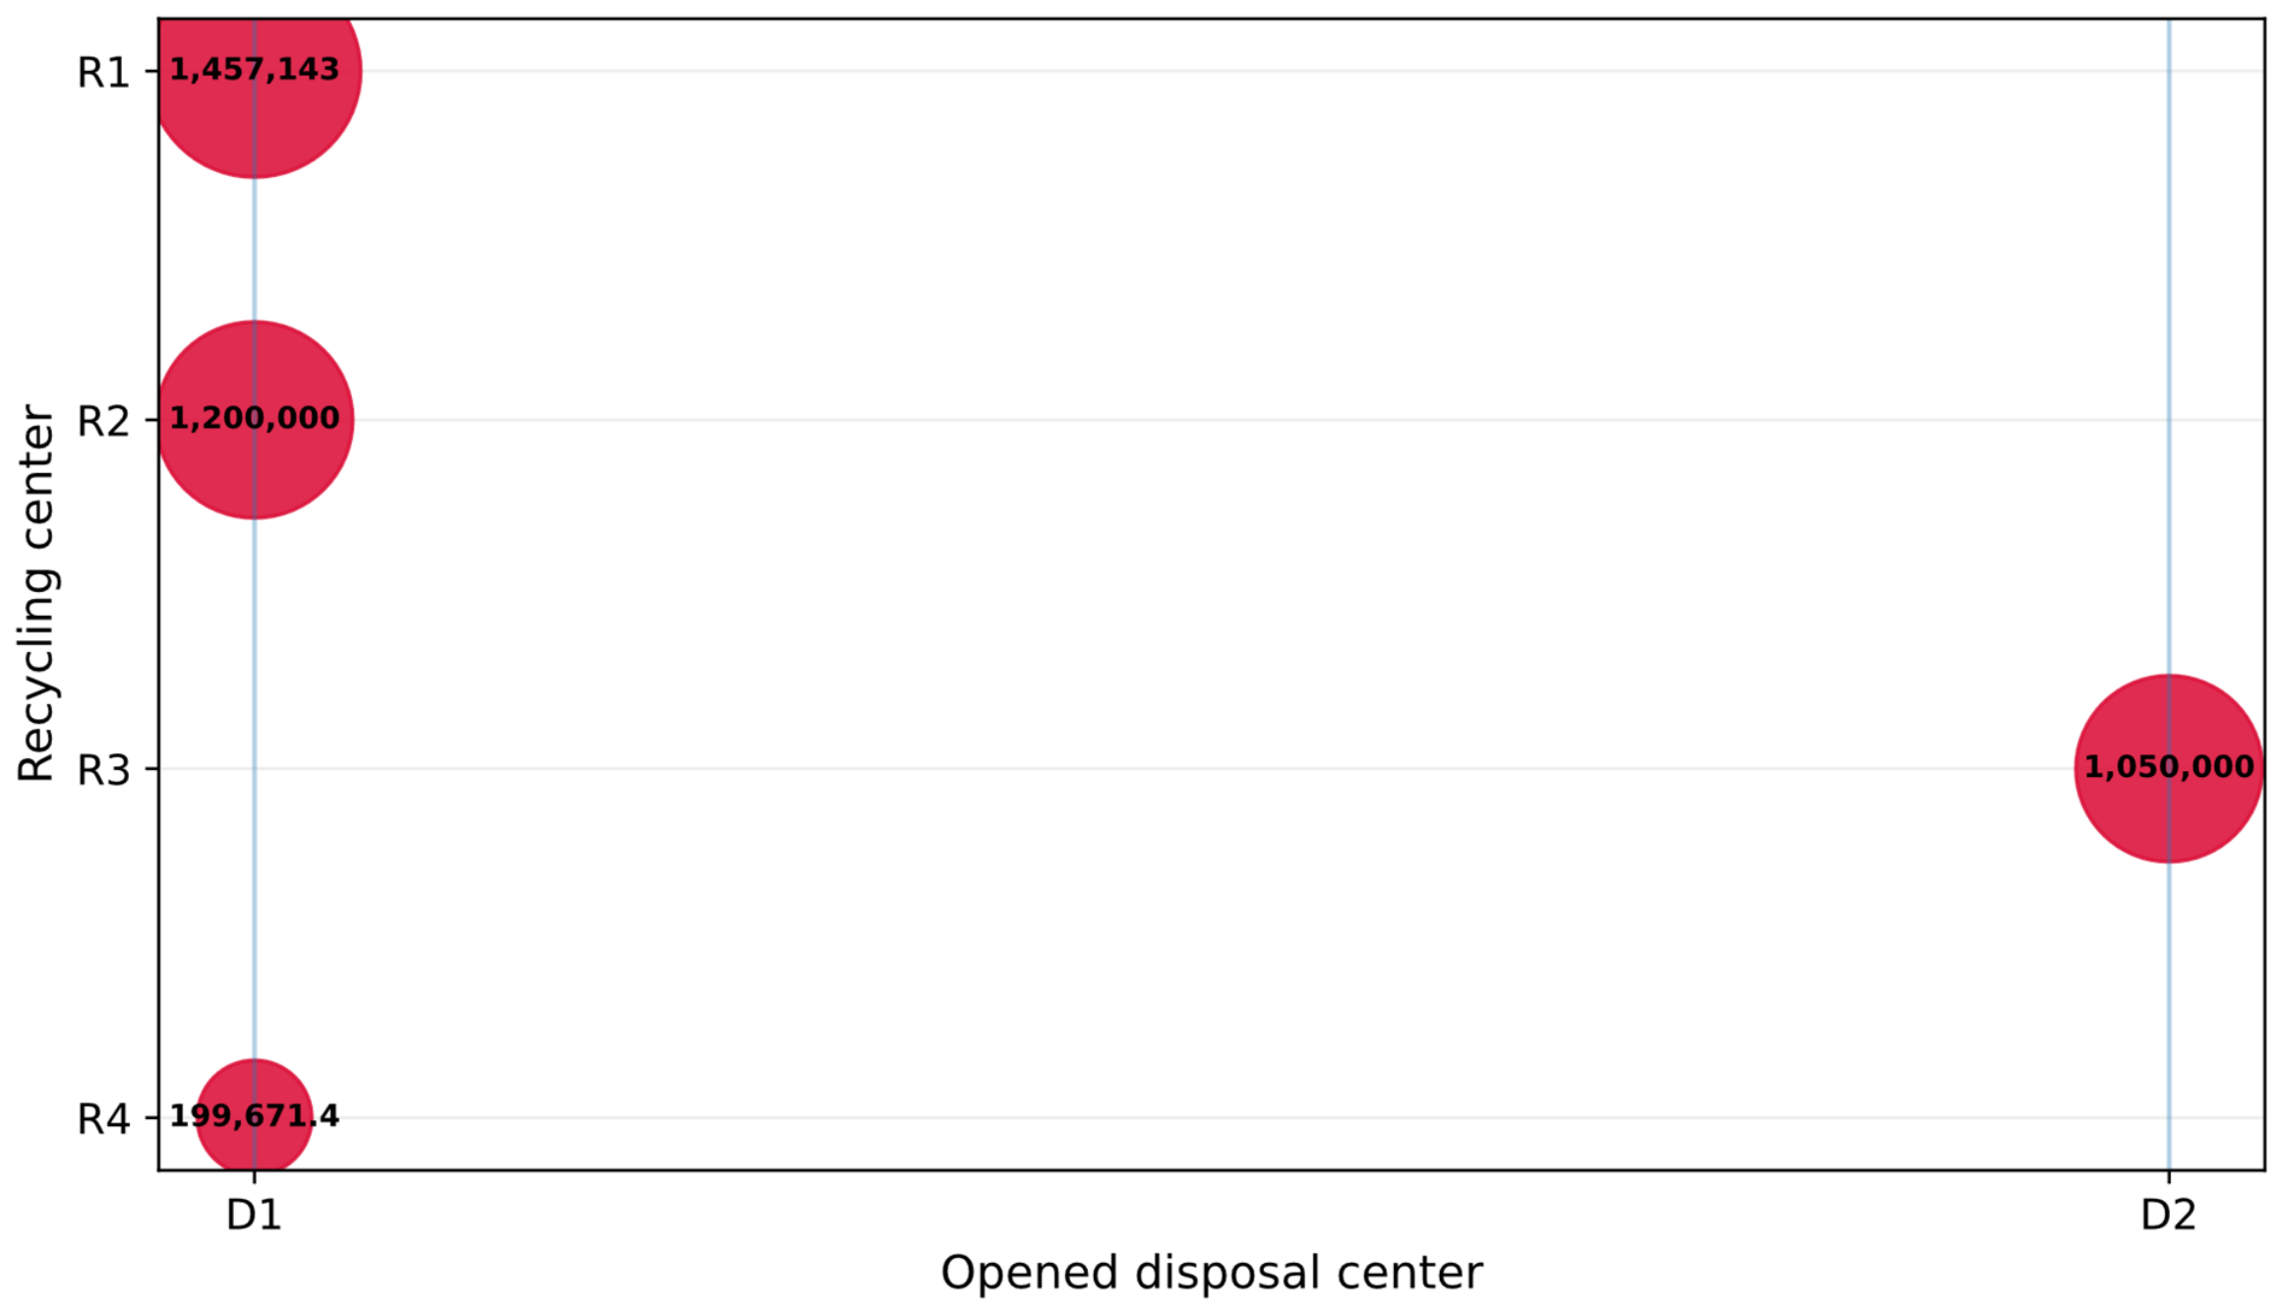
Flows from source nodes to open collection centers.
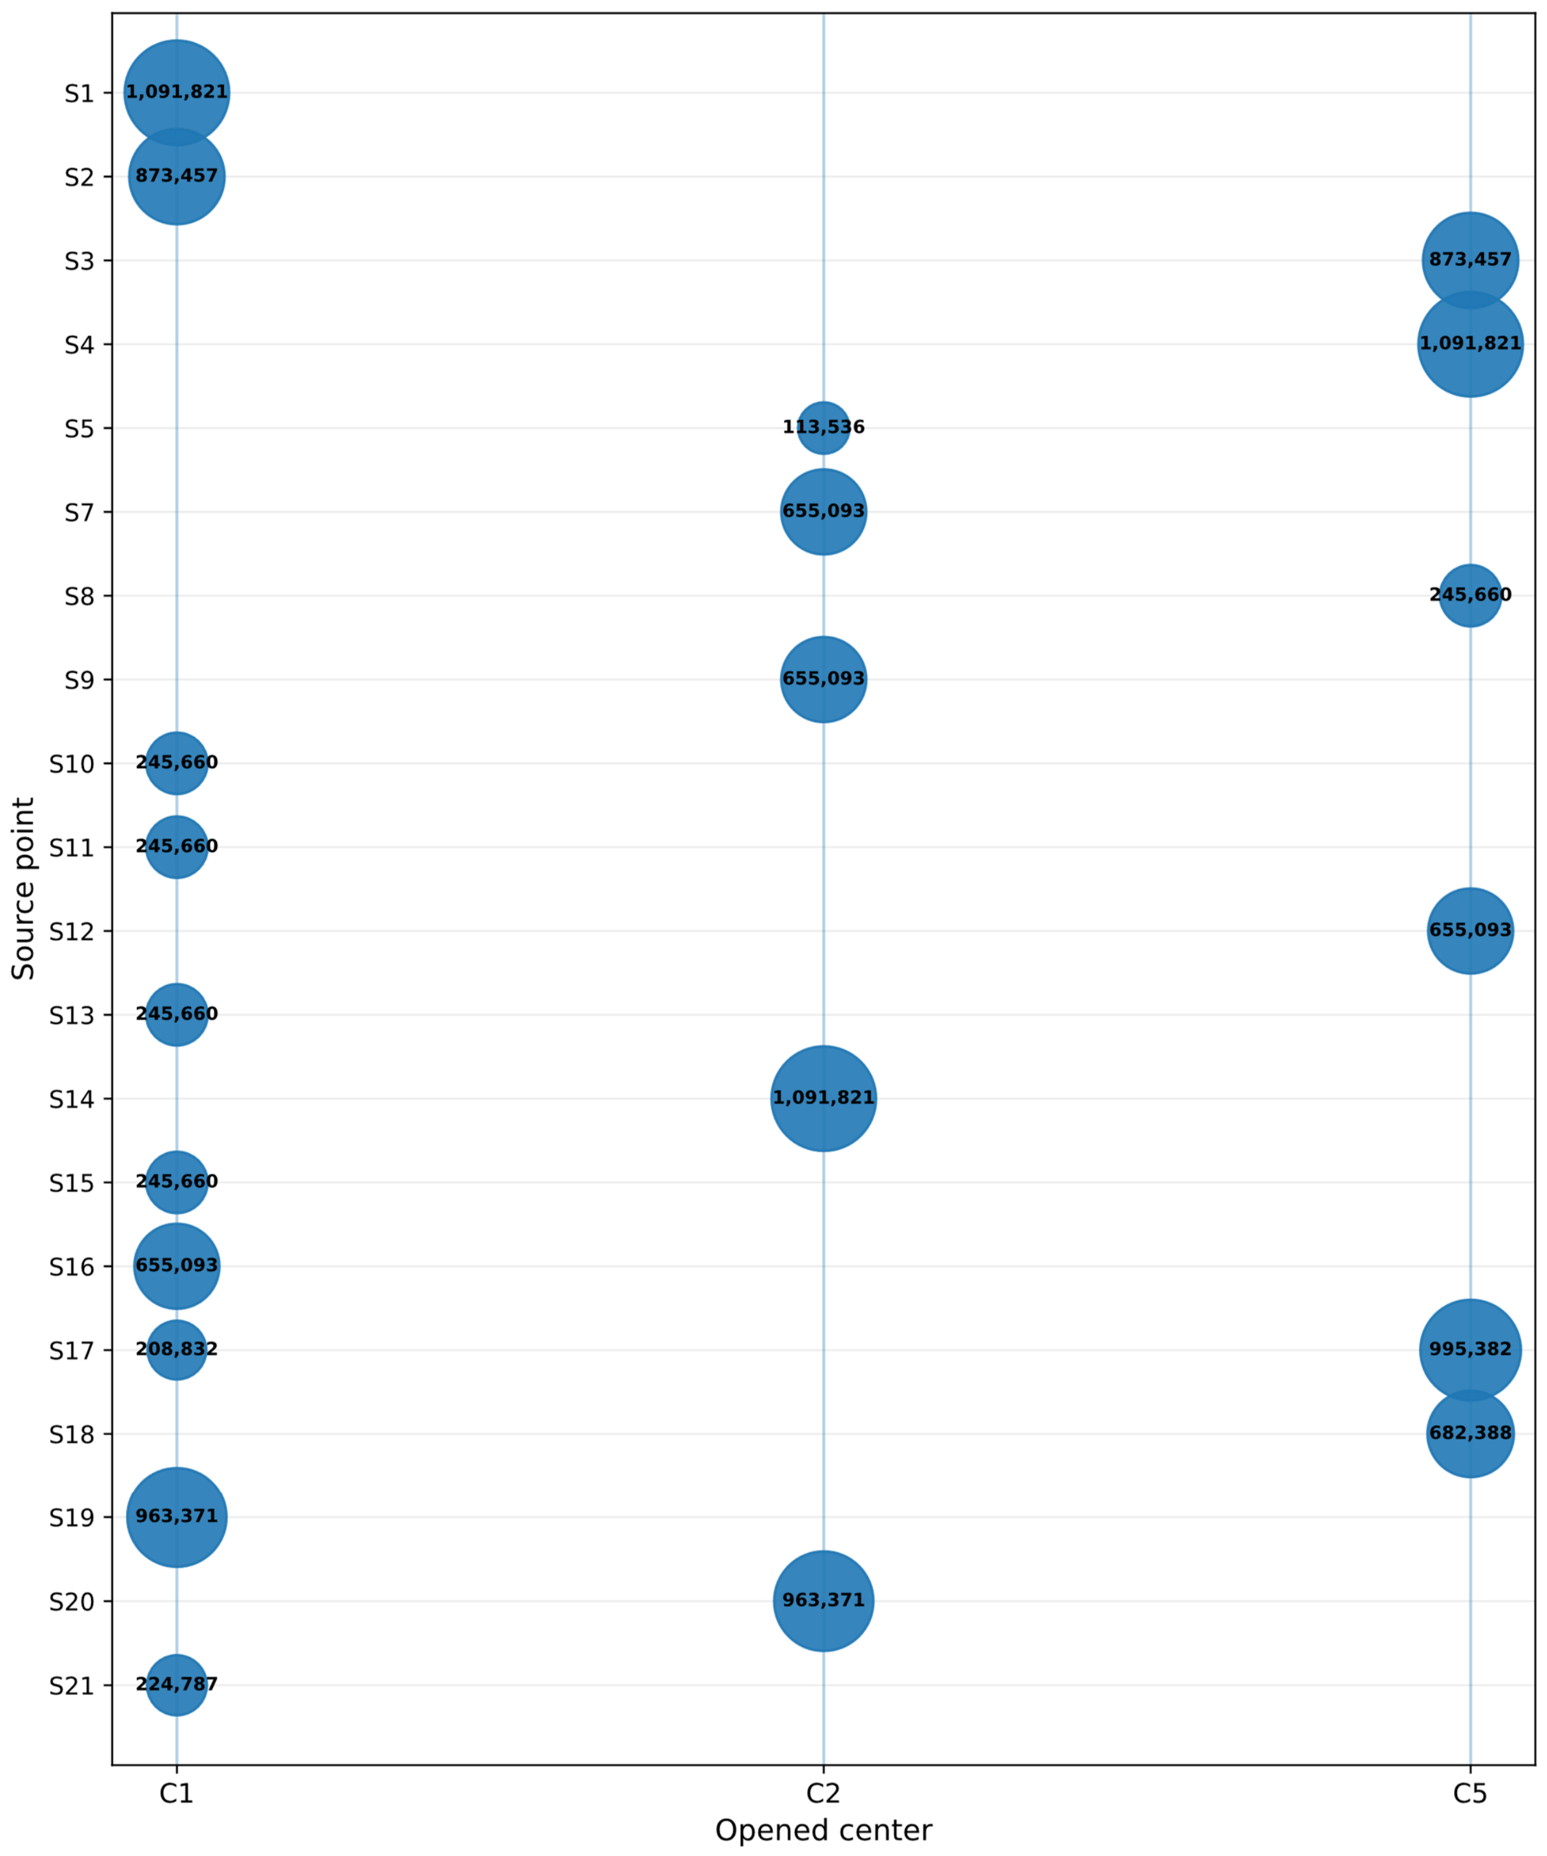
Figure A2.
Flows from source nodes to open disposal sites.
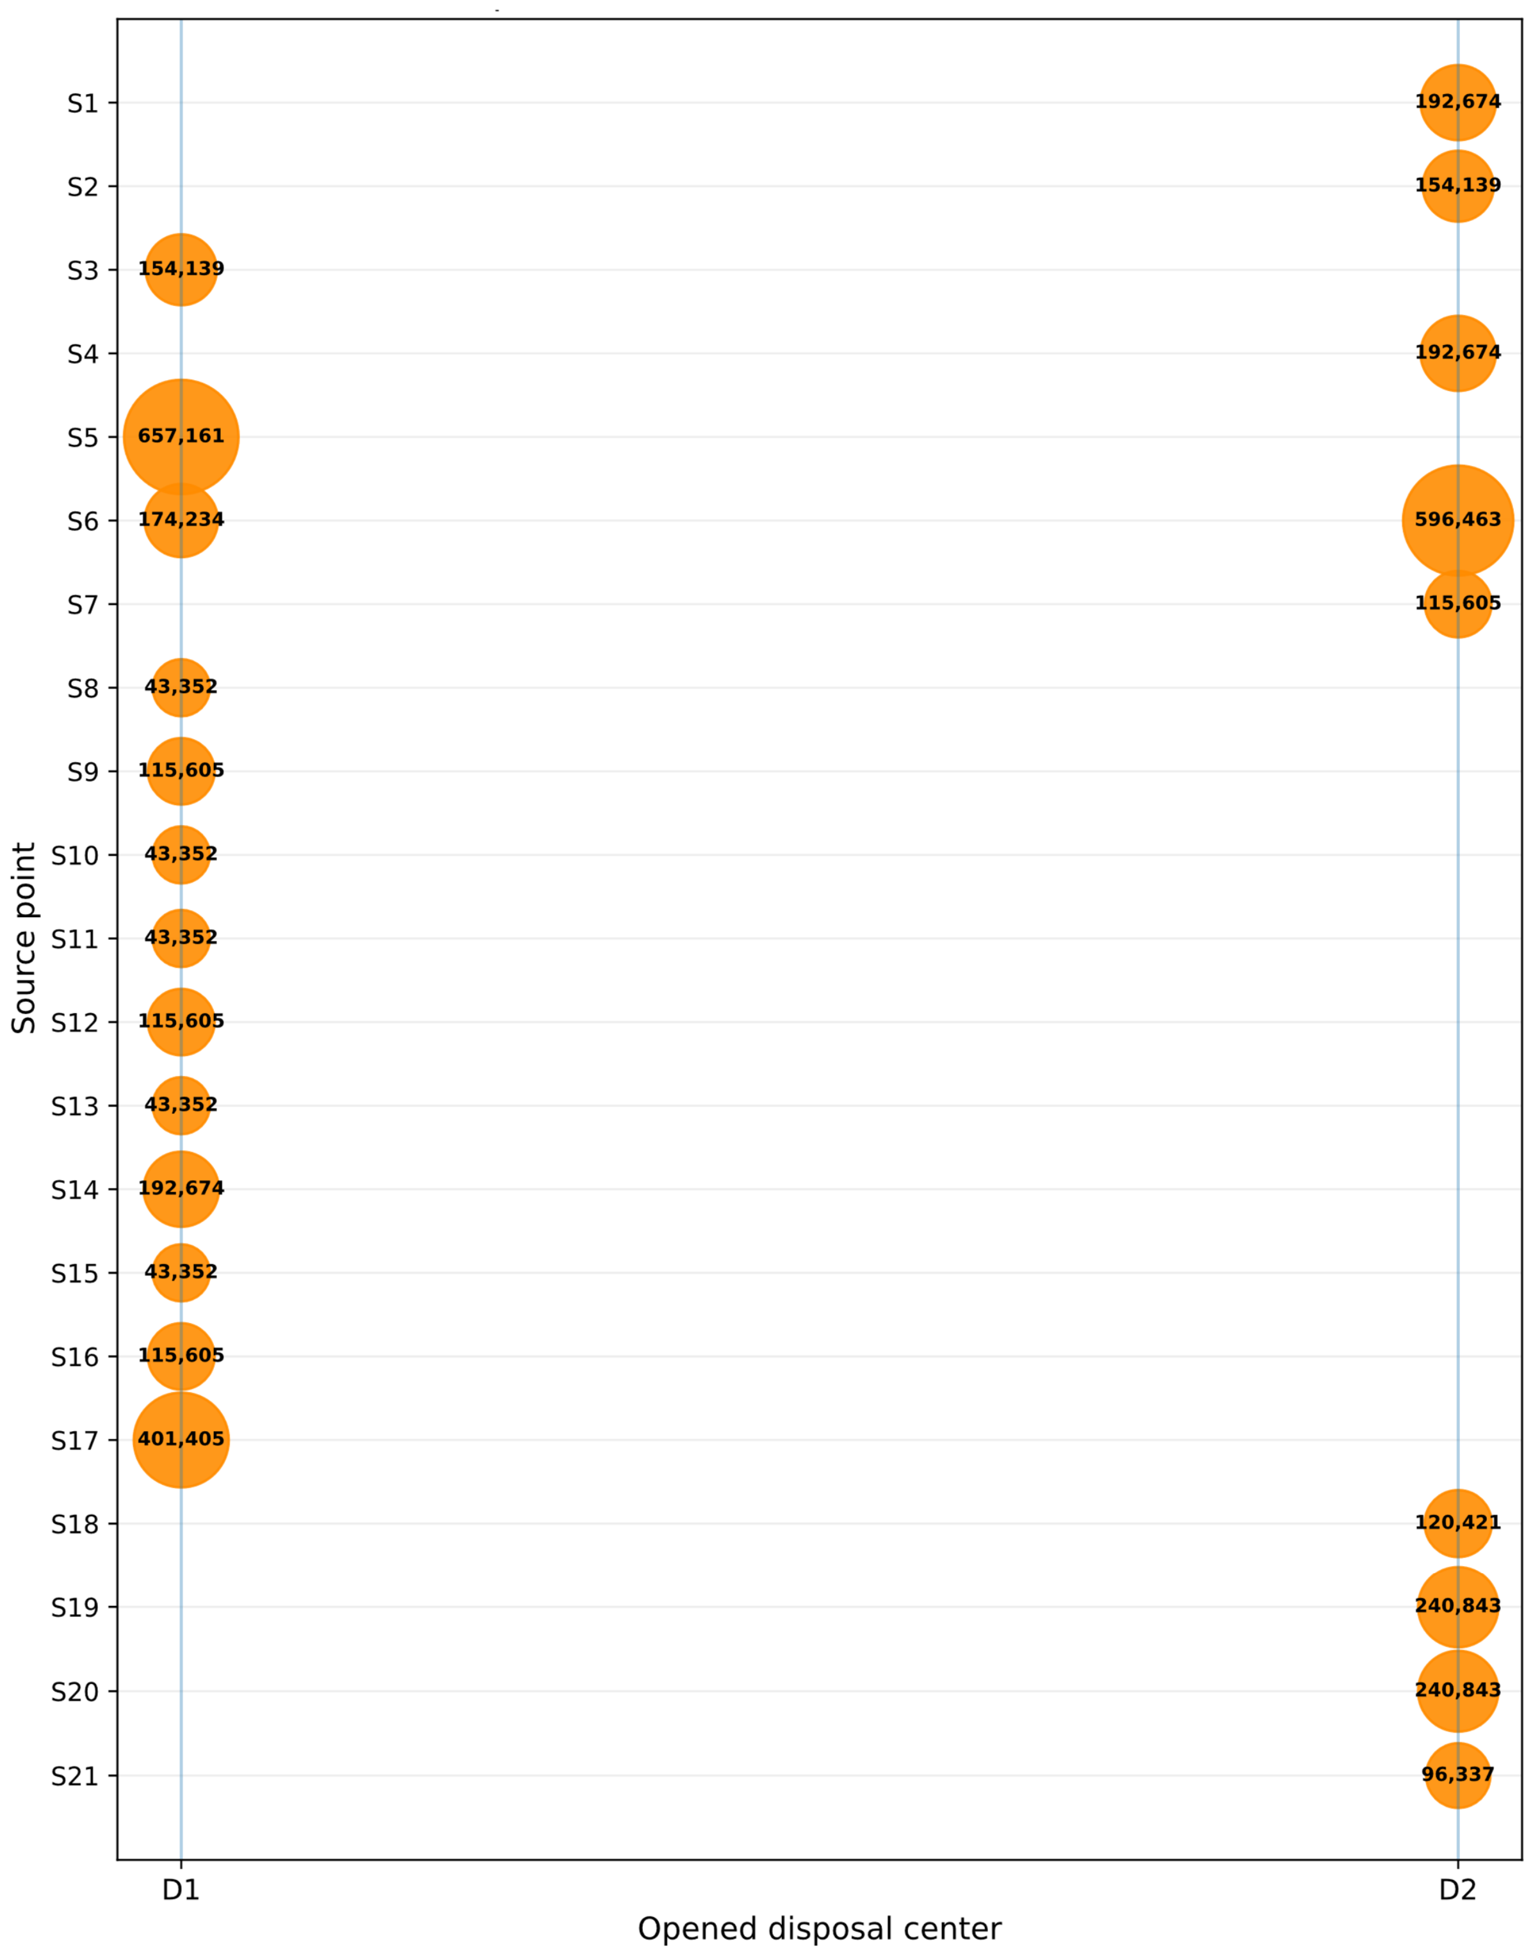
Figure A3.
Flows from open collection centers to open recycling facilities.
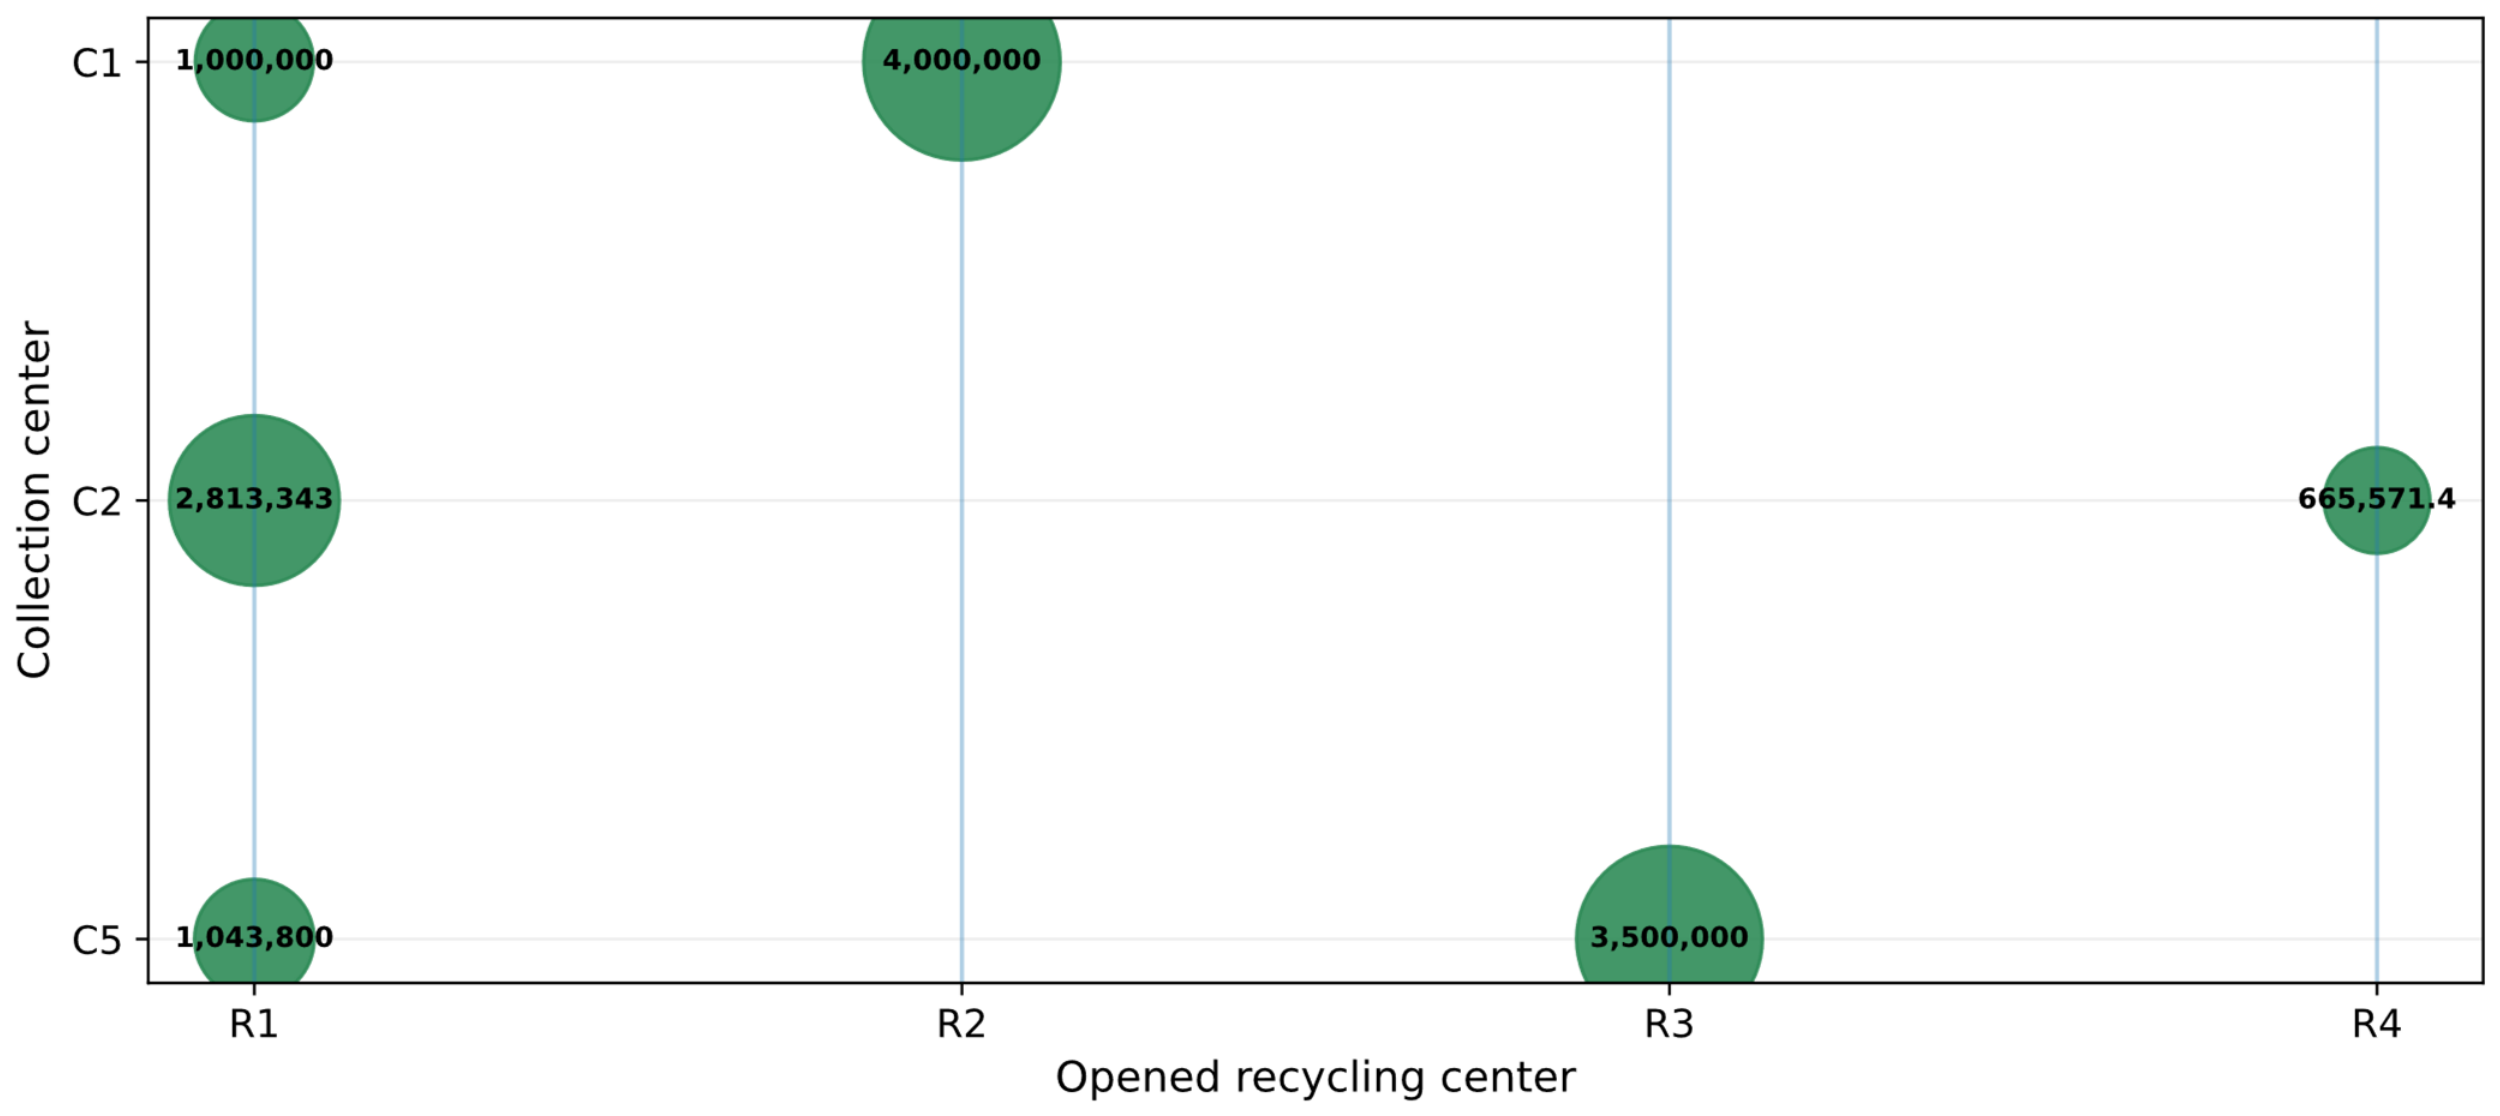
Figure A4.
Flows from recycling facilities to reconstruction-demand nodes.
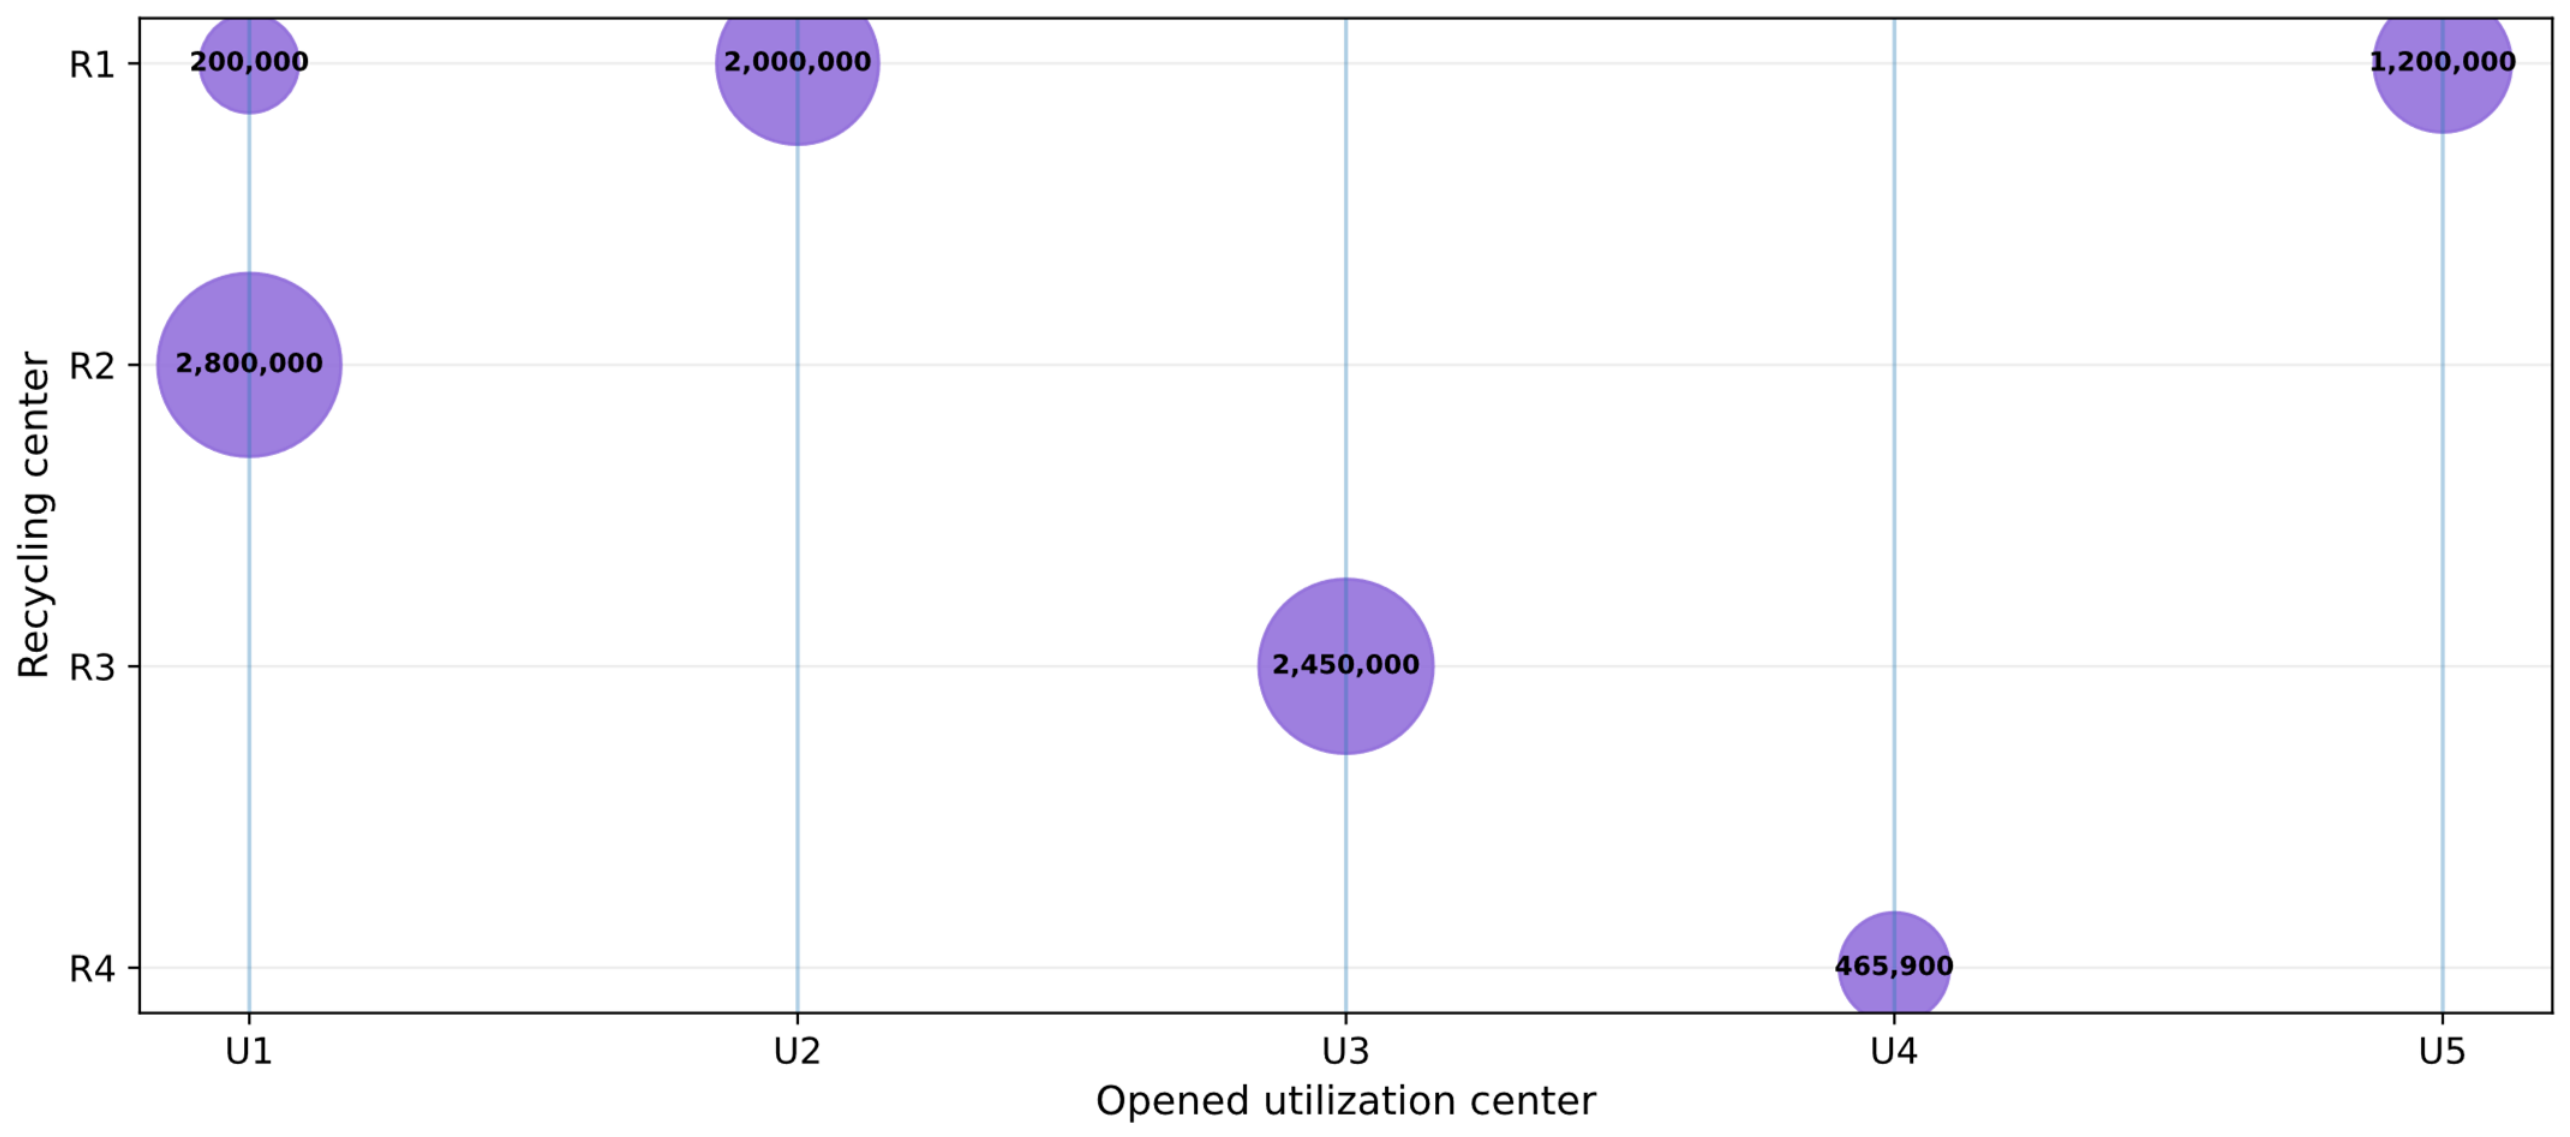
Figure A5.
Flows from recycling facilities to disposal sites.
Appendix E. MARCOS and Validation Results
| S_i | K− | K+ | f(K−) | f(K+) | f(Ki) | Rank | |
| AAI | 0.889894 | 1.000000 | 0.889894 | 0.470870 | 0.529130 | 0.627117 | - |
| AMM-FGP achieved | 0.898416 | 1.009577 | 0.898416 | 0.470870 | 0.529130 | 0.633123 | 3 |
| WGP achieved | 0.990364 | 1.112902 | 0.990364 | 0.470870 | 0.529130 | 0.697919 | 1 |
| Max-Min achieved | 0.928976 | 1.043918 | 0.928976 | 0.470870 | 0.529130 | 0.654658 | 2 |
| WA-FGP achieved | 0.893485 | 1.004035 | 0.893485 | 0.470870 | 0.529130 | 0.629647 | 4 |
| AI | 1.000000 | 1.123730 | 1.000000 | 0.470870 | 0.529130 | 0.704710 | - |
Appendix F. Experts’ Individual Rankings and Fuzzy Adjacent Comparisons
| Expert | Rank1 | Rank2 | Rank3 | Rank4 | Term12 | Term23 | Term34 |
| E1 | C1 | C2 | C3 | C4 | FI | WI | EI |
| E2 | C2 | C1 | C3 | C4 | FI | WI | WI |
| E3 | C1 | C2 | C3 | C4 | WI | VI | WI |
| E4 | C3 | C1 | C2 | C4 | FI | WI | WI |
| E5 | C1 | C2 | C3 | C4 | WI | WI | FI |
| E6 | C2 | C1 | C3 | C4 | EI | EI | EI |
| E7 | C4 | C2 | C1 | C3 | VI | FI | WI |
| E8 | C1 | C2 | C3 | C4 | VI | EI | VI |
| E9 | C3 | C2 | C1 | C4 | FI | FI | WI |
| E10 | C3 | C2 | C1 | C4 | FI | FI | WI |
| E11 | C3 | C4 | C1 | C2 | FI | FI | WI |
| E12 | C3 | C4 | C1 | C2 | FI | FI | WI |
| E13 | C3 | C2 | C1 | C4 | FI | FI | WI |
| C1: Operational implementation risk, C2: Dust/social acceptance, C3: Total cost, C4: Carbon emissions. | |||||||
References
- Brown, C.; Milke, M.; Seville, E. Disaster waste management: A review article. Waste Manag. 2011, 31, 1085–1098. [Google Scholar] [CrossRef] [Scilit] [PubMed]
- Joint UNEP/OCHA Environment Unit. Disaster Waste Management Guidelines; Joint UNEP/OCHA Environment Unit: Geneva, Switzerland, 2011. [Google Scholar]
- World Bank. Syria Joint Damage Assessment of Selected Cities; World Bank: Washington, DC, USA, 2022. [Google Scholar]
- World Bank. Syria Earthquake 2023: Rapid Damage and Needs Assessment (RDNA); World Bank: Washington, DC, USA, 2023. [Google Scholar]
- Kousa, C.; Pottgiesser, U. Post Syrian-war material recovery, reuse and transformation in the Old City of Aleppo. J. Cult. Herit. Manag. Sustain. Dev. 2020, 10, 90–103. [Google Scholar] [CrossRef] [Scilit]
- Rashwani, A.; Kadan, B.; Choubi, S.S.; Alhammoudi, Y.; Hanein, T.; Guadagnini, M.; Akgül, Ç.; Provis, J.L. Rebuilding Syria from the rubble: Recycled concrete aggregate from war-destroyed buildings. J. Mater. Civ. Eng. 2023, 35, 04023010. [Google Scholar] [CrossRef] [Scilit]
- Kabirifar, K.; Mojtahedi, M.; Wang, C.; Tam, V.W.Y. Construction and demolition waste management contributing factors coupled with reduce, reuse, and recycle strategies for effective waste management: A review. J. Clean. Prod. 2020, 263, 121265. [Google Scholar] [CrossRef] [Scilit]
- Hu, Z.-H.; Sheu, J.-B. Post-disaster debris reverse logistics management under psychological cost minimization. Transp. Res. Part B Methodol. 2013, 55, 118–141. [Google Scholar] [CrossRef] [Scilit]
- Habib, M.S.; Sarkar, B. An integrated location-allocation model for temporary disaster debris management under an uncertain environment. Sustainability 2017, 9, 716. [Google Scholar] [CrossRef] [Scilit]
- Rahimi, M.; Ghezavati, V. Sustainable multi-period reverse logistics network design and planning under uncertainty utilizing conditional value at risk CVaR for recycling construction and demolition waste. J. Clean. Prod. 2018, 172, 1567–1581. [Google Scholar] [CrossRef] [Scilit]
- Pan, X.; Xie, Q.; Feng, Y. Designing recycling networks for construction and demolition waste based on reserve logistics research field. J. Clean. Prod. 2020, 260, 120841. [Google Scholar] [CrossRef] [Scilit]
- Jahangiri, A.; Asadi-Gangraj, E.; Nemati, A. Designing a reverse logistics network to manage construction and demolition wastes: A robust bi-level approach. J. Clean. Prod. 2022, 380, 134809. [Google Scholar] [CrossRef] [Scilit]
- Madi, N.; Srour, I.M. Managing emergency construction and demolition waste in Syria using GIS. Resour. Conserv. Recycl. 2019, 141, 163–175. [Google Scholar] [CrossRef] [Scilit]
- Chen, Q.; Liao, W. Collaborative routing optimization model for reverse logistics of construction and demolition waste from sustainable perspective. Int. J. Environ. Res. Public Health 2022, 19, 7366. [Google Scholar] [CrossRef] [Scilit] [PubMed]
- Tamiz, M.; Jones, D.; Romero, C. Goal programming for decision making: An overview of the current state-of-the-art. Eur. J. Oper. Res. 1998, 111, 569–581. [Google Scholar] [CrossRef] [Scilit]
- Mensah, E.K.; Rocca, M. Light Robust Goal Programming. Math. Comput. Appl. 2019, 24, 85. [Google Scholar] [CrossRef] [Scilit]
- Shang, Z. Use of Delphi in health sciences research: A narrative review. Medicine 2023, 102, e32829. [Google Scholar] [CrossRef] [Scilit] [PubMed]
- Ahuja, M.; Aseltine, R.; Warren, N.; Reisine, S.; Williams, P.H.; Cislo, A. Challenges faced with the implementation of web-based data query systems for population health: Development of a questionnaire based on expert consensus. Pilot Feasibility Stud. 2018, 4, 113. [Google Scholar] [CrossRef] [Scilit] [PubMed]
- Pamučar, D.; Stević, Ž.; Sremac, S. A new model for determining weight coefficients of criteria in MCDM models: Full consistency method (FUCOM). Symmetry 2018, 10, 393. [Google Scholar] [CrossRef] [Scilit]
- Pamučar, D.; Ecer, F. Prioritizing the weights of the evaluation criteria under fuzziness: The fuzzy full consistency method—FUCOM-F. Facta Univ. Ser. Mech. Eng. 2020, 18, 419–437. [Google Scholar] [CrossRef] [Scilit]
- Lai, Y.-J.; Hwang, C.-L. Fuzzy Mathematical Programming: Methods and Applications; Lecture Notes in Economics and Mathematical Systems; Springer: Berlin/Heidelberg, Germany, 1992; Volume 394. [Google Scholar] [CrossRef] [Scilit]
- Arıkan, F. A modified augmented max–min model for weighted fuzzy goal programming. J. Intell. Fuzzy Syst. 2014, 27, 339–350. [Google Scholar] [CrossRef] [Scilit]
- Yaghoobi, M.A.; Jones, D.F.; Tamiz, M. Weighted additive models for solving fuzzy goal programming problems. Asia-Pac. J. Oper. Res. 2008, 25, 715–733. [Google Scholar] [CrossRef] [Scilit]
- Stević, Ž.; Pamučar, D.; Puška, A.; Chatterjee, P. Sustainable supplier selection in healthcare industries using a new MCDM method: Measurement of alternatives and ranking according to compromise solution (MARCOS). Comput. Ind. Eng. 2020, 140, 106231. [Google Scholar] [CrossRef] [Scilit]
- Xu, J.; Wei, P. A bi-level model for location-allocation problem of construction and demolition waste management under fuzzy random environment. Int. J. Civ. Eng. 2012, 10, 1–12. [Google Scholar]
- Galan, B.; Dosal, E.; Andrés, A.; Viguri, J.R. Optimisation of the construction and demolition waste management facilities location in Cantabria Spain under economical and environmental criteria. Waste Biomass Valorization 2013, 4, 797–808. [Google Scholar] [CrossRef] [Scilit]
- Pouriani, S.; Asadi-Gangraj, E.; Paydar, M.M. A robust bi-level optimization modelling approach for municipal solid waste management: A real case study of Iran. J. Clean. Prod. 2019, 240, 118125. [Google Scholar] [CrossRef] [Scilit]
- Shi, Q.; Ren, H.; Ma, X.; Xiao, Y. Site selection of construction waste recycling plant. J. Clean. Prod. 2019, 227, 532–542. [Google Scholar] [CrossRef] [Scilit]
- Xu, J.; Shi, Y.; Xie, Y.; Zhao, S. A BIM-based construction and demolition waste information management system for greenhouse gas quantification and reduction. J. Clean. Prod. 2019, 229, 308–324. [Google Scholar] [CrossRef] [Scilit]
- Lin, Z.; Xie, Q.; Feng, Y.; Zhang, P.; Yao, P. Towards a robust facility location model for construction and demolition waste transfer stations under uncertain environment: The case of Chongqing. Waste Manag. 2020, 105, 73–83. [Google Scholar] [CrossRef] [Scilit] [PubMed]
- Hu, W.; Dong, J.; Xu, N. Multi-period planning of integrated underground logistics system network for automated construction-demolition-municipal waste collection and parcel delivery: A case study. J. Clean. Prod. 2022, 330, 129760. [Google Scholar] [CrossRef] [Scilit]
- Tirkolaee, E.B.; Goli, A.; Gütmen, S.; Weber, G.-W.; Szwedzka, K. A novel model for sustainable waste collection arc routing problem: Pareto-based algorithms. Ann. Oper. Res. 2023, 324, 189–214. [Google Scholar] [CrossRef] [Scilit] [PubMed]
- Zhang, X.; Ahmed, R.R. A queuing system for inert construction waste management on a reverse logistics network. Autom. Constr. 2022, 137, 104221. [Google Scholar] [CrossRef] [Scilit]
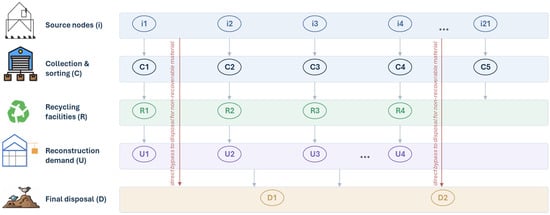
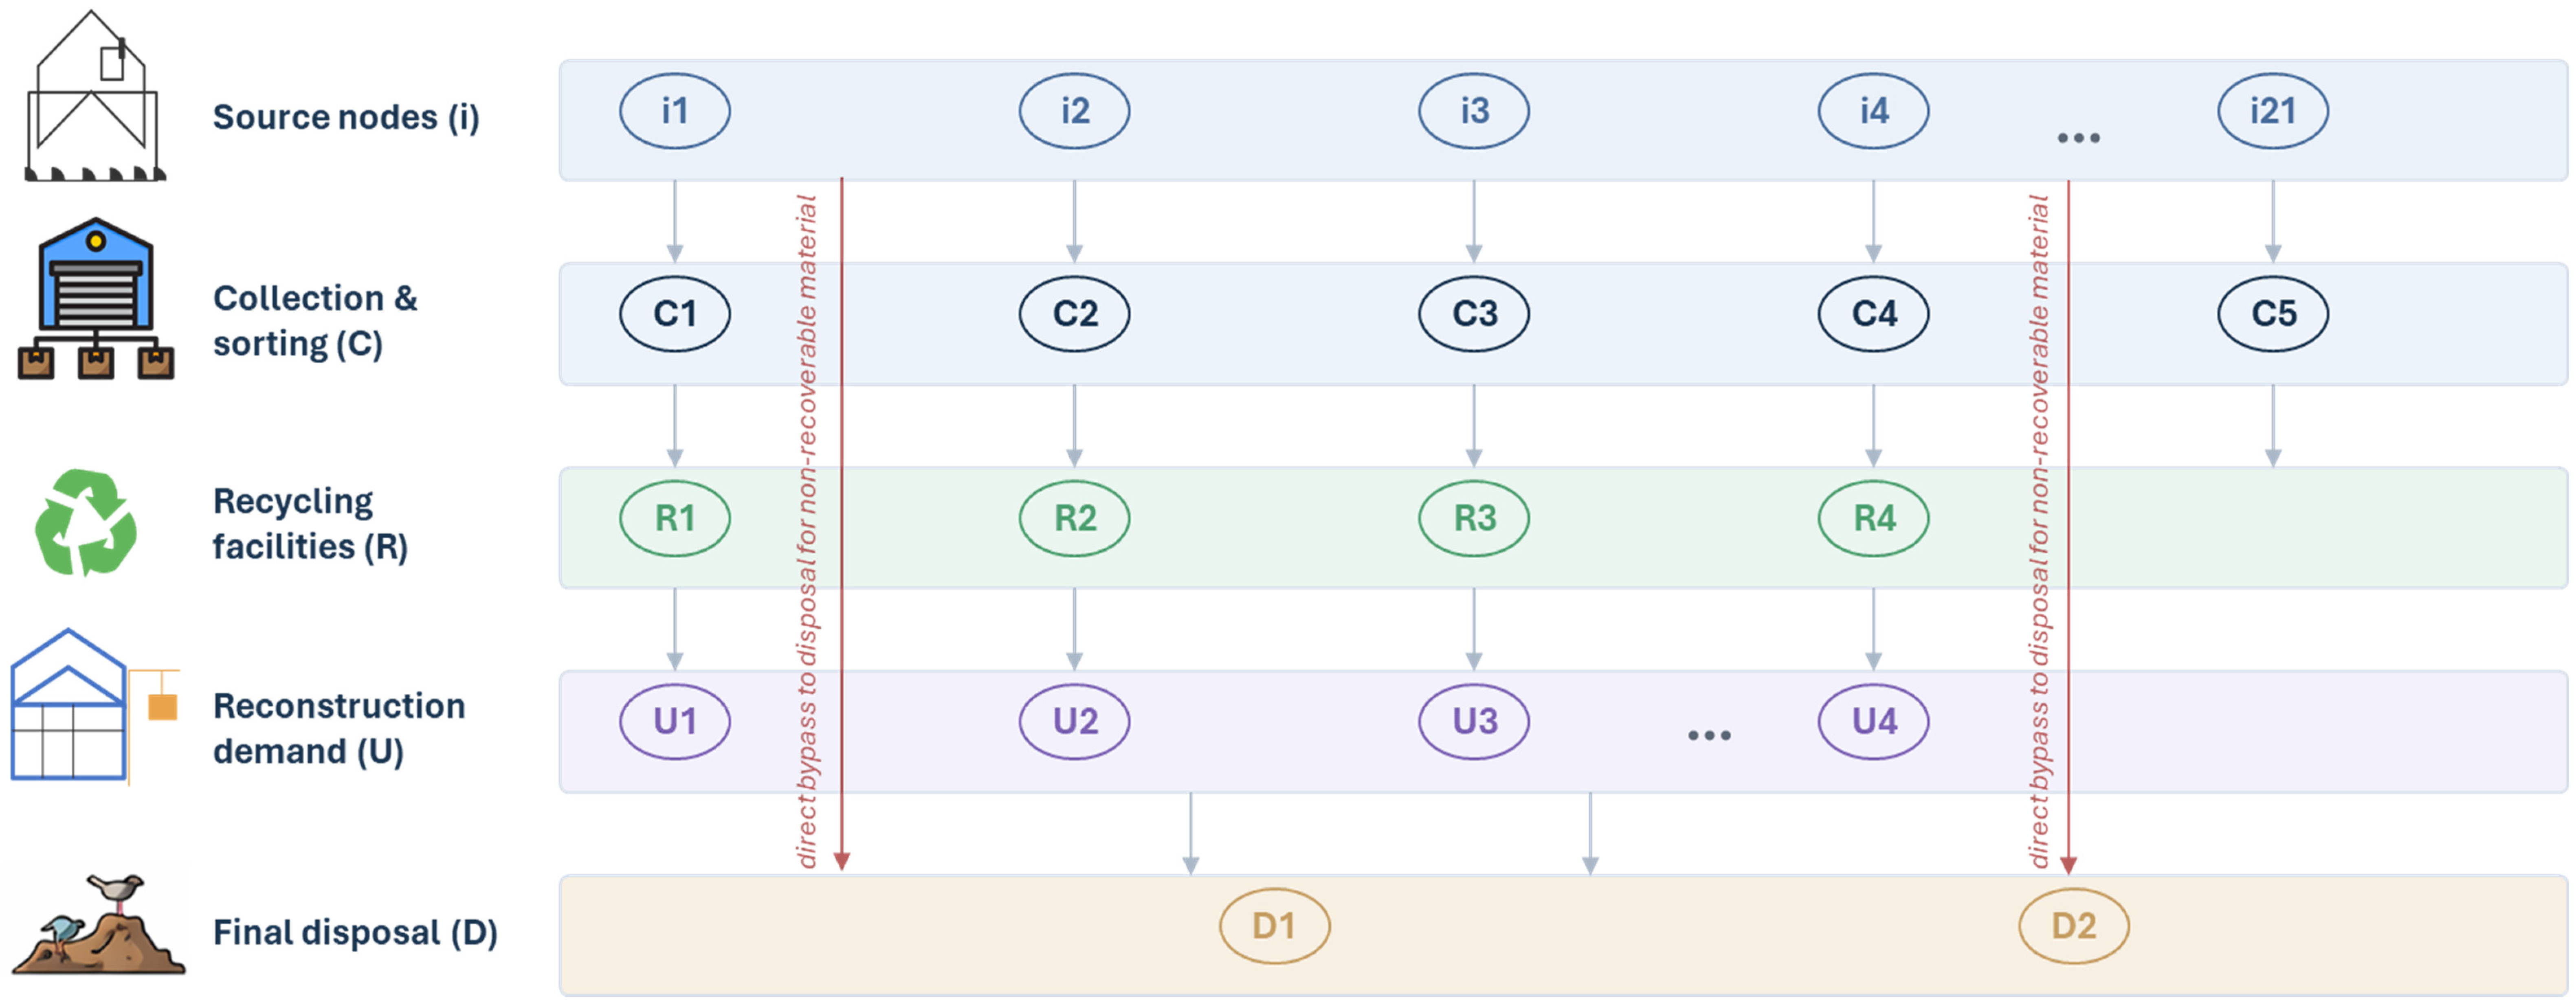
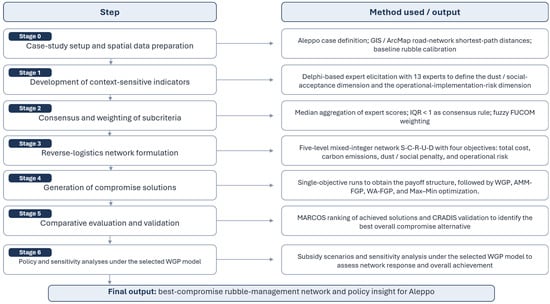
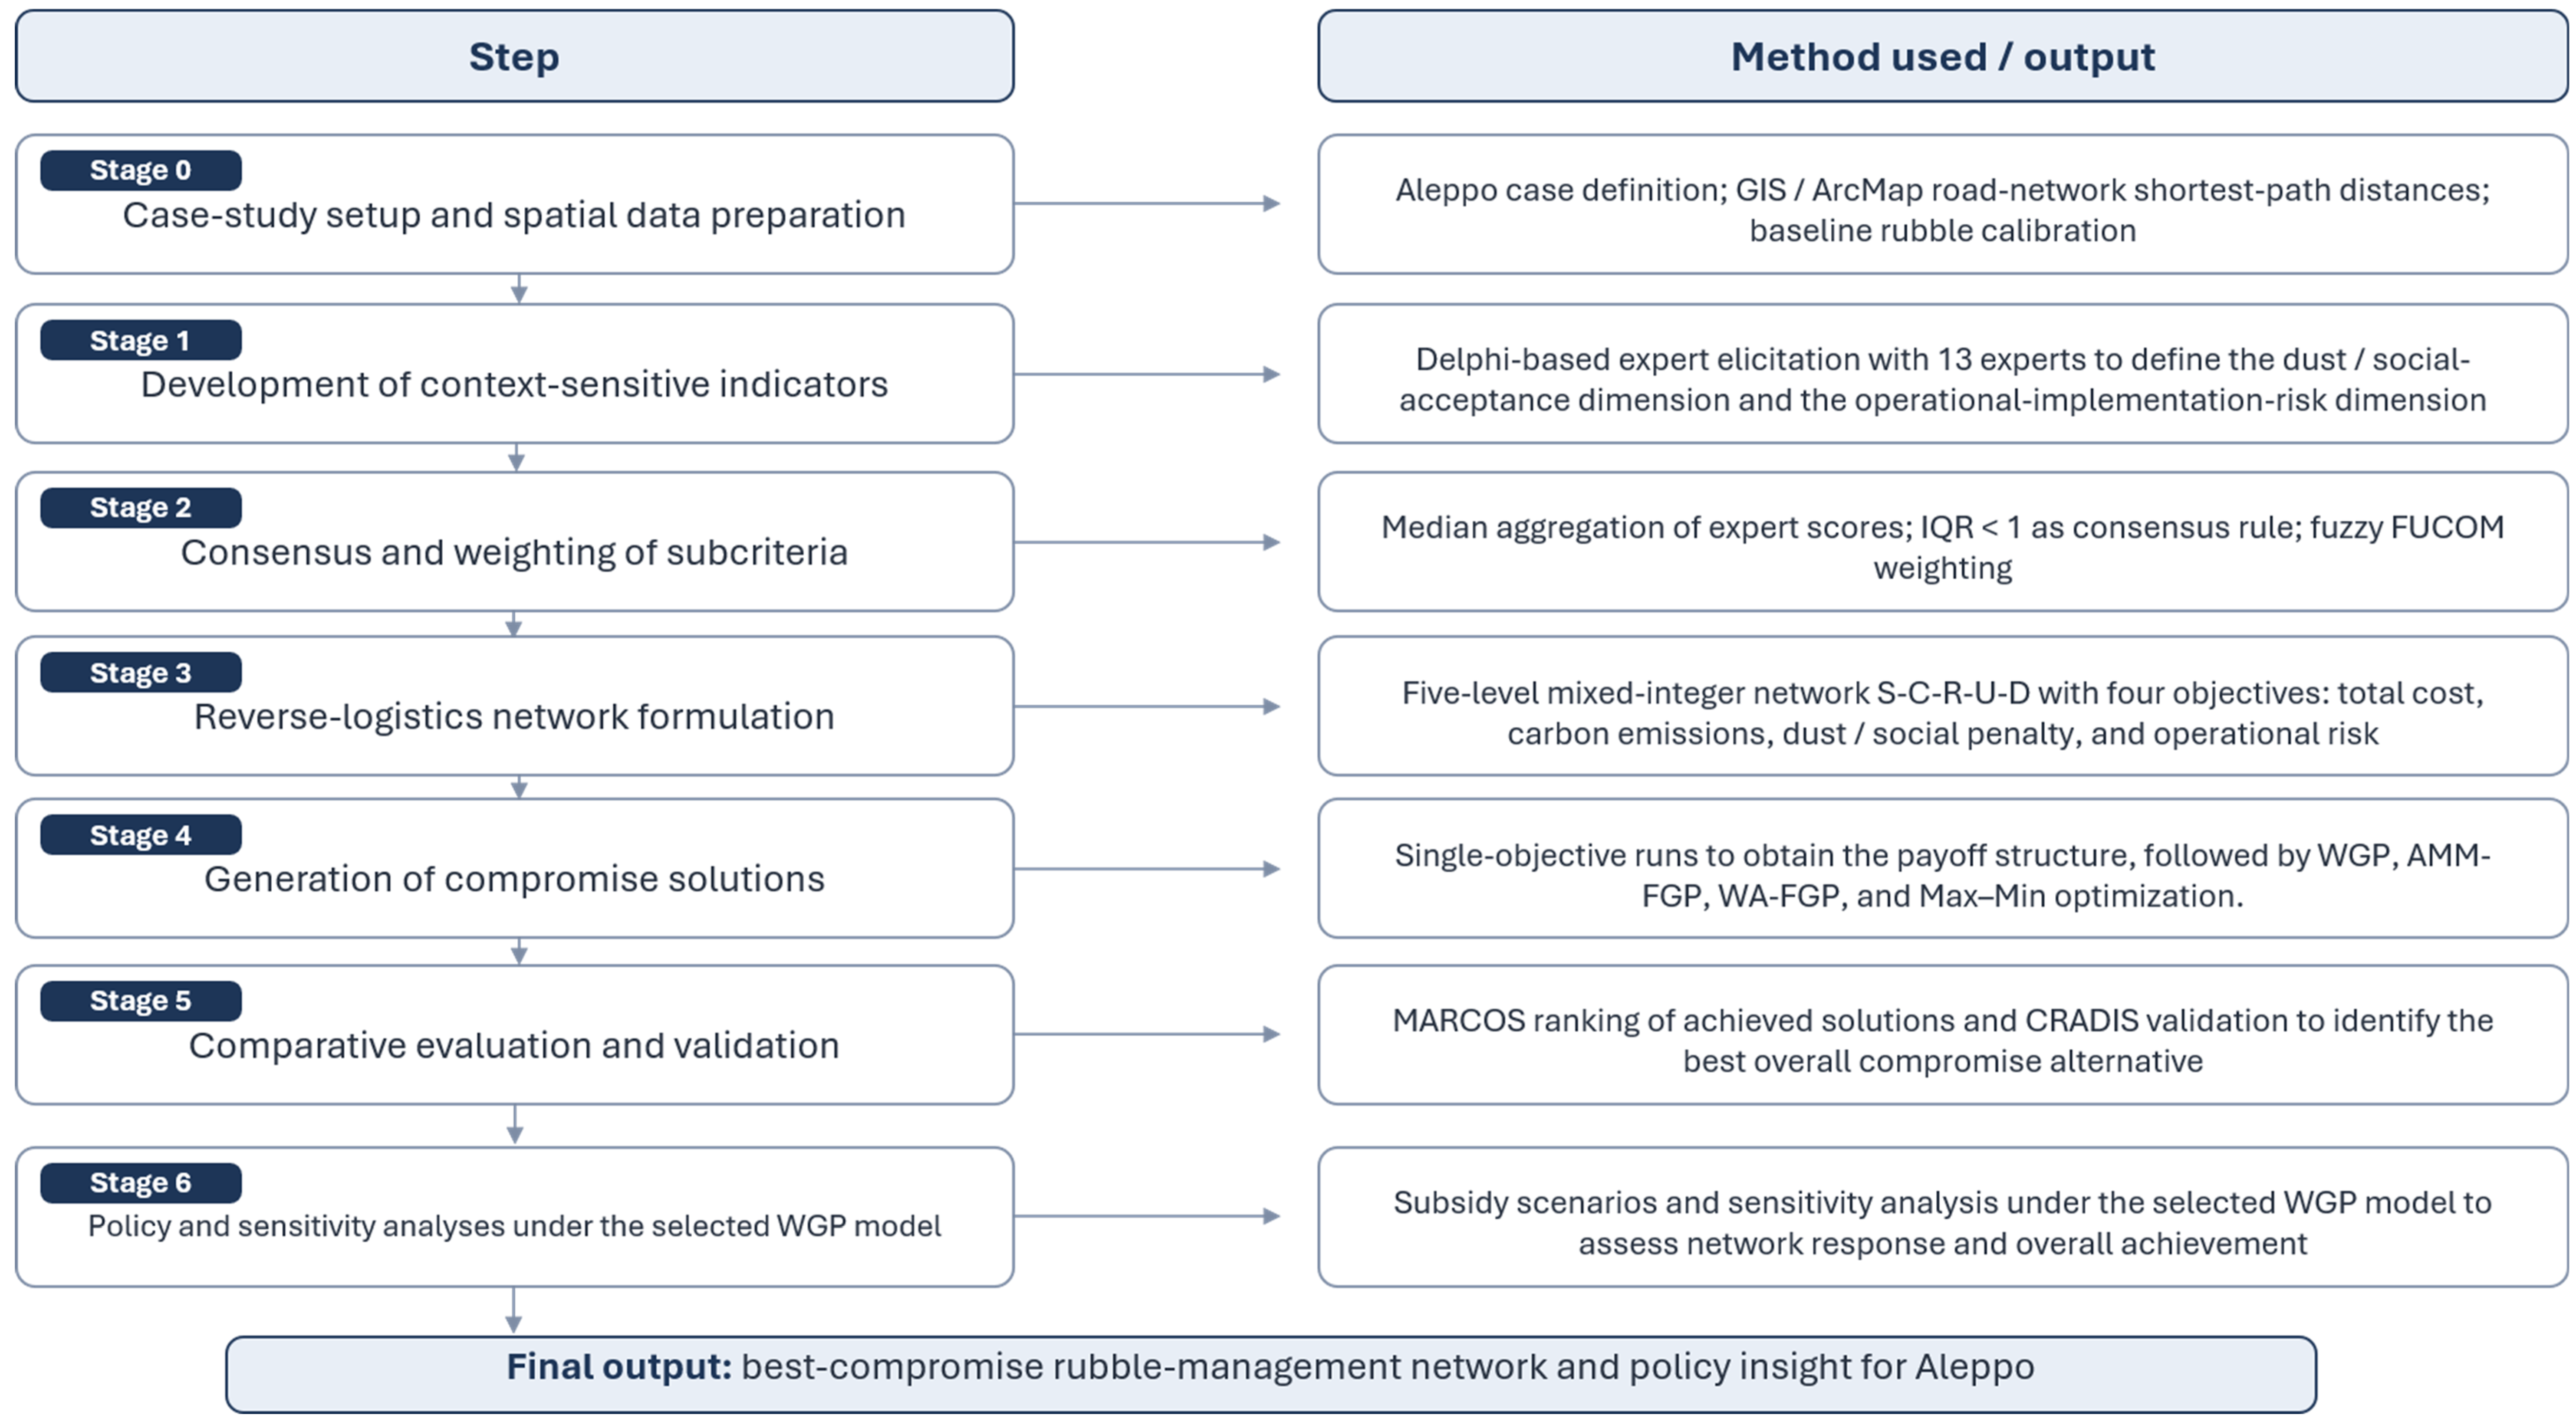
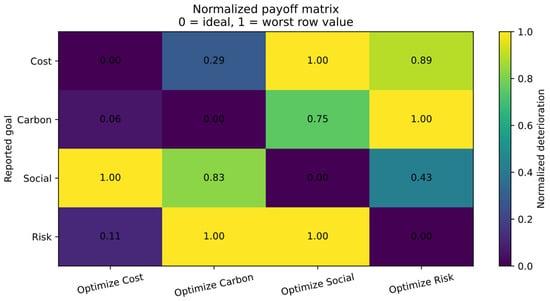
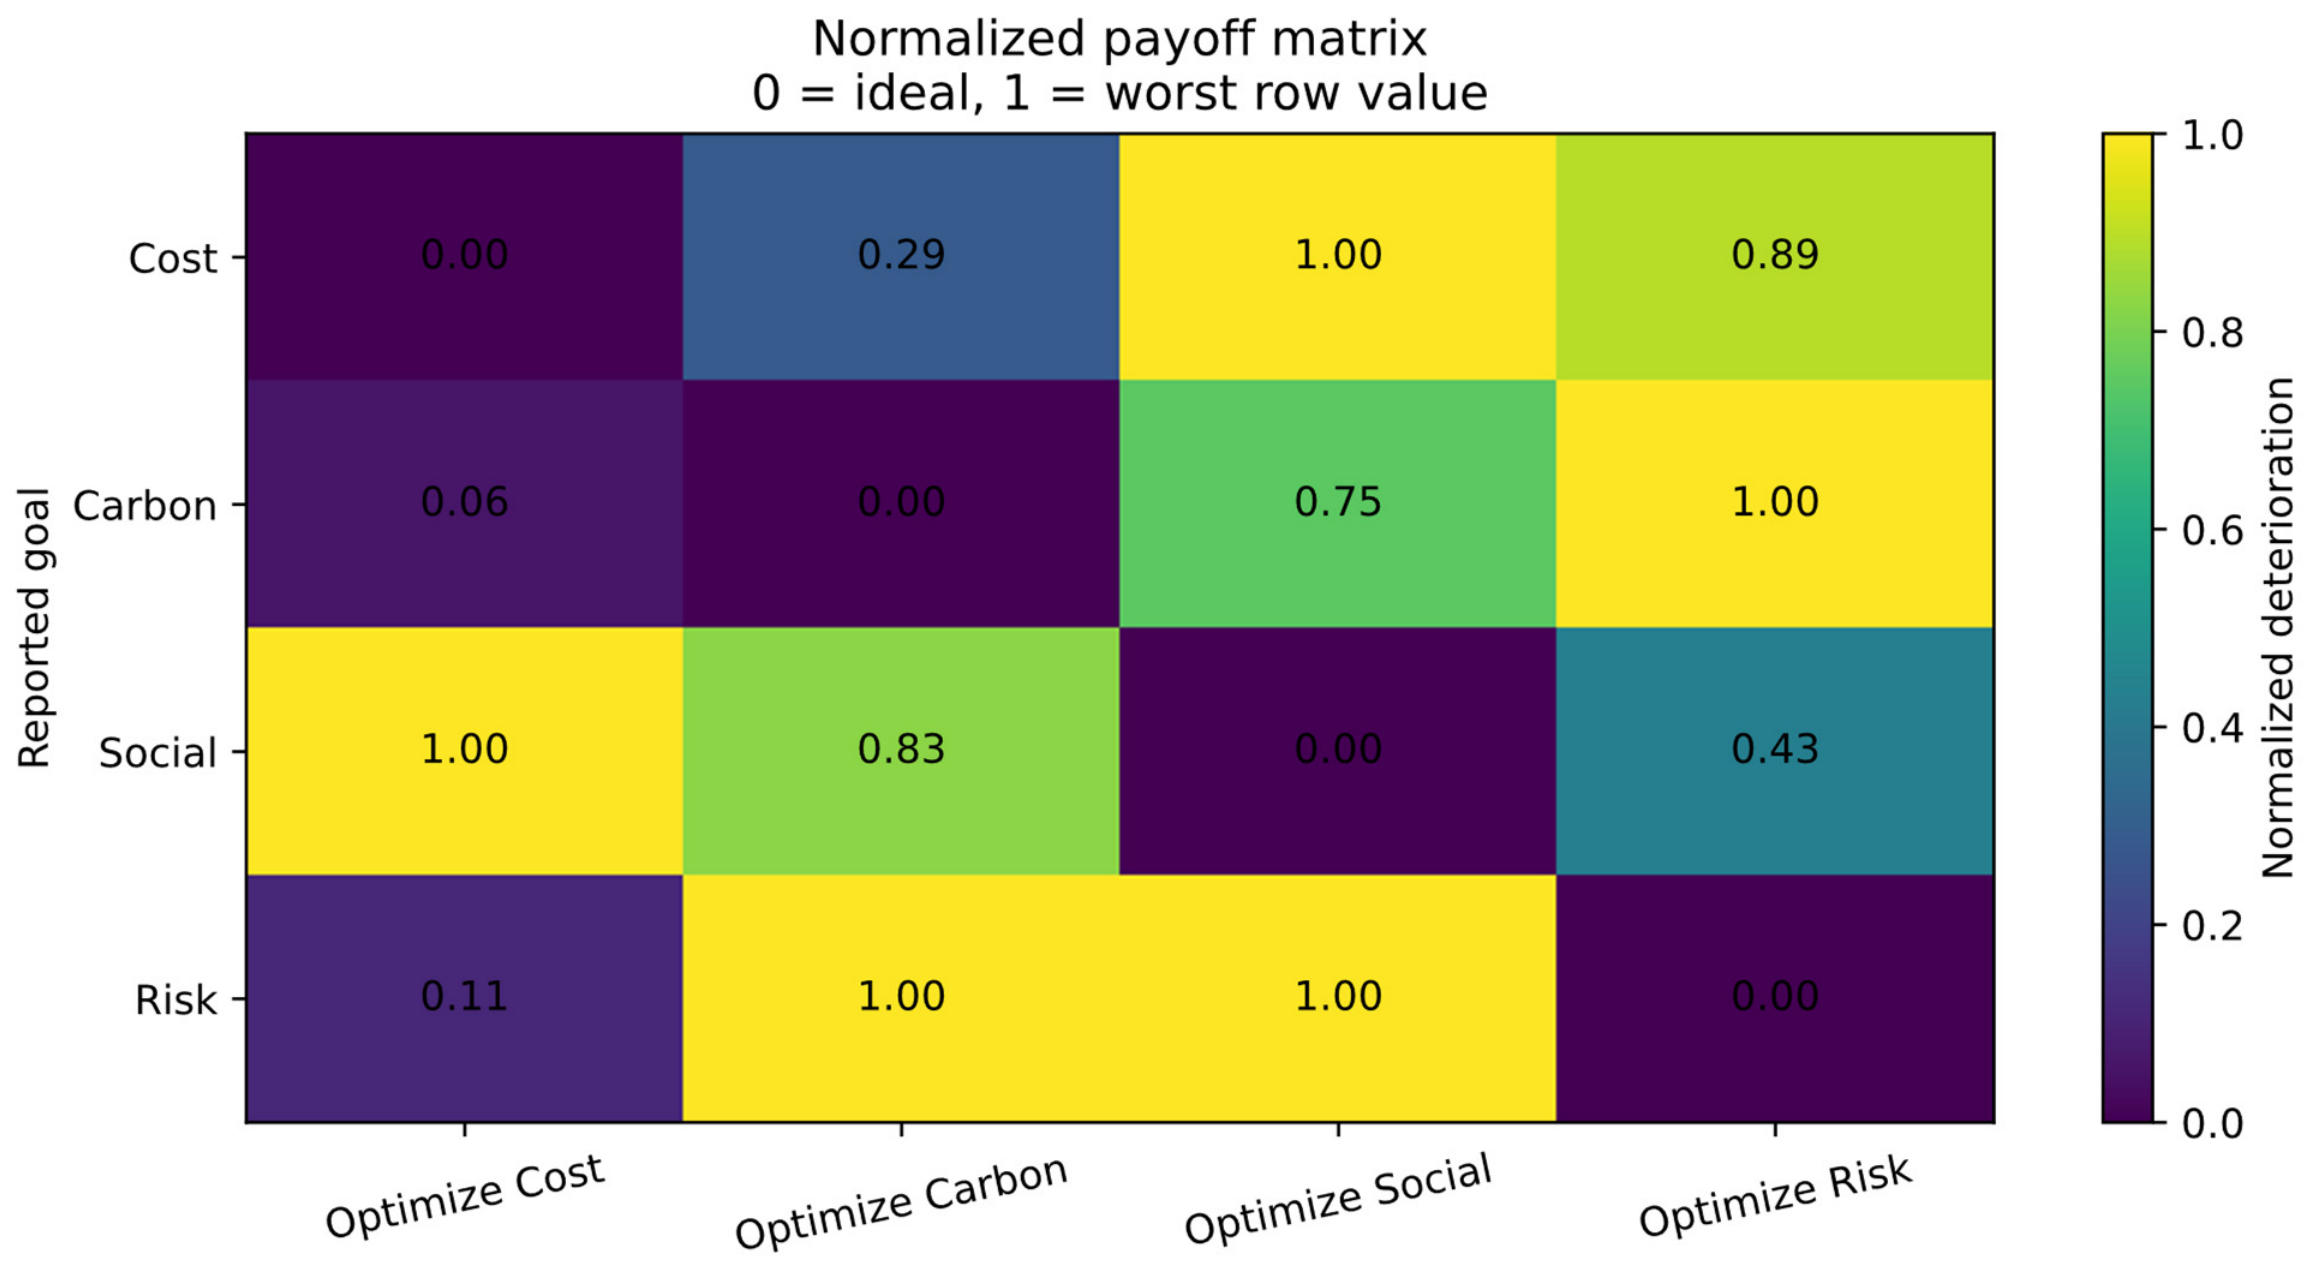
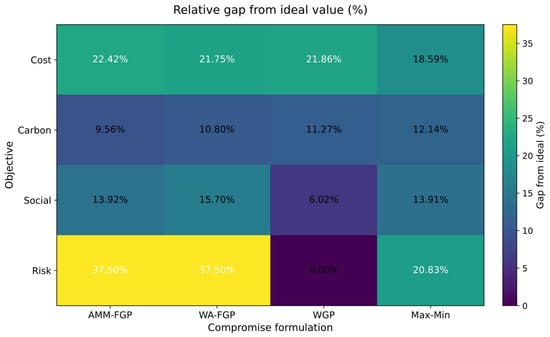
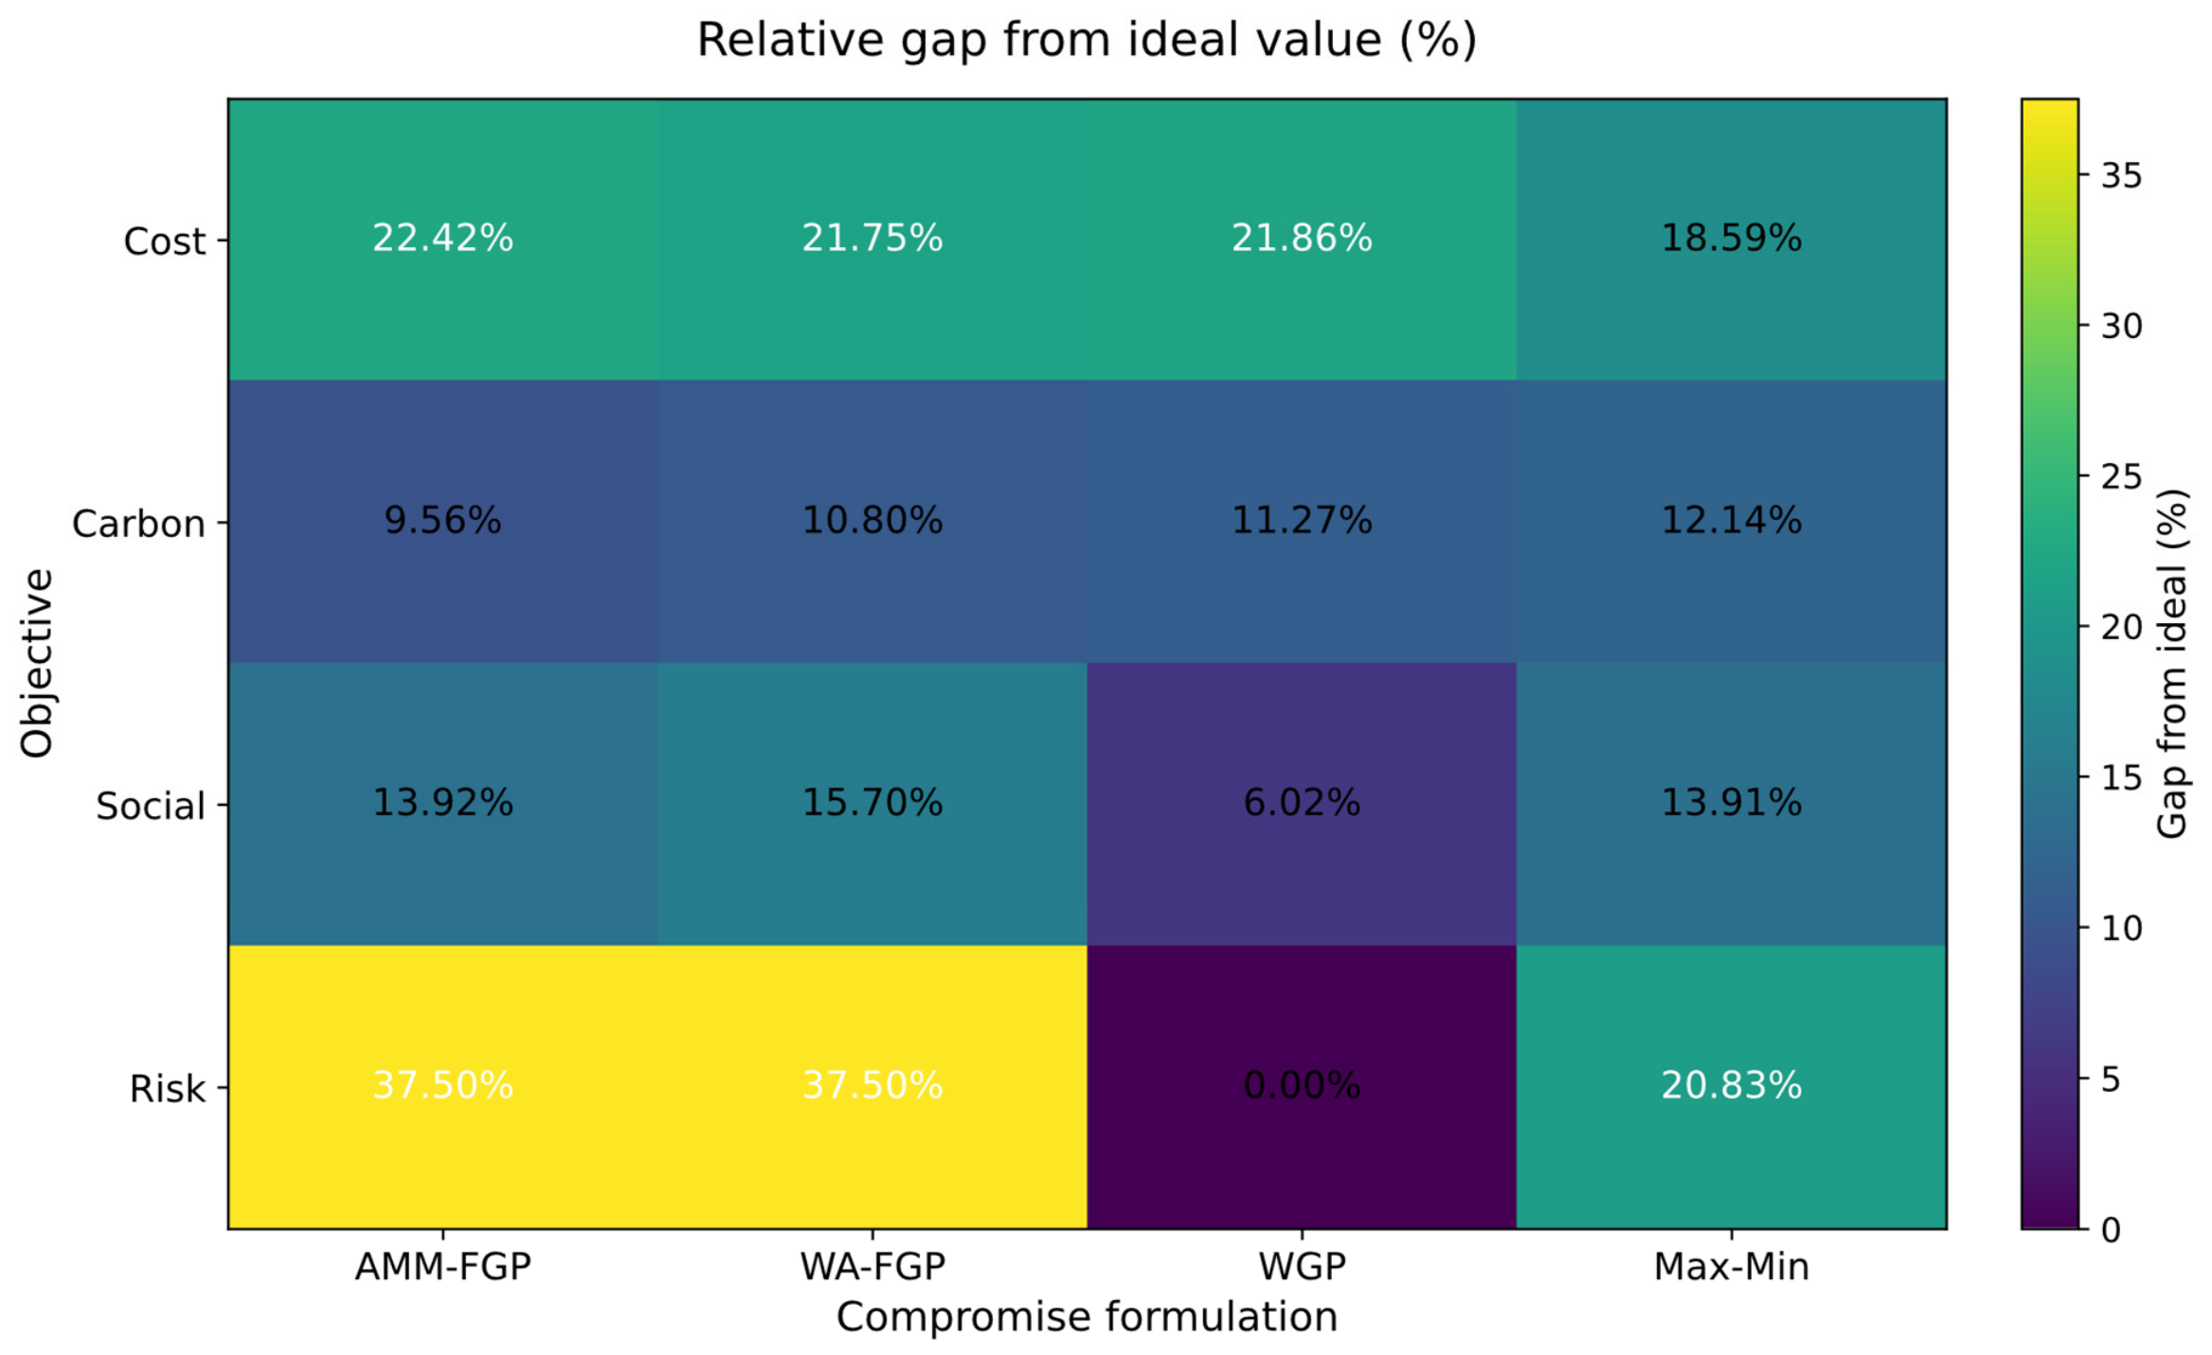

Disclaimer/Publisher’s Note: The statements, opinions and data contained in all publications are solely those of the individual author(s) and contributor(s) and not of MDPI and/or the editor(s). MDPI and/or the editor(s) disclaim responsibility for any injury to people or property resulting from any ideas, methods, instructions or products referred to in the content. |
© 2026 by the authors. Licensee MDPI, Basel, Switzerland. This article is an open access article distributed under the terms and conditions of the Creative Commons Attribution (CC BY) license.