


Abstract
Detecting rotated parabolic shapes in digital images remains a significant challenge in computer vision, especially in embedded environments constrained by computational and memory resources. This study introduces a novel field-programmable gate array (FPGA)-based genetic algorithm (GA) architecture specifically tailored for rotated parabola detection, implemented as an intellectual property (IP) core on a PYNQ-Z1 system-on-chip (SoC) platform. The architecture encodes four parabola parameters into fixed-length chromosomes, assesses their geometric consistency with a 640 × 480 binary edge image using a hardware fitness function, and executes the entire evolutionary process in programmable logic. Image pre-processing is executed on an external CPU, using Canny edge detection for synthetic images and Holistically Nested Edge Detection (HED). For real images, post-processing and result visualization are conducted on the ARM processor using the PYNQ framework. Experimental results on synthetic images demonstrate mean accuracies of 98.47% and 95.23%, with detection success rates of up to 96%. For real images, since manually annotated ground truth is not available, results are presented as qualitative observations of convergence consistency across 100 independent runs. These findings demonstrate the feasibility of detecting rotated parabolas on resource-constrained embedded platforms and indicate promising applications in domains where parabolic patterns are prevalent, such as structural inspection, biomedical imaging, and perception modules for autonomous vehicles and driver-assistance systems.
Keywords:
parabola detection; genetic algorithm; System-on-a-Chip (SoC); High-Level Synthesis (HLS); FPGA; hardware implementation; IP core; image processing MSC:
68M07; 68T45; 68T05
1. Introduction
Detecting parabolic shapes in digital images remains a significant and open challenge within computer vision and image processing. The relevance of this problem spans several areas, including structural inspection, non-destructive testing, medical image analysis, and autonomous systems [1,2]. Parabolas, as conic sections, frequently occur in real-world scenarios: they can be seen in crack tips in ultrasonic B-scan images, in parabolic trajectories observed by machine vision systems, and in anatomical features such as the plantar arch or vascular patterns in retinal fundus images [1]. Yet, reliably detecting these shapes in practical situations is not straightforward. Factors like image noise, partial occlusion, and complex backgrounds complicate the process. Moreover, the challenge is heightened by the need to estimate at least four independent parameters from the image data: the vertex coordinates , the aperture a, and the rotation angle [3,4].
Classical approaches to shape detection rely heavily on the Hough Transform (HT) and its generalizations [3,4]. The HT maps each edge point in image space to a curve in parameter space, and shape detection reduces to finding a peak in an accumulator array. While conceptually elegant, the HT suffers from severe computational and memory demands when extended to parabolas, since the parameter space becomes at least four-dimensional [2]. Probabilistic and randomized variants of the HT partially address these limitations but remain sensitive to quantization of the parameter space and the presence of outliers [5]. The Random Sample Consensus (RANSAC) algorithm offers an alternative robust fitting paradigm that iteratively samples minimal subsets of edge points to estimate shape parameters; however, its convergence rate and accuracy depend critically on the inlier ratio, and it may require a large number of iterations in heavily cluttered images [5].
Evolutionary and bio-inspired algorithms have become strong alternatives for image shape detection, reframing the task as a global optimization problem over the parameter space [6,7,8]. Genetic Algorithms (GAs) represent candidate shapes as chromosomes, where each chromosome encodes a randomly sampled edge point to set the parabola vertex, directly yielding the coordinates . The aperture a and rotation angle are then selected using Look-Up Tables (LUTs) that define a discrete set of feasible parabolic shapes. These candidate populations are evolved using selection, crossover, and mutation, guided by a fitness function that assesses geometric consistency with the edge map [6]. This approach has seen success in circle detection [6,7] and has also been extended to the detection of ellipses [9,10]. A particularly notable contribution comes from Guerrero-Turrubiates et al., who applied Estimation of Distribution Algorithms (EDAs), a probabilistic generalization of GAs [11,12] to identify parabolic shapes in synthetic and medical images, achieving significant reductions in execution time compared to both the generalized Hough transform and RANSAC [1]. Despite these advances in software, evolutionary algorithms still face a computational bottleneck due to the need for repeated fitness evaluations over large populations. This limitation makes them ideal candidates for hardware acceleration. Recently, the hardware acceleration of full metaheuristic loops on System-on-Chip (SoC) FPGA platforms has proven highly effective for solving complex, non-linear estimation problems in other domains. For instance, ref. [13] successfully proposed an FPGA-accelerated -greedy Ant Colony Optimization (ACO) framework for maritime target motion analysis. While such approaches demonstrate the immense potential of embedding bio-inspired algorithms in programmable logic, their application to the geometric optimization problem of detecting rotated parabolas remains unexplored.
Field-Programmable Gate Arrays (FPGAs) offer a reconfigurable, parallel computing substrate that is well suited to accelerate iterative, population-based algorithms [14,15,16]. The inherent parallelism of FPGAs enables simultaneous evaluation of multiple candidate solutions, while fixed-point arithmetic reduces resource consumption compared to floating-point software implementations. FPGA-based accelerators have been demonstrated for circle detection using GAs on Zynq SoC devices [14], and for ellipse detection using GAs synthesized with High-Level Synthesis (HLS) tools on the PYNQ-Z1 platform [15]. These implementations achieve accuracy rates exceeding 99% while operating under strict area and power constraints, highlighting the suitability of the GA-FPGA co-design paradigm for embedded computer vision. FPGAs have also been deployed for real-time ellipse estimation using RANSAC in road sign detection [17] and for eye-tracking applications [18], and broader surveys confirm the growing role of FPGA accelerators in object detection tasks [16].
The PYNQ (Python Productivity for Zynq) framework provides a high-level software layer built on an embedded Linux operating system running on the ARM processing system (PS) of the Zynq SoC, enabling Python-based control and data transfer to hardware overlays executed on the programmable logic (PL) [14,19]. This hardware–software co-design approach enables rapid prototyping and validation of FPGA intellectual property (IP) cores without requiring expertise in low-level HDL design, making it an attractive platform for deploying evolutionary algorithms in embedded image processing systems [15].
Despite these advances, a critical limitation persists across most parabola-detection methods: most approaches restrict detection to non-rotated parabolas with a fixed or partially constrained aperture. For instance, although the Hough-based methods of Oloumi and Rangayyan parameterize the parabola through its vertex and aperture a [20,21], they do not account for arbitrary orientation angles, thereby limiting detection to parabolas aligned with the image axes. Similarly, the Genetic-Based Inverse Voting Hough Transform (GBIVHT) proposed by Maalmi et al. for parabolic crack detection in ultrasonic B-scan images explicitly restricts the search space to horizontal parabolas with fixed aperture in order to maintain a tractable parameter space [22]. Even the EDA-based approach of Guerrero-Turrubiates et al., while capable of handling orientation as a parameter, reports experiments primarily on vertically oriented parabolic shapes and does not demonstrate detection of parabolas under arbitrary rotations [1]. This systematic restriction to axis-aligned or low-dimensional configurations represents a significant gap: in real-world and vision scenarios, parabolic signatures may appear at arbitrary orientations, as in crack propagation fronts, parabolic reflector cross-sections, or biological membrane curvatures. A complete parabolic model must therefore consider four independent parameters: the vertex coordinates , the aperture a, and the rotation angle , allowing the detection of any parabola in any orientation within the image.
On the hardware side, System-on-Chip (SoC) FPGAs that integrate ARM processing cores with reconfigurable programmable logic have emerged as the platform of choice for embedded computer vision systems requiring both algorithmic flexibility and real-time throughput [23,24]. These devices exploit the complementary strengths of software programmability on the ARM processor and spatial parallelism on the FPGA fabric: the ARM core handles image acquisition, pre- and post-processing, and result interpretation, while custom hardware accelerators on the programmable logic implement the computationally intensive inner loops of vision algorithms with deterministic, sub-millisecond latency [25]. Recently, researchers have combined genetic algorithms with FPGAs to make image filters automatically. By doing the genetic optimization and fitness checks on the FPGA, they can get the same results as software, but much faster [26]. Furthermore, design-space exploration workflows based on multi-objective genetic algorithms have been validated on Zynq-class FPGAs, confirming that GA-driven hardware optimization is not only feasible but highly efficient in terms of latency and resource utilization [27].
In this paper, we present, to the best of our knowledge, the first hardware architecture for parabola detection in digital images using a Genetic Algorithm implemented on a PYNQ SoC FPGA platform. The proposed system is designed as an IP core synthesized using Vitis High-Level Synthesis (HLS) and integrated with the Zynq-7000 SoC on the PYNQ-Z1 development board. A single edge point is randomly sampled from the binary edge image as the parabola vertex, directly providing the vertex coordinates ; the aperture a and rotation angle of the candidate parabola are then selected from pre-computed Look-Up Tables (LUTs) that enumerate a discrete range of feasible shapes and orientations. A fitness function measures the geometric consistency between the candidate parabola and the edge map of the image under test. The evolutionary process operates entirely on the programmable logic, while image pre-processing is performed on an external CPU for both synthetic and real images, and result visualization are handled by the ARM processor via the PYNQ Python framework. Experimental results on synthetic images demonstrate mean accuracies of 98.47% and 95.23%, with detection success rates up to 96% across independent runs. For real images, where manually annotated ground truth is not available, results are presented as qualitative observations of convergence consistency across 100 independent runs, demonstrating the feasibility of detecting rotated parabolas on resource-constrained embedded platforms.
In Section 2, we dive into the material and the methods that drive this research. We lay out the architecture’s design and implementation in detail, highlighting its key components and showing how genetic algorithms are adapted to parabolic detection. In Section 3, we discuss our findings on both real and synthetic images, including challenging cases of corrupted salt-and-pepper noise images. Finally, we conclude by summarizing our key findings in Section 4.
2. Materials and Methods
This section presents the complete methodology for designing and implementing the proposed parabola detection system. The system combines a software layer running on an ARM processor with a hardware accelerator implemented on reconfigurable logic (FPGA), both integrated into a single System-on-Chip (SoC) device. The following subsections describe the hardware platform, the mathematical model of the parabola, the binary edge image representation, and the full design of the Genetic Algorithm (GA) used for detection.
2.1. Hardware Platform
The system is implemented on the PYNQ-Z1 development board (Digilent Inc., Pullman, WA, USA), Table 1, which integrates a Xilinx Zynq-7000 SoC XC7Z020-1CLG400C (Xilinx, Inc., San Jose, CA, USA). This device integrates two strongly interdependent domains within a single monolithic chip:
Table 1.
Key hardware resources of the Xilinx Zynq-7000 SoC (XC7Z020) used in this work.
- Processing System (PS): A dual-core ARM Cortex-A9 processor running at 650 MHz, responsible for image acquisition, edge detection, data transfer, and result visualization via the PYNQ Python framework Version 2.7.
- Programmable Logic (PL): An FPGA fabric with 85,000 logic cells, 4.9 Mb of Block RAM (BRAM), and 220 DSP slices, operating at 100 MHz, where the complete GA evolutionary loop executes in hardware.
Communication between PS and PL is carried out through high-speed AXI4 interconnects and Direct Memory Access (DMA) transfers, minimizing data movement latency [14].
2.2. Software and Development Tools
The IP core implementing the GA was designed using Xilinx Vitis High-Level Synthesis (HLS), which translates C/C++ algorithmic descriptions into synthesizable Register-Transfer-Level (RTL) hardware [15]. HLS directives (pragmas) were applied to control loop pipelining, memory binding, and AXI interface protocols. The synthesized IP was integrated into a Vivado block design using AXI4 interconnects, and the resulting bitstream was deployed on the PYNQ-Z1 via the PYNQ Python framework, which provides a high-level hardware abstraction layer running on embedded Linux [14,19].
2.3. Parabola Mathematical Model
A parabola within a digital image is completely specified by four geometric parameters: vertex coordinates , aperture a, and rotation angle . The parametric equations of the rotated parabola, evaluated at the parameter , are:
where the positive branch () and negative branch () of the parabola are evaluated simultaneously at each iteration. This parameterization allows the detection of parabolas at any orientation in the image plane. Specifically, the parameter controls the axis of symmetry direction, a controls the curvature (larger implies tighter curvature), and the vertex fixes the parabola tip. As a result, it overcomes the limitations of earlier detectors, which were restricted to recognizing only axis-aligned parabolas [20,22].
The parametric step is defined adaptively as:
so that the 400-step sweep always covers the full visible extent of the parabola, regardless of its aperture value.
2.4. Binary Edge Image Representation
The input to the GA is a binary edge image of resolution pixels (307,200 pixels total), produced by the ARM processor using a standard edge detector (e.g., Canny, Sobel). To allow efficient hardware access, the binary edge map is compacted into 32-bit words, resulting in an array of 9600 words stored in on-chip BRAM using a dual-port configuration. This reduces memory bandwidth and enables single-cycle pixel reads. Additionally, the indices of all active edge pixels are stored in a separate array used during population initialization, guaranteeing that every individual’s vertex gene corresponds to a real edge point.
2.5. Genetic Algorithm Design
The proposed GA explores the four-dimensional parameter space to identify the parabola that most closely aligns with the edge information present in the input image. The entire evolutionary procedure, from population initialization through to the production of final results is executed within the FPGA’s programmable logic at 100 MHz. The corresponding algorithmic workflow is depicted in Figure 1.
Figure 1.
Flowchart of the Genetic Algorithm for parabola detection executed on the FPGA programmable logic.
2.5.1. Chromosome Representation
Each individual in the population encodes a candidate parabola as a compact 37-bit chromosome composed of three genes. The encoding is designed to be directly operable by bitwise hardware crossover and mutation without any multiplication or division. Table 2 summarizes the gene definitions.
Table 2.
Chromosome structure of each individual in the Genetic Algorithm.
The three genes are packed into a single 37-bit word (bits [36:18] vertex, bits [17:10] aperture, bits [9:0] angle), enabling efficient bitwise manipulation in hardware.
2.5.2. Population Initialization
A population of individuals is randomly initialized using a hardware XOR-shift pseudo-random number generator (PRNG) implemented entirely in the programmable logic. The PRNG is based on the recurrence:
with a 32-bit state and initial seed , providing a period of with zero DSP resource usage. Three variants are derived from this generator:
- A normalized float in for probabilistic decisions.
- A uniform integer in for array indexing.
- A raw 32-bit word for bitwise mutation masks.
The vertex gene of each individual is sampled from the active edge-pixel index array, ensuring biologically meaningful initialization (all vertices start on real edges).
2.5.3. Fitness Function
The fitness of each individual measures how well its encoded parabola aligns with the binary edge map. The evaluation procedure consists of the following steps:
- 1.
- Fixed-point coordinate computation: The parametric equations (Equation (1)) are evaluated using 32-bit fixed-point arithmetic (16 integer bits, 16 fractional bits), avoiding floating-point resources in the PL.
- 2.
- Parametric sweep: The parameter t is swept over 400 steps using the adaptive step (Equation (2)). Both the right arm () and left arm () are evaluated at each step, yielding up to 800 candidate pixels per individual per generation.
- 3.
- Neighborhood tolerance: For each candidate pixel within image bounds, a neighborhood centered on is checked against the BRAM edge map (checking rows , y, ). This tolerance compensates for sub-pixel localization errors in the edge detector.
- 4.
- Fitness score: The normalized fitness is computed as:where denotes the number of candidate pixels that coincide with an edge pixel. At least 50 of such valid edge-pixel coincidences are required; otherwise, the fitness is assigned a value of zero to suppress noise-induced false positives. The constant denominator (800) is used to eliminate hardware division, allowing it to be implemented as a fixed multiplication instead.
Table 3 summarizes the main parameters of the Genetic Algorithm.
Table 3.
Summary of the Genetic Algorithm parameters.
The genetic algorithm (GA) parameters listed in Table 3 were determined through empirical preliminary experimentation. The mutation probability, , was set deliberately high compared to conventional GA practices. Preliminary runs with consistently led to premature convergence of the aperture gene a. The elevated mutation rate was therefore chosen to help maintain diversity in the parameters.
The crossover probability was set to to maximize recombination, while the elitism operator was included to ensure that the best individual is preserved across generations. A population size of was necessary, as smaller populations () did not provide sufficient initial diversity, even with increased recombination and mutation rates.
A 50-hit threshold was implemented to prevent the GA from mistakenly identifying high-fitness individuals arising from noise pixels that coincidentally matched edge coordinates. This parameter effectively guided the algorithm toward geometrically consistent parabolic solutions.
Additionally, a pixel tolerance was introduced to address a convergence problem in which the best individual at the end of the test represented only half of the parabolic arc, resulting in an aperture a approximately twice the expected value. This tolerance relaxed the pixel-matching criterion, allowing candidates whose generated parabolas passed within a neighborhood of each target edge pixel to be accepted. This adjustment facilitated convergence to the correct full-arc solutions.
2.5.4. Genetic Operators
2.5.5. Selection
Fitness-proportionate selection (roulette wheel) is used. The cumulative probability vector is computed each generation. A new parent is chosen by finding the first index i such that , where is drawn from the hardware PRNG.
2.5.6. Crossover
Algorithm 1 summarizes the gene-level uniform crossover operator implemented in the FPGA. The population is processed in consecutive pairs . For each parent pair, the hardware pseudo-random generator XOR_0_to_1() produces a real value , which is compared against the crossover probability ; crossover is only applied when . In that case, all genes j of the two parents are processed and, for each gene, the function XOR_0_to_range(2) generates an integer that decides if the gene is exchanged: when , gene j is swapped between individuals i and , implementing a uniform crossover in which each gene is independently exchanged with probability .
| Algorithm 1 Uniform crossover |
|
2.5.7. Mutation
Algorithm 2 summarizes the mutation stage of the genetic algorithm implemented on the FPGA. For each individual in the population, the hardware PRNG XOR_0_to_1() generates a real value , and mutation is applied only when . Once an individual is selected, each of its three genes is processed independently: a binary variable do_mutate obtained with XOR_0_to_range(2) decides whether the current gene is modified. Gene 0 (stored in Gene[]) encodes the vertex index and is resampled by drawing a new edge index uniformly in , ensuring that the vertex always corresponds to a valid edge pixel. Gene 1 (Gene[]) encodes the aperture index into a LUT of size and undergoes a macro-mutation driven by a 32-bit random word rand_val: a 2-bit pattern mutation_type selects between assigning a new random index (rand_val & 255), halving the current index to obtain a wider parabola, or doubling it when it lies in the lower half of the LUT (with random reinitialization otherwise). Finally, Gene 2 (Gene[]) encodes the orientation angle and is mutated by drawing a new index in using XOR_32bits() & 1023, which avoids integer divisions. This bit-level implementation keeps all indices within the valid LUT ranges and minimizes memory accesses and arithmetic operations, which is crucial to sustain a high clock frequency in the FPGA.
| Algorithm 2 Mutation |
|
2.5.8. Elitism
In every generation, the best individual is directly transferred to position 0 of the next population, without any changes, before crossover and mutation are applied to the other individuals. This ensures that the best fitness value can only stay the same or improve from one generation to the next.
2.6. System Integration and Data Flow
Figure 2 illustrates the end-to-end data flow of the proposed system. The ARM processor acquires an input image, applies edge detection, packs the binary edge map into 32-bit words, and transfers it to the FPGA BRAM via DMA. It also transfers the active edge-pixel index array to BRAM. The FPGA IP core then executes the complete GA autonomously and returns the best individual to the ARM via the AXI interface. Finally, the ARM reconstructs the detected parabola and plots it on the original image for visualization.
Figure 2.
End-to-end data flow of the parabola detection system on the PYNQ-Z1 SoC.
3. Results
3.1. Synthetic Images
For synthetic images, edge detection was performed using an external CPU with a custom Sobel operator. Compared to direct intensity thresholding, the Sobel operator produces a richer edge map. Gradient detection was performed by convolving the image with the spatial kernels defined in Equation (5), which extract high transitions in the horizontal and vertical axes, respectively:
The horizontal and vertical gradient components and were computed and combined as , and the resulting gradient magnitude was binarized using Otsu’s automatic thresholding method [28]. Since the synthetic images consist of geometric traces rendered on a uniform black background, their intensity histograms are strongly bimodal, and the Otsu threshold converges consistently in the range on a scale across all tested figures, as shown in Table 4.
Table 4.
Otsu threshold computed for each synthetic test image as a function of the number of additional shapes.
The proposed GA-based parabola detection algorithm was evaluated on a set of five synthetic images, each containing a single target parabola with known parameters, progressively augmented with additional geometric shapes. Figure 3 presents the detection outcomes alongside the fitness evolution of the elite individual over 5000 generations.
Figure 3.
Synthetic images containing a single parabola with known parameters, progressively augmented with other geometric shapes, doubling in quantity from 2 up to 32 additional figures (a–e). The top image shows the detected parabola (red), marked by the best individual found by the genetic algorithm, after 5000 generations and 128 individuals. The bottom image shows the fitness evolution (cyan) of the elite individual over the 5000 generations for a representative run.
In the simplest case (Figure 3a), the image comprises only two additional shapes. The fitness curve indicates that the best individual stabilizes before generation 2000, after which no further improvement is observed. This behavior suggests that the algorithm rapidly converges to the target parabola, even in a low-clutter environment. This case yields a mean accuracy of 97.54% (Table 5), with particularly strong results for the angular parameter () and the vertex coordinates h and k (, ).
Table 5.
Accuracy of parabola parameters for synthetic images.
For 4 additional shapes (Figure 3b), a similar convergence behavior is observed, with the elite individual reaching a stable optimum before generation 2000. The mean accuracy improves slightly to 97.78%, with reaching 99.48%, confirming that the introduction of a moderate number of geometric shapes does not hinder the search significantly.
With 8 shapes (Figure 3c), the elite individual again stabilizes within the first 2000 generations, and the detection success rate rises to 98.11%. The results show consistent improvements across all parameters compared to the simpler scenes, reflecting the ability of the GA to exploit a larger population of potential candidates in a more demanding search landscape. At 16 shapes (Figure 3d), the same early convergence pattern holds, with the best individual stabilizing before generation 2000 and achieving a mean accuracy of 98.47%, the highest among all five test cases. The vertex accuracies reach and , demonstrating excellent detection of the parabola vertex despite the denser scene.
In the most challenging scenario (Figure 3e), which contains 32 additional shapes, the convergence behavior changes notably: the fitness curve exhibits a prolonged transient phase, and the elite individual does not stabilize until approximately generation 3000, reflecting the increased complexity of the search space. This delayed convergence is accompanied by a measurable drop in detection quality, with mean accuracy falling to 95.23%, a reduction of more than 3 percentage points relative to the 16-shape case. In particular, decreases to 94.61% and to 92.73%, evidencing that the highly cluttered environment makes it harder for the genetic algorithm to converge to a high-quality individual within the allotted 5000 generations. The quantitative results for all five test cases are summarized in Table 5.
3.1.1. Synthetic Image Box Plots
To further characterize the statistical behavior of the IP core across repeated executions, the GA-based detection system was run 100 independent times for each synthetic test case, and the distribution of the estimated parabola parameters was through box plots (Figure 4). This analysis complements the mean accuracy values presented in Table 5 and provides insight into the consistency and robustness of the hardware implementation under varying initial conditions.
Figure 4.
Box plots of the estimated parabola parameters across all synthetic images: (a) vertex coordinate h [px], (b) vertex coordinate k [px], (c) opening parameter a, (d) orientation angle [deg], and (e) best-individual fitness value. Each box shows the median, interquartile range, and outliers over the 100 independent runs performed for each synthetic image with progressively augmented shapes.
The box plots for the vertex coordinates h (Figure 4a) and k (Figure 4b) display a distinct pattern that aligns with the convergence behavior observed in Figure 3: for the simpler scenes (2 and 4 additional shapes), both parameters exhibit tight interquartile ranges and few outliers, confirming that the IP core reliably converges to accurate vertex estimates across all runs. As scene complexity increases to 8 and 16 shapes, the spread remains small, and the medians stay close to the ground-truth values, which is in agreement with the high accuracy figures and reported for Figure 3d in Table 5. For the most cluttered scene (32 shapes, Figure 3e), the interquartile range widens noticeably, and the number of outliers increases, reflecting the greater difficulty that the genetic algorithm faces when searching for the best individual in a more complex fitness landscape.
A particularly important observation arises from the box plot for the opening parameter a (Figure 4c). Unlike h, k, and , whose distributions are approximately symmetric, the distribution of a exhibits a pronounced right-skewed tail to higher values of a across the last case. This asymmetric behavior reveals the existence of sporadic runs in which the GA converges to individuals with an unusually large aperture, shifting the arithmetic mean away from the main body of the distribution and indicating that the most demanding parameter is the aperture a. For this reason, the median absolute error (MedAE) was adopted as the accuracy metric for a, rather than the mean-based definition used for the other parameters. By fixing the error measure to the median rather than the mean, the metric is robust to these outlier runs and provides a more representative assessment of the typical estimation quality. As a result, remains constant at for all complexity levels up to 32 shapes and drops only slightly to for Figure 3e. This small decrease, together with the skewness visible in the box plot, clearly indicates that estimating a is difficult when numerous shapes occupy the research space.
The box plot for the orientation angle (Figure 4d) shows compact distributions for the low complexity scenes and a moderate increase in spread for 32 shapes, consistent with the drop in from (16 shapes) to (32 shapes) observed in Table 5. Finally, the fitness box plot (Figure 4e) captures the convergence quality of the elite individual: for scenes with up to 32 shapes, the fitness values cluster tightly around a high region, confirming rapid and consistent convergence within the allotted 5000 generations. For the 32-shape case, the fitness distribution shifts downward and its spread increases, providing additional statistical evidence that the larger search space not only delays convergence (as evidenced by the fitness curve stabilizing near generation 3000 in Figure 3e) but also results in a genuinely lower-quality final solution across the 100 runs for the parameters h, k, a, and , we defined accuracy measures based on the corresponding ground-truth values. Let denote the value of a given parameter obtained in run i, and let be its ground-truth value. For h, k, and , we used a mean-based definition consistent with the original implementation. First, we compute the sample mean
and the (signed) mean error
The corresponding accuracy is then defined as
The aperture parameter a occasionally exhibits a small number of large outliers, which strongly bias the mean-based accuracy and can even yield misleading values for complex scenes. To obtain a more robust measure, we use the median absolute error (MedAE) with respect to the ground-truth aperture . The per-run absolute errors are
and the median absolute error is defined as
The robust accuracy for the aperture is then
In all tables, the reported accuracies for h, k, and correspond to , while the mean accuracy for the aperture a is given by the robust . This convention is motivated by the fact that only a shows pronounced outliers, for which median-based statistics yield a more faithful description of the typical performance.
3.1.2. Detection Success Rate Under Full-Scale-Range Tolerance Criteria
To assess the robustness of the genetic algorithm against the shapes added in synthetic images, a complementary success-rate analysis was performed on the same 100 independent runs described in Section 3.1.2. Since the synthetic images were computer-generated, the ground-truth parabola parameters are known exactly: px, px, , and . A run was counted as successful if and only if all four estimated parameters simultaneously fell within a tolerance band defined as of the full-scale range (FSR) of each variable’s search space.
Figure 5 summarizes the detection success rate across the five synthetic test cases illustrated in Figure 3a–e, in which the number of additional shapes doubles progressively from 2 to 32 shapes. With only 2 additional shapes (Figure 3a), the algorithm achieves a success rate of , demonstrating near-perfect reliability when the parabolic target is nearly isolated. As the scene complexity grows to 4 shapes (Figure 3b), the rate remains high at , confirming that the search space augmentation is still manageable. A more pronounced degradation appears in 8 shapes (Figure 3c), where the rate declines to : the higher density of competing edges begins to distort the fitness landscape, causing a fraction of runs to converge to suboptimal solutions. At 16 additional shapes (Figure 3d), the success rate drops further to , a relatively small additional decrease, indicating that the strongest downward performance trends are already apparent at 8 and 16 shapes, though some runs still succeed in escaping local optima by the 5000-generation limit. Finally, with 32 shapes (Figure 3e), the success rate reaches its lowest value of , indicating that a heavily cluttered scene with a large number of geometric elements poses a substantial challenge to the genetic algorithm’s exploratory capability within the allotted 5000 generations and 128 individuals. The decrease in performance from to as the number of shapes increases from 2 to 32, corresponding to a successive decline in the detection capability of the known parameters of the parabola in the synthetic images, demonstrates a pronounced inverse relationship between scene complexity and detection performance.
Figure 5.
Detection success rate (100 independent runs) of the proposed genetic algorithm-based parabola detector across the five synthetic images (Figure 3a–e), each progressively augmented with additional geometric shapes. A run is classified as successful only if all four estimated parameters (h, k, a, ) simultaneously satisfy the 3% full-scale-range tolerance criteria. The horizontal axis identifies each test scene by the number of shapes added, and the vertical axis reports the percentage of successful detections for that number of shapes.
3.2. Rotated Parabolas
The GA-based IP core’s ability to detect parabolas across varying orientations was evaluated using five synthetic test images. Each image contains a parabola with a distinct rotation angle , vertex position , and aperture a. These configurations span angles of , , , , and . These five cases constitute a limited proof-of-concept for rotated parabola detection under controlled conditions. Figure 6 presents qualitative detection results for these cases. In each subfigure, the upper image displays the detected parabola overlaid on the input image, as estimated by the best individual of the final generation, while the lower image shows the corresponding fitness convergence curve over 5000 generations.
Figure 6.
Experimental results for rotated parabola images (a–e). The top row of each subfigure displays the detected target marked by the best individual (red) found by the genetic algorithm. The bottom row illustrates the fitness evolution of the elite individual over 5000 generations (cyan) for a representative run.
In Figure 6a, the reference case corresponds to a non-rotated parabola () with vertex at and aperture . The algorithm reliably converges to the correct solution, as evidenced by the smooth fitness curve that stabilizes well before the maximum generation count is reached.
For the -rotated case shown in Figure 6b, with vertex and , the IP core successfully adapts to the parabola’s orientation. The fitness converges quickly, confirming that the rotation does not destabilize the evolutionary search.
The configuration in Figure 6c, defined by vertex and , represents the case of maximum diagonal inclination. Despite the steeper aperture and oblique orientation, the algorithm correctly identifies the target parabola, and the elite individual’s fitness converges to a high value within the allotted generations.
Figure 6d presents the rotated parabola, which is a horizontally oriented curve, with vertex at and . This orientation is particularly challenging because the parabola axis is perpendicular to the canonical upright form; nonetheless, the GA-based hardware accelerator detects the target accurately, as shown by the overlaid curve and the convergent fitness trajectory. Finally, Figure 6e shows a rotation with vertex and . The detection result demonstrates that the IP core generalizes well beyond the four cardinal orientations, successfully estimating all four parameters simultaneously.
A quantitative assessment of the detection performance across all rotated configurations is provided in Table 6, which reports the Mean Absolute Error (MAE), Median Absolute Error (MedAE), Standard Deviation (Std. Dev.), Interquartile Range (IQR), and the detection Success Rate computed over 100 independent runs per image with a population of 128 individuals evolved for 5000 generations, evaluated under a 3% full-scale-range (FSR) tolerance, as mentioned in previous sections.
Table 6.
Statistics and detection success rate across 100 independent runs for the five synthetic images with different parabolic parameters.
For the reference case of Figure 6a (), Table 6 reports a success rate of 100%, with MAE values of 5.31 px for h, 1.43 px for k, for a, and for . The relatively larger MAE in h is attributable to the loose aperture of this parabola, which makes lateral displacements less penalized by the fitness function; nevertheless, the MedAE of 4 px and an IQR of 5 px confirm a tight central distribution of estimates, and the 100% success rate demonstrates perfect reliability across all 100 runs.
In the configuration of Figure 6b, Table 6 shows that the algorithm also achieves a 100% success rate. The MAE values are 2.18 px (h), 2.29 px (k), (a), and (), all well within the 3% FSR tolerance band. The MedAE and IQR values are consistently low, indicating that the distribution of parameter estimates is concentrated around the ground-truth values with minimal outliers.
For the -rotated parabola of Figure 6c, Table 6 records the only case in which the success rate falls below 100%, reaching 98%. This marginal reduction can be attributed to the combination of the highest aperture coefficient () and oblique inclination, which together increase the complexity of the fitness landscape. Even so, the MAE values remain small (1.17 px for h, 1.16 px for k, for a, and for ), and the close success rate to 100% confirms that the hardware-accelerated GA handles this challenging case with high robustness.
The case of Figure 6d achieves a 100% success rate with notably low MAE values: 0.76 px for h, 2.93 px for k, for a, and for (Table 6). The sub-pixel MAE for h and the sub-degree angular error highlight the precision of the IP core when the parabola axis is aligned horizontally. The low IQR values further confirm the consistency of the estimations across all 100 runs.
For the configuration of Figure 6e, Table 6 reports a 100% success rate, with MAE values of 0.98 px (h), 0.78 px (k), (a), and (). Notably, the angular MAE of is the lowest across all five configurations, and the IQR for of reflects exceptional rotational accuracy. These findings show that the genetic algorithm reliably finds the correct orientation, even for non-standard axis-oriented parabolas.
Overall, the results compiled in Table 6 demonstrate that the GA-based IP core running on the FPGA achieves a mean success rate of 99.6% across the five rotated configurations, with four out of five cases attaining a perfect 100% detection rate. The MAE and MedAE values for all parameters remain small relative to the image dimensions and the parameter ranges, and the low Std. Dev. and IQR values confirm that the estimations are both accurate and highly repeatable. These metrics collectively validate that the proposed hardware-accelerated genetic algorithm is robust to parabola rotation in non-challenging background scenarios, vertex displacement, and aperture variation, demonstrating its suitability for real-world detection tasks where parabolic shapes may appear at arbitrary orientations. Additionally, these results should be interpreted as indicative of prototype behavior rather than as a general performance bound.
3.3. Real Images
To assess the IP core behavior under uncontrolled conditions, five real images were selected to represent a broad range of visual scenarios in which parabolic shapes appear naturally: a Mars photograph (Figure 7d), a curved road (Figure 7c), an Earth photograph (Figure 7e), a rainbow arc photograph (Figure 7b), and a Retinal Vessel image [29], in which the main vessel arcade delineates a complex parabolic arc (Figure 7a). Unlike the synthetic images, which were binarized using Otsu’s automatic thresholding applied to the Sobel gradient magnitude (Section 3.1), each real image was pre-processed on an external CPU using the Holistically Nested Edge Detection (HED) [30,31,32], a deep learning-based edge detector that employs a fully convolutional network derived from VGGNet with deep supervision at multiple side-output layers, enabling multi-scale and multi-level edge prediction using the OpenCV DNN module with the pre-trained Caffe model and its corresponding network definition. A custom CropLayer was registered to align intermediate feature maps. The input blob was constructed with a scale factor of and mean subtraction of (BGR). The network output was rescaled to and saved as a grayscale edge map, which was subsequently binarized using a pixel intensity threshold of (on a scale) to produce the binary edge image. This binary image was then packed into 32-bit words and transferred to the FPGA BRAM via DMA as the input to the IP core, and as with synthetic images, the IP core was executed 100 times independently for each image under identical conditions: a population size of 128 individuals and a maximum of 5000 generations (see Table 3). The qualitative results for each test case are summarized in Figure 7, which shows, from top to bottom: the original image with the detected parabola plotted, the corresponding edge images with the same parabola detected, and the fitness evolution of the elite individual across generations. Statistical results of the 100 runs per image are provided in Table 7 and the corresponding box plots in Figure 8.
Figure 7.
Real images used to evaluate the proposed parabola detection algorithm (a–e). For each test case, the top image shows the original input, the middle image shows the detected parabola overlaid by the best individual (red) found by the genetic algorithm, and the bottom image shows the fitness evolution of the elite individual over 5000 generations (cyan) for a representative run.
Table 7.
Descriptive statistics of the detected parabola parameters (h, k, a, ) for real images, based on 100 runs with 5000 generations each test.
Figure 8.
Box plots of the estimated parabola parameters across all real images tested: (a) vertex coordinate h [px], (b) vertex coordinate k [px], (c) opening parameter a, (d) orientation angle [deg], and (e) best-individual fitness value. Each box shows the median, interquartile range, and outliers over the 100 independent runs performed for each real image.
3.3.1. Analysis of Results on Real Images
The five test images span a wide range of real-world image scenarios, enabling a thorough assessment of the IP core genetic algorithm’s ability to detect parabolic shapes under natural image conditions. The following analysis integrates the qualitative inspection of Figure 7, the statistical distributions in Table 7, and the box plots in Figure 8.
Retinal Vessel Image (Figure 7a)
The retinal vessel image is the most favorable among the five real tests. The superior arcade of the optic fundus forms a disrupted parabolic shape, a high-contrast parabolic arc after edge detection, providing the genetic algorithm with a dense and unambiguous set of boundary points. Table 7 confirms the consistency of the 100 independent runs: the vertex coordinates exhibit very low dispersion (h: mean px, median px, std px, CV ; k: mean px, median px, std px, CV ), indicating that the algorithm reliably detects the vertex across all repetitions. The orientation angle is equally stable (mean , std , CV ), and the box plot in Figure 8d shows a very compact whisker range for this image. The opening parameter a has a moderately higher coefficient of variation (CV ), which is consistent with the observation that vessel curvature generates a relatively shallow arc, the exact angular extent of which is difficult to determine with precision; nonetheless, the interquartile range remains narrow (). The fitness evolution curves in Figure 7a confirm a fast convergence before 1000 generations, with the elite individual typically reaching a stable fitness value for the rest of the generation limit.
Rainbow arc Photograph (Figure 7b)
The rainbow arc image exhibits the most consistent convergence behavior among all real images tested, with the positional and curvature parameters showing the lowest variability across 100 independent runs, while also exposing a specific, identifiable limitation of the angle representation. The vertex coordinates are the most tightly constrained of all real images (h: CV ; k: CV ), and the opening parameter a achieves the lowest coefficient of variation of all five images (CV , std ), demonstrating that the shape of the arc is detected with outstanding repeatability. This is consistent with the visual result in Figure 7b, where the detected parabola closely follows the curvature of the rainbow band.
However, the orientation angle presents a markedly anomalous statistical behavior: while the mean is , the median is , and the standard deviation reaches (CV ), with and . This apparent inconsistency is not a failure of the algorithm, but rather a direct consequence of the angular periodicity inherent in the parabola model. The rainbow arc is oriented with very close to the / boundary, so the genetic algorithm correctly identifies equivalent solutions on both sides of this discontinuity: a substantial fraction of runs converges to – (compact cluster at high values, as confirmed by the tight IQR of around the median), while the remaining runs wrap around to –. Both families of solutions are geometrically identical when the periodicity of the angle is taken into account; the bimodal distribution is clearly visible in the box plot of Figure 8d, where the whiskers for the rainbow image span the full range while the box itself is narrow, an unmistakable signature of bimodality near a circular boundary. This effect is not captured by the arithmetic mean or the standard deviation reported in Table 7, which are not appropriate summary statistics for circular data near a circular point; the median, , and together with the box plot provide the correct interpretation. Regarding the fitness convergence, the evolution curve in Figure 7b shows that the elite individual reaches a stable value at approximately generation 1800, after which no significant improvement is observed; this early and decisive convergence is consistent with the algorithm having correctly identified a well-supported solution, notwithstanding the angular ambiguity discussed above.
Curved Road Photograph (Figure 7c)
The road curve image represents an intermediate complexity scenario. The parabolic structure is geometrically present, but the perspective projection of the lane markings introduces slight distortions, and the edge map contains competing contours from road boundaries, lane dividers, and background elements, increasing the difficulty of the optimization problem. The vertex coordinates show a moderate spread (h: std px, CV ; k: std px, CV ), and the interquartile ranges ( px, px) indicate that while the majority of runs converge to a similar region, a non-negligible fraction of runs still identifies a shifted vertex. This behavior is clearly captured in the h and k box plots (Figure 8a,b), which show a wider box for this image compared to the retinal and rainbow cases. The opening parameter a and the orientation angle are, by contrast, well-determined (CV and CV respectively), confirming that the algorithm robustly identifies the correct curvature direction even when the exact vertex location varies between runs. The fitness evolution in Figure 7c reflects a slower convergence compared to the retinal vessel, with the elite individual still exhibiting incremental improvements through approximately generation 4000, after which the curve flattens, and no further significant gains are observed within the rest of the generations.
Mars Photograph (Figure 7d)
The Mars image constitutes one of the two most challenging cases in this set. The visible parabolic shape is embedded in a complex, noisy background at the edge of the image’s vertex. The resulting statistical profile shows substantially higher variability across all parameters: vertex h (std px, CV , IQR px), vertex k (std px, CV , IQR px), and in particular the opening parameter a (mean , median , std , CV ). The large discrepancy between the mean and median of a (mean is above the median) indicates a positively skewed distribution dominated by outlier runs in which the algorithm settled on a wide, nearly flat parabola that covers a large portion of the noisy edge map. The orientation angle is similarly dispersed (mean , std , CV ), suggesting that in many independent runs the algorithm converged to local optima with qualitatively different orientations. The box plots for a and in Figure 8c,d show extended whiskers and numerous outliers for this image, consistent with a fitness landscape having several competing local optima of comparable quality. The fitness evolution curves in Figure 7d corroborate this, displaying a less steep convergence and a lower final fitness value relative to the simpler cases, indicating that the 5000 generations are sufficient to improve but not to reliably identify a unique global solution. Inspection of the fitness evolution curve in Figure 7d reveals that the elite individual undergoes a slow, irregular ascent throughout the run, reaching an approximate value only around generation 2400–2500; beyond this point, the curve remains nearly flat, confirming that the remaining generations do not produce further meaningful refinement and that the algorithm has exhausted its exploratory capacity.
Earth Photograph (Figure 7e)
The Earth image is the most problematic scenario for the proposed detector. Although the planet’s horizon forms an intrinsically parabolic arc, the edge map is distorted by cloud boundaries, atmospheric gradients, and the smooth transition between the Earth’s surface and space, resulting in a broad, diffuse edge region rather than a sharp parabolic boundary. Table 7 reflects this difficulty: the vertex coordinates exhibit the highest absolute dispersion of all images (h: std px, CV , IQR px; k: std px, CV ). The opening parameter a shows the most extreme distributional anomaly of the entire experiment: mean , median , std , CV , with and IQR . This combination, where the mean is nearly five times the median and the IQR is extremely narrow, indicates that the vast majority of runs correctly converge to a tight cluster of solutions with low a (a very open parabola, appropriate for a planetary arc), but a minority of runs produce outlier solutions with very large a values that dramatically inflate the mean and standard deviation. This bipartite pattern is clearly observable in the box plot of a (Figure 8c), where the body of the box is compact at low values while isolated outlier points are scattered toward much higher values. The orientation angle (mean , std , CV ) also shows moderate spread, consistent with a fitness landscape that has a shallow and broad global optimum. The qualitative result in Figure 7c confirms that the detected parabola captures the general curvature of the horizon, although the fitness convergence curve is the slowest and noisiest of all five test cases, indicating that the genetic algorithm encountered significant difficulty in finding best solutions. The fitness evolution curve in Figure 7e corroborates this behavior: the elite individual improves slowly and irregularly, with an approximate value emerging around generation 2300, after which the remaining generations yield no substantial gain, the lowest and most erratic convergence profile observed among all five real images.
Overall Comparative Assessment
Considering all five real-image tests jointly, the results follow a clear hierarchy of detection difficulty that can be traced directly to the quality and specificity of the edge map produced by the binary preprocessing stage. Images in which the parabolic shape generates a dense, isolated, and high-contrast edge (Retinal vessel, Rainbow arc) allow the genetic algorithm to reliably converge on consistent solutions across all 100 runs, with CV values below for most geometric parameters. As the edge density decreases, competing edge sources increase, and the local contrast of the parabolic arc diminishes (Road curve), the variance in vertex localization grows, but the curvature shape remains robustly detected. At the most difficult extreme (Mars, Earth), the fitness value shows that the best individual dominated the population in early generations, which was insufficient to consistently reach the global optimum, leading to large between-run variability across all parameters and the emergence of outlier solutions. The box plots in Figure 8 offer a quick overview of this hierarchy. The interquartile ranges for all five parameters expand systematically from the Retinal vessel case to the Earth case, and the extent and frequency of outliers increase accordingly. These observations demonstrate both the strength of the genetic algorithm approach, its ability to identify parabolic structures in diverse and complex real scenes, and its primary limitation: dependence on the quality of the upstream edge extraction, which directly determines the sharpness of the fitness value and the reliability of convergence within a fixed computational budget. Notably, the fitness convergence generation also follows this difficulty hierarchy: the Rainbow arc stabilizes around generation 1800, the Earth and Mars images require until approximately generation 2300 and generation 2400–2500 respectively, and the Road curve continues to improve until near generation 4000, all of which is visually evident in the fitness curves of Figure 7 and further supports the interpretation that the quality of the edge map is the primary determinant of both the success rate and the convergence speed of the genetic algorithm.
3.4. Noise Corrupted Images
To quantify the robustness of the genetic-algorithm-based parabola detector under additive noise, added directly to the binary edge map image, a salt-and-pepper corruption protocol was applied to three representative images: the synthetic scene with 4 geometric shapes (Figure 9a), the rainbow arc (Figure 9b), and the retinal fundus vessel image (Figure 9c). In contrast to the synthetic evaluation of Section 3.1.2, where exact ground-truth parameters are available, these experiments rely on a surrogate reference: the median parameter obtained from 100 noise-free runs of the algorithm was taken as the pseudo-ground-truth baseline. Noise was then injected as salt-and-pepper pixels whose count was set to a fixed percentage of the total number of detected edge pixels in each image, ranging from 100% to 200% in steps of 25%. For each noise level, 100 independent runs were executed and the detection success rate computed as in the Section 3.1.2 with respect to the surrogate ground truth was recorded. The upper frames of Figure 9 show the best-detected parabola at the maximum noise level of 200%, while the lower frames plot the detection success rate as a function of the applied noise percentage.
Figure 9.
Representative results of the salt-and-pepper noise robustness test applied to three selected images: a synthetic scene with 4 geometric additional shapes (a), the rainbow arc (b), and the retinal fundus vessel image (c). For each case, the upper frame shows the best parabola detected (painted red) by the genetic algorithm over 100 independent runs at the maximum noise level of 200%, while the lower frame reports the detection success rate as a function of the applied noise level, ranging from 100% to 200%.
3.4.1. Synthetic Image with 4 Additional Shapes (Figure 9a)
The synthetic scene exhibits the steepest degradation curve among the three test cases. At 100% noise (i.e., a number of corrupted pixels equal to the total edge count), the algorithm still achieves a detection success rate of approximately , confirming a reasonable tolerance to moderate corruption. However, the success rate drops sharply to ≈68% at 125% noise and further declines to ≈43% at 150%, marking the inflection point beyond which the genetic algorithm fails to converge reliably. At 175% and 200% noise levels, the success rate continues to decline to ≈40% and ≈12%, respectively, indicating that the false edges introduced by the salt-and-pepper pattern overwhelm the genuine parabolic contour and severely distort the fitness. The best individual detected at 200% (upper frame) visually confirms this: although the parabola shape is preserved, the estimated position and curvature deviate noticeably from the noise-free reference. The synthetic image is the most sensitive scenario because its edge map is sparse and precisely defined by the known geometric shapes; any random noise pixel carries proportionally higher misleading weight than in a real image.
3.4.2. Rainbow arc (Figure 9b)
The rainbow image demonstrates the highest robustness to salt-and-pepper noise of the three scenarios evaluated. At 100% noise, the detection success rate reaches ≈100%, and remarkably remains at ≈93% even at 150%, suggesting that the genetic algorithm successfully exploits the strong, spatially extended chromatic edge of the rainbow arc even in the presence of heavy corruption. A meaningful degradation begins only at 175% (≈71%), and at the maximum level of 200% the success rate settles at ≈49%. The superior noise resilience of this image can be attributed to the rainbow arc, which produces a dense, high-contrast edge signal that retains significant discriminative power even after substantial noise injection. The best detection at 200% (upper frame) confirms that the algorithm still recovers the correct parabolic arc even under extreme noise conditions.
3.4.3. Retinal Fundus Vessel Image (Figure 9c)
The retinal image occupies an intermediate position in terms of noise robustness, but exhibits the first occurrence of degradation among the three test scenarios. Starting from ≈85% at 100% noise, already lower than the other two scenarios at the same level, the success rate declines steadily to ≈69% at 125%, ≈51% at 150%, and ≈32% at 175%, reaching its minimum of ≈20% at 200%. The consistently lower baseline success rate reflects the intrinsic difficulty of fitting a single parabola to a complex vascular network where multiple arc-shaped structures compete for detection. As noise increases, the genetic algorithm progressively loses its ability to discriminate the dominant vessel arc from the corrupted background, and the detected parabola drifts away from the target structure, as clearly visible in the upper frame of Figure 9c at 200% noise, where the red parabola is completely misaligned with any meaningful vascular contour.
The three test cases were deliberately selected to cover three representative scenarios: a controlled synthetic image (known geometry, precise edge map), a real image whose dominant structure is genuinely parabolic (rainbow arc), and a real image where the parabolic model is only an approximation of the underlying anatomy (retinal fundus vessel). This design allows the noise-sensitivity behavior of the genetic algorithm to be interpreted in terms of the physical properties of each edge map rather than the image category alone.
The primary factor governing robustness to salt-and-pepper noise is the thickness and density of the edge structure that defines the target parabola. The rainbow arc produces a broad chromatic band whose edge map contains many pixels distributed across the full width of the arc; even after a large fraction of those pixels are corrupted or replaced by noise, a sufficient number of coherent edge points survive to guide the genetic algorithm toward a valid solution, sustaining a detection success rate above up to 150% noise. By contrast, the synthetic image contains thin geometric contours typically one to two pixels wide, so each edge pixel carries disproportionate information weight; as salt-and-pepper noise is added at the same proportion of the total edge count, these sparse contours are rapidly overwhelmed, causing the success rate to collapse sharply beyond 125% noise. The retinal image presents an additional challenge: the retinal vessel network does not constitute a true parabolic structure, and the genetic algorithm is inherently fitting an approximation to a complex, branching vascular geometry. Even in the noise-free case this approximation introduces ambiguity, which explains the lower baseline success rate relative to the other two scenarios; the progressive addition of noise further degrades the edge cues that the algorithm relies upon to resolve that ambiguity, leading to the most consistent decline across all noise levels.
3.5. Time Performance
This work centers on the timing characterization of an FPGA IP core, specifically designed to process a fixed input interface. The core accepts a binary edge image with a resolution of 640 by 480 pixels, which is organized into 9600 32-bit words, totaling 307,200 bits. This image is transferred from the memory of the ARM processor to the FPGA Block RAM (BRAM) via Direct Memory Access (DMA), with the transfer occurring once per image. This time taken to transfer the image is reported in Table 8 as (SW) time, and hardware (HW) time, corresponding to the actual genetic-algorithm execution on the FPGA fabric. Across all configurations, the SW time remains virtually constant at approximately ms, while the HW time dominates the total execution time at around 13,087 ms on average, yielding a mean total execution time of 13,088.01 ms. The near-constant HW time across images of different complexity confirms that the execution budget is fixed by the algorithm parameters (5000 generations, 128 individuals) and is independent of scene content.
Table 8.
Execution Time of the Genetic-Algorithm IP Core for All Test Images: Software (SW), Hardware (HW) FPGA Execution, and Total Time for 5000 Generations.
Table 9 reports the per-generation execution time of the IP core, obtained by dividing the HW execution time of each run by the fixed number of generations (5000). The SW overhead remains unchanged, while the HW time per generation is remarkably consistent across all images at approximately 2.617 ms/generation, confirming that the hardware throughput is fully determined by the fixed algorithmic parameters and is independent of image content.
Table 9.
Per-Generation Execution Time of the Genetic-Algorithm IP Core: Hardware (HW) Time and Total Time per Generation.
Beyond the constant per-generation latency reported in Table 9, the fitness-evolution curves in Figure 3 and Figure 7 provide a more detailed view of how image complexity translates into effective computation time until convergence. In the synthetic experiments, the cases with 2, 4, 8, and 16 additional shapes (Figure 3a–c), and Figure 3d all exhibit early stabilization of the elite individual before generation 2000, corresponding to an estimated convergence time of approximately s of hardware computation. In contrast, the most cluttered synthetic scene (32 shapes, Figure 3e) shows a prolonged transient phase in which the elite fitness does not plateau until around generation 3000, increasing the effective convergence time to s a 50% increase in runtime with respect to the simpler configurations.
A similar complexity-driven pattern emerges in the real image experiments shown in Figure 7. Geometrically well-defined parabolic structures, such as the rainbow arc (Figure 7b) and retinal fundus vessel (Figure 7a), exhibit early elite fitness stabilization on the order of 1000–1500 generations, translating to estimated convergence times of approximately s and s of hardware execution, respectively. In contrast, more cluttered or ambiguous scenes, the road curve (Figure 7c), Mars (Figure 7d), and Earth (Figure 7e) display prolonged transients with plateaus near 2000–3000 generations (roughly – s), mirroring the synthetic clutter effect and highlighting scene complexity as the primary determinant of effective runtime. Overall, these fitness curves demonstrate that, despite the fixed 5000-generation budget, practical convergence occurs 40–60% earlier in simpler cases, enabling potential early-termination optimizations in future IP-core implementations.
3.6. IP Core Resource Consumption
Table 10 reports the hardware resource utilization of the Genetic IP core synthesized on the Zynq 7000 XC7Z020-CLG400C device. The IP core implements six functional stages of the genetic algorithm, each mapped to an independent hardware module whose resource footprint reflects its computational role.
Table 10.
Resources consumption by Genetic IP core implemented in Zynq 7000 (XC7Z020-CLG400C).
The ini_population module initializes the population of 128 candidate individuals, each encoded as a set of four parabola parameters, consuming 907 LUTs (1.70%) and 689 flip-flops (0.65%). No DSPs are required since initialization relies exclusively on pseudo-random integer arithmetic implemented in LUT fabric. The Sum_fitnesses, Prob_by_indi, and Prob_Accu_by_indi modules implement the roulette-wheel selection preparation stage: the first accumulates the raw fitness values of all individuals (97 LUTs, 113 FFs), the second computes the normalized selection probability for each candidate (178 LUTs, 102 FFs), and the third builds the cumulative probability vector used to draw individuals stochastically (97 LUTs, 120 FFs). Together, these three modules consume only 372 LUTs (0.70%) and 335 flip-flops (0.31%), confirming that the probabilistic selection logic is lightweight in hardware.
The Elite_Search module locates the best individual in the current population by scanning all fitness scores, requiring 214 LUTs (0.40%) and 181 flip-flops (0.17%). The Selection module then draws the parent pool via the roulette mechanism, consuming 446 LUTs (0.84%) and 306 flip-flops (0.29%). The Crossover_and_Mutation module performs gene-level uniform crossover over the selected parent pairs, independently swapping each gene between paired parents with probability , and applies gene-level mutation with configurable probability , accounting for 1852 LUTs (3.48%) and 1084 flip-flops (1.02%). All three modules operate entirely on integer and fixed-point logic, requiring zero DSPs.
The most resource-demanding stage is the fitness evaluation performed by EvalNormfitness_parabola_param, which assesses each candidate individual by computing the geometric fitness of its four parabola parameters against the set of detected edge pixels. This module alone consumes 7327 LUTs (13.77%), 4410 flip-flops (4.14%), and all 20 DSPs (9.09%) allocated to the design, reflecting the arithmetic intensity of its pipelined inner loop that evaluates up to 800 pixels per individual per generation. The remaining 11 DSPs at the top level of Genetic are used for address and index computations in the population management logic.
Overall, the Genetic IP core totals 19,216 LUTs (36.12%), 11,895 flip-flops (11.18%), 31 DSPs (14.09%), and 187 BRAMs (66.00%). The primary contributor to the high BRAM usage is the edge index buffer (128 BRAMs), which caches up to 65,536 pixel binary values for single-cycle random access during fitness evaluation, and by the image buffer (32 BRAMs), which stores the edge-pixel coordinate array. The remaining LUT and DSP headroom confirms that the IP core can be integrated alongside the AXI memory interconnect and processing system within a single Zynq 7000 device without resource contention.
The Vitis HLS synthesis report, Table 11, provides a worst-case latency estimate of 3.054 ms per generation, computed under the assumption that all 128 individuals are evaluated against the maximum of 800 edge pixels each. However, this represents the most pessimistic scenario: during the fitness evaluation, the projected parabola points are computed from the four parameters and tested against the edge-pixel map; if a projected point falls outside the image boundaries, it is discarded and does not contribute to the inlier count. Consequently, individuals whose parabola parameters place a significant portion of the curve outside the image dimensions result in fewer valid pixel evaluations, reducing the computing time.
Table 11.
Latency per module of the Genetic IP core (clock period = 10 ns, 100 MHz).
This behavior is consistent with the measured hardware execution time of 2.979 ms, which is 2.44% below the HLS estimate, corresponding to an effective average of approximately 385 valid pixels per individual across the test dataset. The difference of 0.075 ms (7444 cycles) between the theoretical and measured values thus reflects the average number of out-of-bounds projections discarded per generation, confirming that the HLS worst-case bound is tight and that boundary clipping is a minor but measurable factor in the runtime of the fitness evaluation stage.
3.7. Comparison with Similar Works
It is worth noting that several other approaches have been proposed in the literature to address the parabola detection problem. For instance, methods based on matched filtering [33], genetic-based inverse voting Hough transforms [22], edge-gradient dimensionality reduction [34], and specialized discretization schemes for open conics [35] have been extensively explored. However, these works primarily focus on theoretical algorithmic optimization—such as reducing memory storage, avoiding the traditional complexity of the Hough transform, or analyzing parameter discretization—and do not report quantitative, replicable execution times. Consequently, the quantitative performance comparison in this study is strictly based on the EDA-based method [1], Randomized Sampled Consensus (RANSAC), Hough transform, and MIPAV, which provide the most direct, comprehensive, and measurable baseline for execution time across both synthetic and real images.
Table 12 presents a performance and methodological comparison between the proposed hardware architecture and the software-based methods reported by Guerrero-Turrubiates et al. [1], namely the Hough transform, MIPAV, RANSAC, and the Estimation of Distribution Algorithm (EDA/UMDA). It is important to note that these results should be regarded as indicative rather than as a strict head-to-head benchmark. Beyond execution time, the table also highlights a fundamental difference in problem dimensionality: all baseline methods operate in a 3-dimensional axis-aligned parameter space , whereas the proposed FPGA architecture searches the full 4-dimensional space , enabling the detection of arbitrarily rotated parabolas that the software baselines cannot represent.
Table 12.
Performance and Methodological Comparison with State-of-the-Art Parabola Detection.
When compared against the non-evolutionary baselines on synthetic images, the proposed FPGA implementation (13.08 s for 5000 generations) is faster than MIPAV (37.68 s) by a factor of , and faster than RANSAC (16.35 s) by a factor of , while solving a strictly harder, higher-dimensional problem on a resource-constrained embedded platform. The Hough transform reports a per-pixel time of 8.82 s/px, a metric that is not directly comparable to total execution time; however, for any image of non-trivial size, the accumulated cost renders it computationally prohibitive. Although the software approach via UMDA reports lower total execution times on synthetic images (1.41 s to 3.59 s), this advantage does not reflect an equivalent computational problem: it stems from the combined effect of the high sequential clock frequencies of CPUs and the evaluation of a geometrically simpler, lower-dimensional model on a platform with more resources than a System-on-Chip (SoC) FPGA.
The EDA method relies on a point-based sampling strategy in which three random edge pixels are selected to analytically solve for the parabola parameters. From a mathematical standpoint, three coplanar points uniquely determine an axis-aligned parabola but are insufficient to recover the rotation angle of a generic rotated conic, effectively constraining the search to a 3-dimensional parameter space . A direct consequence of this formulation is that a significant fraction of the generated candidates are geometrically invalid, because the parameters are derived from random triplets of pixels rather than constrained within the image domain, the resulting vertex coordinates or curve trajectory frequently fall entirely outside the image boundaries. These invalid candidates consume evaluation resources without contributing useful information to the search, and their frequency varies with image content, a factor that likely contributes to the large execution time variability observed across images (with a time range of 4.4 times, from 1.41 s to 6.18 s).
Notably, for the retinal fundus image dataset, the proposed FPGA architecture achieves a total processing time of approximately 2.6175 s (using 1000 generations), which is faster than the UMDA baseline of 4.5838 s on the same image type. This result is particularly relevant because retinal images represent the only common real-image benchmark reported by Guerrero-Turrubiates et al., providing a direct and equivalent comparison point. The proposed system thus not only matches the application domain of the software EDA on real medical images, but surpasses it in total execution time while simultaneously solving a harder detection problem with an additional degree of freedom and guaranteeing that every evaluated individual encodes a valid parabolic curve in the image.
In contrast, the proposed Genetic Algorithm IP core operates in the full 4-dimensional parameter space , enabling the detection of arbitrarily rotated parabolas. Crucially, the chromosome parameters are bounded and defined directly within the image coordinate system, so every generated individual encodes a valid parabolic curve that exists within the image boundaries. This geometric guarantee eliminates wasted evaluations and ensures that the full computational budget is devoted to meaningful candidates. Instead of fragile point-to-point analytical solutions, fitness is assessed globally by projecting the encoded curve onto the binary edge image and counting inlier pixels, providing inherent robustness against noise, partial occlusion, and edge discontinuities.
From a timing perspective, the key distinction between the two approaches is not raw speed, but temporal determinism and platform suitability. The FPGA implementation runs on a Zynq 7000 SoC, a resource-constrained embedded device whose programmable logic operates at 100 MHz, far below the multi-GHz clock rates of the CPUs used in the software baseline. Despite this clock frequency disadvantage, the hardware architecture delivers a strictly constant per-generation latency of 2.979 ms regardless of image content, yielding a fixed total processing time of approximately 13.08 s for a workload of 5000 generations. The software EDA, running on a far more powerful platform, exhibits execution times that vary by a factor of 4.4 times across images, a variability that is inconsistent with embedded and real-time applications requiring bounded, predictable response times. The proposed architecture thus solves a harder geometric problem, on a more constrained platform, with strictly deterministic timing, a combination that the software baseline cannot provide.
4. Conclusions
This work, to the best of our knowledge, presents the first deterministic embedded FPGA prototype for an FPGA IP core that implements a genetic algorithm to detect rotated parabolas in images on an embedded SoC platform. The proposed architecture was validated on 640 × 480 binary edge images, achieving mean accuracies of 98.47 and 95.23% and a success rate of up to 96% on synthetic images, as well as qualitatively consistent convergence on real images, where the absence of annotated ground truth precludes quantitative accuracy claims. Tests with salt-and-pepper noise and a comparative analysis against related works confirmed the robustness and competitiveness of the implementation, while the measured resource consumption still leaves room to extend the design to the target FPGA. Regarding the genetic parameters, we found that crossover and mutation values of 0.9 and 0.8, respectively, were crucial for the GA to converge on the best solution. The most challenging parameter in our experience was the aperture parameter a, as the best individuals tended to fit only half of the parabolic shape. With these values, the proposed architecture demonstrated consistent convergence toward valid parabolic solutions across all tested images, confirming the feasibility of the design as a deterministic embedded FPGA IP core prototype for rotated parabola detection in the full four-dimensional parameter space . The FPGA IP-core delivers a strictly deterministic per generation latency of 2.979 ms; for 5000 generations, the total system execution time comprising DMA image transfer and hardware GA execution on the programmable logic at 100 MHz, with image pre-processing performed offline on an external CPU and not included in this boundary, is approximately 13.08 s. While the current resource consumption still leaves room to extend the design to the target FPGA, this reflects the constraints of the SoC platform rather than a fundamental algorithmic limitation. Future work will focus on developing a native software-based implementation to enable a fair hardware-acceleration comparison, on timing optimization toward real-time operation, and on extending the model to multi-parabola detection and other conic sections such as hyperbolas.
Author Contributions
Conceptualization, F.J.I.-L., L.d.C.C.-V. and H.R.-G.; Methodology, F.J.I.-L., V.F.-P. and L.d.C.C.-V.; Software, F.J.I.-L.; Validation, F.J.I.-L. and L.d.C.C.-V.; Formal analysis, F.J.I.-L., V.F.-P., L.d.C.C.-V. and H.R.-G.; Investigation, F.J.I.-L., V.F.-P. and H.R.-G.; Resources, F.J.I.-L.; Data curation, F.J.I.-L., V.F.-P. and H.R.-G.; Writing—original draft, H.R.-G.; Writing—review and editing, F.J.I.-L.; Visualization, F.J.I.-L.; Supervision, F.J.I.-L.; Project administration, F.J.I.-L.; Funding acquisition, F.J.I.-L. All authors have read and agreed to the published version of the manuscript.
Funding
This research received no external funding.
Data Availability Statement
The original contributions presented in this study are included in the article. Further inquiries can be directed to the corresponding author.
Conflicts of Interest
The authors declare no conflicts of interest.
References
- Guerrero-Turrubiates, J.d.J.; Cruz-Aceves, I.; Ledesma, S.; Sierra-Hernandez, J.M.; Velasco, J.; Avina-Cervantes, J.G.; Avila-Garcia, M.S.; Rostro-Gonzalez, H.; Rojas-Laguna, R. Fast Parabola Detection Using Estimation of Distribution Algorithms. Comput. Math. Methods Med. 2017, 2017, 6494390. [Google Scholar] [CrossRef] [Scilit] [PubMed]
- Mukhopadhyay, P.; Chaudhuri, B.B. A survey of Hough Transform. Pattern Recognit. 2015, 48, 993–1010. [Google Scholar] [CrossRef] [Scilit]
- Duda, R.O.; Hart, P.E. Use of the Hough transformation to detect lines and curves in pictures. Commun. ACM 1972, 15, 11–15. [Google Scholar] [CrossRef] [Scilit]
- Ballard, D. Generalizing the Hough transform to detect arbitrary shapes. Pattern Recognit. 1981, 13, 111–122. [Google Scholar] [CrossRef] [Scilit]
- Fischler, M.A.; Bolles, R.C. Random Sample Consensus: A Paradigm for Model Fitting with Applications to Image Analysis and Automated Cartography. In Readings in Computer Vision; Fischler, M.A., Firschein, O., Eds.; Morgan Kaufmann: San Francisco, CA, USA, 1987; pp. 726–740. [Google Scholar] [CrossRef] [Scilit]
- Ayala-Ramirez, V.; Garcia-Capulin, C.H.; Perez-Garcia, A.; Sanchez-Yanez, R.E. Circle detection on images using genetic algorithms. Pattern Recognit. Lett. 2006, 27, 652–657. [Google Scholar] [CrossRef] [Scilit]
- Cuevas, E.; Ortega-Sánchez, N.; Zaldivar, D.; Pérez-Cisneros, M. Circle detection by Harmony search optimization. J. Intell. Robot. Syst. 2012, 66, 359–376. [Google Scholar]
- Cruz-Aceves, I.; Hernandez-Aguirre, A.; Valdez, S.I. On the performance of nature inspired algorithms for the automatic segmentation of coronary arteries using Gaussian matched filters. Appl. Soft Comput. 2016, 46, 665–676. [Google Scholar] [CrossRef] [Scilit]
- Scitovski, R.; Sabo, K.; Nikić, P.; Majstorović, S. A new efficient method for solving the multiple ellipse detection problem. Expert Syst. Appl. 2023, 222, 119853. [Google Scholar] [CrossRef] [Scilit]
- Xu, G.; Wang, Y.; Chen, F.; Shen, H.; Li, X. Accurate and Robust Three-Intersection-Chord-Invariant Ellipse Detection. IEEE Trans. Image Process. 2025, 34, 2392–2407. [Google Scholar] [CrossRef] [Scilit] [PubMed]
- Hauschild, M.; Pelikan, M. An introduction and survey of estimation of distribution algorithms. Swarm Evol. Comput. 2011, 1, 111–128. [Google Scholar] [CrossRef] [Scilit]
- Mühlenbein, H.; Paaß, G. From recombination of genes to the estimation of distributions I. Binary parameters. In Proceedings of the Parallel Problem Solving from Nature—PPSN IV; Voigt, H.M., Ebeling, W., Rechenberg, I., Schwefel, H.P., Eds.; Springer: Berlin/Heidelberg, Germany, 1996; pp. 178–187. [Google Scholar]
- Deliparaschos, K.M.; Oliva, G. FPGA-Accelerated-Greedy Ant Colony Optimisation for Maritime Bearings-Only Nonlinear Target Motion Analysis. IEEE Access 2025, 13, 190027–190039. [Google Scholar] [CrossRef] [Scilit]
- Rojas-Muñoz, L.F.; Sánchez-Solano, S.; García-Capulín, C.H.; Rostro-González, H. Embedded system implementation of an evolutionary algorithm for circle detection on programmable devices. Comput. Electr. Eng. 2022, 99, 107714. [Google Scholar] [CrossRef] [Scilit]
- Iñiguez-Lomeli, F.J.; Garcia-Capulin, C.H.; Rostro-Gonzalez, H. A hardware architecture for single and multiple ellipse detection using genetic algorithms and high-level synthesis tools. Microprocess. Microsyst. 2024, 111, 105106. [Google Scholar] [CrossRef] [Scilit]
- Zeng, K.; Ma, Q.; Wu, J.W.; Chen, Z.; Shen, T.; Yan, C. FPGA-based accelerator for object detection: A comprehensive survey. J. Supercomput. 2022, 78, 14096–14136. [Google Scholar] [CrossRef] [Scilit]
- Martelli, S.; Marzotto, R.; Colombari, A.; Murino, V. FPGA-based robust ellipse estimation for circular road sign detection. In Proceedings of the 2010 IEEE Computer Society Conference on Computer Vision and Pattern Recognition-Workshops, San Francisco, CA, USA, 13–18 June 2010; pp. 53–60. [Google Scholar] [CrossRef] [Scilit]
- Dohi, K.; Hatanaka, Y.; Negi, K.; Shibata, Y.; Oguri, K. Deep-pipelined FPGA implementation of ellipse estimation for eye tracking. In Proceedings of the 22nd International Conference on Field Programmable Logic and Applications (FPL), Oslo, Norway, 29–31 August 2012; pp. 458–463. [Google Scholar] [CrossRef] [Scilit]
- Ayachi, R.; Afif, M.; Said, Y.; Abdelali, A.B. Traffic Sign Detection for Green Smart Public Transportation Vehicles Based on Light Neural Network Model. In Computational Intelligence Techniques for Green Smart Cities; Lahby, M., Al-Fuqaha, A., Maleh, Y., Eds.; Springer International Publishing: Cham, Switzerland, 2022; pp. 95–106. [Google Scholar] [CrossRef] [Scilit]
- Oloumi, F.; Rangayyan, R.M. Detection of the temporal arcade in fundus images of the retina using the hough transform. In Proceedings of the 2009 Annual International Conference of the IEEE Engineering in Medicine and Biology Society, Minneapolis, MN, USA, 3–6 September 2009; pp. 3585–3588. [Google Scholar] [CrossRef] [Scilit] [PubMed]
- Oloumi, F.; Rangayyan, R.M.; Ells, A.L. Parametric representation of the retinal temporal arcade. In Proceedings of the 10th IEEE International Conference on Information Technology and Applications in Biomedicine, Corfu, Greece, 3–5 November 2010; pp. 1–4. [Google Scholar] [CrossRef] [Scilit]
- Maalmi, K.; El Ouaazizi, A.; Benslimane, R.; Lew Yan Voon, L.; Diou, A.; Gorria, P. Detecting parabolas in ultrasound B-scan images with Genetic-Based Inverse Voting Hough Transform. In Proceedings of the 2002 IEEE International Conference on Acoustics, Speech, and Signal Processing, Orlando, FL, USA, 13–17 May 2002; Volume 4, pp. IV-3337–IV-3340. [Google Scholar] [CrossRef] [Scilit]
- Zhang, S. Real Time Image Processing on FPGAs. Ph.D. Thesis, University of Liverpool, Liverpool, UK, 2018. [Google Scholar]
- Mansouri, A.E.; Youssef, H.B.; Saidi, L. Real-time object detection using Xilinx Zynq FPGA and tensor flow framework. Int. J. Res. Circuits Devices Syst. 2024, 5, 13–18. [Google Scholar] [CrossRef] [Scilit]
- Zhang, J.; Xiong, S.; Liu, C.; Geng, Y.; Xiong, W.; Cheng, S.; Hu, F. FPGA-Based Feature Extraction and Tracking Accelerator for Real-Time Visual SLAM. Sensors 2023, 23, 8035. [Google Scholar] [PubMed]
- Padua, B. Hybrid implementation of evolutionary algorithms in FPGAs for automatic generation of morphological image filters. Prz. Elektrotech. 2020, 1, 14–18. [Google Scholar] [CrossRef] [Scilit]
- Mazouz, A.; Le, D.H.; Nguyen, V.T. An FPGA compiler for on-the-fly adaptive CNN deployment and reconfiguration. arXiv 2025, arXiv:2504.08534. [Google Scholar] [CrossRef] [Scilit]
- Otsu, N. A Threshold Selection Method from Gray-Level Histograms. IEEE Trans. Syst. Man Cybern. 1979, 9, 62–66. [Google Scholar] [CrossRef] [Scilit]
- Wang, T. “Retinal Vessel”, Mendeley Data, V1. 2023. Available online: https://data.mendeley.com/datasets/frv89hjgrr/1 (accessed on 29 April 2026).
- Xie, S.; Tu, Z. Holistically-Nested Edge Detection. arXiv 2015, arXiv:1504.06375. [Google Scholar] [CrossRef] [Scilit]
- Balla, S. Deep Learning Based Edge Detection Using HED. 2021. Available online: https://github.com/bnsreenu/python_for_microscopists/tree/master/290-Deep%20Learning%20based%20edge%20detection%20using%20HED (accessed on 5 January 2026).
- DigitalSreeni. Deep Learning Based Edge Detection Using Holistically Nested Edge Detection (HED)—Video Tutorial. YouTube. 2021. Available online: https://www.youtube.com/watch?v=UIrvEG9Oj1s (accessed on 5 June 2026).
- Petcher, P.; Dixon, S. Parabola detection using matched filtering for ultrasound B-scans. Ultrasonics 2012, 52, 138–144. [Google Scholar] [CrossRef] [Scilit] [PubMed]
- Jafri, M.Z.M.; Deravi, F. Efficient algorithm for the detection of parabolic curves. In Proceedings of the Vision Geometry III; Melter, R.A., Wu, A.Y., Eds.; International Society for Optics and Photonics, SPIE: Bellingham, WA, USA, 1995; Volume 2356, pp. 53–61. [Google Scholar] [CrossRef] [Scilit]
- de Macedo, M.M.G.; Salas, J.; Conci, A. Hough Transform Voting Scheme for Detection of Parabolas and Open Conics in Images. In Proceedings of the ICGG 2020-Proceedings of the 19th International Conference on Geometry and Graphics; Cheng, L.Y., Ed.; Springer: Cham, Switzerland, 2021; pp. 407–418. [Google Scholar]
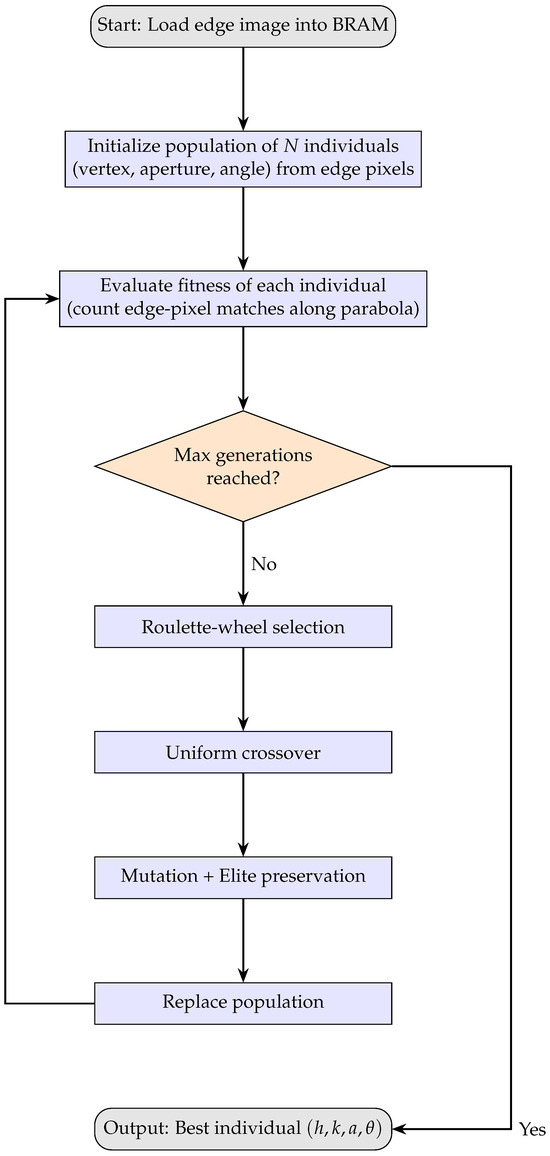
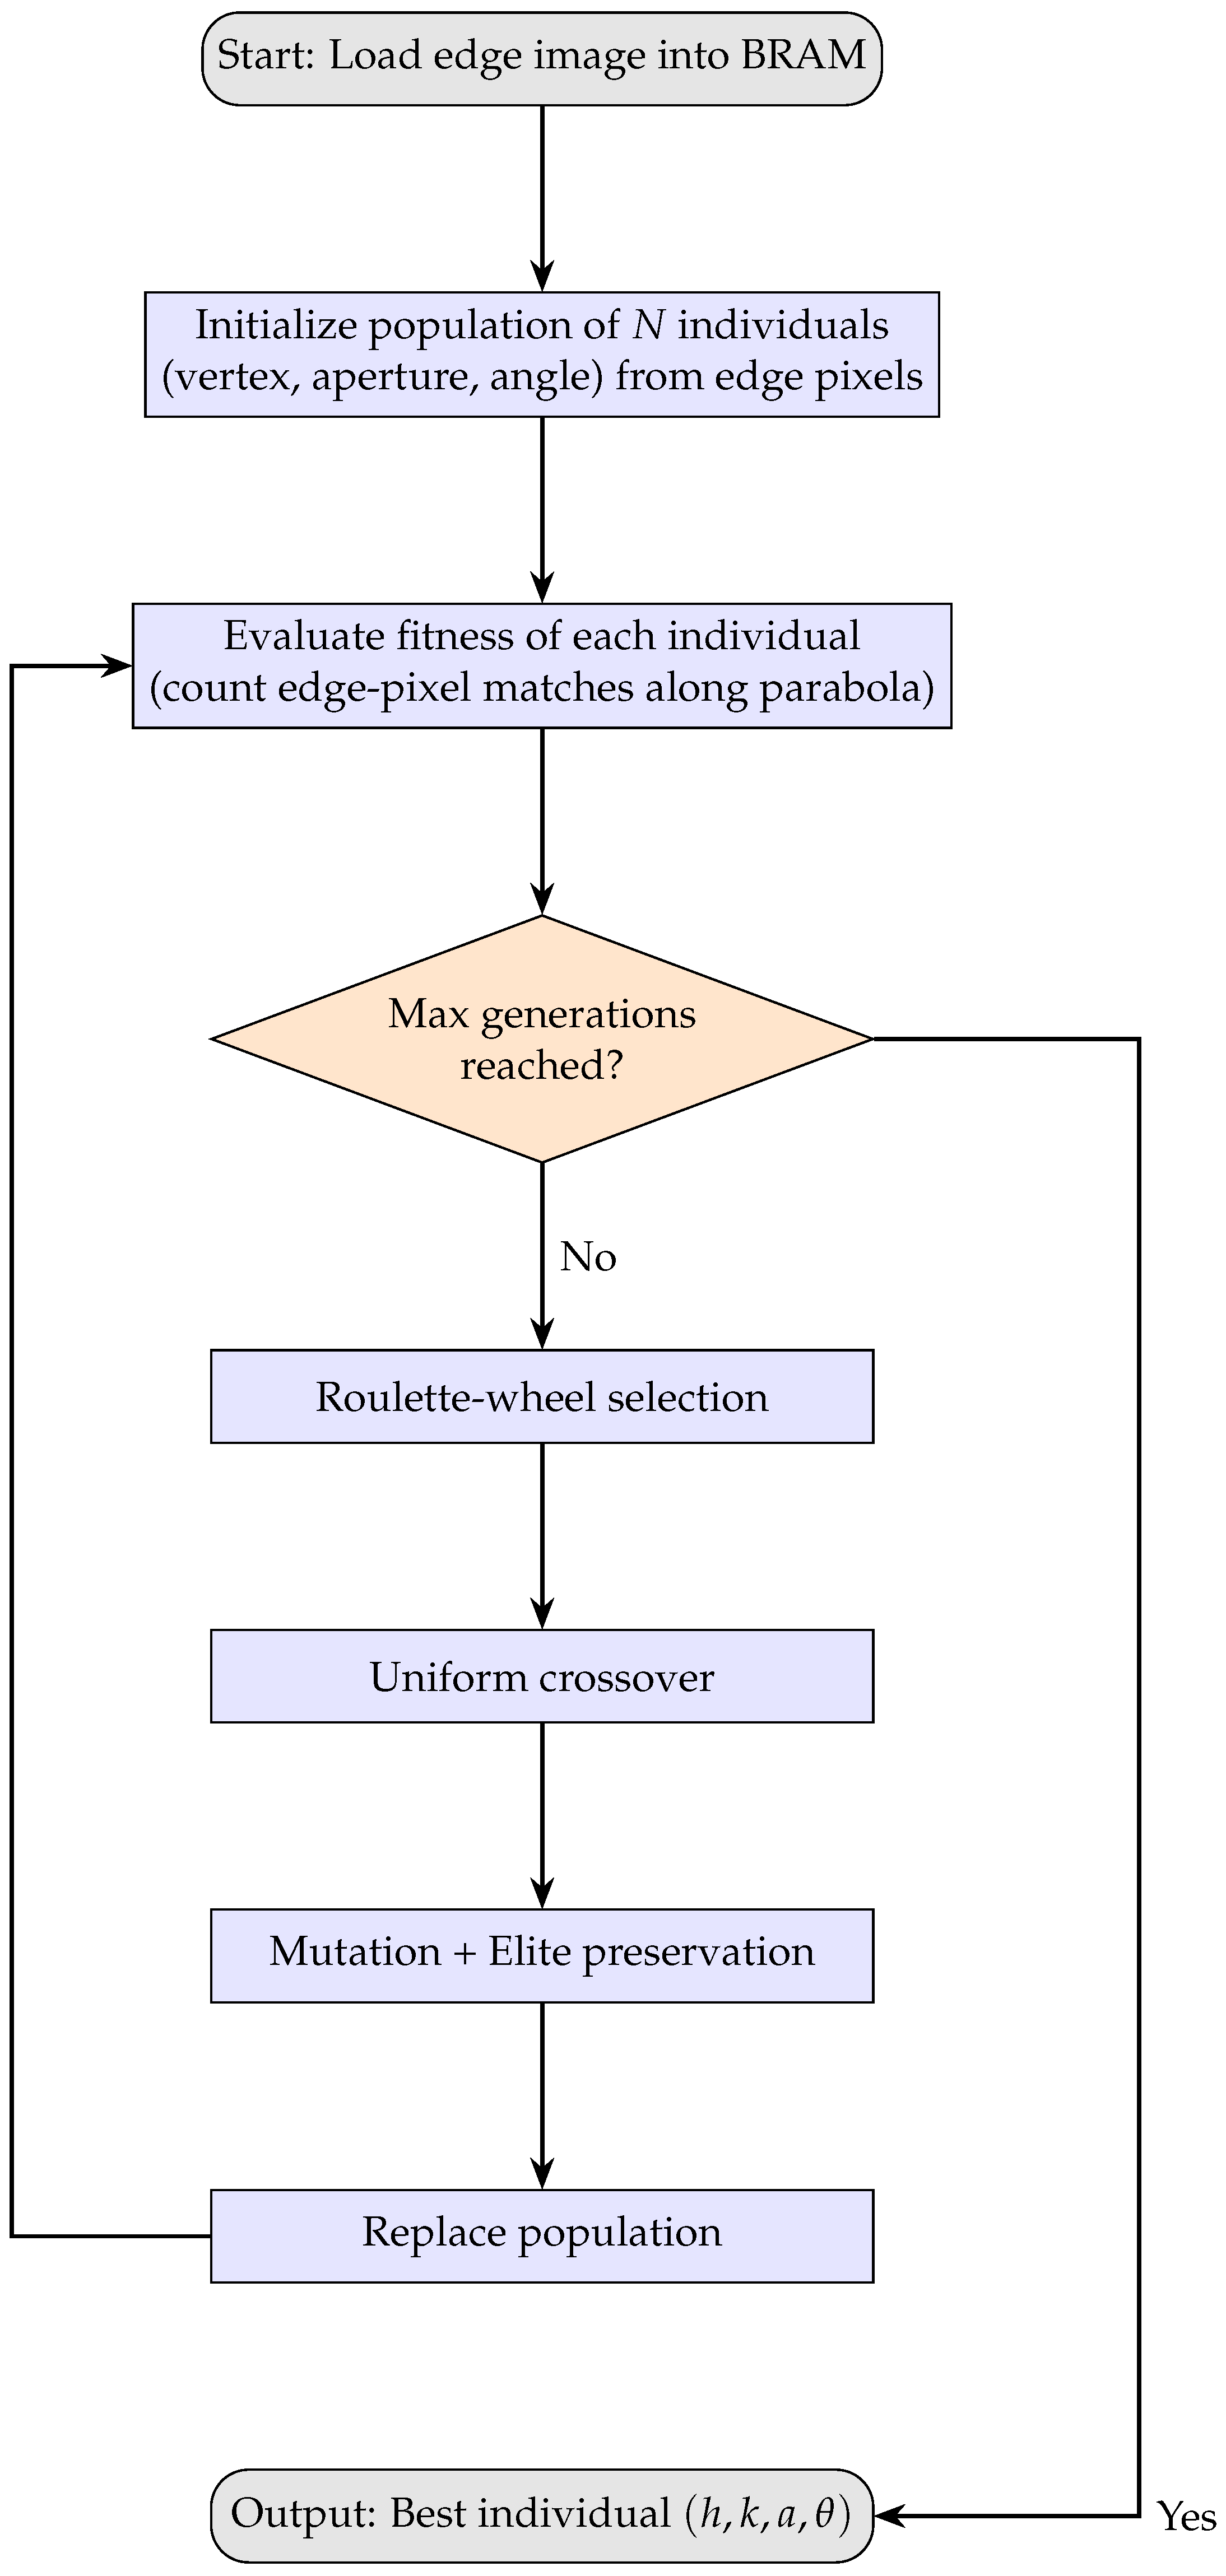
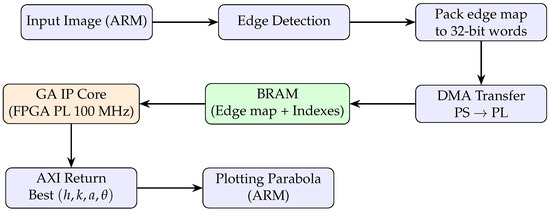
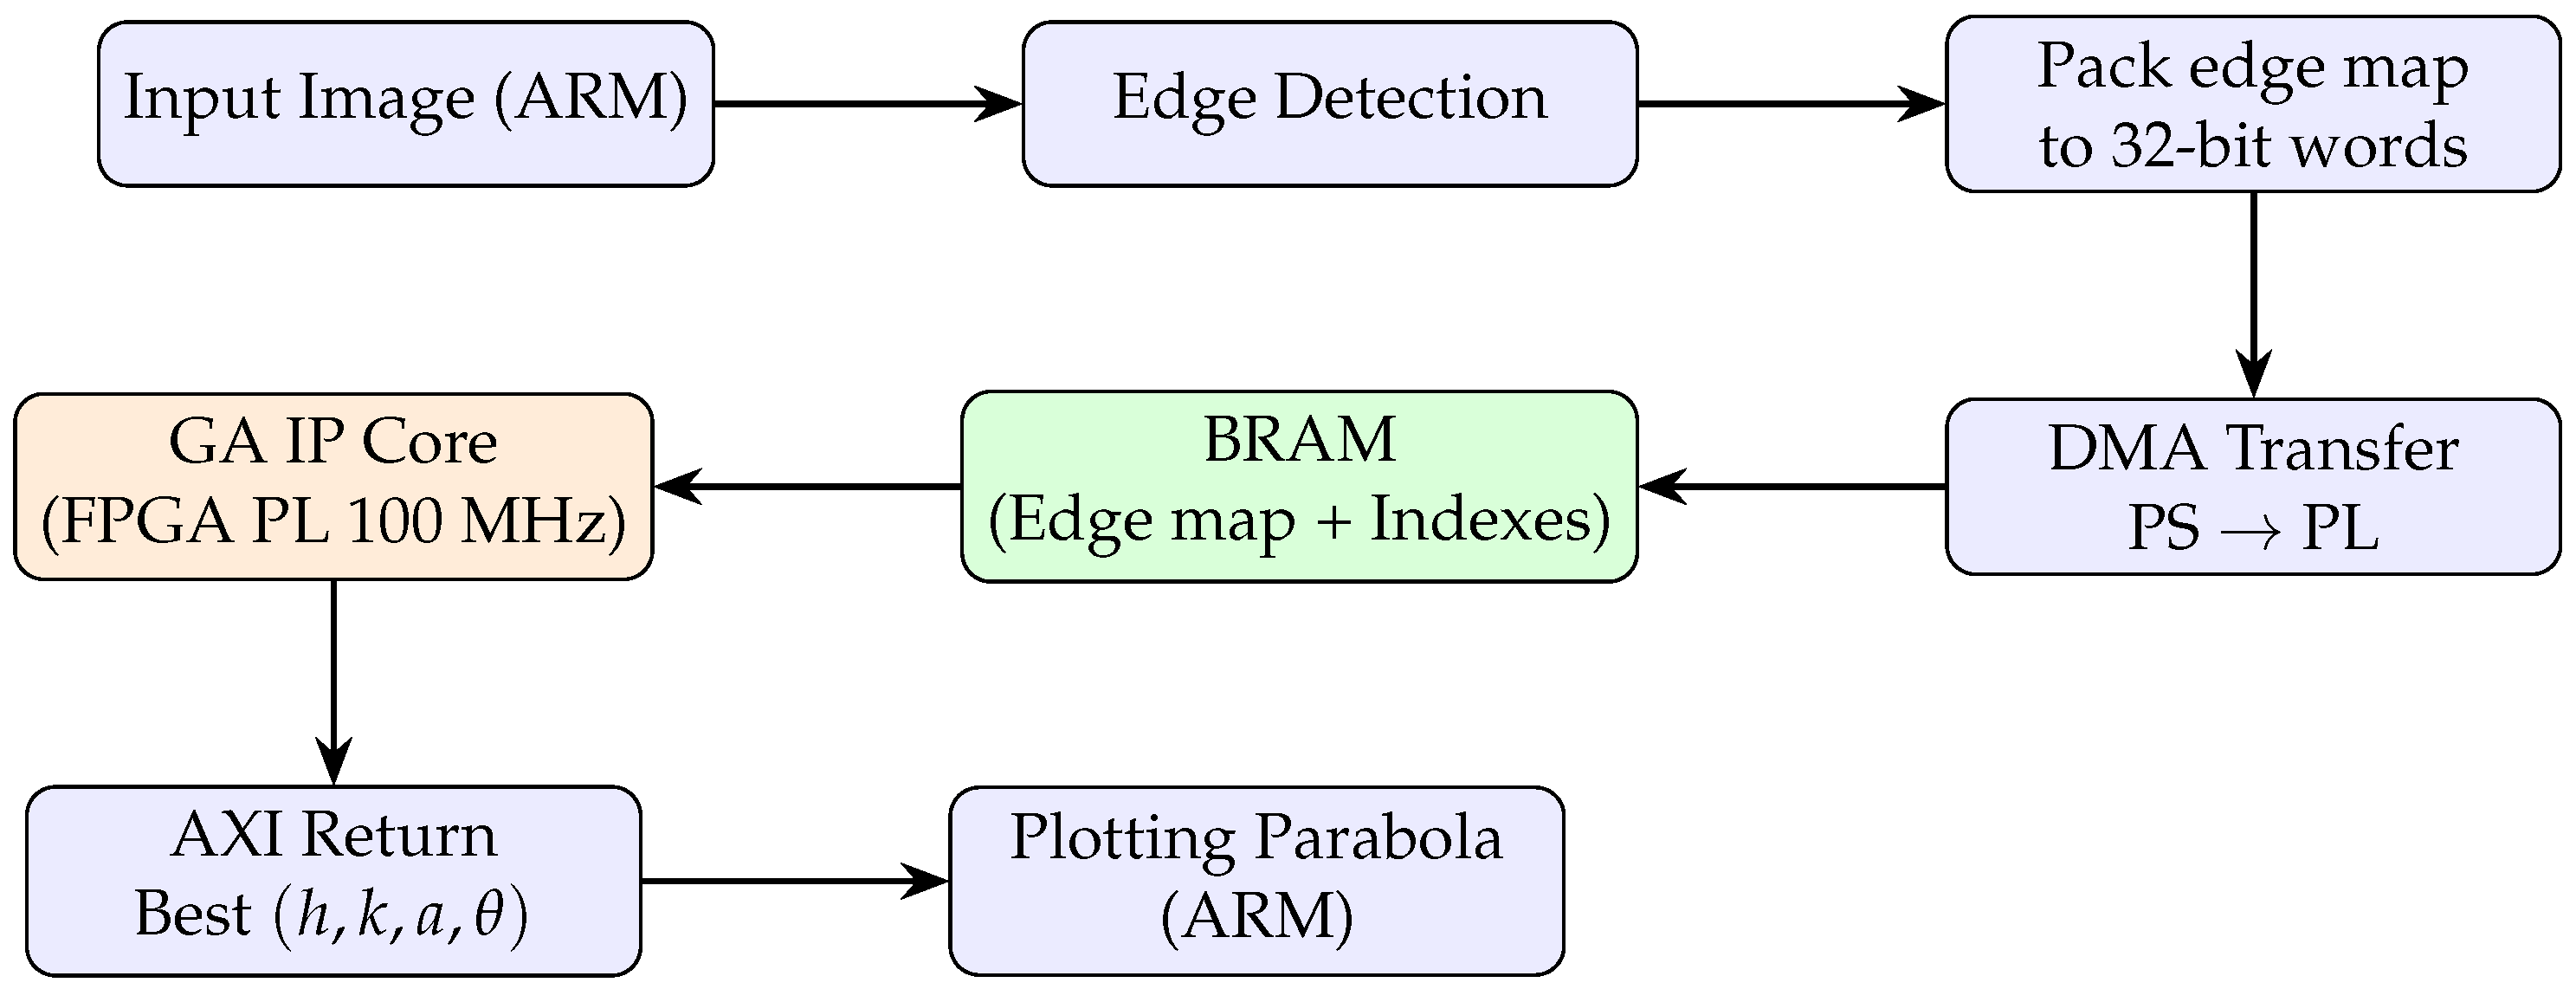
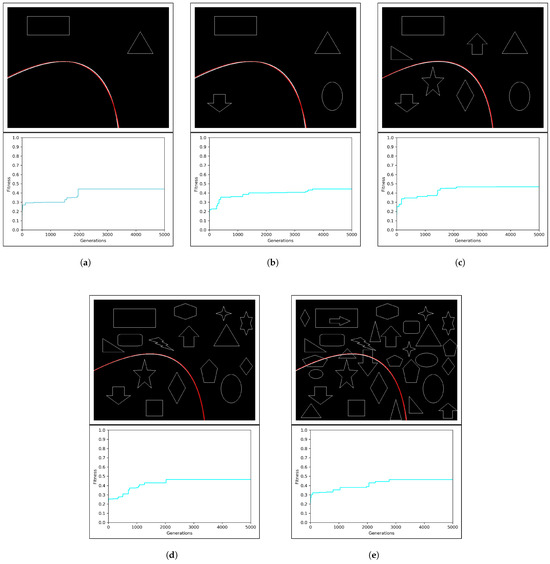
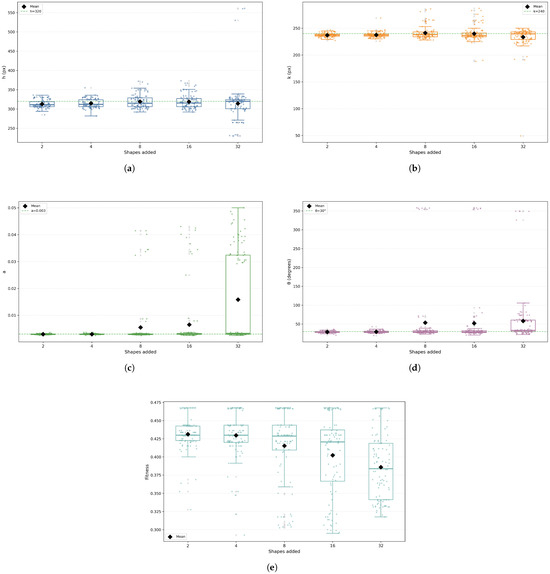
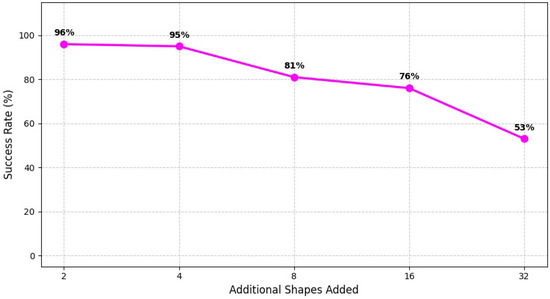
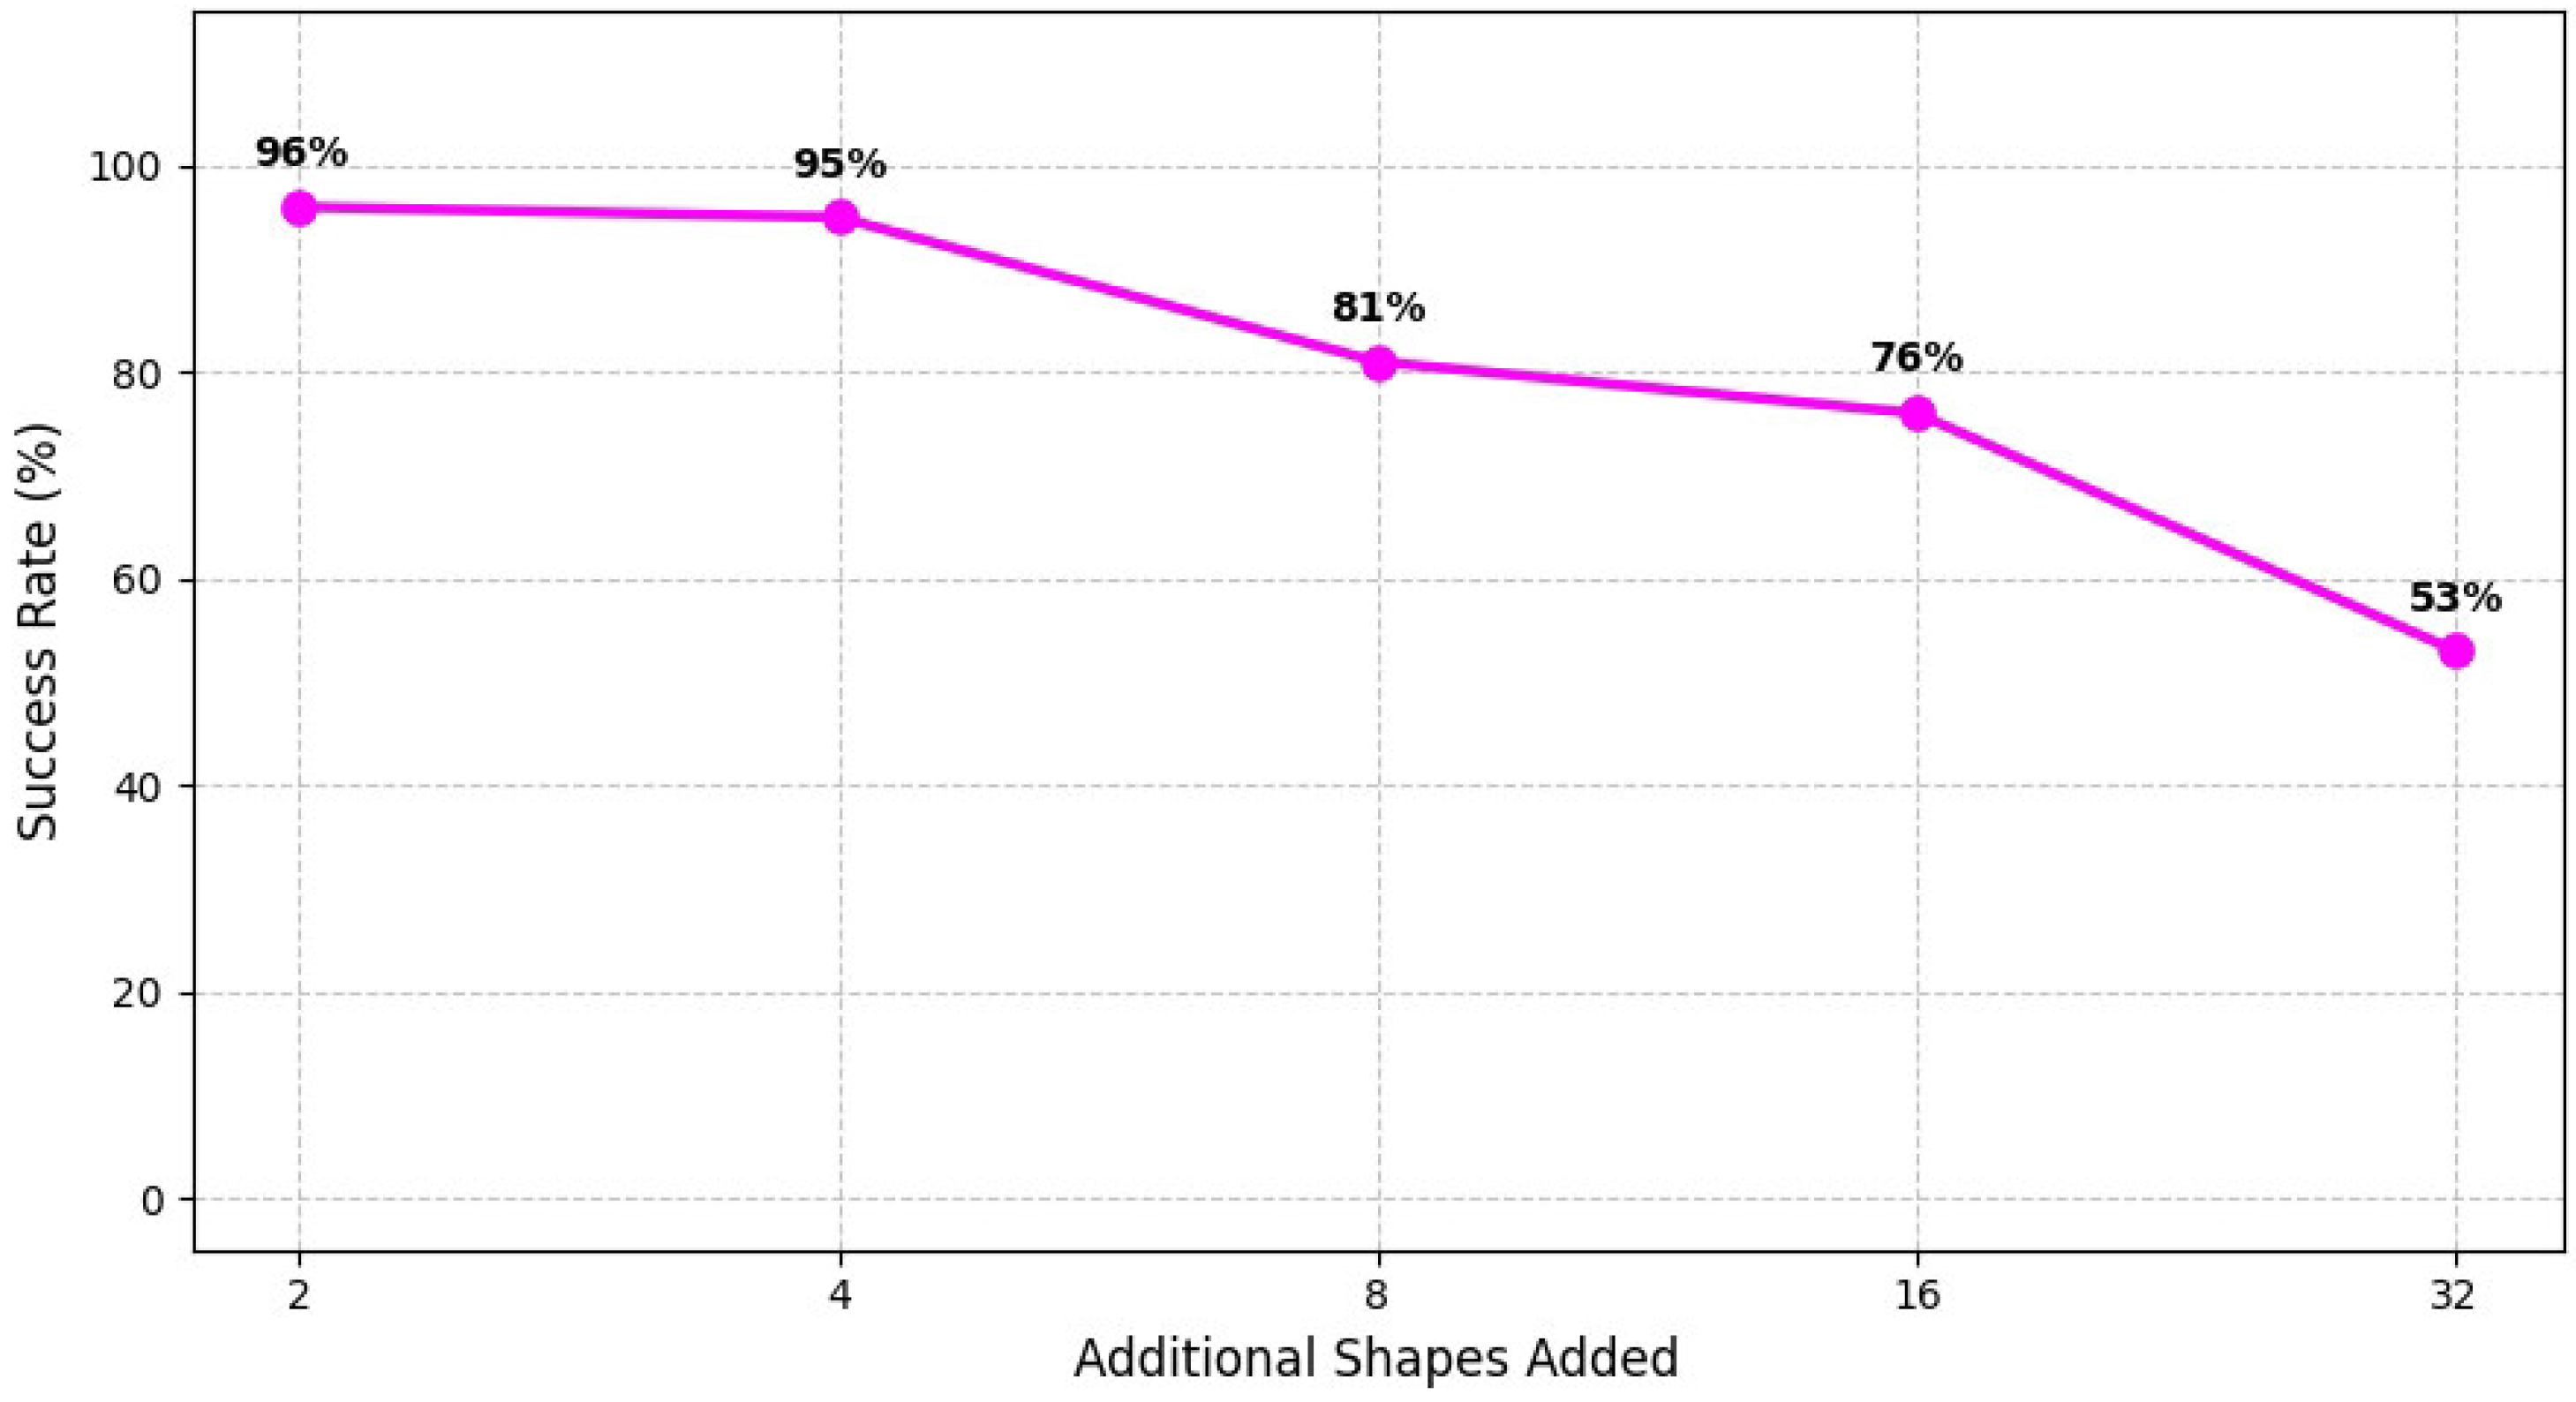
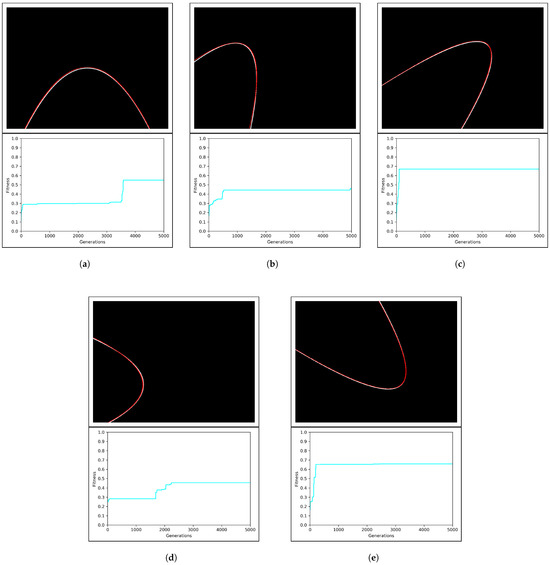
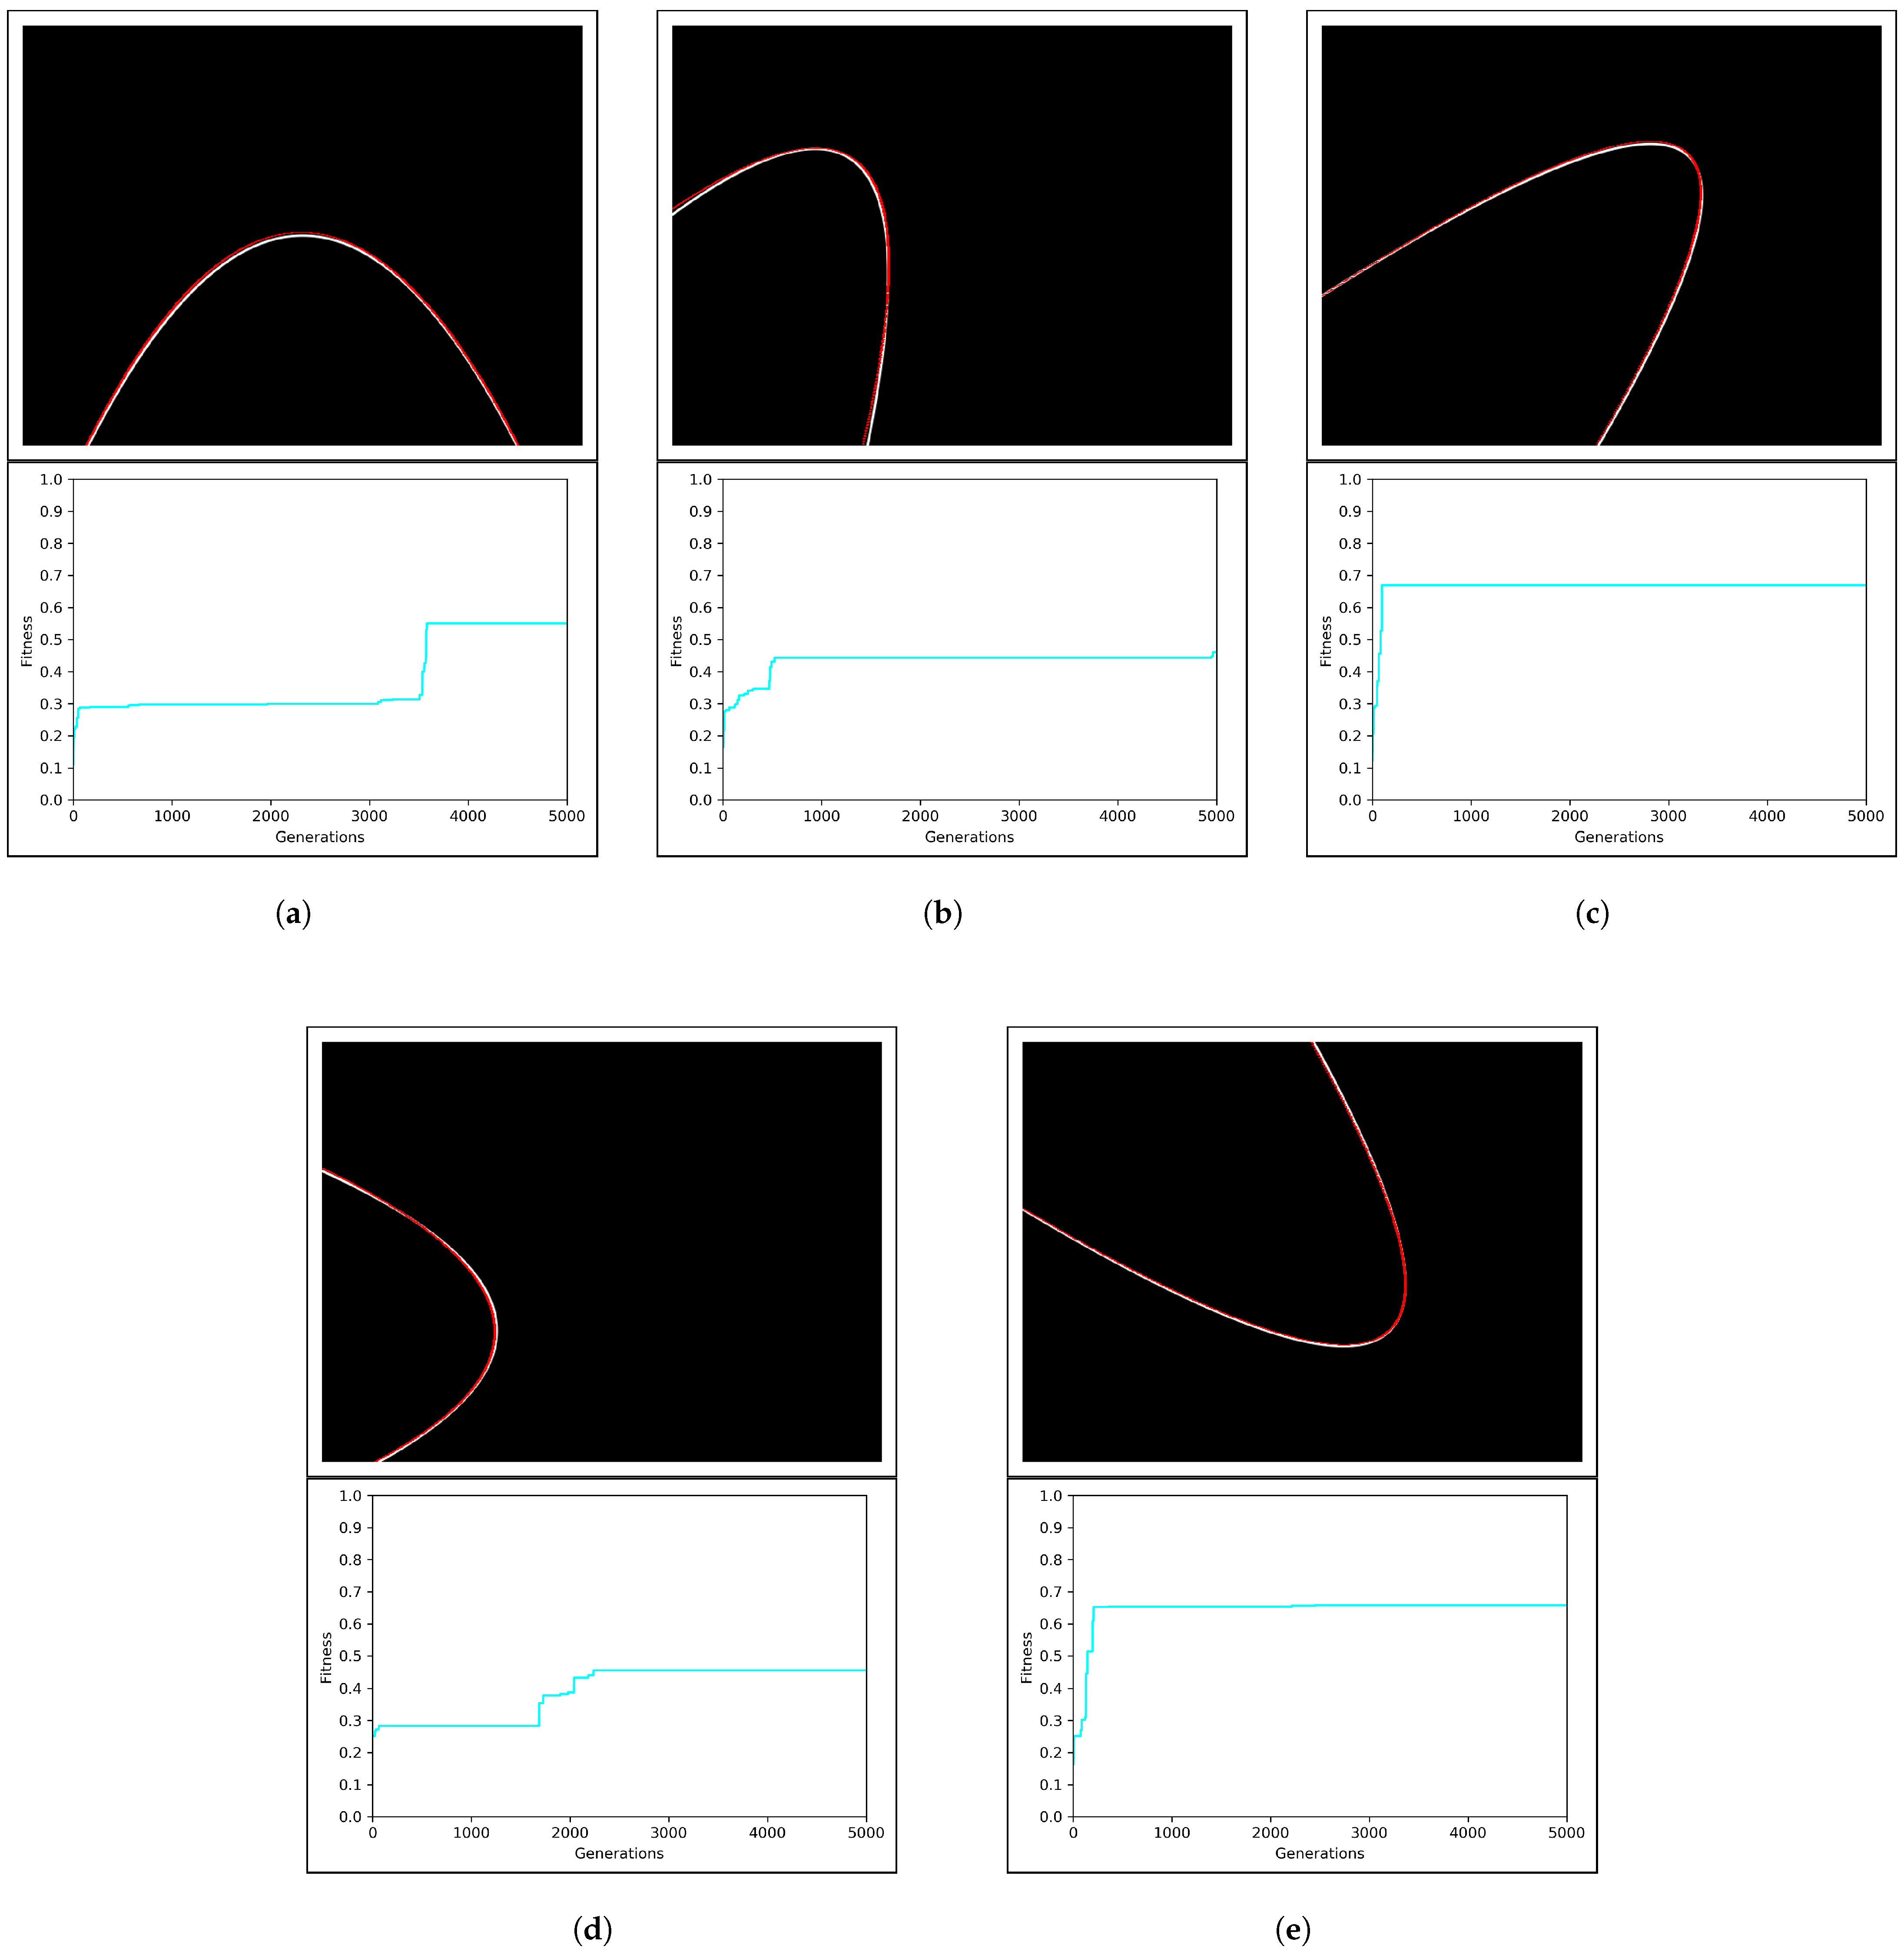
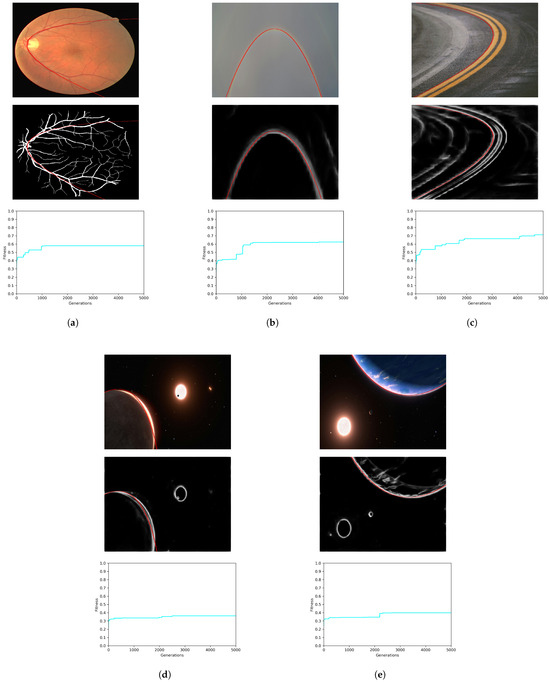
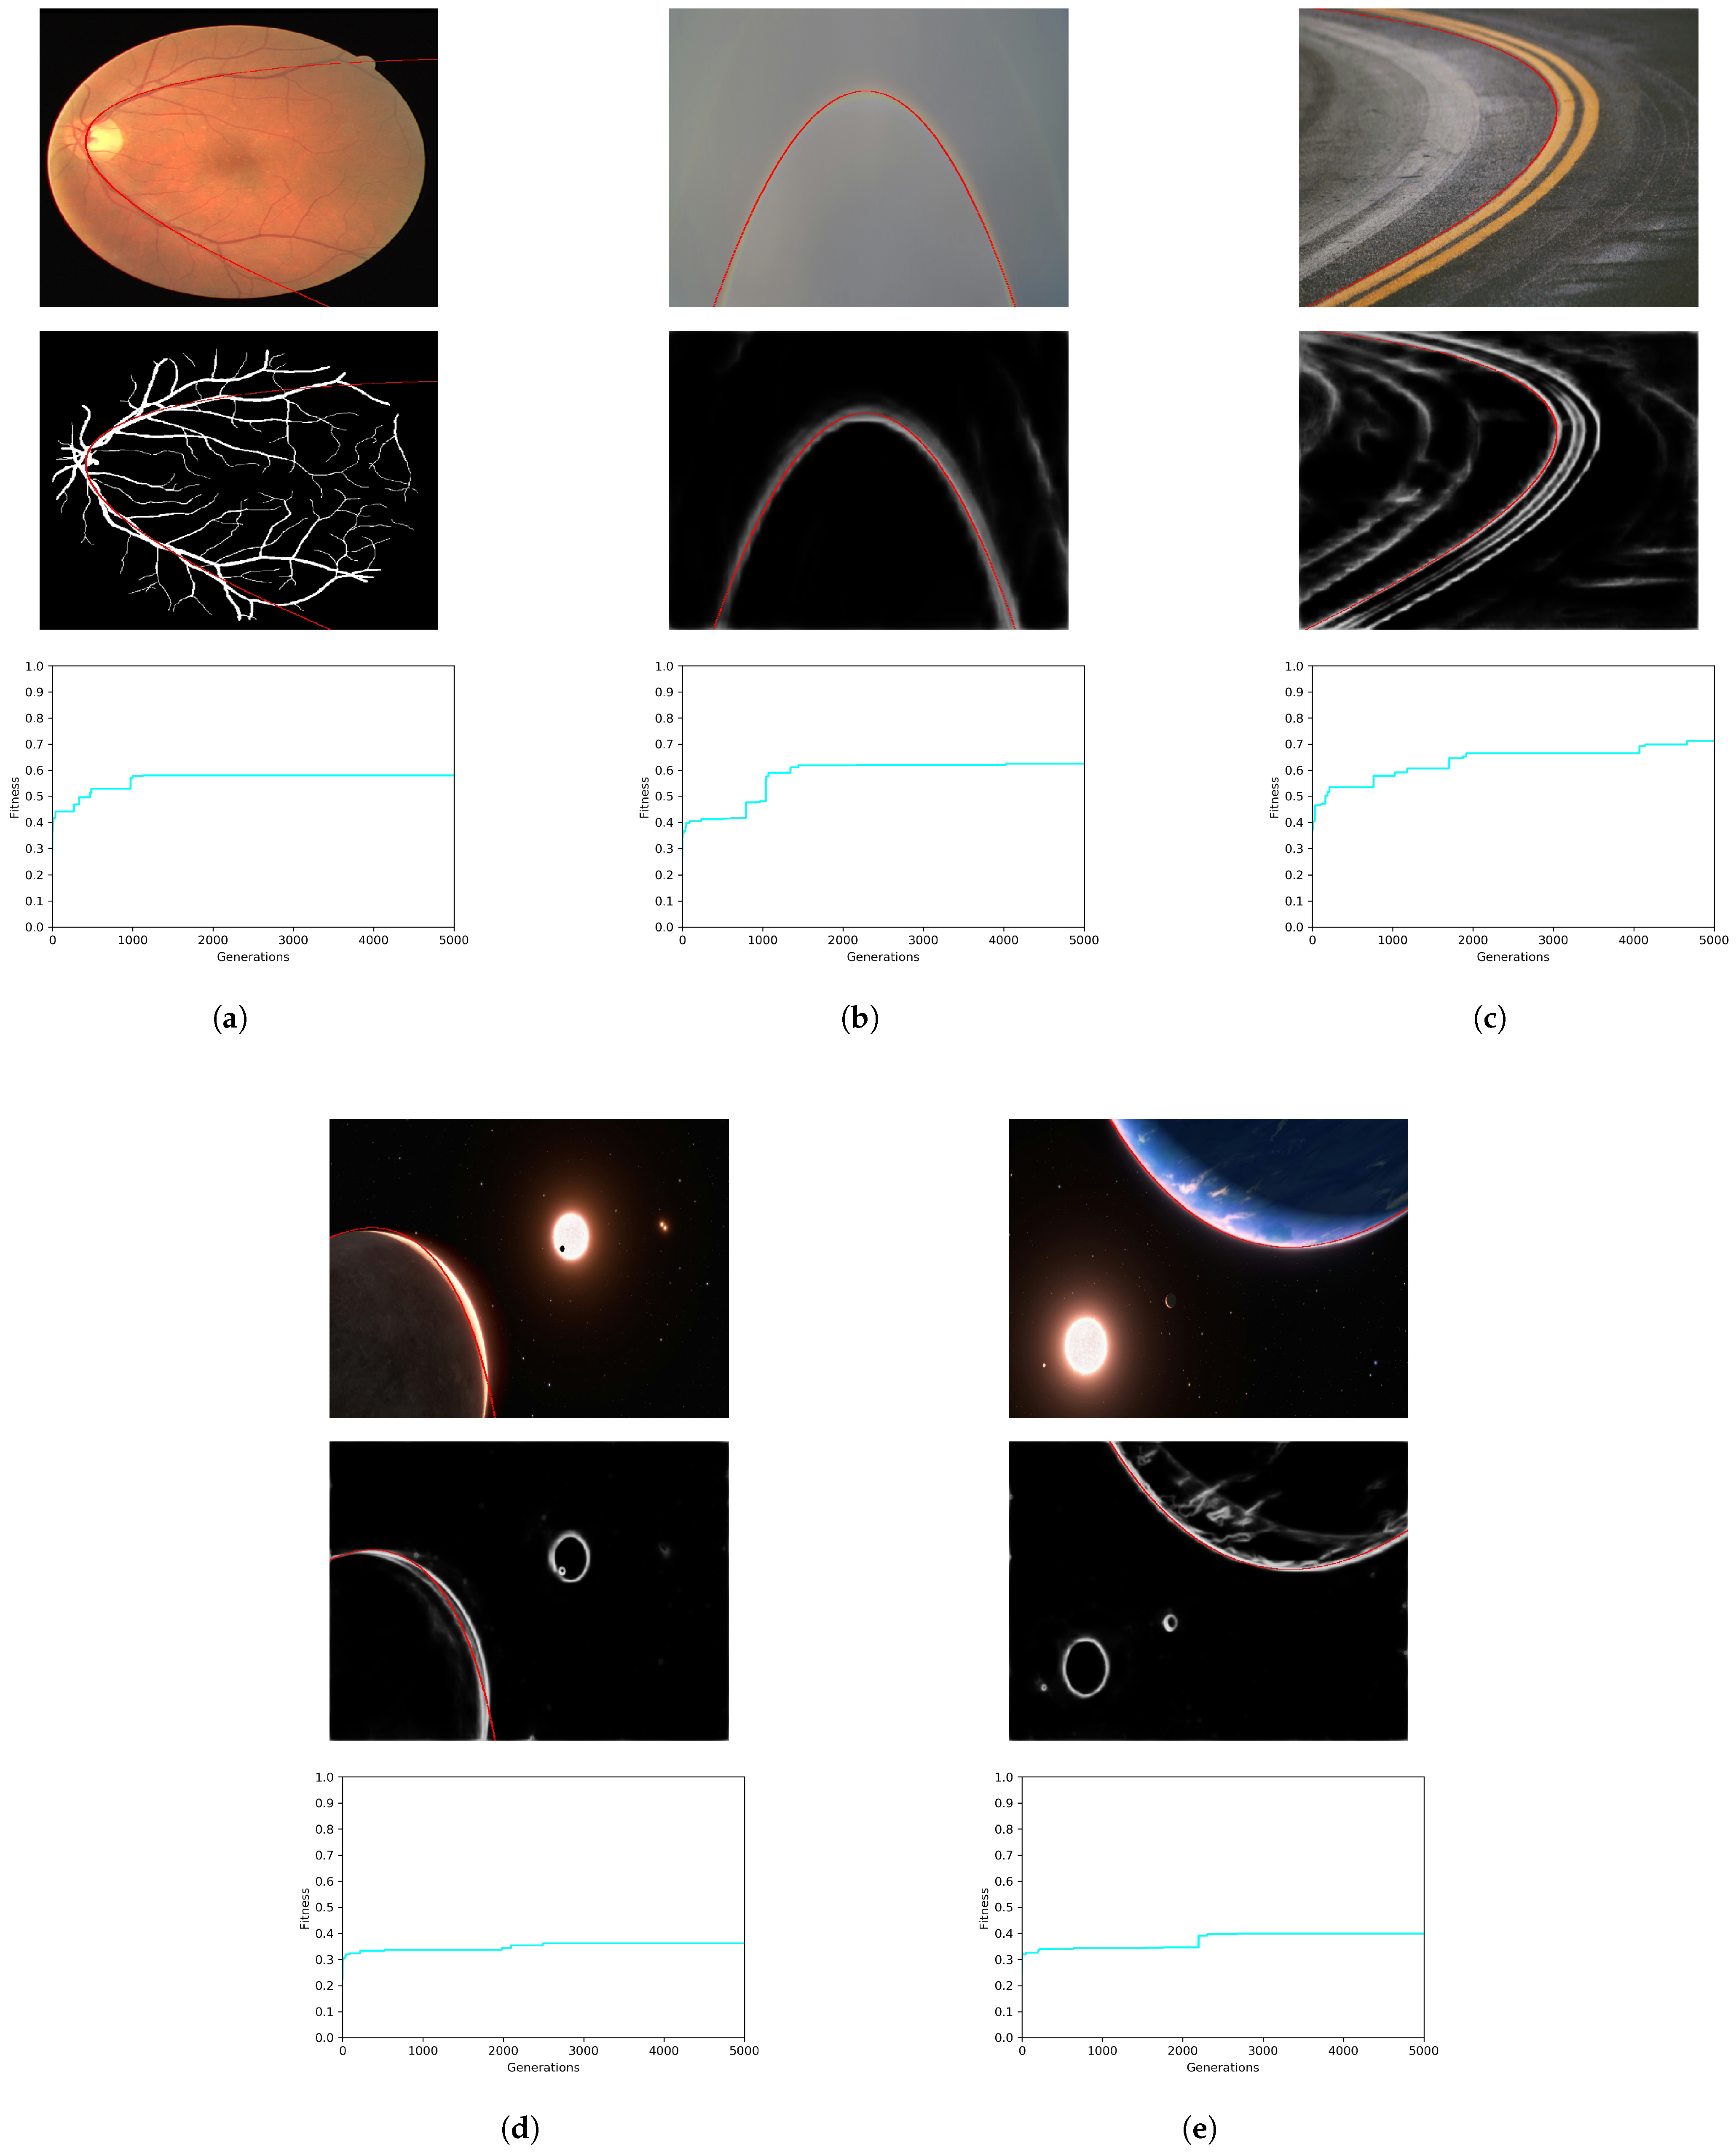
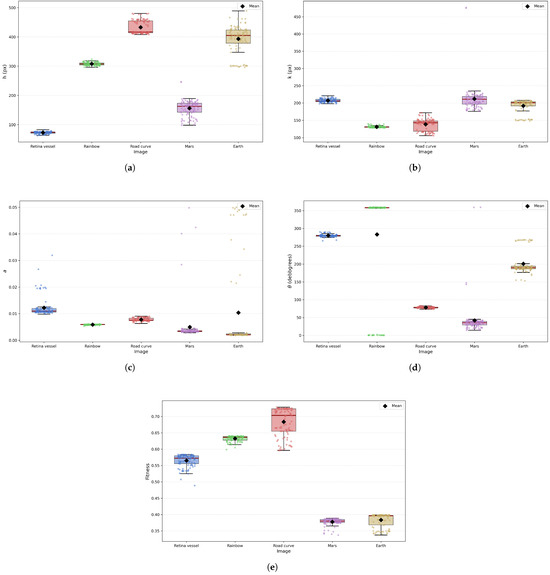
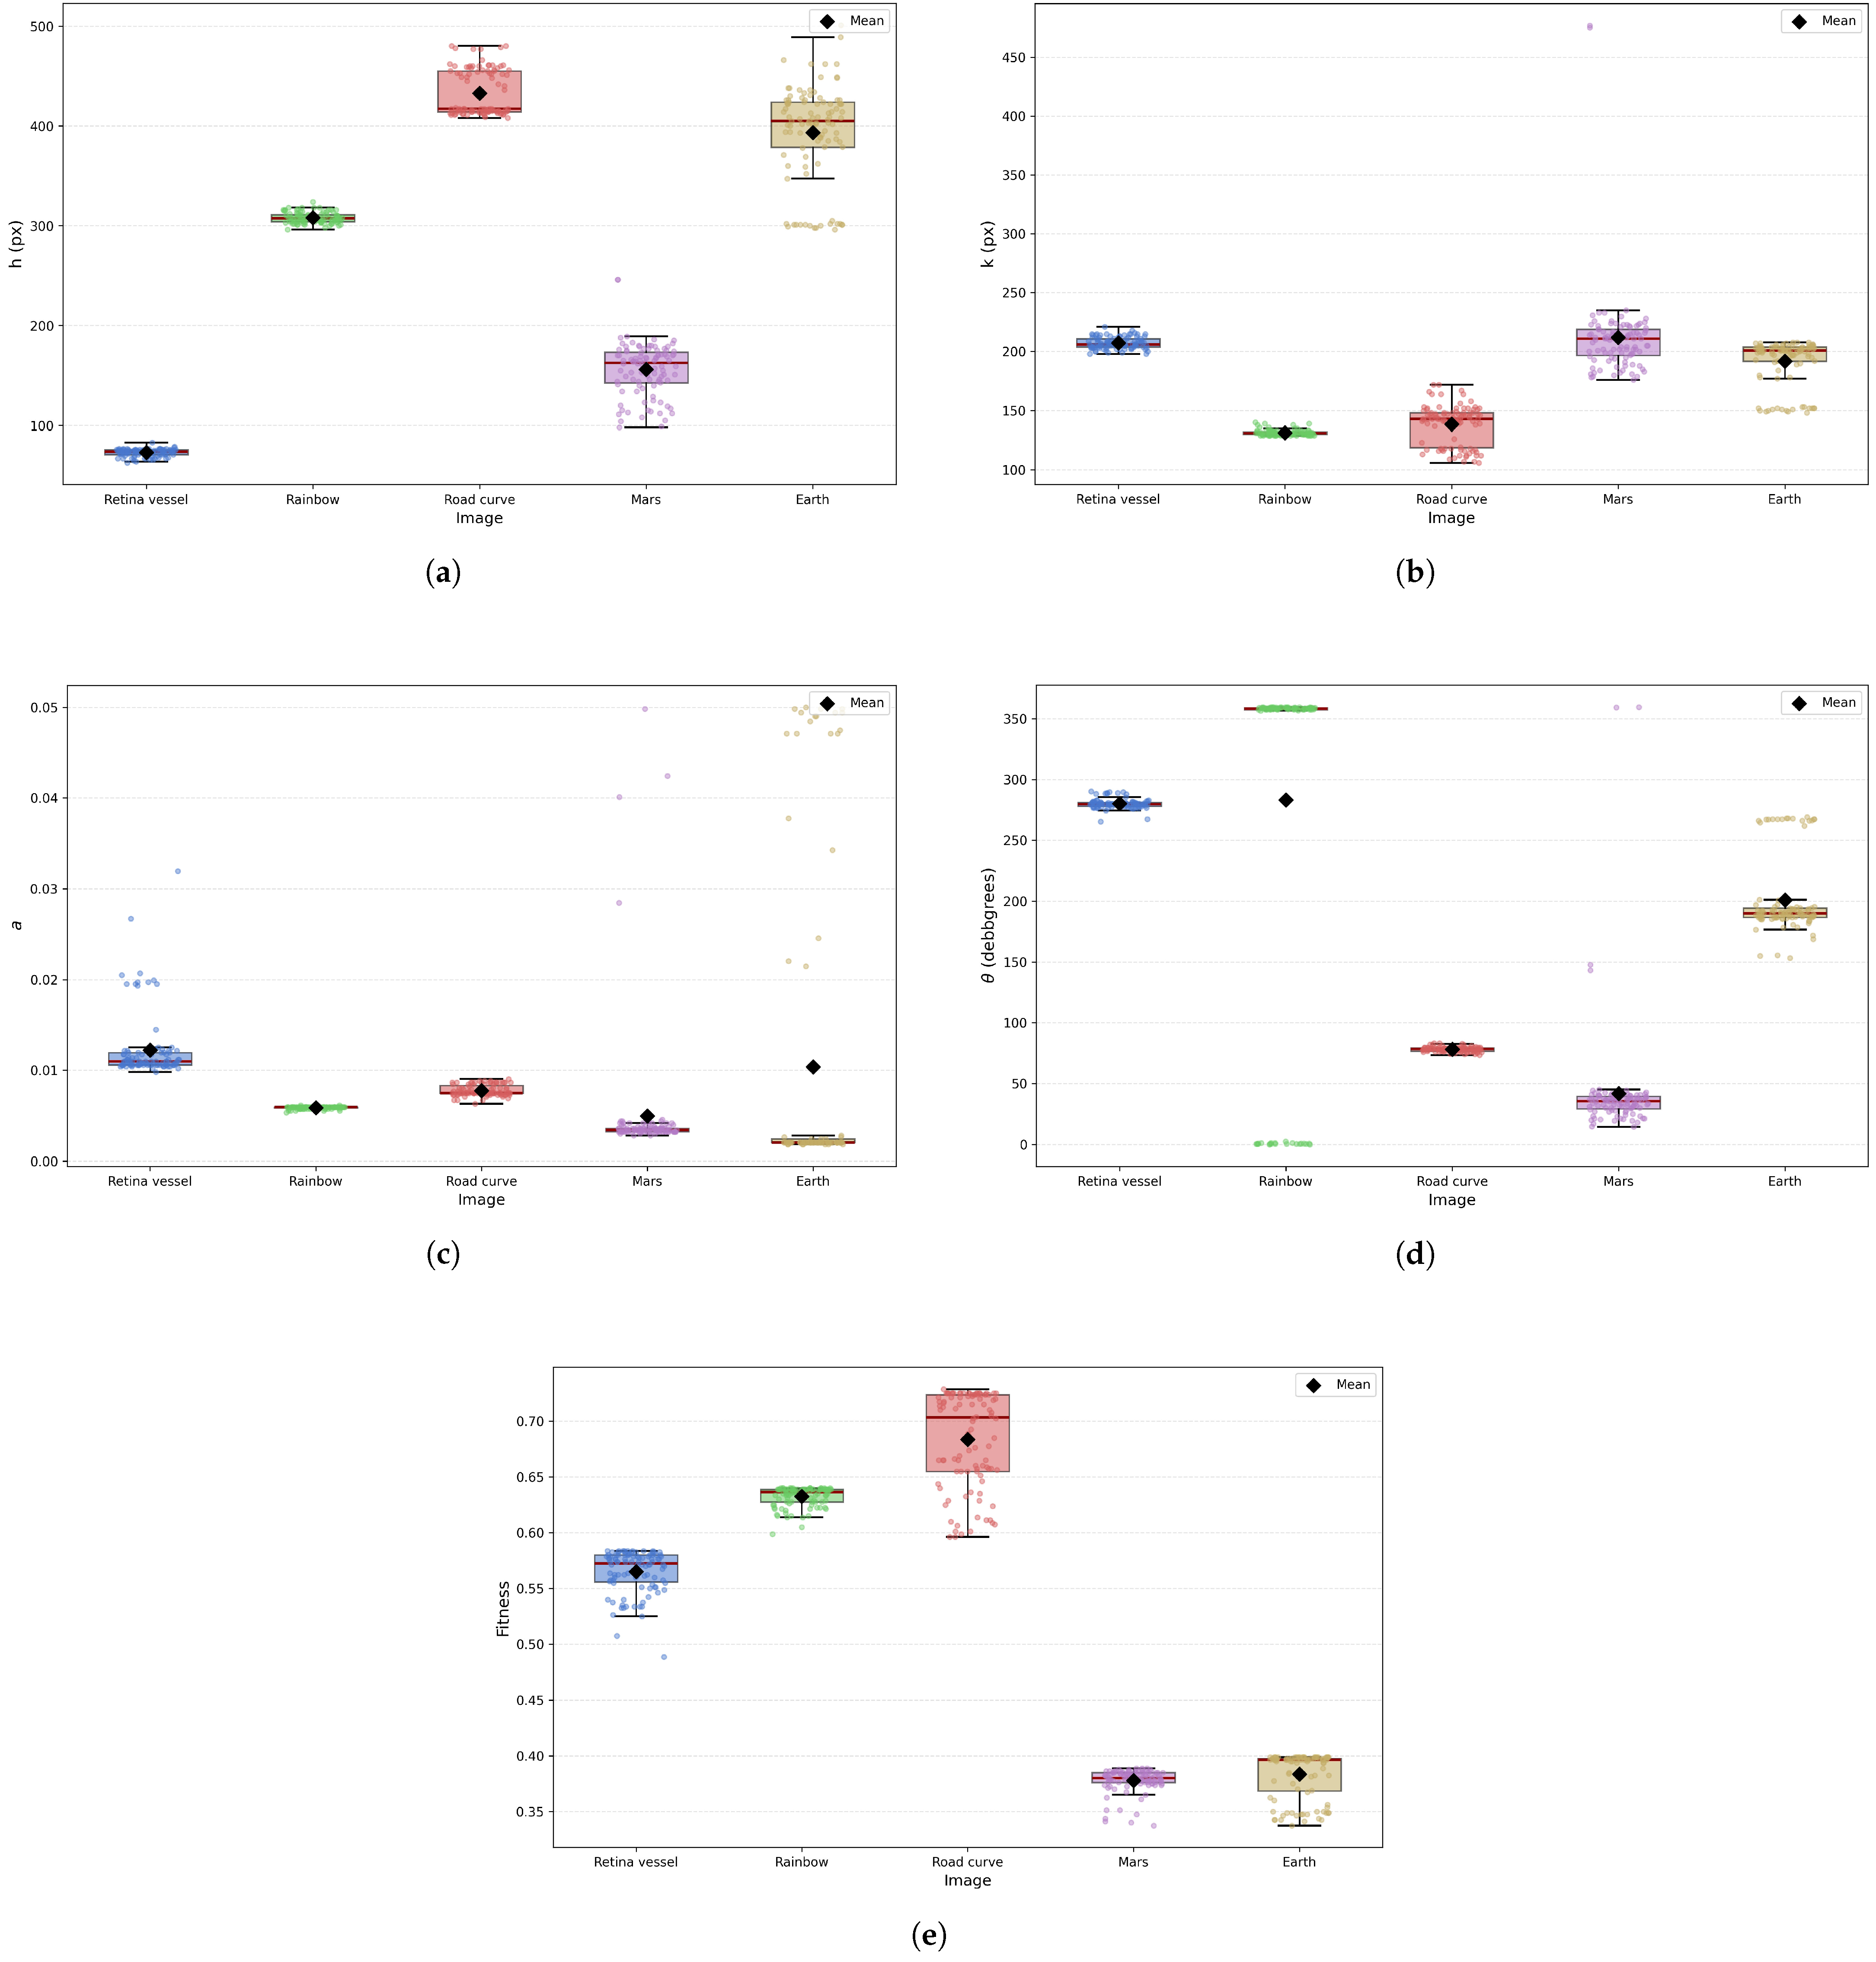
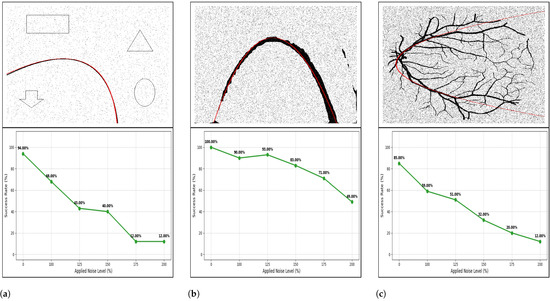
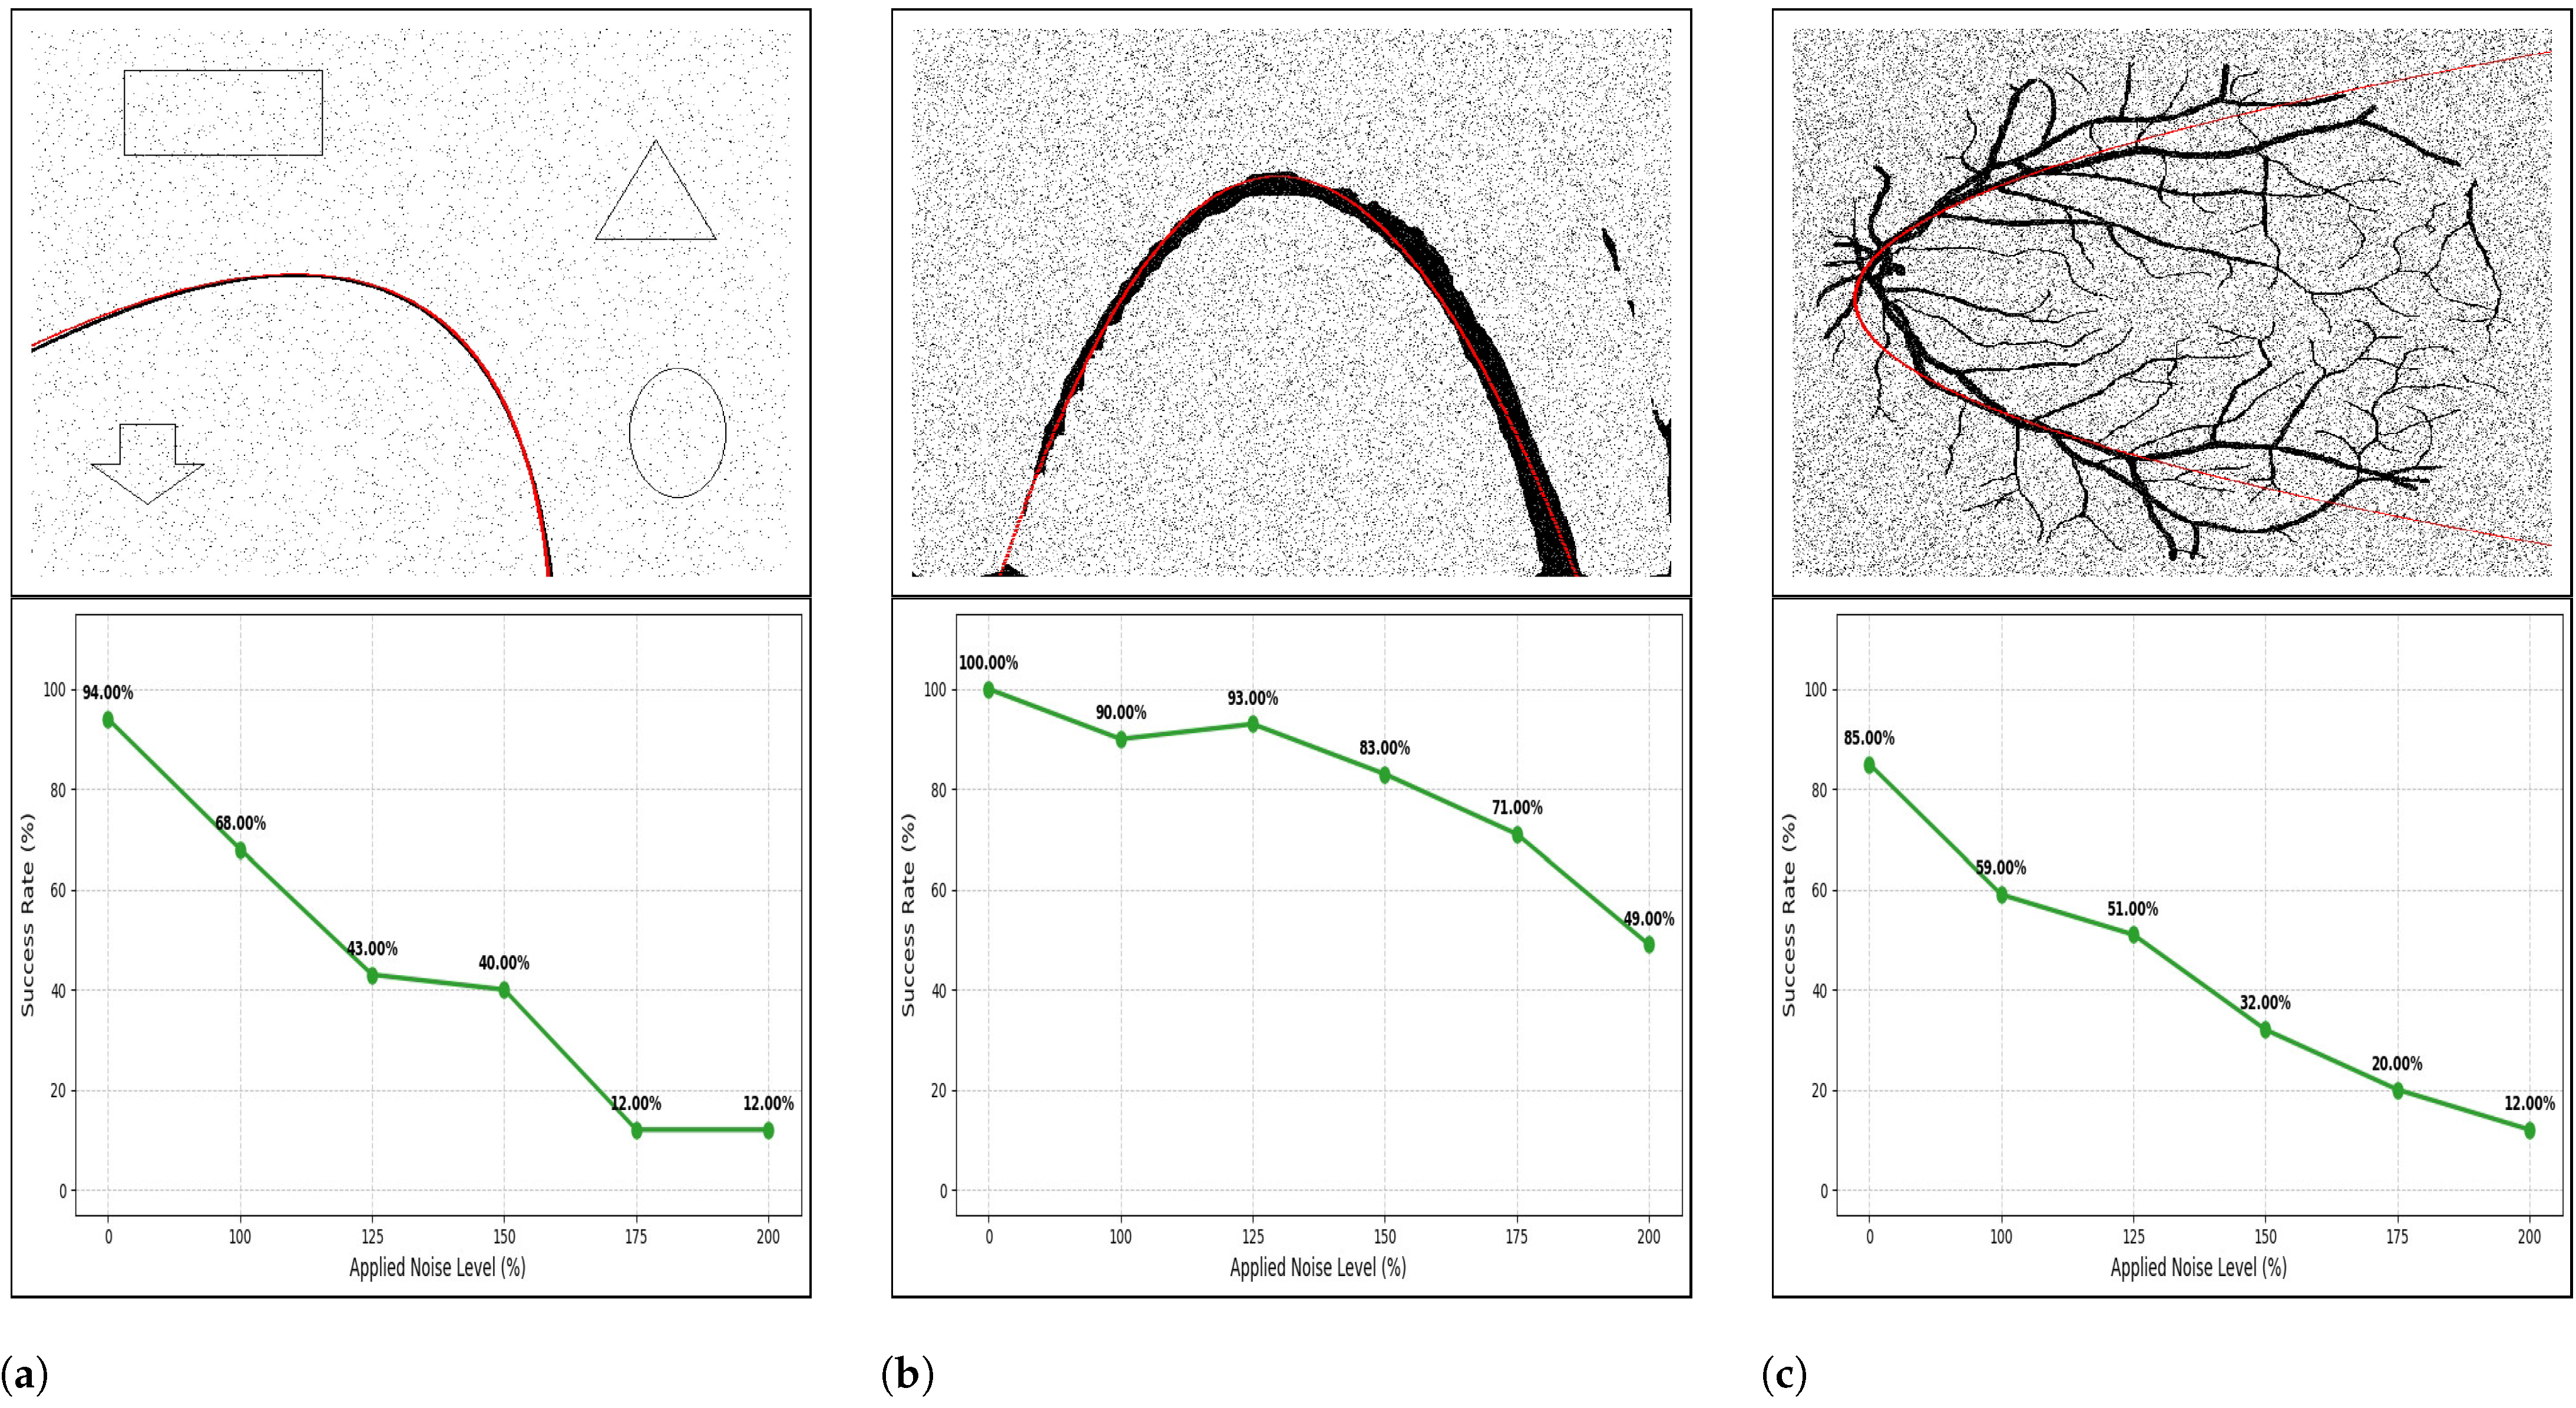

Disclaimer/Publisher’s Note: The statements, opinions and data contained in all publications are solely those of the individual author(s) and contributor(s) and not of MDPI and/or the editor(s). MDPI and/or the editor(s) disclaim responsibility for any injury to people or property resulting from any ideas, methods, instructions or products referred to in the content. |
© 2026 by the authors. Licensee MDPI, Basel, Switzerland. This article is an open access article distributed under the terms and conditions of the Creative Commons Attribution (CC BY) license.