


Abstract
This paper addresses probabilistic and statistical methods for calculating technical energy losses in direct current (DC) networks. A DC network model is adopted as the basis for the analysis, and several approaches are compared in terms of qualitative features and computational efficiency. The load profile is described using probabilistic indicators, emphasizing the importance of accounting for correlation moments (CMs) between node powers and CMs between voltages to reduce calculation errors. A correction procedure for the mathematical expectation of node voltages is proposed, which significantly improves the accuracy of loss estimation. Simulation studies on representative four-node DC test networks show that the proposed method reduces the root mean square error in loss estimation by up to 15–20% compared with traditional approaches based solely on mean load values. The results confirm that the correction of node voltage expectations provides a good balance between accuracy and computational cost and can be recommended as an independent procedure within existing probabilistic frameworks for loss assessment.
Keywords:
direct current networks; energy losses; probabilistic methods; node voltages; technical efficiency MSC:
20P05
1. Introduction
Accurate estimation of power and energy losses (PEL) in electric networks remains one of the key challenges in modern power system analysis. The growing penetration of distributed generation, electric vehicles, and renewable energy sources has significantly increased the variability and uncertainty of node power profiles. As a result, traditional deterministic approaches to loss calculation no longer provide sufficient accuracy for planning, operation, and optimization of electric networks, especially in the context of direct current (DC) and hybrid AC/DC grids.
Loss assessment plays an important role in both operational and strategic decision-making. For real-time operation and financial settlements, highly detailed models are required, while in long-term planning approximate evaluations may be sufficient due to the greater uncertainty of initial data. However, the probabilistic nature of loads, generation scheduling strategies, and daily as well as seasonal fluctuations introduce unavoidable errors into conventional models. Among these factors, the temporal irregularity of load consumption has been identified as the most significant contributor to inaccuracy in loss estimation.
Probabilistic and statistical approaches have demonstrated significant advantages in improving the reliability of loss assessment under uncertain conditions. These methods incorporate probabilistic load characteristics, correlation effects between power injections and CM between node voltages, and statistical properties of operating modes. Nevertheless, existing approaches either lack sufficient accuracy due to the neglect of correlation effects or require extensive computations such as Monte Carlo (MC) simulations.
To address these shortcomings, a methodology is proposed that corrects the mathematical expectation of node voltages in DC networks. The correction procedure substantially improves the accuracy of technical energy loss estimation while maintaining computational efficiency.
The novelty and main contributions of this study are summarized as follows:
- A theoretical framework for probabilistic assessment of technical losses in DC networks is developed, based on statistical characteristics of node loads and their CMs.
- A correction procedure for the mathematical expectation of node voltages is introduced, which significantly reduces the error of loss estimation.
- The method is validated through comparative simulations, demonstrating that the corrected expectation improves accuracy by 15–20% compared with conventional mean-value approaches.
- The correction procedure is shown to serve as an independent enhancement for existing probabilistic methods, providing a practical balance between accuracy and computational efficiency.
The remainder of this paper is organized as follows: Section 2 provides an overview of related work in probabilistic and statistical methods for loss estimation. Section 3 presents the proposed methodology for correcting node voltage expectations. Section 4 reports comparative simulation results that validate the efficiency and accuracy of the approach. Finally, Section 5 concludes the paper and outlines future research directions.
2. Related Work
The problem of assessing load-related PEL in electric networks has been studied extensively throughout the development of power engineering. A comprehensive analysis of classical calculation methods is provided in the works of B. Borkowska, J.J. Grainger, F.F. Wu, S. Kumagai, W.H. Kersting, B.M. Weedy, B.J. Cory [1,2,3,4,5].
The choice of calculation procedure is largely determined by the purpose of the task. For operational and financial calculations, highly accurate mathematical models are required, while for long-term planning—where input data uncertainty is much higher—approximate methods are usually sufficient. Precise estimation of PEL is inherently limited due to the probabilistic nature of loads, the composition of generating units, and their operating strategies. Moreover, energy consumption uncertainty is influenced by a wide range of industrial, meteorological, social, and economic factors. Previous studies have shown that daily and seasonal load irregularities represent the most significant source of error in mathematical models for loss estimation. Consequently, most research in this area has focused on methods that explicitly account for load variability [1,2,3,4,5,6,7].
In practice, simplified approaches are often applied due to the high uncertainty of initial data. These methods are based on the most reliable indicators, such as the maximum load Pmax during the considered interval (e.g., one day), the average load Pavg, and the calculated power losses πmax corresponding to Pmax. On this basis, a set of load profile (LP) characteristics can be derived, including the load factor, loss factor, utilization time of maximum load, time of maximum losses, and load curve form factor [1,2,3,4,5,6,7]. Importantly, this requires only a single power flow calculation, which allows losses to be evaluated with minimal data. Among practical methods for PEL assessment, the following have gained wide application: the method of typical daily load curves, the average load method, the root-mean-square parameter method, the maximum loss method, the separate maximum loss duration method, and the equivalent resistance method. In addition, a particularly relevant and rapidly developing direction is the class of probabilistic and statistical methods [3,6,7].
Significant progress has recently been achieved in probabilistic approaches applied to DC and hybrid AC/DC networks. Liu et al. [8] proposed a probabilistic small-signal stability framework for DC distribution systems with stochastic electric vehicle charging, combining point estimation with Cornish–Fisher expansion to balance accuracy and computational efficiency. Zuluaga-Ríos [9] presented a comprehensive overview of classical methods (Monte Carlo, point estimation) and modern data-driven techniques for probabilistic modeling in DC microgrids and HVDC systems. Sun et al. [10] developed a probabilistic load flow algorithm for hybrid AC/DC systems using cumulant methods and Gram–Charlier series expansion to evaluate the mean and variance of node voltages and power flows. Xia and Xiao [11] incorporated correlations among uncertainty variables through improved Latin hypercube sampling (ILHS) and kernel density estimation (DKDE), enhancing probabilistic power flow models in hybrid networks. Abbasi and Mohammadi [12] demonstrated the applicability of probabilistic techniques such as PEM and MCS in distribution networks with distributed generation and electric vehicles, showing their effectiveness for line loss reduction.
Recent studies have also expanded probabilistic loss estimation to cover advanced modeling techniques. Tong et al. [13] introduced an overvoltage-averse optimization framework for renewable-rich AC/DC distribution networks, highlighting the importance of probabilistic voltage sensitivity analysis. Odeh and Al-Sumaiti [14] reviewed applications of intelligent prediction models in energy systems, emphasizing probabilistic forecasting, uncertainty quantification, and optimization for system efficiency. Cai et al. [15] proposed the use of copula-based dependency models for probabilistic load flow, allowing accurate representation of correlations between renewable energy sources and load patterns. These developments confirm the growing importance of accounting for probabilistic characteristics and correlation effects in loss estimation, and demonstrate the need for methodologies that balance accuracy with computational efficiency.
3. Methodology for Correcting Node Voltage Expectations
Accurate estimation of technical energy losses in DC networks requires consideration of both the mean values and correlation properties of node voltages. This section presents a methodology for refining the mathematical expectation of node voltages and for calculating probabilistic PEL.
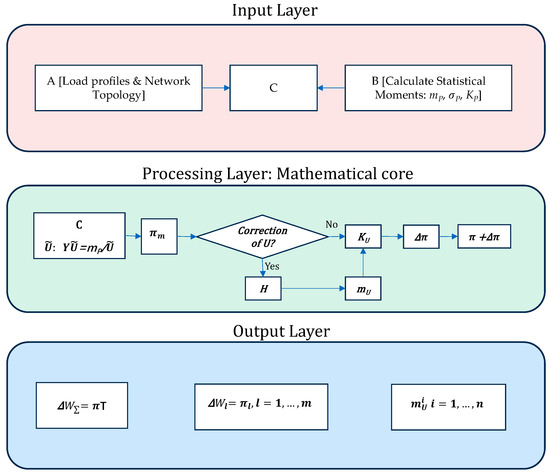
The model initiates by gathering raw data and assessing its probabilistic characteristics such as network parameters (nodal conductance matrix, balancing node voltage), load profile data (power and generation of the node, time intervals), statistical indicators (mathematical expectations of the loads, variance, covariance matrix, load factor, and load shape factor). The model applies targeted mathematical transformations to integrate deterministic and probabilistic analytical approaches. It comprises three stages. In Stage A, the initial operating point is determined by solving the Nodal Voltage Equations using mean load values to estimate expected node voltages. Stage B conducts correlation analysis by deriving the voltage covariance matrix through linearization of the Jacobian, thereby capturing the relationships between node powers and between voltages. Stage C employs an iterative refinement process that uses the residual vector, defined as the Hadamard product of the Y-matrix and covariance matrix, to adjust the estimated node voltages. This process reduces estimation errors by 15–20%. The obtained evaluation results are based on the consideration of refined voltage vector, total power losses, energy loss estimation, and accuracy validation (Figure 1).
Figure 1.
Mathematical model flowchart.
The detailed mathematical model for the proposed approach is presented below.
3.1. Time of Maximum Power Loss
Most conventional methods for calculating load-related power losses reduce the real load profile (LP) to a two-step equivalent profile, for which the time of maximum power loss τ is determined. This parameter reflects the quadratic nature of power losses and is defined as
where is the load value during interval at the i-th step of the LP; m is the number of steps in the calculation interval T; is the maximum load during the interval.
Energy losses over the calculation period are then determined using the maximum power loss at maximum load defined as
A widely used formula for τ over a one-year interval T is an empirical approach [16]:
where ; is the total energy consumed over the year.
In practice, is often replaced by the more intuitive load profile filling factor , which can be expressed through the average load over the calculation interval:
It is worth noting that there are many empirical methods [17,18,19] that allow one to determine ∆W as required for the calculation period. However, these methods do not guarantee an unambiguous determination of ∆W in the general case.
3.2. Load Shape Factor
An even more significant parameter in defining the configuration of the load profile than τ is the load shape factor [20]:
Approximate formulas exist [21,22,23] to determine through or the ratio . Nevertheless, in Formula (5), a detailed description of the load profile is required, which is not always available in practice.
The load shape factor is functionally similar to τ, but its proper application requires careful attention to the physical quantity to which it is tied. For instance, in some guidelines for calculating losses in a network element (Equations (20) and (21), [20]), is included without specifying whether it relates to element-level currents/power (e.g., transformers, lines) or the total system load. In reality, the LPs of individual elements differ significantly from the aggregated system load profile, and confusion here can introduce substantial errors.
Furthermore, the existing directive-based methods [20] do not consider the correlation between node loads, which substantially increases calculation errors [24]. Consequently, the primary challenge in power loss calculation is to fully account for the probabilistic nature of the load profile and the correlations between node loads.
3.3. Power and Energy Losses in the Context of Power System Reliability
In the present study, PEL is considered within the task of determining reserve capacity in interconnected power systems (IPS). Here, losses constitute one of the main components in the balance of generated and consumed power. In reliability assessment [25,26,27,28], the IPS is modeled as a set of reliability zones (RZ), connected by limited-capacity intersystem links. Each RZ is treated as an aggregated node with probabilistic load and generation parameters.
The power losses in each RZ depend functionally on network topology, element parameters, loads, and available generation. For allocation of reserve capacity and overall deficit across the IPS, it is desirable to have an accurate functional relationship between power losses and loads at both the zone and system levels.
Monte Carlo simulation (MCS) is the primary mathematical tool for reliability assessment [29,30,31]. Exact computation of all system states is cumbersome due to the need to solve multiple steady-state regimes. Accuracy can be improved either by increasing the number of simulation runs—at the cost of computation time—or by using simplified computational procedures. In MCS, power losses are often accounted for in an approximate manner: either via specific loss coefficients for power transferred between zones, or quadratically without considering correlation between node powers and voltages. In both cases, the potential principle of current distribution is neglected, leading to significant errors in both element-level power flows and total losses.
Since every kWh of power loss is equivalent to one kWh of unmet electricity in deficit modes, accurate estimation of PEL is critical for reliability metrics. Therefore, stricter accuracy requirements must be applied to loss calculations in reliability studies.
3.4. Proposed Voltage Expectation Correction
To improve the accuracy of power loss estimation, the present methodology introduces a correction of the mathematical expectation of node voltages in DC networks. Unlike conventional methods, which rely solely on averaged load factors or simplified coefficients, the proposed approach explicitly accounts for the probabilistic distribution of node voltages and the correlation between node loads. This correction allows for more accurate calculation of both element-level and total system losses without significantly increasing computational requirements. The method is particularly relevant for reliability assessment and reserve allocation in large-scale interconnected power systems, where small deviations in loss estimation can lead to substantial discrepancies in reliability metrics.
A probabilistic-statistical evaluation of losses and the proposed correction procedure of the mathematical expectation of node voltages provide a more robust framework for power system reliability studies, ensuring that both the total and element-specific losses are properly represented in balance and reserve calculations. Comparative simulations demonstrate that the proposed methodology achieves better accuracy than classical approaches while maintaining computational efficiency.
3.5. Probabilistic Approach to Load Shape Factor
As previously mentioned, one of the methods for calculating technical losses in power networks is the average load method, where the load shape factor (5) characterizes the unevenness of electricity consumption during the calculation period. If the duration of a load profile step is considered a random variable, uniformly distributed over the interval T, then the ratio represents the probability of the step . In this case, the expected value (EV) of the load is and can be expressed through the second raw moment , variance or the coefficient of variation :
According to (6), the functional relationship between the number of hours of maximum losses and the load filling factor can be written as
The total power losses in the network are then
In [20], energy losses are estimated as
This formula provides an acceptable estimate only for relatively smooth load profiles, as it is based on the calculation of the regime at average load and underestimates losses by ignoring voltage drops along lines. In this regard, Formula (8) is significantly more accurate.
3.6. Aggregate Load Shape Factor
In power system design, node loads are typically determined by type (e.g., metallurgical plant), with assigned typical load profiles or . A question arises: which parameters or should be used for total network loss estimation? These parameters can be calculated through variances under the assumption of independent node loads.
It is necessary to separate the total node power into load and generation components because changes in generation are determined by electricity demand, and their variation cannot be represented by typical curves. However, they can be characterized by statistical parameters such as expected value (EV) and variance. This consideration also applies to the balancing node (modeled as node n + 1 in our framework). In reliability assessment of the power system, the generation (available capacity) at nodes i = 1, …, n is often assumed to be constant.
The total network power can be expressed as
where and are generation and load at node i, respectively.
The expected value of total power losses:
According to (6), the variance of power losses is
From this, the aggregate load shape factor is
3.7. Expected Power Losses Considering Node Voltages
In the DC network model, the power loss in a transmission line (TL) connecting nodes i and j with is defined as
where is the nodal conductance matrix, and are the node voltages. Consequently, the total power loss in all lines of the network is
where node is the balancing node with a fixed voltage . The factor 1/2 accounts for double-counting the same line in both directions.
Assuming , the total loss can be expressed as a quadratic form of the voltages:
The expected value of total power losses is
where denotes the expectation operator.
In this task, node loads and generation considered random. The instantaneous generation depends on the load-following strategy (optimal dispatch problem), requiring a functional representation However, for reliability assessment, only events related to power deficit are significant. Hence, node generation can be considered as . In modern power systems, renewable generation (wind, solar) may also be present, so generation can be generalized as a time series of available power, analogous to load profiles.
Node voltages are determined from the nodal voltage equations (NVE):
Thus, voltages cannot be treated as independent random variables. The second moments can be expressed through CMs and expected values : .
Hence,
This formulation requires knowledge of expected values and CMs of node voltages. These can be obtained either from statistical measurements or Monte Carlo simulations (). Alternatively, one can analyze the probabilistic process of the daily operation regime, where time is treated as a uniformly distributed random variable over the observation interval T. With a discrete approximation of the load process (finite intervals of constant parameters), a time series is obtained, which can be interpreted probabilistically with .
In electrical engineering applications, the second approach is more commonly used because the main interest is not only the instantaneous power but also the energy consumed over the calculation interval. When analyzing energy losses in power networks, the correlation matrix , as well as the expected values , are considered with respect to the time factor. If calculations are performed within a Monte Carlo framework, the statistical trials are treated as a sequence of temporal intervals of equal duration.
Since node voltages are functions of node power injections, the matrices and are typically computed analytically as functions of the CMs of node loads, , which are considered the primary sources. This allows capturing both the probabilistic and temporal structure of power consumption in the evaluation of network losses.
Then, (19) can be rewritten as
where denotes the sum of element-wise products of the corresponding elements of the matrices, and represents the power losses corresponding to the expected values of node voltages:
The nodal voltage equations (NVE) in the domain of expected voltages exhibit relatively small nonlinearity. Therefore, approximate estimates of the expected node voltages can be obtained from the operating point corresponding to the mean node loads :
It should be noted that the vector obtained from the NVE system represents only an approximate value of the expected voltages .
3.8. Voltage Correlation Matrix
Previously, it was noted that node voltages are not directly measured, but are parameters dependent on node power injections, which are usually recorded discretely at regular intervals. Statistical characteristics of node loads (expectations, variances, and CMs) can then be determined based on these observations.
The linear approximation of (22) around the point takes the form:
Considering that , we obtain the linear relationship:
where , ; is the Jacobian matrix corresponding to with elements:
From this, we have
Considering the properties of CMs, from (26) we obtain
Substituting (27) into (20) allows for the computation of the network power losses while accounting for the correlation between node loads.
3.9. Refined Calculation of Expected Voltages
In the presented calculations, the voltages are determined from the NVE using the expected values of node powers . However, due to the nonlinear nature of the NVE, the obtained vector represents only an approximate estimate, and coincides with the expected voltages only in the case of linear approximation. Therefore, it is desirable to obtain more accurate estimates of and consequently of . A correction to the expected voltages can be derived according to the following expression (see Appendix A):
where
Equation (28) represents a nonlinear relation for , since the components of the vector depend on . The solution can be obtained, for example, by the simple iteration method with the recurrence relation:
If the initial approximation is chosen as , then and in this case
Verification calculations show that for real networks it is usually sufficient to restrict the procedure to a single iteration. It should be noted that a more accurate estimate of the expected voltages has practically no effect on the covariance matrix of node voltages, but significantly affects the value of .
A full derivation of the correction expression, including intermediate transformations, is presented in Appendix A.
3.10. Quadratic Approximation of the Loss Function
The determination of the expected power losses can also be carried out using a quadratic approximation of the loss function. Let us represent the function of total power losses (16) in the vicinity of the point by a Taylor expansion including the quadratic term:
The partial derivatives are
Since the Hessian matrix of second derivatives in the quadratic approximation coincides, up to a sign, with twice the admittance matrix , the last term in (32) can be written in quadratic form:
Substituting (26) into (34), we obtain a new matrix expression for the quadratic component of power losses:
where is the so-called matrix of quadratic loss coefficients:
Expression (35) represents a quadratic form of , whose expectation is determined as follows [32]:
since . In this expression, denotes the trace of the product of matrices , i.e., the sum of the diagonal elements.
The expected value of the linear component of losses, , is equal to zero. Therefore, the expected value of the total power losses is given by
In this expression, the covariance matrix of voltages does not explicitly appear, but the error of this method nearly coincides with the error of the loss estimation that accounts for the variance component of voltages.
3.11. Z-Matrix Method
The so-called Z-matrix method is a modification of the above approach, involving simplifying assumptions when constructing the Jacobian matrix. If in representation (25) it is assumed that all node voltages are equal (or ), and the diagonal term is neglected, then
In this case,
and
where is the nodal impedance matrix.
4. Comparative Simulation Results
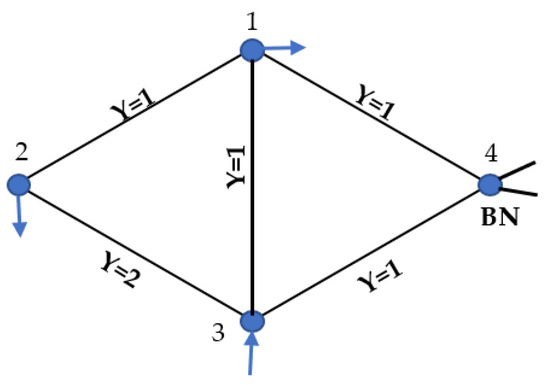
This section presents a comparative analysis of the proposed methodology for refining node voltage expectations and its impact on the estimation of technical energy losses. A test DC network with four nodes (Figure 2) was used as the simulation example. The balancing node voltage was set at kV.
Figure 2.
Four-node test system.
4.1. Input Data and Load Statistics
Piecewise-constant load profiles are presented in the first five columns of Table 1. Based on these data, the statistical characteristics of nodal loads were obtained: expected values , MW, variances , MW2, standard deviations , MW, and the covariance matrix cov(P), MW2. The voltages corresponding to the expected load mode, were computed using conventional power flow solution procedures. An additional column in Table 1 contains the refined estimates of expected voltages, . Although the deviation between and is relatively small, it leads to a noticeable impact on the loss estimates.
Table 1.
Initial and calculated statistical data of nodal loads.
4.2. Covariance and Correlation Analysis
In Table 2, the values required for evaluating the dispersion component of power losses according to (23)–(28) are presented. Particular attention should be paid to the strong correlation between nodal voltages. Almost everywhere, the correlation coefficients are close to unity. This suggests that the covariance matrix of voltages can be approximated with sufficient accuracy through pairwise products of standard deviations, provided the relevant statistics are available to the analyst. The dispersion component of power losses is defined as the trace of the matrix
Table 2.
Voltage covariance and correlation data.
4.3. Energy Loss Estimation
In Table 3, the results of daily energy loss calculations are summarized. The reference (“exact”) calculation was performed by solving the NVE for each time interval. The error of the loss estimate obtained using only the expected load mode (column 3) reaches 30%, which is unacceptably large. This agrees with the general conclusion reported by many researchers: such an estimate cannot be recommended for practical use.
Table 3.
Daily energy losses.
More accurate results are obtained when the CMs of nodal voltages, are taken into account. In this case, the covariance matrix is computed on the basis of voltages , obtained in the expected load mode. This approach improves the accuracy significantly (error about −11%).
Even higher accuracy is achieved with the proposed method, which incorporates an iterative correction of the expected voltages (column 7). It is worth noting that refining has little effect on , but it significantly influences the base loss component .
A relatively simple approach based on the “Z-matrix”, which does not require solving the electrical power flow but accounts for the covariance of nodal powers, showed the lowest accuracy among all tested met-hods and is not recommended for practical applications.
On the other hand, the “B-matrix” method, based on the quadratic loss coefficients, demonstrated accuracy comparable to the more advanced “” method.
5. Discussion and Conclusions
The study confirms the necessity of incorporating both expected values and CMs of node voltages in the probabilistic estimation of technical PEL in DC networks. Adjustment of nodal voltage expectations reduces systematic bias in loss estimation and improves agreement with exact reference calculations. The methodology therefore provides an effective compromise between accuracy and computational efficiency, applicable to both operational and planning contexts.
The main conclusions are as follows:
- Corrections to nodal voltage expectations have only a minor impact on covariance matrices but significantly influence baseline power losses .
- The proposed correction procedure substantially increases the accuracy of technical PEL assessment and can be used either independently or as an enhancement to existing probabilistic methods.
- The method based on the quadratic loss coefficient matrix achieves an accuracy level comparable to that of covariance-based approaches; however, it does not demonstrate notable advantages in terms of computational effort or precision. Validation on large-scale network models is therefore required.
- Neglecting voltage drops in network elements results in a considerable increase in estimation error, whereas the proposed correction procedure reduces such errors by approximately 15–20%.
- From a practical perspective, the methodology can be integrated into planning and operational tools, facilitating more reliable assessment of technical losses and supporting more effective decision-making in network operation and development.
6. Limitations and Future Work
Despite its advantages, the proposed methodology has several limitations. The study focuses primarily on small-to medium-scale DC networks, and scalability to large and highly meshed systems remains to be verified. In addition, the model assumes stationary load distributions; however, in practice, non-stationary and rapidly varying profiles may lead to additional uncertainties. Another limitation is the use of simplified load correlation models, which may not fully capture the stochastic behavior of emerging distributed energy resources and electric vehicles.
Future research will address these limitations by
- Extending the methodology to large-scale DC and hybrid AC/DC grids with diverse load- and generation characteristics.
- Developing advanced correlation models that incorporate temporal variability and non-stationary processes.
- Integrating the proposed correction procedure with Monte Carlo and point-estimation techniques to improve robustness under highly uncertain conditions.
- Testing the methodology within real-time operational frameworks and decision support systems for power system operators.
Author Contributions
Conceptualization, A.K., I.O., S.B., V.O. and M.S. (Murodbek Safaraliev); Methodology, I.O., S.B., A.K., M.S. (Mihail Senyuk), M.S. (Murodbek Safaraliev) and V.O.; Software, I.O., M.S. (Mihail Senyuk) and V.O.; Validation, I.O., S.B., V.O. and A.K.; Formal analysis, I.O., S.B., A.K., M.S. (Mihail Senyuk) and V.O.; Investigation, M.S. (Mihail Senyuk), M.S. (Murodbek Safaraliev) and V.O.; Resources, A.K.; Data curation, A.K., M.S. (Murodbek Safaraliev), V.O. and A.K.; Writing—review and editing, S.B., A.K., M.S. (Murodbek Safaraliev) and I.O.; Visualization, I.O. and V.O.; Supervision, I.O., S.B., A.K., M.S. (Murodbek Safaraliev) and V.O.; Project administration, A.K., M.S. (Murodbek Safaraliev) and I.O.; Funding acquisition, M.S. (Murodbek Safaraliev). All authors have read and agreed to the published version of the manuscript.
Funding
This research received no external funding.
Data Availability Statement
The data presented in this study are available on request from the corresponding author because the data used in the study contain confidential information.
Acknowledgments
The research funding from the Ministry of Science and Higher Education of the Russian Federation (Ural Federal University Program of Development within the Priority 2030 Program) is gratefully acknowledged.
Conflicts of Interest
The authors declare no conflict of interest.
Abbreviations
The following abbreviations are used in this manuscript:
| BN | Balancing Node |
| RZ | Reliability Zone |
| CM | Correlation Moment |
| TL | Transmission Line |
| MC | Monte Carlo Method |
| EV | Expected Value (Mathematical Expectation) |
| Mathematical Expectation of Random Variable x | |
| PEL | Power and Energy Losses |
| NVE | Nodal Voltage Equation |
| EPS | Electric Power System |
| πm | Mean (Base) Power Loss |
| πmax | Maximum Power Loss |
| πD | Variance Component of Losses |
| KU | Voltage Correlation Matrix |
| KP | Power Correlation Matrix |
| Node Voltage at Expected Load | |
| mU | Refined Expected Node Voltage |
| ΔP | Node Power Deviation |
| Δ | Voltage Deviation |
| Jacobian Matrix | |
| R | Residual (Correction) Vector |
| Quadratic Loss Coefficient Matrix | |
| Z | Nodal Resistance Matrix |
Appendix A
Correction of the Expected Voltages
The quadratic approximation of the NVE (23) in the vicinity of the point (), corresponding to the expected values of loads, is expressed as
where ; .
Considering the power balance, , the equation reduces to
Applying the expectation operator, the refined expected voltages satisfy
According to the properties of second-order moments:
where ; ; ; are values centred on mathematical expectations .
For voltages, this gives
where Then, Equation (45) can be rewritten as
Here is the i-th row of the Y matrix;
The Hessian matrix for DC network nodal equations has the form:
where non-zero elements correspond only to those entries in Y that include index i.
Considering symmetry of Y, we have
The element i of vector is defined as
where is the i-th row of the matrix Y; is the i-th column of the covariance matrix ,
Thus, each component is obtained as a scalar product of the i-th row of Y and the vector that combines the covariance structure of voltages with the quadratic correction term
Vector can be conveniently expressed in matrix form:
where is a vector of n ones, and denotes the Hadamard (element-wise) product of A and B matrix.
Finally, the system (48) can be written as
yielding the refined expected voltage values:
References
- Borkowska, B. Probabilistic Load Flow. IEEE Trans. Power Appar. Syst. 1974, PAS-93, 752–759. [Google Scholar] [CrossRef] [Scilit]
- Grainger, J.J.; Stevenson, W.D. Power System Analysis; McGraw-Hill: New York, NY, USA, 1994. [Google Scholar]
- Wu, F.F.; Kumagai, S. Steady-State Security Regions of Power Systems. IEEE Trans. Circuits Syst. 1982, 29, 703–711. [Google Scholar] [CrossRef] [Scilit]
- Kersting, W.H. Distribution System Modeling and Analysis; CRC Press: Boca Raton, FL, USA, 2017. [Google Scholar]
- Weedy, B.M.; Cory, B.J. Electric Power Systems, 4th ed.; Wiley: Chichester, UK, 2012. [Google Scholar]
- Li, F.; Bo, R. Small test systems for power system economic studies. In Proceedings of the IEEE PES General Meeting, Minneapolis, MN, USA, 25–29 July 2010; IEEE: New York, NY, USA, 2010; pp. 1–4. [Google Scholar] [CrossRef] [Scilit]
- Lopes, J.A.P.; Hatziargyriou, N.; Mutale, J.; Djapic, P.; Jenkins, N. Integrating Distributed Generation into Electric Power Systems: A Review of Drivers, Challenges and Opportunities. Electr. Power Syst. Res. 2007, 77, 1189–1203. [Google Scholar] [CrossRef] [Scilit]
- Liu, W.; Zhang, B.; Lu, Z.; Liao, Y.; Nian, H. Probabilistic Small-Signal Modeling and Stability Analysis of the DC Distribution System. Energies 2025, 18, 1196. [Google Scholar] [CrossRef] [Scilit]
- Zuluaga-Ríos, C.D. (Ed.) Probabilistic Analysis in DC Grids, en Modeling, Operation, and Analysis of DC Grids: From High Power DC Transmission to DC Microgrids; Academic Press: London, UK, 2021. [Google Scholar]
- Sun, Y.; Xia, D.; Gao, Z.; Wang, Z.; Li, G.; Lu, W.; Wu, X.; Li, Y. Probabilistic load flow calculation of AC/DC hybrid system based on cumulant method. Int. J. Electr. Power Energy Syst. 2022, 139, 107998. [Google Scholar] [CrossRef] [Scilit]
- Xia, X.; Xiao, L. Probabilistic Power Flow Method for Hybrid AC/DC Grids Considering Correlation among Uncertainty Variables. Energies 2023, 16, 2547. [Google Scholar] [CrossRef] [Scilit]
- Abbasi, A.R.; Mohammadi, M. Probabilistic load flow in distribution networks: An updated and comprehensive review with a new classification proposal. Electr. Power Syst. Res. 2023, 222, 109497. [Google Scholar] [CrossRef] [Scilit]
- Tong, B.; Zhang, L.; Li, G.; Zhang, B.; Xie, F.; Tang, W. An Overvoltage-Averse Model for Renewable-Rich AC/DC Distribution Networks Considering the Sensitivity of Voltage Violation Probability. IEEE Trans. Sustain. Energy 2025, 16, 613–626. [Google Scholar] [CrossRef] [Scilit]
- Odeh, E.; Al-Sumaiti, A. Chapter 5—Towards efficient energy management using intelligent prediction models: A comparative study on energy consumption data. In Advances in Intelligent Energy Systems, Physics-Aware Machine Learning for Integrated Energy Systems Management; Daneshvar, M., Mohammadi-Ivatloo, B., Zare, K., Aghaei, J., Eds.; Elsevier: Amsterdam, The Netherlands, 2025; pp. 105–124. [Google Scholar] [CrossRef] [Scilit]
- Cai, D.; Shi, D.; Chen, J. Probabilistic load flow computation using Copula and Latin hypercube sampling. Gener. Transm. Distrib. IET 2014, 8, 1539–1549. [Google Scholar] [CrossRef] [Scilit]
- Buller, F.H.; Woodrow, C.A. Load factor equivalent hours values compared. Electr. World 1928, 92, 59–60. [Google Scholar]
- Carlos, A.D.; Ramón, N. The Loss That is Unknown is No Loss At All: A Top-Down/Bottom-Up Approach for Estimating Distribution Losses. IEEE Trans. POWER Syst. 2005, 20, 1119–1125. [Google Scholar] [CrossRef]
- Queiroz, L.M.O.; Roselli, M.A.; Cavellucci, C.; Lyra, C. Energy Losses Estimation in Power Distribution Systems. IEEE Trans. Power Syst. 2012, 27, 1879–1887. [Google Scholar] [CrossRef] [Scilit]
- Sabah, H.A.; Ali, A.R.A.; Ahmad, S.A.T. Calculations of Loss Factor Based on Real-Time Data: Determining Technical Power Loss for the Electrical Distribution Network in Karbala City. IOP Conf. Ser. Mater. Sci. Eng. 2020, 671, 012037. [Google Scholar] [CrossRef] [Scilit]
- Ministry of Energy of the Russian Federation. Instruktsiya po Organizatsii v Ministerstve Energetiki Rossiiskoi Federatsii Raboty po Raschetu i Obosnovaniyu Normativov Tekhnologicheskikh Poter’ Elektroenergii Pri ee Peredache po Elektricheskim Setyam; [Instruction on the Organization in the Ministry of Energy of the Russian Federation of Work on Calculation and Justification of Standards for Technological Losses of Electricity during Its Transmission through Electric Grids]; Approved by Order No. 326 of 30 December 2008. Registered in the Ministry of Justice of the Russian Federation on 12 February 2009, No. 13314; Ministry of Justice of the Russian Federation: Moscow, Russia, 2009. (In Russian)
- Tsygulev, N.; Khlebnikov, V.; Voronina, Y. Specific aspects of calculating electrical energy losses in electricity networks. IOP Conf. Ser. Mater. Sci. Eng. 2020, 918, 012156. [Google Scholar] [CrossRef] [Scilit]
- Tsygulev, N.; Khlebnikov, V.; Voronina, Y. Methods of Calculating Technological Losses Electrical Energy in Electricity Networks. In Proceedings of the 2020 International Multi-Conference on Industrial Engineering and Modern Technologies (FarEastCon), Vladivostok, Russia, 6–9 October 2020; IEEE: New York, NY, USA, 2020. [Google Scholar]
- Matsankov, M. Research of electricity losses in electric networks. In Environment Technology Resources Proceedings of the International Scientific and Practical Conference; RTU Press: Riga, Latvia, 2025; pp. 95–199. [Google Scholar] [CrossRef] [Scilit]
- Lipes, A.V. Primenenie Metodov Matematicheskoi Statistiki Dlya Resheniya Elektroenergeticheskikh Zadach; Application of Mathematical Statistics Methods for Solving Electric Power Problems, Textbook; Ural Polytechnic Institute Publishing House: Sverdlovsk, Russia, 1983; 88p. (In Russian) [Google Scholar]
- Ye, C.; Guo, L.; Ding, Y.; Ding, M.; Wang, P.; Wang, L. Reliability Assessment of Interconnected Power Systems with HVDC Links Considering Frequency Regulation Process. J. Mod. Power Syst. Clean Energy 2023, 11, 662–673. [Google Scholar] [CrossRef] [Scilit]
- Singh, C.; Gubbala, N. Reliability evaluation of interconnected power systems including jointly owned generators. IEEE Trans. Power Syst. 1994, 9, 404–412. [Google Scholar] [CrossRef]
- Jiang, X.; Ye, C.; Ding, Y.; Guo, R. Reliability Equivalence to Symmetrical UHVDC Transmission Systems Considering Redundant Structure Configuration. Energies 2018, 11, 753. [Google Scholar] [CrossRef] [Scilit]
- Hu, B.; Xie, K.; Tai, H.M. Reliability Evaluation and Weak Component Identification of ±500-kV HVDC Transmission Systems With Double-Circuit Lines on the Same Tower. IEEE Trans. Power Deliv. 2018, 33, 1716–1726. [Google Scholar] [CrossRef] [Scilit]
- Rei, A.M.; Schilling, M.T.; Melo, A.C. Monte Carlo Simulation and Contingency Enumeration in Bulk Power Systems Reliability Assessment. In Proceedings of the 2006 International Conference on Probabilistic Methods Applied to Power Systems, Stockholm, Sweden, 11–15 June 2006; IEEE: New York, NY, USA, 2006; pp. 1–6. [Google Scholar] [CrossRef] [Scilit]
- Yadav, A.K.; Mudgal, S.; Mahajan, V. Monte Carlo Simulation Application in Composite Power System Reliability Analysis. In Control Applications in Modern Power System; Lecture Notes in Electrical Engineering; Singh, A.K., Tripathy, M., Eds.; Springer: Singapore, 2021; Volume 710. [Google Scholar] [CrossRef] [Scilit]
- Sangwongwanich, A.; Blaabjerg, F. Monte Carlo Simulation With Incremental Damage for Reliability Assessment of Power Electronic. IEEE Trans. Power Electron. 2021, 36, 7366–7371. [Google Scholar] [CrossRef] [Scilit]
- Seber, G.A.; Lee, A.J. Linear Regression Analysis, 2nd ed.; John Wiley & Sons: Hoboken, NJ, USA, 2003. [Google Scholar]

Disclaimer/Publisher’s Note: The statements, opinions and data contained in all publications are solely those of the individual author(s) and contributor(s) and not of MDPI and/or the editor(s). MDPI and/or the editor(s) disclaim responsibility for any injury to people or property resulting from any ideas, methods, instructions or products referred to in the content. |
© 2026 by the authors. Licensee MDPI, Basel, Switzerland. This article is an open access article distributed under the terms and conditions of the Creative Commons Attribution (CC BY) license.