


Abstract
This paper presents a probabilistic sensitivity analysis of a nonlinear electrochemical model for lithium-ion batteries. The model is treated as a reduced virtual replica for uncertainty-aware analysis rather than as a full digital twin. A reduced electrochemical formulation is combined with constrained inverse parameter identification using experimental current–voltage data to relate observable battery behavior to effective model parameters. Predictive variability is assessed through Monte Carlo uncertainty propagation and global sensitivity analysis under both charging and discharging conditions. The results indicate that the particle radius of the positive active material and the effective electrodes area are the dominant contributors to terminal-voltage uncertainty, whereas the electrode thickness parameter and negative electrode active material particle radius have a moderate influence within the studied ranges. Rank-based and variance-based sensitivity measures are more informative than linear indices for this reduced nonlinear system. From a mathematical perspective, the work integrates reduced-order modeling, inverse problem formulation, numerical simulation, and uncertainty quantification in one computational framework for battery analysis. The results support uncertainty-aware parameter prioritization, calibration of reduced electrochemical models, and provide a basis for future work on battery design, control, and digital-twin-oriented extensions under uncertainty.
Keywords:
nonlinear mathematical modeling; lithium-ion batteries; reduced electrochemical model; inverse parameter identification; probabilistic sensitivity analysis; uncertainty quantification; parameter prioritization MSC:
65M06; 35Q70; 78A57
1. Introduction
Recent trends indicate a rapid growth trajectory for the global lithium-ion battery market. According to data from Grand View Research, Inc. (San Francisco, CA, USA) [1], the global lithium-ion battery market was valued at USD 53.6 billion in 2020, with an expected average annual growth rate (CAGR) of 19.0% from 2020 to 2028. Factors influencing this growth include advancements in the design of smart devices, reduction of carbon dioxide emissions, focus on renewable energy sources, and the adoption of electric vehicles and other equipment requiring properly designed lithium-ion batteries.
Reliable mathematical modeling of lithium-ion batteries is essential for their state estimation, control, and design optimization. Among available modeling approaches, Equivalent Circuit Models (ECMs) are widely used in industrial applications due to their computational efficiency and the easy parameterization process [2]. However, ECMs lack direct physical interpretability since they are based on empirical fitting of experimental data rather than electrochemical principles, which limits their applicability in internal state analysis and uncertainty-aware modeling.
More physically grounded approaches are based on electrochemical modeling. The pseudo-two-dimensional (P2D/DFN) model, developed by Newman and co-workers [3,4], describes lithium-ion transport and electrochemical reactions using coupled nonlinear partial differential equations. It provides detailed spatial and temporal distributions of lithium concentration and potential in both solid and electrolyte phases. However, this accuracy comes at the cost of high computational complexity and a large number of parameters. The model typically includes geometric, material, transport, and electrochemical parameters, making parameter identification challenging and computationally expensive [2,5].
The physical parameters of electrochemical models can be categorized into those that remain constant during battery aging and those that evolve over time [6]. Parameter variations reflect degradation mechanisms such as loss of active material or changes in transport properties. These effects can be identified using electrochemical measurements or optimization-based estimation techniques. However, experimental identification often requires invasive procedures, while numerical optimization methods suffer from high computational cost and parameter identifiability issues due to strong coupling between variables.
Reduced-order electrochemical models have therefore been developed to mitigate these limitations. The Single Particle Model (SPM) simplifies the P2D structure by representing each electrode as a single spherical particle, assuming uniform reaction kinetics and neglecting electrolyte dynamics. This leads to a significant reduction in computational complexity but introduces approximation errors, particularly at higher C-rate conditions.
The Single Particle Plus (SP+) model extends the SPM by incorporating electrolyte dynamics and heterogeneous reaction effects, improving accuracy while maintaining computational efficiency. Nevertheless, even with these enhancements, accuracy limitations may still appear at high current rates, where full electrochemical coupling becomes significant [2].
Further reduced electrochemical formulations, such as the Simplified Electrochemical (SEC) model and its improved version (ISEC), employ excitation-based identification techniques and model simplifications to achieve high computational efficiency. However, their accuracy may deteriorate at high C-rates, and parameter estimation remains sensitive to excitation design and operating conditions [7].
From a mathematical modeling perspective, these approaches represent a hierarchy of model reduction strategies, ranging from full-order coupled PDE systems (P2D) to low-order surrogate representations (ECM). Each class of models involves a different trade-off between accuracy, computational cost, and physical interpretability.
From a computational perspective, parameter identification in electrochemical battery models remains a challenging inverse problem due to the large number of strongly coupled parameters and varying degrees of identifiability. These structural properties significantly increase estimation complexity, making accurate determination of individual parameter contributions difficult. As a result, a wide range of identification methods has been developed, spanning classical optimization techniques and data-driven approaches.
Common strategies include evolutionary algorithms such as genetic algorithms [8,9,10], particle swarm optimization [11,12], and related heuristic methods, which iteratively minimize the discrepancy between model predictions and experimental data. To improve efficiency, sensitivity-based approaches have also been proposed; for example, Gu et al. [13] introduced a sensitivity-oriented stepwise optimization (SSO) method based on the Sobol framework, enabling parameter decoupling and more efficient staged optimization.
Probabilistic approaches such as Bayesian inference provide a framework for parameter estimation under uncertainty by incorporating prior knowledge [14,15,16], while machine learning methods, including neural networks [17] and support vector machines, enable data-driven parameter inference from experimental observations [18]. In particular, Li et al. [18] demonstrated a hybrid artificial intelligence framework using the Cuckoo search algorithm for parameter identification in P2D models, achieving robust estimation from operational data.
Hybrid approaches combining multiple optimization and learning strategies have also gained attention, as they improve robustness and convergence properties while mitigating limitations of individual methods [19,20,21]. For instance, Huang et al. [19] proposed a hybrid optimization framework combining Cuckoo search and particle swarm optimization for electrochemical model parameter estimation.
Ultimately, the choice of a parameter identification method depends on model complexity, data availability, and the specific objectives of the estimation problem.
A quantitative comparison reported in recent studies highlights the trade-offs between electrochemical battery models. P2D/DFN models achieve the highest accuracy but require the highest computational effort, while SPM-based models significantly reduce computational cost but introduce larger approximation errors under high C-rate conditions. SP+ models provide a compromise between accuracy and efficiency, whereas ECMs achieve minimal computational costs but lack physical interpretability. These observations confirm that no single model simultaneously optimizes accuracy, computational efficiency, and physical insight [22,23,24].
Despite extensive research on electrochemical modeling and parameter identification, most existing studies address either model accuracy, computational efficiency, or parameter estimation independently. A unified framework that jointly evaluates validation accuracy, computational cost, and parameter sensitivity analysis remains limited in the literature. In particular, global probabilistic sensitivity analysis combined with uncertainty propagation has not been sufficiently explored for reduced electrochemical models.
In this work, the reduced electrochemical model is studied as an uncertainty-aware computational surrogate of the battery system. The contribution is integrative rather than methodological: reduced-order electrochemical modeling, inverse parameter identification, Monte Carlo uncertainty propagation, and comparative global sensitivity analysis are combined within one framework. The study does not perform design optimization, controller testing, or digital-twin operation; instead, it focuses on parameter prioritization and interpretation of model uncertainty from a mathematical and computational perspective.
The structure of this paper is as follows: Section 2 presents the electrochemical model suitable for parameters identification and real applications. Section 3 presents an approach used for uncertainty and sensitivity analysis of model results and parameters. Section 4 describes the experimental data, numerical simulations, validation results, and the results of sensitivity analysis, followed by summarized conclusions in Section 5.
2. Model of Lithium-Ion Battery
The model and life of lithium-ion batteries vary due to the chemical and physical properties of the batteries. Electrochemical models (EMs) are used to describe the internal reactions within batteries through three key transport phenomena: migration, diffusion, and convection. Since convection has a minimal effect, it is typically neglected in battery modeling. Among the most widely used electrochemical models are the P2D and the SP models. These models allow the assessment of battery aging mechanisms.
The P2D model, grounded in porous electrode theory, describes lithium transport along the electrode thickness (macroscale) and diffusion within spherical particles (microscale). It represents the active material as spherical particles distributed across the electrode domain, enabling the modeling of concentration gradients driven by the electrolyte.
In the P2D and related models, lithium-ion transport dynamics in the electrolyte phase are considered along the x-direction, while diffusion in the solid phase is described in the radial coordinate under a spherical particle assumption, with electrochemical reactions occurring at the particle surface. The model comprises ten coupled nonlinear partial differential equations governing mass and charge conservation in both the solid and electrolyte phases [2]. These equations form a nonlinear PDE-coupled system defined on a mixed spatial domain, combining a one-dimensional macroscopic coordinate and a radial microscopic coordinate.
The solid-phase diffusion in the particles along the particles, as well as the diffusion of lithium-ions in the liquid-phase across the electrode thickness, are governed by Fick’s second law of diffusion. Meanwhile, the electrochemical reactions occurring at the solid/liquid interface of the particles are described by the Butler–Volmer equation of chemical kinetics [2].
Due to its complexity, the P2D model requires considerable computational resources and time to solve. An effective way to lower this computational complexity is to derive approximate analytical solutions of the PDEs governing diffusion in both the liquid and solid phases. Through model simplification and parameter regrouping, the number of physical parameters can be reduced, while their interdependencies are decoupled, making them easier to determine.
A further simplification of the P2D model is the SP model, which offers significantly reduced computational costs. In this approach, the electrode-thickness dimension present in the P2D model is removed, and each electrode is represented by a single spherical particle, while the electrolyte phase is neglected. This reduction eliminates spatial dependence in the electrolyte phase and reduces the system to a single-particle radial diffusion problem, significantly decreasing the dimensionality of the original PDE system.
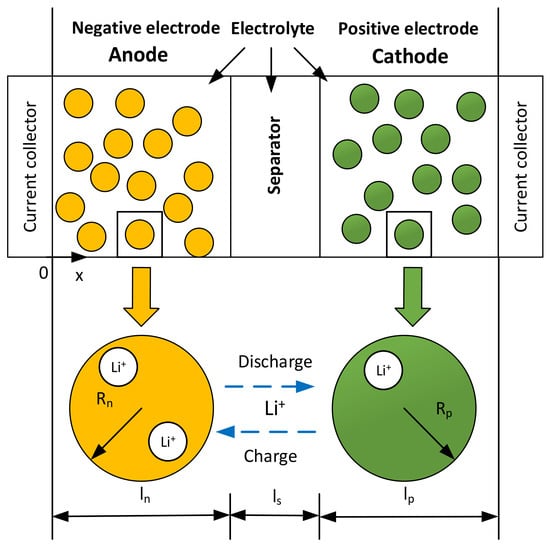
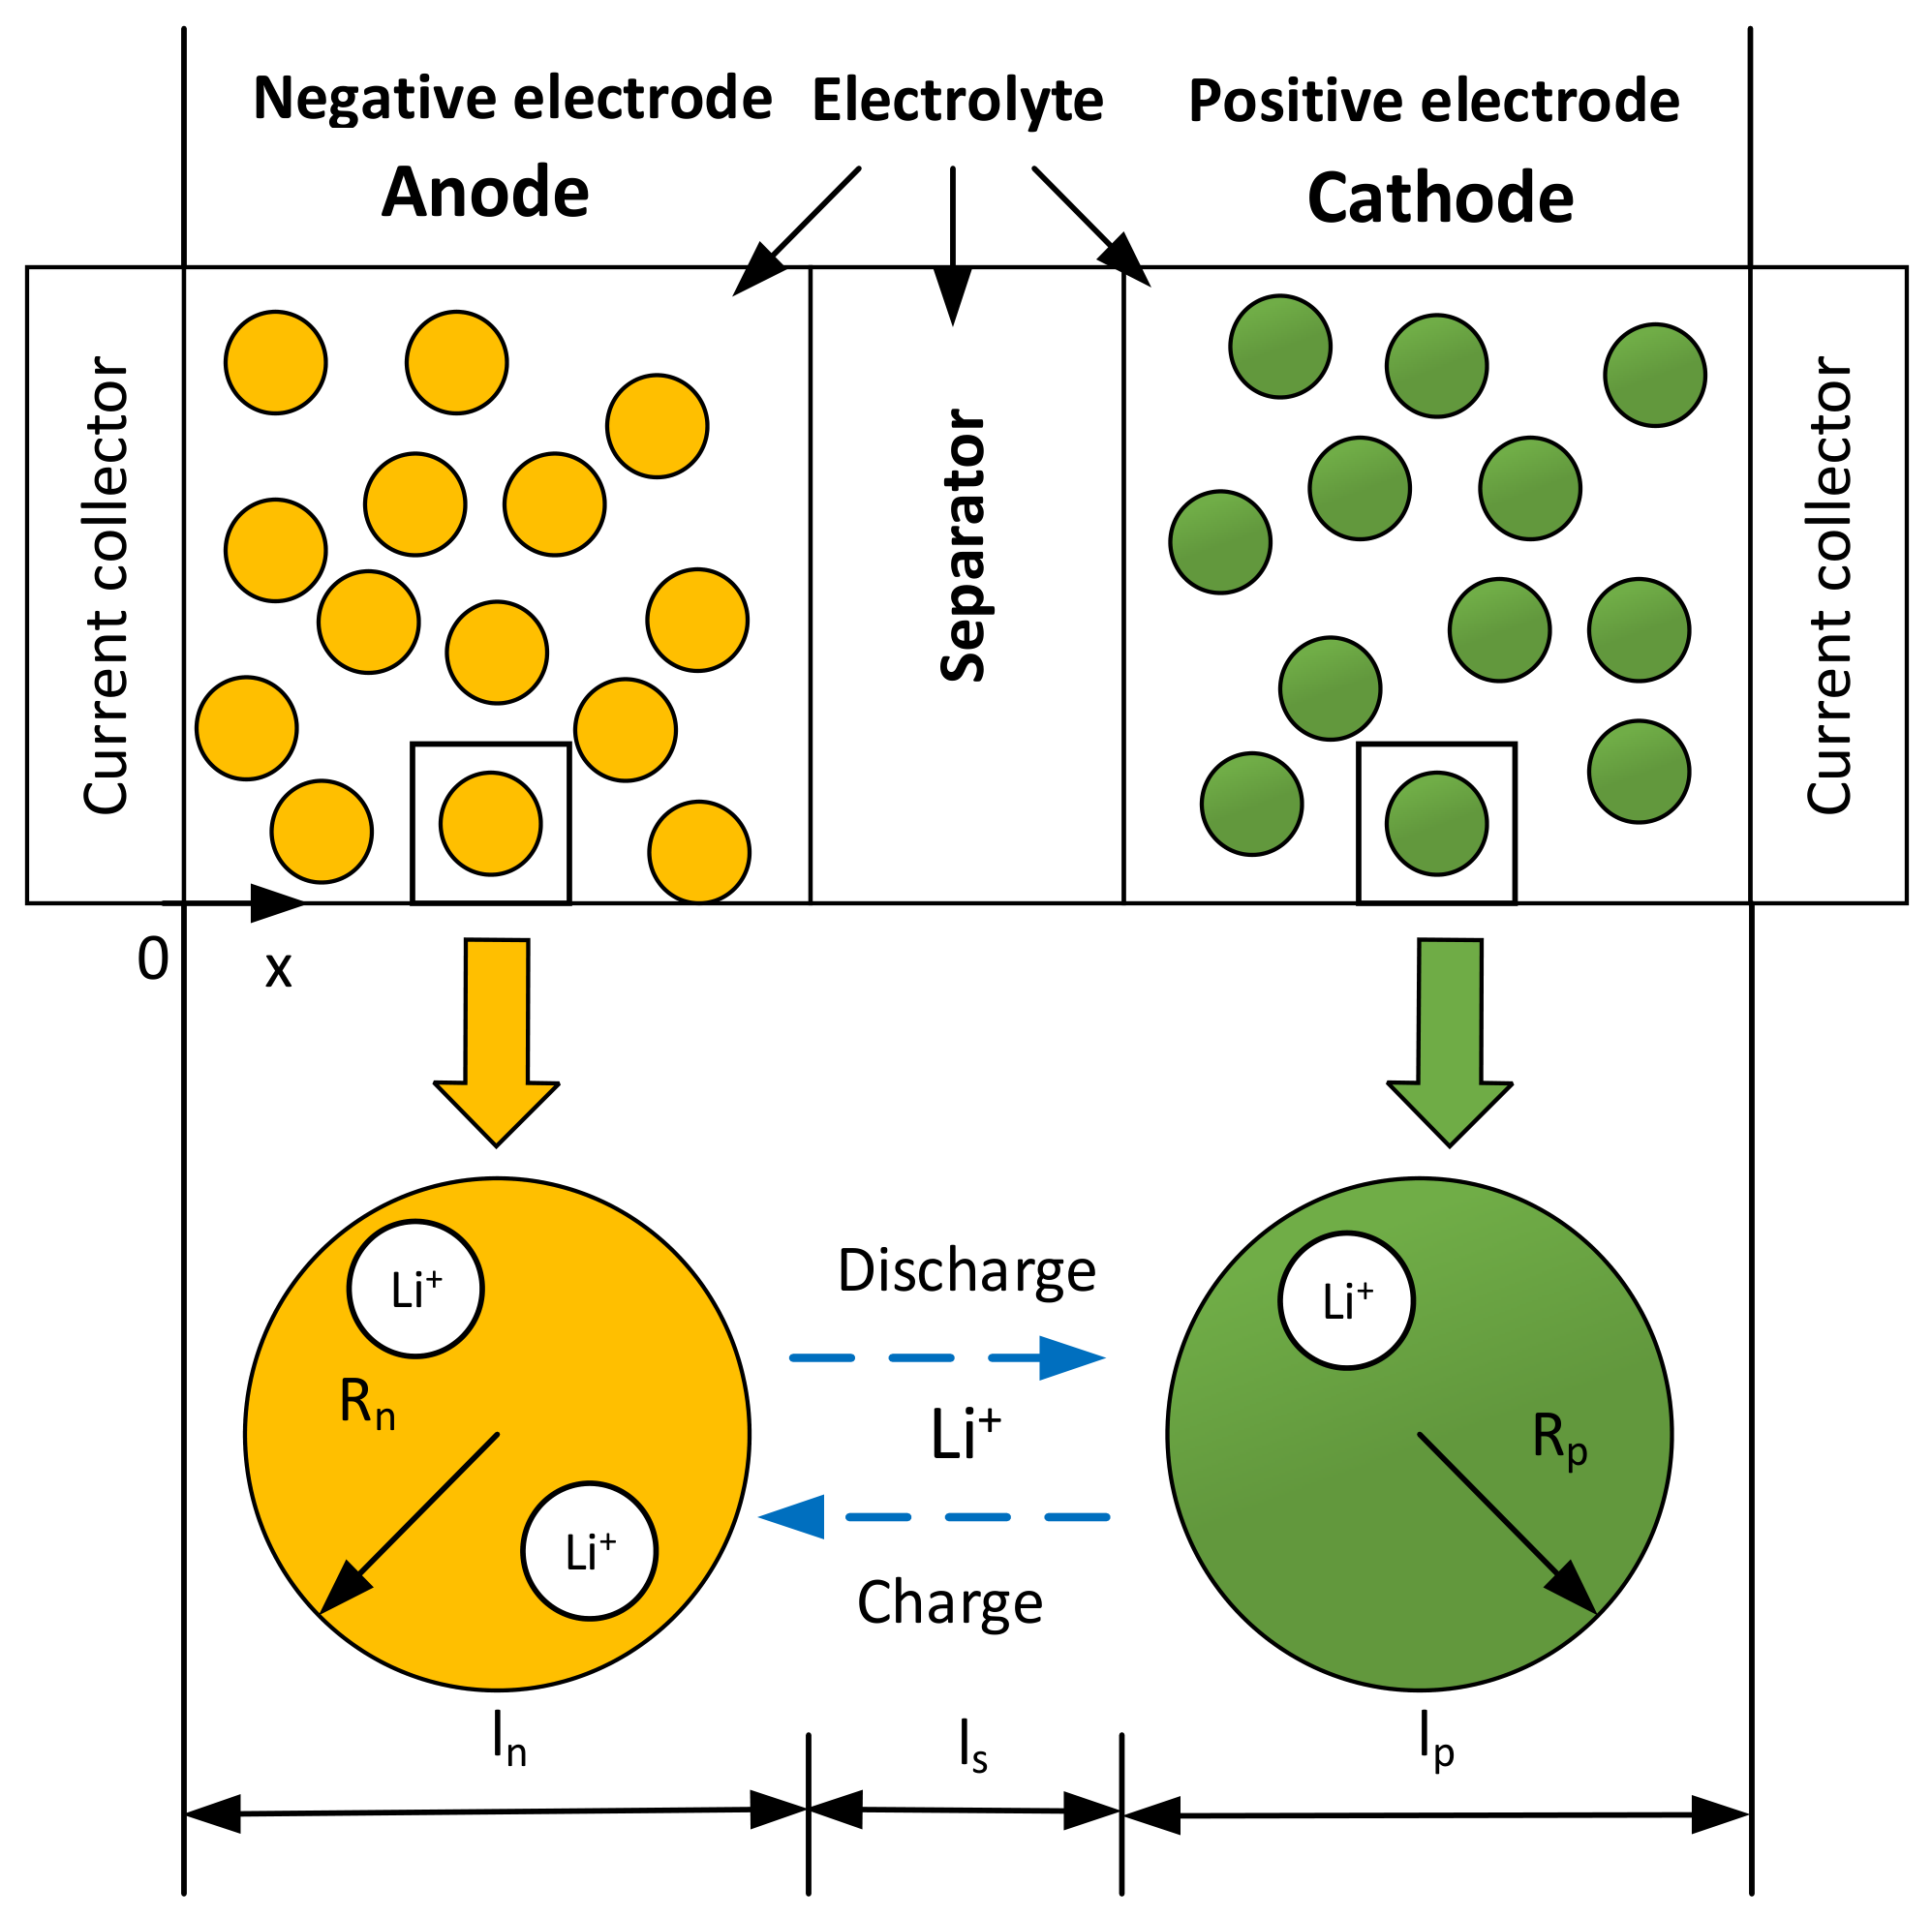
A standard lithium-ion battery cell consists of three key components: porous negative and positive electrodes, a separator, and an electrolyte (Figure 1). During the discharge process, lithium ions (Li+) diffuse to the surface of the active material particles, where they participate in an electrochemical reaction that generates electrons. The Li+ then migrates through the electrolyte to the positive electrode, where they are reinserted into the active material. The dynamics of the cell depend on its chemistry, especially on both the lithium concentration and the speed of its diffusion and uptake.
Figure 1.
Schematic representation of 3 key regions in a lithium-ion cell (models: P2D and SP).
Lithium-ion batteries are available in several chemistries, each offering distinct advantages and trade-offs in terms of energy density, safety, cost, and cycle life. Lithium iron phosphate is valued for its excellent thermal stability, long cycle life, and strong safety characteristics, making it especially attractive for applications where reliability and safety are prioritized over maximum energy density [25].
In the SP model, it is assumed that all particles in each electrode are identical and behave in a similar manner. As a result, each electrode can be modelled as a single spherical particle with a radius , where the subscript or denotes the positive or negative electrode, as shown in Figure 1. Additionally, the current through an electrode is assumed to be evenly distributed across all the particles. Lithium ions move within the spherical solid particle via diffusion, described by Fick’s second law of diffusion [26]:
where is the solid-phase lithium-ion concentration, is time, is the radial coordinate, is the solid-phase diffusion coefficient, and is the radius of the solid-phase particle. This equation represents a nonlinear diffusion process in spherical coordinates, where the radial symmetry reduces the governing equation to a one-dimensional parabolic PDE.
The initial concentration for (1) is
where is the initial solid-phase lithium-ion concentration.
The model of concentrations on the boundary
where represents the molar flux of lithium ions at the surface and can be expressed as [27]:
where is the total current passing through the cell tabs, is the total electroactive surface area of the electrode , and is Faraday’s constant. In this work, the current sign convention is defined such that corresponds to charging (lithium insertion into the positive electrode), while corresponds to discharging. This convention is consistently used throughout all model equations, including diffusion boundary conditions, SOC evolution, and terminal voltage computation. The boundary conditions ensure zero flux at the particle center and a flux-driven Neumann condition at the particle surface, coupling the diffusion dynamics with the electrochemical reaction current.
However, the SP model does not account for concentration and potential distributions in the electrolyte phase. An extended model that incorporates lithium-ion transport in the electrolyte is referred to as the SP+ model [2]. In this formulation, the pore-wall flux density is approximated based on the applied current density. This extension reintroduces electrolyte-phase dynamics, partially restoring the spatial coupling neglected in the SP formulation while maintaining a reduced-order structure.
Let denote the applied current. Under the assumption of a uniform reaction distribution within the electrodes, the reactive ion current density at the two collectors can be determined using the following expressions:
where , are the thicknesses of the positive and negative electrodes, , are the porosity of the positive and negative electrodes, , are the effective porosities of the positive and negative electrode, is the effective area of the electrodes.
In the SP+ model, a simplified method for solid-phase diffusion based on a three-parameter parabolic approximation [28] is applied to derive expressions for the average solid-phase concentration and the surface solid-phase concentration of active particles . In this approximation, the radial concentration profile inside a spherical particle is represented by a parabolic form, and the coefficients in the resulting expressions follow from the average-concentration balance and the surface-flux boundary condition [2,28]:
where is an auxiliary state variable introduced by the parabolic approximation to represent the curvature of the solid-phase concentration profile. Under constant current conditions, it can be expressed as:
Equation (9) is the analytical solution of the corresponding first-order differential equation
Under dynamic conditions, this differential equation is discretized in time using a forward Euler scheme, which yields [2]:
Parabolic profile approximation reduces the original PDE system to a set of time-dependent ODEs, enabling efficient numerical implementation while preserving key diffusion characteristics.
The state of charge (SOC) for both positive and negative electrodes is defined as the ratio of the local lithium-ion concentration to the maximum concentration of lithium-ions that can actively participate in electrochemical reactions within the electrode [27]:
The initial and surface SOCs for positive and negative electrodes are defined as follows, respectively:
As indicated in (12) and (13), the initial is a constant, whereas the surface varies with time.
The surface concentration of solid-phase lithium ions determines the open-circuit potentials of the electrodes, denoted by and . The open-circuit voltage (OCV) of the battery, defined as the difference between the electrode potentials, is given by
This definition assumes quasi-equilibrium conditions at the electrode interfaces, where kinetic overpotentials are neglected. The empirical expressions for and in the LiFePO4/graphite system are provided in Section 4.2.4, where the OCV–SOC relationships are represented using composite analytical functions.
Usually, the SP+ model offers greater computational efficiency compared with the P2D model, making it more suitable for large-scale simulations or real-time applications. Nevertheless, due to the interdependence of its internal structures and physical parameters, accurately determining the model parameters remains a nontrivial problem. In particular, parameters, including diffusion coefficients, geometric properties, and effective electrochemical parameters, are often difficult to measure directly and must instead be inferred from experimental data through parameter identification or optimization techniques. This leads to an inverse problem formulation, where model parameters are inferred from observable terminal voltage data.
3. Uncertainty and Sensitivity Analysis
Once the battery model has been developed and the results are obtained, it is crucial to evaluate the uncertainty and sensitivity associated with these results. The consideration of uncertainty is essential for any further model application or decision-making [29]. The method of probabilistic quantification of result uncertainty and of result sensitivity to parameter uncertainty is discussed below.
Initially, uncertainty analysis is intended to assess how uncertain the estimates of the dependent variables are. Probabilistic sensitivity analysis, which is closely related, focuses on quantifying how uncertainties in the input parameters contribute to the overall uncertainty of the model’s response [29,30].
The purpose of the sensitivity analysis of results is the following:
- to estimate the sensitivity of simulation results impacted by parameters,
- to analyze the influence of the main assumptions on the final results.
The estimation of the variation of model results when model parameters change is important for [5]:
- analyzing the probabilities of values of model results;
- finding parameters that are most important for the accuracy of model results;
- understanding the main dependencies of system behavior.
Using sensitivity analysis, it can be estimated which parameter values improve accuracy and reduce uncertainty in model results, and which parameter corrections are not meaningful due to their small influence on model variation [31]. Thus, the results of sensitivity analysis [32] may show which variables are worth correcting to improve accuracy and which corrections have little influence on the result of uncertainty.
For initial uncertainty and sensitivity analyses, Monte Carlo (MC) simulations might be used. The simulations involve running the model multiple times with different values of input parameters (variables or factors) based on their probability distributions [33].
The outcomes of these or similar simulations might then be applied to identify:
- The degree of uncertainty in the model’s predictions;
- Identification of which input variables contributed to this uncertainty.
Generally, the process of simulation-based or sample-based analysis comprises five main steps [34]:
- Definition of input parameters. The input parameters of the model are defined as random variables, and each uncertain parameter is assigned a probability distribution. This approach maintains the representation of model uncertainty.
- Generation of random samples. Using different combinations of input parameters, sets of random parameter samples are generated. This procedure statistically allows a representative study of the entire parameter space.
- Model evaluation. Each generated parameter sample is used for calculations, obtaining a set of model outputs. This creates a representation that describes the model’s behavior under varying input values.
- Uncertainty analysis. The model results are analyzed using statistical methods to determine key characteristics such as means, variance, and other indicators. This step allows for a quantitative assessment of the model uncertainty.
- Sensitivity analysis. The influence of input parameters on model results is evaluated using indicators such as correlation coefficients. This analysis allows us to identify the parameters that mostly determine the uncertainty of the model.
Various software tools, like SimLab [33], may help with such a process for probabilistic uncertainty and sensitivity analysis. SimLab was developed by the European Commission’s Joint Research Centre (JRC) and used in this study (specifically, the SimLab 2.2 version). It offers a comprehensive framework for performing uncertainty and global sensitivity analyses, including Monte Carlo sampling-based and variance-based sensitivity analysis methods. The software was used as a computational environment for generating parameter samples and estimating relevant sensitivity indices.
For a randomly generated sample of values for parameters, several sensitivity indices are commonly available when performing sensitivity analysis:
- Pearson (PEAR) and Spearman (SPEA) correlation coefficients;
- Partial (PCC) and partial rank (PRCC) correlation coefficients;
- Standardized (SRC) and standardized rank (SRRC) regression coefficients;
- Smirnov indices.
PEAR indices are simple linear correlation coefficients between each parameter and the resulting model outputs. To obtain SPEA indices, a rank transformation is applied to model inputs and outputs before calculating correlation coefficients. Rank transformations substitute raw data values for their ranks within the set: the smallest value is assigned rank 1, the second smallest—rank 2, and so on. Sensitivity indices employing rank transformations are better suited for measuring monotonic non-linear relationships between inputs and outputs.
The PCC index measures the correlation between a parameter and the model output after removing the linear effects of other parameters. For parameter and model output , two linear regression models are built:
Partial correlation coefficients are then obtained by calculating the correlation between variables and . PRCC is like the PCC obtained on ranked data.
SRC indices are obtained by building a linear regression model for output values using parameter values :
where are coefficients of the linear regression model associated with parameters , determined using the least squares method or other approaches. Each coefficient is then standardized using the standard deviations of the related parameter () and model output ().
The standardized coefficients can then be used for sensitivity analysis regardless of parameter ranges and scales. SRRC indices are obtained by performing a rank transformation before the process. Additionally, the coefficient of determination () can be calculated to measure the goodness of fit of the built regression model. This way can be used to measure the validity of both SRC and SRRC indices for the analyzed model.
Smirnov indices quantify the influence of a parameter on model output distribution using the Kolmogorov–Smirnov test statistic. Based on a predetermined threshold, model outputs are separated into behavioral and non-behavioral groups. For each group and parameter, a cumulative distribution function (CDF) is constructed. For parameter , the Smirnov sensitivity index is calculated as
where is the CDF of behavioral outputs, and —the CDF of non-behavioral outputs. Smirnov indices are moment-independent and effective for non-linear non-monotonic models [35].
Additionally, quasi-Monte Carlo samples of parameters might be generated to calculate Sobol sensitivity indices. Sobol indices decompose output variance into portions assigned to parameters and their interactions (combinations), as described in [32]. Sobol indices are effective in global sensitivity analysis for non-linear non-monotonic models. For this study, first-order (no interactions) and total-order (all interactions) Sobol indices were also calculated for each parameter.
4. Experimental and Simulation Analysis
4.1. Data Description and Preprocessing
The experimental data were collected during tests of the electrical behavior of a lithium iron phosphate (LiFePO4) battery. During the experiment, the main battery parameters, current and terminal voltage, were recorded. Measurements were taken at discrete time intervals throughout the experiment.
It should be noted that no additional experimental datasets under different operating conditions (e.g., varying current profiles, C-rates, temperatures, or different cells) were available; therefore, the analysis is based on this single measured dataset.
Before performing the analysis, standard preprocessing steps were applied [36,37]. First, all records containing missing values were removed. From the initial dataset of 674,304 samples, 555,036 samples (82.31%) were identified as empty and excluded from further processing. This resulted in a cleaned dataset of 119,268 valid measurements (17.69% of the original dataset).
After preprocessing, a uniform downsampling (every 100th sample) was applied to reduce data density and computational cost. This operation was justified by the relatively slow-varying nature of the battery current and voltage signals compared to the original sampling frequency. As a result, the essential temporal structure of the data was preserved, including the transitions between discharging and charging regimes.
Importantly, the retained current values exhibit only minor local variation over adjacent samples in the original dataset, meaning that the downsampling does not distort the underlying dynamics or remove significant transient behavior. Statistical inspection of the full and reduced datasets confirmed that the distributions of current and voltage remain consistent after downsampling, preserving the physical representativeness of the data.
Formally, the processed dataset can be described as a discrete-time sequence:
where denotes the time index, ∈ ℝ is the current, ∈ ℝ is the terminal voltage, and 1192 is the total number of samples after preprocessing.
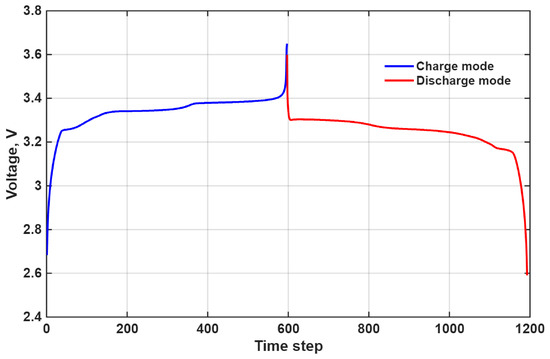
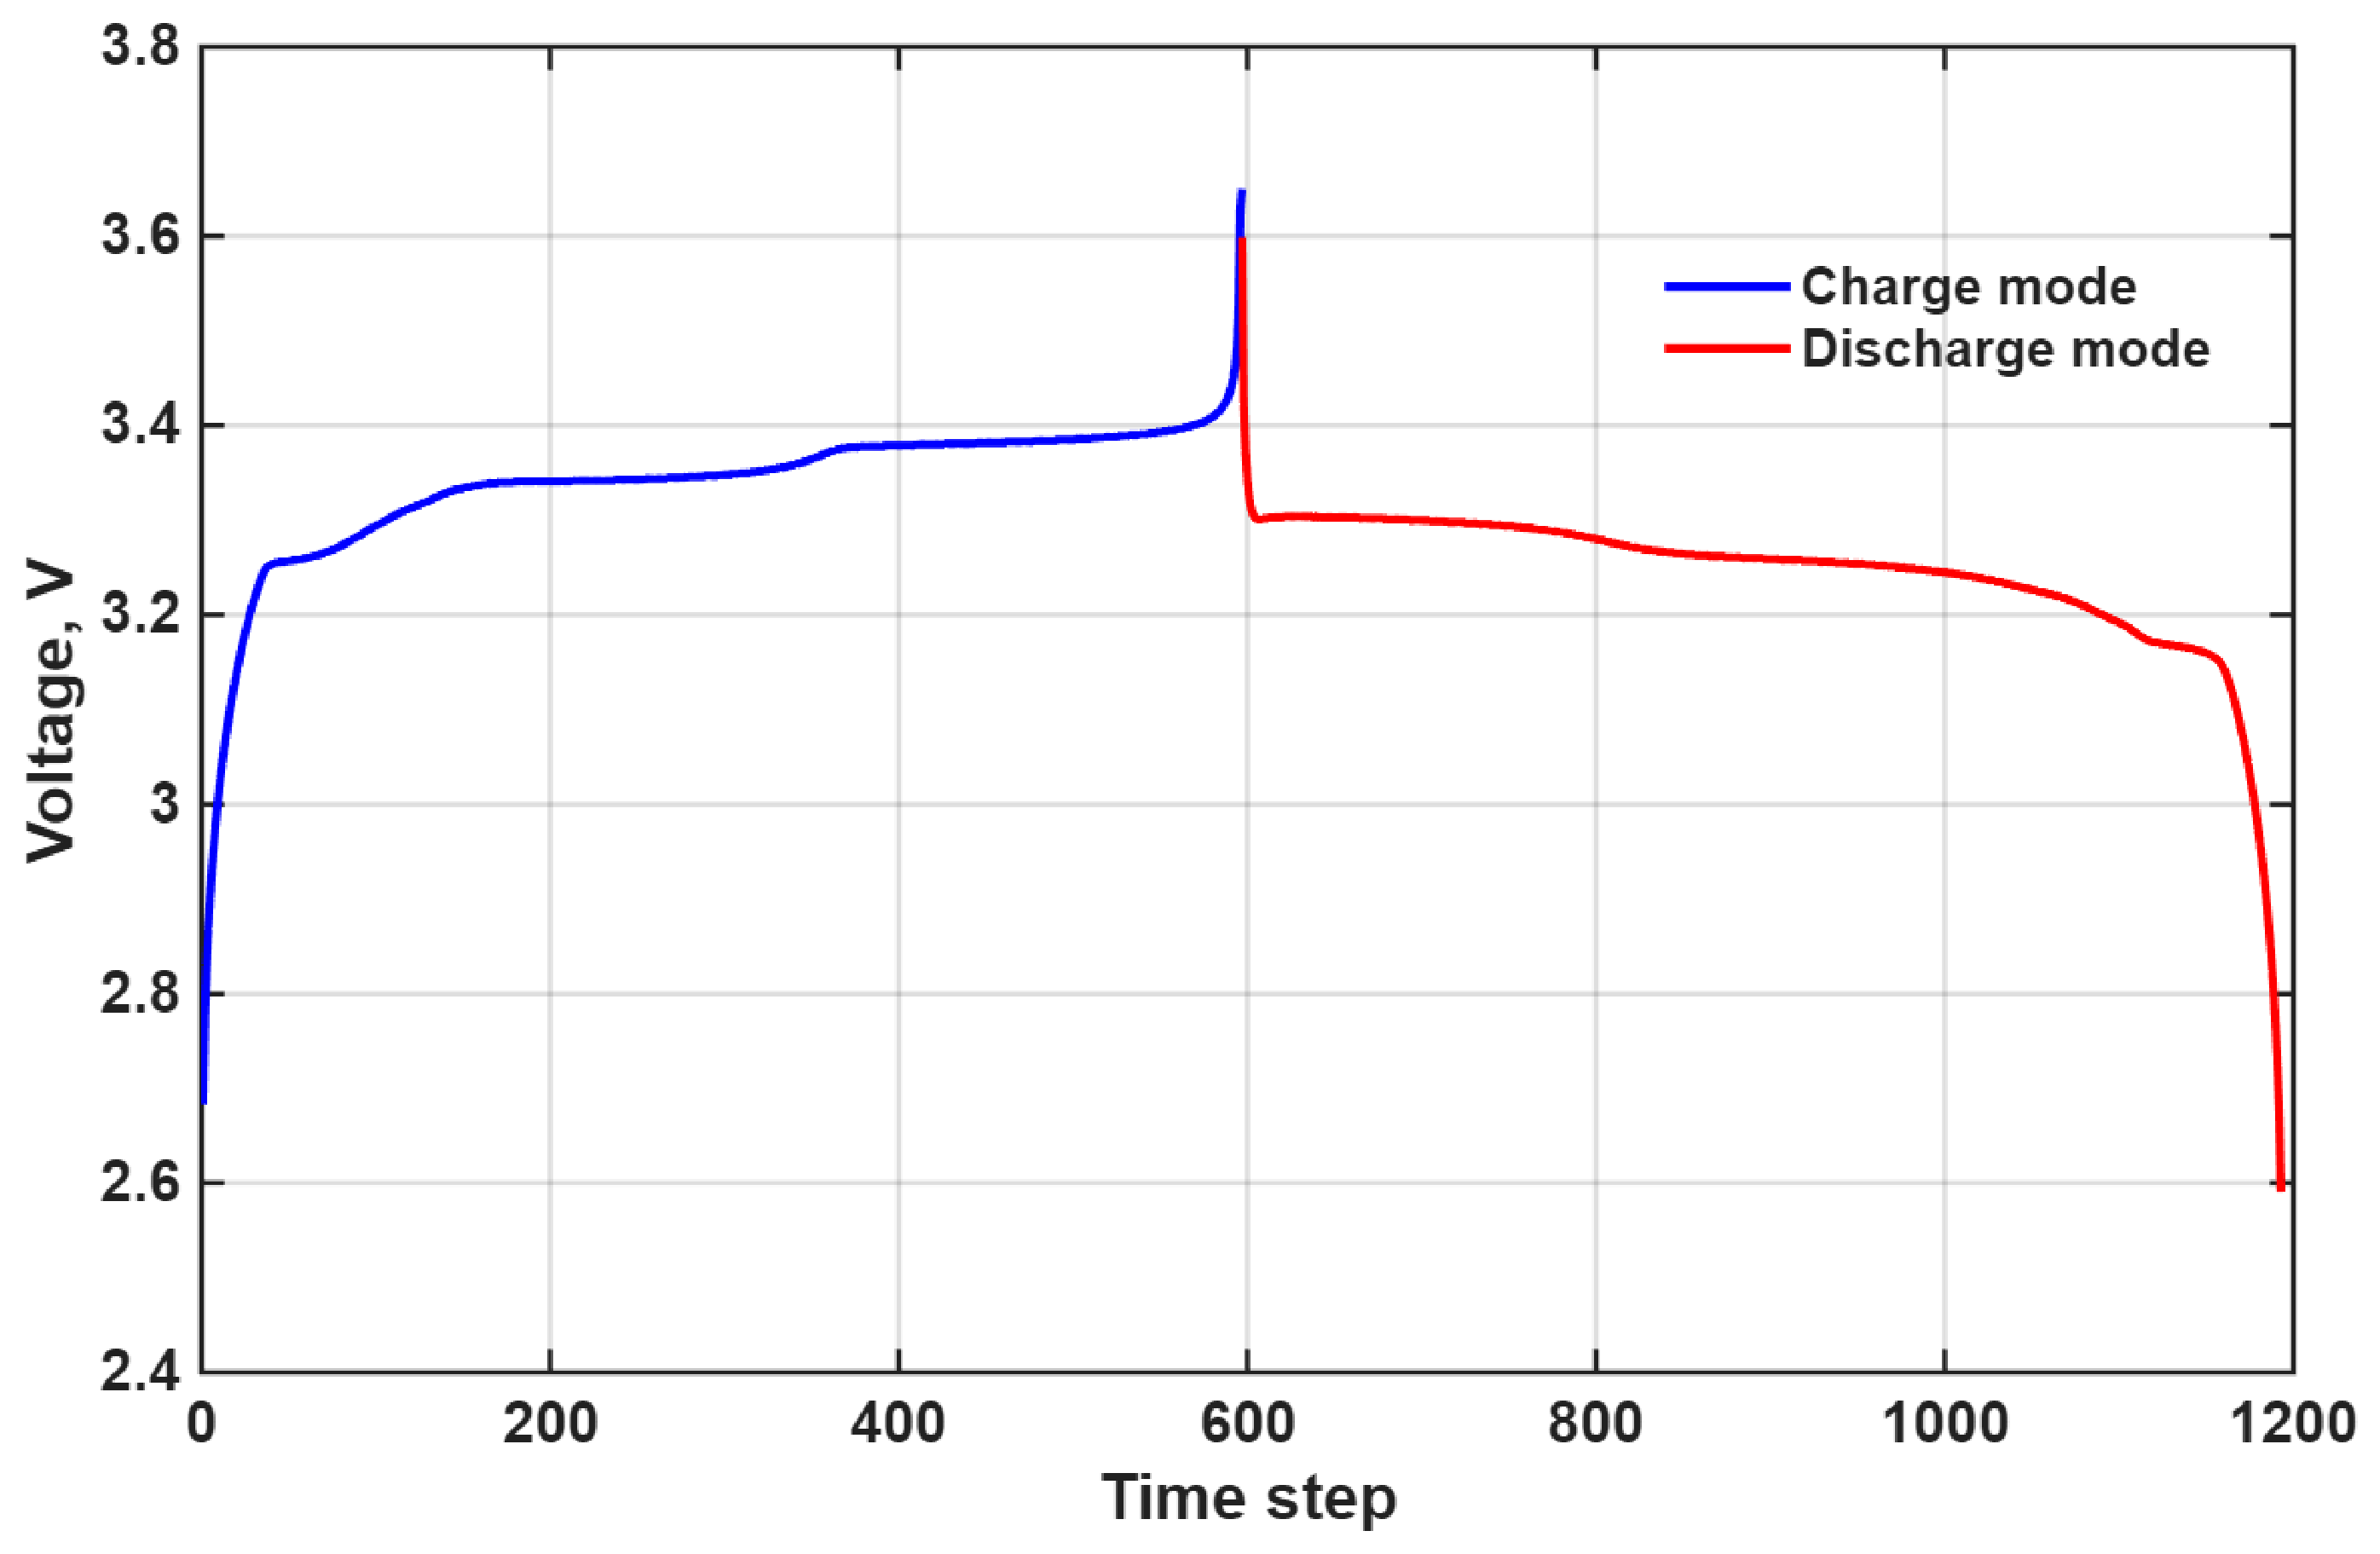
The data were divided into charging and discharging modes based on the sign of the current, i.e., corresponds to charging, while corresponds to discharging. This ensures that both operational regimes are fully preserved in the reduced dataset. The data analysis showed that during charging, the terminal voltage increased, whereas during discharging, the voltage decreased. During the experiment, the current varied between −13 A and 13 A, while the terminal voltage ranged from 2.6 V to 3.63 V, corresponding to the typical operating range of LiFePO4 batteries [3]. The measured terminal voltage during charge and discharge is shown in Figure 2.
Figure 2.
Experimentally measured voltage as a function of time with color-coded current regimes.
The processed dataset was used for parameter identification and in-sample model evaluation by analyzing the discrete-time input–output relationship between current and voltage.
4.2. Simulation Results and Model Validation
4.2.1. Model Formulation and Numerical Implementation
The experimental LiFePO4 cell was modeled using the SP+ electrochemical model, which describes solid-phase concentration dynamics and captures the dependence of terminal voltage on current.
Since the exact electrochemical parameters of the investigated cell were not available, the model parameters were selected based on values reported in the literature for LiFePO4 cells. This approach ensures physically consistent model behavior and is widely adopted in battery modeling studies. The parameter set used in the model is presented in Table 1.
Table 1.
List of parameters used in the battery model.
The SP+ model parameters are obtained through a combination of literature-based values and inverse modeling using experimental measurements. Geometric parameters, including electrode thicknesses, porosity, and maximum solid-phase concentrations, are fixed according to reported values for LiFePO4 cells, ensuring physical consistency of the model structure. The particle radii and solid-phase diffusion coefficients are treated as calibration variables and are refined within bounded physically admissible ranges through an optimization-based identification procedure. The internal resistance and initial state of charge are directly estimated from experimental data to ensure consistency with the measured electrical response.
From a mathematical perspective, the identified parameters represent effective quantities that capture the aggregated behavior of underlying electrochemical processes within the reduced-order SP+ formulation. All optimized parameters are constrained to lie within literature-based bounds, ensuring that the resulting solution remains physically meaningful and consistent with known material properties.
The internal resistance was estimated based on the ratio of the change in voltage to the change in current:
where is the change in terminal voltage, and is the corresponding change in current. This procedure enables the identification of the linear voltage response to current variations and allows the initial internal resistance of the battery to be determined under the experimental conditions.
The initial state of charge of the battery was determined from the first measured terminal voltage by selecting an SOC value that minimizes the difference between the modeled and measured open-circuit voltage (OCV). The corresponding initial concentrations were calculated according to:
This approach ensures that the model initialization is directly linked to the experimental data, which increases model reliability and enables its application in real battery diagnostics or control algorithms.
The experimentally estimated initial state of charge is used to initialize the electrode-level SOC variables in the SP+ model through the corresponding initial solid-phase concentrations, ensuring consistency between the macroscopic experimental estimation and the microscopic model formulation. This provides a consistent link between the measured terminal voltage-based SOC estimation and the concentration-based SOC definition used in the model equations.
The model was discretized in time using an implicit finite difference scheme. The time step was selected to match the sampling interval of the experimental data, ensuring a one-to-one correspondence between measurements and simulation points. At each time step, the resulting nonlinear system of equations was solved iteratively within MATLAB R2022b. The numerical implementation was performed in the MATLAB environment, including model initialization, parameter configuration, time-domain simulation, and post-processing of results. Convergence of the iterative procedure at each time step was ensured using a fixed relative tolerance criterion, while the implicit formulation provided numerical stability for the selected discretization.
4.2.2. Optimization-Based Parameter Identification
The identification of the SP+ model parameters was formulated as a nonlinear optimization problem, aiming to minimize the discrepancy between the modeled and experimentally measured terminal voltage.
Let denote the vector of model parameters, which includes the solid-phase diffusion coefficients and particle radii:
The effective electrode area was not included in the optimization vector and was treated as a fixed parameter based on literature values due to its strong coupling with particle radius and diffusion-related parameters, which may lead to identifiability issues.
The parameter identification problem is defined by minimizing the objective function:
where is the terminal voltage predicted by the SP+ model at time step , is the corresponding experimental measurement, and is the number of samples. The resulting optimization problem is a nonlinear least-squares problem, generally non-convex due to the nonlinear dependence of the state equations on the parameter vector.
The optimization problem is subject to physical constraints on the parameters:
where the bounds are selected based on literature values to ensure physical plausibility.
In this study, the nonlinear optimization problem was solved using the MATLAB lsqnonlin function. The initial parameter vector was defined as corresponding, respectively, to . The lower and upper bounds were defined as , . The solver was configured with a maximum of 200 iterations and MATLAB default tolerance settings.
Due to the nonlinear dependence of the model output on the parameters, the resulting optimization problem is generally non-convex and may contain multiple local minima. Therefore, numerical optimization techniques are required. In this study, the parameter identification problem was solved using a nonlinear least-squares approach, which provides an efficient and robust approximation of the optimal parameter set.
This formulation establishes a mathematically consistent inverse problem framework linking experimental voltage measurements with the reduced-order SP+ electrochemical model and serves as a basis for further extensions such as adaptive estimation and real-time battery state inference.
4.2.3. State-of-Charge Analysis
The state-of-charge (SOC) analysis was performed based on the simulation results of the SP+ model, which provides SOC values at each discrete time step. This enables a consistent analysis of the progression of both charging and discharging phases.
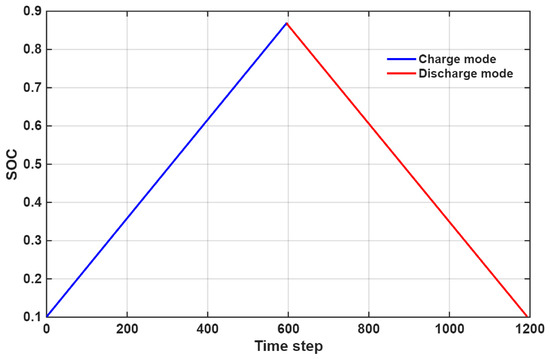
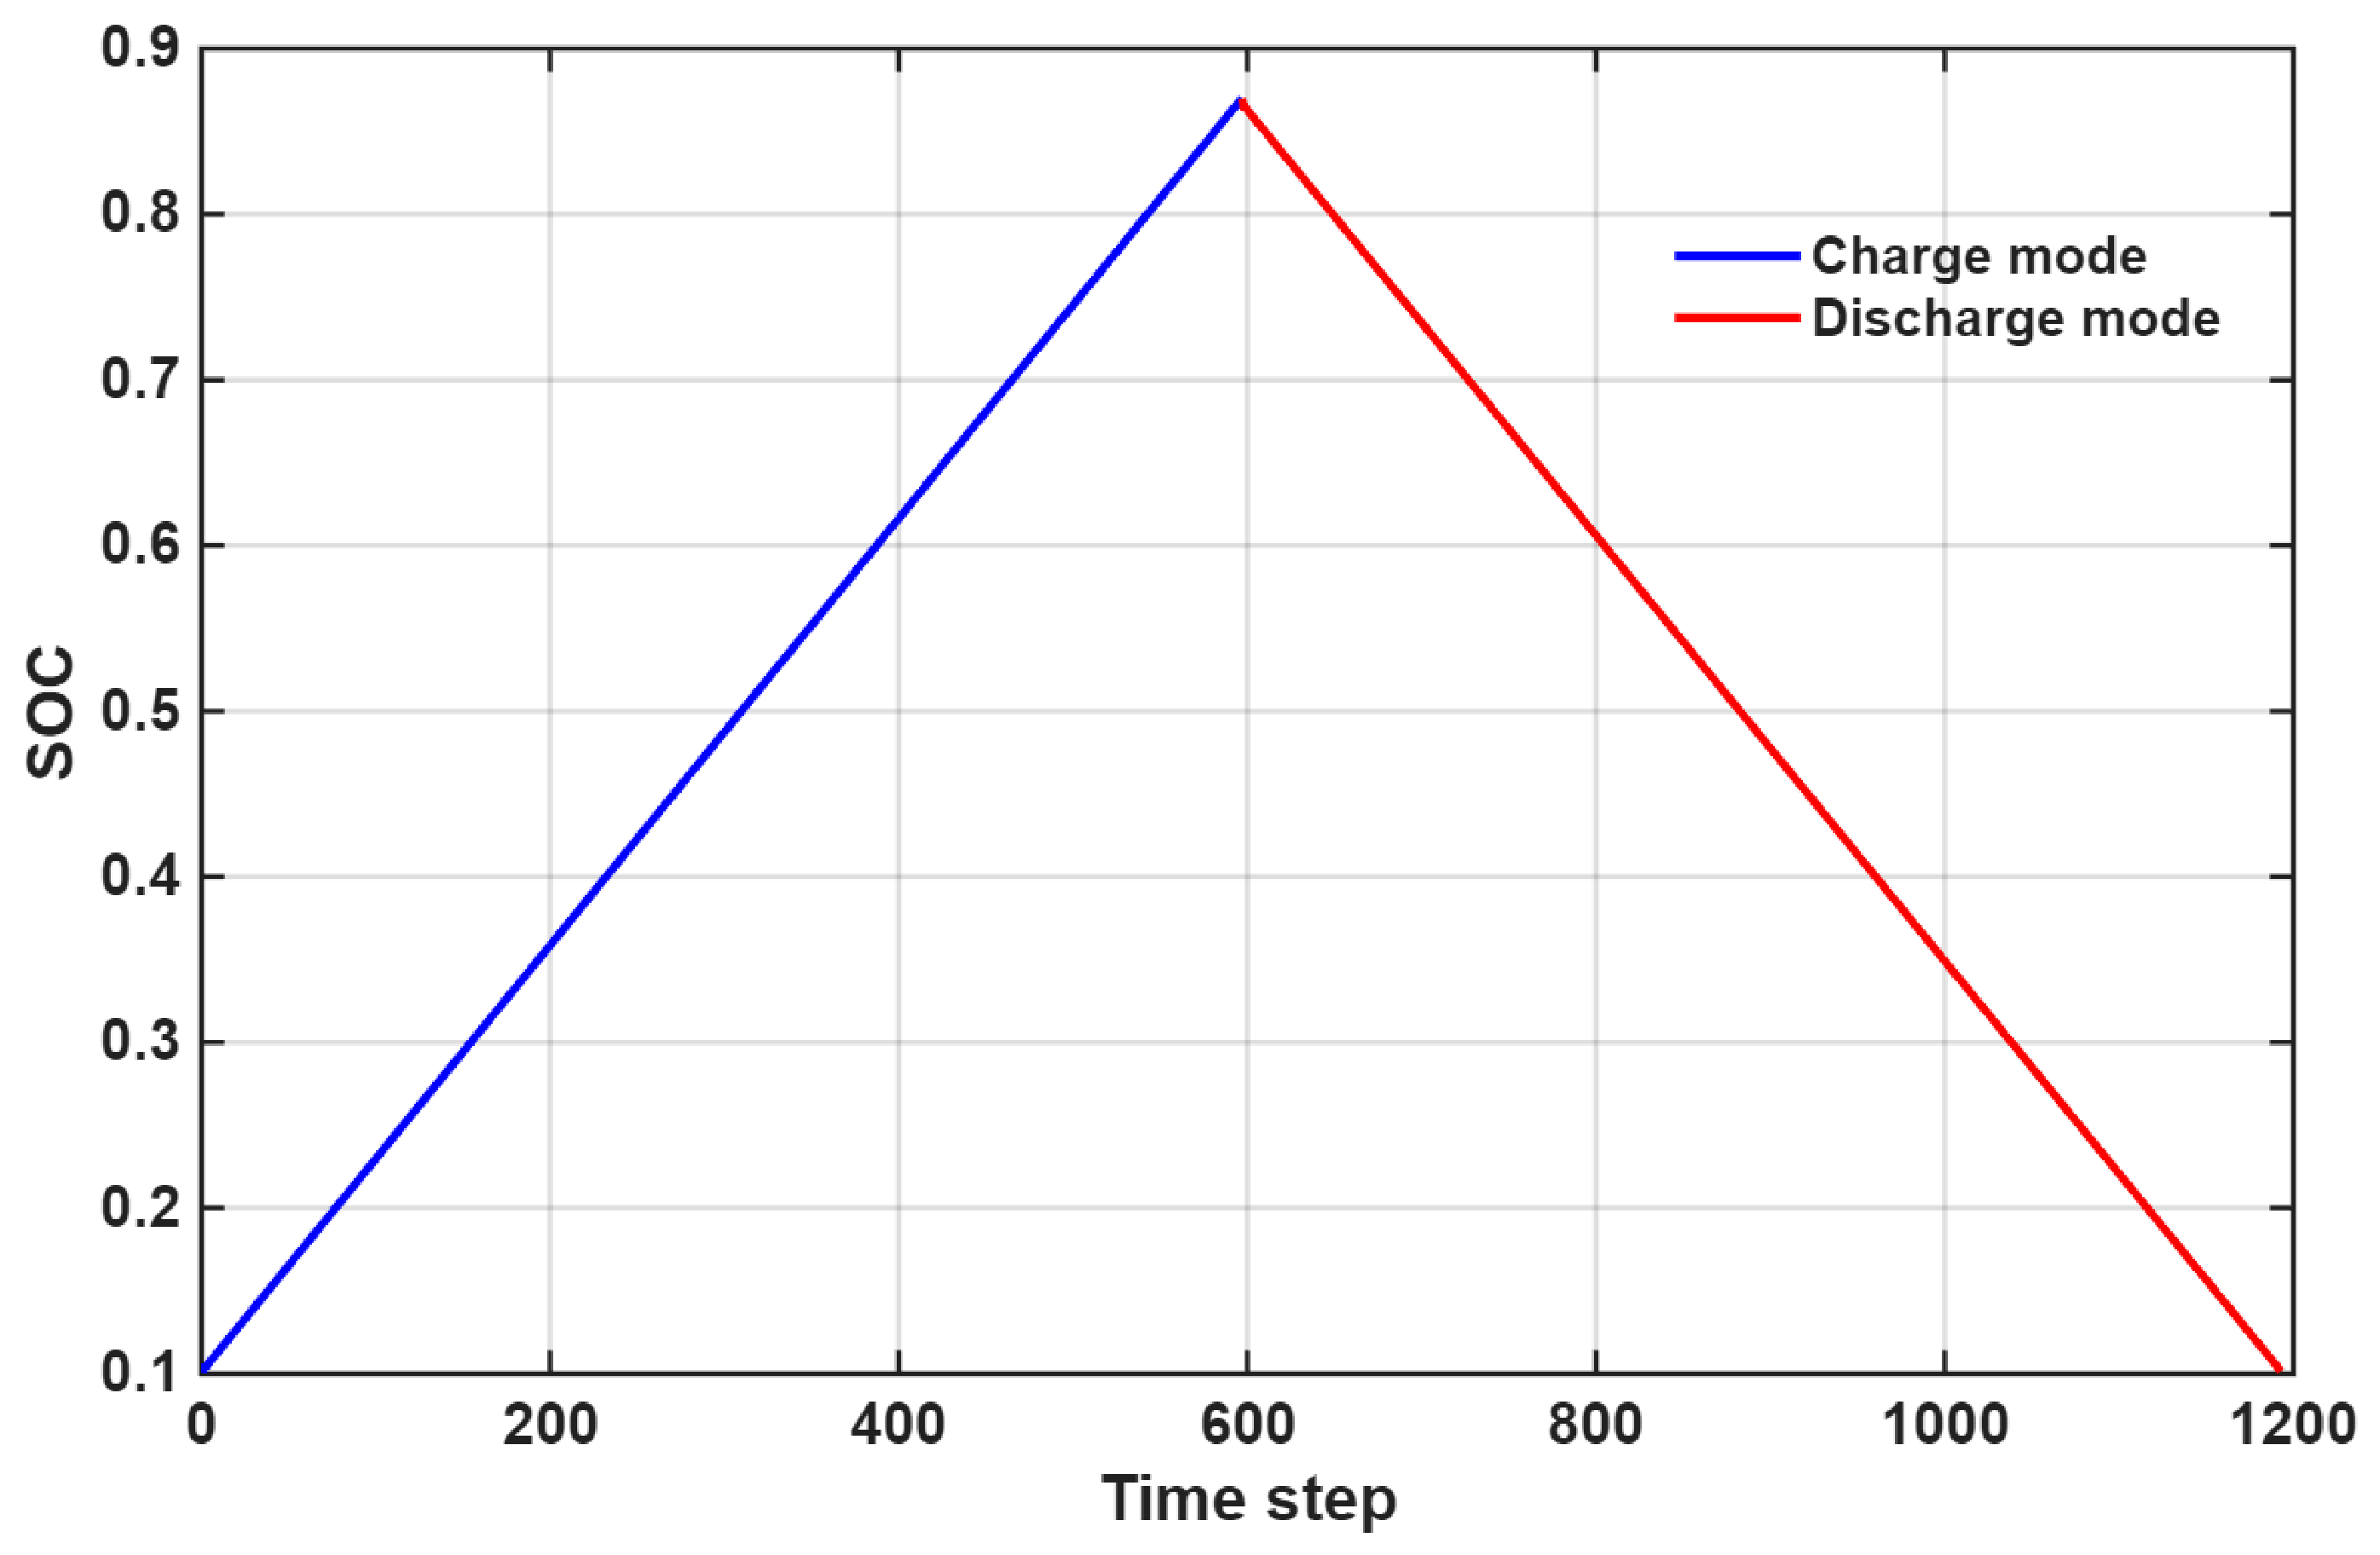
The SOC dynamics of the modeled LiFePO4 battery are presented in Figure 3, with charging () and discharging () modes distinguished based on the sign of the current. The SOC values vary in the range from approximately 0.1 to 0.87, corresponding to the selected initial and boundary conditions of the model.
Figure 3.
SOC dynamics of the battery during charging and discharging phases.
It can be observed that the increase in SOC during charging and the decrease during discharging are close to linear, which is consistent with a constant or slowly varying current regime in the modeled experiment. However, it should be noted that this behavior is observed specifically for the considered current profile and initialization conditions and should not be interpreted as a general property of LiFePO4 electrochemical dynamics.
Thus, the presented SOC response reflects the behavior of the simulated case study rather than a generalized validation of the model under all operating conditions.
The SOC dynamics form the basis for further voltage analysis, as each SOC value can be associated with the corresponding modeled open-circuit voltage (OCV) and terminal voltage. This allows for the evaluation of the model’s agreement with experimental data under different operating conditions.
4.2.4. OCV vs. SOC Analysis
To describe the electrical behavior of the LiFePO4 battery, empirical open-circuit potential (OCP) functions for the positive (cathode) and negative (anode) electrodes were incorporated into the SP+ electrochemical model. The electrode open-circuit potentials are defined as functions of their corresponding states of charge. Different analytical and empirical forms for electrode OCP–SOC relationships can be found in the literature, depending on battery chemistry and the intended modeling application [28,43,45]. In this work, these electrode OCP functions were adopted from prior model-development work for the same LiFePO4 battery. Since the objective of this paper is not to derive the electrode OCP functions themselves, but to analyze a probabilistic reduced-order SP+ model for lithium-ion batteries with uncertainty-based sensitivity analysis, these functions were kept fixed throughout the study.
The LiFePO4 cathode exhibits a characteristic OCV–SOC profile consisting of a steep increase at low SOC, a pronounced plateau in the mid-SOC region, and a gradual rise at high SOC. In contrast, the graphite anode OCV–SOC relationship is comparatively flat, with only minor nonlinear variations near the SOC boundaries [43]. These fundamentally different behaviors necessitate flexible analytical approximations capable of capturing both smooth and highly nonlinear regions.
To accurately represent these characteristics, a hybrid empirical formulation is employed. The adopted OCV functions combine polynomial terms and logarithmic terms to describe the overall OCV–SOC trend, while additional hyperbolic tangent terms improve the representation in regions with rapid voltage variation, particularly near low- and high-SOC boundaries.
This structure provides a smooth and differentiable approximation that is suitable for numerical simulation within the SP+ framework.
The cathode OCP is described as follows:
and the anode OCP is described as follows:
where and denote the surface state of charge of the cathode and anode, respectively. In this study, these OCP functions were treated as fixed model relations, and their suitability was evaluated through the resulting agreement between simulated and measured terminal voltage.
The open-circuit voltage of the cell is calculated as:
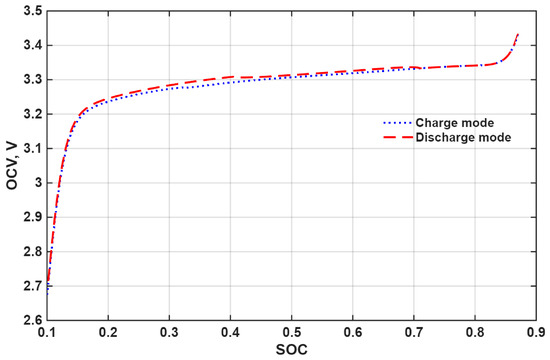
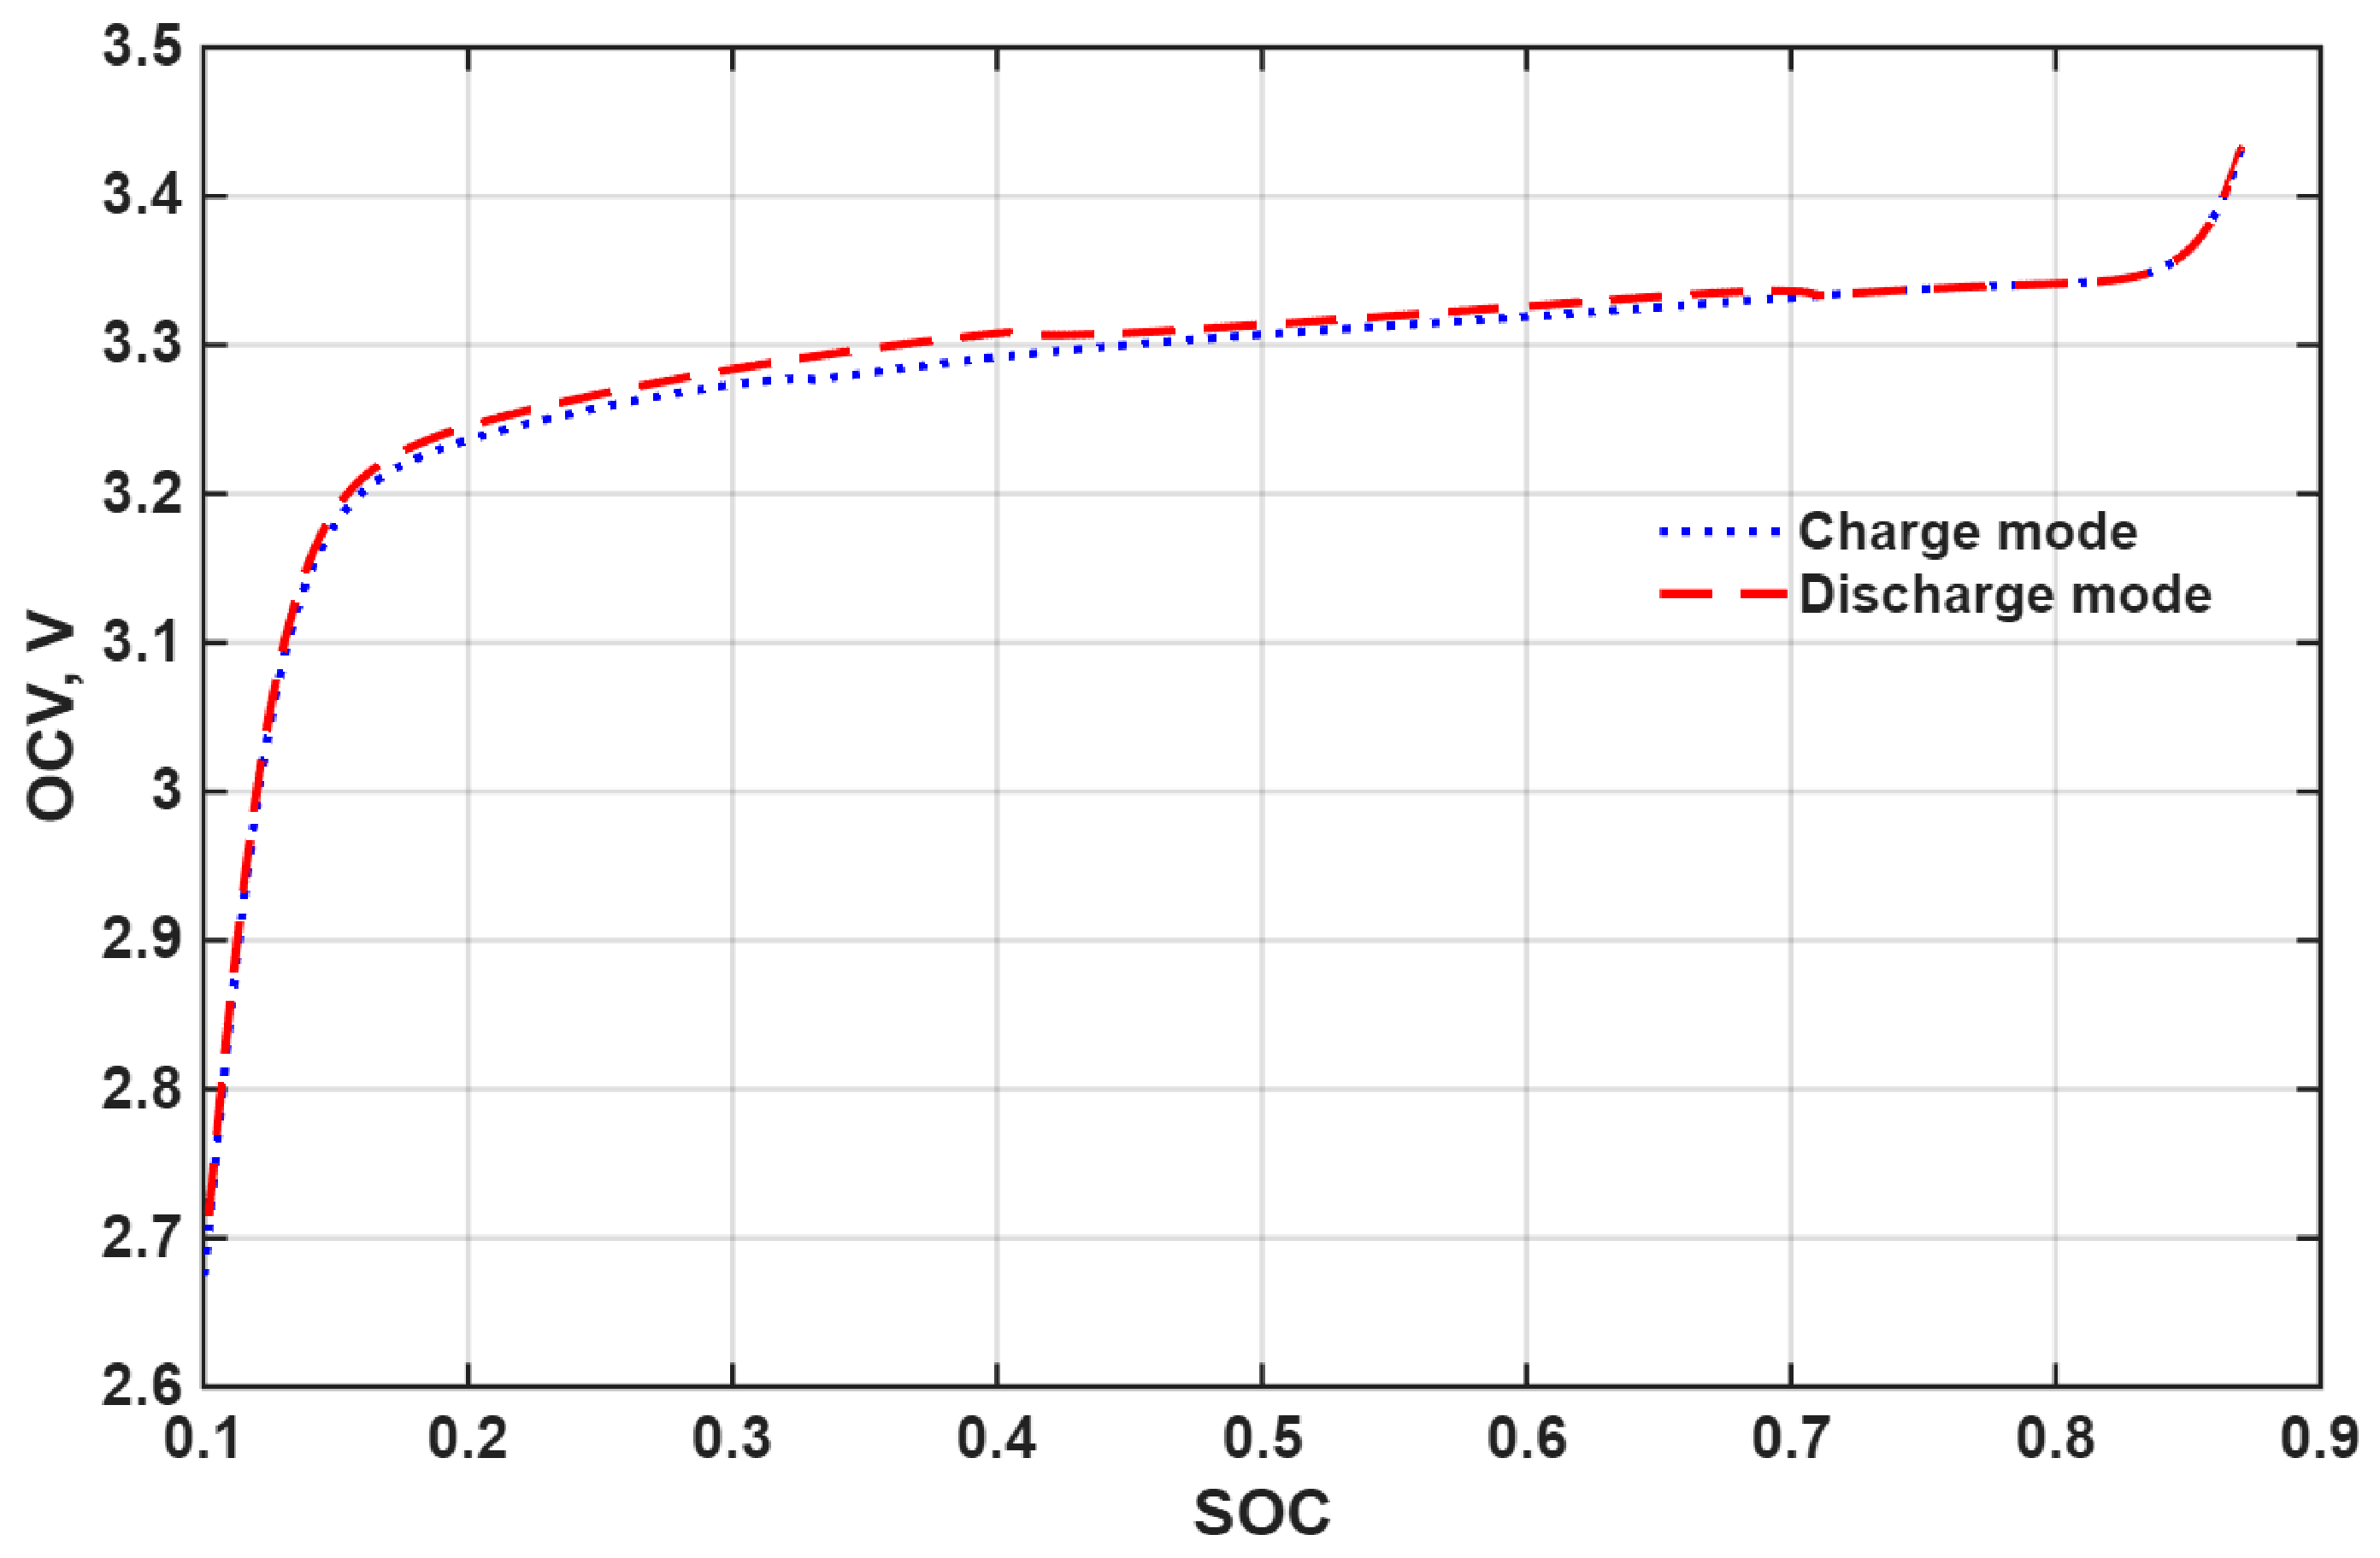
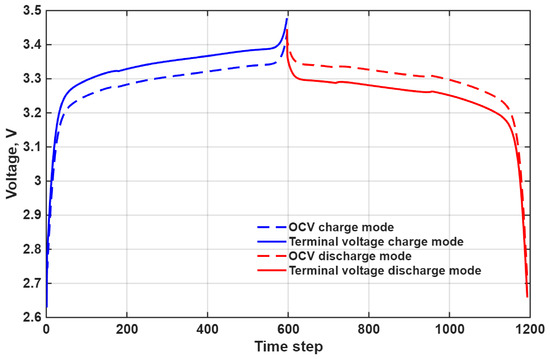
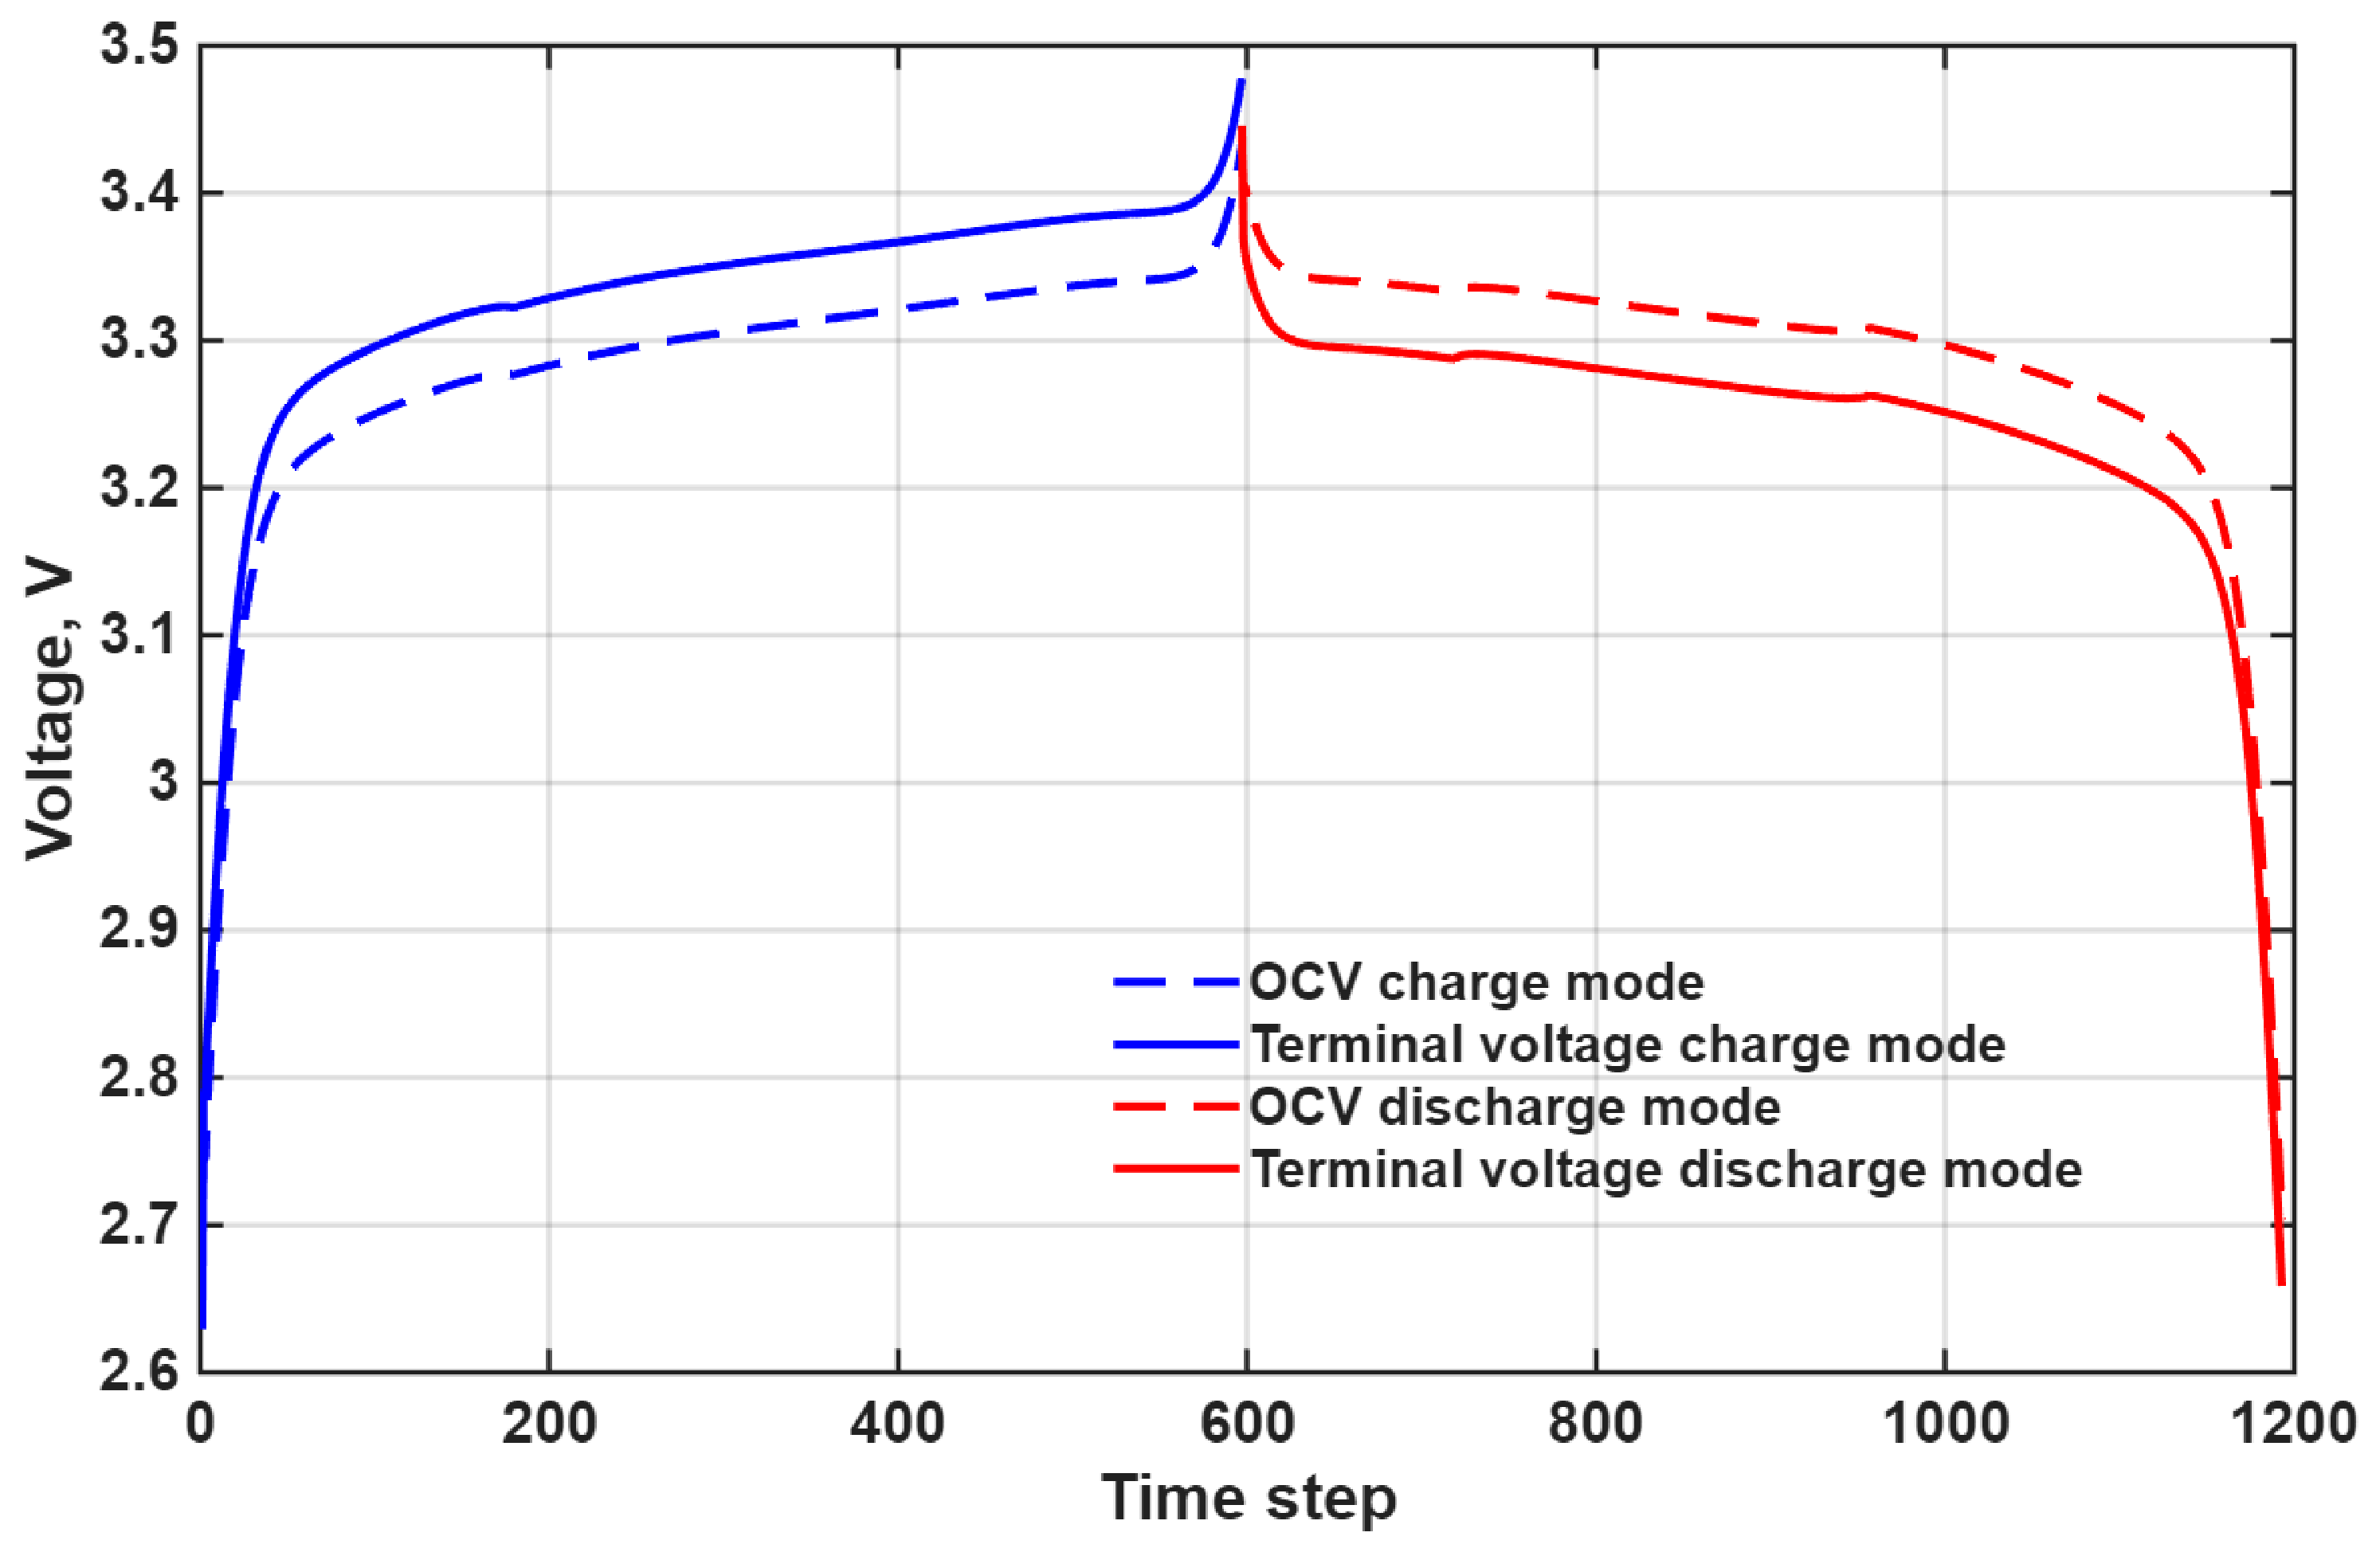
Figure 4 presents the OCV dependence on SOC, distinguishing between charging and discharging modes. In the analyzed interval, SOC varies approximately from 0.1 to about 0.87, while the OCV ranges from approximately 2.65 V to 3.45 V.
Figure 4.
OCV dependence on SOC in a LiFePO4 battery for charge and discharge modes.
It can be observed that OCV is a nonlinear function of SOC, characterized by relatively small variations in the mid-SOC region and steeper slopes at the extreme regions.
This dependence is used in the subsequent analysis to evaluate the modeling of terminal voltage and its agreement with the experimental data.
4.2.5. Terminal Voltage Modeling and Comparison
The terminal voltage in the SP+ model is computed from the difference of electrode open-circuit potentials and the ohmic overpotential:
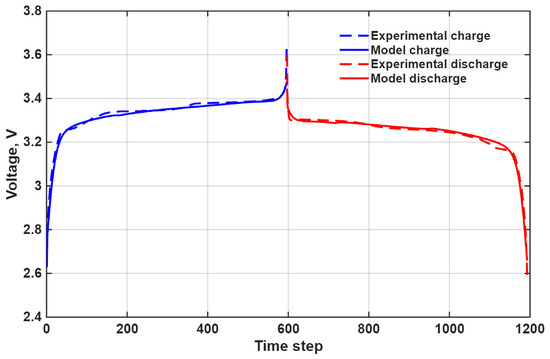
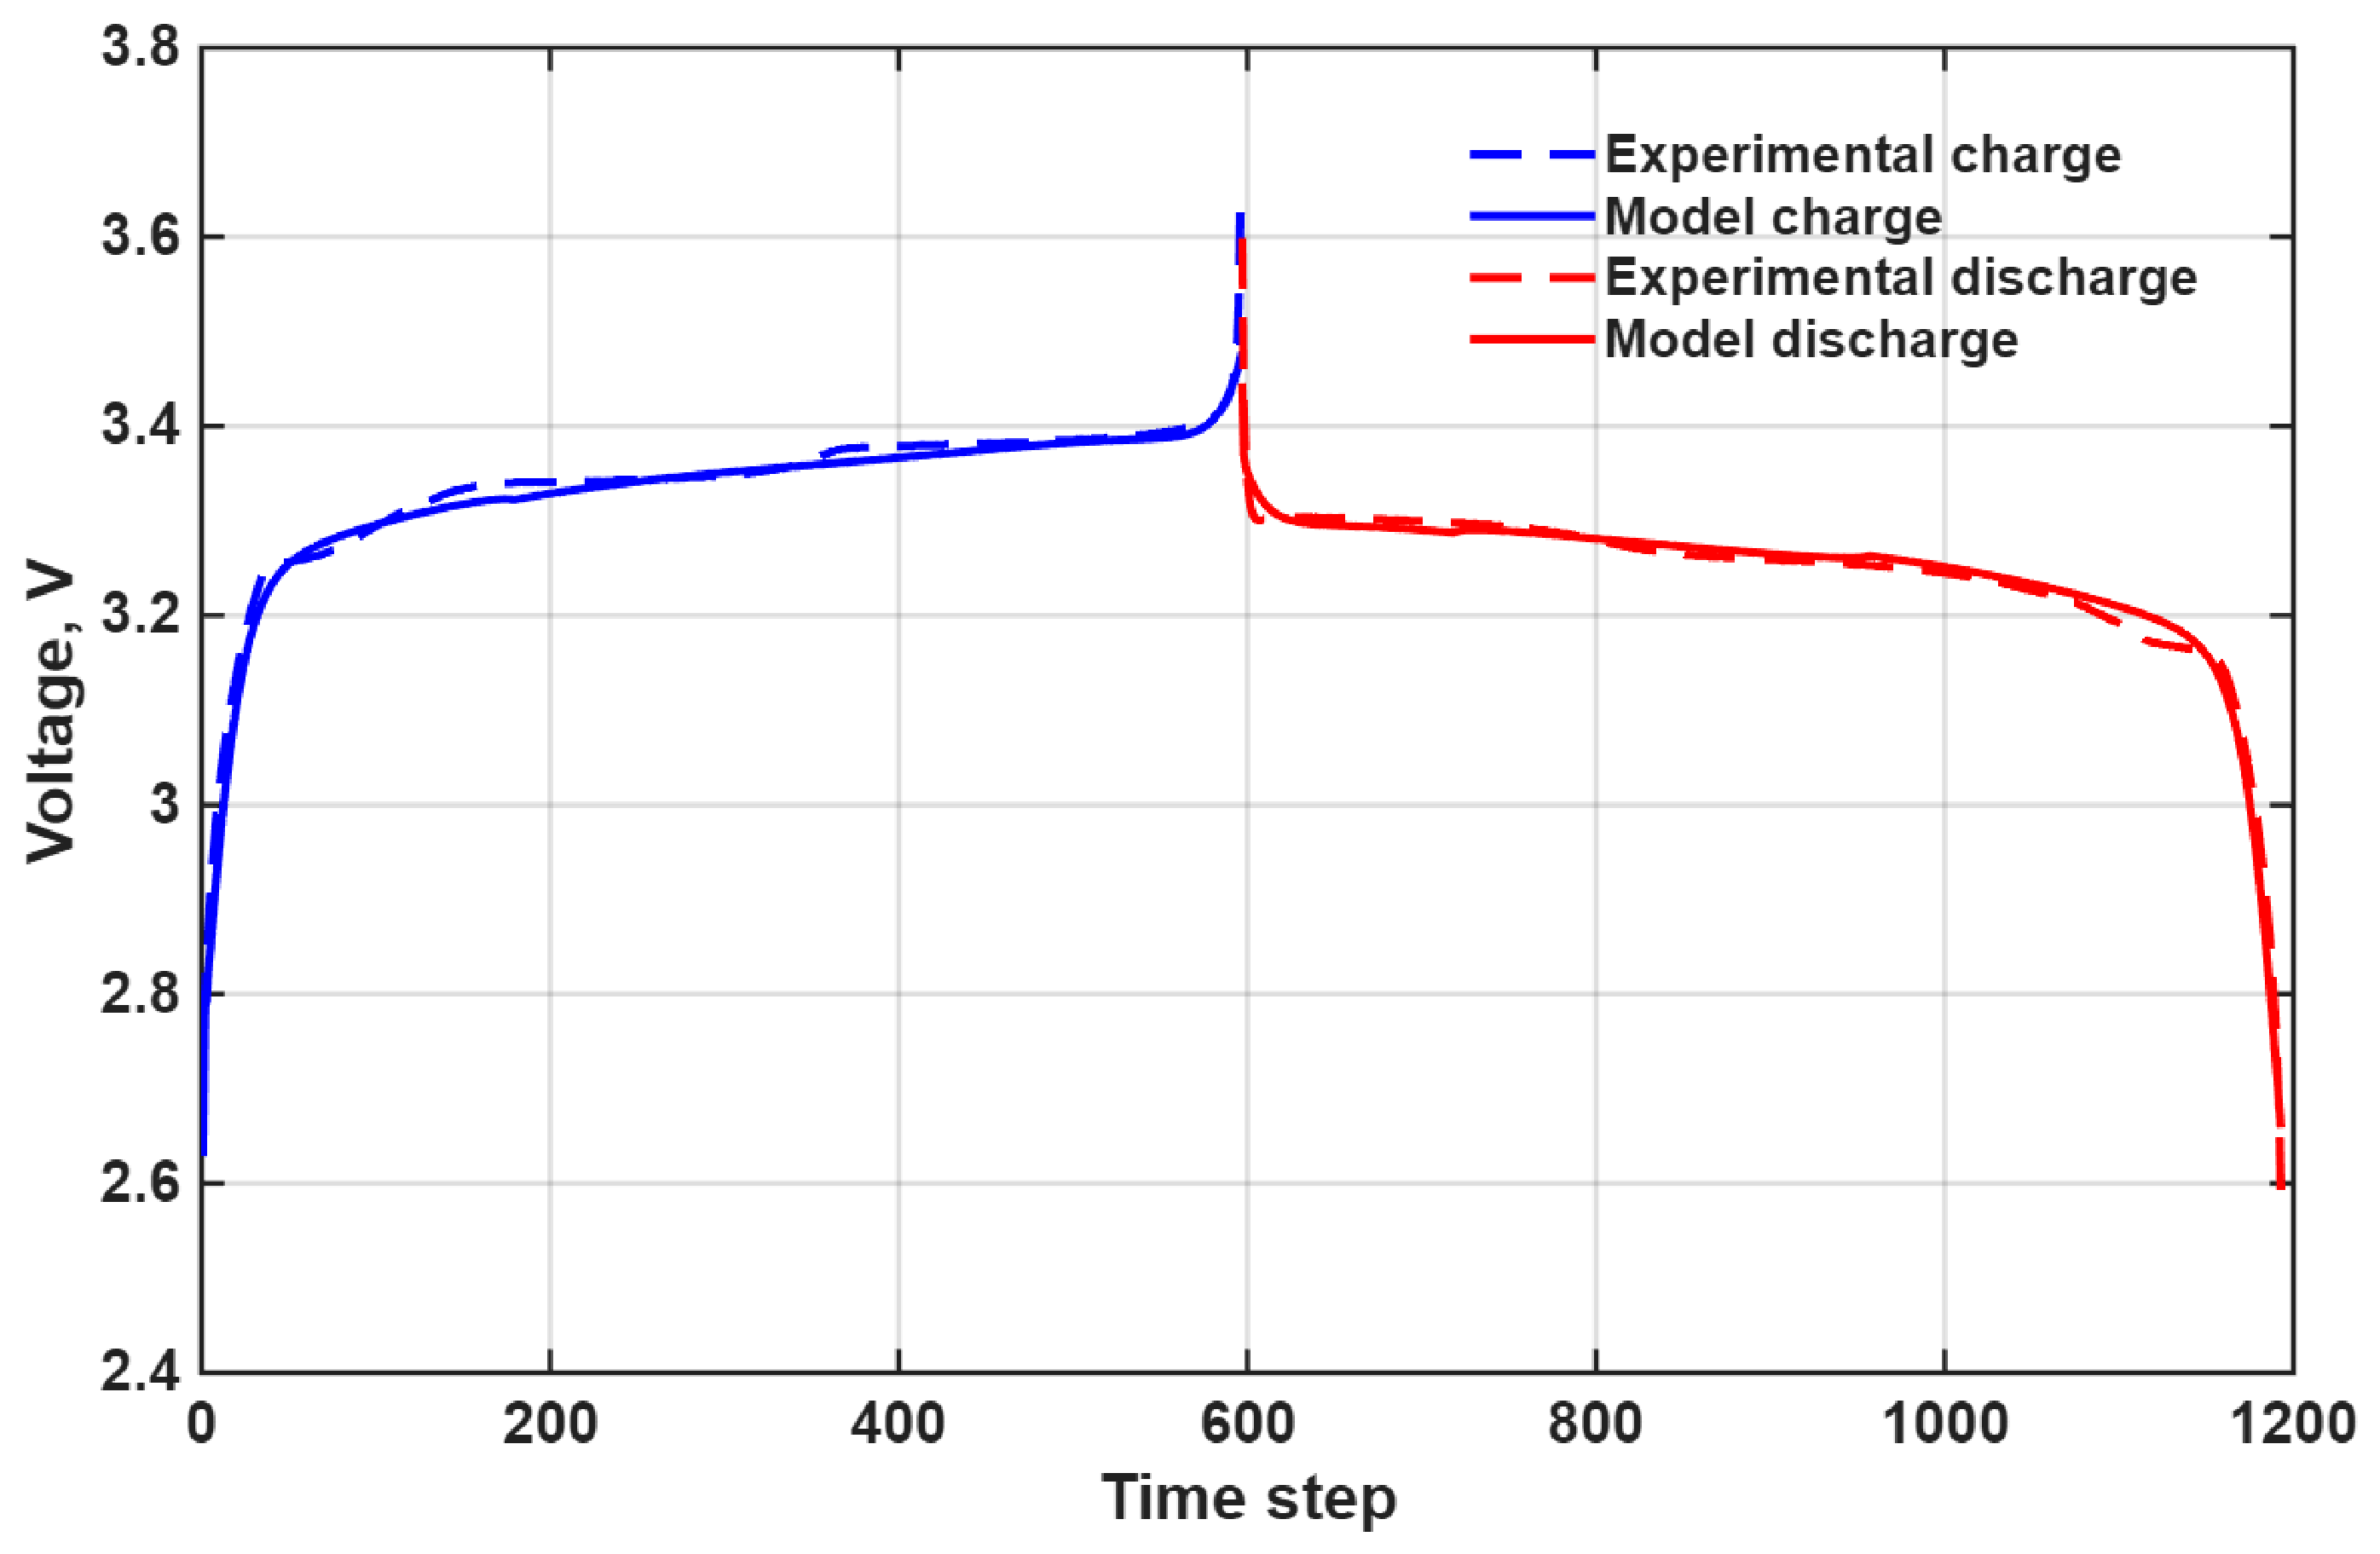
This formulation defines a reduced-order terminal-voltage model, where the voltage is obtained as the difference between the electrode open-circuit potentials with an additional ohmic contribution consistent with the adopted current sign convention, where a positive current corresponds to charging and a negative current corresponds to discharging. This approach allows the real voltage response of the cell to be evaluated in relation to changes in the experimental current, both during charging and discharging phases. The modeled voltage was compared with experimental measurements (Figure 5) to assess the accuracy of the model across the entire SOC range. The numerical results indicate that the mean absolute error (MAE) is 0.01 V, while the root mean square error (RMSE) is 0.01571 V. The RMSE (<50 mV) is consistent with accuracy levels reported for simplified lithium-ion battery models [46]. Considering the average terminal voltage (≈3.12 V), the RMSE corresponds to a relative error of approximately 0.5%, while the mean absolute percentage error (MAPE) is 0.309%, indicating strong agreement between the modeled and experimental voltage responses.
Figure 5.
Comparison of modeled and experimental terminal voltage over time, for both charging and discharging modes.
The maximum absolute error reaches 0.17204 V and occurs primarily in the extreme state-of-charge (SOC) regions, where strong nonlinearities in electrochemical behavior are more difficult to capture using reduced-order models.
The coefficient of determination indicates a strong agreement between model predictions and experimental data. It should be noted that for electrochemical battery models, particularly over a limited voltage range and nonlinear OCV–SOC dependence, may be less informative than absolute error-based metrics. Therefore, model accuracy is primarily assessed using MAE, RMSE, and MAPE. The reported accuracy metrics represent in-sample performance across different operating regimes (charging and discharging), rather than independent out-of-sample validation.
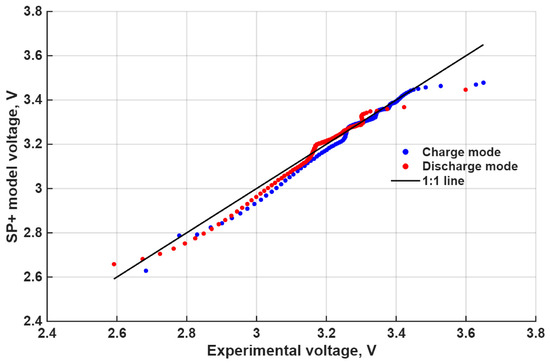
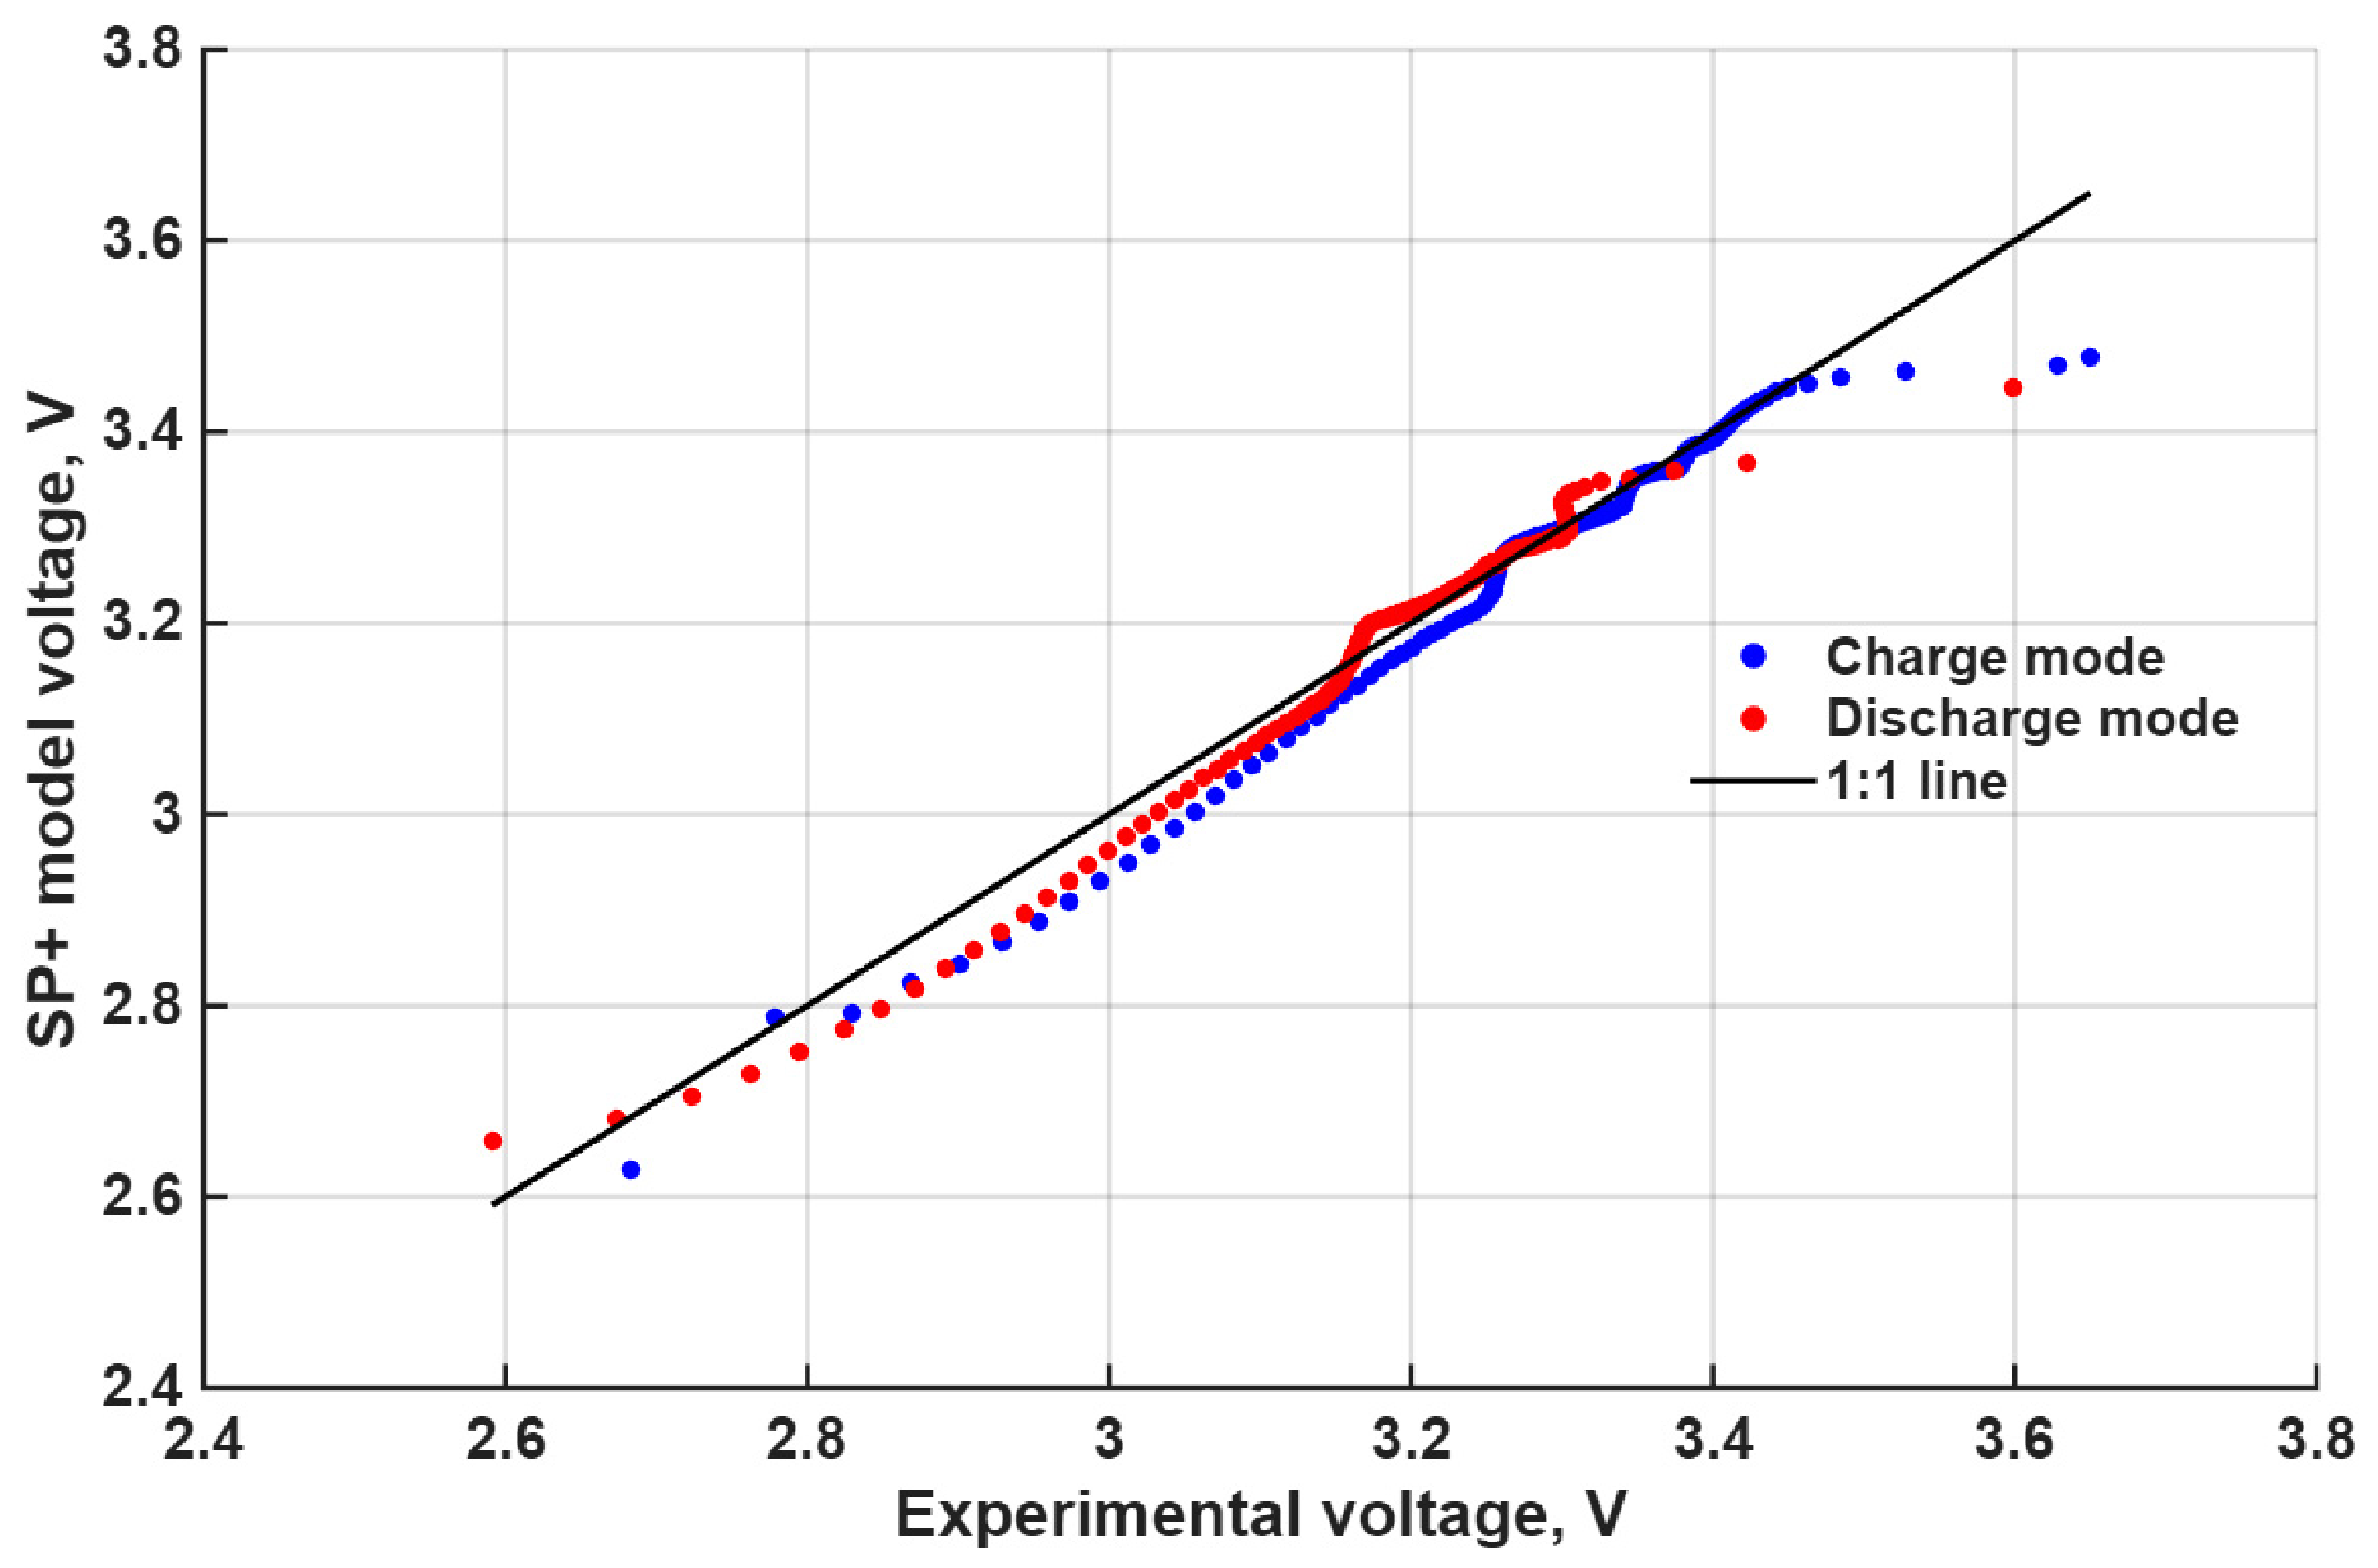
Figure 6 presents a comparison between the experimentally measured and SP+ model-calculated terminal voltage values, along with the ideal 1:1 line. It can be observed that all data points lie within a ±0.1 V interval, indicating a sufficiently good ability of the model to reproduce the experimental data within the analyzed voltage range. However, a systematic deviation from the 1:1 line is observed, suggesting the presence of residual structural model errors, which may be related to the simplified OCV dependence. Even though the points do not cluster exactly along the ideal 1:1 line, their distribution within a limited error band indicates consistent model performance without significant local deviations.
Figure 6.
Agreement between experimentally measured and SP+ model-calculated terminal voltage.
To evaluate the model response in detail, the dynamics of both OCV and terminal voltage were also analyzed throughout the experiment, separately for the charging and discharging phases. As shown in Figure 7, the terminal voltage closely follows the OCV variations; however, due to the effect of the load current, deviations are observed, reflecting the influence of internal resistance. During operation, the terminal voltage deviates from the OCV depending on the direction of the current, being lower during charging and higher during discharging.
Figure 7.
Comparison of the OCV and terminal voltage of the battery over time.
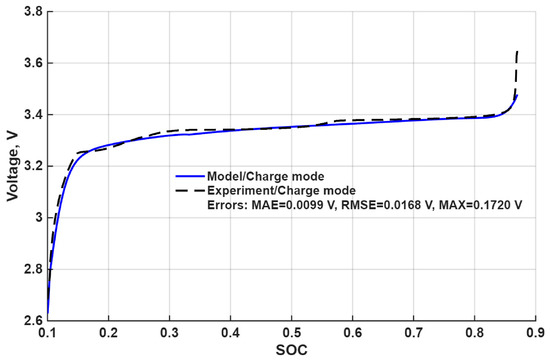
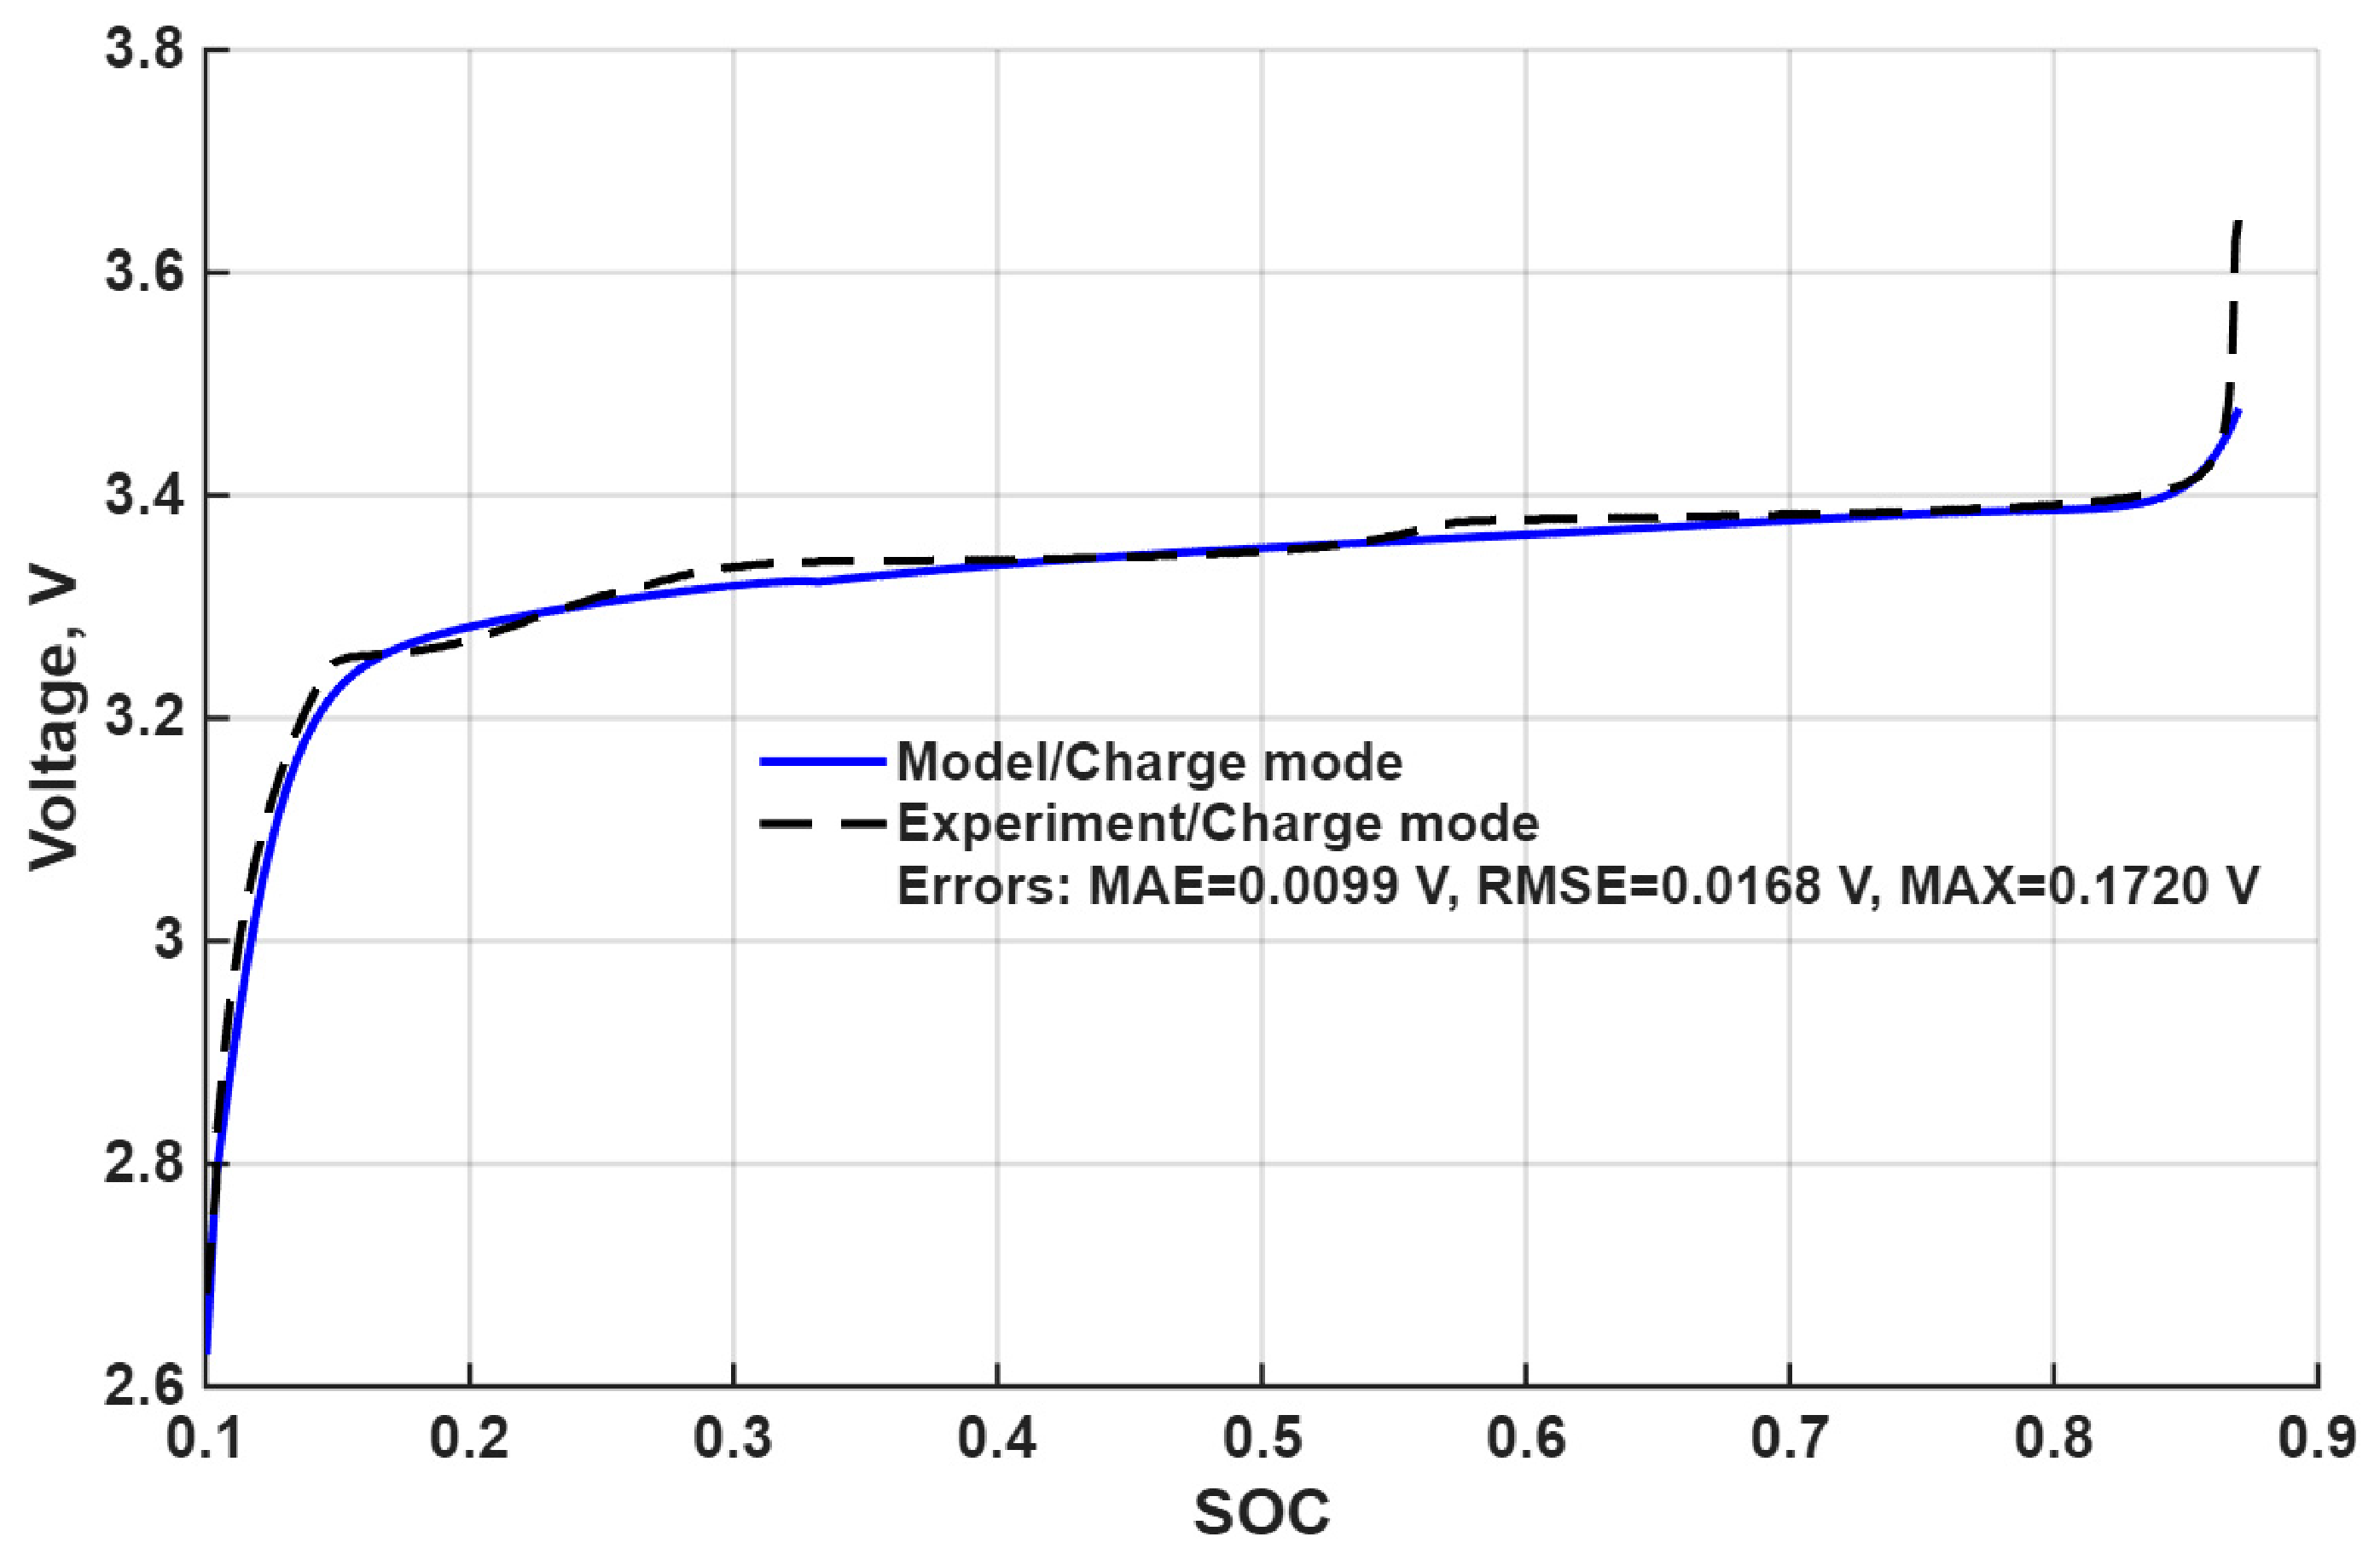
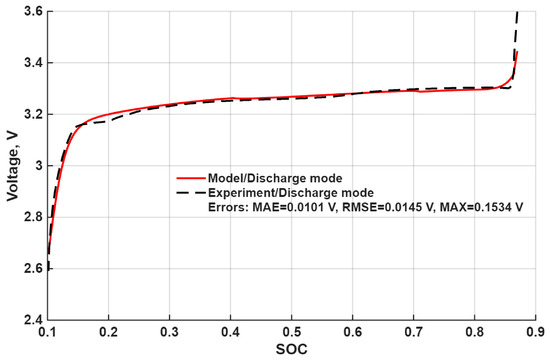
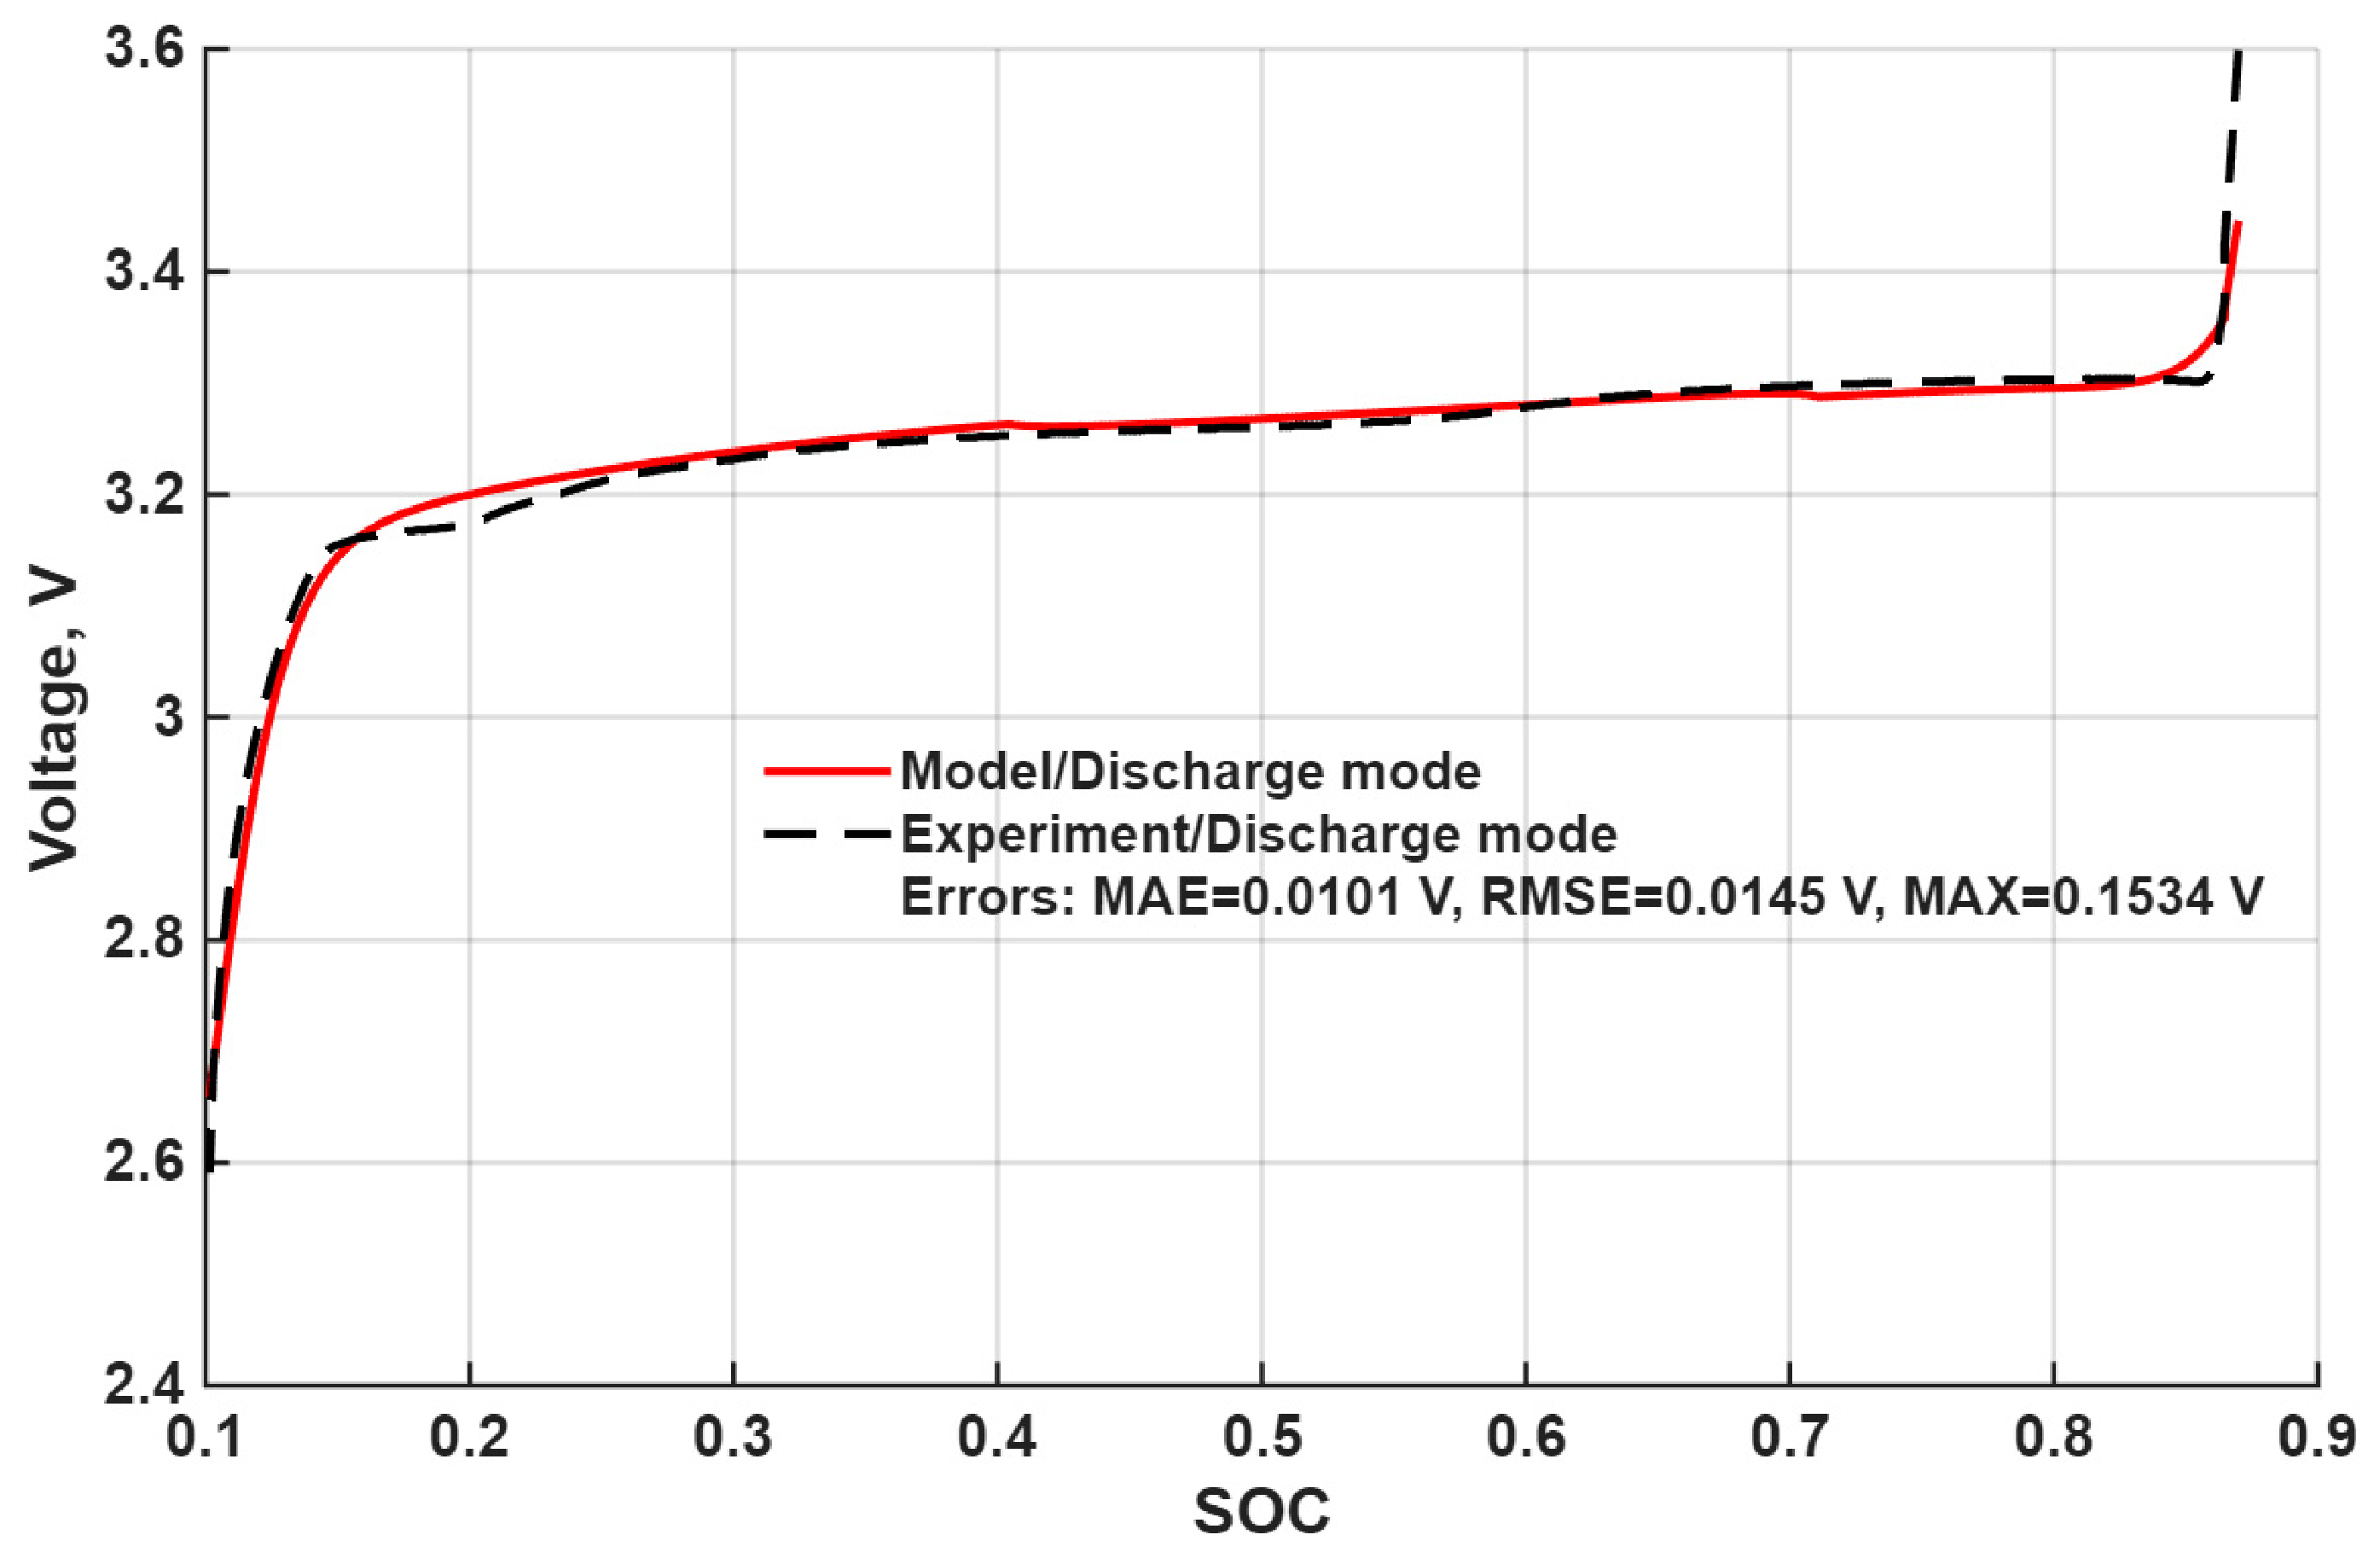
Separating the charging and discharging phases, the terminal voltage was compared with the measured data over the entire SOC range. During the charging phase, the modeled voltage results closely match the measurements (Figure 8), whereas in the discharging regime, larger discrepancies are observed (Figure 9). The corresponding quantitative error metrics (MAE, RMSE, and maximum error) are reported separately for each regime in the respective figures. A SOC-binned error analysis was not performed in this study; instead, the model accuracy was evaluated separately for charging and discharging regimes.
Figure 8.
Voltage of the battery as a function of SOC during the charging phase ().
Figure 9.
Voltage of the battery as a function of SOC during the discharging phase ().
The obtained results indicate that the model can reproduce the main trends of terminal voltage variation, although systematic deviations remain in certain operating regimes. The increased deviations at low and high SOC values are consistent with nonlinear electrochemical effects that are not fully captured by the reduced-order formulation.
This analysis confirms that the model can capture the dynamics of the LiFePO4 cell in both charging and discharging modes and provides a basis for further refinement and optimization of the model.
4.3. Sensitivity Analysis for Parameters Identification
Uncertainty and sensitivity analyses begin with generating a sample of parameters when the distributions of parameters are known. Each set of parameters provides different model outputs of SOC and terminal-voltage values over the specified period. This reflects the uncertainty of model results.
Evaluating the uncertainty of model results quantitatively requires analyzing the model outputs as random values and estimating statistical characteristics of their distributions, such as mean, standard deviation, quantiles, and confidence intervals.
The generated sample must obey the ranges and probabilistic distributions of parameters used in the model. While custom probability distribution functions may highlight stronger parameter interactions and alter sensitivity rankings, uniform distributions ensure valid parameter values and are standard practice when data are scarce [47]. Given the limited availability of distributional data for LiFePO4 battery model parameters, uniform distributions were selected within parameter ranges found in the literature [2,26,38,39,41,48,49,50,51]. However, certain ranges, as indicated in Table 2, were calibrated to exclude values that cause severe model instability. Further narrowing of parameter ranges was considered, but it would have compromised consistency with documented parameter values. Moreover, a systematic sensitivity analysis of range widths is beyond the scope of the present study. Therefore, the adjusted literature-informed ranges were retained.
Table 2.
List of uncertain parameter distribution ranges used in random sample generation.
The reported sensitivity rankings should therefore be interpreted as conditional on the assumed independent uniform input distributions and the selected literature-informed parameter ranges. If narrower calibrated distributions were adopted, the absolute values of the sensitivity measures would change and, in some cases, the ranking of moderately influential parameters could also change.
Parameters for the maximum Li+ concentration in positive and negative electrodes and were not considered for sensitivity analysis, as these parameters strongly correlate with the charging and discharging data collected. Furthermore, variations in these parameters influence results beyond altering the output distribution: any changes in maximum Li+ concentration in either electrode directly impact the observed SOC interval. Therefore, identification of these parameters must be prioritized to accurately depict charge dynamics before identifying other parameters used to model voltage. In addition, the effective porosity of each electrode is held fixed as an effective non-uncertain parameter for the analyzed battery composition due to scarcity of distributional data in relevant literature.
To perform initial uncertainty and sensitivity analysis, a random sample of 10,000 sets of values was generated for the remaining uncertain parameters. The ranges of parameter distributions are listed in Table 2.
With each set of values for parameters, the model estimates a slightly different function of terminal voltage values over the observed battery charge and discharge periods. Uncertainty and sensitivity analysis are performed on the distribution of terminal voltage values (as model results) during the time-wise midpoint of charging and discharging cycles separately.
The failure of significance tests for PEAR coefficients, together with the low calculated for the SRC index (0.503), reflects the strong non-linearity of the SP+ model, which violates the linearity assumptions these methods rely on. Similarly, SPEA coefficients fail the significance test, which would indicate non-monotonic relationships between model parameters and outputs. However, Spearman correlation coefficients are bivariate measures that do not control for confounding among parameters. In contrast, PRCC and SRRC are multivariate measures that operate on ranked data to assess the monotonic relationship between each parameter and output while controlling for linear or rank effects of all other parameters. This means that PRCC and SRRC are more informative and reliable when detecting monotonic relationships in multiparameter systems. The relatively high calculated for the SRRC index (0.910) suggests the parameter–output relationship is largely monotonic, which supports the use of rank-based indices as primary sensitivity measures in this study.
To complement these rank-based approaches, this study incorporates Sobol indices, which capture both individual parameter contributions and interaction effects. This makes them suitable for general nonlinear and nonmonotonic systems.
During Sobol sensitivity analysis, an increasing sample size was explored, starting at . Samples were generated using quasi-random LpTau sequences. Convergence was observed at , with the number of model evaluations reaching (here is the parameter count). The described Sobol analysis design ensures stable and reproducible Sobol indices and closely aligns with other sensitivity measures obtained through random sampling.
Additionally, Smirnov indices are included for their moment-independence and ability to detect distributional shifts that variance-based measures might miss. Together, Sobol and Smirnov indices serve as robust secondary sensitivity measures.
Consequently, indices suited primarily for linear models (PEAR, PCC, SRC) were omitted from further study. Additionally, SPEA was omitted due to its bivariate nature, which fails to account for parameter interactions. PRCC and SRRC were therefore retained as multivariate rank-based measures, while Smirnov and Sobol indices were used as complementary moment-independent and variance-based measures. For Sobol analysis, quasi-random LpTau sequences were used, and first-order and total-order rankings were checked for stability as the sample size increased. Comparison of the absolute values of remaining relevant sensitivity indices for each parameter when modelling the battery in charge mode is displayed in Figure 10.
Figure 10.
Abs. values of sensitivity indices for parameters when modelling in charge mode.
Based on the analysis, such parameters as the particle radius of the positive active material () and the effective area of electrodes () are the most impactful towards the uncertainty of the model results in charge mode and should be prioritized during identification. Depending on the chosen sensitivity index, parameters for the thickness of each electrode (, ) and negative active material particle radius () provide moderate impact towards model uncertainty. The rest of the analyzed parameters (diffusion and porosity coefficients) have minimal impact on uncertainty within selected intervals.
Sobol first-order sensitivity indices () rank and as the only significantly impactful parameters. Tests where parameters are varied individually while others are randomized confirm that these parameters are a major source of model instability. Values beyond the ranges set and listed in Table 2 for and parameters disrupt model calculations and inflate resulting voltage values. Total order Sobol indices () further signify the impact of the aforementioned parameters on model results and their uncertainty.
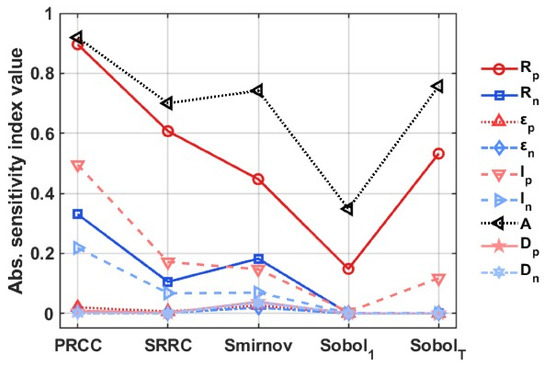
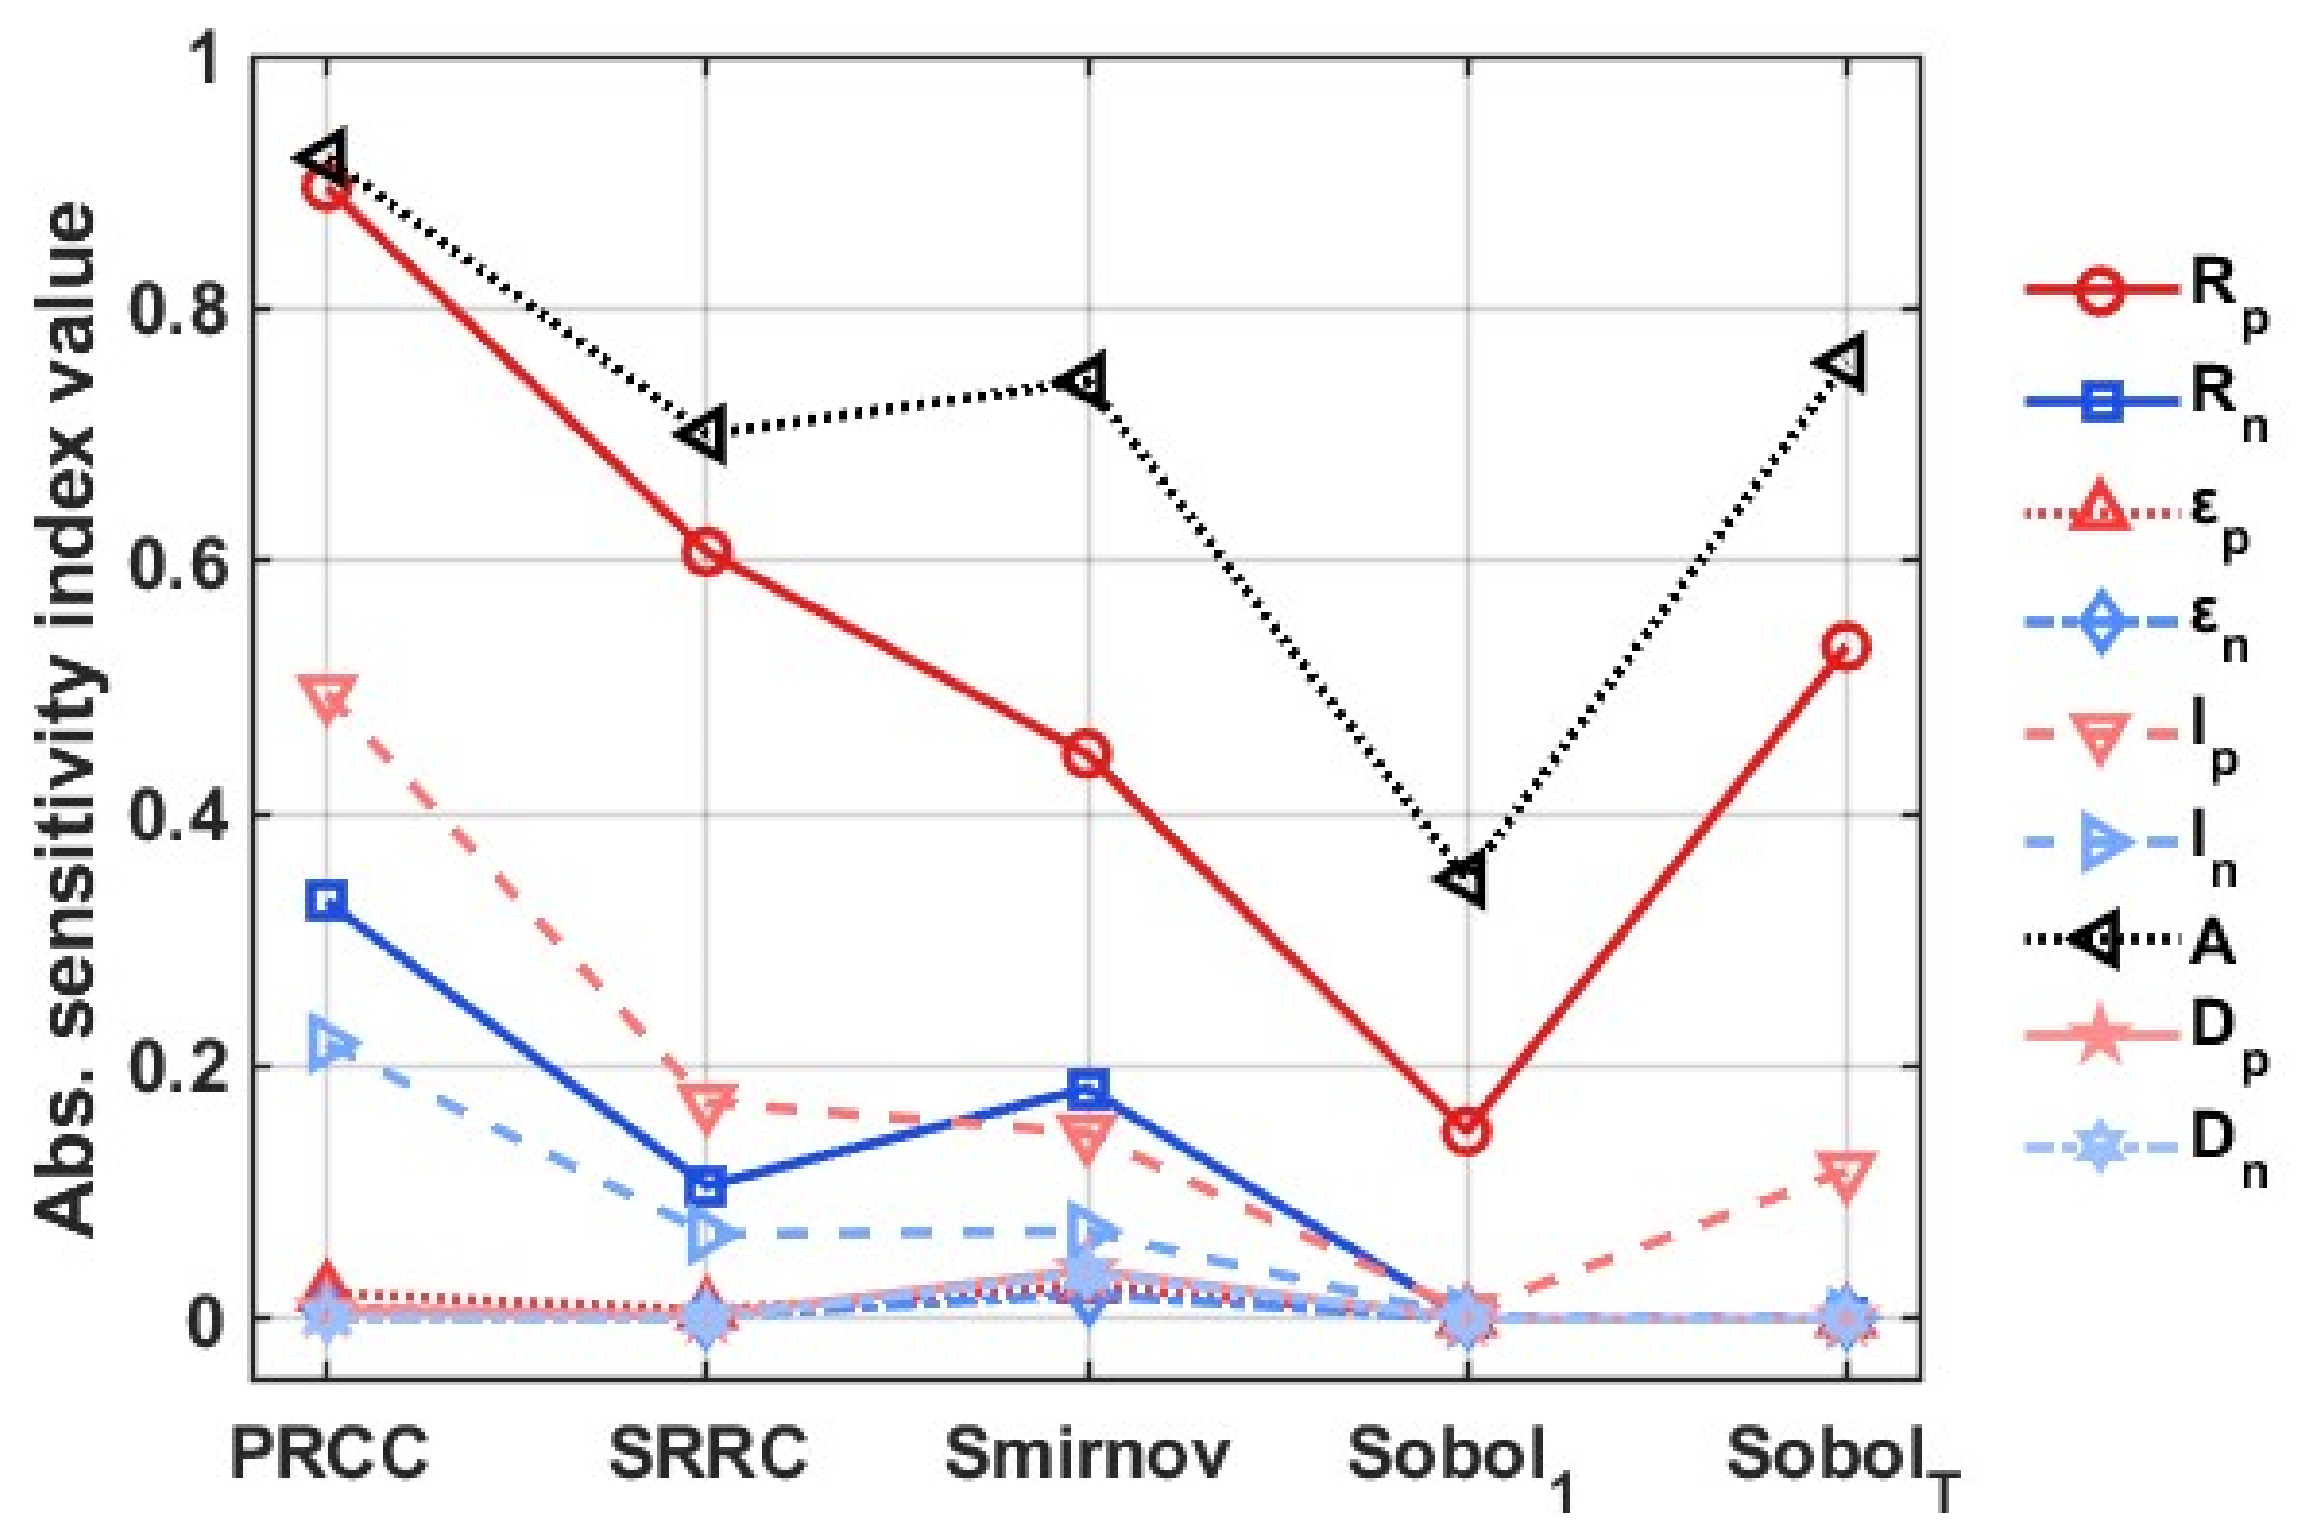
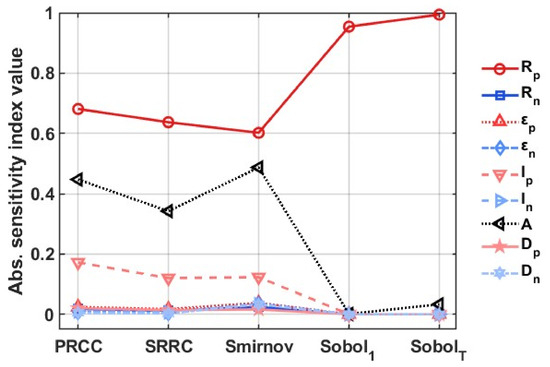
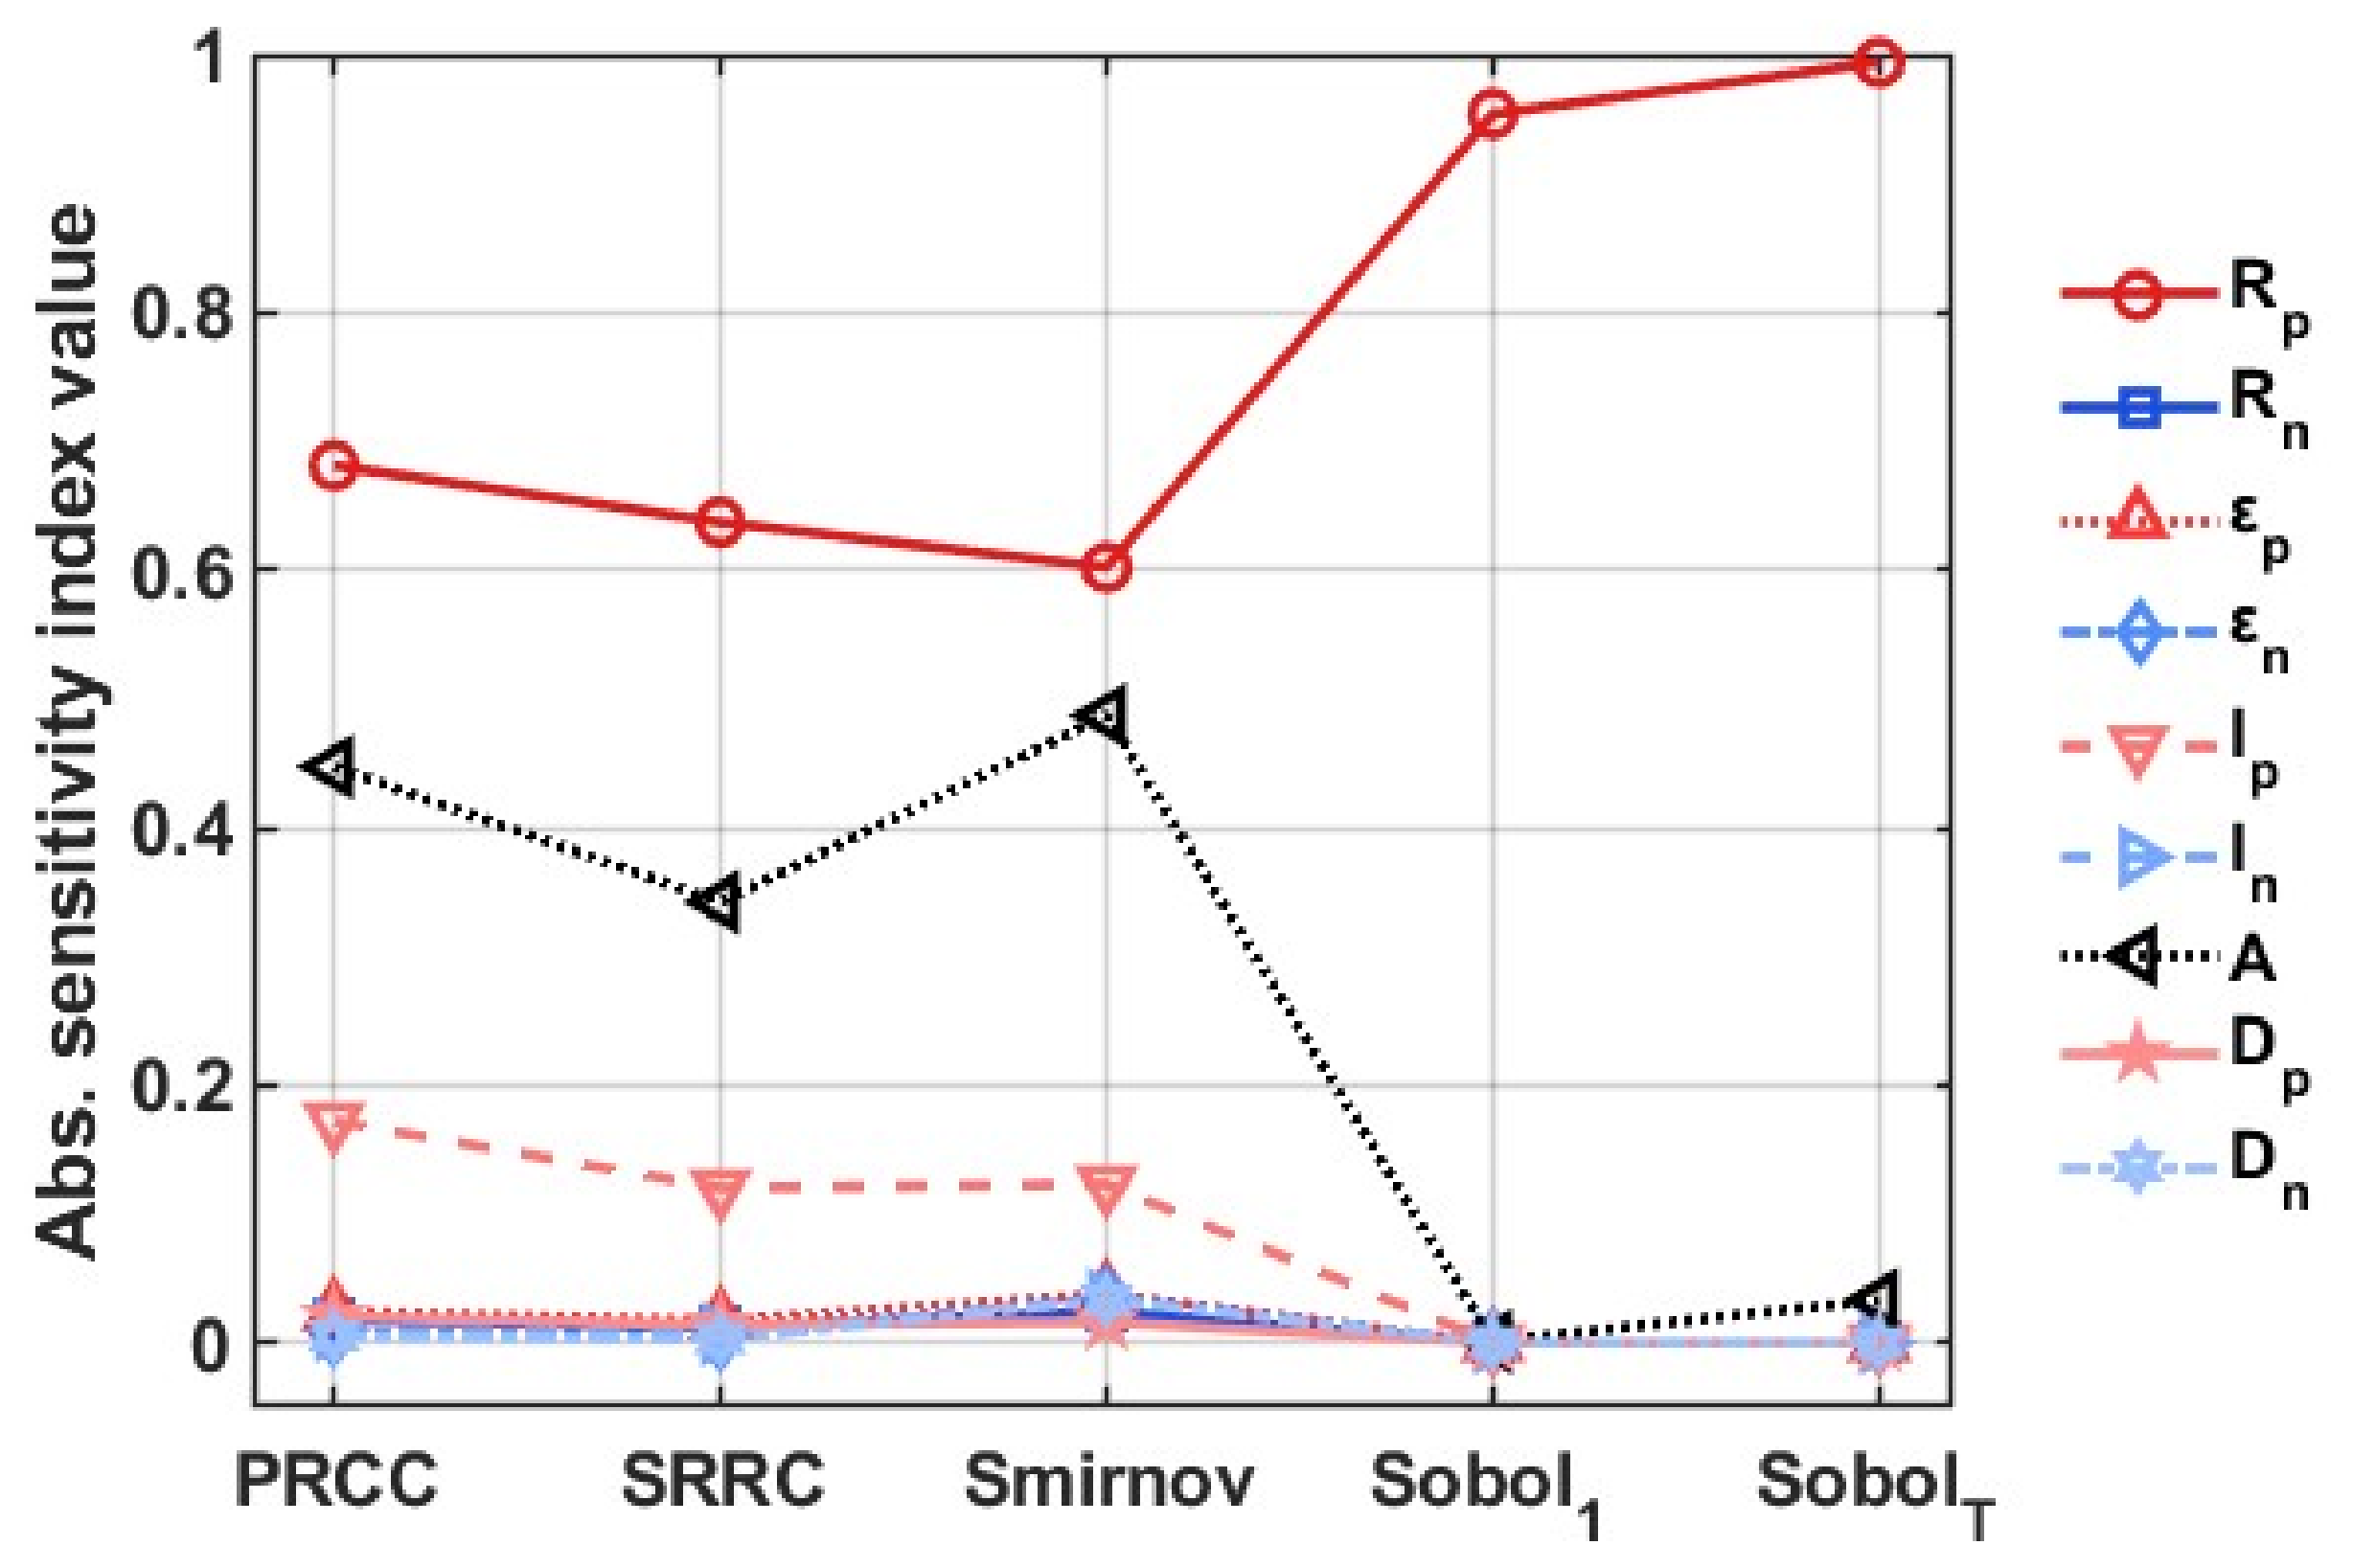
Similarly, for each uncertain parameter when the battery is in discharge mode, sensitivity indices are calculated and compared in Figure 11.
Figure 11.
Abs. values of sensitivity indices for parameters when modelling in discharge mode.
In the case of discharge mode, the same parameters are ranked as most impactful toward the uncertainty of the model: particle radius of the positive active material () and the effective area of electrodes (). Only the thickness of the positive electrode () can be considered moderately impactful in this case, too. According to the Sobol indices, has a much stronger impact on model result uncertainty than or any other parameter, and manual tests of parameter variation confirm this. It must be said that the model is more stable when using battery discharge data and the same parameter ranges.
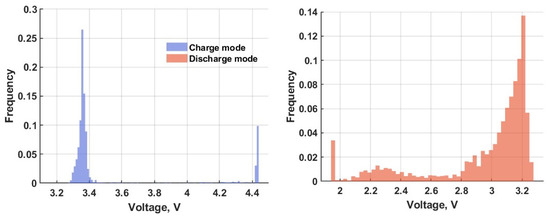
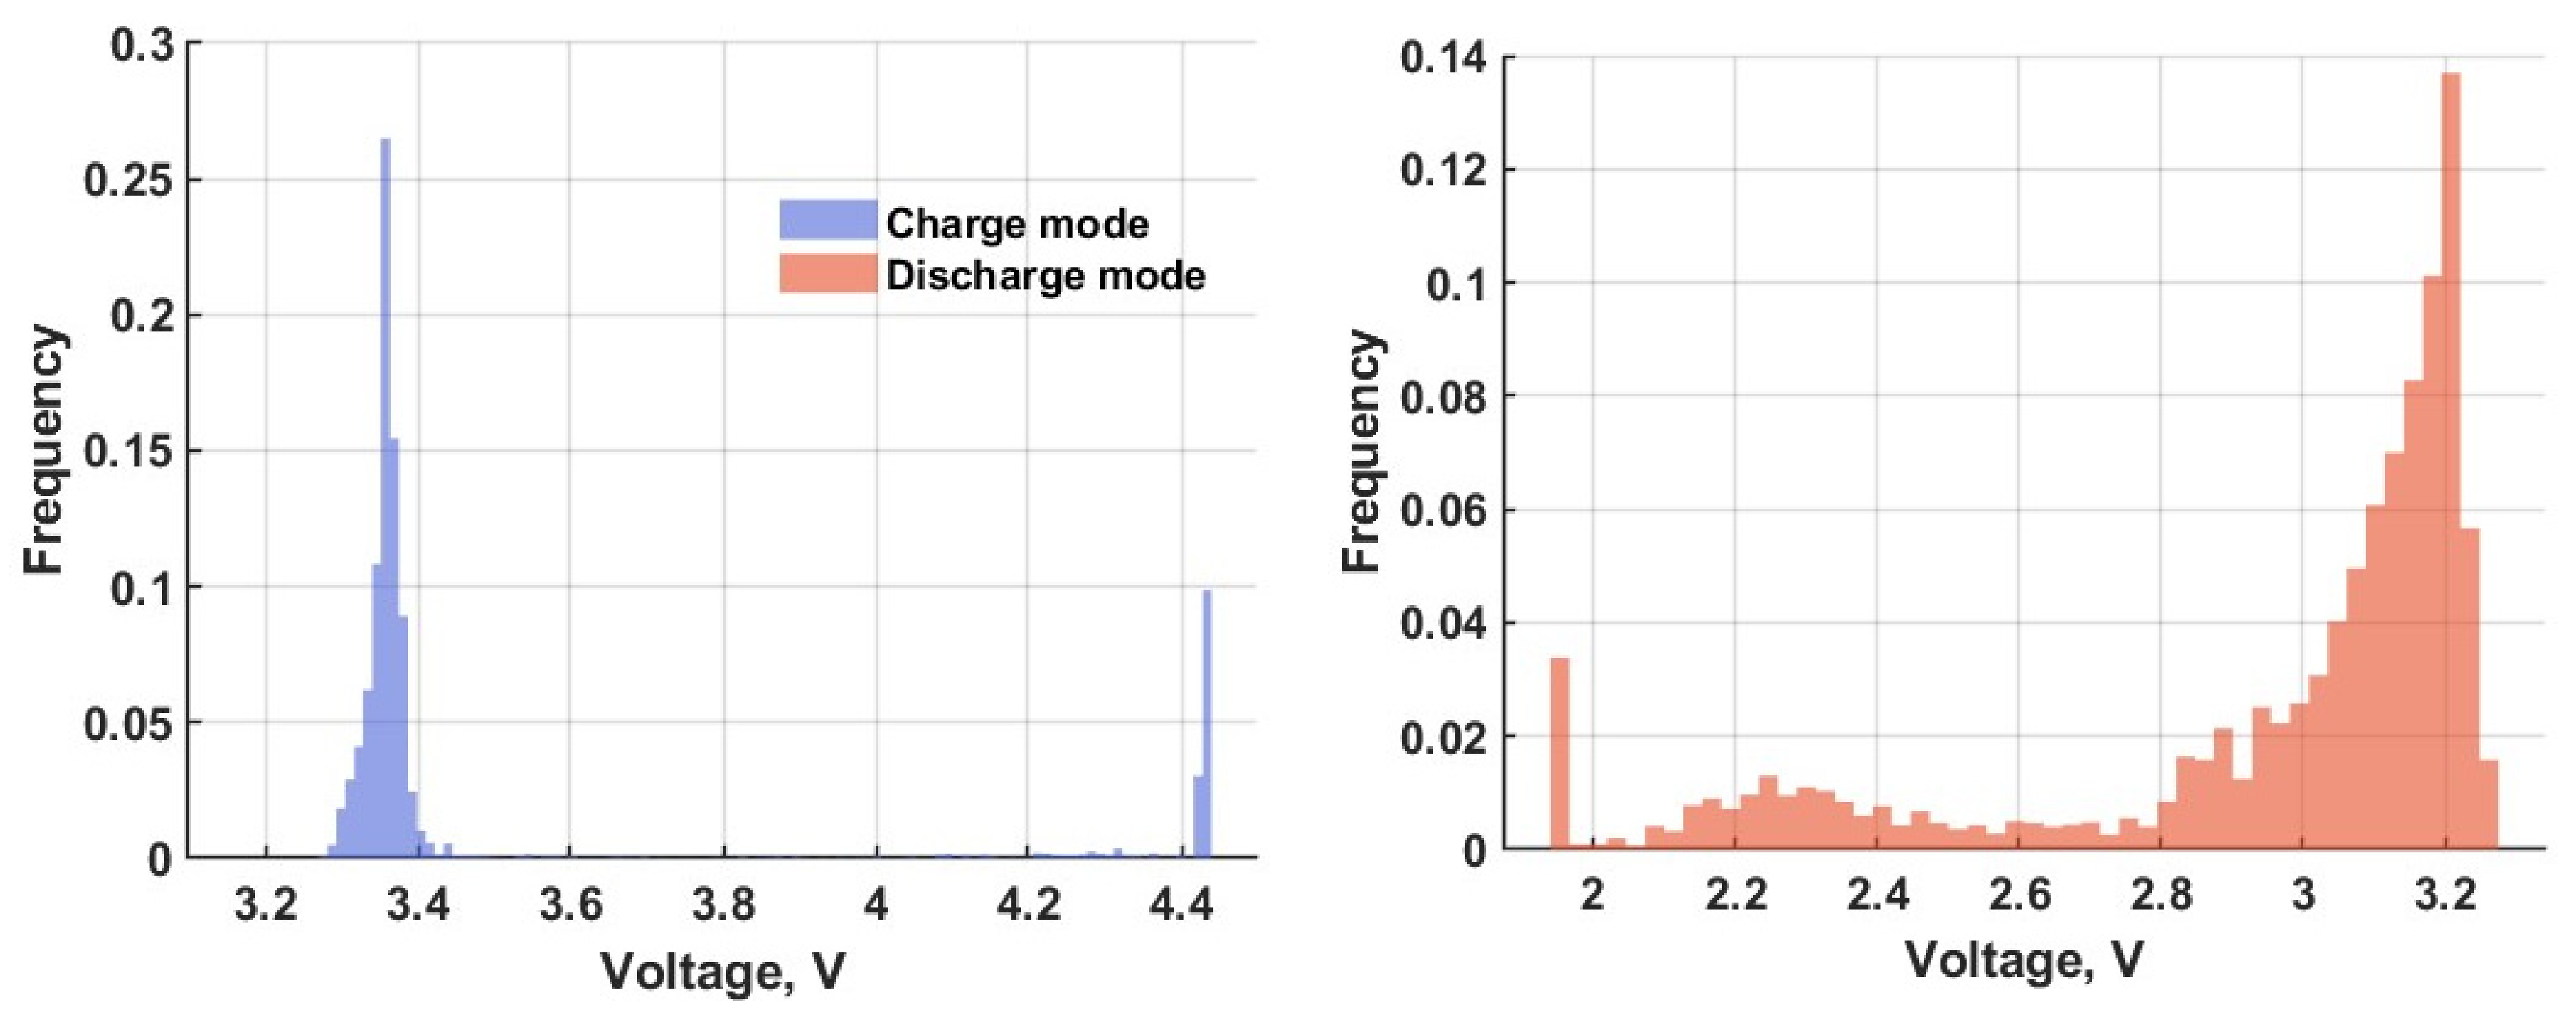
The uncertainty of model results, impacted by parameters and instability, can be visually diagnosed using simple frequency plots. The histograms of voltage during the halfway point of both charge and discharge cycles are provided in Figure 12.
Figure 12.
Voltage uncertainty at the halfway point of charge (left) and discharge (right) cycles.
During battery charging mode, the mean of the voltage at the midpoint of the cycle is 3.530 V, deviating from the median of 3.362 V due to frequent extremities caused by model instability. The standard deviation is 0.384. During the midpoint of battery discharging, the mean voltage is 2.942 V, which is close to the median of 3.099 V. Fewer extremities also lead to a lower standard deviation of 0.358.
The narrower modal region of the voltage distribution during charging likely stems from inherent asymmetries in electrode kinetics. Due to differences in reaction rate and mechanism depending on current direction, the anodic and cathodic charge-transfer coefficients typically differ [52]. As a result, the overpotential during charging is less sensitive to kinetic parameter variations compared to discharge mode. Therefore, parameter uncertainty has a diminished impact on terminal voltage uncertainty in charge mode, leading to a concentrated distribution histogram.
The estimated sensitivity indices for each parameter under charging and discharging conditions are detailed in Table 3 and Table 4, respectively. In both charge and discharge modes, the main contributors to output uncertainty are the same two parameters: and . As the model is more prone to instability when modelling a battery in charging mode, sensitivity analysis reveals several other parameters to consider during identification to reduce the uncertainty of results: , and . Finally, the remaining sensitivity indices, as well as manual tests, reveal the low impact of remaining parameters, leading to a simpler parameter identification process.
Table 3.
Sensitivity measures for parameters when modeling in charge mode.
Table 4.
Sensitivity measures for parameters when modeling in discharge mode.
5. Conclusions
The SP+ electrochemical model, formulated as a reduced-order nonlinear dynamical system, provides a mathematically consistent framework for describing the input–output behavior of a lithium-ion battery based on experimental data. The model preserves the essential electrochemical mechanisms of the underlying P2D formulation while significantly reducing the dimensionality of the governing equations, thereby enabling efficient numerical implementation.
The parameter identification problem was successfully formulated as a constrained nonlinear least-squares optimization problem, allowing the identification of physically plausible parameters directly from experimental measurements. This inverse problem formulation ensures a stable and consistent mapping between the input current and the terminal voltage response.
The model demonstrates high predictive accuracy in reproducing the SOC and terminal voltage dynamics of the investigated LiFePO4 cell of the battery during both charging and discharging regimes. The obtained error metrics (MAE = 0.01 V, RMSE = 0.01571 V, MAPE = 0.309%) confirm the adequacy of the proposed approach for reduced-order battery modeling. The observed deviations at extreme SOC values indicate the influence of nonlinear electrochemical effects and suggest that further accuracy improvements are primarily associated with the refinement of the OCV representation and the inclusion of concentration polarization and activation polarization effects. They become significant at high C-rates and extreme SOC values and are likely responsible for the larger voltage prediction errors observed in those regions, while also indicating that additional validation under independent operating conditions is needed.
Statistical significance tests on sensitivity measures, as well as the coefficients of determination ( for raw data, for ranked data) obtained from standardized regression models suggest non-linear yet monotonic relationships between model parameters and open-circuit terminal-voltage response. The limitations of linear approaches in capturing the non-linear dependence of input and output reinforce the need for advanced mathematical techniques for parameter identification and validation.
Global sensitivity measures consistently identified the most influential physical parameters across both charge and discharge modes: the particle radius of the positive electrode active material () and the effective electrode area (). Sensitivity indices based on rank transformation revealed that parameters for the thickness of each electrode (, ) and negative electrode active material particle radius () are moderately impactful towards model uncertainty. Parameter importance rankings based on sensitivity indices provide a mathematically justified criterion for parameter prioritization.
These findings identify mathematically influential parameters rather than direct design contributors. In particular, the effective electrode area is interpreted primarily as a geometry-related model parameter with strong influence on the voltage response, not as a design variable optimized in the present study. The results support uncertainty-aware parameter prioritization and calibration of reduced electrochemical models. Future work may extend the framework to broader operating conditions, independent validation datasets, and additional voltage-loss terms such as concentration polarization and activation polarization. In this sense, the proposed reduced model may serve as a basis for future virtual-replica or digital-twin-oriented developments.
Author Contributions
Conceptualization, J.D.-B. and R.A.; methodology, G.V., J.D.-B., E.J. and R.A.; software, G.V. and E.J.; validation, G.V., J.D.-B., E.J. and R.A.; formal analysis, G.V., J.D.-B. and E.J.; investigation, G.V., J.D.-B., E.J. and R.A.; resources, R.A.; writing—original draft preparation, J.D.-B., G.V. and E.J.; writing—review and editing, G.V., J.D.-B., E.J. and R.A.; visualization, G.V., J.D.-B., E.J. and R.A.; supervision, J.D.-B. and R.A.; project administration, R.A.; funding acquisition, R.A. All authors have read and agreed to the published version of the manuscript.
Funding
Part of the experimental data collection and this research indirectly received funding from the European Regional Development Fund under a grant agreement with the Lithuanian Business Support Agency No. 01.2.1-LVPA-K-856-01-0205.
Data Availability Statement
The processed current–voltage data, parameter bounds, and sensitivity-analysis setup are available from the corresponding author upon reasonable request. The MATLAB implementation can also be shared upon reasonable request, subject to project and institutional restrictions.
Conflicts of Interest
The authors declare no conflicts of interest. The funders had no role in the design of the study; in the collection, analyses, or interpretation of data; in the writing of the manuscript; or in the decision to publish the results.
References
- Lithium-Ion Battery Market Size, Share & Trends Analysis Report by Product (LCO, LFP, NCA, LMO, LTO, Lithium Nickel Manganese Cobalt), by Application, by Region, and Segment Forecasts, 2021–2028. Grand View Research, San Francisco, CA, USA, 2021. Available online: https://www.grandviewresearch.com/industry-analysis/lithium-ion-battery-market (accessed on 1 September 2020).
- Li, J.; Wang, D.; Deng, L.; Cui, Z.; Lyu, C.; Wang, L.; Pecht, M. Aging modes analysis and physical parameter identification based on a simplified electrochemical model for lithium-ion batteries. J. Energy Storage 2020, 31, 101538. [Google Scholar] [CrossRef] [Scilit]
- Newman, J.; Tiedemann, W. Porous-electrode theory with battery applications. AIChE J. 2004, 21, 25–41. [Google Scholar] [CrossRef] [Scilit]
- Zhou, J.; Xing, B.; Wang, C. A review of lithium ion batteries electrochemical models for electric vehicles. E3S Web Conf. 2020, 185, 04001. [Google Scholar] [CrossRef] [Scilit]
- Li, W.; Cao, D.; Jöst, D.; Ringbeck, F.; Kuipers, M.; Frie, F.; Sauer, D.U. Parameter sensitivity analysis of electrochemical model-based battery management systems for lithium-ion batteries. Appl. Energy 2020, 269, 115104. [Google Scholar] [CrossRef] [Scilit]
- Zhang, L.; Wang, L.; Lyu, C.; Li, J.; Zheng, J. Non-destructive analysis of degradation mechanisms in cycle-aged Graphite/LiCoO2 batteries. Energies 2014, 7, 6282–6305. [Google Scholar] [CrossRef] [Scilit]
- Li, J.; Wang, D.; Pecht, M. An electrochemical model for high C-rate conditions in lithium-ion batteries. J. Power Sources 2019, 436, 226885. [Google Scholar] [CrossRef] [Scilit]
- Zhao, J.; Qian, X.; Jiang, B.; Wang, B. Lithium battery model parameter identification based on the GA-LM algorithm. Int. J. Green Energy 2024, 21, 1147–1160. [Google Scholar] [CrossRef] [Scilit]
- Guo, B.; Sun, H.; Zhao, Z.; Liu, Y. Online parameter identification for fractional order model of lithium-ion battery via adaptive genetic algorithm. In Proceedings of the 2023 IEEE 12th Data Driven Control and Learning Systems, Xiangtan, China, 12–14 May 2023; pp. 1227–1232. [Google Scholar] [CrossRef] [Scilit]
- Choi, Y.Y.; Kim, S.; Kim, S.; Choi, J.-I. Multiple parameter identification using genetic algorithm in vanadium redox flow batteries. J. Power Sources 2020, 450, 227684. [Google Scholar] [CrossRef] [Scilit]
- Yang, X.; Chen, L.; Xu, X.; Wang, W.; Xu, Q.; Lin, Y.; Zhou, Z. Parameter identification of electrochemical model for vehicular lithium-ion battery based on particle swarm optimization. Energies 2017, 10, 1811. [Google Scholar] [CrossRef] [Scilit]
- Rahman, M.A.; Anwar, S.; Izadian, A. Electrochemical model parameter identification of a lithium-ion battery using particle swarm optimization method. J. Power Sources 2016, 307, 86–97. [Google Scholar] [CrossRef] [Scilit]
- Gu, Y.; Wang, J.; Chen, Y.; Zheng, K.; Deng, Z.; Chen, Q. Electrochemical parameter identification for lithium-ion battery sources in self-sustained transportation energy systems. IEEE Trans. Ind. Appl. 2024, 60, 1240–1254. [Google Scholar] [CrossRef] [Scilit]
- Kim, S.; Kim, S.; Choi, Y.Y.; Choi, J.-I. Bayesian parameter identification in electrochemical model for lithium-ion batteries. J. Energy Storage 2023, 71, 108129. [Google Scholar] [CrossRef] [Scilit]
- Kim, M.; Chun, H.; Kim, J.; Kim, K.; Yu, J.; Kim, T.; Han, S. Data-efficient parameter identification of electrochemical lithium-ion battery model using deep Bayesian harmony search. Appl. Energy 2019, 254, 113644. [Google Scholar] [CrossRef] [Scilit]
- Wang, B.-C.; He, Y.-B.; Liu, J.; Luo, B. Fast parameter identification of lithium-ion batteries via classification model-assisted Bayesian optimization. Energy 2024, 288, 129667. [Google Scholar] [CrossRef] [Scilit]
- Chun, H.; Kim, J.; Yu, J.; Han, S. Real-time parameter estimation of an electrochemical lithium-ion battery model using a long short-term memory network. IEEE Access 2020, 8, 81789–81799. [Google Scholar] [CrossRef] [Scilit]
- Li, W.; Demir, I.; Cao, D.; Jöst, D.; Ringbeck, F.; Junker, M.; Uwe Sauer, D. Data-driven systematic parameter identification of an electrochemical model for lithium-ion batteries with artificial intelligence. Energy Storage Mater. 2022, 44, 557–570. [Google Scholar] [CrossRef] [Scilit]
- Huang, S.; Lin, N.; Wang, Z.; Zhang, Z.; Wen, S.; Zhao, Y.; Li, Q. A novel data-driven method for online parameter identification of an electrochemical model based on cuckoo search and particle swarm optimization algorithm. J. Power Sources 2024, 601, 234261. [Google Scholar] [CrossRef] [Scilit]
- Kim, J.; Chun, H.; Baek, J.; Han, S. Parameter identification of lithium-ion battery pseudo-2-dimensional models using genetic algorithm and neural network cooperative optimization. J. Energy Storage 2022, 45, 103571. [Google Scholar] [CrossRef] [Scilit]
- Tenny, K.M.; Braatz, R.D.; Chiang, Y.-M.; Brushett, F.R. Leveraging neural networks and genetic algorithms to refine electrode properties in redox flow batteries. J. Electrochem. Soc. 2021, 168, 050547. [Google Scholar] [CrossRef] [Scilit]
- Ali, H.A.A.; Raijmakers, L.H.J.; Chayambuka, K.; Danilov, D.L.; Notten, P.H.L.; Eichel, R.-A. A comparison between physics-based Li-ion battery models. Electrochim. Acta 2024, 493, 144360. [Google Scholar] [CrossRef] [Scilit]
- Han, S.; Tang, Y.; Khaleghi Rahimian, S. A numerically efficient method of solving the full-order pseudo-2-dimensional (P2D) Li-ion cell model. J. Power Sources 2021, 490, 229571. [Google Scholar] [CrossRef] [Scilit]
- Jahangir, H.; Zahirinia, H.; Tayebnia, M.; Yavarinasab, M.; Enferadi, J.; Nodehi, M.; Simka, W.; Baghayeri, M. Electrochemical modeling in lithium batteries: Pathways to next-generation power sources. J. Power Sources 2025, 654, 237833. [Google Scholar] [CrossRef] [Scilit]
- Satyavani, T.V.S.L.; Srinivas Kumar, A.; Subba Rao, P.S.V. Methods of synthesis and performance improvement of lithium iron phosphate for high rate Li-ion batteries: A review. Eng. Sci. Technol. Int. J. 2016, 19, 178–188. [Google Scholar] [CrossRef] [Scilit]
- Li, J.; Lotfi, N.; Landers, R.G.; Park, J. A single particle model for lithium-ion batteries with electrolyte and stress-enhanced diffusion physics. J. Electrochem. Soc. 2017, 164, A874–A883. [Google Scholar] [CrossRef] [Scilit]
- Guo, M.; Sikha, G.; White, R.E. Single-particle model for a lithium-ion cell: Thermal behavior. J. Electrochem. Soc. 2011, 158, A122. [Google Scholar] [CrossRef] [Scilit]
- Subramanian, V.R.; Diwakar, V.D.; Tapriyal, D. Efficient macro-micro scale coupled modeling of batteries. J. Electrochem. Soc. 2005, 152, A2002. [Google Scholar] [CrossRef] [Scilit]
- Pianosi, F.; Beven, K.; Freer, J.; Hall, J.W.; Rougier, J.; Stephenson, D.B.; Wagener, T. Sensitivity analysis of environmental models: A systematic review with practical workflow. Environ. Model. Softw. 2016, 79, 214–232. [Google Scholar] [CrossRef] [Scilit]
- Azarhoosh, Z.; Ilchi Ghazaan, M. A Review of Recent Advances in Surrogate Models for Uncertainty Quantification of High-Dimensional Engineering Applications. Comput. Methods Appl. Mech. Eng. 2025, 433, 117508. [Google Scholar] [CrossRef] [Scilit]
- Saltelli, A.; Aleksankina, K.; Becker, W.; Fennell, P.; Ferretti, F.; Holst, N.; Li, S.; Wu, Q. Why So Many Published Sensitivity Analyses Are False: A Systematic Review of Sensitivity Analysis Practices. Environ. Model. Softw. 2019, 114, 29–39. [Google Scholar] [CrossRef] [Scilit]
- Prieur, C.; Tarantola, S. Variance-Based Sensitivity Analysis: Theory and Estimation Algorithms. In Handbook of Uncertainty Quantification; Ghanem, R., Higdon, D., Owhadi, H., Eds.; Springer: Cham, Switzerland, 2017; pp. 1217–1239. [Google Scholar] [CrossRef] [Scilit]
- Tarantola, S.; Becker, W. SIMLAB Software for Uncertainty and Sensitivity Analysis. In Handbook of Uncertainty Quantification; Ghanem, R., Higdon, D., Owhadi, H., Eds.; Springer: Cham, Switzerland, 2016; pp. 1–21. [Google Scholar] [CrossRef] [Scilit]
- Liu, Y.; Abeyratne, A.I. Practical Applications of Bayesian Reliability; John Wiley & Sons: Hoboken, NJ, USA, 2019. [Google Scholar]
- Baucells, M.; Borgonovo, E. Invariant Probabilistic Sensitivity Analysis. Manag. Sci. 2013, 59, 2536–2549. [Google Scholar] [CrossRef] [Scilit]
- Tang, K.; Luo, B.; Chen, D.; Wang, C.; Chen, L.; Li, F.; Cao, Y.; Wang, C. The State of Health Estimation of Lithium-Ion Batteries: A Review of Health Indicators, Estimation Methods, Development Trends and Challenges. World Electr. Veh. J. 2025, 16, 429. [Google Scholar] [CrossRef] [Scilit]
- Plett, G.L. Battery Management Systems, Volume I: Battery Modeling; Artech House: Norwood, MA, USA, 2015. [Google Scholar]
- Srinivasan, V.; Newman, J. Discharge Model for the Lithium Iron-Phosphate Electrode. J. Electrochem. Soc. 2004, 151, A1517–A1529. [Google Scholar] [CrossRef] [Scilit]
- Srinivasan, V.; Newman, J. Design and Optimization of a Natural Graphite/Iron Phosphate Lithium-Ion Cell. J. Electrochem. Soc. 2004, 151, A1530. [Google Scholar] [CrossRef] [Scilit]
- Laue, V.; Röder, F.; Krewer, U. Joint Structural and Electrochemical Modeling: Impact of Porosity on Lithium-Ion Battery Performance. Electrochim. Acta 2019, 314, 20–31. [Google Scholar] [CrossRef] [Scilit]
- Kang, J.; Gong, Z.; Wang, J.V.; Chen, W.; Wang, Q.; Fan, Y.; Huang, B. A Novel Method of Parameter Identification for Electrochemical Models of LiFePO4 Batteries Using Parallel Computing and Multi-Objective Optimization. J. Energy Storage 2025, 122, 116662. [Google Scholar] [CrossRef] [Scilit]
- Jokar, A.; Désilets, M.; Lacroix, M.; Zaghib, K. Mesoscopic Modeling and Parameter Estimation of a Lithium-Ion Battery Based on LiFePO4/Graphite. J. Power Sources 2018, 379, 84–90. [Google Scholar] [CrossRef] [Scilit]
- Xiong, R.; Duan, Y.; Zhang, K.; Lin, D.; Tian, J.; Chen, C. State-of-Charge Estimation for Onboard LiFePO4 Batteries with Adaptive State Update in Specific Open-Circuit-Voltage Ranges. Appl. Energy 2023, 349, 121581. [Google Scholar] [CrossRef] [Scilit]
- Safari, M.; Delacourt, C. Modeling of a Commercial Graphite/LiFePO4 Cell. J. Electrochem. Soc. 2011, 158, A562. [Google Scholar] [CrossRef] [Scilit]
- Ahmed, R.; El Sayed, M.; Arasaratnam, I.; Tjong, J.; Habibi, S. Reduced-Order Electrochemical Model Parameters Identification and SOC Estimation for Healthy and Aged Li-Ion Batteries—Part I: Model Development. IEEE J. Emerg. Sel. Top. Power Electron. 2014, 2, 659–677. [Google Scholar] [CrossRef] [Scilit]
- Trivella, A.; Corno, M.; Radrizzani, S.; Savaresi, S.M. Non-Invasive Experimental Identification of a Single Particle Model for LiFePO4 Cells. IFAC-PapersOnLine 2023, 56, 11491–11496. [Google Scholar] [CrossRef] [Scilit]
- Ouisse, M.; Ichchou, M.; Chedly, S.; Collet, M. On the Sensitivity Analysis of Porous Material Models. J. Sound Vib. 2012, 331, 5292–5308. [Google Scholar] [CrossRef] [Scilit]
- Prada, E.; Di Domenico, D.; Creff, Y.; Bernard, J.; Sauvant-Moynot, V.; Huet, F. A Simplified Electrochemical and Thermal Aging Model of LiFePO4-Graphite Li-Ion Batteries: Power and Capacity Fade Simulations. J. Electrochem. Soc. 2013, 160, A616. [Google Scholar] [CrossRef] [Scilit]
- Li, X.; Xiao, M.; Chloe, S.; Joe, W.T. Modeling and Analysis of LiFePO4/Carbon Battery Considering Two-Phase Transition during Galvanostatic Charging/Discharging. Electrochim. Acta 2015, 155, 447–457. [Google Scholar] [CrossRef] [Scilit]
- Prada, E.; Di Domenico, D.; Creff, Y.; Bernard, J.; Sauvant-Moynot, V.; Huet, F. Simplified Electrochemical and Thermal Model of LiFePO4-Graphite Li-Ion Batteries for Fast Charge Applications. J. Electrochem. Soc. 2012, 159, A1508–A1519. [Google Scholar] [CrossRef] [Scilit]
- Tan, X.; Qiu, J.; Li, J.; Fan, Y.; Liu, J. Lithium Plating as Limiting Phenomena for Estimating Safety during Lithium-Ion Battery Charging. Int. J. Electrochem. Sci. 2020, 15, 9233–9244. [Google Scholar] [CrossRef] [Scilit]
- Huang, J.; Zhang, J.; Li, Z.; Song, S.; Wu, N. Exploring Differences between Charge and Discharge of LiMn2O4/Li Half-Cell with Dynamic Electrochemical Impedance Spectroscopy. Electrochim. Acta 2014, 131, 228–235. [Google Scholar] [CrossRef] [Scilit]

Disclaimer/Publisher’s Note: The statements, opinions and data contained in all publications are solely those of the individual author(s) and contributor(s) and not of MDPI and/or the editor(s). MDPI and/or the editor(s) disclaim responsibility for any injury to people or property resulting from any ideas, methods, instructions or products referred to in the content. |
© 2026 by the authors. Licensee MDPI, Basel, Switzerland. This article is an open access article distributed under the terms and conditions of the Creative Commons Attribution (CC BY) license.