


Abstract
Ship structural failure mode classification still relies heavily on subjective expert judgment, which is time-consuming and may introduce uncertainty in safety assessment. Although deep learning provides a promising avenue for automation, many existing learning approaches rely on 2D image representations and may therefore suffer from geometric occlusion and information loss when projecting complex 3D stiffened structures. To address these challenges, we propose a Physics-Guided Graph Convolutional Network (PGGCN) for failure mode classification. Specifically, our method models finite-element (FE) meshes directly as graphs, preserving the holistic topology and displacement-field fidelity without viewpoint dependency. We further incorporate domain knowledge through a hybrid strategy: a Deep Graph Convolutional Network (DeepGCN) first detects local component buckling states such as plate or web buckling, and a logic matrix derived from classical failure definitions subsequently determines panel-level failure modes. To enable systematic evaluation, we construct a dataset spanning diverse stiffened-panel geometries via Latin Hypercube Sampling. Progressive analysis states from each loading case are organized into task-specific graph samples for supervised learning. Experiments on the test set achieve accuracies of 95.48% and 91.42% for plate- and web-buckling classification, respectively, and 89.56% for panel-level failure mode discrimination. These results demonstrate that the proposed method provides an interpretable framework for automated failure mode classification from FE meshes in ship stiffened panels.
Keywords:
ship structure; graph convolutional network; failure mode classification; stiffened panel; finite element analysis MSC:
68T07; 62H30
1. Introduction
In the field of marine engineering, structural strength is a paramount factor ensuring the safety, reliability, and economic operation of ships. Accurate assessment of the ultimate strength of hull structures is fundamental for guaranteeing their serviceability in complex marine environments. Consequently, nonlinear Finite Element Analysis (FEA) has become a standard tool for ultimate-strength assessment of critical structural components, such as decks, bottoms, and side shells, during design and construction. These high-fidelity simulations generate massive datasets capturing the complex evolution of stress and displacement fields.
However, identifying specific structural failure modes from massive datasets remains highly challenging. Although nonlinear FEA provides detailed displacement, stress, and strain fields, converting these raw response outputs into standardized failure-mode labels still often relies on expert interpretation of deformation patterns, response histories, and collapse characteristics obtained from FEA and experiments [1,2,3,4]. This post-processing workflow becomes particularly time-consuming when the number of simulation cases is large, and it may also introduce inconsistency across cases. Moreover, coupled or interacting failure modes are frequently subtle, making them difficult to distinguish reliably from deformation contours alone.
In recent years, artificial intelligence has demonstrated robust applicability in physical modeling and engineering analysis [5,6,7]. While Convolutional Neural Networks (CNNs) have achieved success in image-based marine inspection tasks, such as ship hull corrosion monitoring and weld defect classification [8,9], their direct application to 3D ship structures is less straightforward. Ship structures are represented by irregular FE meshes rather than regular Euclidean grids. When 3D FEA results are converted into 2D images or contour maps for learning, part of the geometric and topological information may be lost, which is unfavorable for identifying localized deformation in stiffened structures. Consequently, a geometric deep learning approach capable of processing the 3D manifold directly, without viewpoint dependency or dimensionality reduction, is required.
Addressing these limitations, we propose a Physics-Guided Graph Convolutional Network (PGGCN) for automated failure mode classification, built upon a DeepGCN backbone [10]. Rather than physics-informed learning that explicitly imposes physical constraints during training, physics guidance is incorporated throughout the pipeline, from the topology of FE meshes and canonical geometric alignment to the rule-based failure-logic matrix used for panel-level inference. Here, physics-guided does not mean that governing equations, physical residuals, or physics-based loss terms are imposed during training. By representing FE meshes directly as graphs, our method learns from the complete 3D displacement field and avoids an explicit 3D-to-2D projection stage. To reliably identify complex global failure modes, we further introduce a knowledge-driven hierarchical strategy that mirrors expert diagnostic reasoning. Specifically, DeepGCN serves as the perception layer to recognize local buckling states at the component level, while a predefined logic matrix acts as the inference layer to determine panel-level failure modes according to established structural failure criteria. The proposed framework is not a purely black-box classifier; instead, it combines a data-driven graph-learning component with a physics-guided inference layer based on a deterministic logic matrix derived from classical structural mechanics.
In summary, our main contributions are as follows:
- We propose PGGCN as, to the best of our knowledge, among the first graph neural network-based frameworks for ship structural failure mode classification. Unlike prior learning-based studies, which mainly focus on response prediction or related tasks, PGGCN enables accurate discrimination among different failure modes within the present simulation-based evaluation through graph-based perception of ship structural displacement responses.
- We propose a hierarchical failure mode classification strategy based on domain-specific knowledge of ship structural failure. Built on a unified graph neural network framework for representing ship structural instances composed of stiffened panels, this strategy supports a two-level classification pipeline, from component buckling-state classification to panel-level failure mode determination.
- We construct SFMD, a simulation-based dataset for ship structural failure mode classification. The dataset contains more than 500 numerical models of ship stiffened panels and 34,806 labeled graph samples, covering six failure modes. We evaluate PGGCN on SFMD, and the experimental results demonstrate the effectiveness of the proposed method.
2. Related Work
2.1. Traditional Ship Structural Failure Analysis Methods
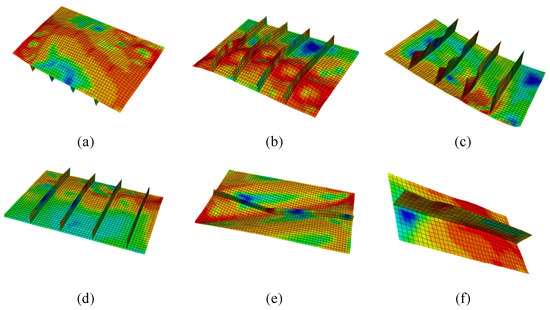
For stiffened panels subjected predominantly to compressive loading, classical studies identify six representative failure modes, namely overall (grillage) buckling collapse, yielding along the plate–stiffener intersection, beam-column collapse of the plate–stiffener combination, local buckling of the stiffener web, stiffener tripping, and gross yielding of the panel cross-section [11,12]. In the present study, these classical failure modes are used as the theoretical basis, but the practical labels are adjusted according to the failure modes that can be identified more reliably from FE deformation patterns. Specifically, Overall Buckling Failure, Beam-Column Buckling Failure, Stiffener Web Buckling Failure, and Stiffener Tripping Failure are retained from the classical definitions; Local Plate Buckling Failure and Shear Buckling Failure are introduced as engineering-oriented categories to better describe the deformation patterns observed in the dataset; yielding-dominated modes are not treated as standalone labels in the current study; and No Failure is added to represent non-failure states. Figure 1 shows the representative failure modes considered in this study. The No Failure case corresponds to states in which neither the plate nor the stiffener web exhibits recognizable buckling deformation.
Figure 1.
Representative failure modes considered in this study: (a) Overall Buckling Failure; (b) Beam-Column Buckling Failure; (c) Stiffener Tripping Failure; (d) Local Plate Buckling Failure; (e) Shear Buckling Failure; (f) Stiffener Web Buckling Failure. Color contours indicate the stress distribution.
Traditional approaches to ship structural failure analysis mainly include theoretical or semi-empirical formulations, numerical simulations, reliability/surrogate-model methods, and experimental studies. Theoretical or semi-empirical formulations derive collapse loads or ultimate strength from structural mechanics assumptions and calibrated formulae [11,12]. Numerical simulations, including nonlinear finite element methods and peridynamics-based methods, resolve deformation, stress, and fracture evolution in complex stiffened structures [2,13,14]. Reliability and surrogate-model methods use numerical or experimental data to estimate ultimate strength or failure probability efficiently [15]. Experimental studies directly observe buckling, post-buckling behavior, and failure processes through physical testing [3]. However, experimental studies are limited by constraints such as test facility capacity and cost; thus, scaled model tests are often conducted, and the results may not fully represent real scenarios.
In general, traditional methods have established a relatively mature framework for evaluating the load-carrying capacity and ultimate strength of ship structures under specific loading and structural conditions. Theoretical and empirical approaches provide efficient estimates of failure trends or probabilities, while finite element methods (FEM) and experimental studies offer detailed and visualized structural responses that support expert judgment. However, existing research predominantly focuses on analyzing response processes and ultimate strength in predefined scenarios, with failure mode classification largely relying on manual interpretation of deformation and damage patterns. As a result, systematic and generalizable methods capable of handling diverse failure scenarios under varying operating conditions remain limited, and an explicit, automated failure analysis framework has not yet been fully established.
2.2. Geometric Deep Learning for FE Meshes
Recent learning-based studies relevant to the present problem can be broadly grouped into image-based learning from projected mechanical responses and graph-based learning on native non-Euclidean structural discretizations. In marine engineering, early deep-learning applications mainly relied on image-based inputs, such as corrosion monitoring and weld-defect inspection [8,9]. In more mechanics-oriented settings, image-based networks have also been used for stress prediction in stiffened panels. For example, Mokhtari et al. showed that CNN-based surrogate models, particularly U-Net architectures with skip connections, can predict stress distributions in stiffened panels with less than 5% error relative to FEM results [16]. However, such approaches mainly address continuous field prediction rather than discrete failure mode classification, and they typically rely on projected or rasterized representations that do not directly preserve the native topology of FE meshes.
Recent reviews have highlighted the rapid growth of graph neural networks in mechanics-related domains [17]. In structural and solid mechanics, graph-based methods have been used for mesh-native response prediction of large-scale and multi-component mechanical systems [18], stress-field reconstruction and digital-twin-based structural monitoring [19], and graph representations of stiffened panels for stress prediction under varying geometries, loading conditions, and boundary conditions [20,21]. These studies demonstrate that graph-based learning is well suited to non-Euclidean finite element data and can preserve structural topology more naturally than fixed-grid image representations.
In adjacent failure-related tasks, GNNs have also been applied to dominant failure-mode searching [22], crack propagation and coalescence simulation in brittle materials [23], and related damage-identification problems. Nevertheless, most of these studies focus on continuous-response prediction, fracture evolution, or structural failure searching, rather than hierarchical failure-mode classification of ship stiffened panels from native FE meshes. To address this limitation, the present work formulates failure mode classification as a two-stage process in which component-level buckling states are first identified from mesh-native graph representations and then fused into panel-level failure modes through an interpretable logic layer.
3. Methodology
3.1. Preliminaries on Graph Neural Networks
GNNs represent a powerful paradigm for learning representations from non-Euclidean data domains [17,24,25]. Formally, an FE mesh is defined as a graph , where is the set of N nodes and is the set of edges representing element connectivity. Each node is associated with a feature vector , which encodes initial physical attributes such as nodal coordinates and displacement vectors.
The core mechanism of GNNs is the message-passing neural network framework [26]. For a deep network of depth L, node representations are updated iteratively at each layer . This process consists of three mathematical operations:
where and are learnable functions (typically multi-layer perceptrons (MLPs)), and is a permutation-invariant aggregation function. While standard GNNs often use mean or max pooling for , determining buckling patterns requires capturing high-frequency local variations. Thus, we adopt SoftMax Aggregation, which adaptively assigns weights to neighbors based on feature significance, allowing the model to focus on critical deformation regions [27].
Training deep graph neural networks on dense FE meshes is often challenged by vanishing gradients and over-smoothing, where node embeddings become increasingly indistinguishable as network depth grows. In our method, we address these issues by adopting the DeepGCN backbone [10]. DeepGCN introduces residual/skip connections to stabilize optimization and enables substantially deeper graph architectures, which is crucial for capturing multi-scale deformation patterns on graphs built from dense FE meshes. The generic update rule of a residual graph convolution layer is formulated as:
where represents the nonlinear graph convolution operation (including message passing and aggregation). This residual structure allows gradients to propagate effectively through multiple layers, enabling the network to learn high-level topological features directly from the complex discretization of ship structures.
3.2. Overview of the Proposed Framework
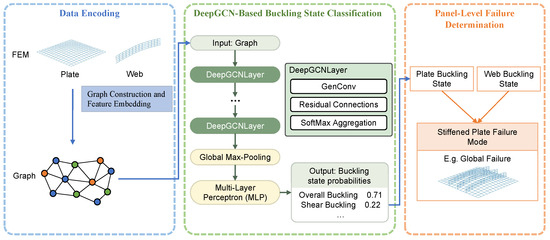
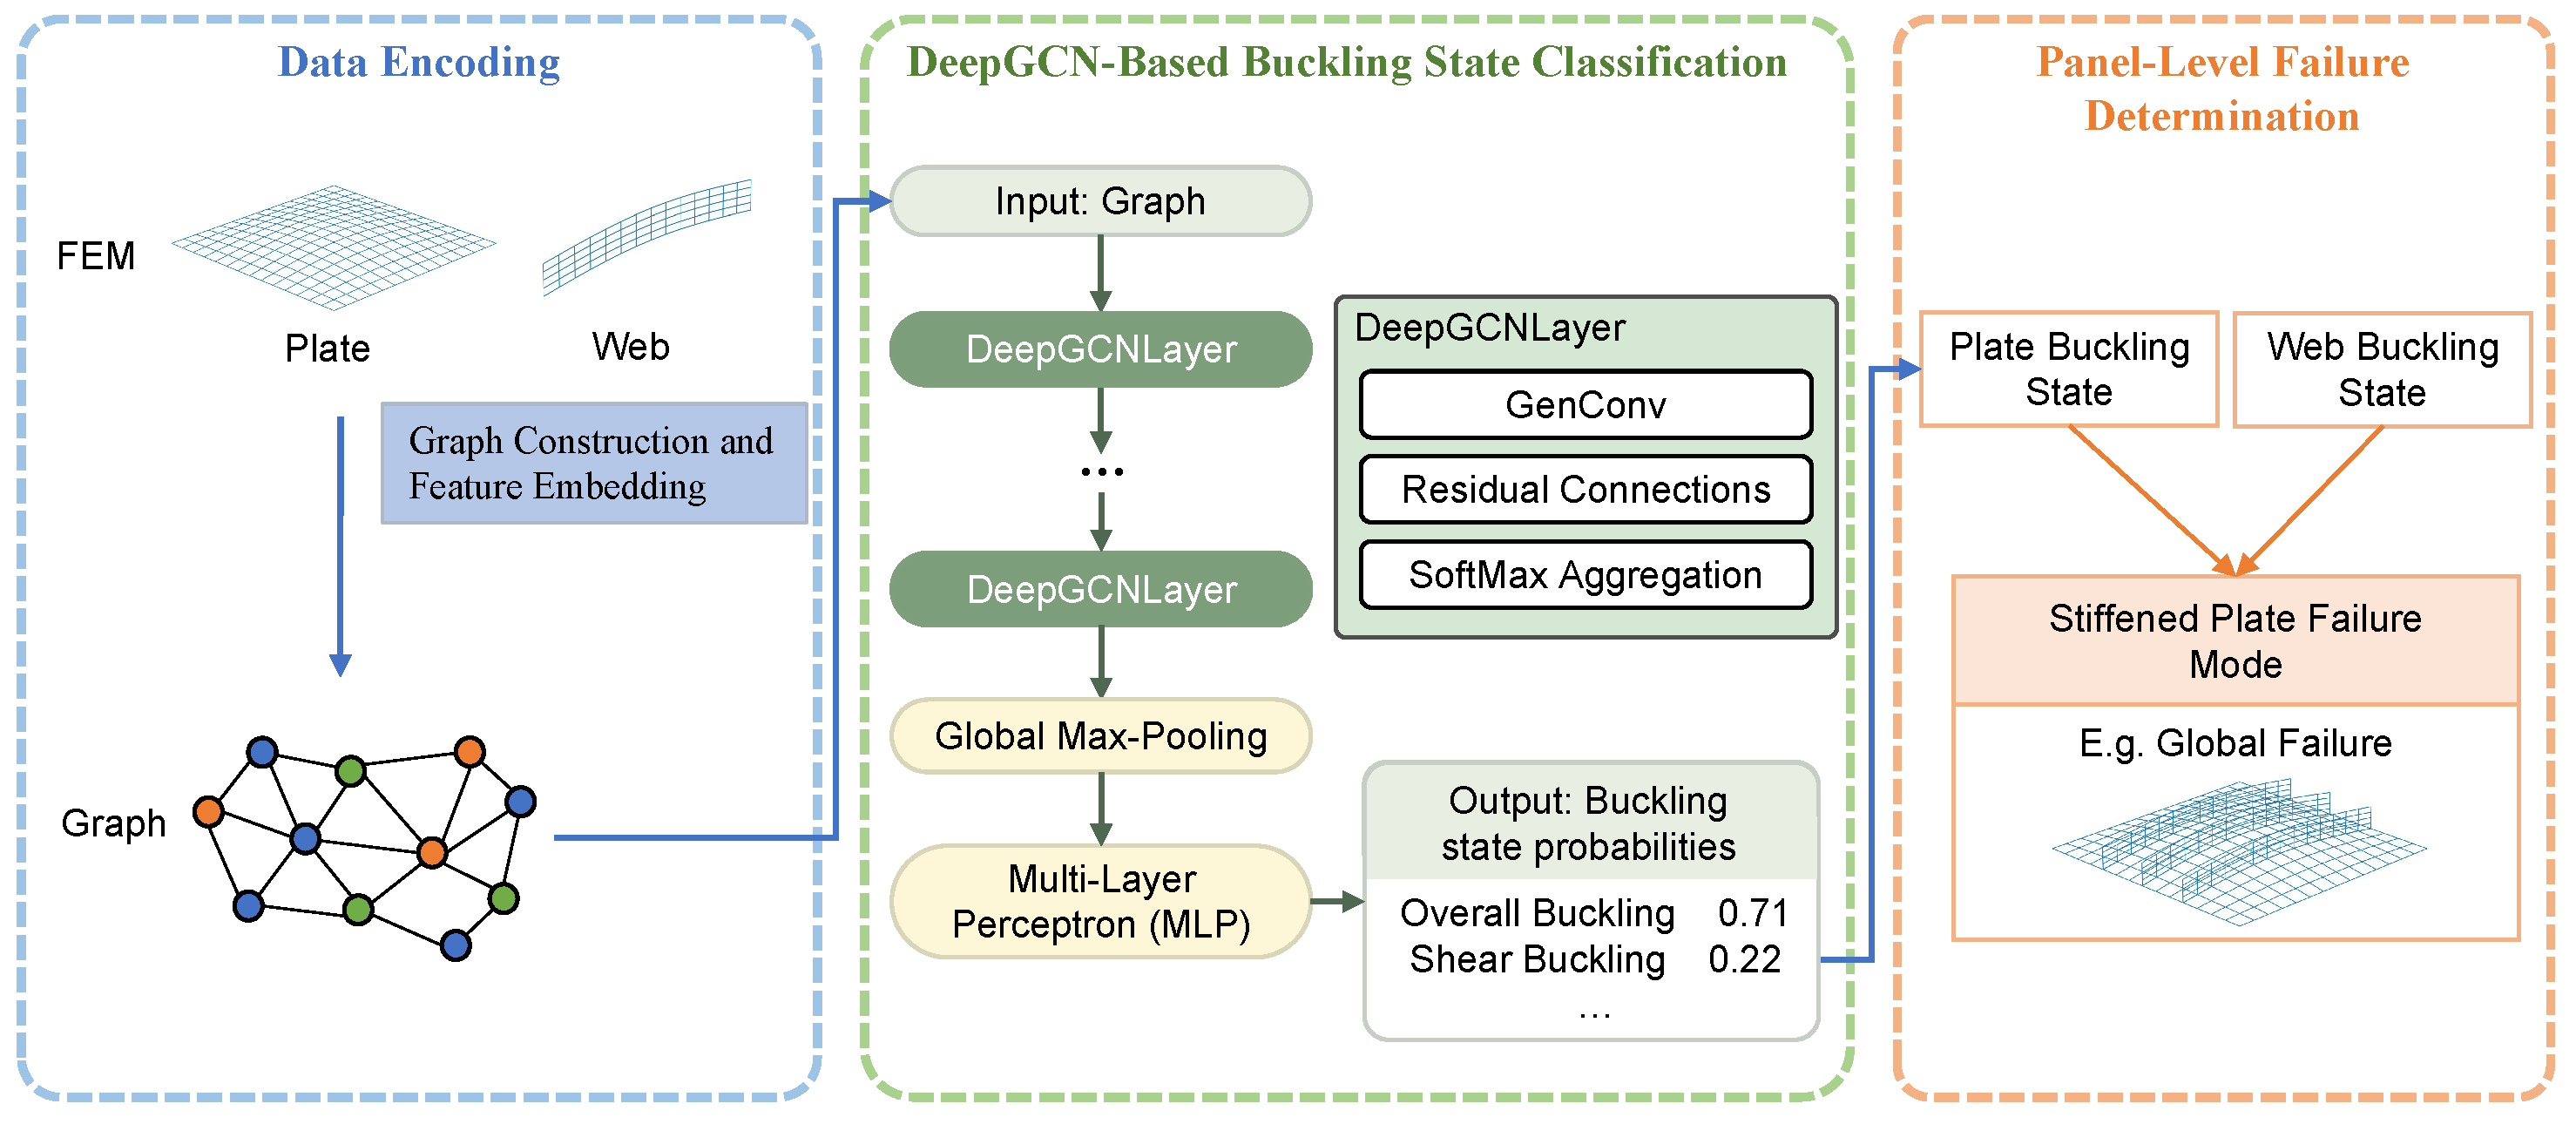
To mitigate the subjectivity and low efficiency of conventional failure mode classification, we propose PGGCN, which is built upon a DeepGCN backbone. The pipeline is designed to process finite element simulation outputs, specifically nodal coordinates and displacement fields, and to automate the post-processing step that maps FE response data to failure-mode labels. The overall architecture, as depicted in Figure 2, consists of three sequentially integrated phases. The process commences with Data Encoding, which transforms the continuous physical domain into discrete graph representations suitable for neural processing. Following this, the DeepGCN-based buckling classification phase identifies the buckling states of individual structural components (i.e., the face plate and the stiffener web) from the displacement field. Finally, the framework determines the panel-level failure mode by combining the plate buckling state with the web buckling states through the logic matrix. The guidance from mechanics enters through the mesh-based graph construction, the orientation normalization, and the deterministic rule set, whereas the component classifier itself remains a supervised data-driven model.
Figure 2.
The overall framework of the proposed failure mode classification method. Colored blocks, arrows, dots, and squares indicate different processing stages and data-flow relationships.
3.3. Data Encoding
To transform the raw finite element simulation results into a format suitable for geometric deep learning, a data encoding pipeline is employed. This process integrates state filtering, structural decomposition, and graph feature embedding.
Stress-based state filtering. To reduce very early states with limited diagnostic value, an optional stress-based pre-screening step may be used in practical failure-mode assessment. For each simulation state, the maximum von Mises stress () within the panel is compared against the material yield limit () [21]. States satisfying may optionally be skipped as low-information early-response states. This heuristic is optional, is not part of PGGCN itself, and was not used in the reported training or test evaluation. Panel-level labels such as No Failure are determined later by the logic matrix from component buckling states, rather than by this stress threshold alone.
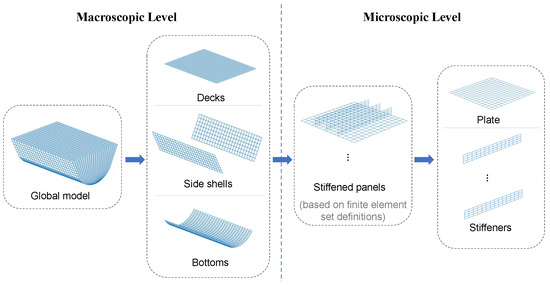
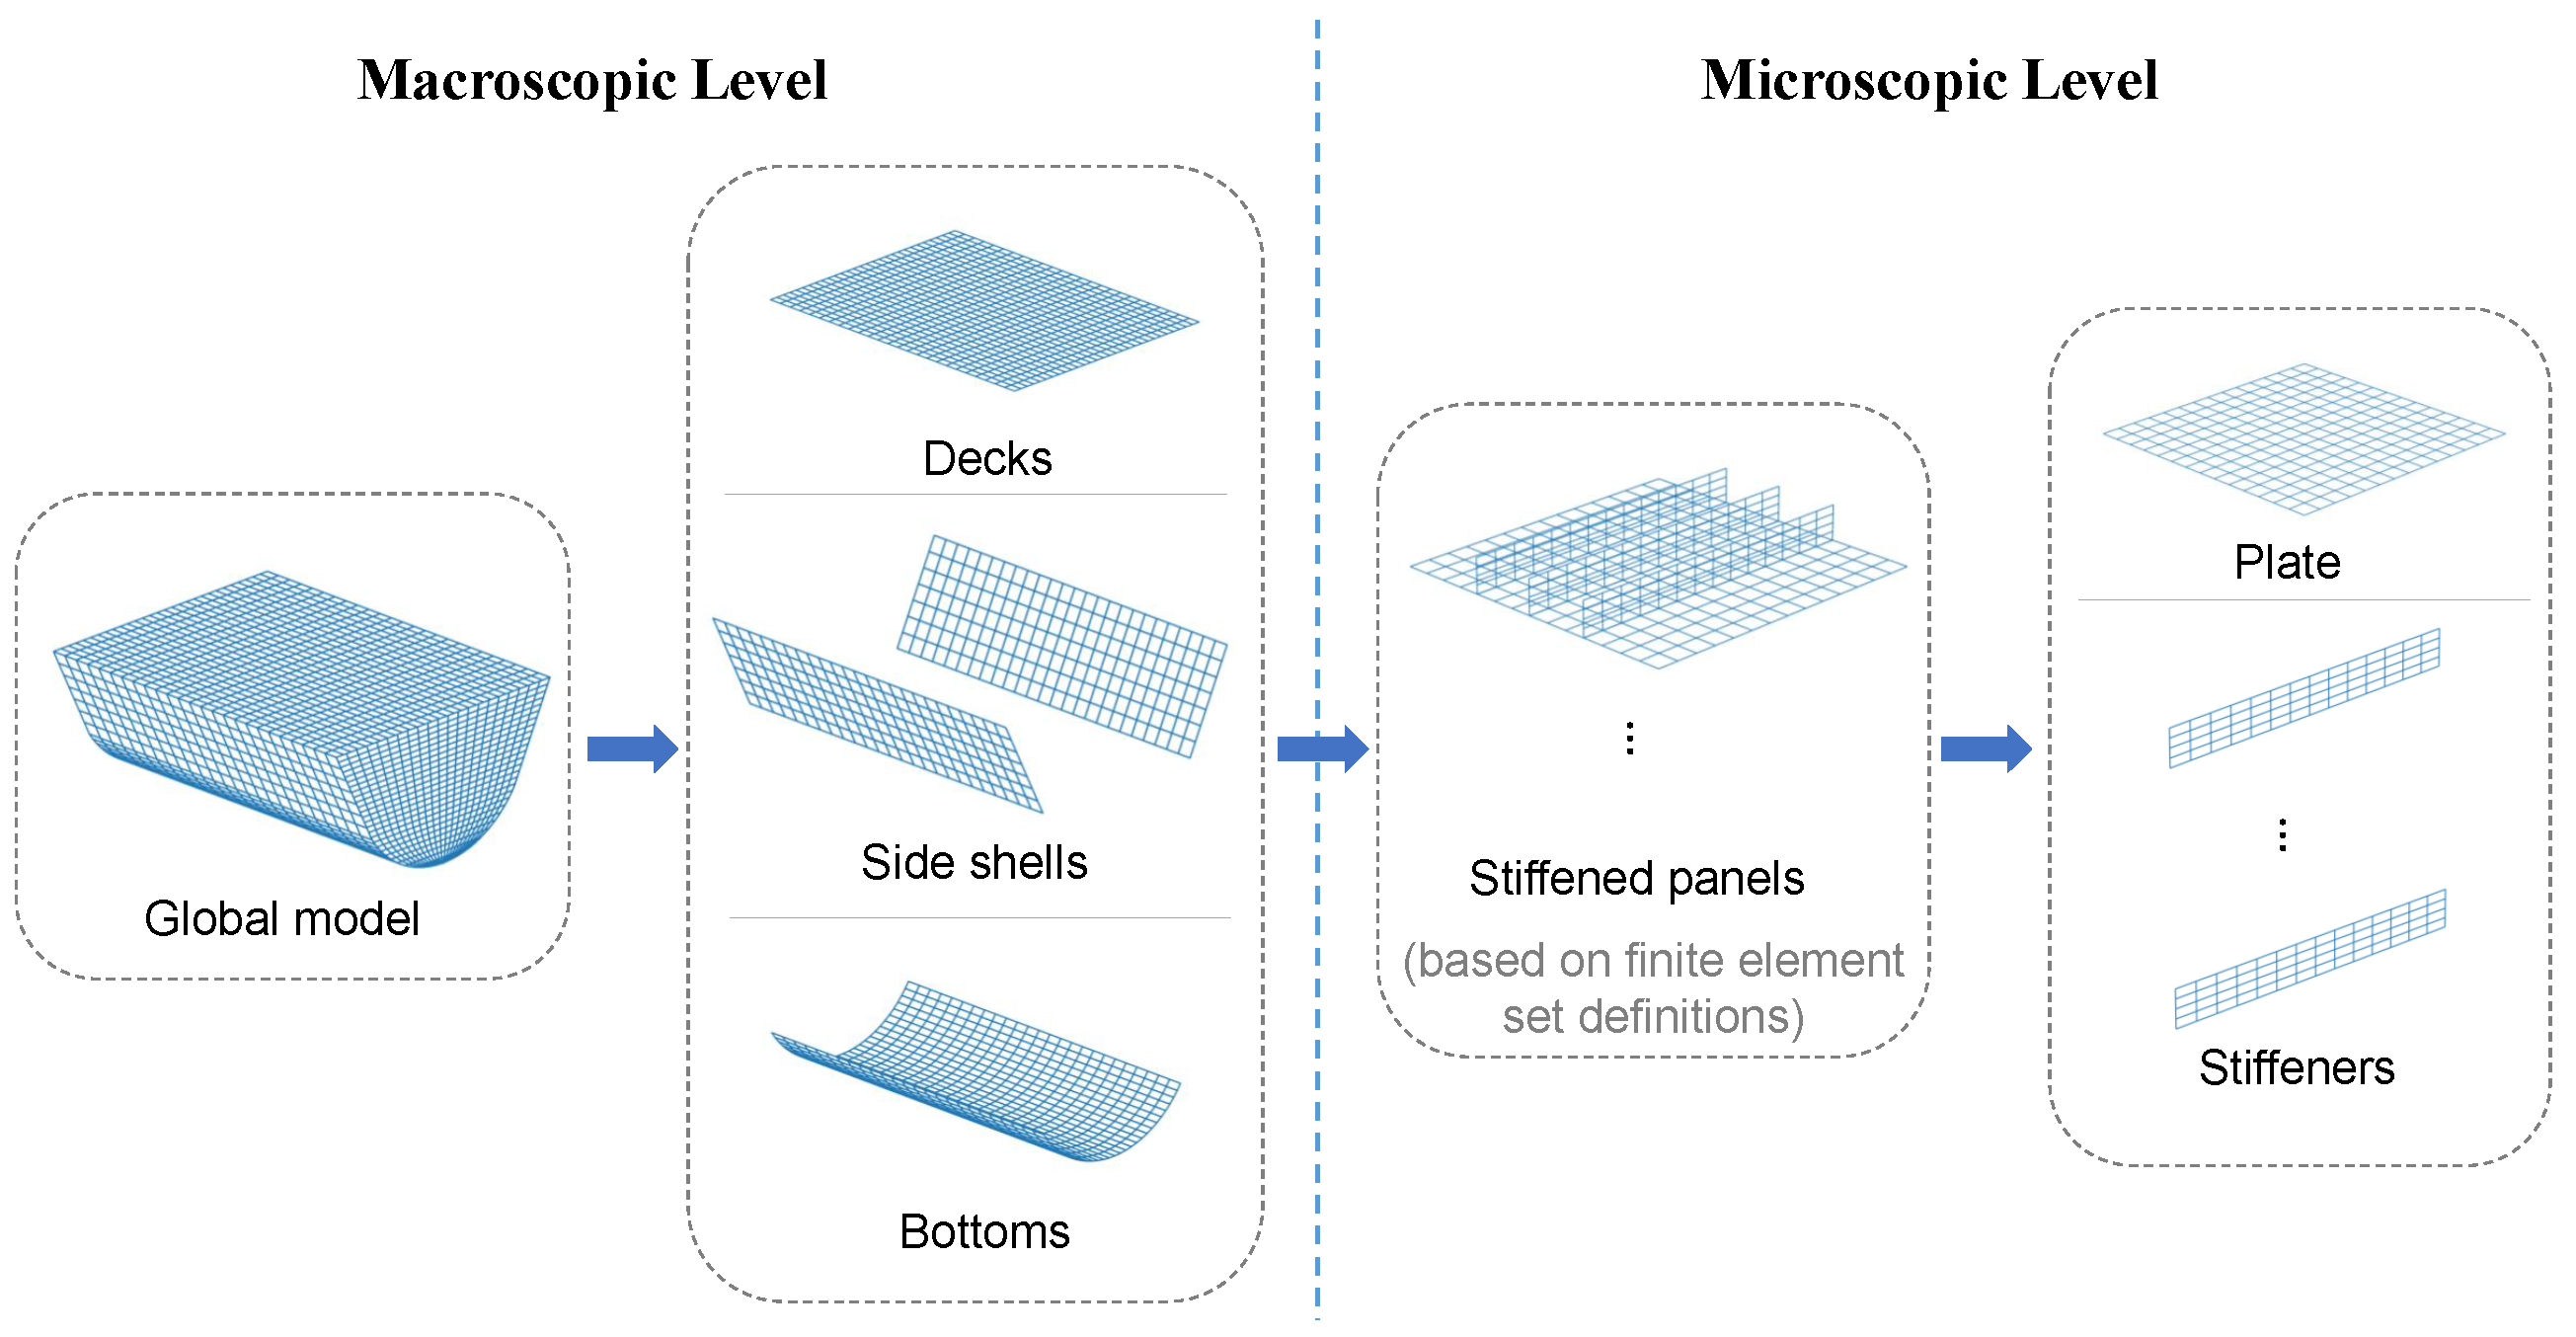
Hierarchical structural decomposition. Given the geometric complexity of ship hull sections, a decomposition strategy is employed (Figure 3). The global model is segmented into stiffened panels based on finite element set definitions [20]. To capture the distinct buckling states of different structural members, each panel is further decomposed into its fundamental mechanical constituents: the face plate and the stiffener web. This granular decomposition allows specific component instability features, such as web buckling, to be isolated, mitigating geometric occlusion by the larger plate area [28]. This hierarchical decomposition is introduced for an engineering purpose: because stiffened panels are fundamental load-bearing substructures within ship cabin sections, panel-level failure mode classification provides structured local evidence for interpreting the dominant instability characteristics of the cabin section as a whole.
Figure 3.
Hierarchical structure partitioning strategy for complex ship sections.
Graph construction and feature embedding. The structural modeling employs quadrilateral and triangular thin-shell elements (e.g., S4R/S3 types) to represent the large-deformation behavior of the thin-walled stiffened panels. Following decomposition, this discretized FE mesh is mapped to a graph structure [29]. In this mapping, mesh nodes correspond to graph vertices . The feature vector for a node v is explicitly constructed to encapsulate both geometric and physical state information:
where denote spatial coordinates, and represent displacement components. Edges are defined by element connectivity, representing the physical pathways for stress and force transmission.
To mitigate the adverse effects of spatial orientation discrepancies among varying components on model learning, a canonical orientation alignment strategy is implemented. This step aligns the estimated surface normal of each component to a unified target direction before graph learning, thereby reducing pose-induced variance in the geometric features [30].
Let the set of 3D nodal coordinates for the input component be denoted as . A consistent local reference frame is first established by centroid normalization, and .
The component orientation is then estimated via Principal Component Analysis (PCA) [31]. The covariance matrix is defined as
Singular value decomposition of then yields the minimum-variance axis , which is used as the estimated component normal for plate-like parts.
Each component is then rotated so that is aligned to a fixed target axis (here ). The rotation axis is defined by
If , the component is regarded as already aligned and no rotation is applied (i.e., ). Otherwise, we normalize and compute the rotation angle
The associated skew-symmetric matrix is
The corresponding rotation matrix follows the Rodrigues form:
Finally, is applied to both the nodal coordinates and displacement vectors, yielding the standardized input features for subsequent graph learning.
3.4. DeepGCN-Based Buckling State Classification
The core classification component of PGGCN is a custom-designed DeepGCN for graph-level buckling-state classification. Its full workflow is summarized in Algorithm 1: a linear encoder first maps nodal features into a latent space, L residual GenConv blocks with LayerNorm and ReLU then perform message passing, and the final graph embedding is obtained by Global Max Pooling followed by a linear classifier.
| Algorithm 1: DeepGCN-based component buckling state classifier (graph-level classification) |
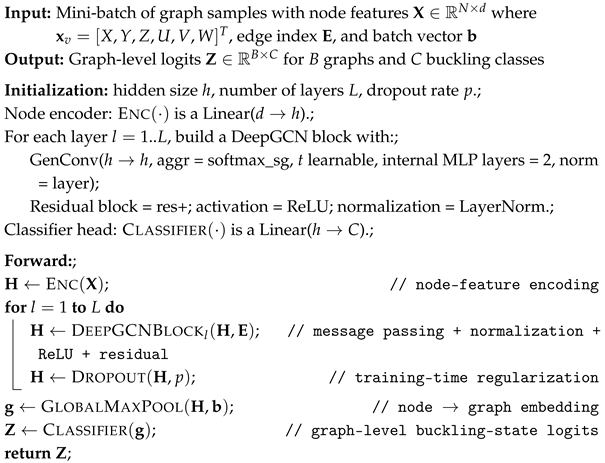 |
Following the generic residual update in Equation (4), each block instantiates with a GenConv-based graph convolution over the local neighborhood . This residual structure stabilizes optimization on graphs built from dense FE meshes and supports the deeper receptive fields required for multi-scale buckling patterns.
To better capture localized buckling waves, we employ the SoftMax aggregation function within . Unlike simple mean or max pooling, SoftMax aggregation adaptively assigns weights to neighbors according to feature importance. For a node v and its neighbor set , the aggregated feature is
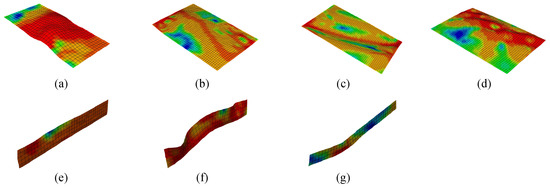
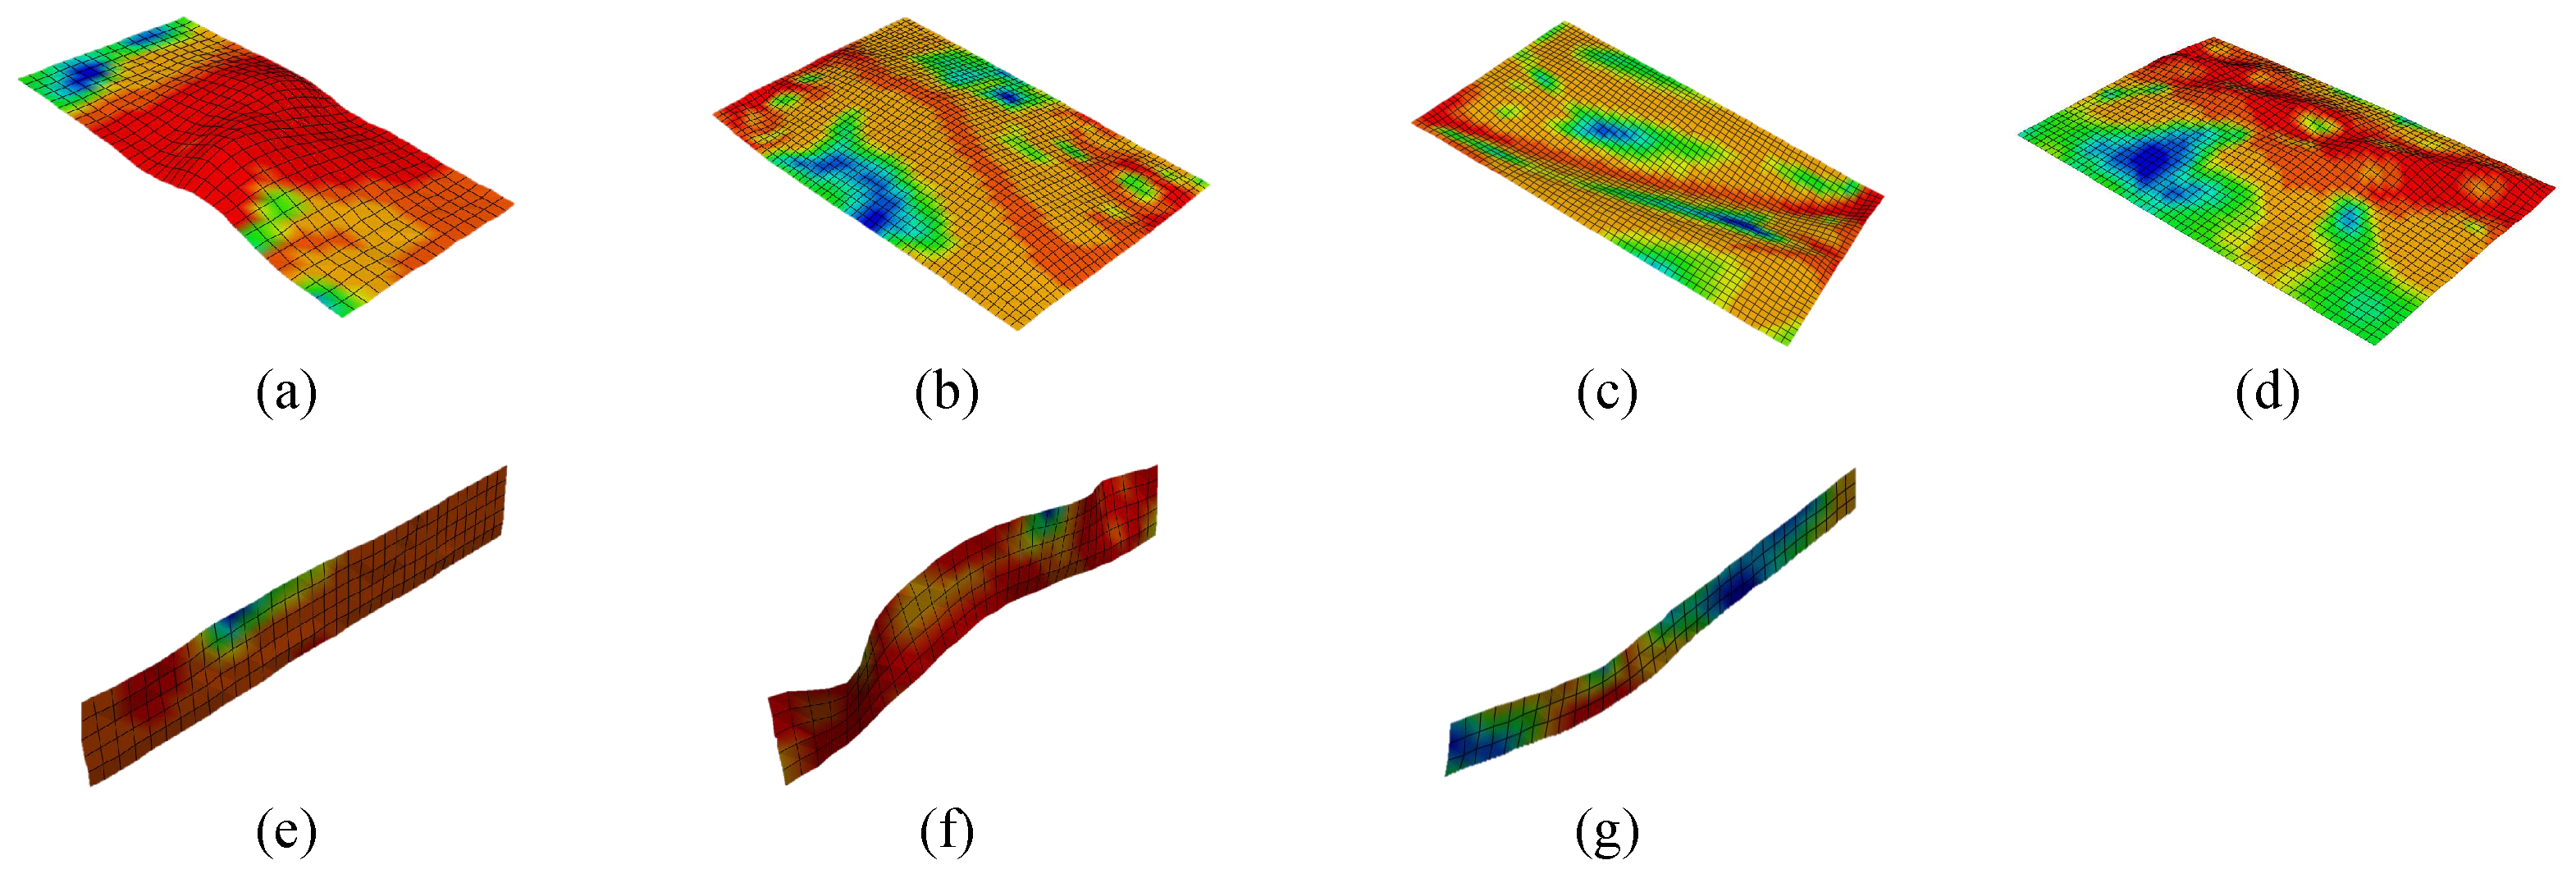
where and are learnable MLPs. This mechanism allows the network to emphasize neighbors exhibiting abnormal displacements while suppressing less informative regions. Figure 4 shows representative component-level patterns used in this stage.
Figure 4.
Representative component-level buckling patterns used in this study: (a) plate local buckling; (b) plate global buckling; (c) plate shear buckling; (d) plate composite buckling; (e) web intermediate buckling; (f) web upper edge buckling; (g) web arc-like buckling. Color contours indicate the stress distribution.
3.5. Optimization Objective
The model optimization is formulated as a supervised learning problem [32]. We employ the standard Cross-Entropy Loss to quantify the divergence between the predicted probability distribution and the ground truth labels [33]. For a training batch of N samples with C classes, the objective function is defined as:
where is the binary indicator for class c in sample i, and is the predicted probability. The network parameters are iteratively updated using the Adam optimizer to minimize this objective.
3.6. Panel-Level Failure Determination
While the DeepGCN identifies the buckling state of individual components, the ultimate goal of PGGCN is to determine the panel-level failure mode of the stiffened panel. To achieve this, we employ a physics-guided hierarchical strategy based on the plate buckling state and the web buckling state.
The logic matrix in Table 1 was established by combining the classical failure taxonomy of stiffened panels under compressive loading with engineering interpretation of the deformation characteristics observed in the present FE dataset [11,12]. Because the supervised learning stage focuses on component-level buckling-state classification for the face plate and each stiffener web, the matrix acts as a rule-based layer grounded in classical taxonomy and engineering interpretation to translate component-scale predictions into pair-level panel failure modes.
Table 1.
Logic matrix for panel-level failure mode discrimination. For brevity, the word Failure is omitted in the table entries;—denotes a physically inconsistent plate–web state combination that was not observed in the current dataset. The downward arrow denotes the plate buckling state, and the rightward arrow denotes the web buckling state.
The mapping follows a hierarchy of mechanical dominance rooted in classical stiffened-panel collapse classifications [1,11,12]. Plate global buckling takes precedence because it indicates system-level instability of the stiffened panel rather than isolated local deformation of a single web. Deformation concentrated near the stiffener free edge is interpreted as tripping-related instability [1,34], whereas coupled arc-like web deformation together with local or composite plate buckling is interpreted as beam-column behavior of the plate–stiffener assembly [1,11,12]. In the absence of a dominant plate instability, intermediate web buckling is classified as Stiffener Web Buckling, while plate shear buckling remains Shear Buckling regardless of the simultaneous web state.
In this taxonomy, No Failure denotes that neither the plate nor the web exhibits a recognizable buckling pattern in the current analysis step, so it is a morphology-based engineering label. The earlier stress-based filtering step only removes low-information early states and is not the criterion used for the final failure taxonomy. Combinations marked as — are treated as physically inconsistent under the adopted engineering definitions and were not observed in the present dataset.
4. Experiments
4.1. Datasets
To support the proposed learning framework, we constructed an ABAQUS-generated dataset of stiffened panels using nonlinear FEA and Latin hypercube sampling over key geometric and material parameters. The underlying ABAQUS models were constructed from large-scale model tests of representative ship cabin sections and were subsequently expanded through parametric variation within the same FE modeling framework. Accordingly, the present dataset is simulation-based but engineering-grounded. The present dataset should therefore be understood as a task-specific dataset constructed for method evaluation under the scope of this study. After task-specific organization, the dataset contains 34,806 labeled graph samples derived from progressive analysis states within each loading case, with an average of 1449 mesh nodes per graph.
Labels were assigned according to the engineering taxonomy introduced in Section 2. Annotation was carried out collaboratively by ship-structure experts. For each analysis state, the face plate and each stiffener web were interpreted from FE deformation patterns, with stress/strain fields and load–displacement responses consulted when geometry alone was insufficient. Borderline cases or differing initial interpretations were resolved through expert discussion to consensus, followed by a final expert review for cross-sample consistency. The supervised targets are the component-level buckling states of the face plate and stiffener web, whereas the panel-level label is determined afterward through the logic matrix in Table 1.
The dataset is organized at the stiffened-panel level. During evaluation, however, we use plate–web pairs as the fundamental counting unit: a panel with n webs contributes n pair-level panel samples, and the resulting plate and web states are fused through the predefined logic matrix to determine the panel-level failure mode. Accordingly, different plate–web pairs extracted from the same panel may legitimately correspond to different panel-level failure modes, and the reported panel-level metrics should be interpreted as pair-level diagnostics under the present protocol.
The dataset split was performed at the loading-case level to avoid direct train–test leakage between correlated analysis steps. A held-out subset of loading cases was reserved for final testing and the remainder was used for training; thus, the present evaluation should be interpreted as a case-level train/test protocol. This yields 9587/1395 train/test samples for the plate-stage task and 17,416/6408 for the web-stage and panel-level tasks. Table 2 and Table 3 report the class supports of the test set. Even with case-level splitting, samples from the same loading history are not fully independent within each subset, so the reported results should be interpreted as sample-level performance under the present data organization and evaluation protocol.
Table 2.
Component buckling state classification results on the test set.
Table 3.
Panel-level failure mode discrimination (counted on plate–web pairs). Boldface highlights the macro-average row, which summarizes the overall evaluation metrics.
4.2. Evaluation Metrics
To evaluate multi-class classification performance, we report Accuracy, Precision, Recall, and F1-score for (i) component-level buckling state classification (plate and web) and (ii) panel-level failure mode discrimination (plate–web pairs).
Accuracy is defined as the fraction of correctly classified samples:
where N is the number of samples, and denote the ground-truth and predicted labels, and is the indicator function.
For a class c, we compute its precision , recall , and F1-score using a one-vs- rest formulation:
To summarize performance across classes, we report Macro Average (unweighted mean over classes), which is suitable for imbalanced failure-mode distributions:
4.3. Implementation Details
The proposed framework was implemented using Python 3.8.5, PyTorch 1.8.1+cu111, PyTorch Geometric 2.0.4, and CUDA 11.1. The DeepGCN backbone consists of four residual GenConv layers with a hidden feature dimension of 64, SoftMax aggregation, and a dropout rate of 0.5. Training was performed with the Adam optimizer, an initial learning rate of , a weight decay of , a batch size of 64, and 200 epochs. The learning rate was reduced by a factor of 0.5 every 50 epochs, and a fixed random seed of 3407 was used throughout the experiments. All reported results are based on a single training run under this fixed-seed configuration. The experiments were conducted on a workstation equipped with an NVIDIA RTX 4090 GPU with 24 GB of memory.
4.4. Experimental Results
All reported metrics are computed on the task-specific supervised samples derived from analysis states within each loading case. To avoid train–test leakage, the dataset split is performed at the loading-case level, and no sequence-level aggregation across steps within the same loading case is applied in the reported metrics. The held-out test set comprises 6408 plate–web pairs for panel-level failure mode discrimination. Note that evaluation is conducted at two levels: the plate stage involves 1395 face-plate samples, while the web-stage and panel-level evaluations use 6408 plate–web pairs. This discrepancy arises because a single face plate may correspond to multiple stiffener webs within a panel.
Detailed metrics are summarized in Table 2 and Table 3. On this test set, the proposed framework achieves an accuracy of 89.56% for panel-level failure mode discrimination, with Macro-Precision, Recall, and F1-score reaching 90.06%, 88.76%, and 89.24%, respectively. Regarding component-level buckling classification, the accuracy reaches 95.48% for the plate stage and 91.42% for the web stage. Pair-level accuracy stratified by the number of webs in the source panel is summarized in Table 4; the corresponding accuracies are 86.01%, 86.56%, 80.54%, 77.45%, 97.75%, and 93.79% for panels containing 1, 2, 3–4, 5–8, 9–16, and 17+ webs, indicating a non-monotonic trend under the present pair-level protocol.
Table 4.
Pair-level panel accuracy stratified by the number of webs in the source panel.
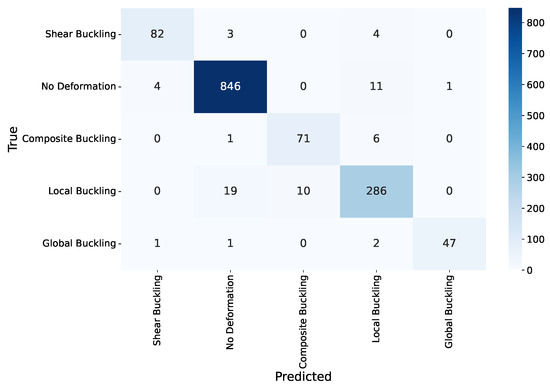
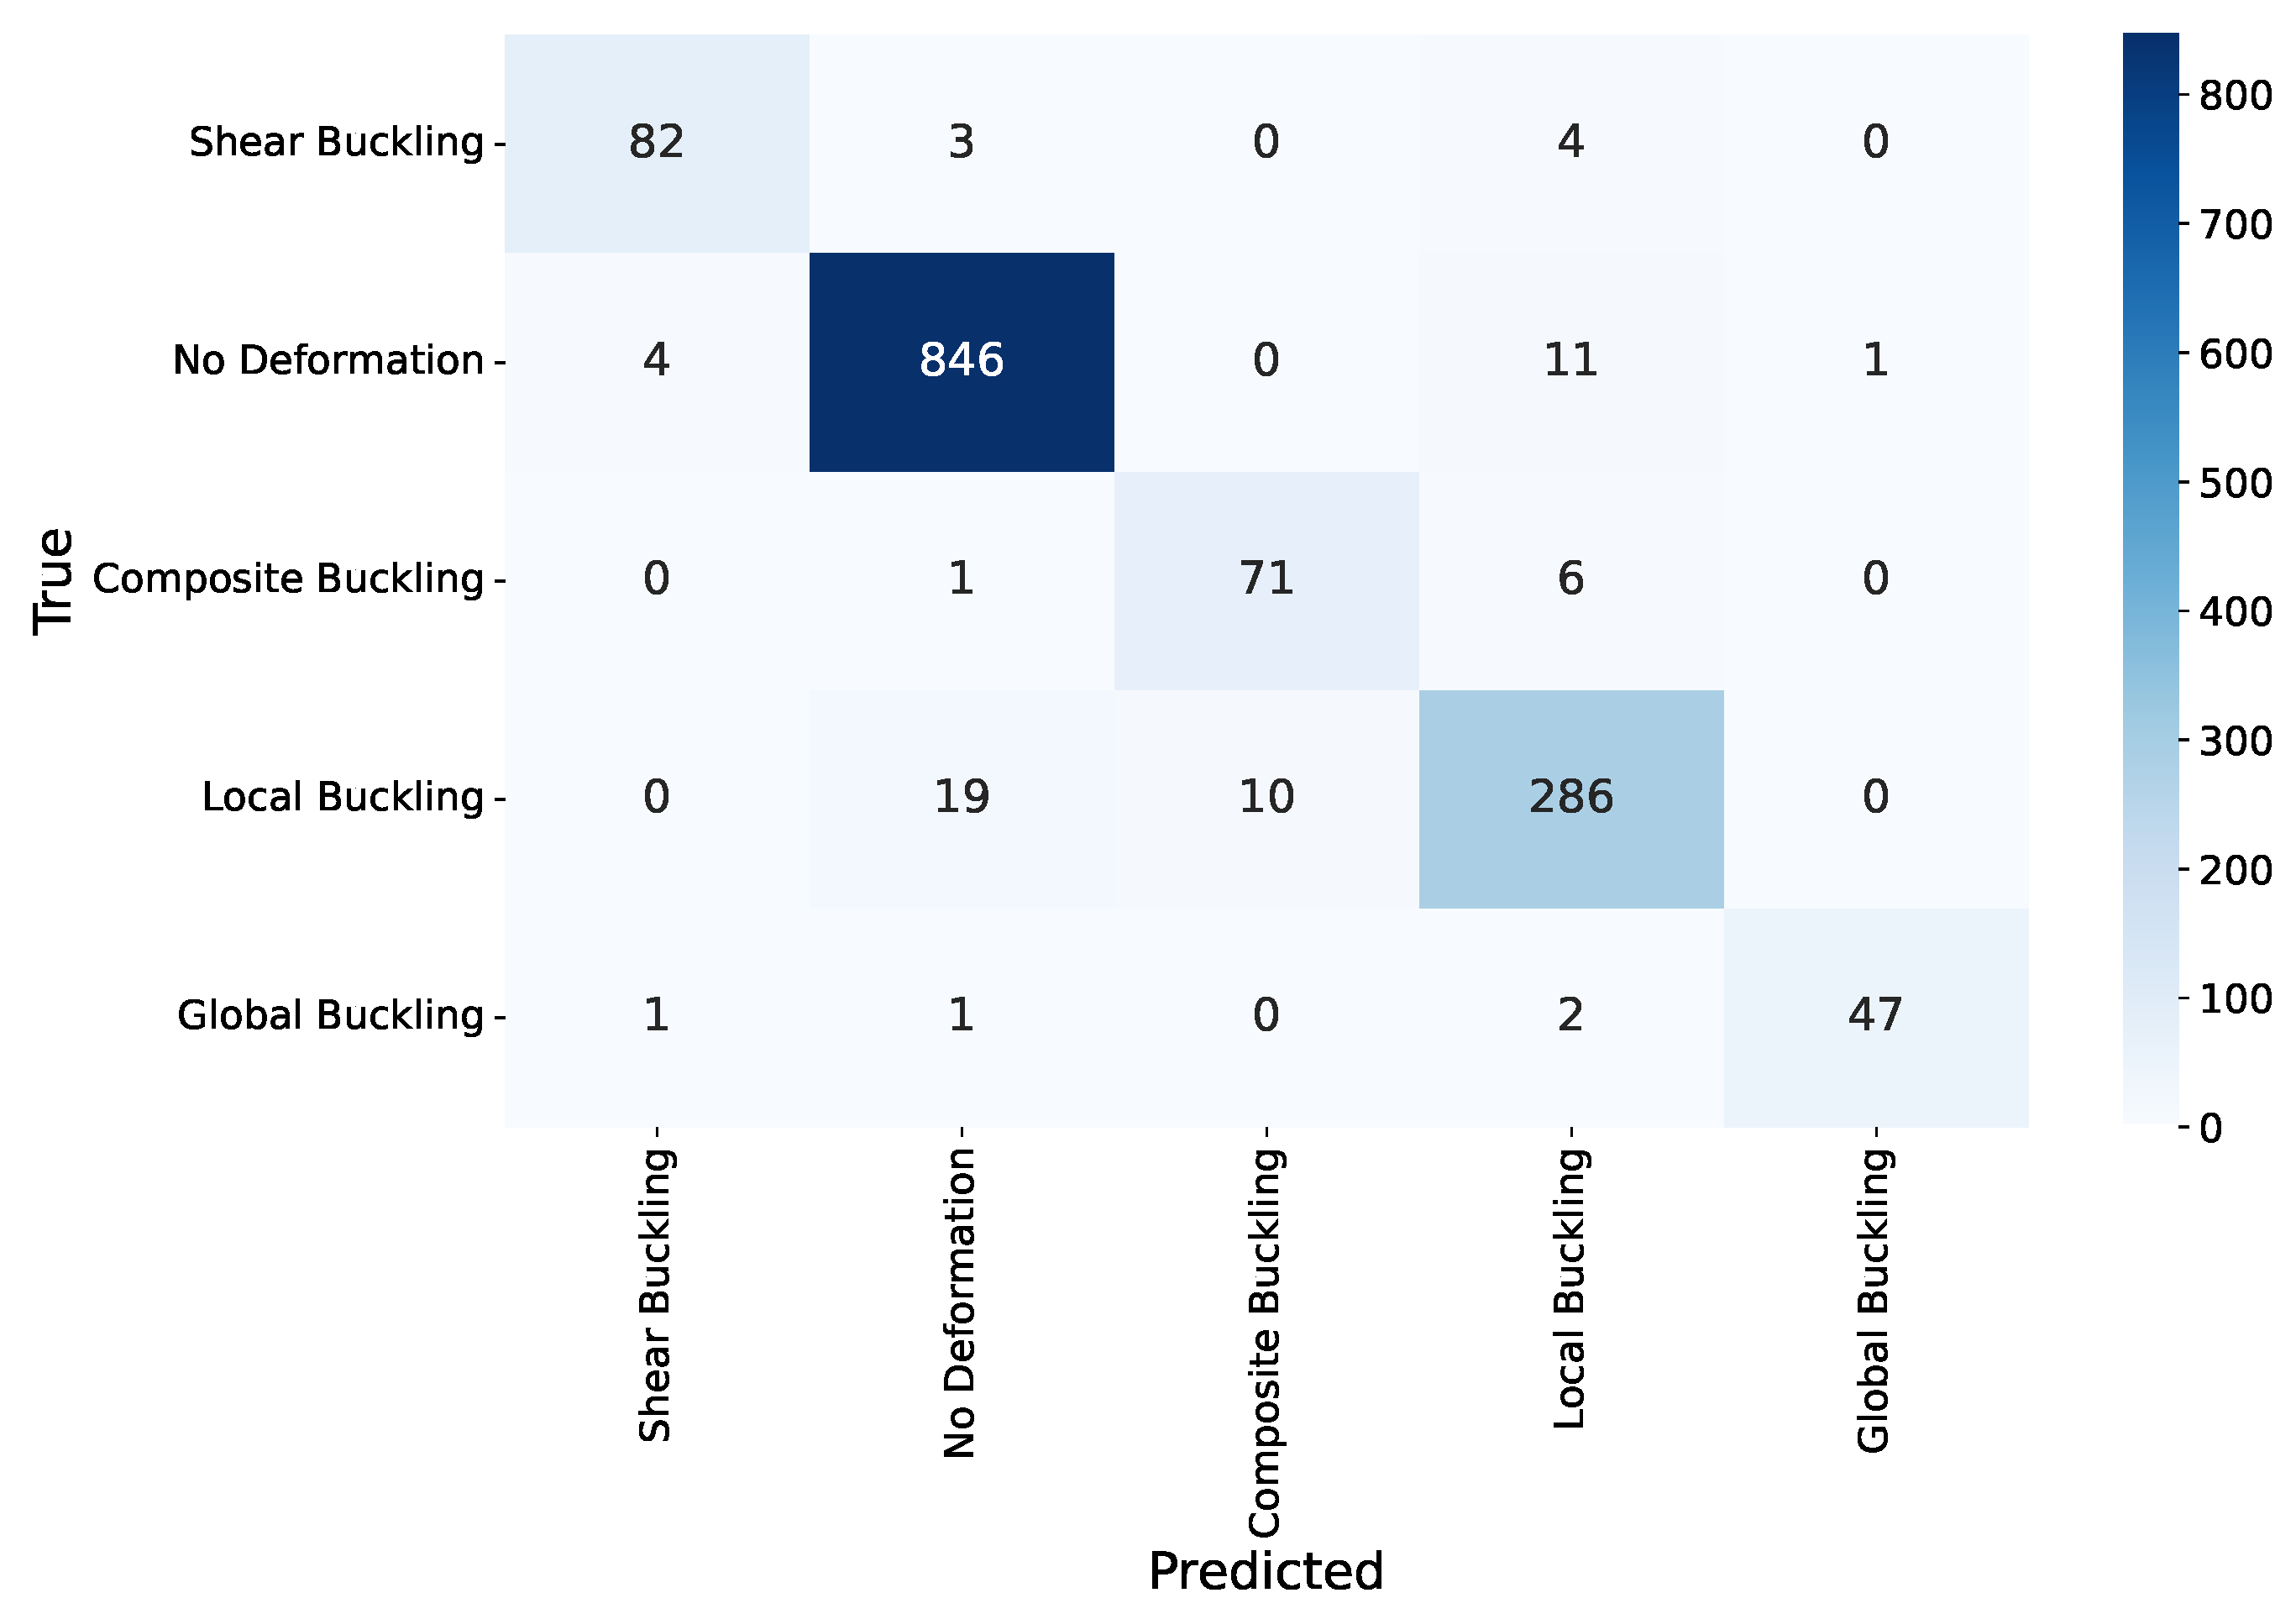
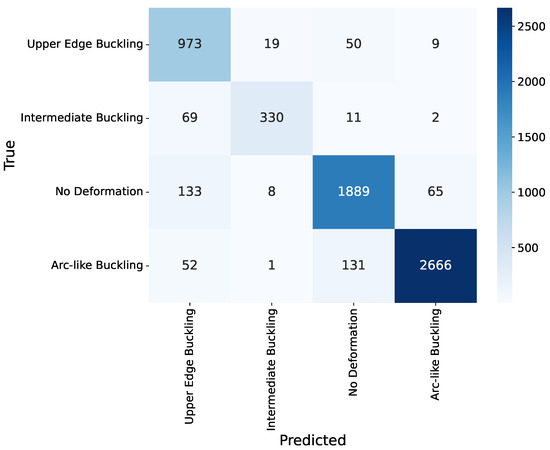
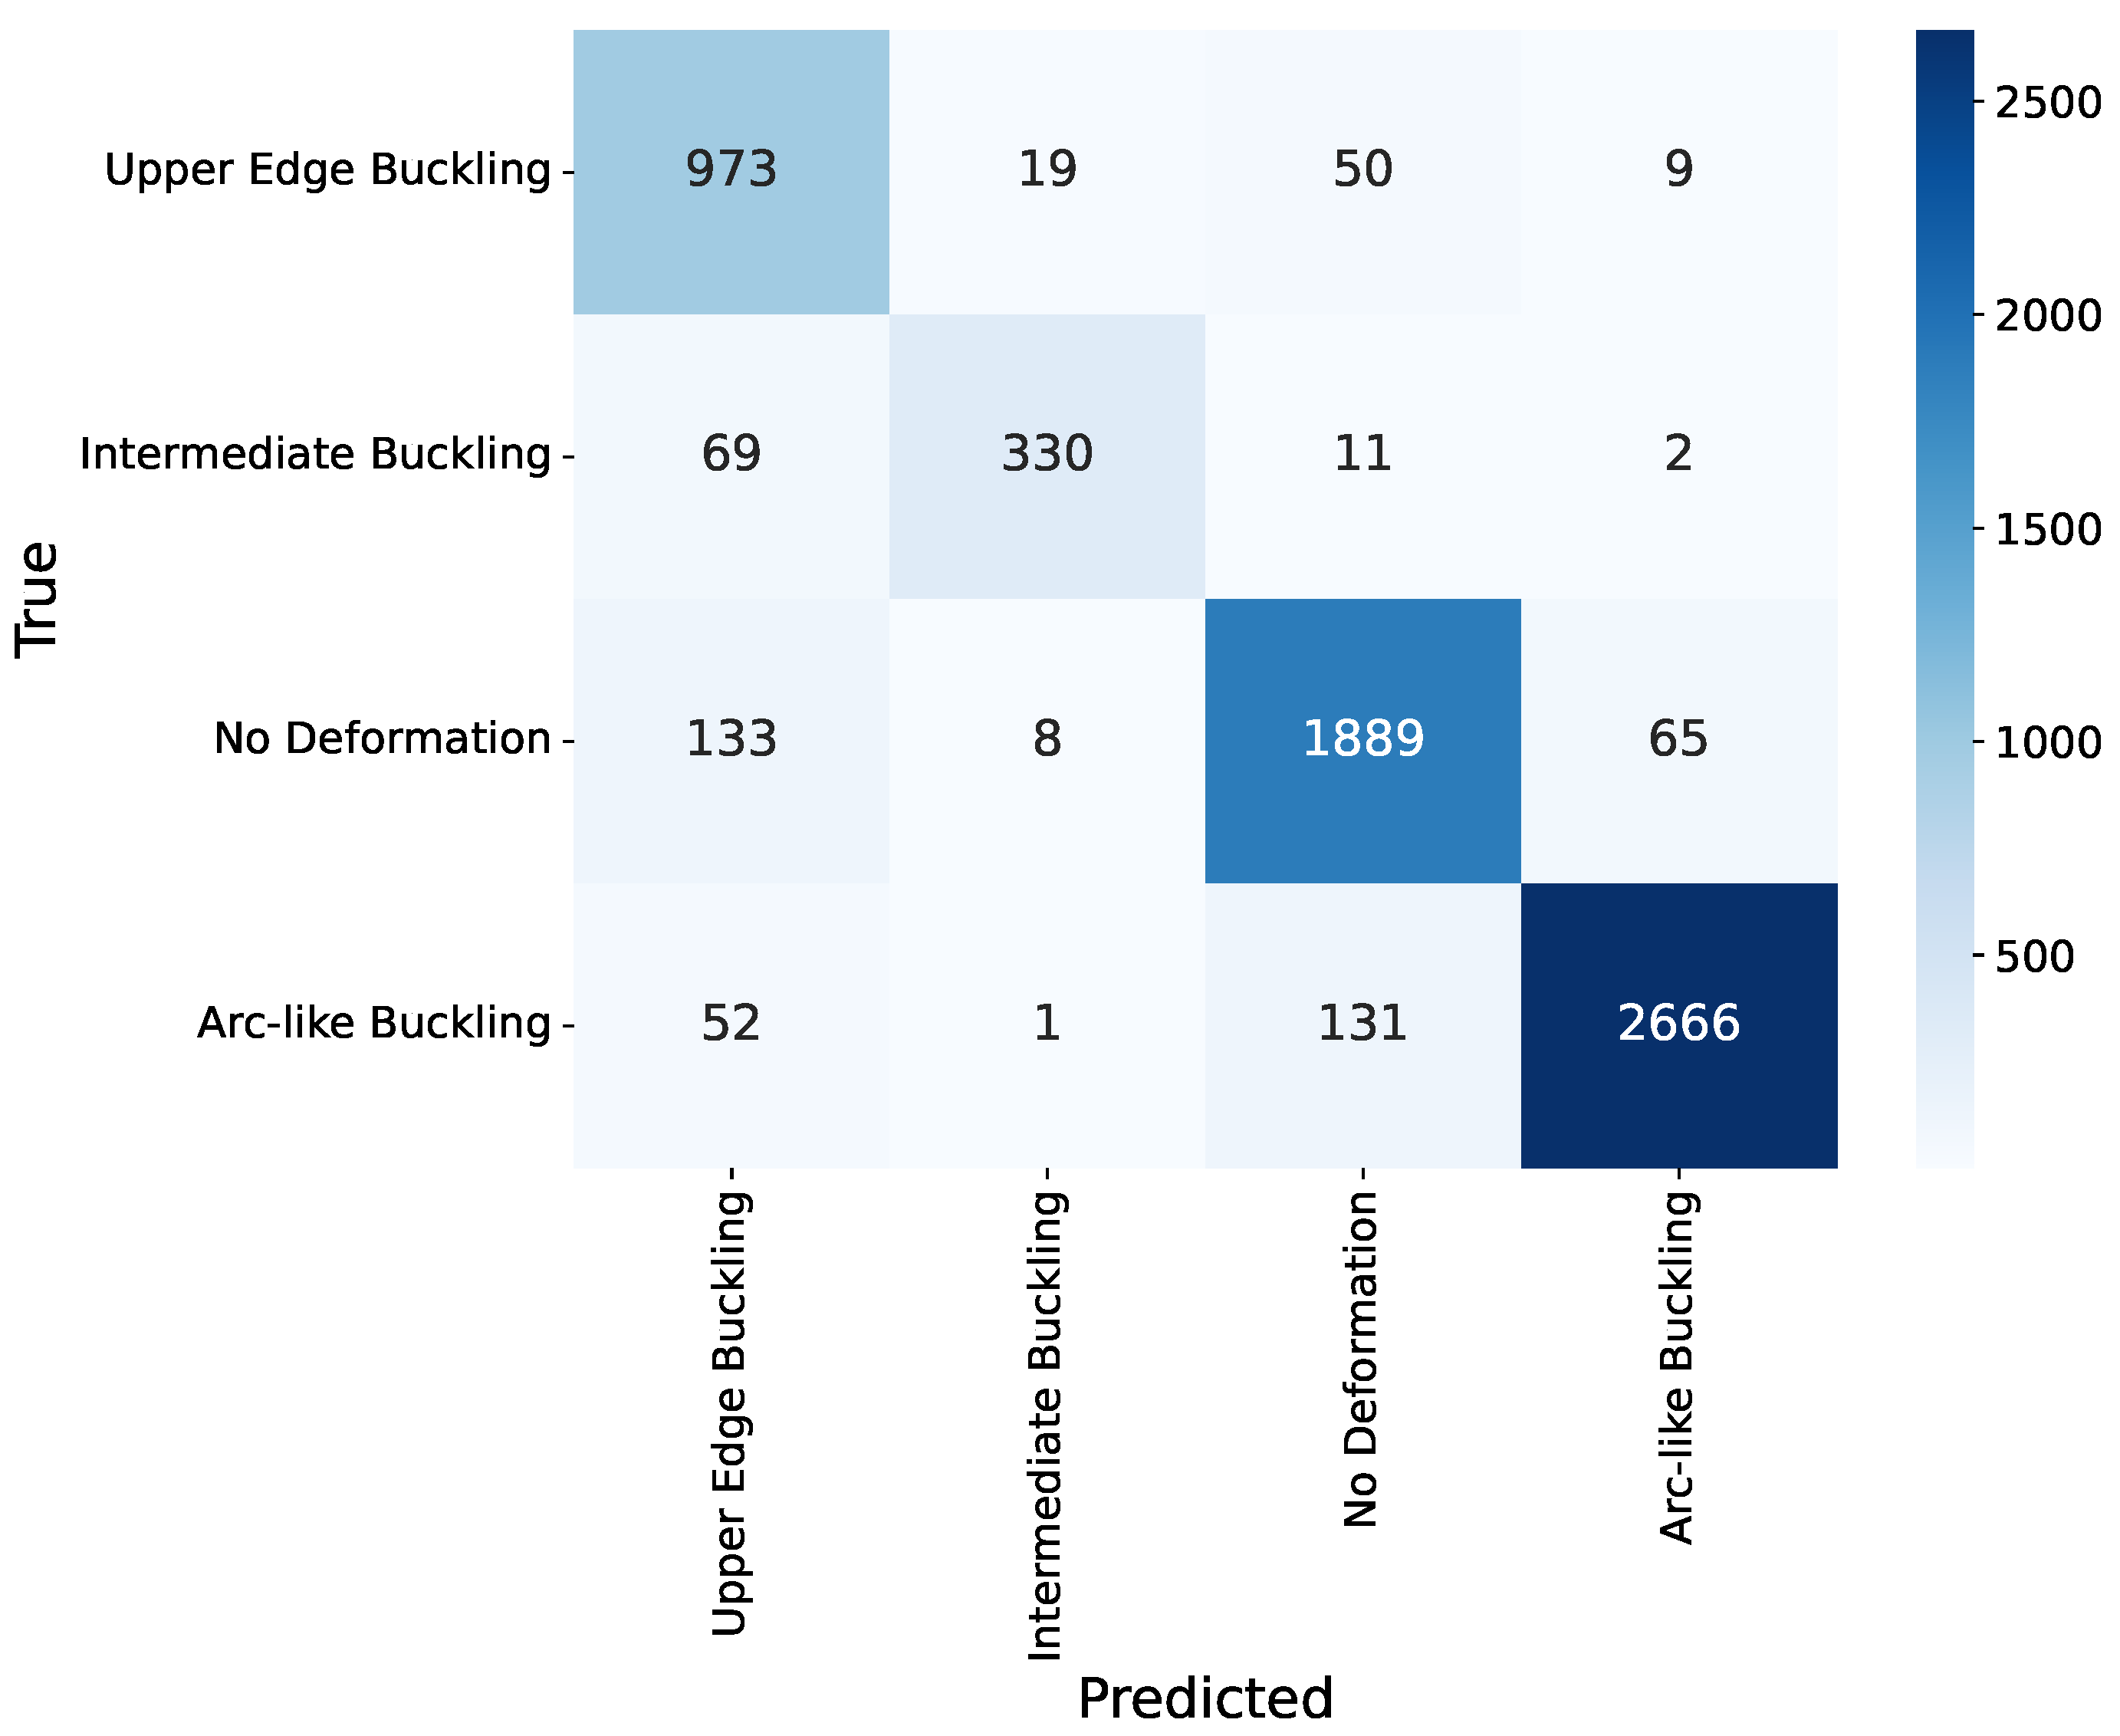
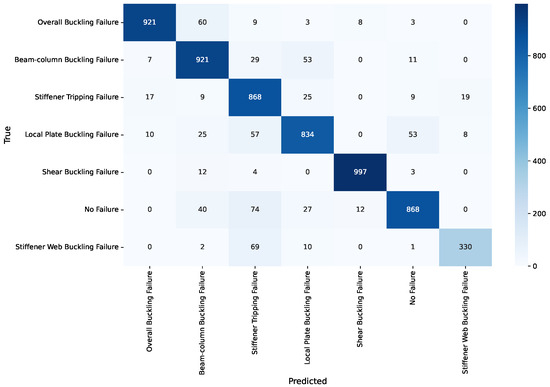
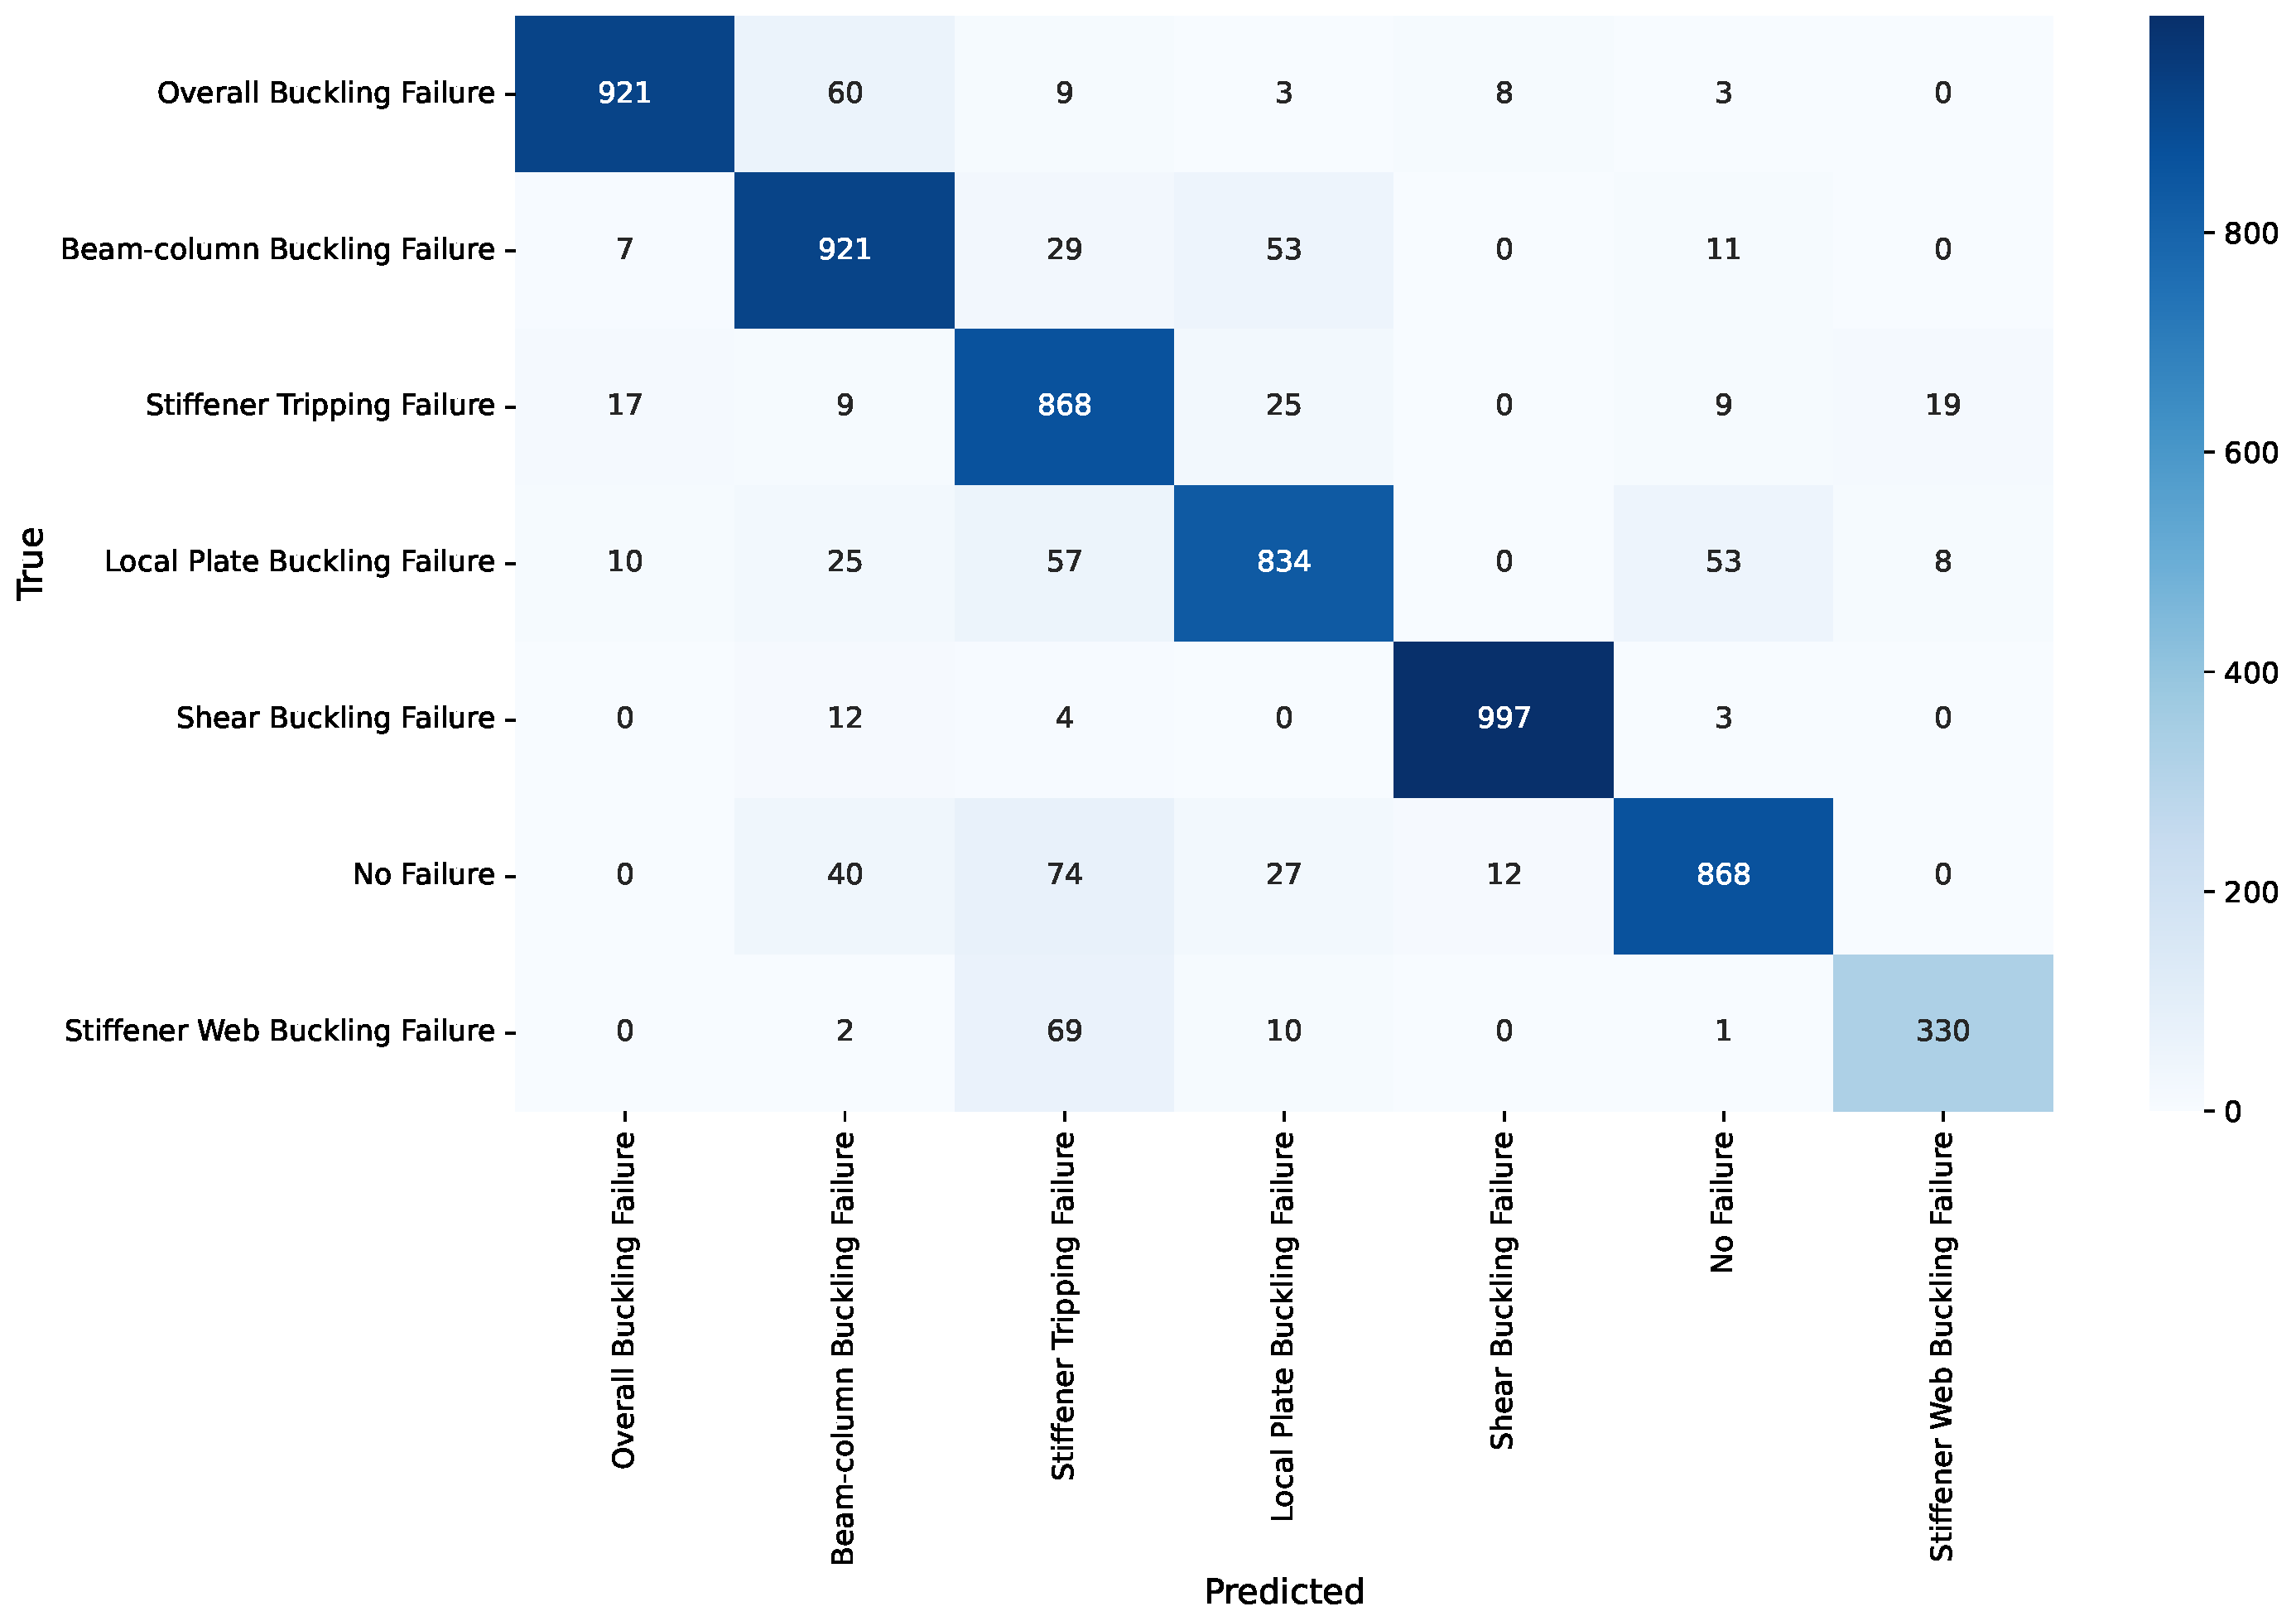
Figure 5, Figure 6 and Figure 7 provide the confusion matrices to visualize performance across all classification tasks. The confusion matrices show that the dominant errors are concentrated in mechanically similar classes rather than being uniformly distributed: at the component level, the web class Intermediate Buckling is most often confused with Upper Edge Buckling, while No Deformation and Arc-like Buckling are occasionally confused in both directions; at the panel level, the main confusions occur among the Beam-Column Buckling, Stiffener Tripping, Local Plate Buckling, and No Failure classes, whose boundaries depend on coupled plate–web interpretation. Among these, the overlap between Local Plate Buckling Failure and Beam-Column Buckling Failure is mechanically plausible because local plate instability may act as a precursor to, or coexist with, the broader beam-column response of the plate–stiffener assembly. Because panel-level predictions are derived deterministically from component-level outputs, some upstream errors propagate directly to the final decision, especially near the decision boundaries in Table 1; however, the logic matrix can also absorb part of the component-level uncertainty when multiple component combinations map to the same panel class.
Figure 5.
Confusion matrix of plate buckling state classification on the test set.
Figure 6.
Confusion matrix of web buckling state classification on the test set.
Figure 7.
Confusion matrix of panel-level failure mode discrimination on the test set, counted on plate–web pairs.
Baseline comparison. To further position PGGCN against representative alternatives, we compare it with representative graph-learning backbones under the same dataset organization and evaluation protocol. The baselines include GCN, GAT, GraphSAGE, and GIN, which provide a direct comparison under the same mesh-native input representation. Table 5 summarizes the comparison at the plate, web, and pair-level panel stages. Overall, PGGCN achieves the best panel-level accuracy and macro-F1, while also attaining the highest plate- and web-level macro-F1 among the compared graph baselines. These comparisons therefore establish the relative advantage of PGGCN within the graph-based structural representation used in the present study.
Table 5.
Comparison with representative graph-learning baselines on the test set. Boldface highlights the proposed PGGCN method to distinguish it from the baseline methods.
Ablation study. To rigorously evaluate the design choices of the proposed framework, we conducted ablation experiments focusing on three aspects: geometric preprocessing (PCA-based rotation alignment), the feature aggregation function, and exploratory feature design. The results are summarized in Table 6.
Table 6.
Ablation study on geometric alignment, aggregation functions, and exploratory feature design (evaluated on the test set). Boldface highlights the complete proposed PGGCN model and its main result.
As also summarized in Table 6, an exploratory feature-design trial was conducted by augmenting the node representation from to , where S denotes the scalar von Mises stress. This variant reduced panel-level accuracy from 89.56% to 82.41%. Given the morphology-driven nature of the present task, in which buckling-state and failure-mode interpretation is driven mainly by deformation shape, the more compact coordinate-displacement representation was retained in the final model.
5. Limitations and Future Work
Despite the encouraging performance, the proposed framework has several limitations that motivate future work.
Deterministic logic matrix limits uncertainty representation. The panel-level failure mode is inferred through a physics-guided deterministic logic matrix. This improves interpretability but does not retain uncertainty from the component classifiers, especially near class boundaries. In practical deployment, a simple human-in-the-loop strategy would be to flag panel cases when one or more component-level predictions fall below a confidence threshold or show only a small margin between the top candidate classes; expert review could then focus on the uncertain plate/web buckling states before panel-level failure determination through the logic matrix. Future work could incorporate probabilistic fusion while preserving interpretability.
Generalization beyond the current dataset scope remains limited. The present evaluation is limited to the structural configurations, parameter ranges, and loading conditions covered by the current ABAQUS-generated dataset. Future work will examine generalization to broader stiffened-panel configurations, alternative loading scenarios, and out-of-distribution cases through external validation using independently generated FE datasets and experimental measurements.
6. Conclusions
We proposed PGGCN for ship structural failure mode classification as a graph-native framework for variable-sized FE meshes within a simulation-based method-development study. By combining component-level graph learning with a physics-guided logic matrix, the method provides an interpretable hierarchical pipeline for panel-level failure mode discrimination. Experimental results demonstrate strong performance on the current dataset, suggesting that graph-native mesh learning is a promising direction for failure mode classification in stiffened ship panels within the modeled structural configurations and loading conditions.
Author Contributions
Methodology, writing—original draft, funding acquisition, S.L.; writing—original draft, software, validation, Y.X.; formal analysis, software, H.C.; project administration, supervision, validation and formal analysis, P.W.; resources, validation, R.Z.; validation, visualization, Z.Z. All authors have read and agreed to the published version of the manuscript.
Funding
This research was funded by the Project of Virtual-Real Fusion Analysis Technology for Ship Structure Fatigue Performance (WDZC70202030206) and the Project of Virtual-Real Fusion Testing Technology for Ship Structure Performance (WDZC70202030202).
Data Availability Statement
The data presented in this study are available on request from the corresponding author due to institutional and engineering-data management constraints.
Conflicts of Interest
The authors declare no conflicts of interest.
References
- Zhang, Q.; Yang, H.; Wu, S.; Cheng, W.; Liang, Y.; Huang, Y. A Study on the Ultimate Strength and Failure Mode of Stiffened Panels. J. Mar. Sci. Eng. 2023, 11, 1214. [Google Scholar] [CrossRef] [Scilit]
- Li, D.; Chen, Z. Progressive collapse analysis and ultimate strength estimation of continuous stiffened panel under longitudinal extreme cyclic load and lateral pressure. Ocean Eng. 2023, 285, 115340. [Google Scholar] [CrossRef] [Scilit]
- Feng, Y.; Wang, W.; Lu, S.; Liu, S.; Ma, B. Axial compressive performances of stiffened composite panels: Experimental and numerical study. Alex. Eng. J. 2023, 71, 115–130. [Google Scholar] [CrossRef] [Scilit]
- Liu, B.; Yao, X.; Lin, Y.; Wu, W.; Guedes Soares, C. Experimental and numerical analysis of ultimate compressive strength of long-span stiffened panels. Ocean Eng. 2021, 231, 109633. [Google Scholar] [CrossRef] [Scilit]
- Ban, I.J.; Lim, C.; Kim, G.Y.; Choi, S.Y.; Shin, S.C. A Data-Driven DNN Model to Predict the Ultimate Strength of a Ship’s Bottom Structure. J. Mar. Sci. Eng. 2024, 12, 1328. [Google Scholar] [CrossRef] [Scilit]
- Zeng, Z.; Ying, G.; Zhang, Y.; Gong, Y.; Mei, Y.; Li, X.; Sun, H.; Li, B.; Ma, J.; Li, S. Classification of failure modes, bearing capacity, and effective stiffness prediction for corroded RC columns using machine learning algorithm. J. Build. Eng. 2025, 102, 111982. [Google Scholar] [CrossRef] [Scilit]
- Azad, M.M.; Jung, J.; Kim, H.S.; Munyaneza, O.; Sohn, J.W. Physics-guided graph convolutional network for damage severity and zone identification in industrial composites. Adv. Eng. Inform. 2025, 68, 103701. [Google Scholar] [CrossRef] [Scilit]
- Tuswan; Veda, K.A.B.; Chrismianto, D.; Mursid, O.; Adam, S.; Prabowo, A.R.; Nubli, H. Artificial intelligence-based ship hull plate corrosion monitoring using Convolutional Neural Network (CNN): Comparison of YOLOv8 and Detectron2 architecture models. Ship Technol. Res. 2025, 72, 88–98. [Google Scholar] [CrossRef] [Scilit]
- Palma-Ramírez, D.; Ross-Veitía, B.D.; Font-Ariosa, P.; Espinel-Hernández, A.; Sanchez-Roca, A.; Carvajal-Fals, H.; Nuñez-Alvarez, J.R.; Hernández-Herrera, H. Deep convolutional neural network for weld defect classification in radiographic images. Heliyon 2024, 10, e30590. [Google Scholar] [CrossRef] [Scilit] [PubMed]
- Li, G.; Muller, M.; Thabet, A.; Ghanem, B. DeepGCNs: Can GCNs go as deep as CNNs? In Proceedings of the IEEE/CVF International Conference on Computer Vision (ICCV); IEEE: New York, NY, USA, 2019; pp. 9267–9276. [Google Scholar]
- Paik, J.K.; Thayamballi, A.K.; Kim, B.J. Large deflection orthotropic plate approach to develop ultimate strength formulations for stiffened panels under combined biaxial compression/tension and lateral pressure. Thin-Walled Struct. 2001, 39, 215–246. [Google Scholar] [CrossRef] [Scilit]
- Paik, J.K. Ultimate Limit State Analysis and Design of Plated Structures; John Wiley & Sons Ltd.: Hoboken, NJ, USA, 2018. [Google Scholar]
- Han, J.; Li, S.; Zhang, A.M. Applications of bond-based cohesive peridynamics method (CPDM) to simulate inelastic fracture of stiffened plates in ship hull structures. Comput. Struct. 2023, 286, 107108. [Google Scholar] [CrossRef] [Scilit]
- Günay, E.; Aygun, C.; Yildiz, Y.O. Nonlinear buckling finite element analysis of stiffened B-Al plates. Trans. Nonferrous Met. Soc. China 2014, 24, S20–S28. [Google Scholar] [CrossRef] [Scilit]
- Lima, J.P.; Evangelista, F.; Guedes Soares, C. Bi-fidelity kriging model for reliability analysis of the ultimate strength of stiffened panels. Mar. Struct. 2023, 91, 103464. [Google Scholar] [CrossRef] [Scilit]
- Mokhtari, N.; Cai, Y.; Jelovica, J. Comparison of deep learning techniques for prediction of stress distribution in stiffened panels. Thin-Walled Struct. 2025, 215, 113494. [Google Scholar] [CrossRef] [Scilit]
- Zhao, Y.; Li, H.; Zhou, H.; Attar, H.R.; Pfaff, T.; Li, N. A review of graph neural network applications in mechanics-related domains. Artif. Intell. Rev. 2024, 57, 315. [Google Scholar] [CrossRef] [Scilit]
- Zhang, G.; Liu, Y.; Quan, Y.; Yan, J. A mesh-based geometric deep learning framework for rapid response prediction of large-scale and multi-component mechanical structures in engineering. Comput. Methods Appl. Mech. Eng. 2026, 448, 118435. [Google Scholar]
- Jiang, C.; Chen, N.Z. G-Twin: Graph neural network-based digital twin for real-time and high-fidelity structural health monitoring for offshore wind turbines. Mar. Struct. 2025, 103, 103813. [Google Scholar] [CrossRef] [Scilit]
- Cai, Y.; Jelovica, J. Efficient graph representation in graph neural networks for stress predictions in stiffened panels. Thin-Walled Struct. 2024, 203, 112157. [Google Scholar] [CrossRef] [Scilit]
- Cai, Y.; Jelovica, J. Heterogeneous graph representation of stiffened panels with non-uniform boundary conditions and loads. Eng. Comput. 2026, 42, 5. [Google Scholar] [CrossRef] [Scilit]
- Tian, Y.; Guan, X.; Sun, H.; Bao, Y. An adaptive structural dominant failure modes searching method based on graph neural network. Reliab. Eng. Syst. Saf. 2024, 243, 109841. [Google Scholar]
- Perera, R.; Guzzetti, D.; Agrawal, V. Graph neural networks for simulating crack coalescence and propagation in brittle materials. Comput. Methods Appl. Mech. Eng. 2022, 395, 115021. [Google Scholar] [CrossRef] [Scilit]
- Monti, F.; Boscaini, D.; Masci, J.; Rodola, E.; Svoboda, J.; Bronstein, M.M. Geometric deep learning on graphs and manifolds using mixture model CNNs. In Proceedings of the IEEE Conference on Computer Vision and Pattern Recognition; IEEE: New York, NY, USA, 2017; pp. 5115–5124. [Google Scholar]
- Gu, J.; Wang, Z.; Kuen, J.; Ma, L.; Shahroudy, A.; Shuai, B.; Liu, T.; Wang, X.; Wang, G.; Cai, J.; et al. Recent advances in convolutional neural networks. Pattern Recognit. 2018, 77, 354–377. [Google Scholar] [CrossRef] [Scilit]
- Pfaff, T.; Fortunato, M.; Sanchez-Gonzalez, A.; Battaglia, P. Learning mesh-based simulation with graph networks. In Proceedings of the International Conference on Learning Representations, Virtual Event, Austria, 3–7 May 2021. [Google Scholar]
- Li, G.; Xiong, C.; Thabet, A.; Ghanem, B. DeeperGCN: All You Need to Train Deeper GCNs. arXiv 2020, arXiv:2006.07739. [Google Scholar] [CrossRef] [Scilit]
- Guevara Garban, M.R.; Chemisky, Y.; Clément, M.; Pruliére, É. Physics-Informed graph neural networks to reconstruct local fields considering finite strain hyperelasticity. Int. J. Numer. Methods Eng. 2025, 126, e70193. [Google Scholar] [CrossRef] [Scilit]
- Pelissier, U.; Parret-Fréaud, A.; Bordeu, F.; Mesri, Y. Graph neural networks for mesh generation and adaptation in structural and fluid mechanics. Mathematics 2024, 12, 2933. [Google Scholar] [CrossRef] [Scilit]
- Besnier, T.; Arguillère, S.; Pierson, E.; Daoudi, M. Toward mesh-invariant 3D generative deep learning with geometric measures. Comput. Graph. 2023, 115, 309–320. [Google Scholar] [CrossRef] [Scilit]
- Pauly, M.; Gross, M.; Kobbelt, L.P. Efficient simplification of point-sampled surfaces. In Proceedings of the IEEE Visualization; IEEE: New York, NY, USA, 2002; pp. 163–170. [Google Scholar]
- Sun, S.; Cao, Z.; Zhu, H.; Zhao, J. A survey of optimization methods from a machine learning perspective. IEEE Trans. Cybern. 2019, 50, 3668–3681. [Google Scholar] [CrossRef] [Scilit]
- Wang, Q.; Ma, Y.; Zhao, K.; Tian, Y. A comprehensive survey of loss functions in machine learning. Ann. Data Sci. 2022, 9, 187–212. [Google Scholar] [CrossRef] [Scilit]
- Hu, Y.; Chen, B.; Sun, J. Tripping of thin-walled stiffeners in the axially compressed stiffened panel with lateral pressure. Thin-Walled Struct. 2000, 37, 1–26. [Google Scholar] [CrossRef] [Scilit]

Disclaimer/Publisher’s Note: The statements, opinions and data contained in all publications are solely those of the individual author(s) and contributor(s) and not of MDPI and/or the editor(s). MDPI and/or the editor(s) disclaim responsibility for any injury to people or property resulting from any ideas, methods, instructions or products referred to in the content. |
© 2026 by the authors. Licensee MDPI, Basel, Switzerland. This article is an open access article distributed under the terms and conditions of the Creative Commons Attribution (CC BY) license.