


Abstract
Automatic insertion machines play an important role in the assembly of through-hole electronic components on printed circuit boards (PCBs). However, for irregular multi-pin components, fixed-position registration strategies may fail to recover feasible insertion poses under grasping errors, manufacturing tolerances, and transportation-induced pin perturbations. To address this issue, this paper proposes a maximum-clearance optimization model with chaotic initialization for PCB component pin registration. First, the Graham–Scan algorithm is employed to generate convex polygons to simulate the geometric layout of component pins. Subsequently, random perturbations following two-dimensional normal distributions are introduced to simulate pin deformation caused by manufacturing and transportation processes. Then, a maximum-clearance objective is formulated to determine a feasible insertion pose under bounded translational and rotational adjustments. Finally, the resulting registration model is first evaluated through a solver-level comparison among three general-purpose numerical optimizers—namely, SLSQP, genetic algorithm, and simulated annealing—all applied to the same maximum-clearance formulation. In addition, representative registration baselines are introduced in a supplementary cross-paradigm comparison to clarify the difference between alignment-oriented registration accuracy and clearance-oriented insertion feasibility. Experimental results under an industrially motivated simulation setting show that, when solved by SLSQP, the proposed model achieved a clearance-based surrogate success rate of 98.44% over a complete simulated dataset of 1,400,000 samples, while maintaining an average computation time of 0.0198 s per sample. These results suggest that the proposed method provides computational evidence for the potential usefulness of a clearance-oriented geometric registration framework under simulated PCB insertion conditions motivated by field investigation data from Dalian Rijia Electronics Co., Ltd., rather than direct validation on a fully instrumented production line.
Keywords:
automatic insertion machine; graham scan algorithm; component registration; chaotic iterative algorithm MSC:
90C30
1. Introduction
In the current manufacturing process of printed circuit boards (PCBs), Surface Mount Technology (SMT) has become the dominant assembly technique. However, due to limitations in structural strength and adaptability to irregular electronic components, through-hole technology (THT) still plays an important role in PCB assembly. Many irregularly shaped electronic components with significant size variations are difficult to assemble using standardized automated equipment. Therefore, automatic insertion machines remain indispensable in PCB manufacturing.
During automated PCB manufacturing and inspection, traditional manual registration and inspection procedures are not only labor-intensive but also vulnerable to operator fatigue, illumination variation, and subjective judgment errors. To improve inspection efficiency, sensing capability, and assembly reliability, machine-vision-based techniques have been increasingly introduced into PCB production systems. Early and representative studies have investigated PCB component detection, defect inspection, and solder-joint quality assessment from the perspectives of hardware assurance, fully convolutional defect segmentation, and deep-learning-based inspection pipelines [1,2,3,4]. In addition, several recent survey and review papers have summarized the rapid development of machine-vision-based PCB inspection and defect detection systems [5,6,7,8]. In recent years, substantial progress has also been achieved in PCB defect detection, automated optical inspection, component localization, and visual understanding through image processing, machine learning, and deep-learning techniques. Representative studies have further explored practical inspection pipelines, lightweight detection networks, plug-in component recognition, and dataset construction for PCB-related manufacturing scenarios [9,10,11,12,13,14,15]. Related progress has also been reported in lightweight visual recognition under complex unstructured indoor environments, where joint attention and prior-knowledge mechanisms were used to improve feature extraction efficiency and environmental adaptability [16]. Although such studies are not designed for PCB pin registration, they further illustrate the broader trend that lightweight perception models are becoming increasingly important in practical vision-guided industrial and robotic scenarios. These studies provide an important technical foundation for intelligent PCB inspection and visual perception in modern manufacturing environments.
In addition to defect inspection, several studies have investigated vision-based PCB assembly positioning and related component-level understanding. These studies indicate that machine vision and deep learning techniques can significantly improve detection accuracy, component recognition performance, and production-line sensing capability [8,17,18]. Nevertheless, most of the existing literature remains focused on defect identification, defect classification, visual localization, or alignment-oriented pose recovery, whereas comparatively less attention has been paid to insertion-oriented pin registration for automatic through-hole assembly. More importantly, conventional registration and pose-estimation methods usually evaluate transformation quality through alignment-oriented criteria, such as matching residual, geometric consistency, or point-set discrepancy. In automatic PCB insertion, by contrast, a small alignment error does not necessarily imply that a component admits a geometrically feasible insertion pose with a positive clearance margin under bounded translational and rotational adjustment. This distinction motivates the need for a clearance-oriented registration formulation that is more directly connected to insertion feasibility.
From the computational viewpoint, such a formulation leads naturally to a bounded nonlinear optimization problem over translational and rotational pose variables. Accordingly, practical solution procedures must rely on suitable numerical optimization strategies, including sequential quadratic programming methods and stochastic or population-based search methods such as genetic algorithms and simulated annealing [19,20,21,22,23,24]. In the present study, these methods are not treated as distinct registration paradigms, but as representative general-purpose numerical solvers applied to the same clearance-oriented optimization model. In parallel, to make insertion-oriented feasibility analysis computationally tractable for irregular pin layouts, polygonal approximation and convex-hull construction provide a natural geometric preprocessing framework for subsequent clearance evaluation [25,26].
For automatic insertion machines, the essential computational problem is not merely to determine whether a component is defective or whether its observed pose is close to a nominal reference position. Rather, the key question is whether a feasible insertion pose exists under bounded translational and rotational correction when grasping errors, manufacturing tolerances, and transportation-induced pin perturbations are taken into account. This issue becomes particularly critical for irregular components and multi-pin structures, for which a rigid fixed-position criterion may reject components that are in fact insertable after proper pose adjustment.
Through field investigations at Dalian Rijia Electronics Co., Ltd., it was found that traditional fixed-position registration strategies may produce inaccurate registration decisions during component insertion, thereby preventing otherwise insertable components from being correctly matched with PCB holes. Under such rigid criteria, defective and non-defective components may also be insufficiently distinguished from the viewpoint of actual insertion feasibility, which may lead either to unnecessary component rejection or to increased risk of insertion failure. These observations indicate that a registration model directly linked to geometric insertion margins is of practical importance for automatic insertion systems.
The present study is therefore motivated by a practical industrial registration problem rather than by a purely synthetic benchmark setting. The component categories, pin distribution patterns, and dimensional tolerance data considered in this paper are all derived from field-investigation data collected from Dalian Rijia Electronics Co., Ltd. Accordingly, the purpose of this work is to develop and evaluate a clearance-oriented geometric registration formulation under an industrially motivated simulation setting, rather than to claim a completed end-to-end production-line deployment or a fundamentally new general-purpose optimization paradigm. In particular, the present study does not yet provide a fully instrumented real-world validation dataset containing synchronized machine-vision contours, physical insertion outcomes, and insertion-force measurements. Therefore, the industrial relevance claimed in this paper should be understood as problem motivation and simulation grounding, rather than as direct evidence of deployment readiness.
To address the above gap, the main contributions of this paper are summarized as follows:
- A clearance-oriented geometric formulation is established for PCB component pin registration under bounded translational and rotational adjustments, so that the optimization target is directly linked to insertion-related geometric margins rather than only to alignment residuals.
- A simulation framework is constructed based on component categories, pin layout patterns, and dimensional tolerance data collected from Dalian Rijia Electronics Co., Ltd., Dalian, China, so that the experimental setting reflects an industrially motivated application background.
- A logistic-map-based chaotic initialization strategy is introduced as an auxiliary mechanism to improve the empirical dispersion of initial trial points in the feasible search domain for the non-convex optimization stage.
- Comparative experiments show that conventional alignment-oriented registration accuracy and clearance-oriented insertion feasibility are not equivalent, thereby highlighting the task-specific value of the proposed formulation.
2. Related Work
In automatic through-hole insertion, the literature most relevant to the present study can be viewed from three closely related perspectives: registration and pose estimation methods, tolerance- or clearance-related geometric feasibility analysis, and numerical optimization techniques for solving bounded nonlinear pose-adjustment problems. Existing registration methods usually emphasize alignment-oriented criteria, whereas the present study focuses on clearance-oriented insertion feasibility. Therefore, the purpose of this section is not merely to review computational tools but to position the proposed formulation relative to these neighboring methodological directions.
2.1. Registration and Pose Estimation Methods
Registration and pose estimation problems are widely encountered in machine vision, robotic manipulation, and geometric matching. Representative approaches such as point-set alignment, rigid transformation estimation, template matching, and RANSAC-based fitting generally assess transformation quality through alignment-oriented criteria, including matching residuals, point-to-point discrepancies, or geometric consistency. These methods are effective when the main objective is to recover a pose that best matches an observed configuration to a reference one. However, in automatic PCB insertion, good alignment accuracy alone does not necessarily guarantee insertion feasibility, because insertion feasibility depends not only on pose consistency but also on whether sufficient geometric clearance remains for all pin–pad correspondences under bounded pose correction. This distinction indicates that insertion-oriented registration cannot always be reduced to a standard alignment-minimization problem.
2.2. Tolerance- and Clearance-Related Geometric Feasibility
In manufacturing and assembly analysis, tolerance accumulation, geometric deviation, and interference avoidance are all closely related to clearance-based feasibility. From this perspective, the relevant issue is not merely whether two geometric objects are well aligned but whether a feasible configuration exists in which contact conflict is avoided and sufficient margin is preserved. For PCB component insertion, this viewpoint is particularly important because pin deformation prior to insertion, transportation-induced perturbation, and manufacturing tolerances may all affect whether the component can be successfully matched to the PCB holes. Compared with conventional alignment-based criteria, a clearance-oriented objective is therefore more directly connected to insertion-oriented geometric feasibility. The present study follows this line of thinking by formulating PCB pin registration as a bounded pose optimization problem in which the minimum geometric clearance is directly optimized.
2.3. Numerical Optimization and Chaotic Initialization
Once the registration task is formulated as a bounded nonlinear optimization problem, an appropriate numerical solution strategy is required. In this context, Sequential Least Squares Programming (SLSQP), the genetic algorithm (GA), and simulated annealing (SA) are treated in the present study as general-purpose numerical solvers applied to the same maximum-clearance model, rather than as distinct registration paradigms. Therefore, the comparison among these three methods should be interpreted as a solver-level comparison within a common optimization formulation.
From this perspective, SLSQP represents a gradient-based local constrained optimization strategy, whereas the GA and SA provide stochastic or population-based search mechanisms that may lead to different trade-offs among solution quality, robustness, and computational cost. Such a comparison is useful for identifying a practically suitable solver for the proposed model, but it does not by itself establish superiority over existing registration paradigms. For that reason, a separate cross-paradigm comparison with representative registration baselines is introduced later in the experimental section.
In addition, chaos-based initialization strategies have been used in numerical optimization to improve the dispersion of initial trial points and to reduce the risk of poor local exploration caused by overly concentrated initial samples. In the present work, the logistic-map-based chaotic initialization is introduced in this spirit, as an auxiliary enhancement of the solution procedure for the proposed non-convex registration model. It is therefore regarded not as the principal source of methodological novelty but as a practical device for improving initialization diversity within the feasible search domain.
Overall, the present study is positioned at the intersection of these three directions. Its main contribution lies not in proposing a fundamentally new general-purpose optimization paradigm but in introducing a clearance-oriented geometric formulation for PCB pin registration and in showing that alignment-oriented accuracy and insertion-oriented feasibility are not equivalent evaluation objectives.
2.4. Chaotic Iteration Strategy
Chaotic iteration is frequently used in optimization as a mechanism for generating deterministic but ergodic sequences to replace conventional pseudo-random initialization. Recent reviews have shown that chaotic maps are commonly incorporated into metaheuristic and numerical optimization methods through several roles, including population initialization, parameter control, and search-update perturbation [27,28]. In the present study, chaotic iteration is not used as an independent comparative solver; rather, it is employed as an initialization strategy to generate well-distributed candidate solutions for the proposed registration model.
In general, a discrete chaotic system can be written as follows:
where is a nonlinear map and denotes the state variable at iteration k. A widely used example is the logistic map
which exhibits chaotic behavior for suitable values of . Because chaotic sequences possess sensitivity to initial conditions and good ergodicity, they are often used to improve the diversity of the initial population or initial trial points in optimization algorithms [27,29].
To generate initial solutions in a bounded search interval , the chaotic variable can be mapped by
For multidimensional decision variables, the same mapping can be applied component-wise to obtain an initial vector in the feasible domain. This strategy is motivated by the observation that chaos-enhanced optimization methods may provide a better balance between exploration and exploitation than purely random initialization, especially for non-convex problems [28,30].
Therefore, in the present work, chaotic iteration is introduced as an auxiliary initialization mechanism for the proposed pin registration model, while SLSQP, GA, and SA are retained as the three comparative numerical optimization methods in the experimental study. It is therefore regarded not as the principal source of methodological novelty in this work but as a practical enhancement of the solution procedure for the proposed non-convex registration model.
3. Model Design
3.1. Design Theory
The present study focuses on the pre-insertion registration stage of PCB component assembly, rather than on the subsequent contact-rich insertion stage. The aim is to determine whether a feasible pose correction exists under bounded planar translation and rotation after the component has been detected by a vision system. Accordingly, the model developed in this paper is a geometric registration model rather than a full thermomechanical or contact-deformation model.
At the registration stage, the observed pin geometry may already contain deviations caused by manufacturing tolerances, transportation, trimming, or handling. However, the pose-correction motion itself is modeled here as a planar rigid-body motion. In other words, the present formulation allows pre-existing geometric perturbations in the observed pin configuration, but it does not model additional elastic deformation, thermal deformation, or contact-force-induced bending during the corrective motion. Accordingly, the present model does not account for out-of-plane pin deformation such as three-dimensional bending, Z-axis tilt, or tip-to-base misalignment, which may occur in practical through-hole technology (THT) assembly.
In addition, because machine-vision outputs are typically contour-based and resolution-limited, the detected pin outline is represented by a polygonal approximation for subsequent geometric computation. This approximation should therefore be understood as a two-dimensional vision-compatible surrogate used for registration analysis, rather than as a complete physical description of the true three-dimensional pin geometry. Because scan-derived pin contours of actual components are not available in the current study, the practical adequacy of the convex-hull surrogate is not evaluated here by a direct pointwise geometric discrepancy between the simulated hull and an exact measured pin outline. Instead, the surrogate is constructed as a field-investigation-informed geometric abstraction: the number of pins, dominant arrangement pattern, nominal pitch, and characteristic pin scale of each component family are taken from the investigated industrial component categories, and the generated convex polygon is used as a vision-compatible two-dimensional representation for subsequent registration analysis. Therefore, the present model should be interpreted as a category-level practical surrogate for pre-insertion feasibility analysis, rather than as a full geometric reconstruction of the true three-dimensional lead profile.
Under these modeling choices, the following assumptions are adopted:
- During the pose-correction stage, the relative positions among the pin vertices of a component remain unchanged, so that the corrective motion is treated as rigid in the plane.
- After contour extraction by machine vision, the pin outline is approximated by a convex polygon for geometric registration computation.
Therefore, the registration problem considered in this paper is abstracted as a planar rigid-body pose adjustment problem for convex polygonal surrogates.
Let denote the observed planar contour point set of the i-th non-ideal pin (or the representative local pin contour extracted from vision), and let
be its convex hull computed by the Graham–Scan algorithm. By a standard result in computational geometry, is the smallest convex set containing . Therefore, the convex hull preserves the extreme points and support directions of the observed pin contour, while filtering out local concave indentations and small contour oscillations that are not essential to the outer-envelope feasibility test considered in the present pre-insertion registration stage.
This outer-envelope interpretation is particularly suitable here because the geometric question addressed by the model is not the detailed post-contact deformation of a pin but, rather, whether a rigid pose correction can place the detected pin surrogate inside the admissible solder-hole region with a positive safety margin. In this sense, the convex hull acts as a conservative geometric surrogate: if the outer convex envelope is feasible under the matching criterion, then the contained true contour is also feasible under the same criterion.
Moreover, the correctness of the Graham–Scan construction is combinatorial and applies to any finite planar point set. Hence, from the viewpoint of hull construction, there is no structural restriction that limits the method to a specific pin arrangement. Whether the observed pin layout corresponds to a dual-pin linear component or to a rectangular multi-pin component, the algorithm still returns the exact convex hull of the sampled planar point set. The arrangement pattern influences the shape and complexity of the resulting hull, but it does not alter the mathematical validity of the hull operator itself.
To quantify the geometric approximation error of the convex-hull surrogate for an irregular pin contour, define the Hausdorff distance
where denotes the Hausdorff distance. Let and denote the center and radius of the matched solder hole, respectively. Define the true contour-based clearance and the convex-hull-based clearance by
Since , one immediately has
On the other hand, since the map is 1-Lipschitz, the Hausdorff perturbation gives
and therefore
Equation (9) shows that the convex-hull surrogate produces a conservative clearance estimate, and the discrepancy between the surrogate clearance and the true contour-based clearance is bounded by the geometric approximation error . Thus, even for irregular pin shapes, the convex-hull abstraction remains computationally meaningful as long as the induced contour-to-hull discrepancy stays within an acceptable range for the intended registration tolerance.
In what follows, all planar coordinates are treated as vectors in . To avoid ambiguity, we use
to denote the translation vector, where and are its scalar components, and we use to denote the rotation angle. Then, the rigid-body update of a vertex coordinate can be written as
where x is the coordinate before transformation, is the coordinate after transformation, is the rotation center, and t is the translation vector. The rotation matrix is
Equation (10) means that each vertex is first rotated counterclockwise about by the angle and is then translated by the vector t. For a rigid component, the same transformation is applied to every pin vertex.The symbols used in the above rigid-body transformation and matching formulation are summarized in Table 1.
Table 1.
Symbol descriptions.
3.2. Model Structure
To ensure that the automatic insertion machine can complete the insertion process safely and reliably, an objective function with rigid transformation parameters as inputs is constructed to evaluate the rationality of the final insertion position of the component. Specifically, the distances between the vertices of the component pin polygon and the centers of the corresponding solder holes are computed. By subtracting these distances from the solder holes’ radii, the clearance between each vertex and the inner wall of the solder hole can be obtained. The minimum clearance among all vertices is then used as the evaluation metric, and the objective is to maximize this value in order to improve the insertion safety.
3.2.1. Maximum Clearance Model
After rigid-body transformation, the clearance between the i-th pin vertex and the corresponding solder-pad center is defined by
where denotes the Euclidean norm. Accordingly, let
where is the translation vector and is the rotation angle. The quantity represents the minimum clearance among all pin vertices and their corresponding solder-pad centers after rigid-body transformation.
Accordingly, the full translation–rotation registration model can be written as follows:
To clarify the geometric compatibility principle between the convex-hull surrogate and solder-hole matching, for each matched pair define the admissible disk
Then the transformed representative pin vertex is admissible if and only if . The optimization problem therefore seeks a rigid pose correction for which all matched surrogate vertices enter their corresponding admissible disks with the largest possible common margin.
Proposition 1.
For the full objective function defined in (13), the following statements hold for any feasible rigid-body transformation :
- 1.
- if and only if for all ;
- 2.
- if and only if for all and at least one matched vertex lies on the boundary ;
- 3.
- if and only if there exists at least one index i such that .
Consequently, is exactly the bottleneck clearance of the matched pin–pad system under the convex-hull surrogate model.
Proof.
By definition,
Hence, is equivalent to
that is,
which is equivalent to for all i. Similarly, means that all inequalities are non-negative and at least one is attained as equality, while means that at least one inequality is violated. Therefore, the sign of gives the exact feasibility status of the matched surrogate system, and the value of is the minimum clearance over all matched pairs. □
Remark 1.
The above matching principle is independent of the total number of pins and of the global arrangement pattern. In a dual-pin linear component, the index set contains only two matched constraints; in a rectangular multi-pin component, the same criterion is applied to a larger finite family of matched constraints. In both cases, the local admissibility condition for each matched pair is identical, and the global feasibility is determined by the minimum local clearance. Therefore, the mathematical form of the criterion is preserved across different pin numbers and arrangement patterns. Increasing the number of pins or the pin density does not change the criterion itself but only increases the number of simultaneously active geometric constraints and may reduce the attainable bottleneck margin.
Furthermore, combining (9) with the sign characterization above shows that positivity of the hull-based clearance provides a sufficient geometric feasibility certificate for the underlying irregular pin contour. Indeed, if , then , so the true contour remains inside the matched admissible solder-hole disk as well. In this sense, the convex-hull surrogate is not only computationally convenient but also geometrically conservative for pre-insertion feasibility screening.
A further interpretation of the objective function is that it provides an explicit worst-case safety margin for pre-insertion geometry. Let
If , then every matched surrogate vertex lies strictly inside its corresponding admissible solder-hole disk with at least margin . Moreover, suppose that after pose correction each matched vertex is still subject to an additional residual geometric disturbance . If
then, by the triangle inequality,
Hence, whenever , all matched pairs remain geometrically feasible after the residual disturbance. Therefore, maximizing is equivalent to maximizing the largest common disturbance that the matched pin–pad system can tolerate without violating the non-interference condition. In this precise geometric sense, the objective of maximizing the minimum gap improves insertion safety: it maximizes the bottleneck clearance and, thus, maximizes the common geometric fault-tolerance margin of the surrogate registration system.
This interpretation also clarifies the role of the solder-hole radius . For a fixed transformed vertex , a larger directly enlarges the local clearance
which improves the geometric insertion tolerance. Conversely, for a fixed hole radius, reducing the eccentricity strengthens the centering quality and enlarges the same clearance. Therefore, the objective balances these two geometric factors through their difference: the admissible hole size supplies tolerance, whereas the pose-correction term controls alignment. The resulting max–min criterion optimizes the worst matched pair rather than the average one, which is appropriate because insertion failure is typically triggered by the first geometrically critical pin–pad pair.
To analyze the convexity property, we first consider the translation-only subproblem obtained by fixing . In this case, the transformed pin coordinates satisfy
and the corresponding objective function is
Define
Then, the objective function can be rewritten as
Hence, the translation-only optimization model is
We now show that the translation-only subproblem is a concave maximization problem over a convex box, or equivalently a convex minimization problem after sign reversal.
Proposition 2.
Let f be the function defined in (22). Then, f is concave on . Consequently, is convex, and
is a convex optimization problem on the convex feasible set .
Proof.
For each , define
Since the Euclidean norm is convex and the composition of a convex function with an affine mapping remains convex, the mapping
is convex on . Therefore, is concave, and adding the constant preserves concavity. Hence, each is concave on .
Next, we prove that the finite pointwise minimum of the concave family is still concave. Let and . Since each is concave, we have
Taking the minimum over i on both sides gives
Next, for any two real sequences and ,
Indeed, for every i, one has and , and hence,
Taking the minimum over i yields the desired inequality. Applying this with and , we obtain
Therefore, f is concave on .
Since is convex, minimizing over is a convex optimization problem. Equivalently, after sign reversal, the translation-only maximization problem can be reformulated as the convex minimization problem (24). □
Remark 2.
The above proposition applies only to the translation-only reduction obtained by fixing . It does not imply that the full objective is concave, nor that is convex, on the joint translation–rotation domain.
When both translation and rotation are considered, the objective function is exactly the full model (13). Once rotation is introduced, the transformed pin coordinates depend nonlinearly on through the trigonometric matrix . Therefore, the full translation–rotation model (14) is generally non-convex. Nevertheless, because the feasible set is closed and bounded in a finite-dimensional space and the objective function is continuous, the feasible domain is compact. Hence, according to the Weierstrass theorem, the full model admits at least one global maximizer and at least one global minimizer on the feasible domain.
3.2.2. Generation of Initial Solutions
In this study, chaotic sequences are employed in place of ordinary pseudo-random numbers to generate diversified initial solutions for numerical optimization. The main purpose of this strategy is to improve the spatial dispersion of the starting population. Since a deterministic chaotic system can generate highly dispersed iterates with sensitive dependence on initial conditions, it is beneficial for enlarging the diversity of initial points and increasing the probability that different regions of the feasible set are sampled at the initialization stage. Consequently, the risk of premature convergence to poor local optima may be reduced. It should be emphasized, however, that chaotic initialization does not theoretically guarantee escape from all local optima; its role is to improve the initial coverage and empirical dispersion of the search points, thereby enhancing the global exploration capability of the optimization algorithm.
From a dynamical-systems viewpoint, the practical value of the logistic map in initialization comes from its stretching-and-folding mechanism on the bounded interval . Indeed, for
one has
so that, away from the turning point , nearby states are typically separated by local expansion, while the boundedness of the interval forces the expanded trajectories to be folded back into . This repeated stretching and folding is the standard geometric mechanism that produces sensitive dependence, broad interval traversal, and strong empirical dispersion of the iterates.
The relevance of this mechanism to non-convex optimization is indirect but important. Let denote the feasible search domain, and let denote the attraction region of a desirable solution basin. If an initialization strategy produces M well-dispersed starting points with effective coverage proportion , then the probability that at least one starting point enters is heuristically increased toward
Although the chaotic initial points are not independent random samples, and (31) should therefore be interpreted only as a coverage-based heuristic rather than an exact probabilistic law, it clarifies the mathematical meaning of “reducing the risk of poor local optima”: the benefit of chaotic initialization lies not in guaranteeing global escape but in increasing the chance that the initialization stage touches multiple attraction regions instead of being clustered in a narrow portion of the feasible domain.
To make the initialization mechanism mathematically explicit, we adopt the logistic map in its classical fully chaotic form
where is the initial value. The parameter value 4 is chosen for three reasons: First, it corresponds to the standard fully chaotic regime of the logistic map, so that the Lyapunov exponent is positive and the sequence exhibits sensitive dependence on the initial conditions. Second, the invariant density of the map is explicitly known, which makes it possible to derive an analytic distribution-correction formula rather than relying on a heuristic normalization. Third, the initialization remains deterministic and reproducible, which is advantageous for numerical comparison and sensitivity analysis. Therefore, the choice is adopted not as a claim of universal optimality but as a theoretically analyzable and reproducible compromise between chaotic dispersion and deterministic regularity.
In the numerical implementation, the first iterates are discarded as a burn-in stage to eliminate transient effects, and the subsequent N iterates are retained for initialization and statistical evaluation. In this paper, we use
To quantify the chaoticity of the generated sequence, we compute the Lyapunov exponent
where a positive value of indicates sensitive dependence on the initial conditions and, thus, supports the chaotic behavior of the adopted map. This quantity is used here only as a theoretical indicator of chaoticity; it does not by itself imply uniform distribution of the sequence.
For the logistic map (32) with parameter 4, the invariant density on is
and the corresponding cumulative distribution function is
Therefore, the corrected sequence is defined by
In this way, the raw chaotic sequence is transformed into a corrected sequence with uniform marginal distribution on in the invariant-measure sense. Hence, the theoretical role of (37) is not to create chaos but to convert the nonuniform invariant distribution of the raw logistic sequence into a uniformly distributed marginal variable.
The corrected sequence is then mapped into the feasible interval of each decision variable through the affine transformation
where denotes the feasible interval of the j-th decision variable and d is the dimension of the optimization problem. Since (38) is a linear transformation of a uniformly distributed variable on , each component has uniform marginal distribution on . We do not claim that the resulting d-dimensional initial points are jointly uniform over the whole feasible domain; rather, the practical advantage is that they exhibit improved empirical dispersion in the admissible search space. Therefore, the adaptation logic between the chaotic sequence and the optimization search space is as follows: the logistic map provides deterministic chaotic dispersion, the correction (37) provides uniform marginals, and the affine transformation (38) transfers this marginal uniformity to each feasible coordinate interval in a way that is consistent with the geometry of box-constrained search spaces.
This mapping is theoretically natural for the present optimization model because the feasible domain is a Cartesian product of bounded coordinate intervals. The affine transformation (38) preserves order, interval endpoints, and relative position within each coordinate range. Consequently, a corrected chaotic variable with uniform marginal distribution on is transferred to a variable with uniform marginal distribution on the admissible interval without introducing an additional geometric bias toward either endpoint or midpoint. In this sense, the mapping from to is not an ad hoc normalization but a structure-consistent coordinate transformation for box-constrained search spaces.
At the same time, the present parameter combination is chosen to balance randomness-like dispersion and deterministic regularity in a practically analyzable manner. The fixed chaotic parameter ensures a fully chaotic regime together with an explicit invariant density; the burn-in length removes transient dependence on the initial seed; the retained sample size N provides a sufficiently large population for stable empirical evaluation; and the bin number B controls the resolution of the one-dimensional uniformity diagnostics. Therefore, the adopted setting is not tuned to claim universal superiority over all possible chaotic maps or parameter choices; rather, it is selected to provide a reproducible, mathematically interpretable, and numerically stable initialization mechanism for the present optimization framework.
To numerically assess the empirical uniformity of the corrected sequence, the interval is divided into B equal-width bins, and the uniformity deviation is defined by
where denotes the empirical frequency of the corrected sequence in the b-th bin. A smaller value of indicates that the empirical distribution is closer to the ideal uniform distribution. In addition, the coverage ratio is defined by
which measures the proportion of occupied bins among all bins and is used here as a finite-sample numerical indicator of one-dimensional interval traversal. In this paper, we take
This choice balances histogram resolution and statistical stability: with retained samples, the expected number of samples in each bin under the ideal uniform distribution is
which is sufficient for a stable empirical evaluation while still preserving adequate distributional resolution.
Accordingly, the theoretical and numerical roles of the above quantities are different. The Lyapunov exponent (34) is used to characterize chaoticity, whereas the histogram, the uniformity deviation (39), and the coverage ratio (40) are used to evaluate the empirical uniformity and one-dimensional interval traversal of the corrected sequence. The robustness of these conclusions with respect to the implementation parameters , , N, and B will be examined in the subsequent sensitivity analysis subsection, while the chaotic parameter is kept fixed at so as to remain consistent with the invariant-density correction (37).
For the numerical experiment shown in Figure 1 and Table 2, we use the initial value , discard the first 1000 iterates, retain the subsequent 5000 corrected samples, and set . The numerical results show that the adopted initialization mechanism has positive chaoticity, low empirical deviation from the ideal uniform distribution, and full one-dimensional interval coverage.
Figure 1.
Corrected chaotic sequence after burn-in (a) and corrected-sequence histogram (b).
Table 2.
Quantitative metrics for chaotic initialization.
The results in Figure 1 and Table 2 show that the corrected sequence has good empirical dispersion over . Therefore, the proposed initialization strategy should be understood as a quantitatively validated mechanism for improving the diversity, marginal uniformity, and empirical coverage of the initial solutions, rather than as a claim of exact joint uniformity over the entire multidimensional feasible domain.
3.2.3. Sensitivity Analysis of the Chaotic Initialization Model
To further examine the robustness of the proposed chaotic initialization mechanism, we perform a sensitivity analysis for the corrected logistic-based model introduced in (32)–(38). Since the correction Formula (37) is derived from the invariant density of the logistic map with parameter 4, the sensitivity analysis is carried out with respect to the initial value , the burn-in length , the retained sample size N, and the histogram partition size B, while the chaotic parameter is fixed at
This restriction avoids mixing the robustness analysis of the proposed corrected model with a change in the underlying invariant-density correction itself.
The baseline setting is chosen as follows:
A one-factor-at-a-time strategy is adopted: when one parameter is varied, all of the remaining parameters are fixed at their baseline values. For each parameter configuration, we compute the Lyapunov exponent , the uniformity deviation , and the coverage ratio. Here, is used to characterize the theoretical chaoticity of the raw sequence, whereas and the coverage ratio are used to evaluate the empirical uniformity and interval coverage of the corrected sequence.
Table 3 reports the sensitivity results with respect to and . It can be seen that, after a sufficiently long burn-in stage, the initialization mechanism is only weakly sensitive to the initial value . Specifically, for all tested values of , the Lyapunov exponent remains in the narrow interval from to , which is very close to the theoretical value . Meanwhile, the empirical uniformity deviation stays at a low level, ranging from to , and the coverage ratio remains equal to throughout. This indicates that the corrected initialization is robust with respect to moderate perturbations of the initial value. Similarly, varying within the tested range does not substantially affect the empirical coverage, while the corresponding values of fluctuate only slightly between and . Therefore, the adopted choice is numerically stable and reasonable.
Table 3.
Sensitivity analysis with respect to the initial value and the burn-in length .
Table 4 presents the sensitivity results with respect to the retained sample size N and the histogram partition size B. As N increases from 1000 to 10000, the empirical uniformity deviation decreases monotonically from to , showing that a larger retained sample provides a more stable empirical approximation of the target uniform marginal distribution. At the same time, the Lyapunov exponent remains close to , and the coverage ratio stays equal to for all tested values of N. For the partition size B, the overall conclusion of good empirical coverage remains unchanged, since the coverage ratio is always . Although the value of changes from for to for , this comparison should be interpreted as a robustness check rather than a scale-independent comparison, because the definition of itself depends on B. Overall, these results confirm that the proposed corrected chaotic initialization mechanism is robust under moderate changes in the implementation parameters.
Table 4.
Sensitivity analysis with respect to the retained sample size N and the partition size B.
4. Experiments and Analysis
4.1. Experimental Environment and Reproducibility
Before presenting the experimental design and the corresponding results, the computational platform used in this study is reported to improve reproducibility. The software environment and hardware configuration are summarized in Table 5 and Table 6, respectively. Although a GPU was available on the test machine, the optimization procedures reported in this paper were executed on the CPU. The algorithm-specific termination criteria and key parameter settings are reported in the subsequent subsection.
Table 5.
Software environment used in the experiments.
Table 6.
Hardware environment used in the experiments.
4.2. Experimental Design
For the generation of component pin polygons, according to the assumptions given in the previous section, convex polygons with random positions and random numbers of edges should be generated. In this study, a certain number of points are first randomly generated in the polar coordinate system under a uniform distribution, after which the Graham–Scan algorithm is employed to generate the convex polygon.
The point generation process is defined as follows:
where the radial coordinate r follows a uniform distribution from to , and the polar angle follows a uniform distribution over . The generated points are then indexed in ascending order of polar angle. After converting the polar coordinate system into the Cartesian coordinate system, the Graham–Scan algorithm is used to obtain the minimum convex hull of the generated points.
Using the above procedure, the generation of a single pin can be completed. The distribution patterns, component categories, and pin-shape information are summarized in Table 7, while the corresponding pin dimensions, pin pitches, and numbers of pins are listed in Table 8. These data are determined according to field investigation data collected from Dalian Rijia Electronics Co., Ltd. (Dalian, Liaoning, China).
Table 7.
Common component pin distribution patterns collected from Dalian Rijia Electronics (a).
Table 8.
Common component pin distribution patterns collected from Dalian Rijia Electronics (b).
Although direct scan-based contour validation is unavailable in the present study, the field investigation data still allow the practical scope of the surrogate to be examined across heterogeneous component families. To this end, the 14 component categories are interpreted according to three structural descriptors: pin number, arrangement pattern, and pin-density level. More precisely, the categories are divided into representative groups such as dual-pin linear layouts, multi-pin linear layouts, and rectangular multi-pin layouts. In addition, a simple density descriptor is introduced for interpretation,
where denotes the number of pins of component category c and denotes the area of the corresponding nominal layout bounding box. This descriptor is not intended as a direct fidelity error with respect to a measured real contour; rather, it is used to examine whether the convex-hull-based surrogate remains operationally consistent when the structural complexity of the pin layout varies. In this sense, the subsequent experiments provide a grouped practical-scope analysis of the surrogate under different component configurations, rather than a scan-based geometric accuracy validation.
To simulate various abnormal situations that may occur during transportation, transfer, trimming, and distribution, perturbations are introduced to the generated components. The perturbations are mainly divided into the following two categories:
The first type of perturbation originates from the component as a whole. In practical insertion operations, due to factors such as the uncertain grasping position of the robotic manipulator and mechanical errors, the component often cannot be perfectly aligned with the target pin positions after moving along the prescribed trajectory, and calibration is therefore required. To simulate this error, a random rigid-body transformation is applied to the component in the model to reflect its positional deviation during motion, as illustrated in Figure 2.
Figure 2.
Rigid-body transformation perturbation of CONN-A.
The second type of perturbation originates from positional variations among individual pins within the component. Due to displacement during transportation, deformation, and manufacturing tolerances, the relative positions among pins may vary. To simulate this situation, each pin is subjected to a normally distributed translational perturbation with mean 0 and variance determined by the process coefficient, as illustrated in Figure 3.
Figure 3.
Normally distributed pin perturbation of CONN-A.
As shown in Figure 3, after adding normally distributed perturbations, the connector pins may no longer be inserted into the solder holes. Therefore, an additional registration step is required to correct these perturbations and recover an insertable configuration.
The pin deviation ranges used for component generation are based on the field investigation data provided by Dalian Rijia Electronics Co., Ltd. (Dalian, Liaoning, China). Representative random perturbation samples from five component categories are shown in Figure 4.
Figure 4.
Representative random perturbation samples for five component categories.
Accordingly, the simulated dataset was constructed to reflect the geometric characteristics and tolerance ranges of representative component categories encountered in the production environment of Dalian Rijia Electronics Co., Ltd. It should be emphasized, however, that the present dataset is still a simulation dataset generated under industrially motivated geometric assumptions, rather than a real-world validation dataset obtained from a fully instrumented production line.
Based on the tolerance data listed in Table 9 and the component perturbation model proposed in the previous section, simulated samples were generated for all 14 component categories considered in this study. For each component category, 100,000 perturbed samples were generated independently according to the same simulation protocol, resulting in a total of 1,400,000 simulated samples. Therefore, the reported clearance-feasible rate was evaluated over the complete simulated dataset rather than over a selected subset of components. At the same time, it should be noted that these samples do not contain synchronized machine-vision contour outputs, physical insertion success/failure records, or force measurements from an actual insertion platform. Consequently, the present experimental study should be interpreted as a large-scale simulation-based evaluation protocol informed by field investigation data, rather than as an end-to-end real-production validation.
Table 9.
Component categories, dimensional tolerances, and sample sizes used in the simulation dataset.
More specifically, let denote the tolerance of the kth component category listed in Table 9. Based on the nominal pin layout of each component, the positional deviation of each pin was modeled by an independent Gaussian translational perturbation with zero mean. For the jth pin of the kth component category, the perturbation was defined as
where denotes the identity matrix and the variance is determined by the tolerance of the corresponding component category through
with being a fixed process coefficient shared by all component categories and kept unchanged throughout all experiments. This choice provides a direct tolerance-scaled perturbation rule and avoids introducing an additional category-dependent tuning factor into the simulation protocol. Under this perturbation protocol, component categories with larger tolerance values admit proportionally larger random deviations, whereas categories with smaller tolerance values are perturbed more conservatively. Representative examples of the generated perturbed components are shown in the following figures.
According to the maximum-clearance function defined in the previous section, when the objective function value is greater than 0, the sample is considered insertable; otherwise, it is considered non-insertable. The generated components are then substituted into the objective function of the mathematical model described above for evaluation.The distribution of the initial objective values for representative component pin optimization samples is shown in Figure 5.
Figure 5.
Histogram of initial objective values for component pin optimization.
Let C denote the experimental dataset, and let represent the optimization result of sample c obtained by a numerical method. For example,
This means that, after optimizing the objective function by the SLSQP algorithm, the resulting transformation first rotates the sample counterclockwise by an angle about its center, and then translates it by the vector to reach the target position.
Let
denote the objective function associated with sample c. Then,
denotes the objective function value after optimization by the SLSQP algorithm. This value should be no greater than, and ideally close to, the maximum value of the objective function, namely,
Furthermore, define
as the objective value at the nominal unadjusted pose of component c, where denotes the reference pose before optimization.
A sample is called initially insertable if
and initially non-insertable if
For an optimization method, the registration result of sample c is denoted by . The sample is regarded as clearance-feasible under this method if
That is, after optimization, the minimum clearance between all transformed pins and the corresponding pad boundaries remains positive. Accordingly, the reported clearance-feasible rate is defined as the proportion of samples satisfying (56) over the complete simulated dataset. It should be emphasized that this quantity is a clearance-based geometric surrogate indicator under the present simulation protocol, rather than a direct physical manufacturing KPI. In particular, it does not directly measure the insertion force, defect rate, or production cycle time, nor does it by itself constitute a sufficient condition for successful physical insertion on an actual production platform.
As shown in the above figure, most generated samples require further optimization. To verify the performance of the proposed algorithm, three types of experiments are designed in this study:
- Basic feasibility verification experiment: For a given sample, the optimization result and the optimization process are observed to verify the basic feasibility of the algorithm in practical problems.
- Effectiveness verification experiment: For each sample c in the sample set C, optimization is carried out using a method from the method set. If the initial objective value satisfies and the final objective value satisfies , this optimization is regarded as an effective optimization. By calculating the proportion of effective optimizations obtained by different optimization algorithms over the entire sample set, the performance differences among the algorithms can be compared.
- Efficiency verification experiment: Optimization is performed for each sample c in the sample set C, and the average computation time for different types of samples is recorded to evaluate the computational efficiency of the algorithm.
To improve reproducibility, and to ensure a fair comparison among the three optimization methods, the main parameter settings and termination criteria are specified explicitly at the end of the experimental design. Since the proposed registration model is formulated as a bounded continuous optimization problem with three pose variables , all algorithms were implemented over the same feasible search domain. For SLSQP, the optimization was performed by minimizing the negative of the maximum-clearance objective under the prescribed bound constraints. For the SLSQP solver, the actual initial point was generated by the corrected logistic-map-based chaotic initialization mechanism and was set to in the present implementation. For GA and SA, the same bounded search range was adopted so that the comparative results would reflect the optimization behavior of the algorithms rather than inconsistencies in the feasible region. The corresponding settings are summarized in Table 10, Table 11 and Table 12.
Table 10.
Parameter settings and termination criterion of SLSQP.
Table 11.
Parameter settings and termination criterion of the genetic algorithm.
Table 12.
Parameter settings and termination criterion of the simulated annealing algorithm.
For the SLSQP solver, the initial point was generated by the corrected logistic-map-based initialization mechanism. In the present implementation, a feasible chaotic candidate was selected from the mapped sample set and then used as the starting point of the local optimization.
Under the above unified settings, the three algorithms can be compared on a consistent computational basis in terms of optimization effectiveness, stability, and efficiency. The feasibility verification experiments reported in the following subsection were conducted according to this experimental configuration.
4.3. Feasibility Verification Experiment
In this subsection, a component with a relatively large number of pins is taken as an example to verify the feasibility of the three algorithms mentioned above.
The experimental result of the SLSQP algorithm is shown in Figure 6.
Figure 6.
Optimization result of the SLSQP algorithm.
It can be observed from the above figure that the SLSQP algorithm can successfully optimize this sample.
The optimization result of the genetic algorithm and the corresponding loss curve are shown in Figure 7.
Figure 7.
Comparison of optimization results obtained by different algorithms.
According to the above results and the final loss curve, the genetic algorithm performs slightly worse on this sample, but the final result remains very close to the optimum.
The experimental result of the simulated annealing algorithm and the corresponding loss curve are shown in Figure 8.
Figure 8.
Comparison of optimization results obtained by different algorithms: (a) Simulated annealing algorithm optimization result. (b) Loss curve of the simulated annealing algorithm.
As can be seen from the above figure, the simulated annealing algorithm can also successfully optimize this representative sample, and its loss curve decreases more smoothly. These observations indicate that all three algorithms can produce feasible registration results for the representative example considered here. More detailed comparative experiments are therefore reported in the following subsections.
4.4. Effectiveness Verification Experiment
Let C denote the sample set and M denote the method set. In this subsection, the effectiveness of a solver is evaluated by three surrogate indicators under the common geometric registration protocol:
- Clearance-feasible rate;
- Mean optimized clearance;
- Repeated-solution variance.
These indicators are introduced to compare solver behavior at the geometric-registration level. They should not be interpreted as direct manufacturing KPIs such as insertion force, defect rate, or production cycle time.
For each sample and each method , let
denote the pose vector returned by method m for sample c, where
If repeated runs are considered, we write
for the pose vector returned in the i-th trial.
First, the clearance-feasible rate measures the proportion of samples for which the optimized pose satisfies the strict geometric non-interference condition
That is, after optimization, the minimum clearance between all transformed pin vertices and their corresponding pad boundaries remains positive. Accordingly, the clearance-feasible rate is defined by
where denotes the clearance-feasible rate of method m.
It should be emphasized that the condition (57) is adopted here as a strict geometric non-interference criterion under the present simulated registration protocol. Therefore, is interpreted as a clearance-based surrogate indicator of geometric insertion feasibility, rather than as a direct physical insertion success rate measured on an actual production platform.
Second, the mean optimized clearance measures the average objective value achieved by method m over the sample set:
where denotes the mean optimized clearance.
A larger value of indicates that, on average, the returned poses leave a larger geometric clearance margin between transformed pins and the corresponding pad boundaries. Similar to , however, is a surrogate geometric indicator rather than a direct physical manufacturing KPI.
Third, for repeated runs, let
denote the sample-wise average returned pose. Then, the repeated-solution variance is defined by
where denotes the repeated-solution variance.
Based on the surrogate indicators defined above, comparative effectiveness experiments are carried out for the three solvers considered in this study. The experimental results for different component types are shown below.
For interpretation purposes, the component-wise results shown below may also be read in grouped form. In particular, the dual-pin linear categories mainly represent sparse layouts with low structural coupling, the multi-pin linear categories represent one-dimensional dense layouts, and the rectangular multi-pin categories represent two-dimensional coupled layouts with stronger geometric interaction among pins. Accordingly, cross-category differences in clearance-feasible rate, mean optimized clearance, and repeated-solution variance are used here to assess the practical robustness of the convex-hull surrogate under increasing layout complexity and density. Since no scan-derived real contour is available, these grouped comparisons should be understood as evidence of category-level applicability of the surrogate, rather than as a direct geometric error evaluation against exact physical pin shapes.
As shown in Figure 9 and Table 13, under the clearance-feasible rate, the SLSQP and SA solvers perform better, whereas the genetic algorithm is relatively inferior. This indicates that, within the same maximum-clearance formulation, SLSQP and SA are more likely to return poses satisfying the strict geometric non-interference condition.
Figure 9.
Comparison of clearance-feasible rates.
Table 13.
Clearance-feasible rate under the geometric non-interference criterion.
As shown in Figure 10 and Table 14, under the mean optimized clearance, the SA solver achieves the best overall performance, followed closely by SLSQP, while the genetic algorithm performs the worst. In particular, the genetic algorithm shows relatively poor performance on DISP-A and may fail to obtain competitive solutions for larger components. One possible reason for this is that the relatively large component size leads to a more difficult search landscape for the stochastic population-based solver under the present parameter setting.
Figure 10.
Comparison of mean optimized clearances.
Table 14.
Mean optimized clearance over the sample set.
As shown in Figure 11, the SLSQP solver exhibits the smallest repeated-solution variance in the present repeated experiments, with nearly identical optimization results across different runs. One possible reason for this is that SLSQP is a deterministic gradient-based nonlinear optimization method under fixed settings, whereas the GA and SA are heuristic optimization methods and, therefore, show comparatively larger run-to-run fluctuations.
Figure 11.
Comparison of repeated-solution variances.
Overall, the three indicators consistently suggest that SLSQP provides the most stable solver behavior, while SA achieves highly competitive geometric effectiveness under the present simulated protocol. Nevertheless, these conclusions should still be understood at the level of geometric surrogate evaluation, rather than as direct comparisons of real manufacturing KPIs.
4.5. Comparison with Representative Registration Baselines
The experiments in the previous subsections are solver-level evaluations conducted within the same maximum-clearance formulation. In contrast, the purpose of the present subsection is to provide a supplementary cross-paradigm comparison against representative registration baselines, so as to clarify the difference between alignment-oriented registration criteria and clearance-oriented insertion feasibility.
To further position the proposed maximum-clearance model against representative registration paradigms, three baseline methods were introduced, namely, ICP, rigid RANSAC, and template matching. These methods were not used to solve the same optimization model as SLSQP, GA, and SA, but were instead included as cross-paradigm baselines representing alignment-oriented registration strategies. These baselines should be understood as representative classical registration methods rather than as exhaustive surrogates for the latest industrial proprietary registration systems, which often involve more specialized task-specific or hybrid heuristic pipelines.
Unlike the main solver-level experiments on the full simulated dataset, the present cross-paradigm comparison was conducted on a representative subset of size 10,000, selected from the 14 component categories by stratified random sampling. The subset was fixed throughout the baseline comparison so that all methods were evaluated on the same samples. For fairness, all baseline methods and the proposed model were evaluated under the same perturbation protocol, the same bounded pose-adjustment range, and the same clearance-based evaluation criterion. The reported runtime for each method was measured under the same computational environment, including the baseline-specific preprocessing required to construct the corresponding registration inputs from the same simulated component sample. Because of the additional preprocessing burden required by the registration baselines, this subsection is intended as supplementary comparative evidence rather than as a full-scale benchmark over all 1,400,000 simulated samples.
It should be emphasized that the clearance-feasible rates reported in this subsection are surrogate geometric feasibility indicators obtained under an industrially motivated simulation setting. They should therefore be interpreted as clearance-based indicators of geometric insertion feasibility, rather than as direct physical manufacturing KPIs or actual production-line insertion success rates. Nevertheless, such comparisons remain meaningful, because all competing methods are assessed under the same geometric assumptions and the same evaluation protocol.
To further clarify the relation between the clearance objective and system-level manufacturing outcomes, let
denote the optimized geometric margin of component sample c. Then, the binary clearance-feasible indicator used in this paper is
which yields the reported clearance-feasible rate after sample averaging. In this sense, the present “success rate” is a geometric surrogate KPI rather than a directly measured physical insertion-success probability.
For an actual production process, it is natural to expect that the physical insertion success probability and the component loss risk are monotone functions of the geometric margin . A simple phenomenological correlation model may therefore be written as
where is non-decreasing and is non-increasing with respect to the margin m. For example, one may adopt sigmoid-type response functions
with , where and are process-dependent margin thresholds. These expressions should be understood as monotonic response models rather than identified laws, because the current study does not include force measurements, defect-rate statistics, or component-damage data for parameter calibration.
Within this interpretation, either increasing the solder-hole radius or reducing the pin–pad eccentricity will increase the geometric margin m, thereby shifting the system toward a higher expected insertion-success probability and a lower expected component-loss risk. However, an excessively loose effective hole–lead clearance, although beneficial for insertion tolerance, may weaken post-insertion positional constraint and may be unfavorable to connection reliability if electrical or mechanical retention requirements are also taken into account. Therefore, the present max–min clearance objective should be interpreted as optimizing the safety/fault-tolerance side of the trade-off, whereas a full reliability-aware model would require additional physics-based terms or experimentally calibrated constraints beyond the geometric scope of the current paper.
4.5.1. Main Comparison Under the Clearance-Based Criterion
The comparison between the proposed SLSQP-based maximum-clearance model and the three representative registration baselines under the clearance-based criterion with is summarized in Table 15. The results show that ICP achieves the smallest mean RMSE, indicating that it performs best in terms of conventional rigid alignment accuracy on this representative subset.
Table 15.
Comparison of the proposed model and representative registration baselines on a representative subset under the clearance-based criterion ().
However, when the evaluation is shifted from alignment error to insertion-oriented geometric feasibility, the conclusion becomes different. The proposed model achieves the highest mean clearance and the highest clearance-feasible rate, outperforming ICP, rigid RANSAC, and template matching. In particular, although ICP yields better alignment accuracy than the proposed model, its mean clearance and clearance-feasible rate remain substantially lower. Under , the proposed model attains a positive mean clearance of and a clearance-feasible rate of , compared with and for ICP, and for rigid RANSAC, and and for template matching. This result indicates that minimizing registration error is not equivalent to maximizing insertion-oriented geometric tolerance. In other words, a method that is more accurate in the conventional registration sense does not necessarily provide a larger feasible insertion margin.
This discrepancy is consistent with the objective design of the proposed model. ICP and rigid RANSAC aim to recover a rigid pose that best aligns the source and target point sets, while template matching maximizes image-level similarity after rasterization. By contrast, the proposed model directly optimizes the minimum clearance over all pins, which is more closely related to the geometric feasibility required by the insertion task. Therefore, the proposed model is better suited to the present problem, whose primary concern is clearance-oriented insertion robustness rather than purely alignment-oriented accuracy.
4.5.2. Sensitivity Analysis with Respect to the Surrogate Margin Coefficient
Since the true pad boundary is not explicitly available in the simulated dataset, a surrogate pad-margin coefficient was introduced to construct the clearance-based feasibility criterion. Because is a surrogate geometric allowance coefficient rather than a directly measurable physical constant, it should not be fixed from an assumed industrial standard. Instead, its influence should be examined through sensitivity analysis.
The variation in the mean clearance and clearance-feasible rate with respect to is summarized in Table 16. As increases from to , the clearance-feasible rates of all methods improve, which is expected because a larger surrogate pad margin relaxes the geometric feasibility criterion. Nevertheless, the proposed model consistently remains superior to ICP, rigid RANSAC, and template matching across the tested range.
Table 16.
Sensitivity of the clearance-feasible rate to the surrogate margin coefficient .
More specifically, under the setting , the proposed model already achieves a higher clearance-feasible rate than all baseline methods. As the surrogate margin is further relaxed to and , the advantage of the proposed method becomes more evident. In particular, when , the proposed model achieves a clearance-feasible rate of , compared with for ICP, for rigid RANSAC, and for template matching.
These results indicate that the superiority of the proposed clearance-oriented optimization is not limited to a single threshold but persists over a range of relaxed surrogate feasibility settings. Therefore, the proposed method exhibits a stable advantage in insertion-oriented geometric feasibility under different surrogate criteria. At the same time, the sensitivity analysis also shows that the reported clearance-feasible rate depends on the surrogate geometric allowance and should therefore be interpreted with appropriate caution when relating it to practical manufacturing conditions.
4.6. Efficiency Verification Experiment
After examining both the internal solver-level effectiveness and the supplementary cross-paradigm baseline comparison, we finally report the computational efficiency of the three solvers used for the proposed model.
Let C denote the sample set and let M denote the method set. For the efficiency verification experiment, the following two metrics are defined:
- Average optimization time;
- Stability of average optimization time.
The average optimization time is used to evaluate the computational speed of an algorithm. Let denote the time required by method to perform one optimization on sample . Then, the average optimization time of method m over the sample set C is defined by
The average optimization time of each algorithm over the sample set C is summarized in Table 17.
Table 17.
Comparsion of average optimization times of the algorithms.
The corresponding graphical comparison of the average optimization times is shown in Figure 12.
Figure 12.
Average optimization times of the algorithms.
The stability of the average optimization time is used to evaluate the steadiness of algorithm operation. Let denote the time required by method m for the i-th repeated optimization on sample c, and let denote the corresponding mean optimization time of method m. Then, the stability of the average optimization time of method m over the sample set C is defined by
The stability of the average optimization time over the entire sample set C is summarized in Table 18.
Table 18.
Comparision stability of average optimization time.
The corresponding graphical comparison of the stability of the average optimization time is shown in Figure 13.
Figure 13.
Stability of average optimization time.
In terms of the stability of average optimization time, the SA and GA approaches exhibit relatively larger fluctuations under the same experimental setting, whereas the SLSQP algorithm shows more stable timing behavior.
5. Conclusions and Limitations
Considering the reported metrics, the proposed clearance-oriented registration formulation, when solved by SLSQP, provides the best overall trade-off among the three numerical solvers considered in this study under the present industrially motivated simulation setting. Across the 14 component categories and the complete simulated dataset of 1,400,000 samples, it achieved a clearance-based surrogate success rate of 98.44% with an average runtime of 0.0198 s per sample on the reported computational platform. More importantly, the comparative results indicate that conventional alignment-oriented registration accuracy and insertion-oriented clearance feasibility are not equivalent. In this sense, the main contribution of this work lies in providing a task-specific geometric formulation for PCB pin registration under bounded pose adjustment, rather than in introducing a fundamentally new general-purpose optimization paradigm. The logistic-map-based chaotic initialization should accordingly be understood as an auxiliary enhancement of the solution procedure for the non-convex model. Accordingly, the proposed framework should not be interpreted as addressing the full industrial objective in isolation, but rather as a clearance-oriented geometric module within a broader process optimization strategy, where insertion feasibility must be balanced against alignment quality and cycle-time requirements. This perspective is also consistent with related multi-objective process-optimization studies, where geometric or spatial performance must be balanced against efficiency-related objectives rather than optimized in isolation, as illustrated for example by Zhang et al. [31].
At the same time, the limitations of the present study should be clearly stated. The proposed model is a geometric registration model developed for the pre-insertion correction stage, and it does not explicitly incorporate compliant-lead deformation, thermal effects, contact-force-induced bending, or other three-dimensional insertion phenomena. In particular, future extensions should consider deformation-aware three-dimensional registration models that explicitly address out-of-plane bending and structural misalignment, as explored in related three-dimensional registration studies such as that of Wang et al. [32]. In addition, although the simulation protocol is informed by field investigation data from Dalian Rijia Electronics Co., Ltd., the present study does not yet include a fully instrumented real-production dataset with synchronized machine-vision outputs, physical insertion outcomes, and force measurements. Moreover, the current manuscript does not include scan-derived two-dimensional pin contours or laser-scanning-based three-dimensional measurements of actual components. As a result, the geometric discrepancy between the convex-hull surrogate and the exact non-ideal pin shape has not yet been quantitatively measured in a direct experimental sense. The present evidence should therefore be interpreted as field-investigation-informed practical support at the component-family level, rather than as a full geometric-fidelity validation of the surrogate. Therefore, the reported results should be interpreted as evidence under an industrially motivated simulation framework rather than as direct proof of production-line deployment readiness. Moreover, although the average runtime is low at the single-component level, its cumulative cost may become non-negligible for modern high-density PCB assemblies containing hundreds or thousands of components, and further acceleration remains an important direction for future practical deployment. Future work will focus on validating the model on real PCB image data and physical insertion experiments, and on extending the formulation to more detailed deformation-aware and contact-aware registration settings. Such extensions may further incorporate safe-stress or force-related constraints so that geometric clearance is evaluated together with mechanically admissible insertion conditions, in line with related reliability-oriented optimization studies such as that of Yin et al. [33].
Author Contributions
Conceptualization, C.K. and J.S.; methodology, Q.Y., Y.H., and J.S.; software, Q.Y., Y.H., and J.S.; validation, C.K., Q.Y., and J.S.; formal analysis, C.K., Q.Y., and J.S.; investigation, C.K., Q.Y., and J.S.; resources, C.K., Q.Y., and J.S.; data curation, C.K., Q.Y., and J.S.; writing—original draft preparation, C.K., Q.Y., and Y.H.;writing—review and editing, C.K., Q.Y., and Y.H.; visualization, C.K., Q.Y., and Y.H.; supervision, C.K. and J.S.; project administration, C.K. and J.S.; funding acquisition, J.S. All authors have read and agreed to the published version of the manuscript.
Funding
This research was funded by the Harbin Engineering University Alumni Foundation Funding Project.
Data Availability Statement
The original contributions presented in this study are included in the article. Further inquiries can be directed to the corresponding author.
Conflicts of Interest
Author Chang Kou is the owner of Dalian Rijia Co., Ltd. The company provided access to the field-investigation site and practical industrial background relevant to this study. However, the company did not provide funding for this work and had no controlling role in the mathematical modeling, numerical analysis, interpretation of the results, preparation of the manuscript, or the decision to publish the results. The remaining authors declare no competing interests.
References
- Zhao, W.; Gurudu, S.R.; Taheri, S.; Ghosh, S.; Mallaiyan Sathiaseelan, M.A.; Asadizanjani, N. PCB component detection using computer vision for hardware assurance. Big Data Cogn. Comput. 2022, 6, 39. [Google Scholar] [CrossRef] [Scilit]
- Zheng, J.; Sun, X.; Zhou, H.; Tian, C.; Qiang, H. Printed circuit boards defect detection method based on improved fully convolutional networks. IEEE Access 2022, 10, 109908–109918. [Google Scholar] [CrossRef] [Scilit]
- Liao, S.; Huang, C.; Liang, Y.; Zhang, H.; Liu, S. Solder joint defect inspection method based on ConvNeXt-YOLOX. IEEE Trans. Compon. Packag. Manuf. Technol. 2022, 12, 1890–1898. [Google Scholar] [CrossRef] [Scilit]
- Pham, T.T.A.; Thoi, D.K.T.; Choi, H.; Park, S. Defect detection in printed circuit boards using semi-supervised learning. Sensors 2023, 23, 3246. [Google Scholar] [CrossRef] [Scilit]
- Ling, Q.; Isa, N.A.M. Printed circuit board defect detection methods based on image processing, machine learning and deep learning: A survey. IEEE Access 2023, 11, 15921–15944. [Google Scholar] [CrossRef] [Scilit]
- Zhou, Y.; Yuan, M.; Zhang, J.; Ding, G.; Qin, S. Review of vision-based defect detection research and its perspectives for printed circuit boards. J. Manuf. Syst. 2023, 70, 557–578. [Google Scholar] [CrossRef] [Scilit]
- Fonseca, L.A.L.O.; Iano, Y.; Oliveira, G.G.; Vaz, G.C.; Carnielli, G.P.; Pereira, J.C.; Arthur, R. Automatic printed circuit board inspection: A comprehensible survey. Discov. Artif. Intell. 2024, 4, 10. [Google Scholar] [CrossRef] [Scilit]
- He, Z.; Lian, Y.; Wang, Y.; Lu, Z. A comprehensive review of research on surface defect detection of PCBs based on machine vision. Results Eng. 2025, 27, 106437. [Google Scholar] [CrossRef] [Scilit]
- Chen, I.-C.; Hwang, R.-C.; Huang, H.-C. PCB defect detection based on deep learning algorithm. Processes 2023, 11, 775. [Google Scholar] [CrossRef] [Scilit]
- Tang, J.; Liu, S.; Zhao, D.; Tang, L.; Zou, W.; Zheng, B. PCB-YOLO: An improved detection algorithm of PCB surface defects based on YOLOv5. Sustainability 2023, 15, 5963. [Google Scholar] [CrossRef] [Scilit]
- Dlamini, S.; Kuo, C.-F.J.; Chao, S.-M. Developing a surface mount technology defect detection system for mounted devices on printed circuit boards using a MobileNetV2 with feature pyramid network. Eng. Appl. Artif. Intell. 2023, 121, 105875. [Google Scholar] [CrossRef] [Scilit]
- Ling, Q.; Isa, N.A.M.; Asaari, M.S.M. SDD-Net: Soldering defect detection network for printed circuit boards. Neurocomputing 2024, 610, 128575. [Google Scholar] [CrossRef] [Scilit]
- Lv, S.; Ouyang, B.; Deng, Z.; Liang, T.; Jiang, S.; Zhang, K.; Chen, J.; Li, Z. A dataset for deep learning based detection of printed circuit board surface defect. Sci. Data 2024, 11, 811. [Google Scholar] [CrossRef] [Scilit]
- Chen, W.; Wang, Z.; Zhao, H. PCB plug-in solder joint defect detection method based on coordinated attention-guided information fusion. Sci. Rep. 2024, 14, 19864. [Google Scholar] [CrossRef] [Scilit]
- Shen, M.; Liu, Y.; Chen, J.; Ye, K.; Gao, H.; Che, J.; Wang, Q.; He, H.; Liu, J.; Wang, Y.; et al. Defect detection of printed circuit board assembly based on YOLOv5. Sci. Rep. 2024, 14, 19287. [Google Scholar] [CrossRef] [Scilit]
- Xing, Z.; Li, L.; Yang, Y.; Zhou, W.; Ma, G.; Chen, S.; Lyu, L.; Li, X. A lightweight model for indoor object detection in unstructured scenes based on joint attention and prior knowledge in the context of home rehabilitation. J. King Saud Univ.–Comput. Inf. Sci. 2026. [Google Scholar] [CrossRef] [Scilit]
- Qiu, R.-Q.; Tsai, M.-L.; Chen, Y.-W.; Singh, S.P.; Lo, C.-Y. Integrated automatic optical inspection and image processing procedure for smart sensing in production lines. Sensors 2024, 24, 1619. [Google Scholar] [CrossRef] [Scilit] [PubMed]
- Starodubov, D.; Danishvar, S.; Abu Ebayyeh, A.A.R.M.; Mousavi, A. Advancements in PCB components recognition using WaferCaps: A data fusion and deep learning approach. Electronics 2024, 13, 1863. [Google Scholar] [CrossRef] [Scilit]
- Berahas, A.S.; Curtis, F.E.; Robinson, D.P.; Zhou, B. Sequential quadratic optimization for nonlinear equality constrained stochastic optimization. SIAM J. Optim. 2021, 31, 1352–1379. [Google Scholar] [CrossRef] [Scilit]
- Berahas, A.S.; Xie, M.; Zhou, B. A sequential quadratic programming method with high-probability complexity bounds for nonlinear equality-constrained stochastic optimization. SIAM J. Optim. 2025, 35, 240–269. [Google Scholar] [CrossRef] [Scilit]
- Katoch, S.; Chauhan, S.S.; Kumar, V. A review on genetic algorithm: Past, present, and future. Multimed. Tools Appl. 2021, 80, 8091–8126. [Google Scholar] [CrossRef] [Scilit]
- Zhan, Z.-H.; Shi, L.; Tan, K.C.; Zhang, J. A survey on evolutionary computation for complex continuous optimization. Artif. Intell. Rev. 2022, 55, 59–110. [Google Scholar] [CrossRef] [Scilit]
- Cunha, M.; Marques, J. A new multiobjective simulated annealing algorithm—MOSA-GR: Application to the optimal design of water distribution networks. Water Resour. Res. 2020, 56, e2019WR025852. [Google Scholar] [CrossRef] [Scilit]
- Xue, H.; Zhang, Z.; Deng, S.; Mu, L.; Fu, J.; Diao, L. Improved simulated annealing algorithm on the design of satellite orbits for common-view laser time transfer. Remote Sens. 2024, 16, 472. [Google Scholar] [CrossRef] [Scilit]
- An, P.T.; Huyen, P.T.T.; Le, N.T. A modified Graham’s convex hull algorithm for finding the connected orthogonal convex hull of a finite planar point set. Appl. Math. Comput. 2021, 397, 125889. [Google Scholar] [CrossRef] [Scilit]
- Kwon, H.; Oh, S.; Baek, J.-W. Algorithmic efficiency in convex hull computation: Insights from 2D and 3D implementations. Symmetry 2024, 16, 1590. [Google Scholar] [CrossRef] [Scilit]
- Gao, Z.-M.; Zhao, J.; Zhang, Y.-J. Review of chaotic mapping enabled nature-inspired algorithms. Math. Biosci. Eng. 2022, 19, 8215–8258. [Google Scholar] [CrossRef] [Scilit]
- Limane, A.; Zitouni, F.; Harous, S.; Lakbichi, R.; Ferhat, A.; Almazyad, A.S.; Jangir, P. Chaos-enhanced metaheuristics: Classification, comparison, and convergence analysis. Complex Intell. Syst. 2025, 11, 177. [Google Scholar] [CrossRef] [Scilit]
- El Ghouate, N.; Bencherqui, A.; Mansouri, H.; El Maloufy, A.; Tahiri, M.A.; Karmouni, H.; Sayyouri, M.; Askar, S.S.; Abouhawwash, M. Improving the Kepler optimization algorithm with chaotic maps: Comprehensive performance evaluation and engineering applications. Artif. Intell. Rev. 2024, 57, 313. [Google Scholar] [CrossRef] [Scilit]
- Bencherqui, A.; Mansouri, H.; El Ghouate, N.; El Maloufy, A.; Tahiri, M.A.; Karmouni, H.; Sayyouri, M.; Askar, S.S.; Abouhawwash, M. Chaos-enhanced Archimede algorithm for global optimization of real-world engineering problems and signal feature extraction. Processes 2024, 12, 406. [Google Scholar] [CrossRef] [Scilit]
- Zhang, Z.; Liu, S.; Zhang, Y.; Wang, C.; Zhang, S.; Yang, Z.; Xu, W. Optimization of low-power femtosecond laser trepan drilling by machine learning and a high-throughput multi-objective genetic algorithm. Opt. Laser Technol. 2022, 148, 107688. [Google Scholar] [CrossRef] [Scilit]
- Wang, L.; Wang, Z.; Zhang, S.; Tan, J.; Lin, Y.; Xiang, Y. Multi-unit global-local registration for 3D bent tube based on implicit structural feature compatibility. Adv. Eng. Inform. 2025, 65, 103120. [Google Scholar] [CrossRef] [Scilit]
- Yin, X.; Li, X.; Qian, L.; Zhu, Z. Numerical Analysis and Optimization of Chip-Level Drop Impact Reliability for Chiplet Based on Si Interposer. IEEE Trans. Compon. Packag. Manuf. Technol. 2025, 15, 1203–1212. [Google Scholar] [CrossRef] [Scilit]
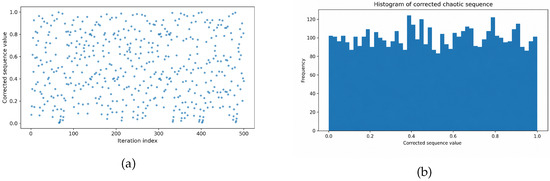
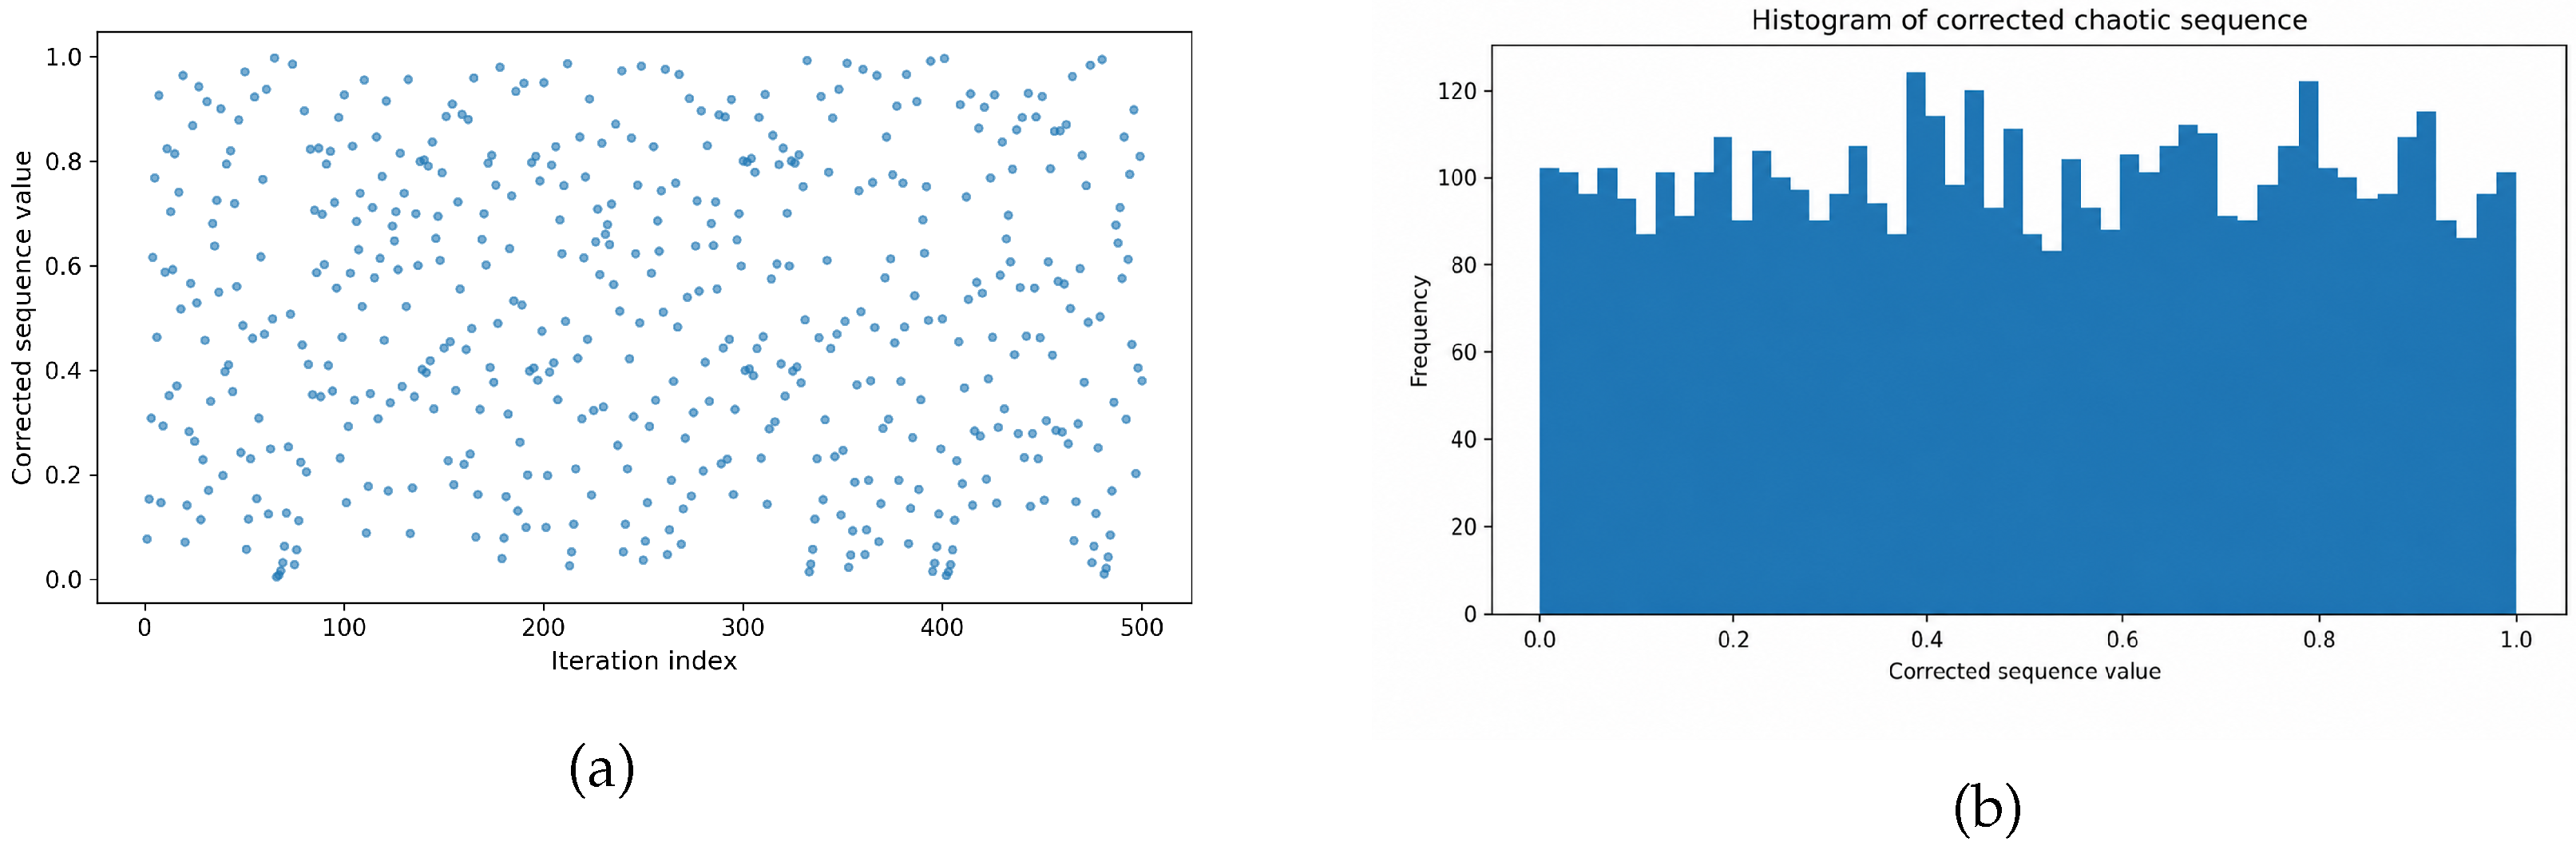
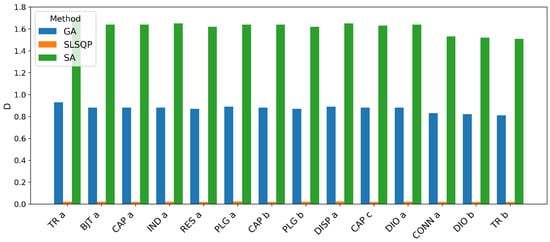
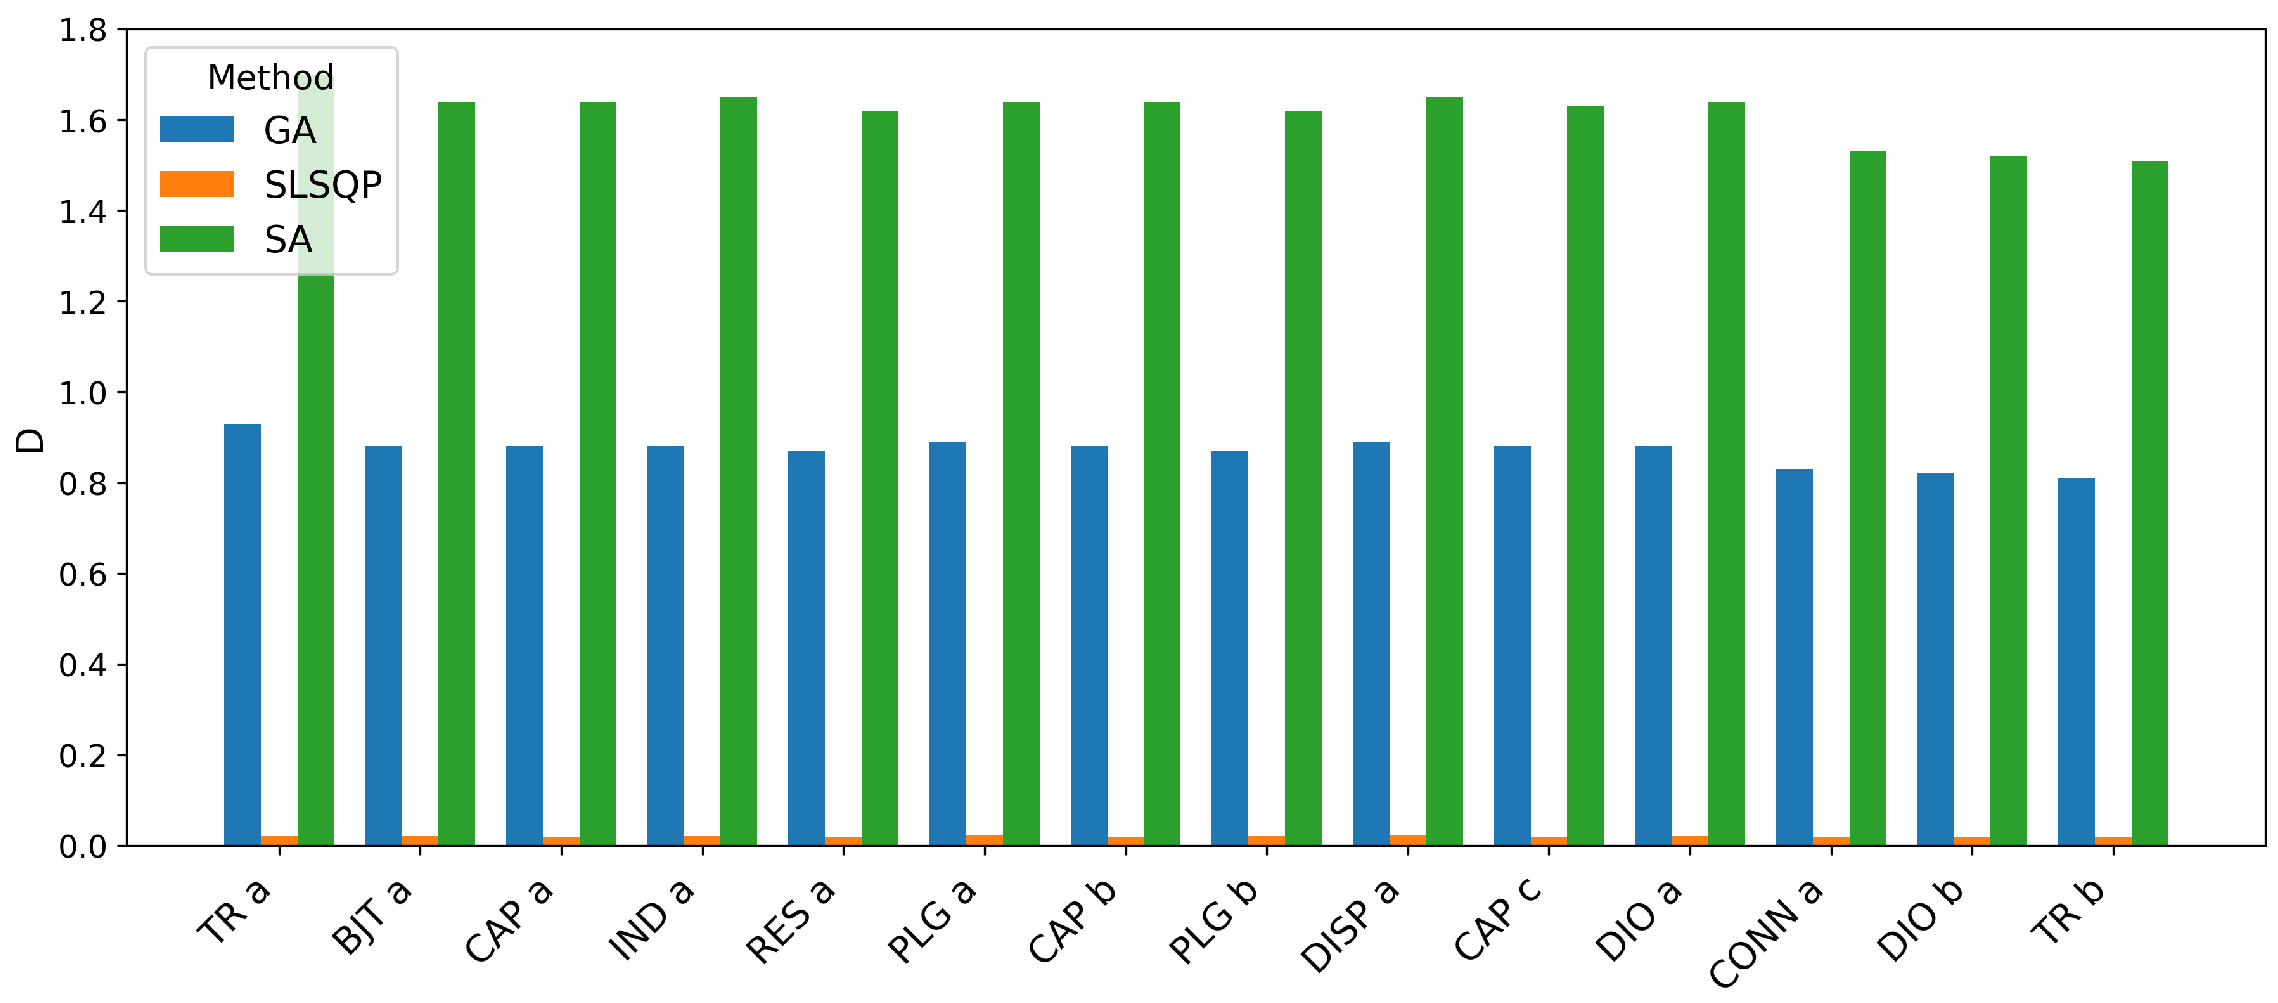
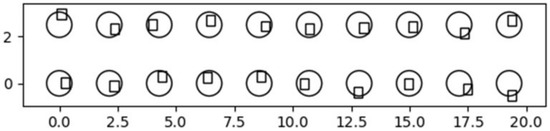
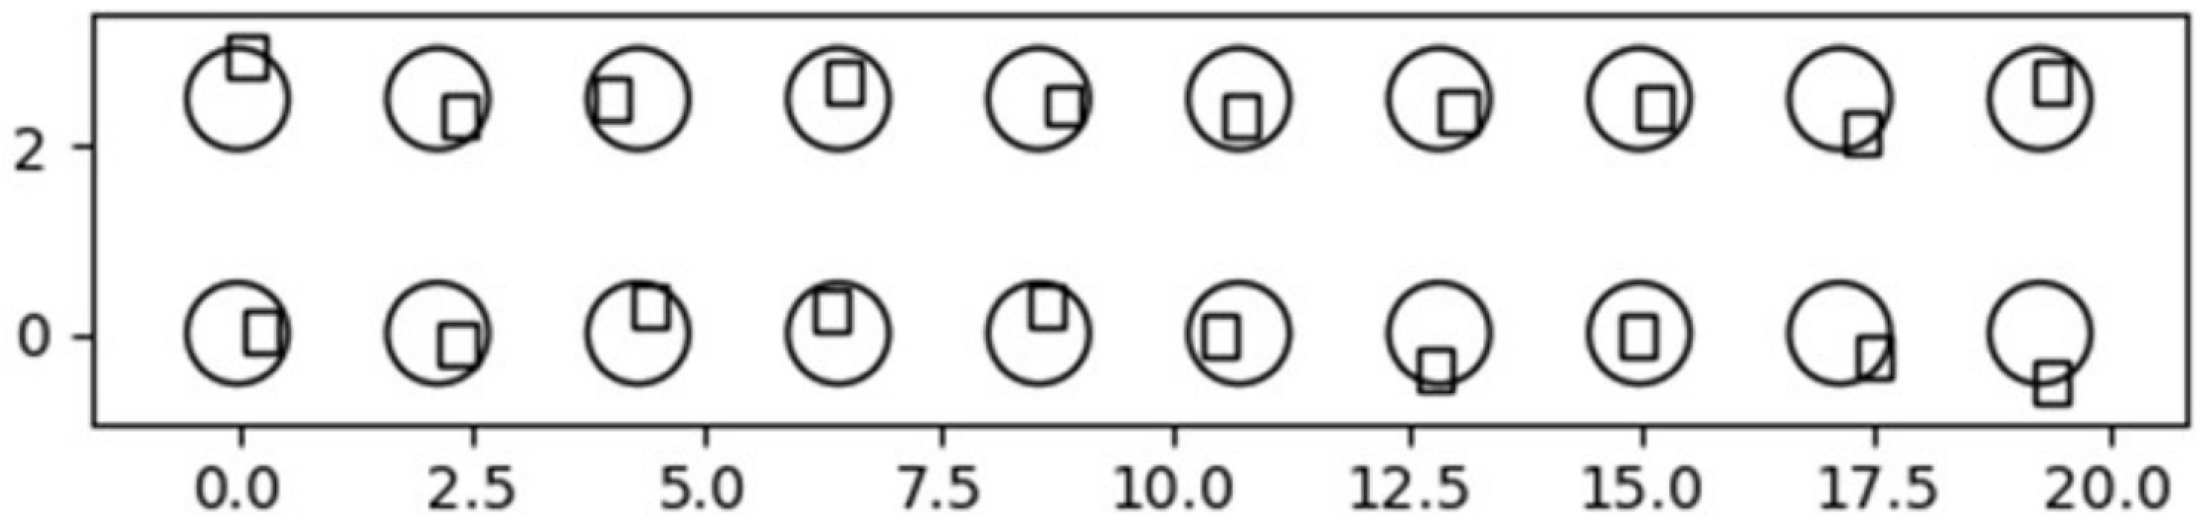
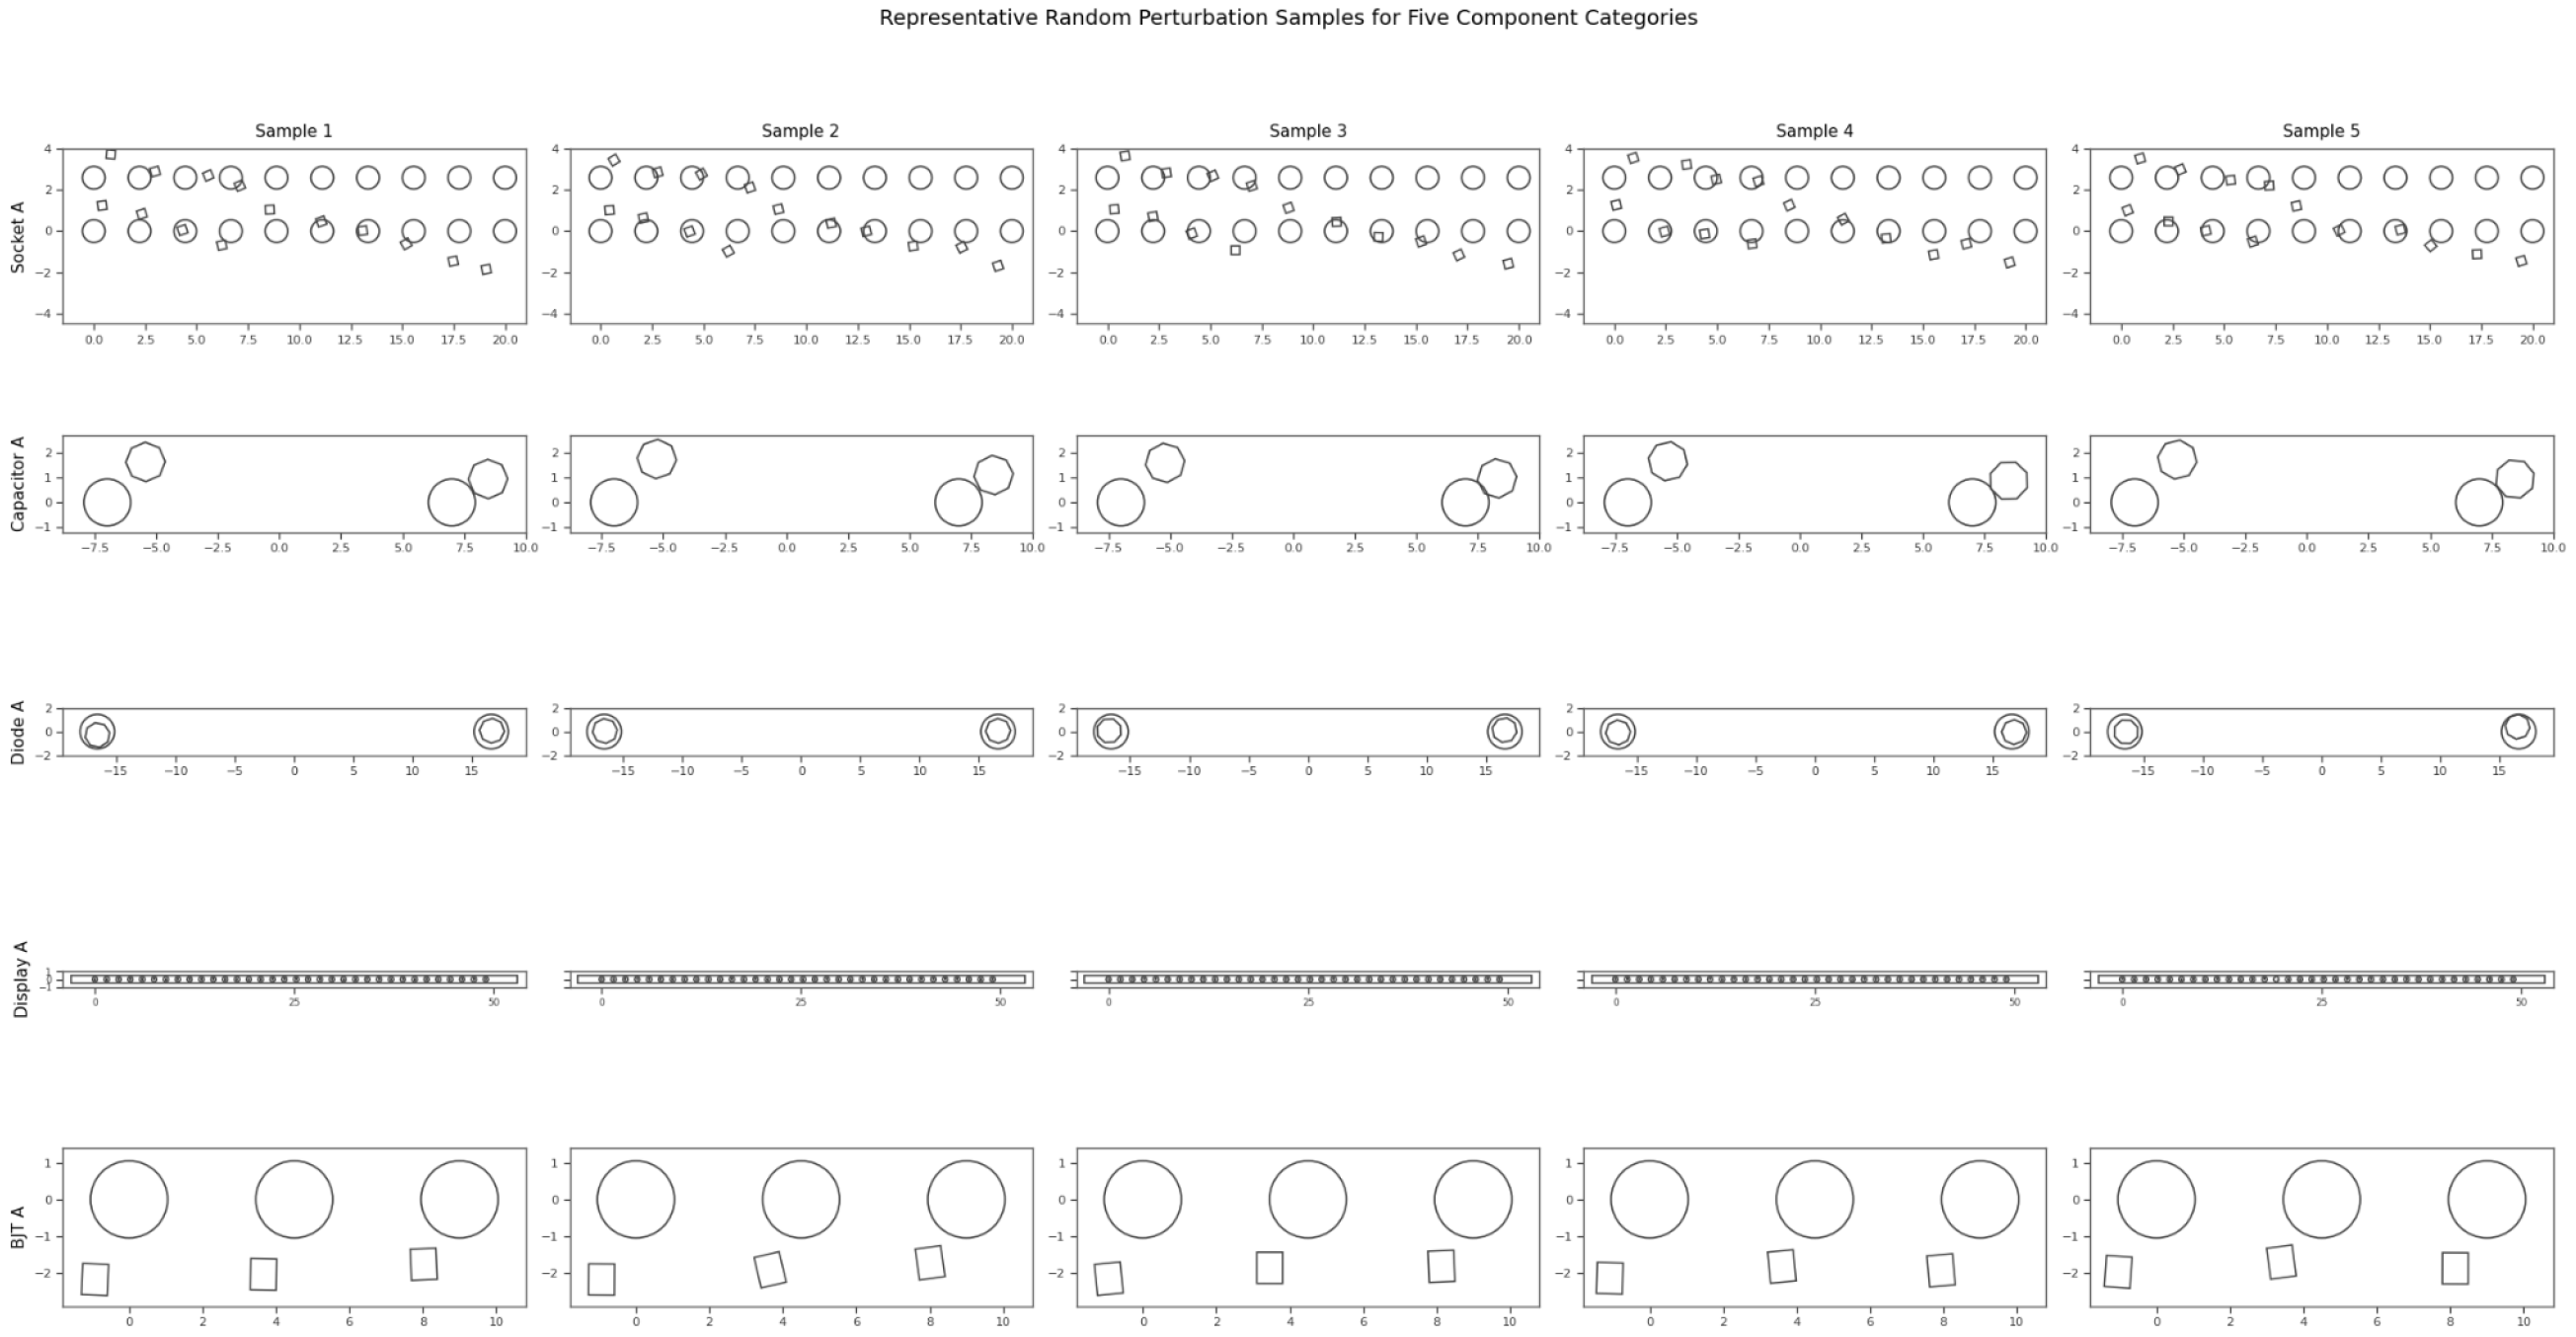
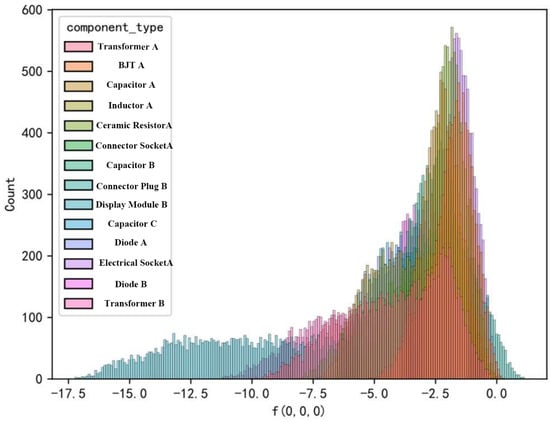
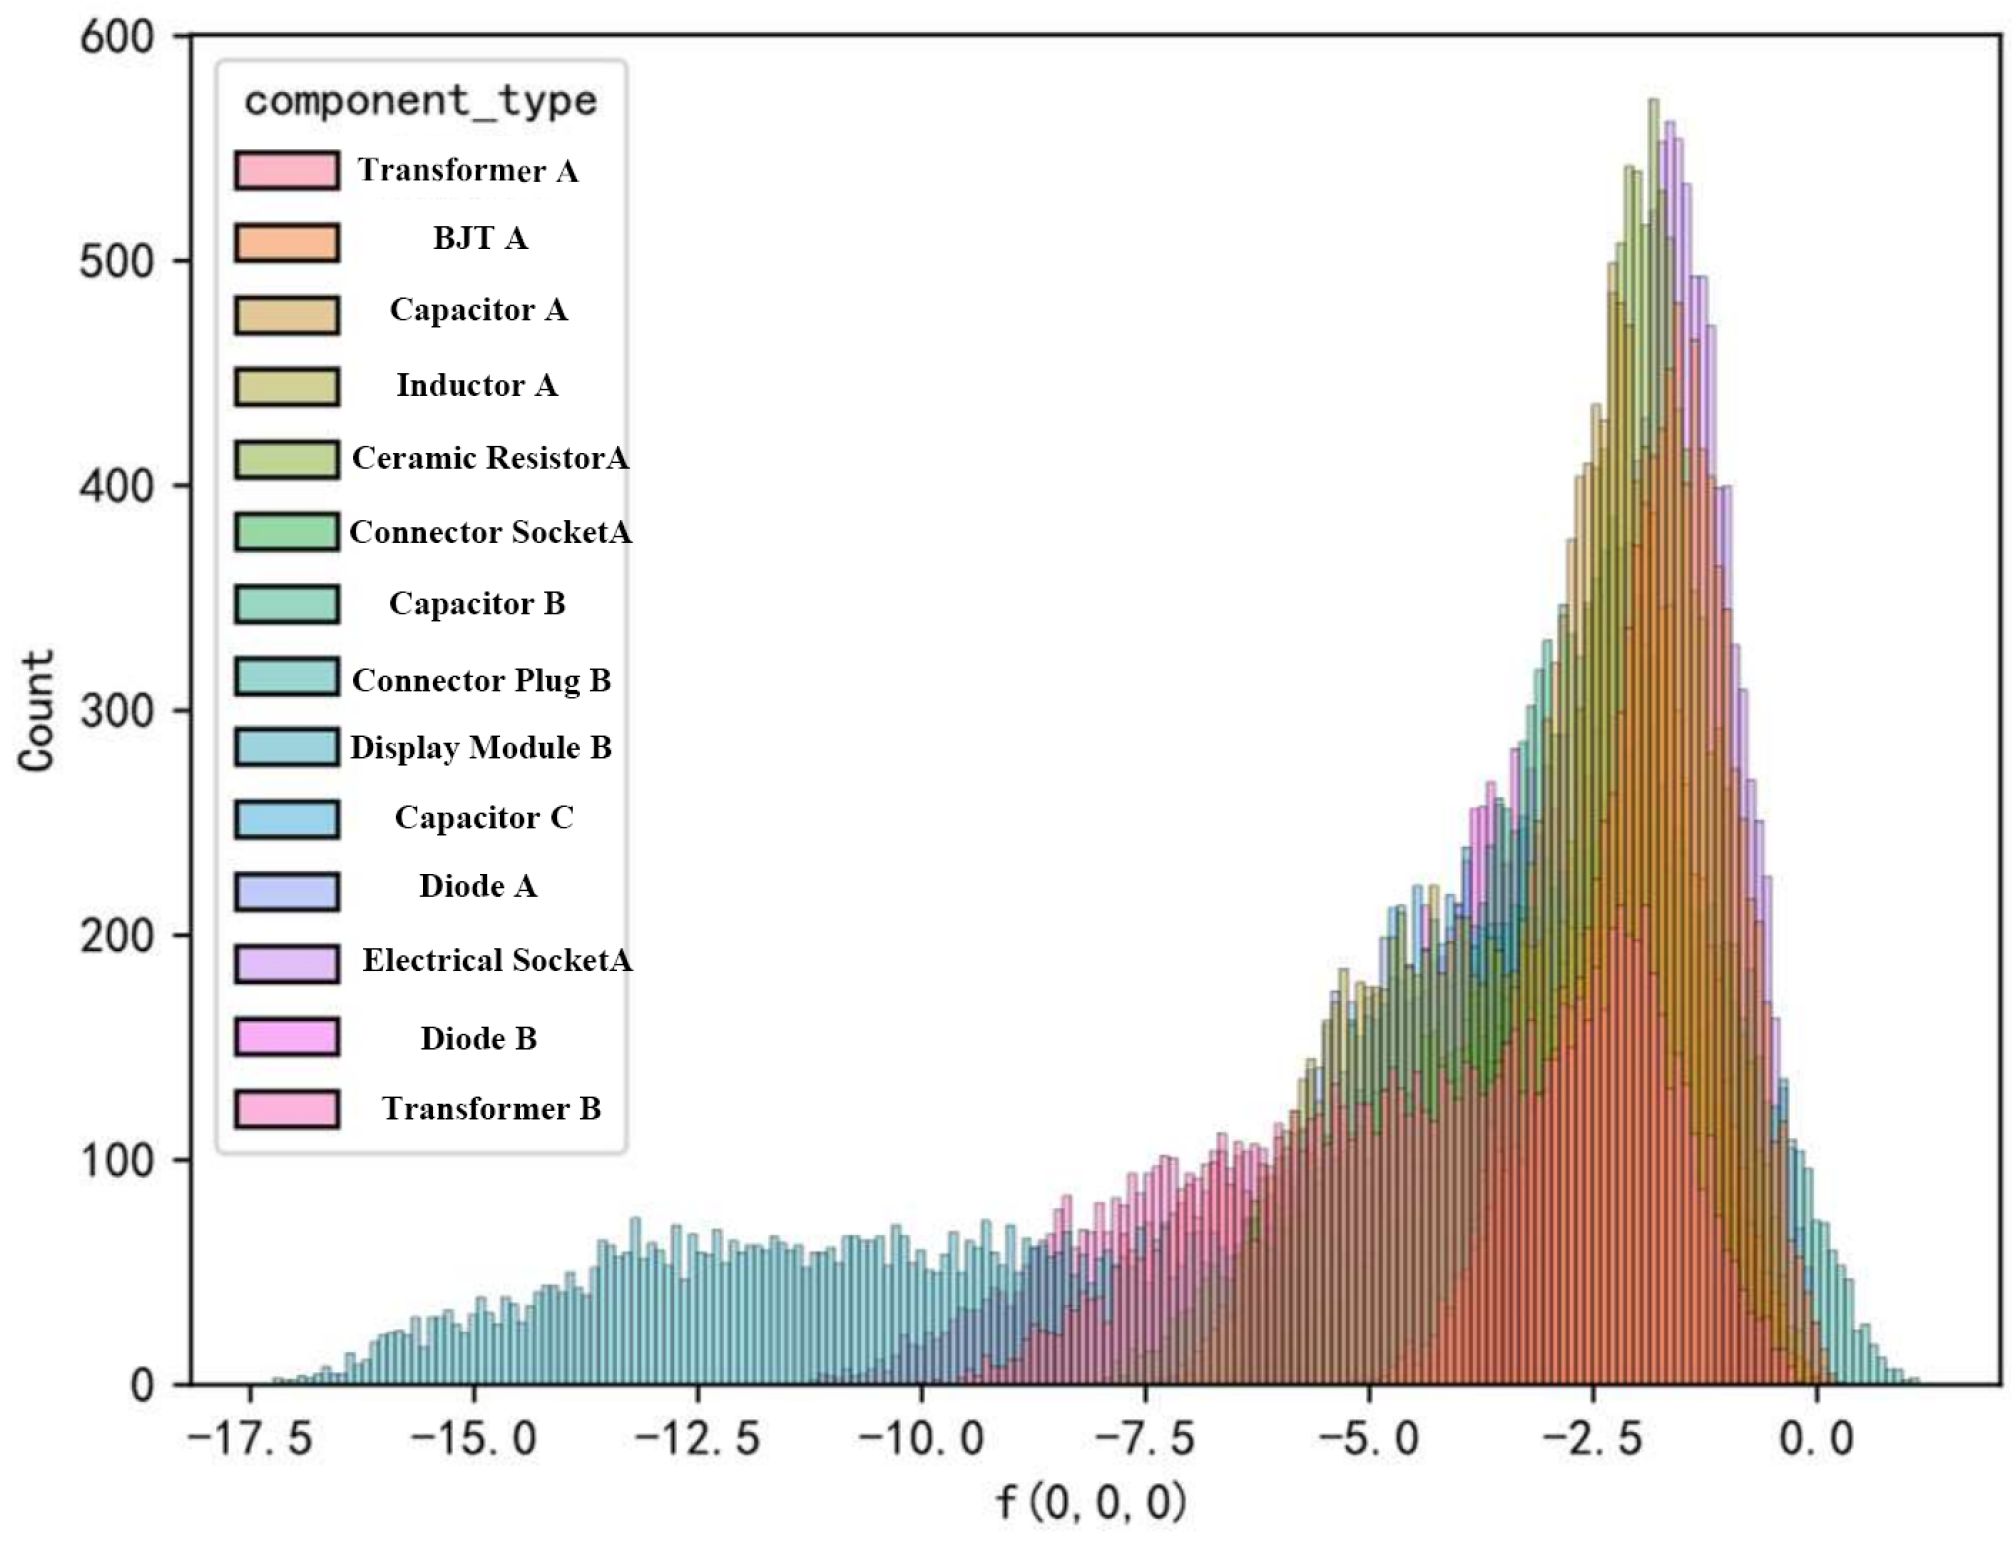
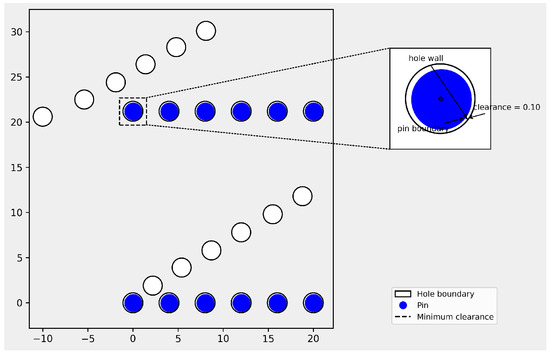
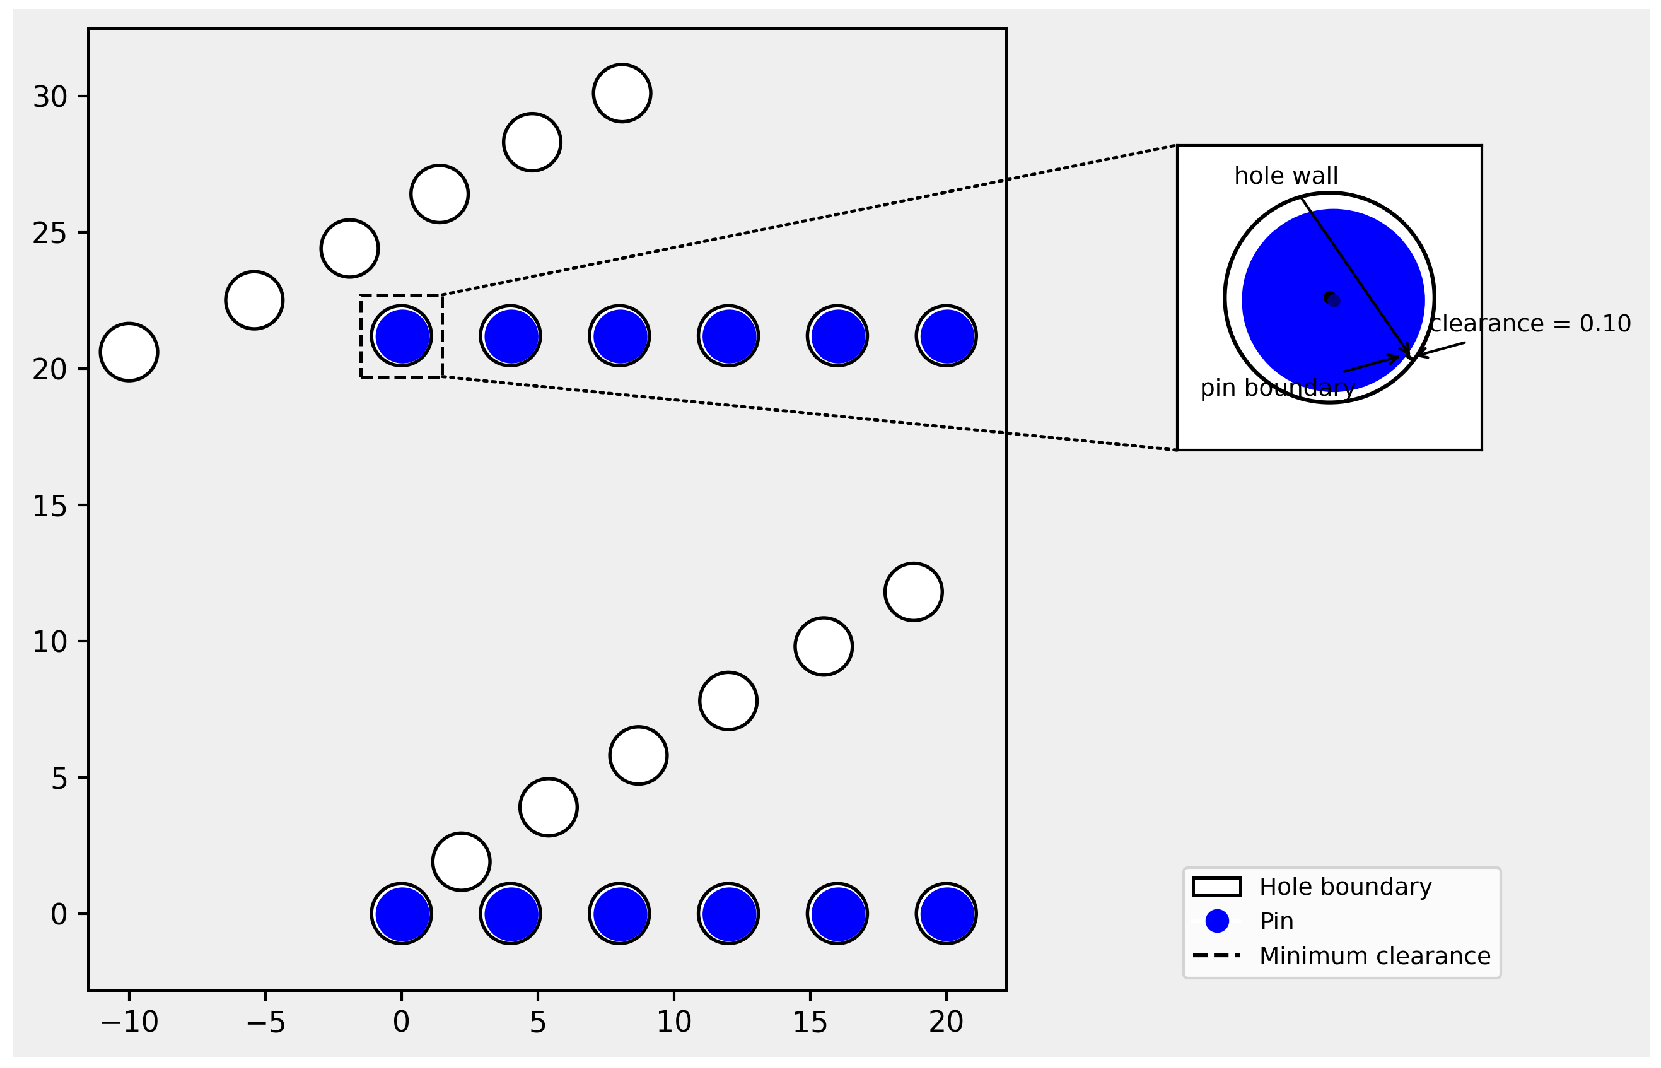
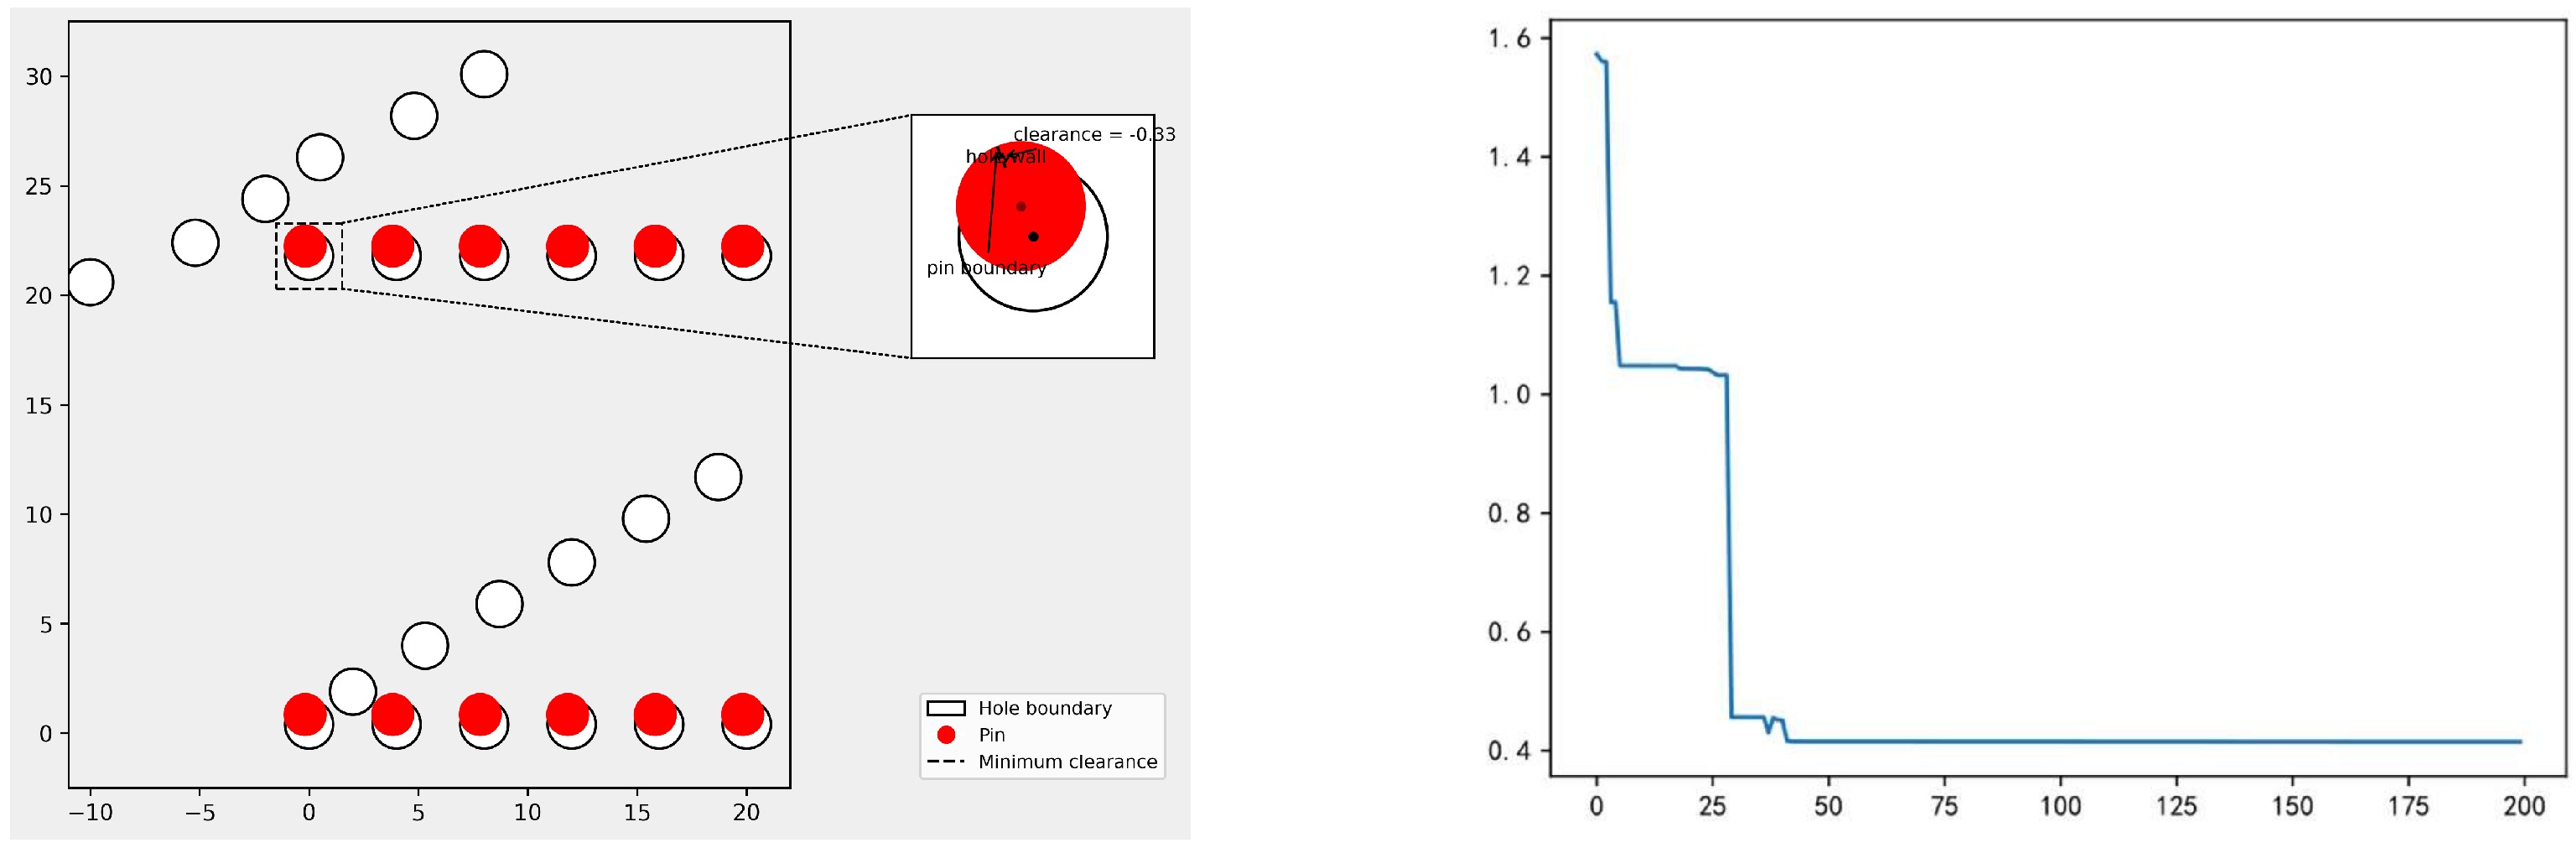
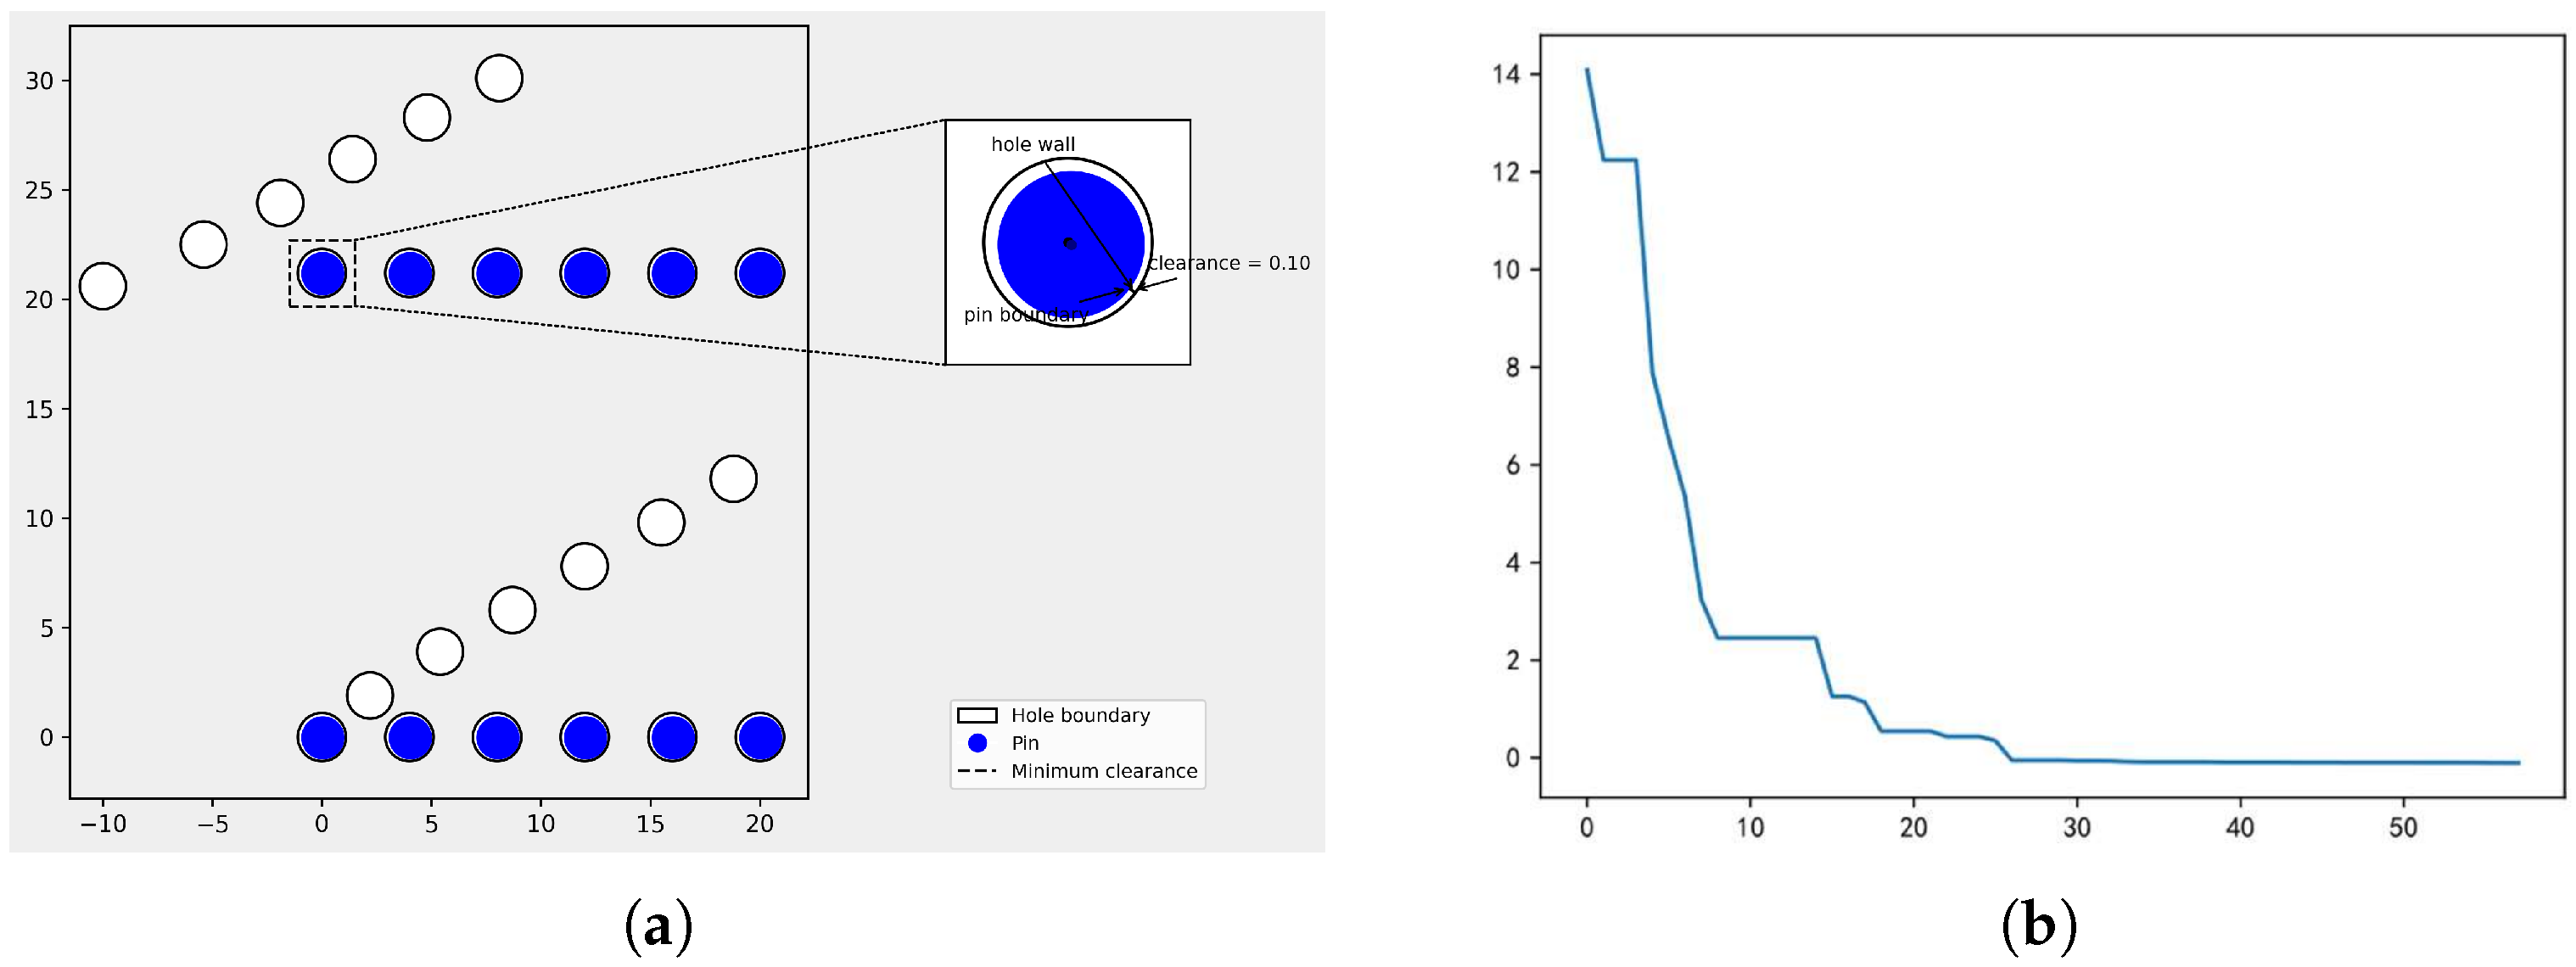
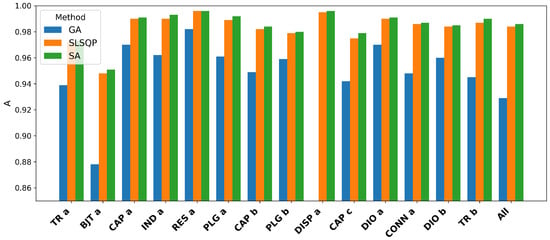
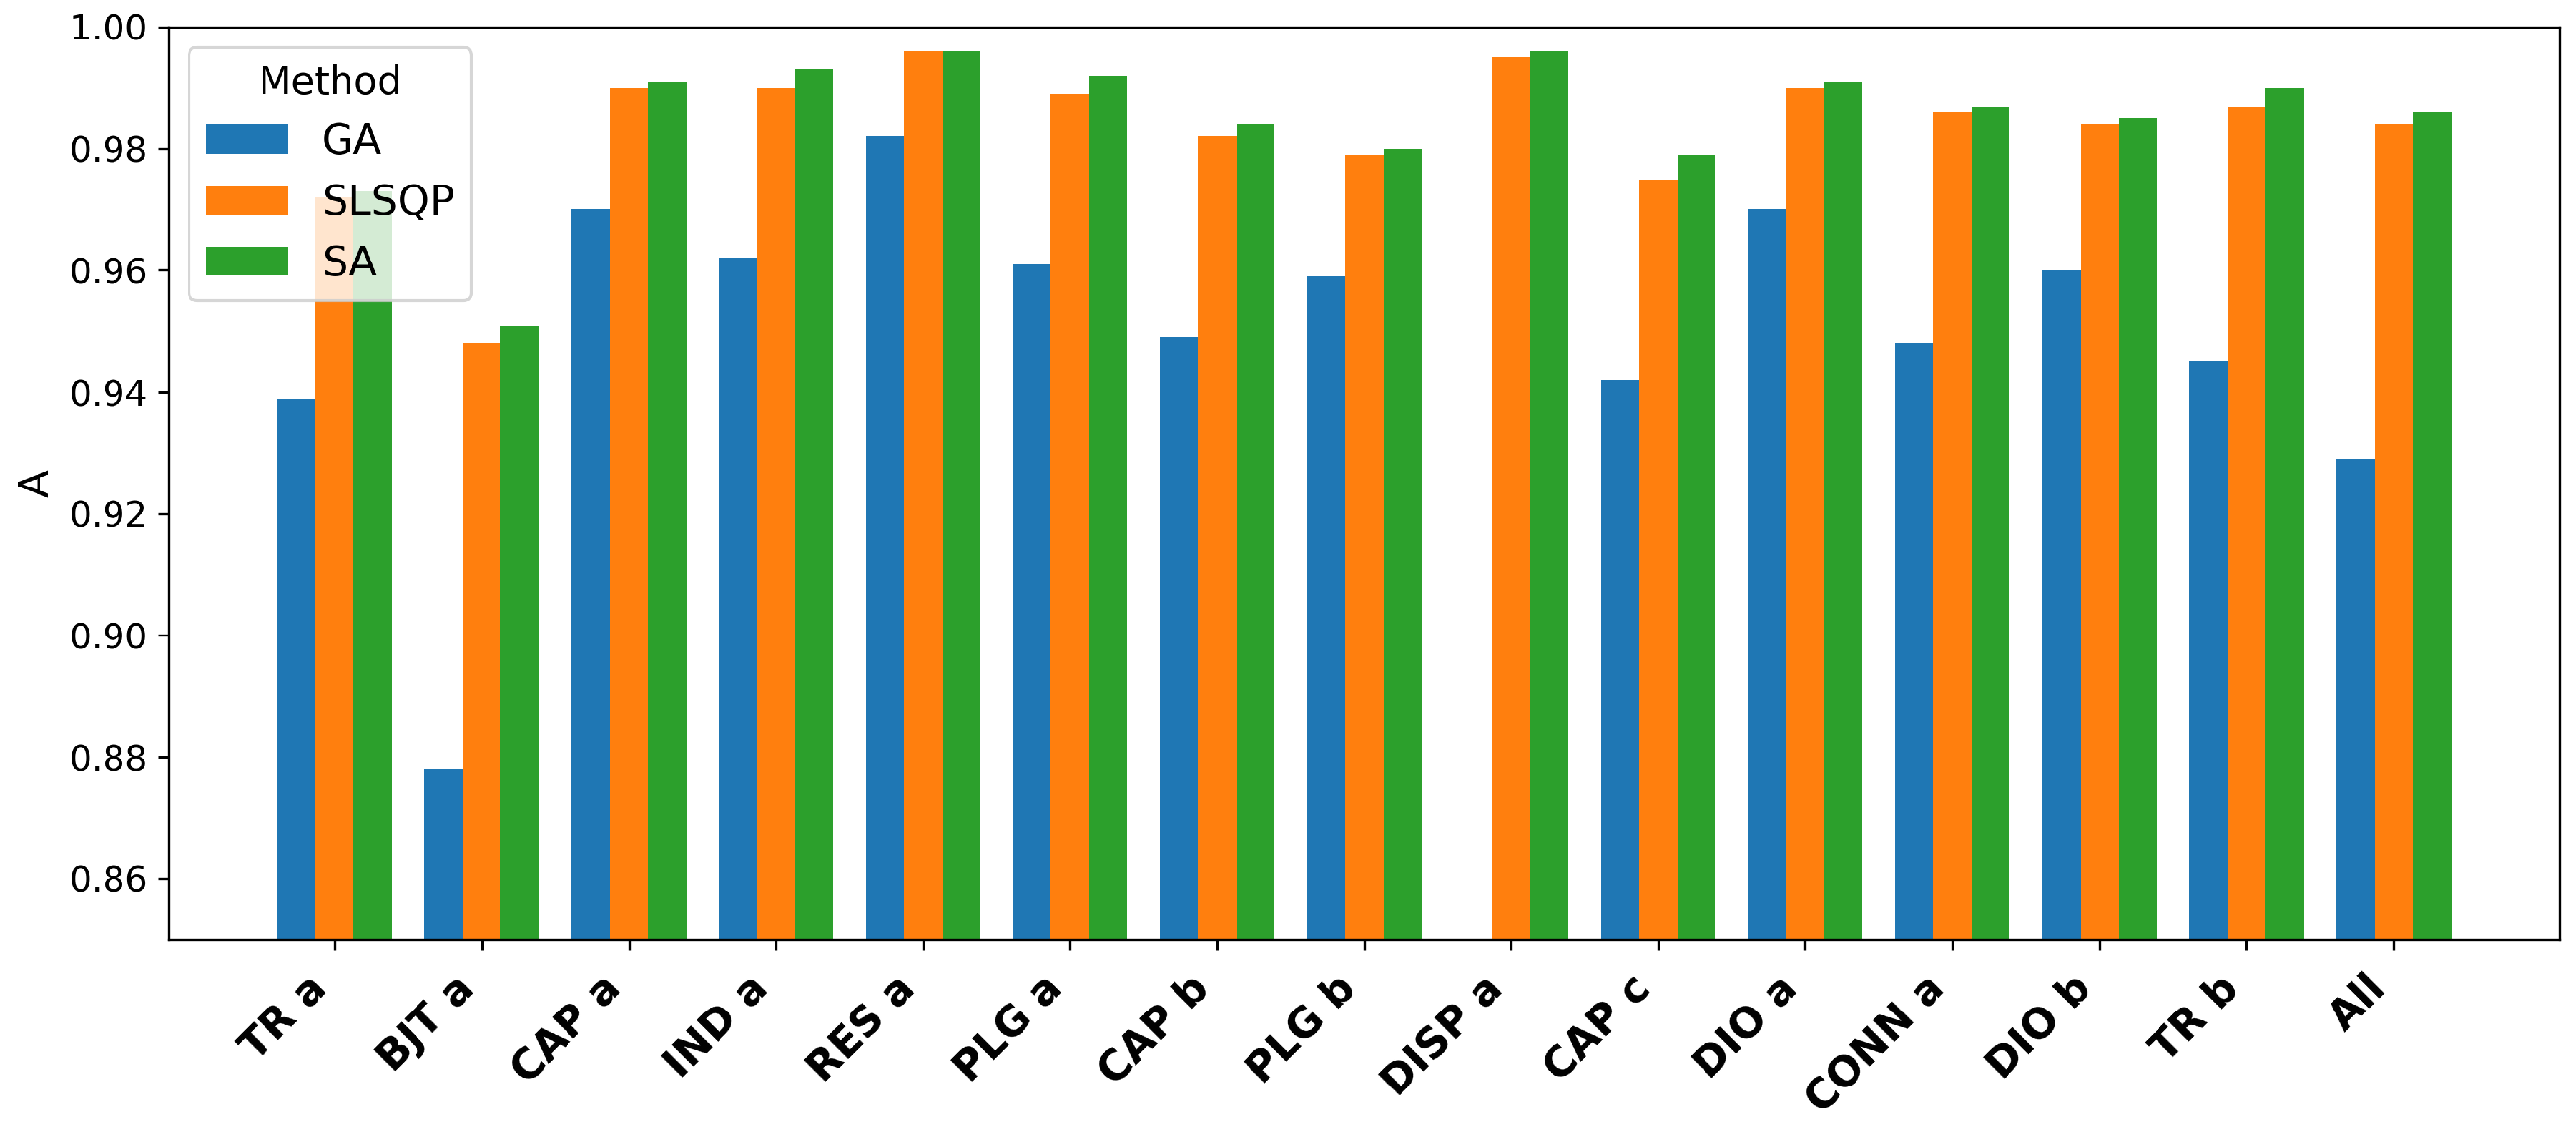
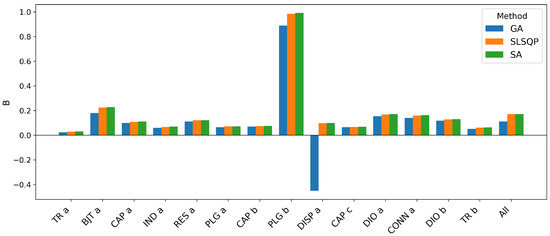
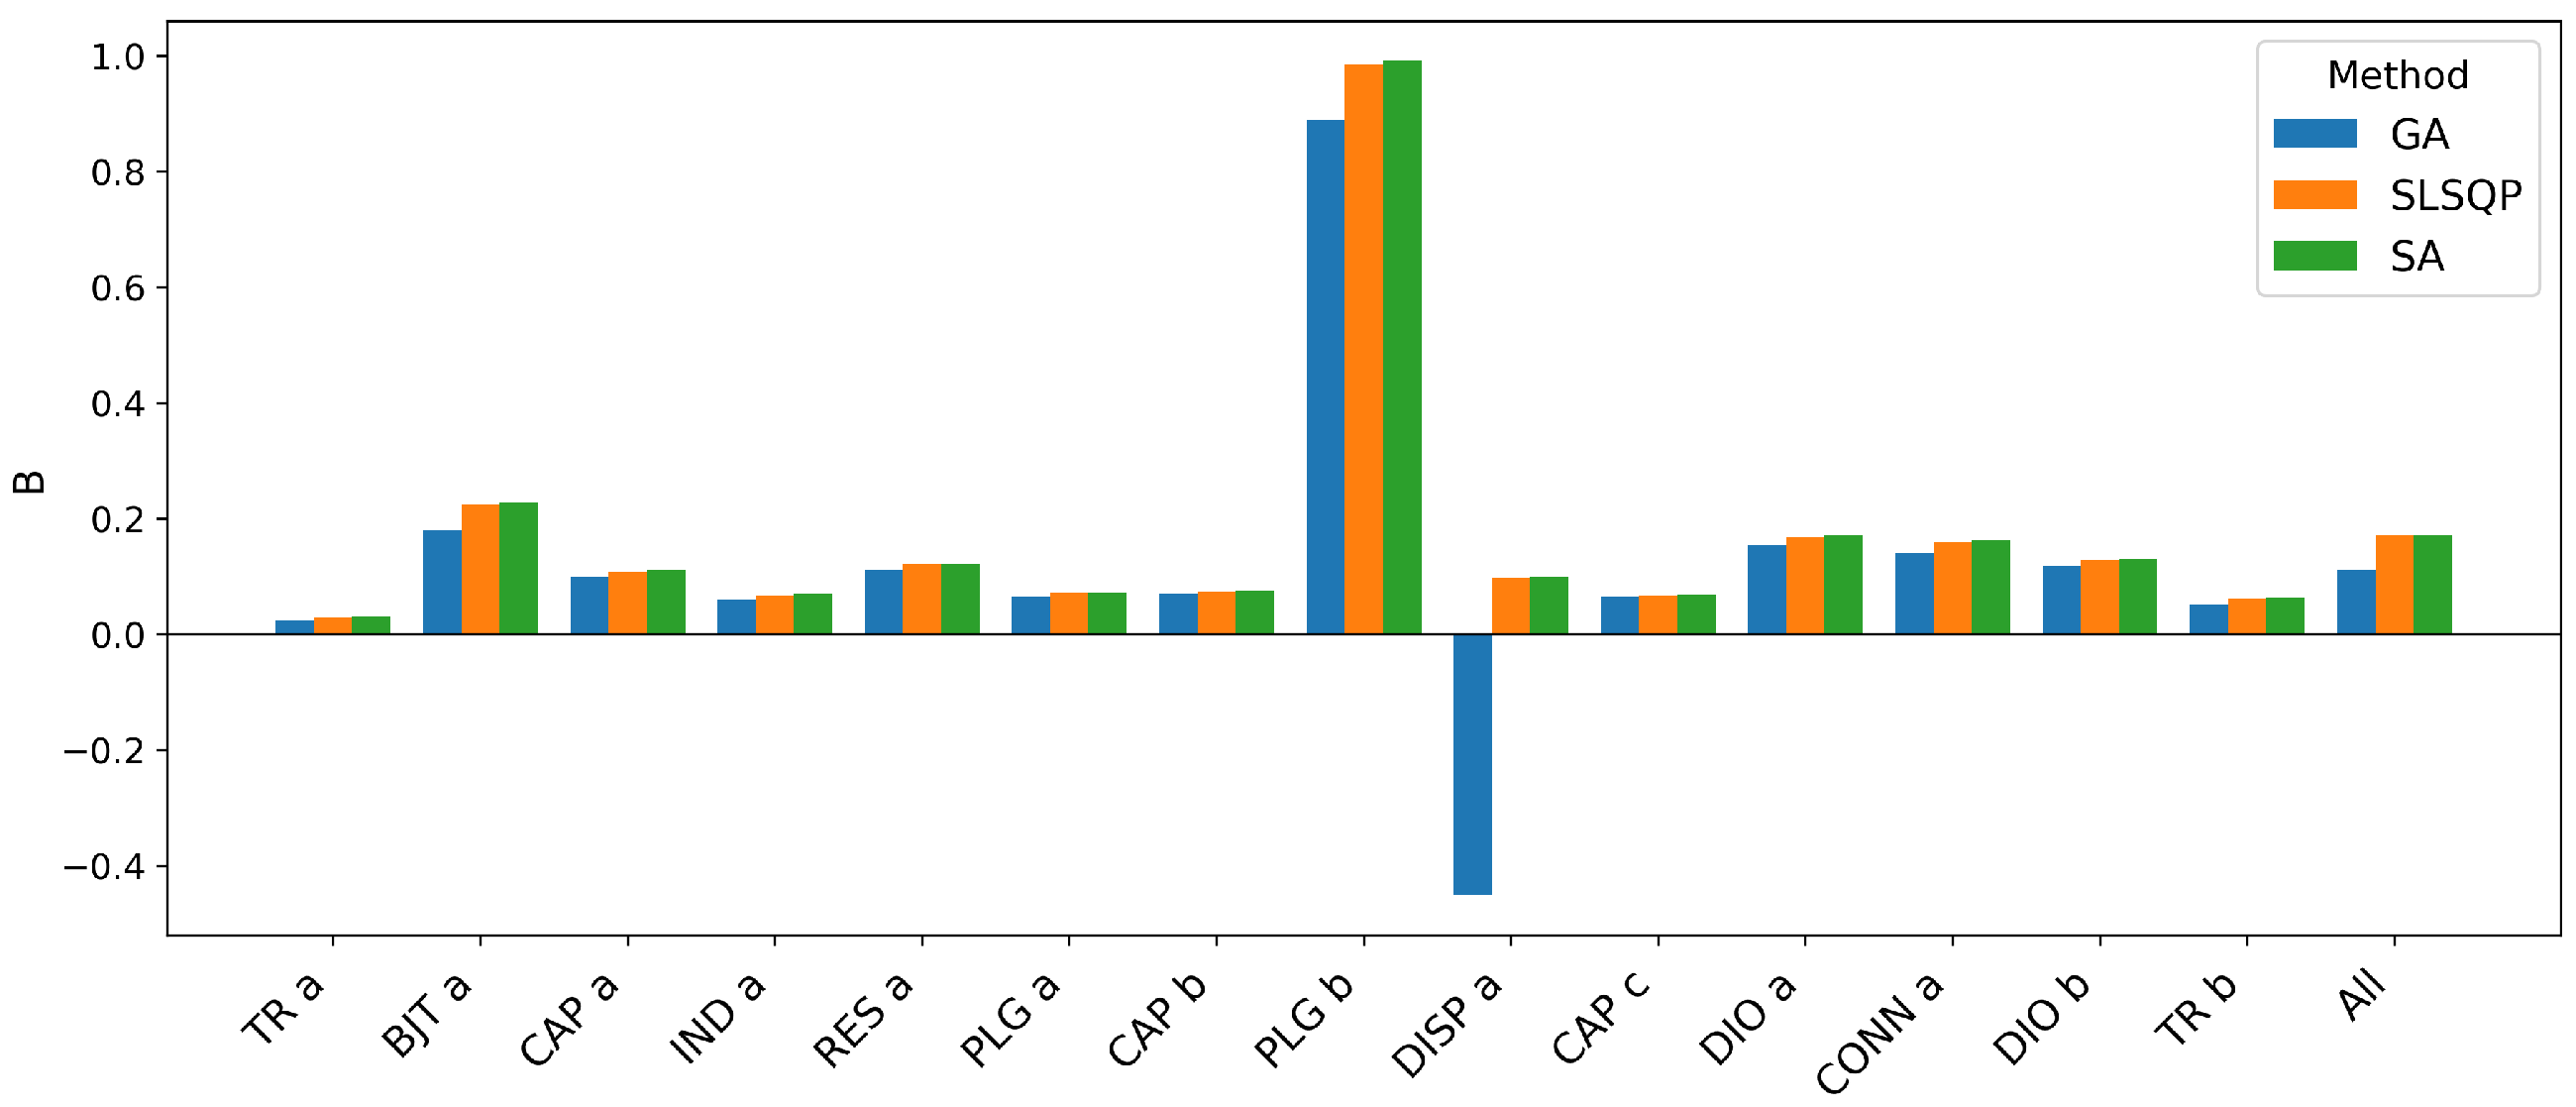
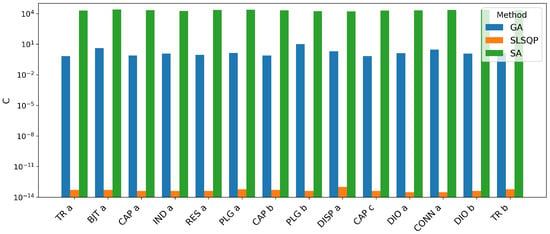
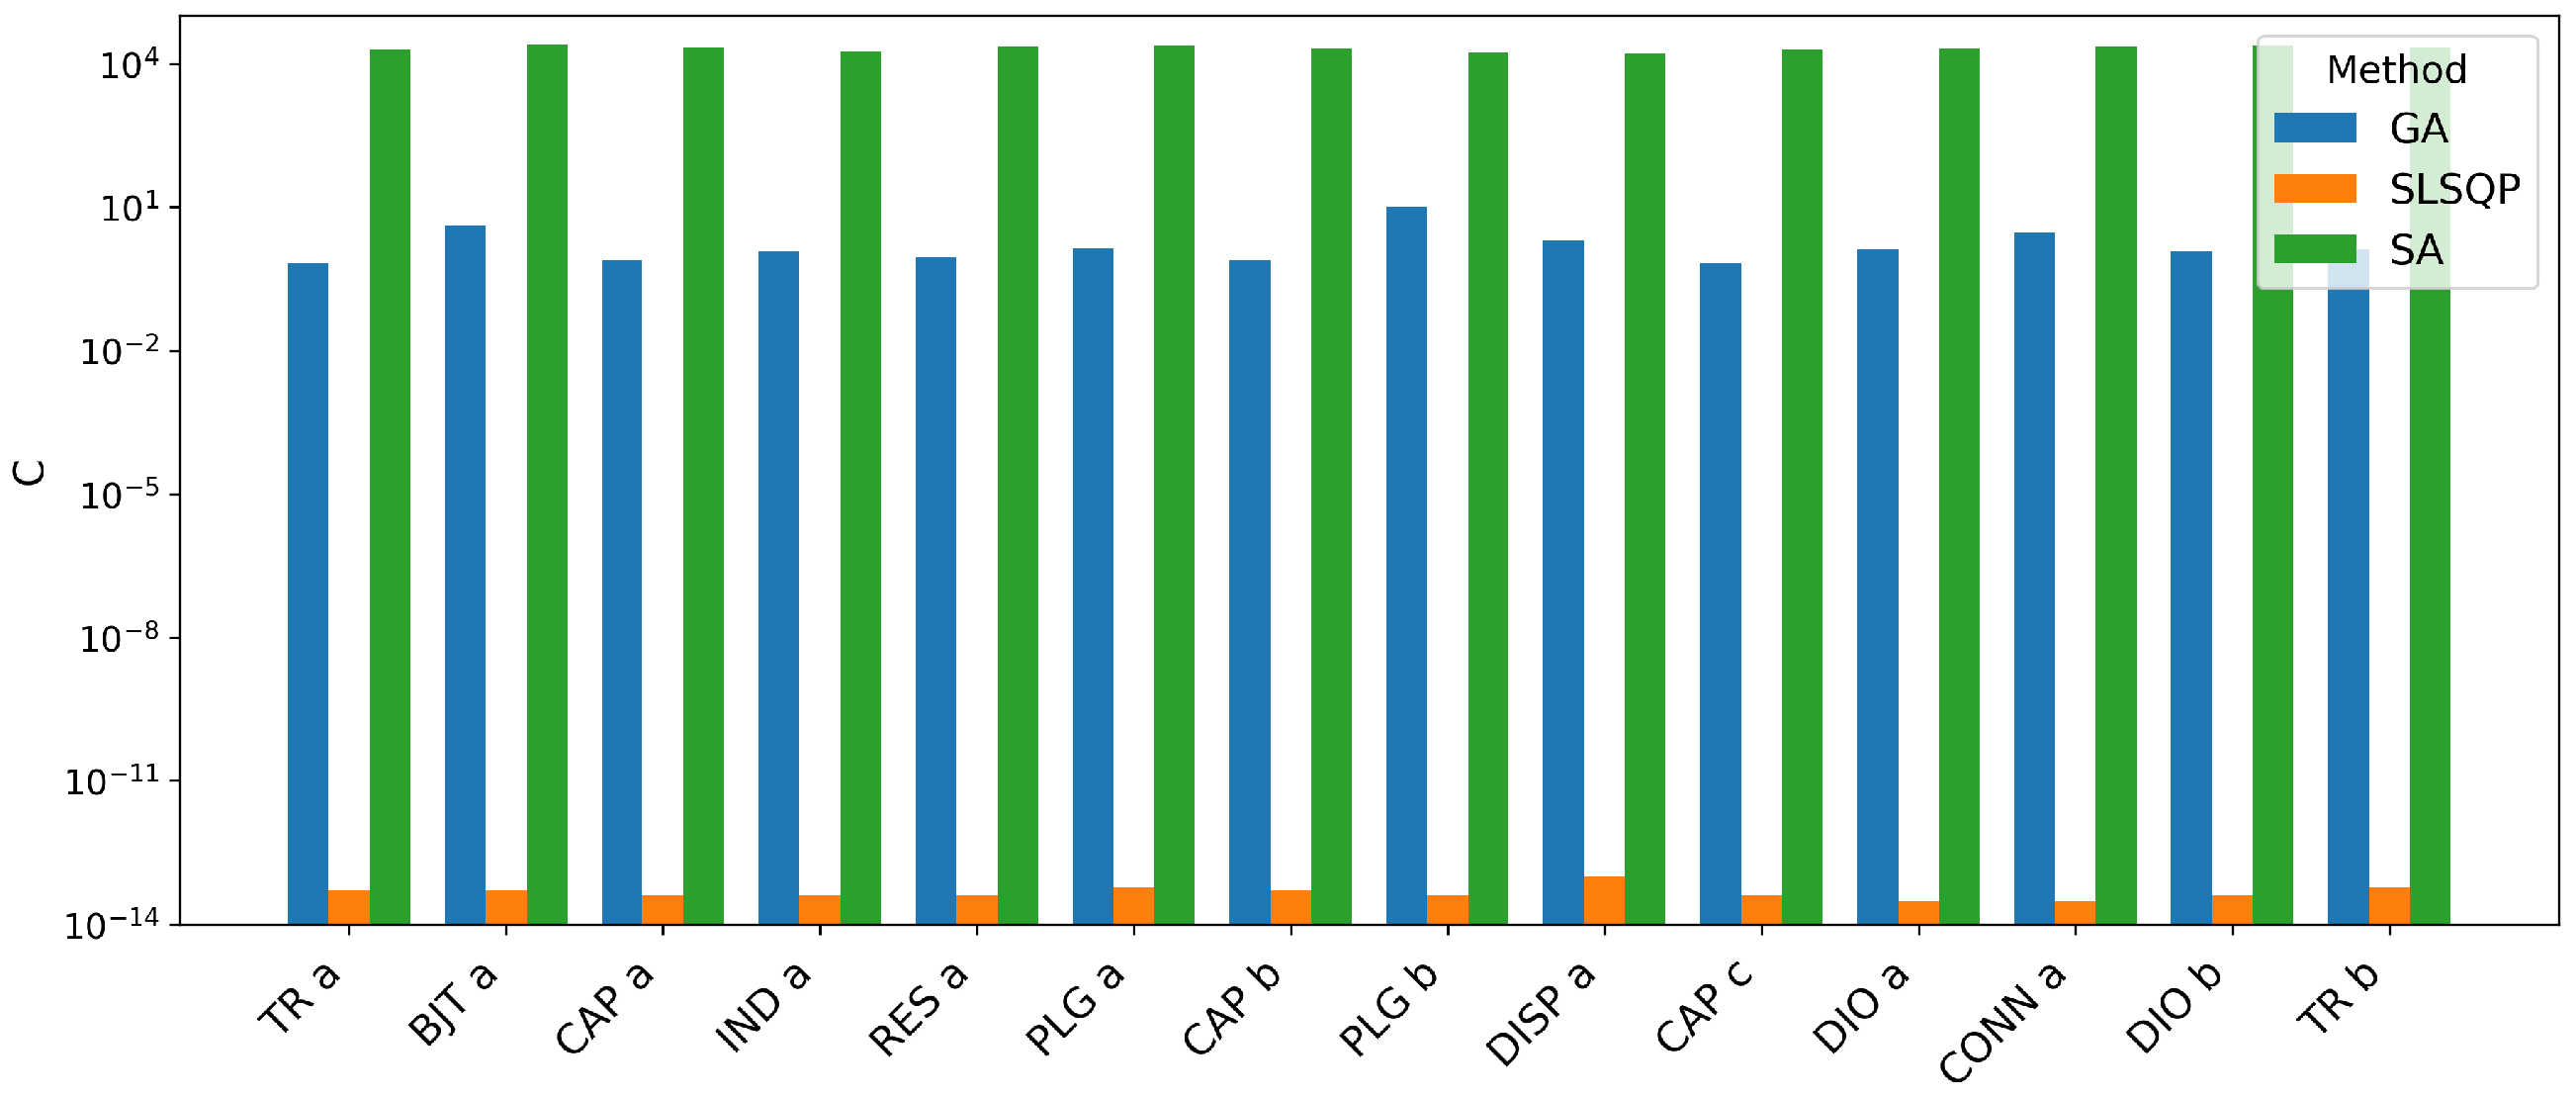
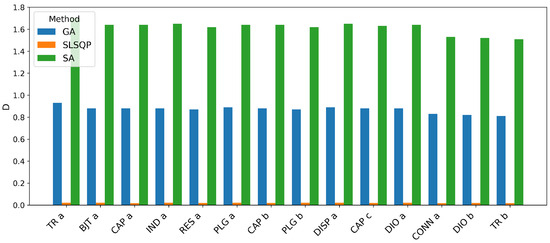
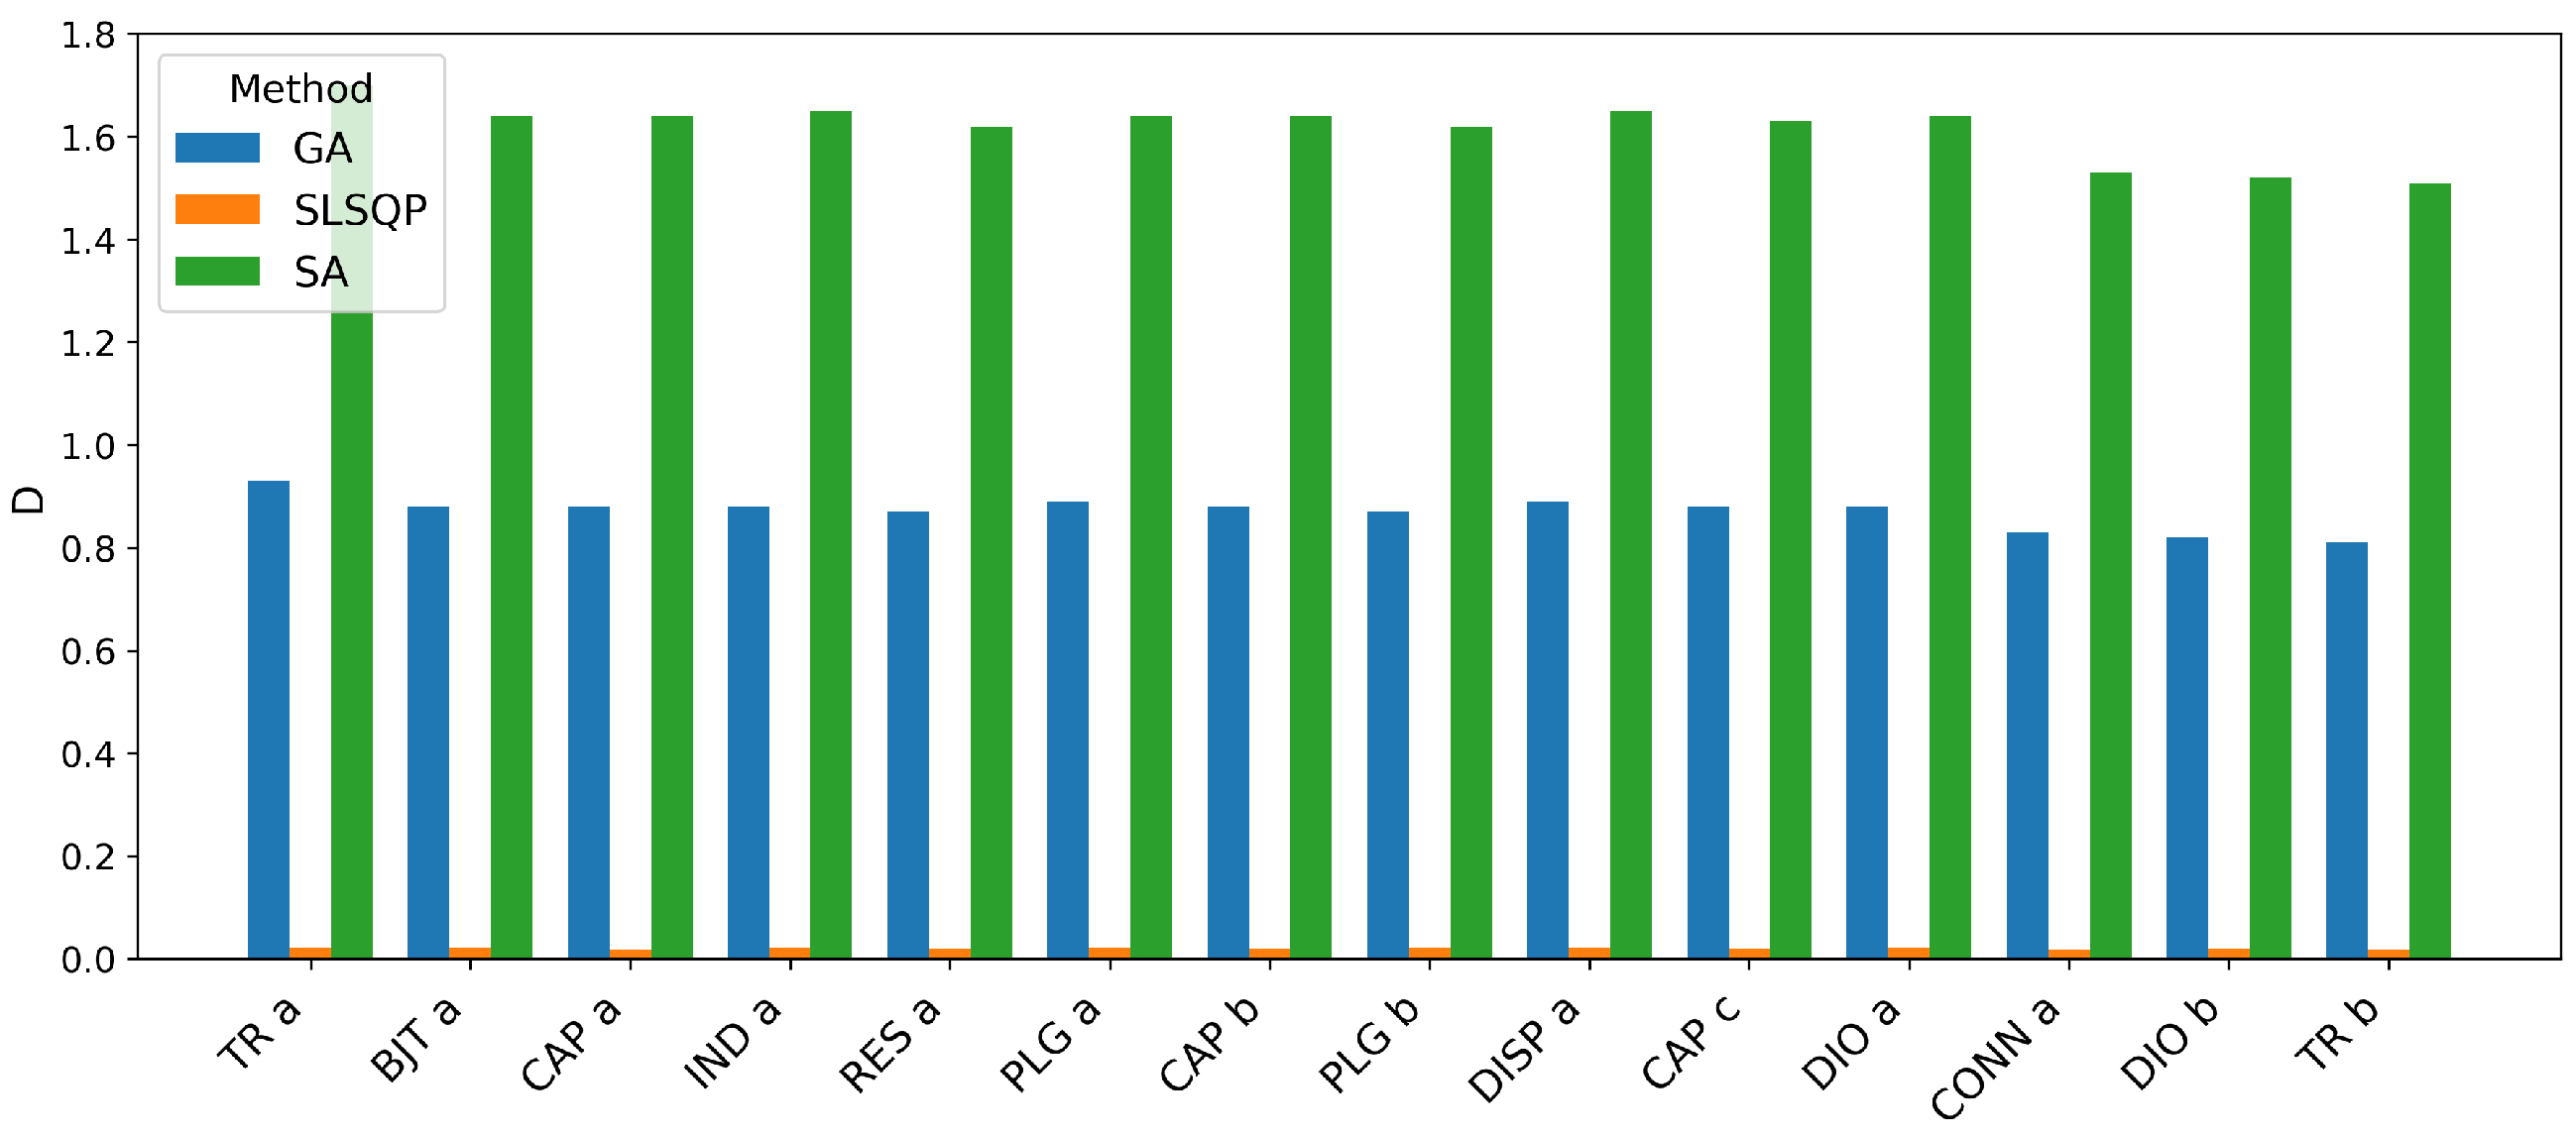
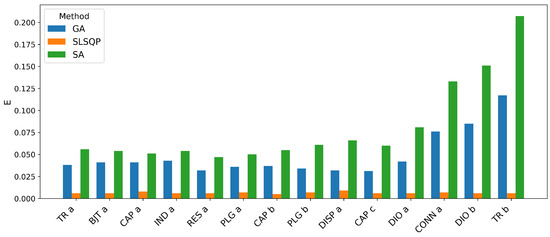
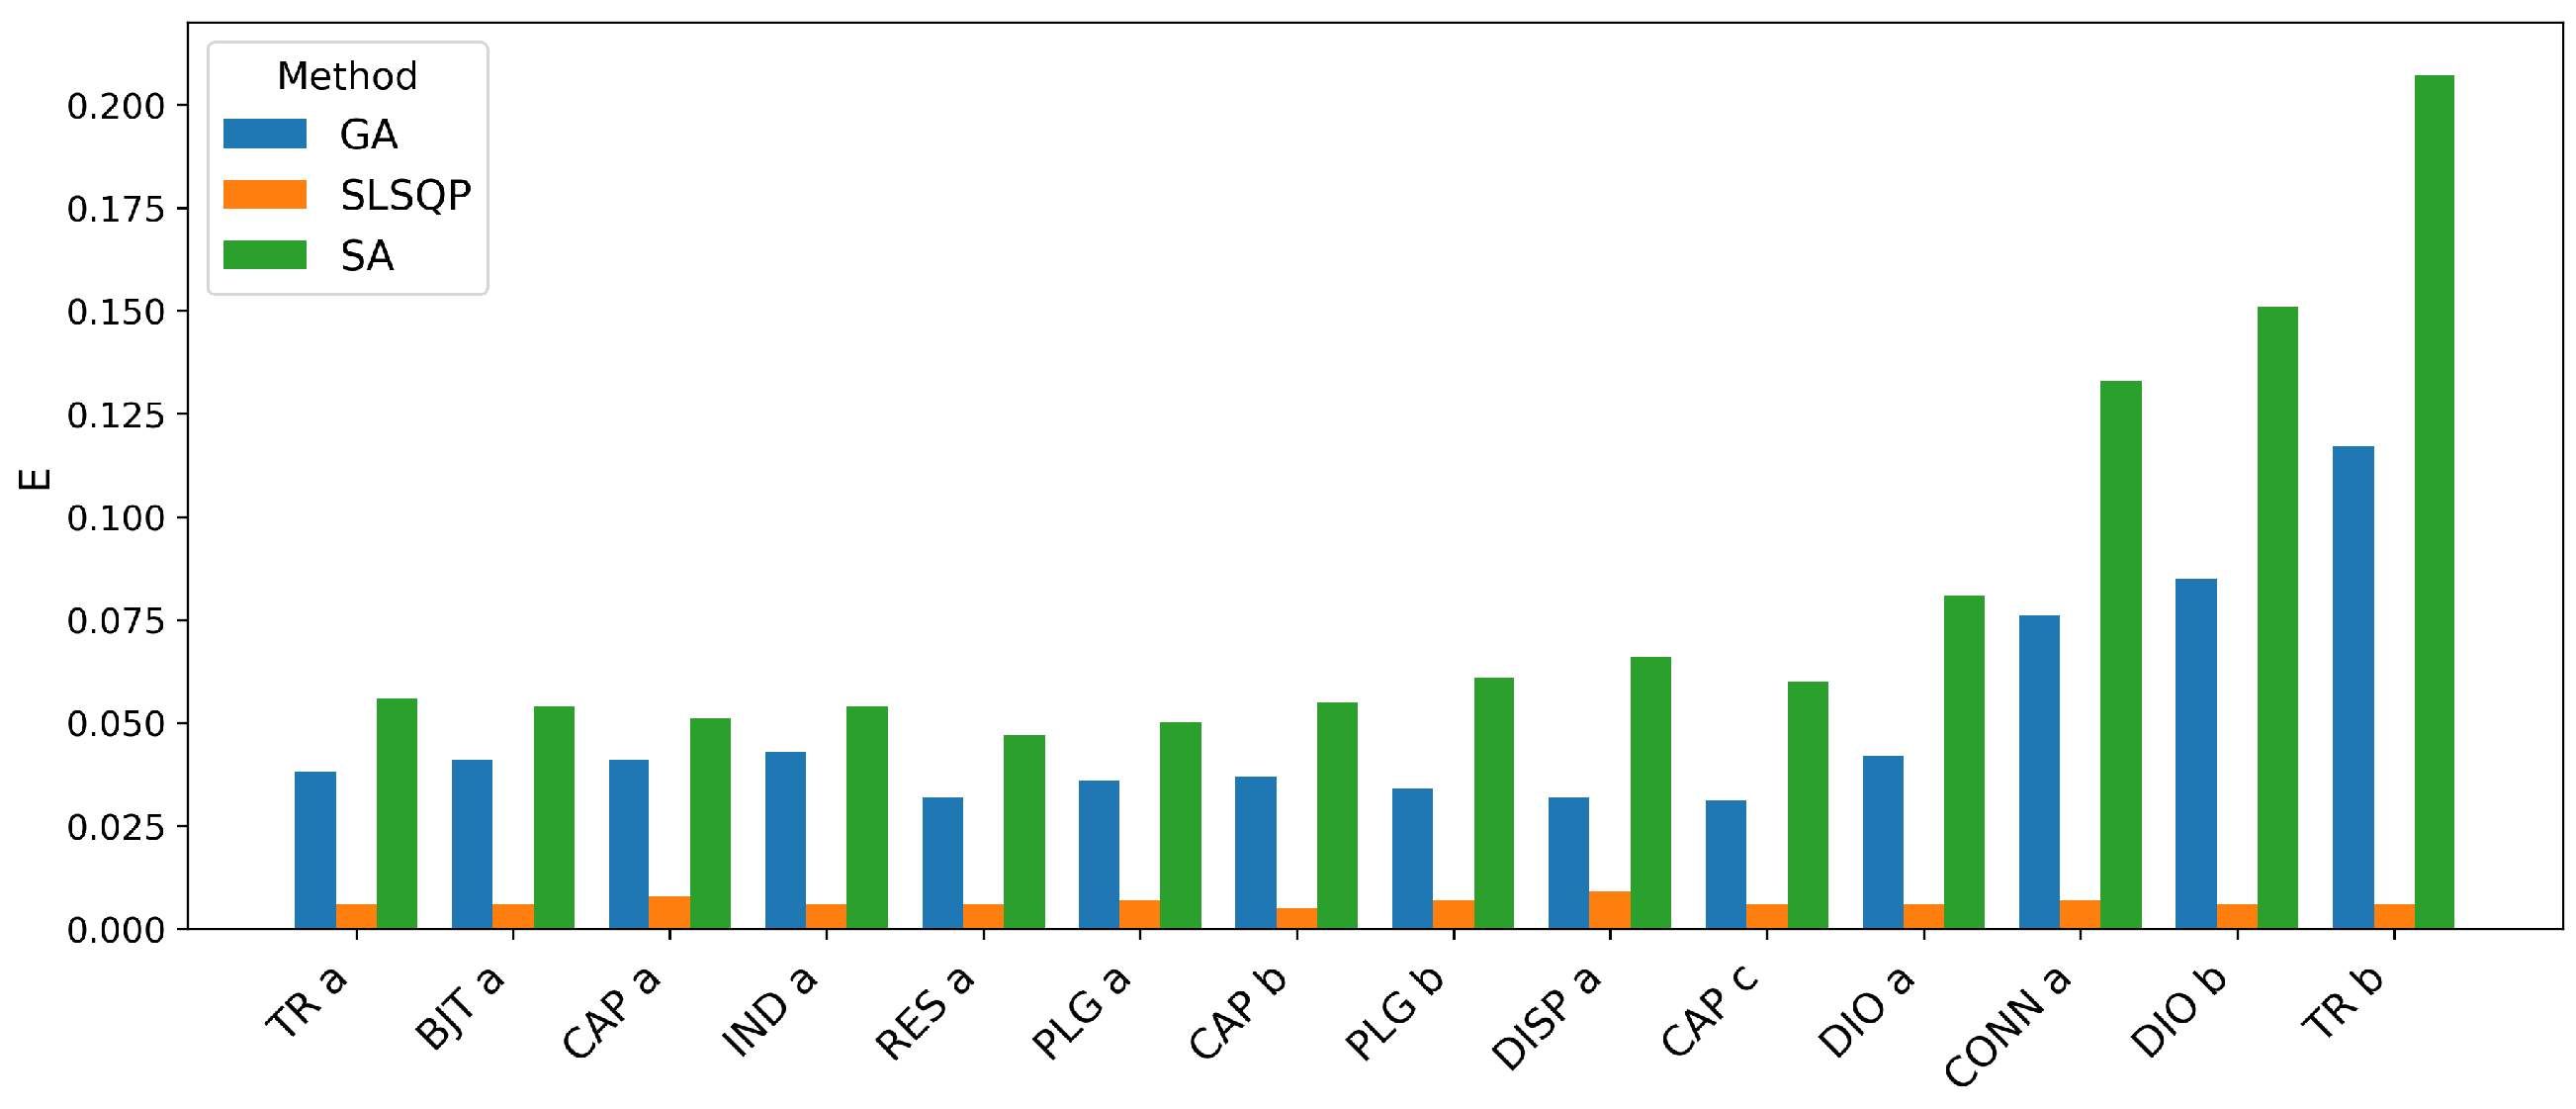

Disclaimer/Publisher’s Note: The statements, opinions and data contained in all publications are solely those of the individual author(s) and contributor(s) and not of MDPI and/or the editor(s). MDPI and/or the editor(s) disclaim responsibility for any injury to people or property resulting from any ideas, methods, instructions or products referred to in the content. |
© 2026 by the authors. Licensee MDPI, Basel, Switzerland. This article is an open access article distributed under the terms and conditions of the Creative Commons Attribution (CC BY) license.