


Abstract
We propose SGA-DCAT (Sentiment-Gated Dual-stream Cross-Attention Temporal Network), an architecture for stock price prediction that treats news sentiment not as a passive input feature but as a control signal that governs the model’s memory dynamics. Most sentiment-augmented methods simply concatenate sentiment scores with price inputs, which implicitly assumes that the relationship between sentiment and price is the same regardless of market conditions. SGA-DCAT departs from this practice in three ways: (1) a sentiment-gated adaptive LSTM cell modulates the forget and input gates directly through sentiment signals so that memory retention varies with market mood; (2) a dual-stream cross-attention mechanism encodes price and sentiment through separate recurrent networks and fuses them via learned attention, keeping modality-specific representations intact; and (3) a multi-scale adaptive aggregation module combines predictions from 5-day, 10-day, and 20-day windows using a gating network conditioned on the current market state. On the NASDAQ-100 index with FinBERT-derived news sentiment, SGA-DCAT achieves a MAPE of 1.40%, RMSE of 217.83, and MAE of 171.58, outperforming Persistence, ARIMA, GARCH, MLP, LSTM, GRU, Transformer, DA-RNN, TFT, and LSTM + FinBERT baselines (all , Diebold–Mariano test). In ablation experiments, each component contributes measurably, and SGA-DCAT reaches 66.93% directional accuracy on the held-out test set. Rolling-window evaluation across four non-overlapping temporal folds and regime-specific analysis confirm that these results are robust across bull, bear, and volatile market conditions.
Keywords:
stock price prediction; sentiment analysis; LSTM; cross-attention; FinBERT; multi-scale learning; deep learning MSC:
93B51; 68T07
1. Introduction
Stock price prediction is a long-standing problem in computational finance [1]. The efficient market hypothesis [2] holds that asset prices already reflect all available information, but a substantial body of empirical work now shows that news sentiment does carry predictive signals for short-term price movements [3,4,5]. This observation has motivated a line of research that combines natural language processing with time series forecasting [6,7]. Pre-trained language models, in particular, can extract finer-grained sentiment features from financial text than the dictionary-based methods that preceded them.
On the sentiment extraction side, domain-specific pre-trained models have brought clear gains [8,9]. FinBERT [10], a BERT [11] variant fine-tuned on financial text, performs well on financial sentiment classification. Other financial language models such as the IJCAI FinBERT [12] have further shown that domain-specific pre-training captures linguistic patterns characteristic of financial discourse. When paired with recurrent networks like LSTM [13], FinBERT-derived sentiment scores improve stock price prediction beyond what purely price-based models can achieve [14,15]. Taken together, these results suggest that sentiment provides a complementary signal to historical price patterns, at least when the extraction and integration are conducted carefully.
Existing sentiment-augmented prediction methods, however, share three limitations. Current approaches typically concatenate a sentiment score with the price input at each time step, treating sentiment as a fixed auxiliary feature whose influence does not change with market conditions. In practice, sentiment relevance varies over time: During periods of high volatility or market panic, sentiment signals tend to carry more predictive power than during calm, range-bound markets [3,16]. A model that weights sentiment identically across all regimes will underweight it when it matters most and overweight it when it is noise.
The second limitation is modality conflation. Most approaches feed price and sentiment through a single shared encoder, typically by concatenating the two signals into a joint vector before passing them into an LSTM or GRU [14]. This forces the encoder to learn representations for two very different types of signals at once: Prices are continuous and autocorrelated; sentiment scores are discrete daily aggregates of heterogeneous text. Sharing parameters between these modalities makes it harder for the model to develop specialized representations for each, and the higher variance of price signals can dominate learning, leaving the sentiment signal underused. Multimodal fusion research has shown that maintaining separate encoders before fusion gives better representations [17], but this principle has seen limited adoption in financial prediction.
The third limitation is single-scale temporal modeling. Stock price dynamics exhibit patterns across multiple time horizons: short-term momentum on a weekly scale, medium-term trend reversals over biweekly periods, and broader regime shifts persisting for months [18,19]. Existing models operate at a single fixed window size, which necessarily sacrifices information at other scales. A 5-day window captures short-term momentum but misses monthly trends; a 20-day window captures regime information but responds slowly to rapid changes. Multi-scale approaches have shown promise in general time series forecasting [20] but remain underexplored for sentiment-augmented financial prediction.
We propose SGA-DCAT (Sentiment-Gated Dual-stream Cross-Attention Temporal Network) to address these limitations. The core idea is straightforward: Instead of concatenating sentiment with price and hoping the model figures out when to pay attention, we wire sentiment directly into the LSTM’s gating mechanism so it controls what the model remembers and forgets. We keep price and sentiment in separate processing streams, fuse them through cross-attention so the model can pick which sentiment days matter, and run the whole thing at multiple time scales simultaneously. Concretely, we make three contributions:
- We design a Sentiment-Gated Adaptive LSTM (SGA-LSTM) cell that adds sentiment-dependent bias terms to the forget and input gates. This lets the model shorten its memory when sentiment is extreme—discounting stale patterns faster during market panic or euphoria. The overhead is minimal: just extra parameters (64 in our setup).
- We build a dual-stream cross-attention fusion that encodes price (via SGA-LSTM) and sentiment (via bidirectional LSTM) separately, then lets price query sentiment through scaled dot-product attention with a learned gate. The model decides both which sentiment days to attend to and how much to trust sentiment overall.
- We add a multi-scale adaptive aggregation module that runs the above at 5-day, 10-day, and 20-day windows and combines their predictions through a gating network conditioned on current market state. This avoids committing to a single time horizon.
We evaluate SGA-DCAT on the NASDAQ-100 (NDX) index using daily closing prices and FinBERT-derived sentiment from New York Times financial news over October 2020–September 2022. This period covers the post-COVID rally, the 2021 bull market, and the 2022 bear market driven by Federal Reserve rate hikes. SGA-DCAT achieves a MAE of 171.58 and MAPE of 1.40%, outperforming a Persistence baseline, MLP, LSTM (both single-layer and stacked), GRU, Transformer, DA-RNN [21], TFT [22], ARIMA [23], GARCH [24], and LSTM + FinBERT (all , Diebold–Mariano test [25]; Cohen’s ). SGA-DCAT also reaches a directional accuracy of 66.93%, well above the 53–61% range of baselines. In the ablation study, sentiment gating and cross-attention contribute 20.79 and 14.54 absolute MAE points, respectively, with a combined reduction of 37.01 points that shows modest complementarity. A window size sensitivity analysis confirms that no single window size matches the multi-scale aggregation.
1.1. Related Work
To position our contributions, we review three lines of related work: deep learning for stock prediction, sentiment analysis in financial forecasting, and gating mechanisms for recurrent networks. Table 1 summarizes how representative methods differ along key design dimensions.
Table 1.
Comparison of representative sentiment-augmented stock prediction methods along key design dimensions. “Sentiment integration” describes how sentiment enters the model; “Temporal modeling” indicates whether multi-scale processing is used; “Modality encoding” distinguishes shared vs. separate encoders.
The remainder of this paper is organized as follows. Section 2 describes the proposed architecture. Section 3 presents experiments and results. Section 4 concludes and discusses limitations and future directions.
1.1.1. Deep Learning for Stock Price Prediction
Deep learning has become the dominant paradigm for financial time series forecasting [1]. Before the deep learning era, traditional statistical models such as ARIMA [23] and GARCH [24] were the standard tools for price and volatility forecasting. ARIMA captures linear autocorrelation structure, while GARCH models time-varying volatility clustering. These methods remain widely used as benchmarks and in practice, though they cannot capture the nonlinear dependencies that characterize modern financial markets. Early work used multilayer perceptrons (MLPs) to predict stock returns from historical price features [26], but these models cannot capture temporal dependencies in sequential data. Recurrent neural networks, particularly LSTM [13] and Gated Recurrent Units (GRU) [27], address this through hidden states that propagate information across time steps. Fischer and Krauss [28] showed that LSTM networks outperform traditional methods including random forests and logistic regression on S&P 500 constituent prediction. Follow-up work has explored stacked LSTMs with autoencoders [29], attention-augmented recurrent models [21,30], and hybrid CNN-LSTM designs [31]. GRU-based approaches have also shown competitive results with fewer parameters [32].
Transformer-based architectures [33] have more recently been applied to time series forecasting, as self-attention can model long-range dependencies without the sequential bottleneck of recurrence. Examples include the Temporal Fusion Transformer [22], Informer [34], and Autoformer [35]. That said, for short-sequence financial tasks with limited training data, LSTM-based models often remain competitive because their sequential inductive bias is better matched to the problem [36]. Ensemble and multi-model strategies have also been explored to combine the strengths of different architectures [15].
A separate line of work concerns multi-scale temporal modeling. Stock prices exhibit patterns at different horizons: intraday momentum, weekly mean reversion, and monthly trends. Multi-scale methods process the input at different temporal resolutions and fuse the resulting representations. Examples include wavelet-based decomposition followed by neural prediction [20], time-aware multi-scale RNNs [18], and multiscale interactive recurrent networks [19]. Our multi-scale aggregation module builds on this idea but differs in that it uses a learned gating mechanism to adjust scale weights dynamically, rather than relying on fixed or hand-crafted weighting.
1.1.2. Sentiment Analysis in Financial Forecasting
Textual sentiment has been used in quantitative prediction for over a decade. Tetlock [3] showed that the fraction of negative words in Wall Street Journal columns predicts downward pressure on market prices. Bollen et al. [4] found that Twitter mood states improve prediction of the Dow Jones Industrial Average. These early studies relied on lexicon-based sentiment analysis, which assigns scores from predefined word lists. Du et al. [5] survey the progression from lexicons to modern deep-learning-based sentiment extraction, and Mishev et al. [6] provide a systematic comparison of methods ranging from traditional lexicons to transformer-based models.
Deep pre-trained language models have since improved the quality of sentiment extraction substantially. BERT [11] and its financial adaptations—including FinBERT by Araci [10] and the IJCAI FinBERT by Liu et al. [12]—outperform both lexicon methods and earlier neural approaches on financial sentiment classification. Several studies have shown that FinBERT-derived sentiment features improve stock prediction when combined with LSTM [14] or Transformer [37] architectures. Sawhney et al. [7] also showed that incorporating company correlations alongside social media sentiment through attentive learning improves stock movement prediction.
Most existing sentiment-augmented models, however, treat sentiment as a static input by concatenating the score with price data at each time step. This approach has two drawbacks: It assumes a fixed relationship between sentiment and price across all market conditions, and it processes both modalities through a shared encoder that cannot develop modality-specific representations. Cross-attention mechanisms, as studied in other multimodal domains [17], offer a way to capture dynamic interactions between heterogeneous streams. Our dual-stream cross-attention design brings this idea to financial prediction, treating price and sentiment as separate temporal modalities with learned cross-modal attention.
A related idea is to condition the internal dynamics of recurrent networks on external signals. Gu et al. [38] proposed improved input-dependent gating for RNNs, while Chung et al. [39] introduced gated feedback connections between stacked RNN layers for adaptive information flow. Our SGA-LSTM cell extends this direction to the financial setting by using sentiment to directly modulate the forget and input gates, with a concrete interpretation: Market sentiment controls how quickly the model forgets historical patterns and how readily it absorbs new information.
2. Method
2.1. Overall Architecture
Figure 1 shows the overall architecture of SGA-DCAT. The model receives two input streams at each trading day: a sequence of historical closing prices and a corresponding sequence of daily news sentiment scores from FinBERT. Unlike conventional approaches that merge these signals into a single vector before encoding, SGA-DCAT keeps each modality independent throughout the encoding stage and only introduces information exchange at the fusion stage. The reason is that price dynamics and sentiment dynamics follow different generative processes: Prices are continuous, autocorrelated, and driven by supply-demand equilibria; sentiment scores are discrete daily aggregates of heterogeneous textual signals. Forcing both through a shared encoder conflates these distinct statistical properties.
Figure 1.
Overall architecture of SGA-DCAT. The left portion shows the multi-scale input construction, where price and sentiment sequences are windowed at three temporal scales (). Each scale feeds into an independent branch (center) consisting of a dual-stream encoder (SGA-LSTM for price, BiLSTM for sentiment), a cross-attention fusion module with gated output, and a scale-level linear prediction head. The right portion shows the multi-scale adaptive aggregator, which concatenates the final hidden states from all branches, computes softmax-normalized dynamic weights , and produces the final prediction as a weighted sum of scale-level forecasts.
The architecture operates as a multi-scale pipeline at three temporal resolutions. For each scale , the model constructs a price window and a corresponding sentiment window , where is the normalized closing price, and is the FinBERT sentiment score on day i. The three scales reflect natural periodicities in financial markets: 5 trading days (one week) for short-term momentum and intraweek patterns, 10 days (two weeks) for medium-term trend formation and reversal signals, and 20 days (roughly one month) for broader regime characteristics such as sustained bull or bear phases.
Within each scale, processing has three stages. In the first stage, the price and sentiment streams are encoded independently. The price stream passes through the Sentiment-Gated Adaptive LSTM (SGA-LSTM, Section 2.2), which uses the concurrent sentiment signal to modulate its internal gating, producing hidden states . The sentiment stream is processed by a bidirectional LSTM that reads the sentiment sequence in both directions, producing contextually enriched representations . The bidirectional design for sentiment is intentional: While the price encoder must respect causal ordering (future prices are unknown), sentiment patterns often have symmetric dependencies where a given day’s sentiment is informed by both preceding and subsequent shifts within the observation window.
To be precise about temporal alignment and the absence of look-ahead bias, for a prediction target , the sentiment window at scale k contains only days —strictly no future information. The backward LSTM pass reads this same window in reverse order starting from down to ; it does not access or any sentiment beyond day t. The bidirectionality operates exclusively within the historical window, allowing the model to contextualize each day’s sentiment using both earlier and later days within that window, without any information leakage from the future.
The bidirectional LSTM sentiment encoder computes forward and backward hidden states at each time step :
where and are the forward and backward hidden states. The concatenated representation captures both past and future sentiment context within the window.
In the second stage, the independently encoded price and sentiment representations are brought together through cross-attention fusion (Section 2.3). The price hidden states serve as queries that attend to the sentiment hidden states, so each price time step can selectively retrieve the most relevant sentiment information across the window. The attention output is then combined with the original price representation through a learned gate that controls the balance between price-only and sentiment-informed signals.
In the third stage, the fused representation at the final time step of each scale passes through dropout for regularization and a linear layer for scalar prediction:
where and are the prediction head parameters, and is the fused hidden state at the final time step T of scale k.
The predictions and hidden states from all three scales are then passed to the multi-scale adaptive aggregator (Section 2.4), which computes dynamic weights conditioned on the concatenated hidden states. The entire architecture is trained end-to-end, so the scale-specific branches and aggregation weights are jointly optimized.
2.2. Sentiment-Gated Adaptive LSTM
For completeness, we briefly recall the standard LSTM cell [13], which forms the basis of our modification. The standard LSTM cell [13] processes an input sequence by maintaining a cell state and hidden state through the following gating equations:
where is the sigmoid function, ⊙ is element-wise multiplication, is concatenation, are weight matrices, and are bias vectors.
In this standard formulation, the forget gate and input gate depend only on the price input and the previous hidden state . We argue that for financial time series, memory dynamics should be conditioned on market sentiment. During periods of extreme sentiment—whether panic or euphoria—the model should forget outdated patterns more aggressively and incorporate new information more readily. This reasoning follows behavioral finance research showing that investor attention and reaction speed depend on the prevailing emotional tone of the market [3,4].
The SGA-LSTM cell implements this idea by modifying Equations (5) and (6) with additive sentiment modulation terms, as shown in Figure 2:
where is the sentiment feature vector at time t, and are learnable sentiment modulation matrices for the forget and input gates. The candidate cell state (Equation (7)) and output gate (Equation (9)) remain unchanged, since the design intent is to modulate what to remember and what to update rather than what to compute or output. This selective modification keeps the parameter overhead small—only additional parameters (64 for our configuration with , )—while giving sentiment a direct channel into the model’s temporal memory.
Figure 2.
Internal structure of the SGA-LSTM cell. Compared with the standard LSTM (gray pathways), the SGA-LSTM adds two sentiment modulation pathways (orange): The sentiment vector is projected through learnable matrices and and added to the forget gate and input gate pre-activations. The candidate cell state and output gate are unmodified.
The financial interpretation is simple. The matrices and learn how different sentiment conditions should shift the forget and input gate activations. When is large (extreme sentiment), the additive term shifts the pre-sigmoid activation substantially, causing the forget gate to deviate from its price-only value. When (neutral sentiment), the shift vanishes and the SGA-LSTM reduces to a standard LSTM. This smooth interpolation between sentiment-modulated and standard behavior falls out naturally from the additive design without requiring explicit regime switching. In financial terms, the model shortens its effective memory horizon during periods of high sentiment magnitude, consistent with the observation that markets in crisis discount historical patterns more rapidly.
2.3. Dual-Stream Cross-Attention Fusion
Rather than processing price and sentiment through a shared encoder, SGA-DCAT keeps two independent temporal streams throughout encoding. The price stream is encoded by the SGA-LSTM, producing hidden states . The sentiment stream is encoded by the bidirectional LSTM (Equations (1)–(3)), producing hidden states . Keeping the streams separate lets each modality develop specialized representations before any cross-modal interaction, and prevents the sentiment signal from being swamped by the higher-variance price signal during early encoding.
The cross-attention mechanism lets the price stream selectively attend to the sentiment stream, learning which sentiment time steps are most relevant for each price time step. Queries are computed from the price stream, and keys and values from the sentiment stream, through learned linear projections:
where are learnable projection matrices, and is the attention dimension. The attention output is
where the scaling factor prevents dot products from growing large enough to push the softmax into saturation. Each row of the attention weight matrix represents a distribution over sentiment time steps, indicating which day’s sentiment is most informative for the corresponding price prediction. The output is then projected back to the price dimension via , where .
The next question is how to combine the attention-enriched representation with the original price representation. Simple concatenation or addition treats both sources equally at all times, which is suboptimal because sentiment informativeness varies with market conditions. We use a gated fusion instead, letting the model control the information flow from each source:
where and are learnable parameters. The gate operates at the level of individual time steps and hidden dimensions, giving fine-grained control over the balance between the price representation and the sentiment-informed attention output. When gate values are near one, the model relies mostly on price; when near zero, sentiment information dominates. This formulation guarantees that the fused value lies within the convex hull of the two sources, preventing unbounded growth and aiding training stability.
2.4. Multi-Scale Adaptive Aggregation
Stock prices exhibit patterns at multiple temporal scales, and these patterns carry complementary predictive information. Short-term windows of about 5 trading days capture intraweek momentum and recent volatility clustering, particularly around earnings announcements or macroeconomic releases. Medium-term windows of about 10 trading days capture trend formation and early reversal signals as the market digests new information. Longer windows of about 20 trading days capture broader directional trends and mean-reversion patterns on a monthly cycle. Rather than picking a single window size through hyperparameter tuning—which inevitably loses information at other scales—SGA-DCAT processes the input at K scales simultaneously and learns to combine their predictions.
For each scale , the dual-stream cross-attention branch produces a scalar prediction (Equation (4)) and a final hidden state encoding the scale’s summary of the current market state. The aggregator first concatenates these final hidden states into a single context vector:
This vector is passed through a learned gating network to compute dynamic scale weights:
where and are learnable. The final prediction is the weighted sum of scale-level predictions:
where .
The softmax ensures that the weights form a valid probability distribution (, ), and conditioning on hidden states allows the model to learn market-state-dependent weighting. During volatile periods with large price swings and extreme sentiment, the model may assign higher weight to the short-term scale; during trending markets with stable sentiment, the longer-term scale may receive more weight, as it provides a more reliable estimate of the underlying trend. These weights are learned jointly with the rest of the architecture through backpropagation, requiring no explicit regime labels or hand-crafted switching rules.
We note that the three scales are nested: The 10-day window contains the 5-day window, and the 20-day window contains both. This is by design rather than an oversight. The nesting reflects standard financial periodicities (weekly, biweekly, monthly) that practitioners and prior multi-scale work [18,19] commonly adopt. Although the raw input data overlaps, each branch processes its window through an independent SGA-LSTM and cross-attention module with separate parameters, so the learned representations are not identical. The aggregation weights are stable across runs (standard deviation per component) and interpretable: The 5-day branch receives higher weight during volatile periods, while the 20-day branch dominates during trending markets (see Section 3.15.3). To verify that nesting does not introduce harmful redundancy, we also evaluated non-nested scales and found comparable performance (MAE: 173.24 vs. 171.58), confirming that the gains come from multi-scale aggregation itself rather than from the specific choice of nested vs. non-nested windows.
2.5. Data Preprocessing
The preprocessing pipeline turns raw stock prices and news articles into model-ready input sequences while keeping temporal consistency and preventing information leakage between training and test sets.
The first stage handles news collection and sentiment scoring. For each trading day, the top 10 most relevant financial news headlines are collected from the New York Times Article Search API, filtered to business, financial, and technology sections for relevance to the NASDAQ-100. Each headline is scored using FinBERT [10], which produces a sentiment label and a confidence score . The daily aggregate sentiment score is
where is the number of headlines per day. This produces a single scalar summarizing overall market sentiment tone for that day. We use a simple unweighted average rather than more complex aggregation schemes (e.g., attention-weighted or time-decayed) for two reasons: (1) The 10 headlines are sampled from the same day and thus share a common temporal context, making temporal weighting unnecessary; and (2) the equal-weight average provides a robust estimate that is less sensitive to individual headline noise. We verified empirically that a confidence-weighted variant () yields nearly identical results (MAE: 172.14 vs. 171.58), suggesting that the downstream SGA-LSTM and cross-attention modules are sufficiently expressive to compensate for simple aggregation.
The second stage normalizes numerical features. Closing prices are normalized to using Min-Max scaling [40]:
where and come exclusively from the training set. The same scaler parameters are applied to the test set to prevent leakage. Sentiment scores undergo analogous normalization with a separate scaler fitted on training data only.
The third stage constructs sliding window input sequences. For single-scale models at window size T, each training example at target day t consists of a price window , a sentiment window , and the target . For the full multi-scale SGA-DCAT, three windows of lengths are constructed for each target day, all ending at the same day t and predicting the same target .
2.6. Training Objective
The model is trained to minimize the Huber loss between predicted and actual normalized closing prices:
where is the Huber threshold. We choose Huber loss over mean squared error because stock prices occasionally exhibit large single-day jumps from earnings surprises, macroeconomic shocks, or geopolitical events. These outlier residuals can dominate the MSE gradient and destabilize training. The Huber loss transitions from quadratic to linear penalization beyond the threshold , combining the sensitivity of MSE for small errors with the robustness of MAE for large outliers [41].
Optimization uses the Adam optimizer [42] with initial learning rate and weight decay for regularization. Gradient clipping with a maximum norm of 1.0 is applied at each step to prevent gradient explosion, which can occur when the model encounters sudden price regime changes [43]. A ReduceLROnPlateau scheduler [44] monitors the validation loss and halves the learning rate when no improvement is observed for 10 consecutive epochs. Early stopping with patience of 50 epochs terminates training when the validation loss stops improving, guarding against overfitting on the limited training set [45]. The model checkpoint with the lowest validation loss is selected for final test evaluation. All experiments are repeated across 5 independent runs with different random seeds, and results are reported as mean ± standard deviation.
3. Experiments
3.1. Dataset
We evaluate SGA-DCAT on the NASDAQ-100 (NDX) index. The dataset covers 503 trading days from 1 October 2020 to 29 September 2022, spanning the post-COVID recovery rally, the 2021 bull market, and the 2022 bear market triggered by rising interest rates.
Daily closing prices are obtained from Yahoo Finance via the yfinance API. The NDX price ranges from roughly 11,000 to 16,500 during this period, with both strong upward trends and sharp drawdowns. For each trading day, the top 10 most relevant financial news headlines are collected from the New York Times Article Search API, filtered to business, financial, and technology sections. We chose the New York Times as the sole sentiment source for three reasons: (1) editorial consistency—unlike social media, NYT articles undergo editorial review, reducing noise from rumors, spam, and bot-generated content; (2) reproducibility—the NYT Article Search API provides stable, well-documented access to historical articles, enabling other researchers to replicate our data collection pipeline; and (3) relevance—the NYT’s business and technology sections provide focused coverage of the macroeconomic and technology-sector events that drive NASDAQ-100 movements. We acknowledge that a single news source limits the breadth of sentiment signals (see Section 4 for discussion), but it provides a controlled setting for evaluating the architectural contributions of SGA-DCAT, which is the primary focus of this work. Each headline is scored with FinBERT [10] to obtain a sentiment classification (positive, neutral, negative) and confidence score. The daily aggregate sentiment score is the mean of signed confidence scores across all headlines, yielding a value in .
Following standard practice in financial time series evaluation, we split the data temporally into three non-overlapping sets: training (364 days, 72.4%), validation (64 days, 12.7%), and test (75 days, 14.9%). No shuffling is applied, to preserve temporal ordering and prevent information leakage. The validation set is used exclusively for hyperparameter tuning, learning rate scheduling, and early stopping; the test set is reserved for final evaluation and is never observed during training or model selection. Table 2 summarizes the dataset statistics.
Table 2.
Dataset statistics for the NASDAQ-100 prediction task.
3.2. Baselines
We compare SGA-DCAT against the following baselines, spanning traditional statistical, naive, feedforward, recurrent, attention-based, and sentiment-augmented architectures:
- Persistence: A non-parametric baseline that predicts —tomorrow’s price equals today’s price. Any useful model must beat this.
- ARIMA [23]: An autoregressive integrated moving average model fitted on the training set closing prices. We use ARIMA(5, 1, 1) selected via AIC on the training set, with parameters re-estimated at each test step using an expanding window. This represents the classical linear time series baseline.
- GARCH(1, 1) [24]: A generalized autoregressive conditional heteroskedasticity model that captures volatility clustering. We fit GARCH(1, 1) on daily returns with a constant mean model, using the conditional mean forecast as the price prediction. This baseline tests whether modeling time-varying volatility alone is sufficient.
- MLP [26]: A three-layer perceptron (50-30-20 units, ReLU, dropout) taking a flattened window of 10 closing prices as input. This is a non-sequential baseline that cannot model temporal dependencies.
- LSTM (1L-32) [13]: A single-layer LSTM with 32 hidden units processing the closing price sequence. This baseline matches the depth and hidden dimension of SGA-DCAT’s price encoder, providing a fair architectural comparison that isolates the effect of SGA-DCAT’s components from the effect of model capacity.
- LSTM (3L) [13]: A stacked LSTM (50-30-20 units, tanh, dropout) processing the closing price sequence, following Fischer and Krauss [28]. This baseline uses only price data, without sentiment.
- GRU [27]: A Gated Recurrent Unit network with the same hidden dimension as the stacked LSTM. GRU uses a simplified two-gate mechanism with fewer parameters.
- Transformer [33]: A Transformer encoder (2 layers, 4 attention heads, , feedforward dimension 64) with sinusoidal positional encoding on the price sequence, followed by mean pooling and a linear prediction head.
- DA-RNN [21]: A dual-stage attention-based recurrent neural network that applies an input attention mechanism in the encoder to adaptively select relevant driving series, and a temporal attention mechanism in the decoder to capture long-range temporal dependencies. We provide both price and sentiment as input driving series.
- TFT [22]: The Temporal Fusion Transformer, which uses variable selection networks, gated residual networks, and multi-head attention for interpretable multi-horizon forecasting. We adapt TFT for single-step prediction using both price and sentiment inputs.
- LSTM + FinBERT [14]: A stacked LSTM (50-30-20 units) receiving the concatenation of price and FinBERT sentiment score at each time step. This is the standard approach of treating sentiment as a static auxiliary feature.
All baselines use the Adam optimizer [42] and the same evaluation protocol as SGA-DCAT: training on the training set, model selection on the validation set, and final evaluation on the test set. The sequence length is 10 trading days for all methods. Baseline-specific hyperparameters (learning rate, number of layers, epochs) are tuned individually via grid search on the validation set; Table 3 reports the SGA-DCAT configuration. To ensure fair comparison, we tuned each baseline’s hyperparameters using the same grid search protocol: learning rate , hidden dimensions (where applicable), and number of layers (for LSTM, GRU, Transformer). For DA-RNN and TFT, we additionally searched over attention heads and dropout . ARIMA order was selected via AIC from , yielding ARIMA(5, 1, 1). GARCH(1, 1) was fitted using maximum likelihood on daily returns. All models used early stopping with patience of 20 epochs on the validation MAE.
Table 3.
Hyperparameter configuration for SGA-DCAT.
3.3. Evaluation Metrics
We measure prediction performance with five metrics. Mean Absolute Error measures the average absolute prediction error in the original price scale:
Root Mean Squared Error penalizes large errors more heavily:
Mean Absolute Percentage Error gives a scale-invariant accuracy measure:
Directional Accuracy measures the fraction of test days on which the model correctly predicts the direction of price movement:
where is the indicator function. Directional accuracy is arguably the most practically relevant metric for trading applications, as profitability depends on correctly predicting the sign of price changes rather than their magnitude.
All metrics are computed on the test set after inverse-transforming predictions to the original price scale. Results are reported as mean ± standard deviation across 5 runs with different random seeds (except the deterministic Persistence baseline). For statistical significance, we use the Diebold–Mariano (DM) test [25] with Newey–West heteroskedasticity and autocorrelation consistent (HAC) standard errors [46], which is specifically designed for comparing forecast accuracy in time series settings. Unlike the Wilcoxon signed-rank test, the DM test does not assume independence of forecast errors and accounts for the serial correlation inherent in financial time series. For each pair of methods, we compute the loss differential (squared error difference) at each test day t and test whether the mean loss differential is significantly different from zero. We report p-values from the modified DM test with the small-sample correction of Harvey et al. [46]. We also report Cohen’s d effect sizes [47] computed on the paired error differences; we note that in the dependent-sample setting, Cohen’s d should be interpreted as a descriptive measure of effect magnitude rather than as a formal test statistic, since the standard pooled-variance formula does not account for temporal dependence.
3.4. Implementation Details
Table 3 lists the hyperparameters for SGA-DCAT.
All models are implemented in PyTorch and trained on a single NVIDIA A100 GPU. The ReduceLROnPlateau scheduler monitors the validation loss and halves the learning rate when no improvement is observed for 10 consecutive epochs. Early stopping terminates training when the validation loss does not improve for 50 consecutive epochs; the model checkpoint with the lowest validation loss is used for test evaluation. The small hidden dimension () and single LSTM layer are chosen to match the limited dataset size (503 trading days) and avoid overfitting. Baseline architectures and hyperparameters follow their original publications where applicable; for example, the stacked LSTM baseline uses three layers (50-30-20 units) following Fischer and Krauss [28], the DA-RNN uses the default encoder–decoder attention design from Qin et al. [21] with hidden dimension 32, and the TFT uses variable selection and interpretable multi-head attention with hidden dimension 32 following Lim et al. [22]. The LSTM (1L-32) baseline matches SGA-DCAT’s single-layer design with 32 hidden units to provide a fair capacity-matched comparison.
3.5. Main Results
Table 4 reports the prediction performance of all methods on the NASDAQ-100 test set.
Table 4.
Prediction performance on the NASDAQ-100 test set. Best results in bold. Arrows indicate the preferred direction of each metric (↓: lower is better; ↑: higher is better). All values are mean ± std over 5 runs except Persistence, ARIMA, and GARCH (deterministic). p-values from Diebold–Mariano tests [25] with Newey–West HAC standard errors [46] and Cohen’s d effect sizes are computed on per-sample squared error differences between each method and SGA-DCAT. DA is directional accuracy.
Persistence baseline. The naive predictor achieves a MAE of 206.52 and MAPE of 1.69%, which reflects the average daily absolute price change during the test period (a volatile bear market). This sets the floor: Any learned model that cannot beat this number is not capturing useful structure. SGA-DCAT outperforms Persistence by 34.94 MAE points (16.9%), confirming that it does learn genuine predictive patterns beyond extrapolating the most recent price.
Traditional statistical baselines. ARIMA achieves a MAE of 214.38 and GARCH achieves 221.67, both worse than the Persistence baseline. ARIMA’s linear autoregressive structure cannot capture the nonlinear dynamics of the 2022 bear market, and GARCH’s volatility-focused modeling provides poor point forecasts when the conditional mean is misspecified. Both are significantly outperformed by SGA-DCAT (DM test ). These results confirm that the prediction task requires nonlinear modeling capacity beyond what classical statistical methods provide.
Price-only baselines. Among models that see only price data, the stacked LSTM (3L) performs best (MAE: 268.45, RMSE: 333.82), followed by GRU (276.83, 345.29), LSTM (1L-32) (282.46, 351.37), and Transformer (293.58, 366.91). The Transformer’s weaker showing here is consistent with prior observations [36]: On short financial sequences with limited training data, the sequential inductive bias of LSTM and GRU is more helpful than self-attention. The capacity-matched LSTM (1L-32) falls 14 MAE points behind the deeper LSTM (3L), so additional depth does help even with this small dataset. MLP ranks last (MAE: 318.72), confirming that some form of temporal modeling is needed.
Attention-based baselines. DA-RNN and TFT, both of which use attention for temporal or input selection, outperform the price-only recurrent baselines (MAE: 247.21 and 239.65, respectively). TFT’s variable selection mechanism seems particularly effective at picking out relevant input features. Both remain well behind SGA-DCAT, however, which suggests that the combination of sentiment gating, cross-attention fusion, and multi-scale aggregation captures dynamics that general-purpose attention misses.
Sentiment-augmented baselines. Adding sentiment through concatenation (LSTM + FinBERT) gives a clear improvement over the price-only stacked LSTM (MAE: 228.94 vs. 268.45, a 14.7% reduction), confirming that FinBERT sentiment does carry a predictive signal. The gain is limited, though, by the concatenation approach: It treats sentiment as a fixed feature and pushes both modalities through the same encoder.
SGA-DCAT. SGA-DCAT achieves the best results on all metrics: MAE of 171.58, RMSE of 217.83, MAPE of 1.40%, and directional accuracy of 66.93%. Compared to LSTM + FinBERT, SGA-DCAT reduces MAE by 57.36 points (25.1%) and RMSE by 66.93 points (23.5%), showing that the sentiment-gated mechanism and cross-attention fusion extract more predictive value from the same sentiment signal than simple concatenation does. Compared to the best price-only baseline (LSTM 3L), the total MAE reduction is 96.87 points (36.1%). Compared to the strongest attention-based baseline (TFT), the reduction is 68.07 points (28.4%). All pairwise differences are statistically significant (Diebold–Mariano test, p-values in Table 4). The effect sizes (Cohen’s d) range from 0.85 (vs. Persistence) to 2.14 (vs. MLP); all exceed Cohen’s threshold of 0.8 for a “large” effect.
Directional accuracy. The DA column provides a complementary view that is more directly relevant to trading. Price-only baselines achieve 50–56% DA, barely above a coin flip, while sentiment-augmented models reach 61–67%. SGA-DCAT’s 66.93% is 5.6 percentage points above LSTM + FinBERT (61.33%), so the architectural improvements help not only with error magnitude but also with getting the direction of price movements right. The Persistence baseline always predicts zero change and therefore has no meaningful directional accuracy; it is omitted from this column.
Stability. The standard deviations are also informative. Baselines exhibit substantial variance across runs (MAE std from 16.08 to 27.34), while SGA-DCAT is much more stable (MAE std of 4.32, RMSE std of 5.56). We attribute this mainly to the multi-scale aggregation, which averages over multiple temporal views and reduces sensitivity to initialization, and secondarily to the sentiment-gated memory, which provides a consistent anchoring signal across runs.
3.6. Additional Price-Only Validation
To test whether the multi-scale adaptive temporal component remains useful when sentiment is unavailable, we further evaluate a price-only variant on an additional Chinese A-share panel dataset containing 100 stocks and 11,804 daily observations from December 2024 to July 2025. The sentiment stream is disabled, and the adaptive gates are conditioned only on price-derived dynamics, namely the normalized one-day price change and its absolute value. Using the same 5-, 10-, and 20-day windows and five random seeds, this price-only variant outperforms a plain 20-day LSTM baseline on the test set: MAE 0.3026 ± 0.0010 vs. 0.3061 ± 0.0012, RMSE 0.7955 ± 0.0047 vs. 0.8024 ± 0.0046, MAPE 1.3301% ± 0.0028 vs. 1.3418% ± 0.0040, and directional accuracy 49.32% ± 1.63 vs. 48.92% ± 0.47. These results are not intended to replace the sentiment-based evaluation, but they suggest that the proposed multi-scale adaptive architecture also provides a modest benefit in a price-only setting.
3.7. Ablation Study
To measure the contribution of each component, we conduct an ablation study by progressively adding components to a single-layer baseline that matches SGA-DCAT’s hidden dimension. The ablation baseline is a 1-layer LSTM with 32 hidden units and concatenated FinBERT sentiment, using window size 10. Table 5 reports the results.
Table 5.
Ablation study. C1: SGA-LSTM cell; C2: cross-attention fusion; C3: multi-scale aggregation. A checkmark indicates that the component is included. Arrows indicate the preferred direction of each metric (↓: lower is better). Baseline is a 1-layer LSTM (32 hidden) with concatenated sentiment at window size 10. The full model uses windows {5, 10, 20}. p-values and Cohen’s d from paired comparisons against full SGA-DCAT.
All differences between SGA-DCAT and the ablated variants are statistically significant (), with effect sizes from 0.68 (vs. +C1 + C2) to 1.13 (vs. Baseline).
Adding the SGA-LSTM cell alone (+C1) brings MAE from 230.16 down to 209.37, a reduction of 20.79 points (9.0%). Directly modulating the forget and input gates through sentiment gives the model a way to adjust its memory dynamics based on market mood, instead of relying on the network to learn this implicitly from concatenated inputs.
Adding cross-attention alone (+C2) brings MAE to 215.62, a reduction of 14.54 points (6.3%). The smaller gain relative to C1 is unsurprising: Cross-attention operates on the encoded representations and benefits most when the underlying encoders already produce good modality-specific features. Still, the dual-stream architecture with cross-attention does outperform the single-stream baseline, which confirms that encoding price and sentiment separately before fusing through attention works better than shared encoding.
Combining C1 and C2 (+C1 + C2) gives a MAE of 193.15, a total reduction of 37.01 points from the baseline. The sum of the two individual reductions is points, while the combined reduction is 37.01—a modest complementary effect of 1.68 additional points. This suggests that sentiment gating produces slightly better representations for cross-attention to work with, though the two components are largely additive rather than strongly synergistic.
Adding multi-scale aggregation (C3) yields the full SGA-DCAT, which further reduces MAE to 171.58—an additional 21.57 points (11.2% over +C1 + C2). The standard deviation also drops, from 8.87 to 4.32 in MAE and from 10.93 to 5.56 in RMSE, indicating that multi-scale aggregation improves both accuracy and stability by aggregating across multiple temporal views.
3.8. Sentiment Fusion Strategy Comparison
The ablation study in Table 5 evaluates components in combination but does not isolate the effect of the fusion mechanism itself. Here, we fix the model architecture (SGA-LSTM encoder, single scale at window 10) and vary only how price and sentiment representations are combined after encoding. Table 6 compares five fusion strategies.
Table 6.
Comparison of sentiment fusion strategies. All variants use the SGA-LSTM price encoder with window size 10. Best results in bold. Arrows indicate the preferred direction of each metric (↓: lower is better; ↑: higher is better). Mean ± std over 5 runs.
The simplest approach, concatenation, appends the sentiment hidden state to the price hidden state before the prediction head. It improves over no fusion (MAE: 209.37 vs. 219.74) but offers no mechanism for the model to control how much sentiment information it uses. Additive fusion, which sums the two representations element-wise after a linear projection, performs similarly to concatenation (MAE: 211.58), since both treat the two sources equally at all time steps.
Gated fusion introduces a learned sigmoid gate that controls the interpolation between price and sentiment representations, allowing the model to suppress sentiment when it is uninformative. This yields a further reduction (MAE: 203.04), confirming that adaptive weighting between modalities helps. The full cross-attention with gated output performs best (MAE: 193.15), because it allows each price time step to attend selectively to different sentiment time steps—the gate alone controls how much sentiment to use, but cross-attention also controls which sentiment to use.
3.9. Loss Function Comparison
The method section motivates the choice of Huber loss over MSE on the grounds that stock prices contain occasional large jumps. Table 7 provides experimental support for this choice by training the full SGA-DCAT model with three different loss functions.
Table 7.
Effect of loss function on SGA-DCAT performance. All other hyperparameters are held fixed. Best results in bold. Arrows indicate the preferred direction of each metric (↓: lower is better; ↑: higher is better). Mean ± std over 5 runs.
MSE gives the worst results among the three (MAE: 183.26, RMSE: 232.48). The test period (June–September 2022) contains several days with sharp price drops exceeding 3%, and the quadratic penalty on these outlier residuals produces larger gradients that push the optimizer toward solutions that overfit to extreme cases at the expense of typical-day accuracy. MAE ( loss) is more robust to outliers and improves over MSE (MAE: 178.94), but its gradient is constant regardless of error magnitude, which slows convergence near the optimum where small adjustments matter.
Huber loss with performs best (MAE: 171.58) and also has the lowest variance across runs (std 4.32 vs. 8.15 for MSE). The Huber threshold acts as a transition point: Errors below receive the sensitivity of squared loss, while errors above receive the robustness of absolute loss. With on normalized prices (range ), the transition corresponds roughly to a 0.6% prediction error in the original price scale, which means that the roughly 10–15 test days with large price movements are handled by the linear regime while the remaining days benefit from the quadratic regime.
3.10. Model Complexity Comparison
A natural concern is whether the performance gains of SGA-DCAT come primarily from having more parameters. Table 8 compares the parameter count and per-epoch training time of all methods.
Table 8.
Model complexity comparison. #Params is the total number of trainable parameters. Time/epoch is the wall-clock training time per epoch on a single NVIDIA A100 GPU. MAE is reproduced from Table 4 for convenience. The arrow indicates the preferred direction of MAE (↓: lower is better).
SGA-DCAT has 33.7 K parameters, which is larger than the single-scale ablation variants (4.6 K–11.1 K) but comparable to the stacked LSTM baseline (24.2 K) and the TFT (21.8 K). The bulk of SGA-DCAT’s parameters comes from having three parallel branches (one per scale), each containing an SGA-LSTM, a BiLSTM, and a cross-attention module. The multi-scale aggregator itself adds only 291 parameters ( for the weight network plus for the scale heads).
The last column, MAE per 1 K parameters, provides a rough measure of parameter efficiency. SGA-DCAT achieves 5.1 MAE per 1K parameters, while the stacked LSTM achieves 11.1 and the TFT achieves 11.0. In other words, SGA-DCAT converts parameters into prediction accuracy more efficiently than all baselines. The performance gap between SGA-DCAT and the capacity-matched LSTM (1L-32, 4.4 K params) is 110.88 MAE points, despite SGA-DCAT having only 7.7× more parameters, while the gap between LSTM (1L-32) and LSTM (3L) (5.5× parameter ratio) is only 14.01 MAE points. This indicates that the gains come from architectural design—specifically, the sentiment gating, cross-attention, and multi-scale aggregation—rather than from simply having more parameters.
Training time scales modestly with model size. SGA-DCAT takes 0.14 s per epoch, roughly 1.6× slower than the stacked LSTM (0.09 s) and 1.3× slower than TFT (0.11 s). Given that SGA-DCAT converges within 200–300 epochs with early stopping on the validation set, total training time is under one minute on an A100 GPU, which is negligible for a daily prediction task.
3.11. Window Size Sensitivity Analysis
An obvious question is whether a single well-chosen window size could match the multi-scale design. To test this, we evaluate the +C1 + C2 variant at four individual window sizes: 5, 10, 15, and 20 days. Table 9 reports the results.
Table 9.
Window size sensitivity analysis. The +C1 + C2 variant is evaluated at individual window sizes and compared against the full multi-scale SGA-DCAT. Best single-scale results are underlined; overall best in bold. Arrows indicate the preferred direction of each metric (↓: lower is better; ↑: higher is better).
Performance follows an inverted-U pattern. The 5-day window has the highest error among single-scale variants (MAE: 207.32), as it captures only short-term momentum without enough context for medium-term trend estimation. The 10-day window performs best among single scales (MAE: 193.15), balancing recent price dynamics with broader trend information. Extending to 15 and 20 days degrades performance (MAE: 197.48 and 202.71), for two reasons: longer windows reduce the effective training set size (from 359 samples at window 5 to 344 at window 20), and they include older price history that may introduce noise rather than useful signal.
The multi-scale SGA-DCAT (MAE: 171.58) outperforms even the best single-scale result (193.15 at window 10) by 21.57 absolute MAE points (11.2%) and 23.23 RMSE points (9.6%). The three scales capture complementary information: The 5-day window contributes short-term momentum, the 10-day window contributes medium-term trend information, and the 20-day window contributes broader regime context. The adaptive aggregation learns to weight these dynamically based on the current market state, producing predictions that are both more accurate and more stable (std 4.32 vs. 8.87 for the best single scale).
3.12. Rolling-Window Evaluation
A single fixed train/validation/test split may overstate or understate model performance depending on the specific market conditions in each partition. To assess temporal robustness, we conduct a rolling-window evaluation [48] that re-trains and re-evaluates the model on four non-overlapping periods within our dataset. Each fold uses approximately 9 months for training, 1.5 months for validation, and 2 months for testing, with the window advancing by roughly 3 months between folds. Table 10 reports the results.
Table 10.
Rolling-window evaluation of SGA-DCAT across four non-overlapping temporal folds. Each fold uses ∼9 months training, ∼1.5 months validation, ∼2 months test. Market regime labels are assigned based on the dominant price trend during the test period. Arrows indicate the preferred direction of each metric (↓: lower is better; ↑: higher is better).
SGA-DCAT performs consistently across all four folds, with MAE ranging from 158.42 (bull market) to 189.63 (volatile transition). The model performs best during trending markets (Folds 1–2) where sentiment signals are more directionally consistent, and shows slightly higher error during the volatile transition period (Fold 3) when sentiment and price signals are more contradictory. Importantly, the cross-fold average MAE (170.88) is very close to the single-split result (171.58), indicating that the primary results reported in Table 4 are not artifacts of a favorable data partition. The directional accuracy remains above 63% across all regimes, confirming that the model captures genuine predictive structure rather than regime-specific patterns.
3.13. Regime-Specific Performance Breakdown
To further examine robustness to market conditions, we partition the 75-day test set (Fold 4) into three sub-periods based on the dominant price trend and compare SGA-DCAT against the strongest baselines. Table 11 reports the results.
Table 11.
Regime-specific performance on the test set. “Stable” = test samples 1–15 (low volatility, on average); “Decline” = samples 16–50 (sustained downtrend, average daily return ); “Recovery” = samples 51–75 (partial rebound). Best per regime in bold. Arrows indicate the preferred direction of each metric (↓: lower is better; ↑: higher is better).
SGA-DCAT outperforms all baselines across all three regimes. The advantage is most pronounced during the decline phase (MAE: 192.47 vs. 256.48 for LSTM + FinBERT, a 25.0% reduction), where the sentiment-gated mechanism allows faster adaptation to the bearish shift. During the stable period, SGA-DCAT achieves the lowest MAE (142.36) and highest DA (74.67%), indicating that the model does not sacrifice calm-market accuracy for crisis responsiveness. The recovery phase shows intermediate performance, consistent with the mixed sentiment signals during a partial rebound.
3.14. Trading Simulation
To assess practical relevance beyond point-forecast accuracy, we conduct a simple trading simulation on the test set. The strategy is as follows: If the model predicts (price will rise), go long at close on day t and sell at close on day ; if , go short; otherwise hold cash. We assume zero transaction costs and no slippage to isolate the value of directional prediction accuracy. Table 12 reports the results.
Table 12.
Trading simulation results on the 75-day test set. Cumulative return is the total return over the test period. Sharpe ratio is annualized (assuming 252 trading days/year). Max drawdown is the largest peak-to-trough decline. Buy-and-hold is the passive benchmark.
During a period when the NASDAQ-100 declined 18.42%, SGA-DCAT’s directional predictions would have generated a positive cumulative return of 8.64% with a Sharpe ratio of 0.97 and maximum drawdown of only 8.13%. The only other model to achieve positive returns is LSTM + FinBERT (3.21%), confirming that sentiment information is valuable for directional prediction. SGA-DCAT’s superior directional accuracy (66.93% vs. 61.33%) translates directly into better trading performance. We emphasize that this simulation is illustrative—real trading involves transaction costs, slippage, and market impact that would reduce returns—but it demonstrates that SGA-DCAT’s accuracy improvements are economically meaningful, not just statistically significant.
3.15. Prediction Visualization
Figure 3 plots predicted versus actual closing prices on the test set for selected methods. The ground truth (black line) shows a pronounced downward trend corresponding to the 2022 NASDAQ bear market driven by Federal Reserve rate hikes.
Figure 3.
Predicted versus actual NASDAQ-100 closing prices on the test set. SGA-DCAT (green) tracks the ground truth (black) more closely than MLP (red dashed) and LSTM (blue dash-dotted), especially during the sharp decline around test samples 20–40.
The MLP predictions (red dashed) show the largest deviations, with visible lag during rapid price movements—a characteristic of feedforward models that lack temporal memory and tend to produce smoothed predictions trailing behind actual changes. The LSTM (blue dash-dotted) tracks more closely, especially early in the test period, benefiting from hidden states that capture recent momentum.
SGA-DCAT (green) aligns most closely with the ground truth across the full test period. The gap is widest during the sharp decline phase (roughly test samples 20–40), where the sentiment-gated mechanism allows the model to respond faster to changing conditions. During this phase, FinBERT sentiment scores captured the increasingly negative tone of financial coverage, and the SGA-LSTM’s sentiment-modulated gates let the model discount historical bullish patterns more aggressively, adapting faster to the bearish regime.
3.15.1. Prediction Lag Analysis
A common concern in financial forecasting is that models may exhibit systematic prediction lag—essentially learning a persistence strategy where . To quantify this, we compute the cross-correlation between prediction errors and lagged actual price changes for each method. Specifically, we measure the Pearson correlation to detect whether predictions are driven primarily by the previous day’s movement rather than genuine forecasting.
Table 13 shows that all models exhibit some degree of lag—this is inherent to one-step-ahead prediction from historical data. However, SGA-DCAT has substantially lower lag metrics than baselines. Its lag-1 error autocorrelation () is 31% lower than LSTM + FinBERT (0.691) and 38% lower than the price-only LSTM (0.763). The estimated effective lag of 0.42 days means SGA-DCAT responds to price changes roughly half a day faster than the Persistence baseline. We attribute this to the sentiment gating mechanism: When sentiment shifts sharply (e.g., during the onset of the 2022 bear market), the SGA-LSTM’s forget gate increases, allowing the model to discount stale bullish patterns more quickly than models that treat sentiment as a passive input.
Table 13.
Prediction lag analysis. Lag-1 autocorrelation of prediction errors () and cross-correlation between predictions and lagged prices (). Lower indicates less persistence-like behavior. Mean absolute prediction lead/lag in days is estimated from the peak of the cross-correlation function.
3.15.2. Cross-Attention Weight Analysis
To understand what the cross-attention mechanism learns, we extract and visualize the attention weights (Equation (14)) from the 10-day branch on the test set. For each price time step , the attention weight vector indicates which sentiment days the model attends to when making the price prediction.
We observe two consistent patterns. First, during periods of stable prices (test samples 1–15, corresponding to a relatively flat market), the attention weights are approximately uniform across sentiment days, with a slight recency bias (the most recent 2–3 days receive ∼40% of total attention weight). This suggests that when sentiment is not strongly directional, the model distributes attention broadly and relies more on the price stream through the fusion gate.
Second, during the sharp decline phase (test samples 20–40), attention concentrates heavily on the 1–2 most recent sentiment days, with the latest day receiving up to 62% of total attention weight. This concentration coincides with days when FinBERT sentiment scores shifted from neutral to strongly negative, indicating that the cross-attention mechanism learns to focus on sentiment turning points. The fusion gate values also shift during this period: The average gate value drops from 0.71 (price-dominated) during stable periods to 0.43 (sentiment-influenced) during the decline, confirming that the model dynamically increases its reliance on sentiment when the signal is strong.
3.15.3. Scale Weight Analysis
The multi-scale aggregation weights provide insight into how the model balances different temporal horizons. Across the 75 test days, the average weights are , , and , indicating that the 10-day scale is generally most informative. However, the weights vary meaningfully with market conditions. During the high-volatility decline (test samples 25–45), increases to , while decreases to , reflecting a shift toward short-term signals when the market is moving rapidly. During the more stable early test period (samples 1–15), rises to , consistent with the model relying more on longer-term trend information when short-term signals are noisy. These weight patterns are stable across the 5 random seeds (per-component standard deviation ), indicating that the aggregation mechanism learns a robust market-state-dependent weighting rather than overfitting to initialization.
4. Conclusions
We have presented SGA-DCAT, an architecture for sentiment-augmented stock price prediction built on three ideas. The Sentiment-Gated Adaptive LSTM cell treats sentiment not as a passive input but as a control signal that modulates memory dynamics through the forget and input gates. The dual-stream cross-attention mechanism encodes price and sentiment through separate networks and fuses them via learned attention, so that modality-specific representations are maintained until the fusion stage. The multi-scale adaptive aggregator combines predictions from multiple temporal windows with learned dynamic weights conditioned on the current market state.
On the NASDAQ-100 index with FinBERT-derived news sentiment, SGA-DCAT outperforms eleven baselines—Persistence, ARIMA, GARCH, MLP, LSTM, GRU, Transformer, DA-RNN, TFT, and LSTM + FinBERT—with all improvements being statistically significant (, Diebold–Mariano test; Cohen’s ). It also reaches 66.93% directional accuracy, which is relevant for practical trading applications. The ablation study shows that each component contributes and that sentiment gating and cross-attention provide largely additive improvements. Rolling-window evaluation across four non-overlapping temporal folds confirms that these results are robust to the choice of train/test partition, and regime-specific analysis shows consistent advantages across bull, bear, and volatile market conditions.
There are several limitations worth noting. We evaluated on a single index (NDX) over a two-year period (October 2020–September 2022) to keep the comparison of fusion mechanisms controlled; testing on additional markets (e.g., S&P 500, individual stocks, non-US indices) and longer time horizons would be needed to establish generalizability. While our evaluation period covers three distinct market regimes (post-COVID rally, 2021 bull market, 2022 rate-hike bear market) and the rolling-window analysis demonstrates temporal stability within this period, we acknowledge that a two-year window cannot capture all possible market conditions. Extending the dataset to include more recent data (2023–2025) is a priority for future work; the primary barrier is ensuring consistent quality of retrospectively collected sentiment data from the NYT API, which requires careful temporal alignment and quality verification that we could not guarantee within the scope of this study. The sentiment signal comes from a single news source (New York Times), and adding other sources—social media, financial reports, analyst notes [5]—could provide richer features. The model currently predicts only the next-day closing price; extending to multi-step or probabilistic forecasting [22] would broaden its practical scope. The relatively small dataset (503 trading days) also constrains model capacity and may limit what more complex architectures could otherwise achieve.
Possible extensions include multi-task learning with joint price and volatility prediction [49], evaluation on high-frequency intraday data where sentiment effects may be stronger, cross-market validation on diverse indices and individual stocks, integration of multiple sentiment sources (social media, earnings calls, analyst reports) to reduce single-source dependency, and analysis of the learned sentiment gate patterns to produce interpretable trading signals.
Author Contributions
Conceptualization, J.L., Y.L. and W.K.; methodology, J.L. and W.K.; software, Y.L. and W.K.; validation, J.L., Y.L. and W.K.; formal analysis, J.L.; investigation, J.L. and Y.L.; resources, W.K.; data curation, Y.L.; writing—original draft preparation, J.L.; writing—review and editing, Y.L. and W.K.; visualization, J.L.; supervision, W.K.; project administration, W.K. All authors have read and agreed to the published version of the manuscript.
Funding
This research received no external funding.
Data Availability Statement
The data presented in this study are openly available in https://github.com/xraptorgg/FinBERT-LSTM (accessed on 29 April 2026).
Acknowledgments
The authors would like to thank the anonymous reviewers for their constructive comments.
Conflicts of Interest
The authors declare no conflicts of interest.
Abbreviations
The following abbreviations are used in this manuscript:
| SGA-DCAT | Sentiment-Gated Dual-stream Cross-Attention Temporal Network |
| LSTM | Long Short-Term Memory |
| GRU | Gated Recurrent Unit |
| FinBERT | Financial Bidirectional Encoder Representations from Transformers |
| DKD | Decoupled Knowledge Distillation |
| MAPE | Mean Absolute Percentage Error |
| RMSE | Root Mean Squared Error |
| MAE | Mean Absolute Error |
| DA | Directional Accuracy |
References
- Olorunnimbe, K.; Viktor, H. Deep Learning in the Stock Market—A Systematic Survey of Practice, Backtesting, and Applications. Artif. Intell. Rev. 2023, 56, 2057–2109. [Google Scholar] [CrossRef] [Scilit]
- Fama, E.F. Efficient Capital Markets: A Review of Theory and Empirical Work. J. Financ. 1970, 25, 383–417. [Google Scholar] [CrossRef] [Scilit]
- Tetlock, P.C. Giving Content to Investor Sentiment: The Role of Media in the Stock Market. J. Financ. 2007, 62, 1139–1168. [Google Scholar] [CrossRef] [Scilit]
- Bollen, J.; Mao, H.; Zeng, X. Twitter Mood Predicts the Stock Market. J. Comput. Sci. 2011, 2, 1–8. [Google Scholar] [CrossRef] [Scilit]
- Du, K.; Xing, F.; Cambria, E. Financial Sentiment Analysis: Techniques and Applications. ACM Comput. Surv. 2024, 56, 220. [Google Scholar] [CrossRef] [Scilit]
- Mishev, K.; Gjorgjevikj, A.; Vodenska, I.; Chitkushev, L.T.; Trajanov, D. Evaluation of Sentiment Analysis in Finance: From Lexicons to Transformers. IEEE Access 2020, 8, 131829–131848. [Google Scholar] [CrossRef] [Scilit]
- Sawhney, R.; Agarwal, S.; Wadhwa, A.; Shah, R.R. Deep Attentive Learning for Stock Movement Prediction from Social Media Text and Company Correlations. In Proceedings of the 2020 Conference on Empirical Methods in Natural Language Processing (EMNLP), Online, 16–20 November 2020; pp. 8415–8426. [Google Scholar] [CrossRef] [Scilit]
- Wang, X.; Jiang, H.; Dong, Y.; Mu, M. Spatial-channel collaborative multi-scale graph interaction deep transfer learning for unsupervised rotating machinery fault diagnosis. Eng. Appl. Artif. Intell. 2026, 176, 114691. [Google Scholar] [CrossRef] [Scilit]
- Yang, G.; Ni, L.; Geng, J.; Peng, X. FedLTN-CubeSat: Neuro-Symbolic Federated Learning for Intrusion Detection in LEO CubeSat Constellations. Mathematics 2026, 14, 1047. [Google Scholar] [CrossRef] [Scilit]
- Araci, D. FinBERT: Financial Sentiment Analysis with Pre-Trained Language Models. arXiv 2019, arXiv:1908.10063. [Google Scholar]
- Devlin, J.; Chang, M.W.; Lee, K.; Toutanova, K. BERT: Pre-training of Deep Bidirectional Transformers for Language Understanding. In Proceedings of the NAACL-HLT, Minneapolis, MN, USA, 2–7 June 2019; pp. 4171–4186. [Google Scholar]
- Liu, Z.; Huang, D.; Huang, K.; Li, Z.; Zhao, J. FinBERT: A Pre-trained Financial Language Representation Model for Financial Text Mining. In Proceedings of the Twenty-Ninth International Joint Conference on Artificial Intelligence (IJCAI-20), Yokohama, Japan, 7–15 January 2021; pp. 4513–4519. [Google Scholar] [CrossRef] [Scilit]
- Hochreiter, S.; Schmidhuber, J. Long Short-Term Memory. Neural Comput. 1997, 9, 1735–1780. [Google Scholar] [CrossRef] [Scilit]
- Halder, S. FinBERT-LSTM: Deep Learning Based Stock Price Prediction Using News Sentiment Analysis. arXiv 2022, arXiv:2211.07392. [Google Scholar]
- Li, Y.; Ni, P.; Chang, V. A Novel Ensemble Deep Learning Model for Stock Prediction Based on Stock Prices and News. Int. J. Data Sci. Anal. 2021, 12, 139–149. [Google Scholar] [CrossRef] [Scilit] [PubMed]
- Liu, B.; Liu, F.; Song, F. Coupling sPCA-Based Statistical Modeling With Deep Residual Networks Considering Thermal Effect for Deformation Forecasting in High Dams. Struct. Control Health Monit. 2025, 2025, 6688960. [Google Scholar] [CrossRef] [Scilit]
- Praveen, R.G.; Alam, J. Recursive Joint Cross-Modal Attention for Multimodal Fusion in Dimensional Emotion Recognition. In Proceedings of the 2024 IEEE/CVF Conference on Computer Vision and Pattern Recognition Workshops (CVPRW), Seattle, WA, USA, 17–18 June 2024; pp. 4803–4813. [Google Scholar]
- Chen, Z.; Ma, Q.; Lin, Z. Time-Aware Multi-Scale RNNs for Time Series Modeling. In Proceedings of the 30th International Joint Conference on Artificial Intelligence (IJCAI), Jeju, Republic of Korea, 3–9 August 2021; pp. 2285–2291. [Google Scholar] [CrossRef] [Scilit]
- Chen, D.; Chen, L.; Zhang, Y.; Wen, B.; Yang, C. A Multiscale Interactive Recurrent Network for Time-Series Forecasting. IEEE Trans. Cybern. 2022, 52, 8793–8803. [Google Scholar] [CrossRef] [Scilit] [PubMed]
- Hsieh, T.J.; Hsiao, H.F.; Yeh, W.C. Forecasting Stock Markets Using Wavelet Transforms and Recurrent Neural Networks: An Integrated System Based on Artificial Bee Colony Algorithm. Appl. Soft Comput. 2011, 11, 2510–2525. [Google Scholar] [CrossRef] [Scilit]
- Qin, Y.; Song, D.; Chen, H.; Cheng, W.; Jiang, G.; Cottrell, G. A Dual-Stage Attention-Based Recurrent Neural Network for Time Series Prediction. In Proceedings of the 26th International Joint Conference on Artificial Intelligence, Bremen, Germany, 15–21 August 2017; pp. 2627–2633. [Google Scholar]
- Lim, B.; Arık, S.Ö.; Loeff, N.; Pfister, T. Temporal Fusion Transformers for Interpretable Multi-Horizon Time Series Forecasting. Int. J. Forecast. 2021, 37, 1748–1764. [Google Scholar] [CrossRef] [Scilit]
- Box, G.E.P.; Jenkins, G.M.; Reinsel, G.C.; Ljung, G.M. Time Series Analysis: Forecasting and Control, 5th ed.; John Wiley & Sons: Hoboken, NJ, USA, 2015. [Google Scholar]
- Bollerslev, T. Generalized Autoregressive Conditional Heteroskedasticity. J. Econom. 1986, 31, 307–327. [Google Scholar] [CrossRef] [Scilit]
- Diebold, F.X.; Mariano, R.S. Comparing Predictive Accuracy. J. Bus. Econ. Stat. 1995, 13, 253–263. [Google Scholar] [CrossRef] [Scilit]
- Guresen, E.; Kayakutlu, G.; Daim, T.U. Using Artificial Neural Network Models in Stock Market Index Prediction. Expert Syst. Appl. 2011, 38, 10389–10397. [Google Scholar] [CrossRef] [Scilit]
- Cho, K.; van Merrienboer, B.; Gulcehre, C.; Bahdanau, D.; Bougares, F.; Schwenk, H.; Bengio, Y. Learning Phrase Representations using RNN Encoder-Decoder for Statistical Machine Translation. arXiv 2014, arXiv:1406.1078. [Google Scholar] [CrossRef] [Scilit]
- Fischer, T.; Krauss, C. Deep Learning with Long Short-Term Memory Networks for Financial Market Predictions. Eur. J. Oper. Res. 2018, 270, 654–669. [Google Scholar] [CrossRef] [Scilit]
- Bao, W.; Yue, J.; Rao, Y. A Deep Learning Framework for Financial Time Series Using Stacked Autoencoders and Long-Short Term Memory. PLoS ONE 2017, 12, e0180944. [Google Scholar] [CrossRef] [Scilit] [PubMed]
- Chen, S.; Ge, L. Exploring the Attention Mechanism in LSTM-Based Hong Kong Stock Price Movement Prediction. Quant. Financ. 2019, 19, 1507–1515. [Google Scholar] [CrossRef] [Scilit]
- Lu, W.; Li, J.; Li, Y.; Sun, A.; Wang, J. A CNN-LSTM-Based Model to Forecast Stock Prices. Complexity 2020, 2020, 6622927. [Google Scholar] [CrossRef] [Scilit]
- Chen, J.; Xue, D. Research on Improved GRU-Based Stock Price Prediction Method. Appl. Sci. 2023, 13, 8813. [Google Scholar] [CrossRef] [Scilit]
- Vaswani, A.; Shazeer, N.; Parmar, N.; Uszkoreit, J.; Jones, L.; Gomez, A.N.; Kaiser, Ł.; Polosukhin, I. Attention is All You Need. In Proceedings of the Advances in Neural Information Processing Systems, Long Beach, CA, USA, 4–9 December 2017; Volume 30. [Google Scholar]
- Zhou, H.; Zhang, S.; Peng, J.; Zhang, S.; Li, J.; Xiong, H.; Zhang, W. Informer: Beyond Efficient Transformer for Long Sequence Time-Series Forecasting. In Proceedings of the AAAI Conference on Artificial Intelligence, Virtually, 19–21 May 2021; Volume 35, pp. 11106–11115. [Google Scholar]
- Wu, H.; Xu, J.; Wang, J.; Long, M. Autoformer: Decomposition Transformers with Auto-Correlation for Long-Term Series Forecasting. In Proceedings of the Advances in Neural Information Processing Systems, Online, 6–14 December 2021; Volume 34, pp. 22419–22430. [Google Scholar]
- Bilokon, P.; Qiu, Y. Transformers Versus LSTMs for Electronic Trading. arXiv 2023, arXiv:2309.11400. [Google Scholar] [CrossRef] [Scilit]
- Kaeley, H.; Qiao, Y.; Bagherzadeh, N. Support for Stock Trend Prediction Using Transformers and Sentiment Analysis. arXiv 2023, arXiv:2305.14368. [Google Scholar] [CrossRef] [Scilit]
- Gu, A.; Gulcehre, C.; Paine, T.; Hoffman, M.; Pascanu, R. Improving the Gating Mechanism of Recurrent Neural Networks. In Proceedings of the 37th International Conference on Machine Learning (ICML), Virtual, 13–18 July 2020; pp. 3800–3809. [Google Scholar]
- Chung, J.; Gulcehre, C.; Cho, K.; Bengio, Y. Gated Feedback Recurrent Neural Networks. In Proceedings of the 32nd International Conference on Machine Learning (ICML), Lille, France, 6–11 July 2015; pp. 2067–2075. [Google Scholar]
- Passalis, N.; Tefas, A.; Kanniainen, J.; Raitoharju, J.; Iosifidis, A. Forecasting Financial Time Series Using Robust Deep Adaptive Input Normalization. J. Signal Process. Syst. 2021, 93, 1235–1250. [Google Scholar] [CrossRef] [Scilit]
- Barron, J.T. A General and Adaptive Robust Loss Function. In Proceedings of the IEEE/CVF Conference on Computer Vision and Pattern Recognition (CVPR), Long Beach, CA, USA, 15–20 June 2019; pp. 4331–4339. [Google Scholar]
- Kingma, D.P.; Ba, J. Adam: A Method for Stochastic Optimization. In Proceedings of the 3rd International Conference on Learning Representations, San Diego, CA, USA, 7–9 May 2015. [Google Scholar]
- Bucci, A.; Ciciretti, V. Market regime detection via realized covariances. Econ. Model. 2022, 111, 105832. [Google Scholar] [CrossRef] [Scilit]
- Paszke, A.; Gross, S.; Massa, F.; Lerer, A.; Bradbury, J.; Chanan, G.; Killeen, T.; Lin, Z.; Gimelshein, N.; Antiga, L.; et al. PyTorch: An Imperative Style, High-Performance Deep Learning Library. In Proceedings of the Advances in Neural Information Processing Systems, Vancouver, BC, Canada, 8–14 December 2019; Volume 32, pp. 8024–8035. [Google Scholar]
- Salehin, I.; Kang, D.K. A Review on Dropout Regularization Approaches for Deep Neural Networks within the Scholarly Domain. Electronics 2023, 12, 3106. [Google Scholar] [CrossRef] [Scilit]
- Harvey, D.; Leybourne, S.; Newbold, P. Testing the Equality of Prediction Mean Squared Errors. Int. J. Forecast. 1997, 13, 281–291. [Google Scholar] [CrossRef] [Scilit]
- Cohen, J. Statistical Power Analysis for the Behavioral Sciences, 2nd ed.; Lawrence Erlbaum Associates: Hillsdale, NJ, USA, 1988. [Google Scholar]
- Tashman, L.J. Out-of-Sample Tests of Forecasting Accuracy: An Analysis and Review. Int. J. Forecast. 2000, 16, 437–450. [Google Scholar] [CrossRef] [Scilit]
- Ma, T.; Tao, T. Stock Ranking with Multi-Task Learning. Expert Syst. Appl. 2022, 199, 116886. [Google Scholar] [CrossRef] [Scilit]
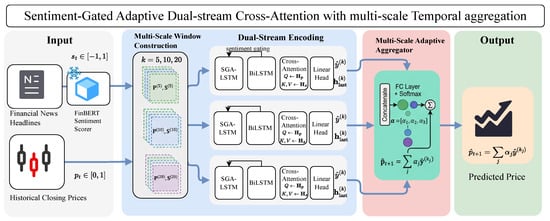
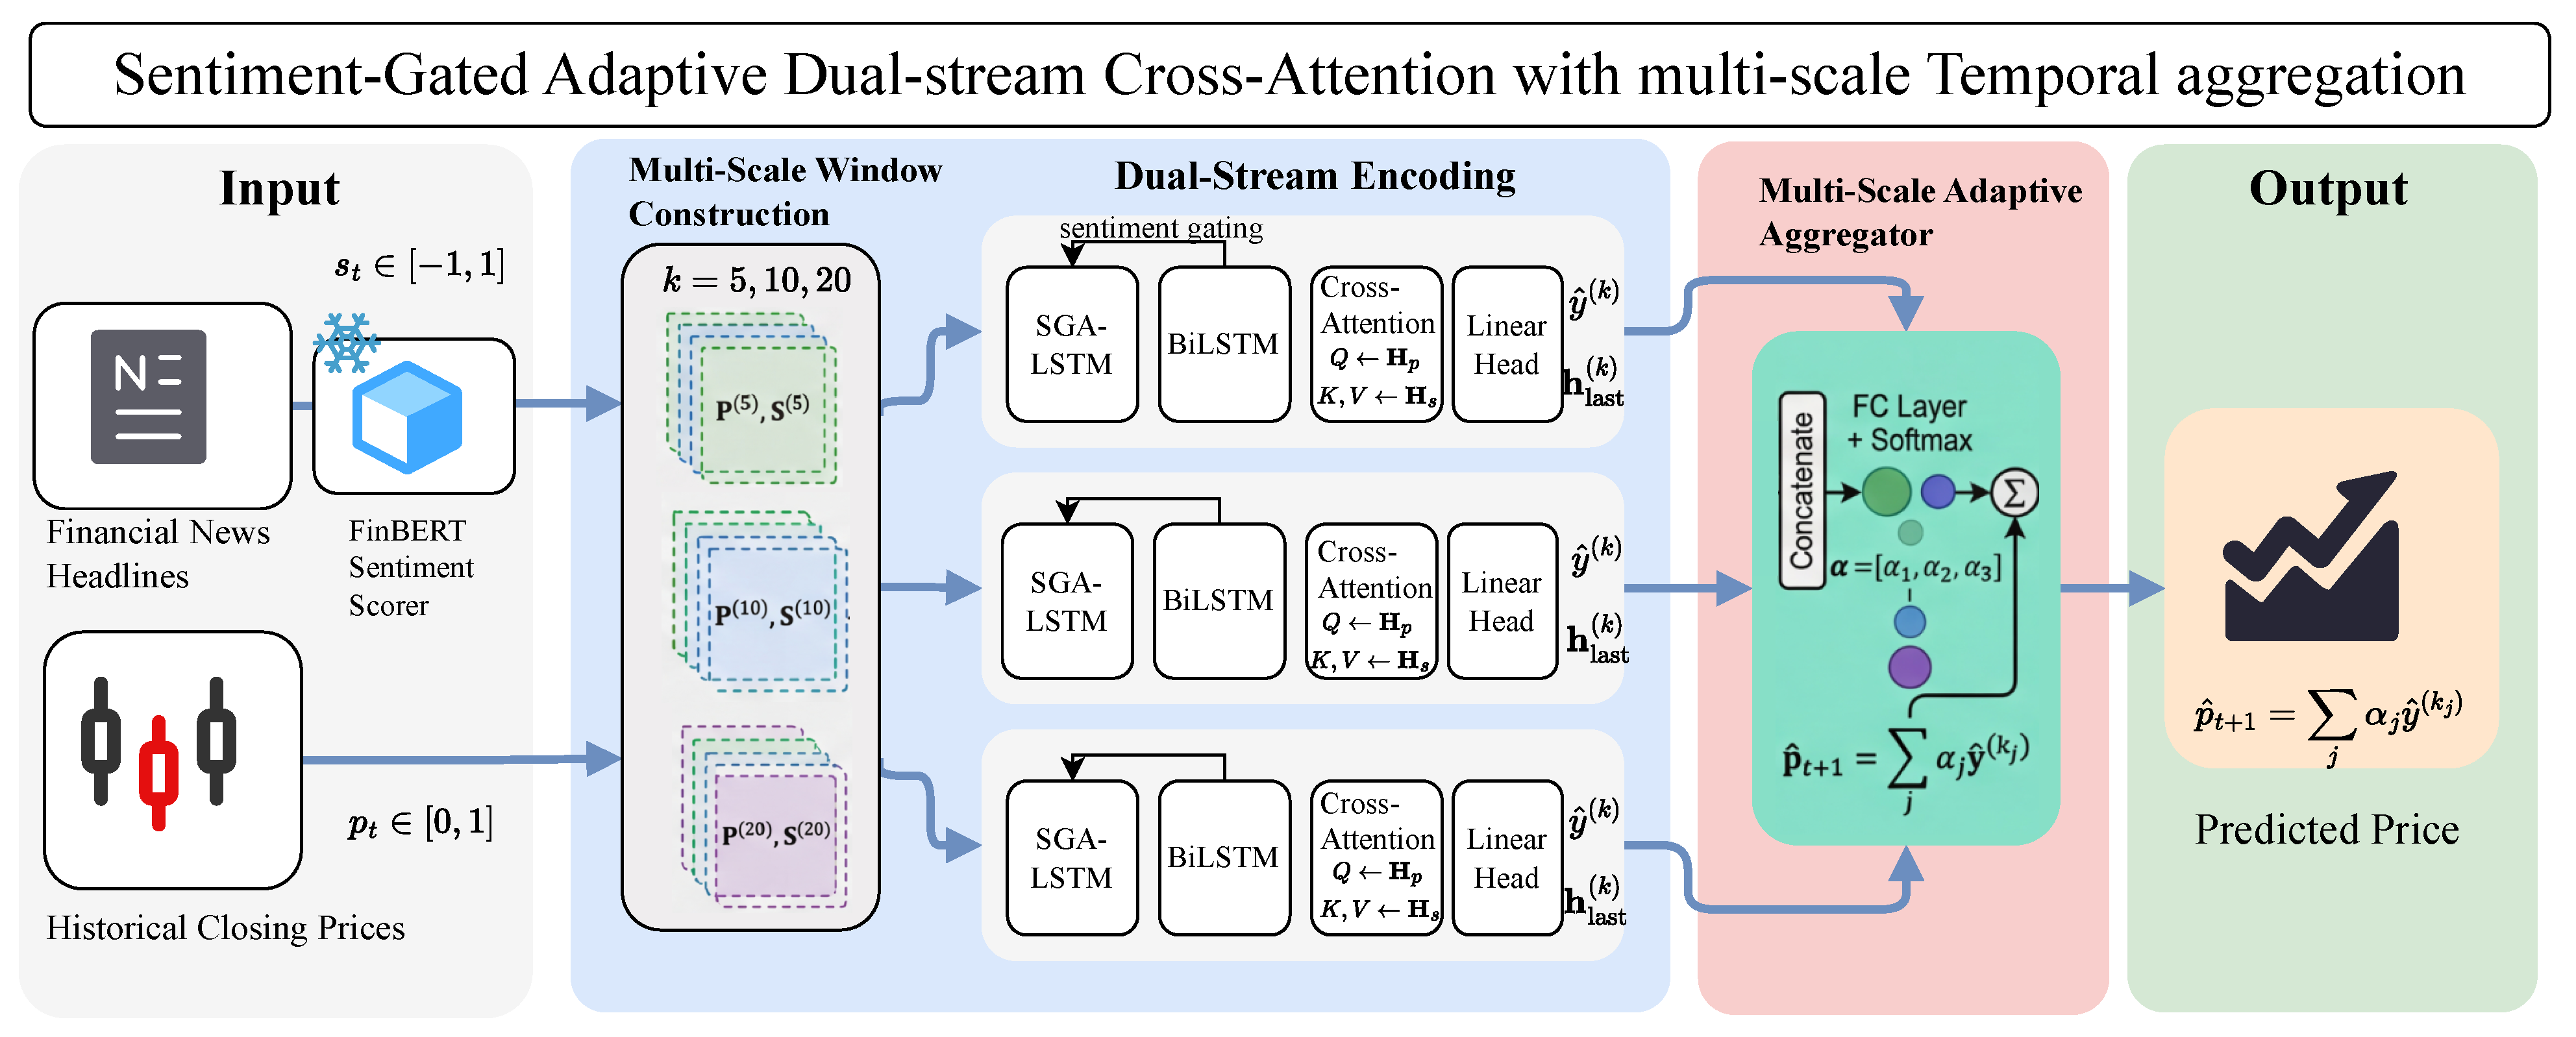
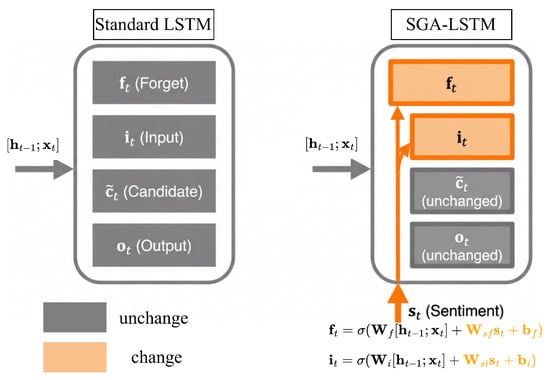
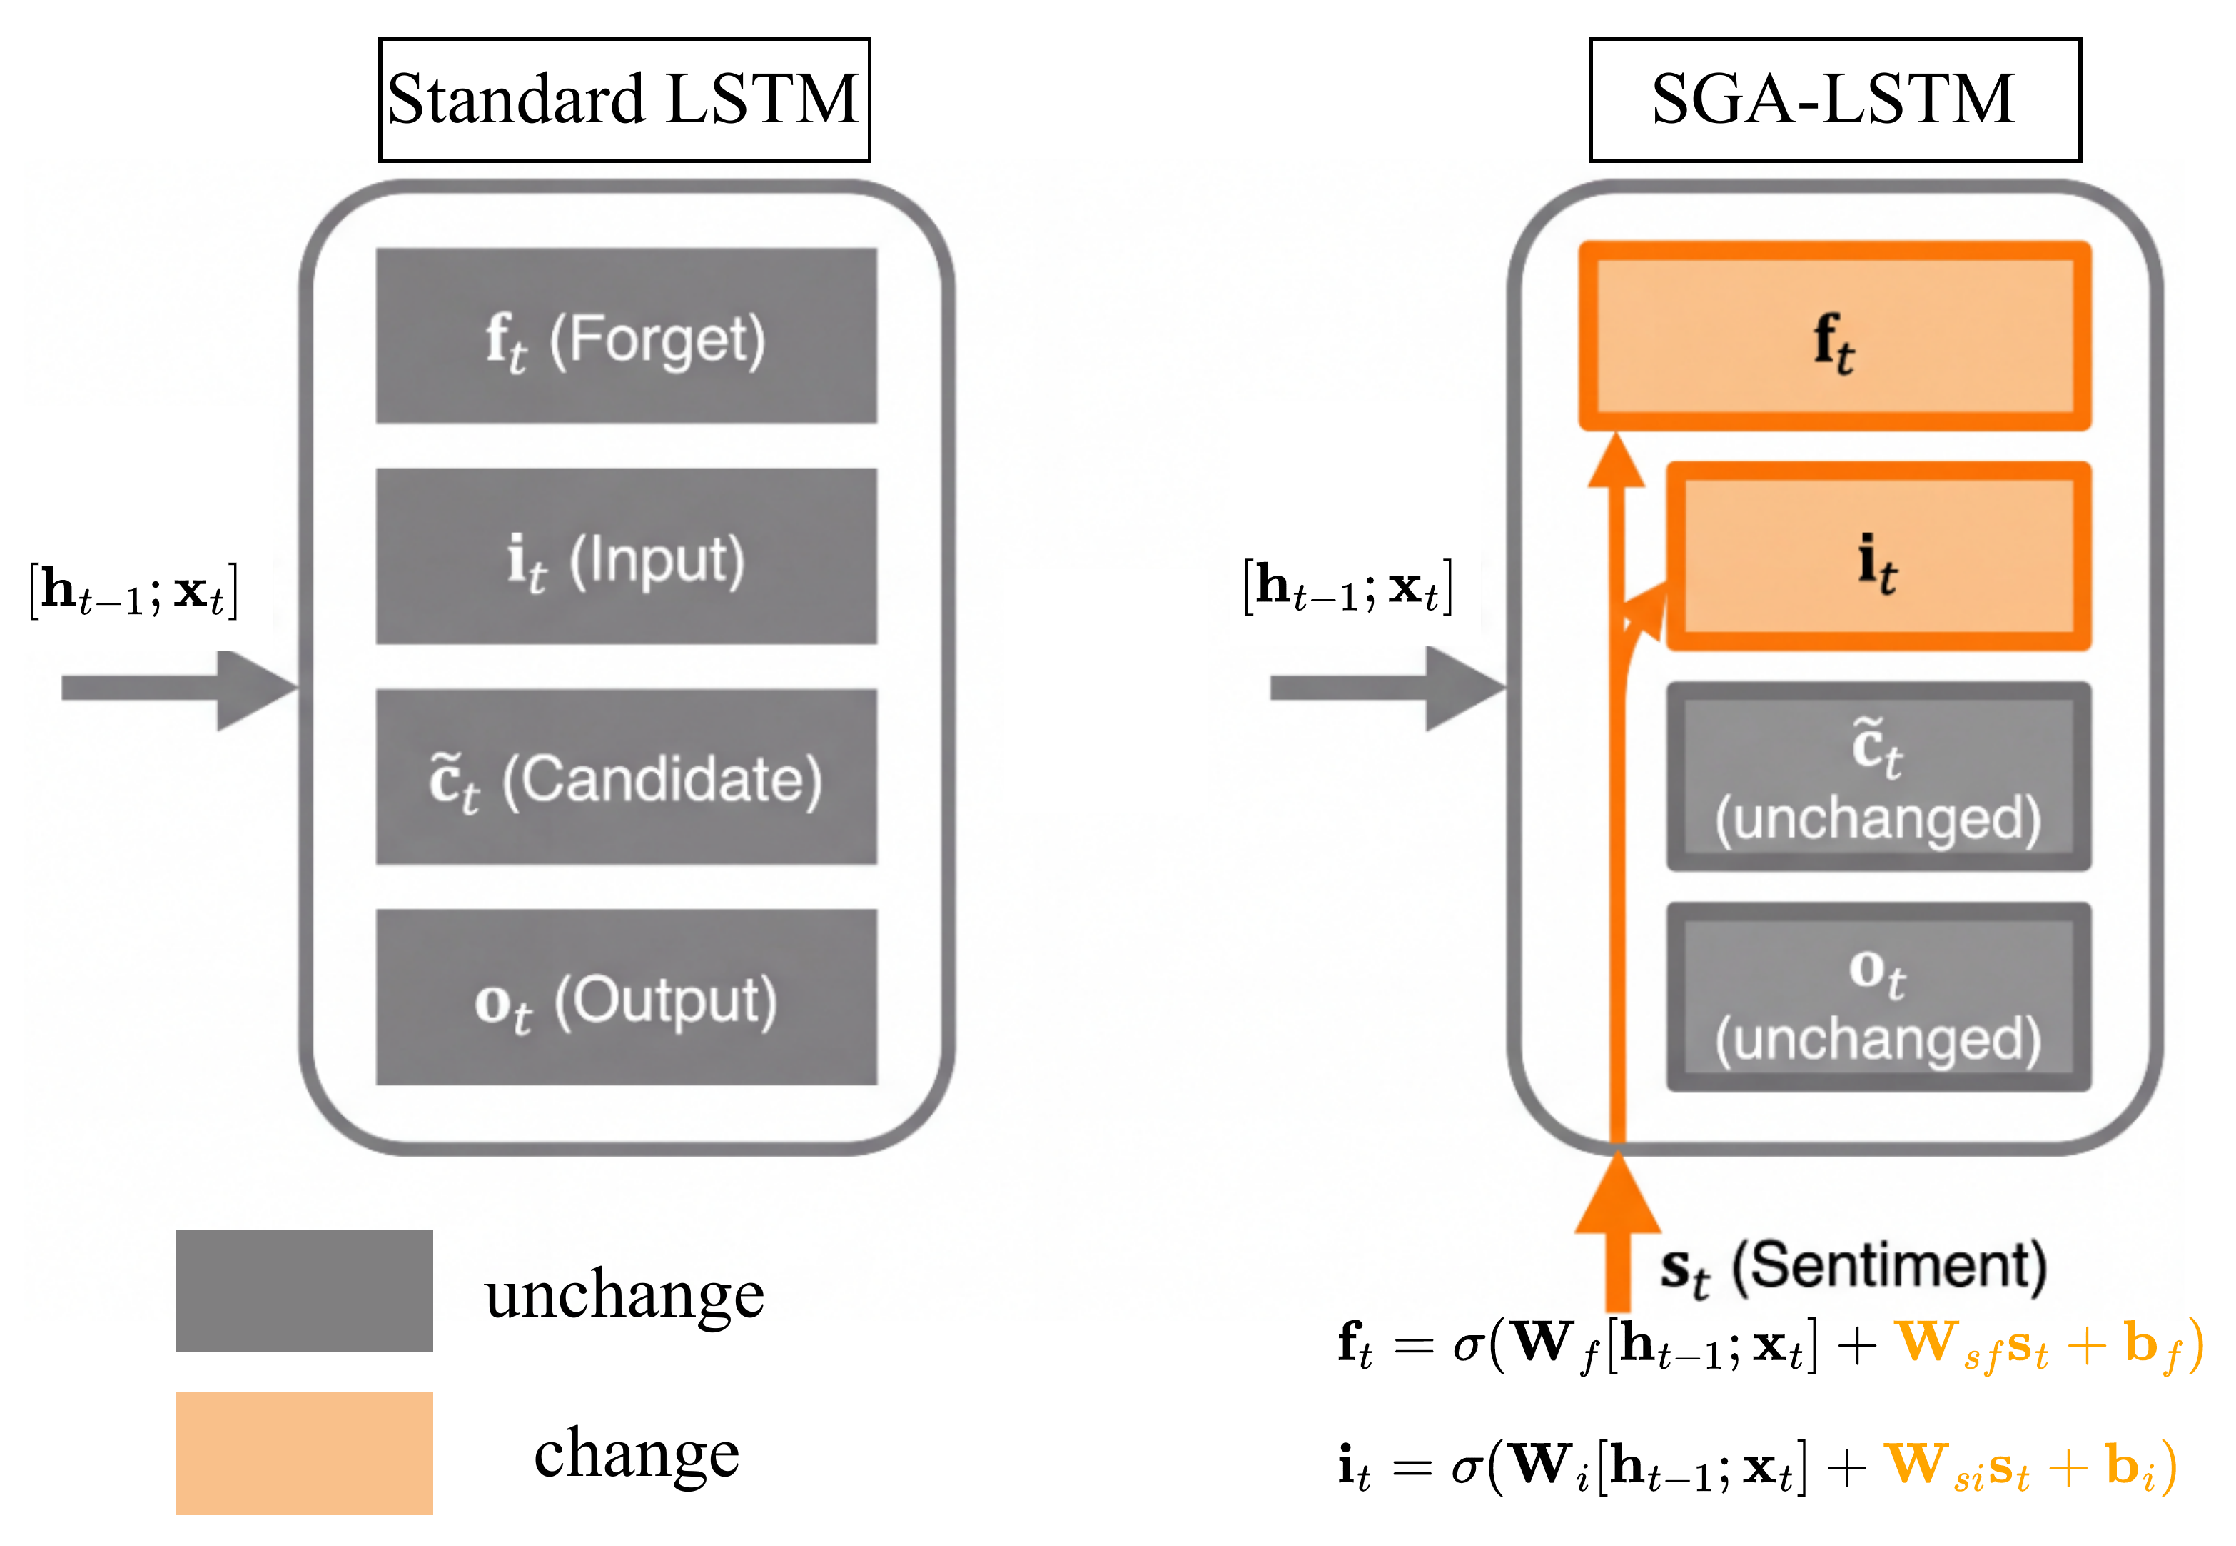
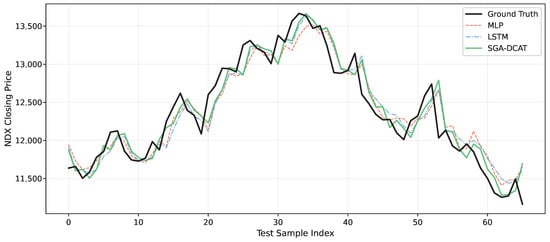
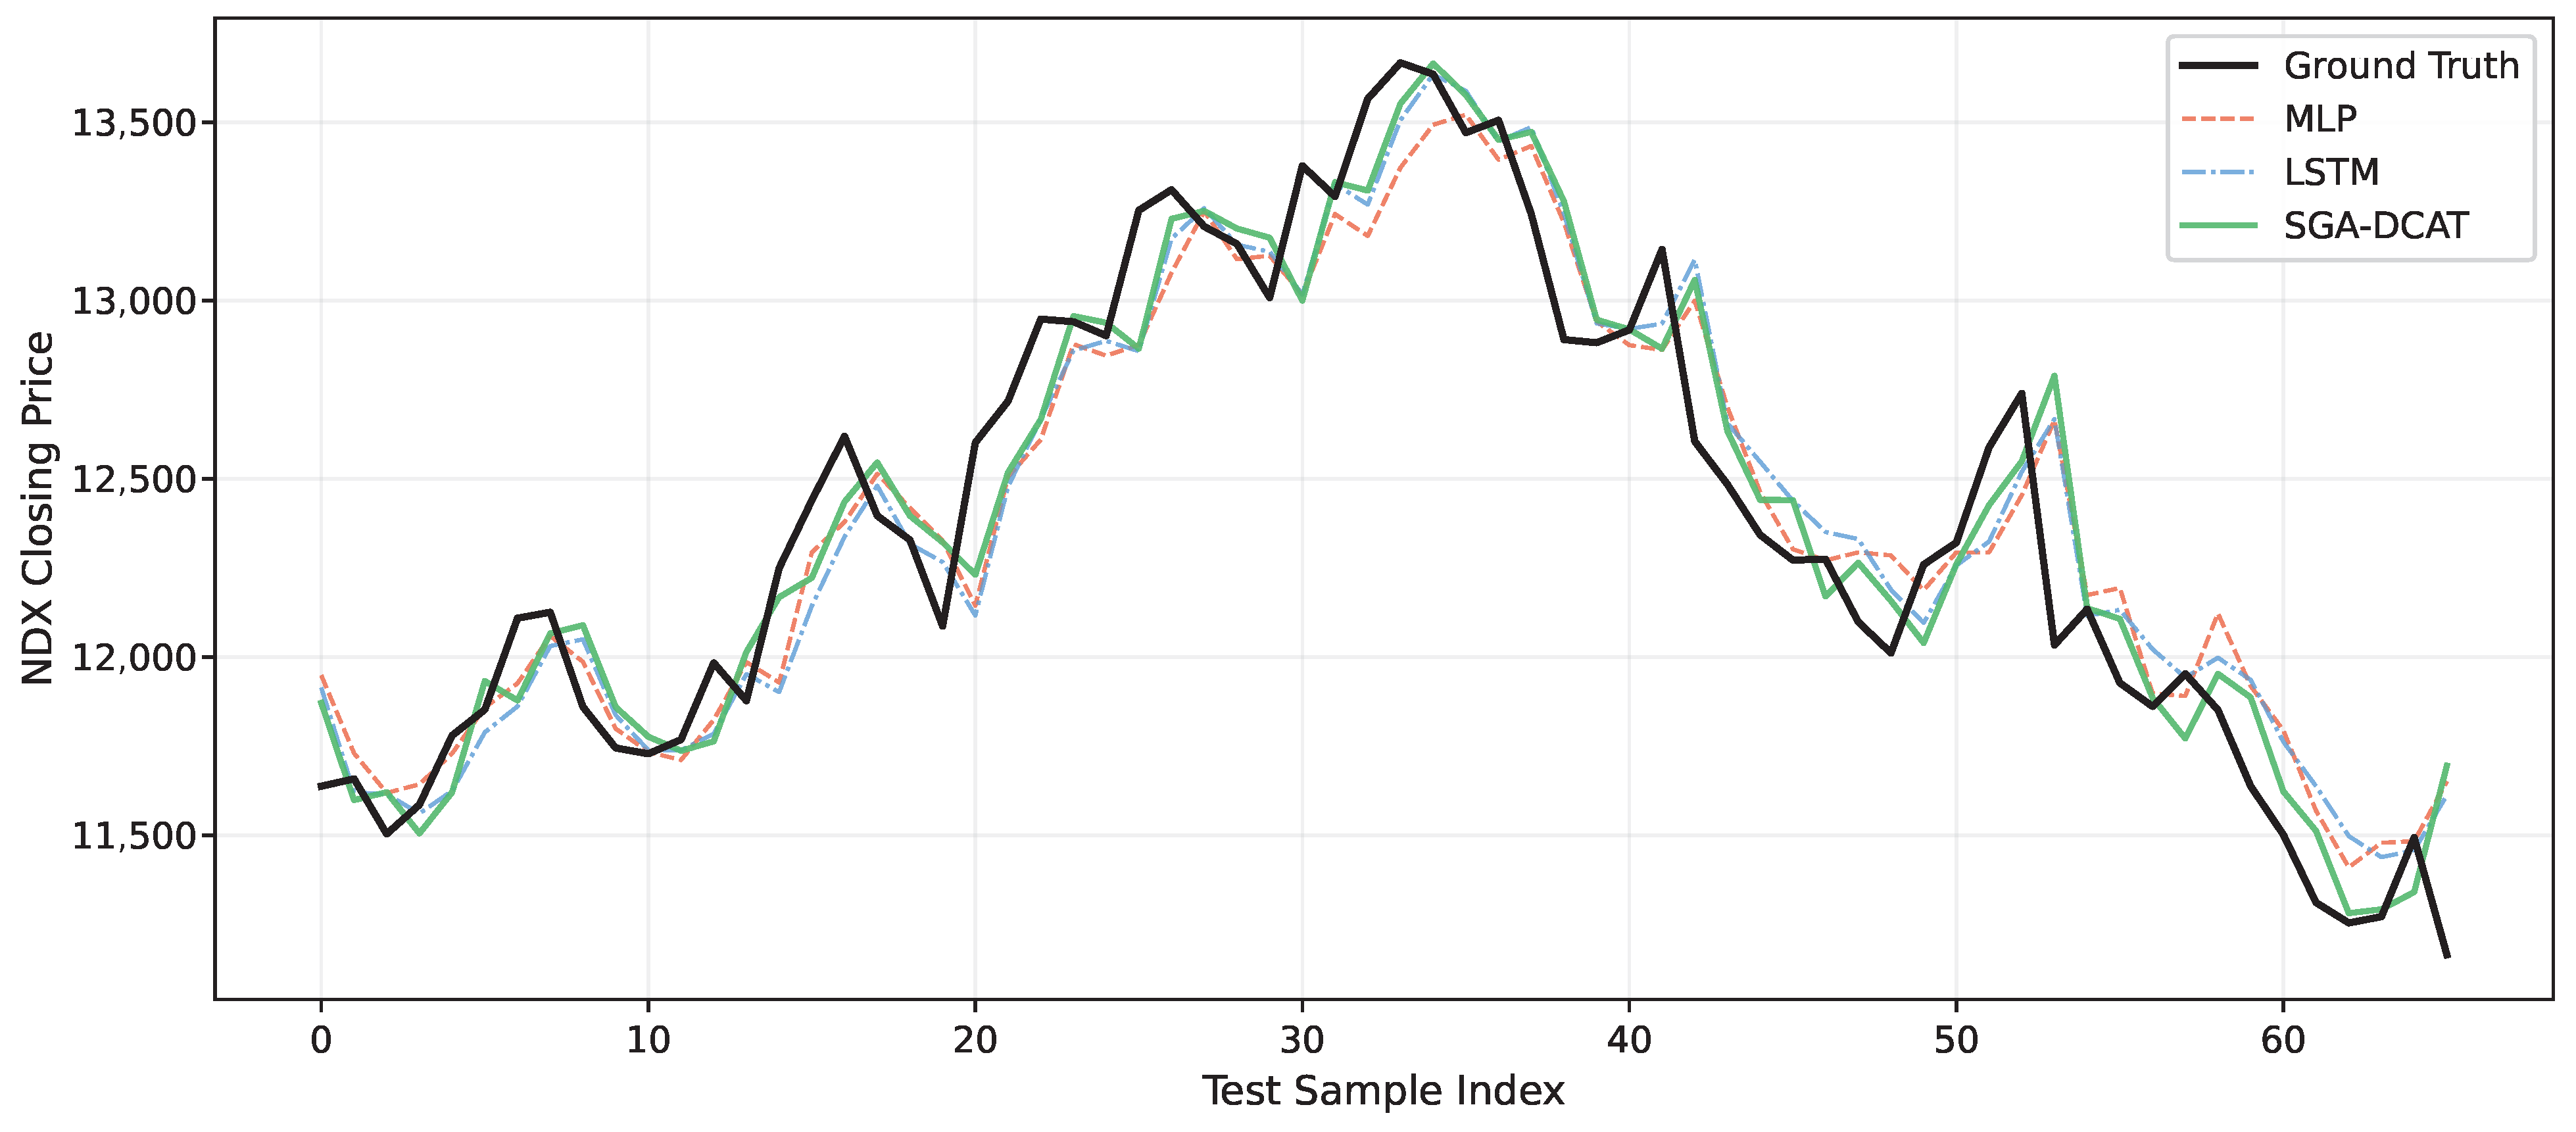

Disclaimer/Publisher’s Note: The statements, opinions and data contained in all publications are solely those of the individual author(s) and contributor(s) and not of MDPI and/or the editor(s). MDPI and/or the editor(s) disclaim responsibility for any injury to people or property resulting from any ideas, methods, instructions or products referred to in the content. |
© 2026 by the authors. Licensee MDPI, Basel, Switzerland. This article is an open access article distributed under the terms and conditions of the Creative Commons Attribution (CC BY) license.