


Abstract
The Belt and Road Initiative (BRI) has reshaped global trade and infrastructure, with port cities as key nodes in its Maritime Silk Road. Quantifying their spatiotemporal development is challenging due to data limitations in emerging economies. This study employs VIIRS nighttime light (NTL) data from 2013 to 2023 to analyze urbanization patterns in twelve BRI port cities spanning Asia, Africa, Europe, and South America. We compile a 12-city cohort; inferential analyses are conducted for a pre-specified six-city subset, while descriptive NTL trends cover all 12. This study makes three contributions: (i) we assemble a cross-sensor harmonized VIIRS NTL record for 12 BRI port cities during 2013–2023; (ii) we integrate Standard Deviational Ellipse(SDE) parameters with rank-size dynamics as a joint diagnostic of urban hierarchy; and (iii) we triangulate NTL with external indicators (GDP, population, port throughput) to validate interpretation. Three key findings emerge: Asian ports experienced pronounced NTL growth, with Singapore approaching saturation, consistent with the luminosity-ceiling hypothesis; SDE analysis shows varied expansion patterns shaped by geophysical and policy factors; and rank-size trends indicate decentralization during the BRI decade, with |q| declining in most cities, challenging the primate-city model. To optimize development, we highlight polycentric infrastructure investment, institutionalized NTL monitoring, and green port certification aligned with sustainability goals.
Keywords:
Belt and Road Initiative; NTL remote sensing; port city development; standard deviation ellipse; rank-size distribution MSC:
62H11
1. Introduction
The Belt and Road Initiative (BRI), launched in 2013, has redefined global trade and infrastructure connectivity, with an estimated $1 trillion invested in over 3000 projects spanning 150 countries [1]. Port cities, serving as critical nodes in BRI’s maritime Silk Road, have experienced transformative growth driven by investments in deep-water terminals, logistics corridors, and industrial parks [2,3]. Quantifying these changes, however, remains challenging due to the spatial heterogeneity of development and the scarcity of high-resolution, longitudinal socio-economic data in emerging economies [4,5]. Nightlight remote sensing (NLR) has emerged as a pivotal tool for overcoming these limitations. Unlike traditional metrics such as GDP or employment statistics, NLR provides spatially explicit, temporally consistent proxies for human activity, capturing light emissions from urbanization, industrial operations, and transportation networks [6,7,8]. The transition from the Defense Meteorological Satellite Program (DMSP) to the Visible Infrared Imaging Radiometer Suite (VIIRS) in 2012 marked a technological leap, with VIIRS offering finer spatial resolution (500 m vs. 5 km) and reduced saturation in brightly lit urban cores [9,10]. Recent studies have increasingly utilized VIIRS-based nighttime light(NTL) remote sensing (NLR) to monitor urbanization and infrastructure growth along the BRI. For instance, Jean et al. [4] demonstrated that satellite imagery fused with machine learning can effectively map socio-economic activity in data-scarce regions, offering a proxy for traditional metrics such as GDP and employment statistics. It is emphasized that the superior radiometric calibration and spatial resolution of VIIRS (~500 m) enable detailed monitoring of port-adjacent urban growth and industrial operations, overcoming the limitations of earlier DMSP-OLS sensors [6].
Nighttime light datasets have been operationally employed in urban investigations across more than five hundred refereed publications, functioning either as core analytical inputs or complementary evidence sources [11]. The integration of NTL remote sensing into urban studies has demonstrated significant methodological advancements, with VIIRS/DMSP-derived radiance data emerging as a critical tool for characterizing spatiotemporal urbanization patterns, economic activity, and infrastructure development across diverse geographic contexts [11,12,13]. While VIIRS-based NTL datasets have dominated urban remote sensing research since 2012, emerging platforms (e.g., Luojia-01, EROS-B) offering medium-to-high spatial resolution imagery account for merely 10% of total applications, primarily due to limitations in swath width, temporal coverage, and atmospheric interference [14,15]. Emerging frontiers and methodological paradigms in nocturnal remote sensing for urban dynamics analysis include characterizing urban growth, mapping socioeconomic and environmental variables, investigating human activities, and mapping light pollution [11,16,17,18]. The operationalization of NTL has transcended traditional urban analytics, facilitating data-driven investigations into ecosystem disturbances, population health outcomes, and security optimization, while continued sensor advancements and machine learning integration suggest accelerated methodological innovation [17,19,20,21]. The past decade has witnessed significant progress in NTL remote sensing for monitoring urban development along the BRI corridors [22]. Analysis of NTL data (1993–2012) employing spatial metrics reveals significant luminescence growth in BRI corridors undergoing economic reconstruction, contrasted by reductions in socioeconomically unstable regions [23]. Spatiotemporal analysis of 80 BRI cities (1992–2015) reveals a 133% surge in urban land cover (0.24% to 0.56%), driven primarily by Asian/African developing economies, with concentric density gradients and divergent compactness trends—Chinese cities decentralizing while European, African, and West/Southeast Asian counterparts consolidate, reflecting economic vitality and population distribution as hierarchical determinants of morphological evolution [24]. However, most studies focus on pre-2015 data, neglecting post-initiative impacts. Few NTL studies target cities with actual BRI projects, hindering localized policy assessments. Hence, NTL’s potential as a tool for evaluating BRI-related urban policies (e.g., infrastructure efficiency, ecological trade-offs) remains underexplored.
Collectively, these findings underscore the value of NTL as a spatially explicit and temporally consistent tool for analyzing BRI-related urban transformation, especially in regions where conventional socio-economic data are incomplete or outdated. Based on cross-sensor calibrated VIIRS nighttime light data (2013–2023), this study applies statistical analysis, the Standard Deviational Ellipse (SDE), and the rank-size rule to examine spatial pattern changes and spatiotemporal dynamics in representative BRI port cities. We compile a 12-city cohort; inferential analyses are conducted for a pre-specified six-city subset, while descriptive NTL trends cover all 12 (see Table A1). Our work builds on recent advances in four domains. First, in remote sensing of development, NTL has been validated as a robust proxy for economic activity, poverty mapping, and inequality, with recent work improving cross-sensor harmonization and applications to urbanization monitoring [9,25]. Second, in urban growth modeling, global assessments have highlighted heterogeneous expansion pathways under the Shared Socioeconomic Pathways (SSPs), showing how different development trajectories impact land use and sustainability [26,27,28]. Third, in spatial statistics, methodological contributions over the past decade have refined tools such as Moran’s I, Local Indicators of Spatial Association (LISA), and entropy-based measures to capture clustering, dispersion, and spatial heterogeneity in urban contexts [29,30,31]. Fourth, in spatial econometrics, recent syntheses and applications have extended the Spatial Lag Model (SAR), Spatial Error Model (SEM), and Spatial Durbin Model (SDM) to cross-sectional and panel data, providing rigorous treatments of spatial dependence and spillovers in urban and regional studies [32,33,34]. For port systems specifically, NTL captures shipping and anchorage activity around harbors and coastal urban footprints, supporting the analysis of port-city dynamics. Within the BRI, the Maritime Silk Road prioritizes nodal port infrastructure and trade corridors; recent empirical studies report measurable development effects and clustering among MSR port cities [35,36].
Within this context, our contribution is threefold: (i) we assemble a harmonized VIIRS NTL record for BRI port cities (2013–2023); (ii) we formalize a joint diagnostic that couples urban form and hierarchy by integrating SDE shape metrics (semi-axes ratio and orientation) with the rank-size (Zipf) exponent, and by quantifying polycentric transition via the percentage reduction in || over time; and (iii) we incorporate external validation (GDP, population, port throughput) to enhance the robustness of interpretations. These definitions make our contribution explicitly mathematical yet fully reproducible from the reported quantities, while the combined advances help reveal the dynamics of port-city transformations during the first decade of the BRI and provide empirical references for policy-making and infrastructure planning in the coming decade.
2. Materials and Methods
The study first conducts a statistical analysis of both aggregate luminosity and incremental growth in NTL (2013–2023) across representative cities in the BRI region, with a focus on urban centers hosting green energy investment projects. Subsequently, the spatial evolutionary trajectory of regional lighting patterns is systematically investigated using the SDE method, quantifying directional bias and dispersion dynamics at the macro scale. Finally, the rank-size distribution principle is employed to decode the spatial morphology and spatiotemporal evolutionary characteristics of NTL scaling patterns, with comparative insights derived from pan-BRI regions and China’s urban systems [37].
2.1. Study Area
The BRI, launched in 2013, spans six continents and encompasses two primary routes: the Silk Road Economic Belt (connecting China to Central Asia, South Asia, Europe, and the Middle East via overland corridors) and the 21st Century Maritime Silk Road (linking China to Southeast Asia, the Indian Ocean, East Africa, the Mediterranean, and Europe through maritime networks). As of 2023, it involves 152 countries and 32 international organizations, covering 65% of the global population and 40% of world GDP, with infrastructure investments exceeding $1 trillion across transportation, energy, and digital connectivity projects. The initiative prioritizes five key areas—policy coordination, infrastructure connectivity, trade facilitation, financial integration, and people-to-people bonds—and has established six major economic corridors, including the China-Pakistan Economic Corridor (CPEC) and the New Eurasian Land Bridge.
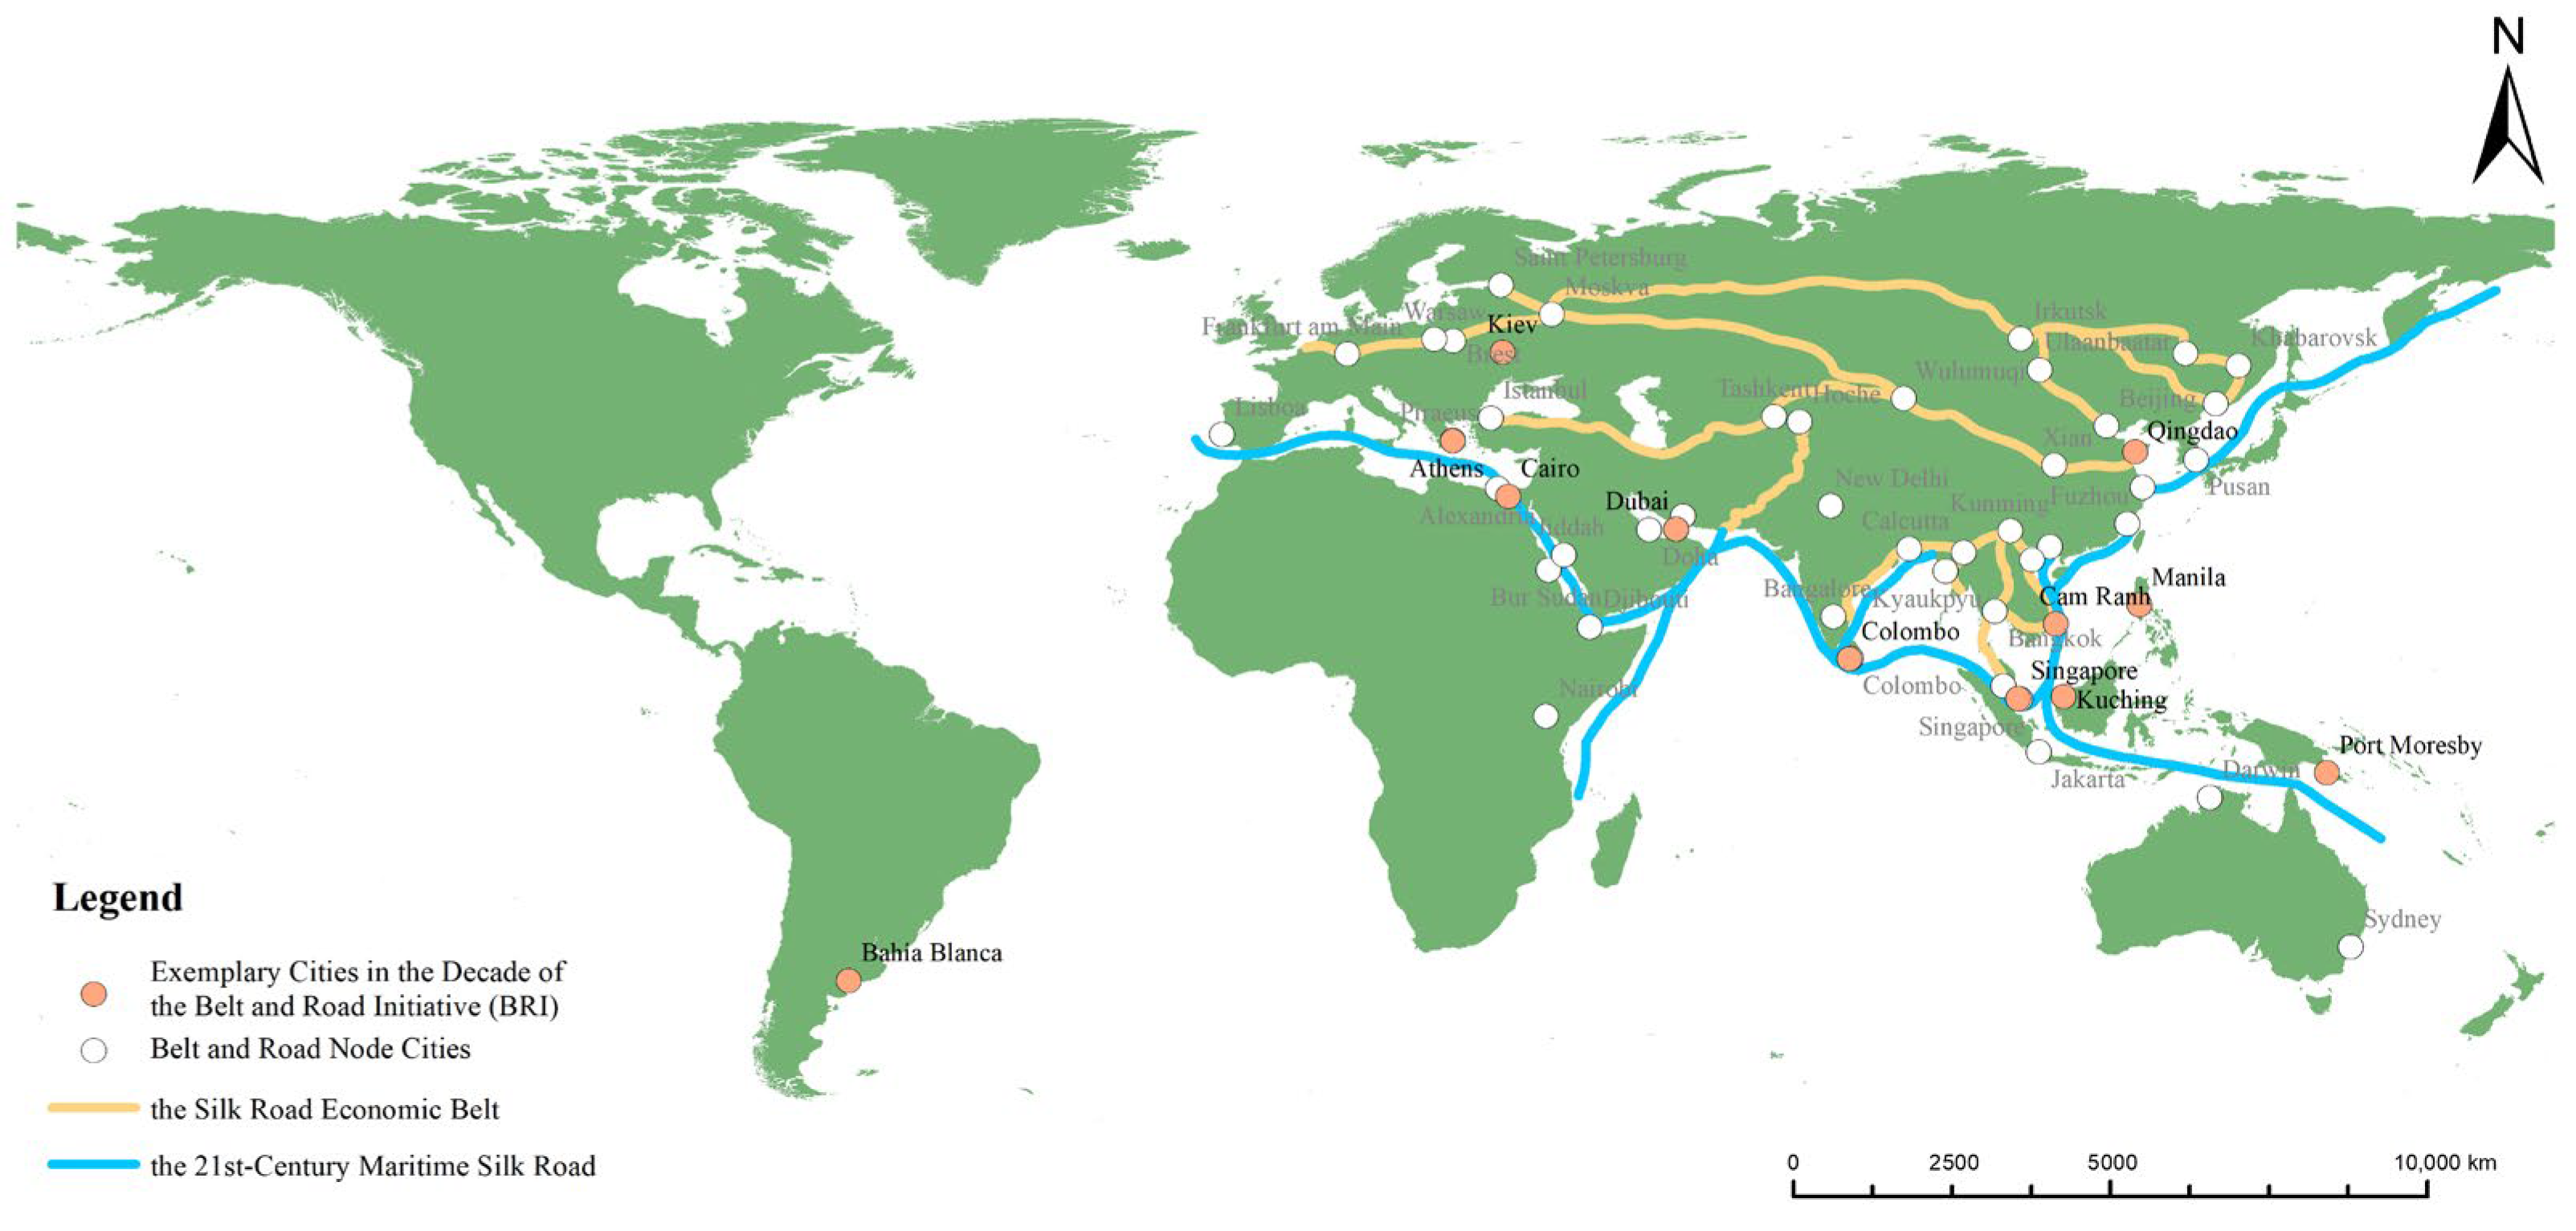
The study focuses on 12 pivotal port cities along the BRI corridors, selected based on their geopolitical significance, infrastructure connectivity, and role in advancing China’s global trade network (Figure 1). These cities, spanning six continents, exemplify the spatial-temporal evolution of BRI’s maritime-terrestrial integration strategy over the initiative’s first decade (2013–2023).
Figure 1.
Schematic Map of BRI Participating Countries as of 2024 (Compiled and Drafted Based on Documentation).
The selection of the twelve port cities was guided by four criteria: (i) their geopolitical and economic significance as nodes of the BRI; (ii) the presence of substantial BRI-related infrastructure investments documented in official reports (e.g., Green BRI Decade Report, CUFE Renewable Database); (iii) their representativeness of diverse regional contexts across Asia, Africa, Europe, and South America; and (iv) their recognition as official BRI Ten-Year case studies or key project implementation sites, which underscores their exemplary status in policy discourse (see Appendix A for details).
2.2. Definition and Adjustment of Urban Boundaries
To define spatial extents, we adopted a functional urban area (FUA)-aligned approach, balancing comparability with accuracy. Where the official municipal boundary sufficiently captured the economic footprint (e.g., Qingdao, Colombo), the administrative unit was retained. However, for cities where the municipal boundary was too narrow, we extended to the next administrative level, guided by NTL imagery and corroborated economic records. For example, Kuching was extended to Sarawak State, and Cam Ranh to Khánh Hòa Province, as both ports function at the metropolitan scale. Similarly, Cairo’s urban extent was defined by aggregating Ancient Cairo and New Cairo zones to reflect state-led expansion, while Dubai’s boundary was delineated using sub-municipality sectors (FID47–FID55) from GADM to represent its polycentric development. GADM is the Database of Global Administrative Areas.
These adjustments mitigate the Modifiable Areal Unit Problem (MAUP) and align with best practices in global urban research, ensuring that the analyzed units reflect functional economic geographies rather than arbitrary municipal boundaries. All adjustments were cross-validated using NTL spatial extent and Google Earth imagery to confirm correspondence with actual urbanized areas [38,39]. These adjustments may introduce a scale effect that is acknowledged as a limitation of our analysis (Table 1).
Table 1.
Definition and Adjustment of Urban Boundaries.
2.3. Data Sources
This study integrates multi-source geospatial datasets to analyze spatiotemporal patterns of 12 BRI port cities (2013–2023), with technical specifications summarized in Table 2. The primary dataset comes from NASA’s Black Marble project (VNP46A4/VJ146A4 Yearly Moonlight-adjusted NTL Product), providing 500 m resolution annual composites from 2012 to present. Key processing steps include the following: Radiometric Calibration: Cross-sensor harmonization using DMSP/OLS (2012–2013) and VIIRS (2013–2023) data via quadratic regression; Noise Removal: Application of straylight correction and fire exclusion algorithms; Urban Masking: Extraction of port-centric 50 km zones using OpenStreetMap infrastructure layers. The relevant equations are presented as follows:
where denotes the total luminosity in year , aggregated from pixel-level values representing the NTL intensity of pixel in year .
where represents the inter-annual rate of luminosity change from year to [23].
Table 2.
Technical Specifications of Core Datasets.
The vector boundaries used in this study were primarily obtained from the GADM v4.1 database, which provides three levels of administrative divisions, namely national, provincial, and city. To refine port-specific zoning within China, we supplemented these boundaries with data from the 1:1 M National Fundamental Geographic Database (2020 edition). In order to ensure spatial accuracy, we performed topological validation to resolve discrepancies between datasets. More than 10% of the boundary inconsistencies were corrected through conflation with Google Earth imagery (2023). Additionally, Ground Control Points (GCPs) derived from BRI infrastructure maps were applied to further enhance the positional precision of the boundaries.
2.4. Methods
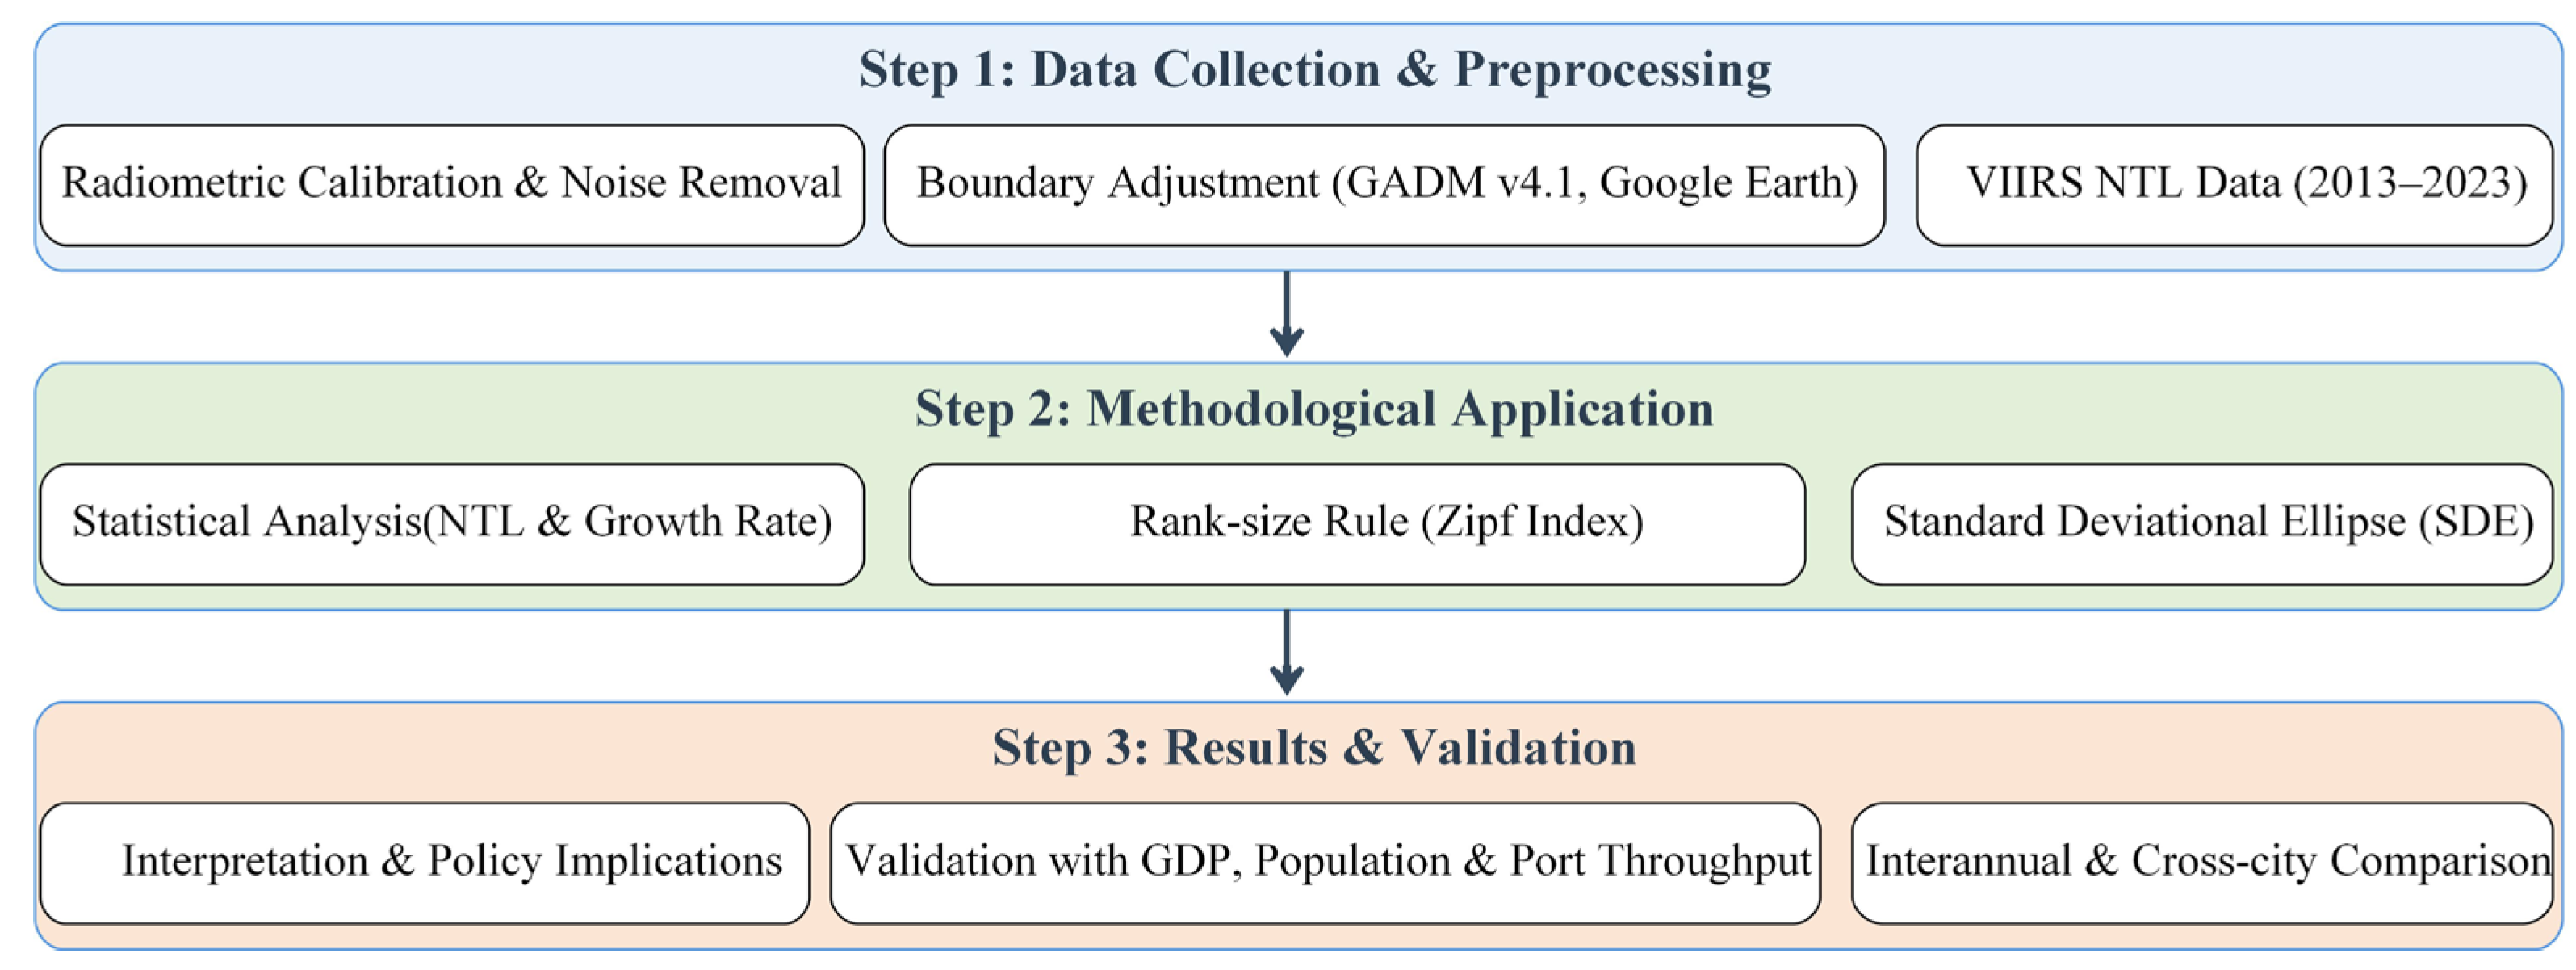
Descriptive statistics cover all 12 cities, whereas SDE and rank-size are reported for the six-city subset marked in Table A1. To provide a clear overview of the research design, the workflow of data processing and methodological framework is illustrated in Figure 2.
Figure 2.
Workflow of the methodological framework.
The diagram illustrates the research process, including (i) data collection and preprocessing, (ii) methodological applications (statistical analysis, SDE, and rank-size rule), and (iii) results and validation with external indicators and policy implications.
2.4.1. SDE Method
The SDE method is a widely used spatial statistical technique designed to analyze the directional trends, dispersion patterns, and evolutionary dynamics of geographic phenomena. The method allows for the visualization and quantification of spatial patterns by fitting an ellipse to a set of geographic data points. This ellipse reflects the orientation, extent, and concentration of the data within a defined area, making it particularly useful for identifying significant spatial relationships in multidimensional datasets [37].
SDE analysis synthesizes four core parameters—mean center, rotation angle, major and minor axes, and elliptical area—which together define the spatial distribution of the dataset. The mean center represents the geometric center of the dataset, serving as a reference point for measuring dispersion. The rotation angle indicates the direction of maximum variance within the dataset, providing insights into the spatial orientation of phenomena. The major and minor axes reflect the extent of dispersion along two perpendicular directions, with the major axis often revealing the dominant directional trend. Finally, the elliptical area is proportional to the spatial concentration of the data, and a larger ellipse area signifies greater dispersion. Equations (3)–(6) quantify the spatial dispersion and orientation of urban growth. In Equations (3)–(6), (, ) denotes the spatial location of the research object; indicates corresponding weights; (,) indicates the location of each study object relative to the center of gravity (,):
The ellipse is defined by the standard deviations and of the - and -axis coordinates, respectively, which quantify dispersion along the east–west and north–south directions, as follows:
2.4.2. Urban Rank-Size Rule
The urban scale distribution is traditionally extracted from built-up areas using night-time light remote sensing images, which provide a unique and consistent means to capture urban extents and their growth patterns globally. This methodology was initially employed in studies such as those that highlighted that NTL remote sensing imagery can offer a globally consistent brightness threshold [40], which helps verify urban growth models, also known as Zipf’s law [41,42]. In this study, the corresponding NTL values, which are consistent with remote sensing images, are selected as the urban identification threshold. This allows us to study the spatial scale distribution of NTL in these urban areas. By using this approach, we can directly analyze urbanization levels in regions where conventional methods might lack sufficient data. The rank-size rule models the relationship between city rank and size as follows:
where denotes the total NTL of the s-th region, is the NTL of the largest city, represents the rank of the -th region, while is the Zipf index, commonly used to describe the concentration and dispersion of city sizes based on NTL [23,43].
The Zipf mode corresponds to the special case of Equation (7) when = 1. In this sense, Equation (7) can be regarded as a generalization of the Zipf mode. Taking the logarithm of Equation (7), gives:
The value reflects the luminosity of the largest city, providing a reference for the urban scale. The || value reveals key information about the NTL scale distribution. When || is close to 1, the distribution tends to be balanced. A || greater than 1 indicates concentration, where larger cities dominate and smaller ones lag in development, while a value less than 1 shows a more dispersed distribution, with smaller cities being relatively more developed. Long-term analysis suggests that if || increases, it points to a greater concentration of urban luminosity, implying stronger development in large cities. Conversely, a decrease in || signifies that dispersion is increasing, meaning that smaller cities are catching up in terms of development. These trends provide insights into the evolving urban hierarchies within regions, influenced by infrastructure and policy shifts.
Following the classical rank-size tradition and recent NTL-based extensions, secondary cities are identified through the relative luminosity hierarchy as non-primate nodes that maintain spatial and functional significance within broader urban networks [44,45,46]. Beyond exploratory visualization, we extend the rank-size analysis by explicitly estimating the Zipf exponent () for each port city using double-logarithmic regressions. Goodness-of-fit was evaluated through the coefficient of determination (R2), and residual patterns were examined to identify systematic deviations from Zipf’s law. These diagnostics allow the rank-size model to serve not only as a descriptive tool but also as a quantitative test of hierarchical structure. For comparability, regressions were conducted separately for each year (2013–2023) and standardized across cities.
2.5. Validation of NTL as a Proxy for Development
To assess whether NTL dynamics reflect real socio-economic changes rather than sensor noise or policy artifacts, we conducted a qualitative validation exercise. For a subset of representative cities, we compared NTL trajectories (2013–2023) with official statistics, including GDP growth (Qingdao), port throughput (Colombo), and demographic change (Cairo). These external indicators were selected because they represent key dimensions of economic and demographic development that NTL is expected to approximate. The validation is designed to check directional and proportional consistency rather than to establish precise causal relationships.
3. Results
Unless otherwise specified, all results herein pertain to the pre-specified six-city subset for inferential analyses; the complete 12-city cohort is provided in Table A1. In this paper, “resource-dependent growth” denotes NTL gains that remain concentrated around port terminals and main transport corridors and move in step with the external port-activity indicators already reported in the manuscript, rather than diffusing across the wider urban system.
3.1. Spatiotemporal Variations in NTL and Growth Rates
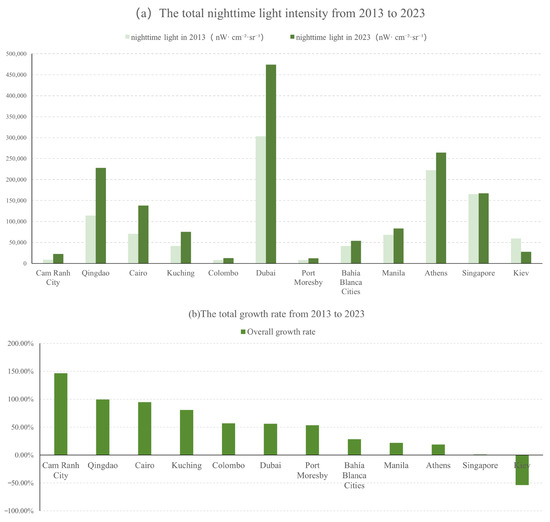
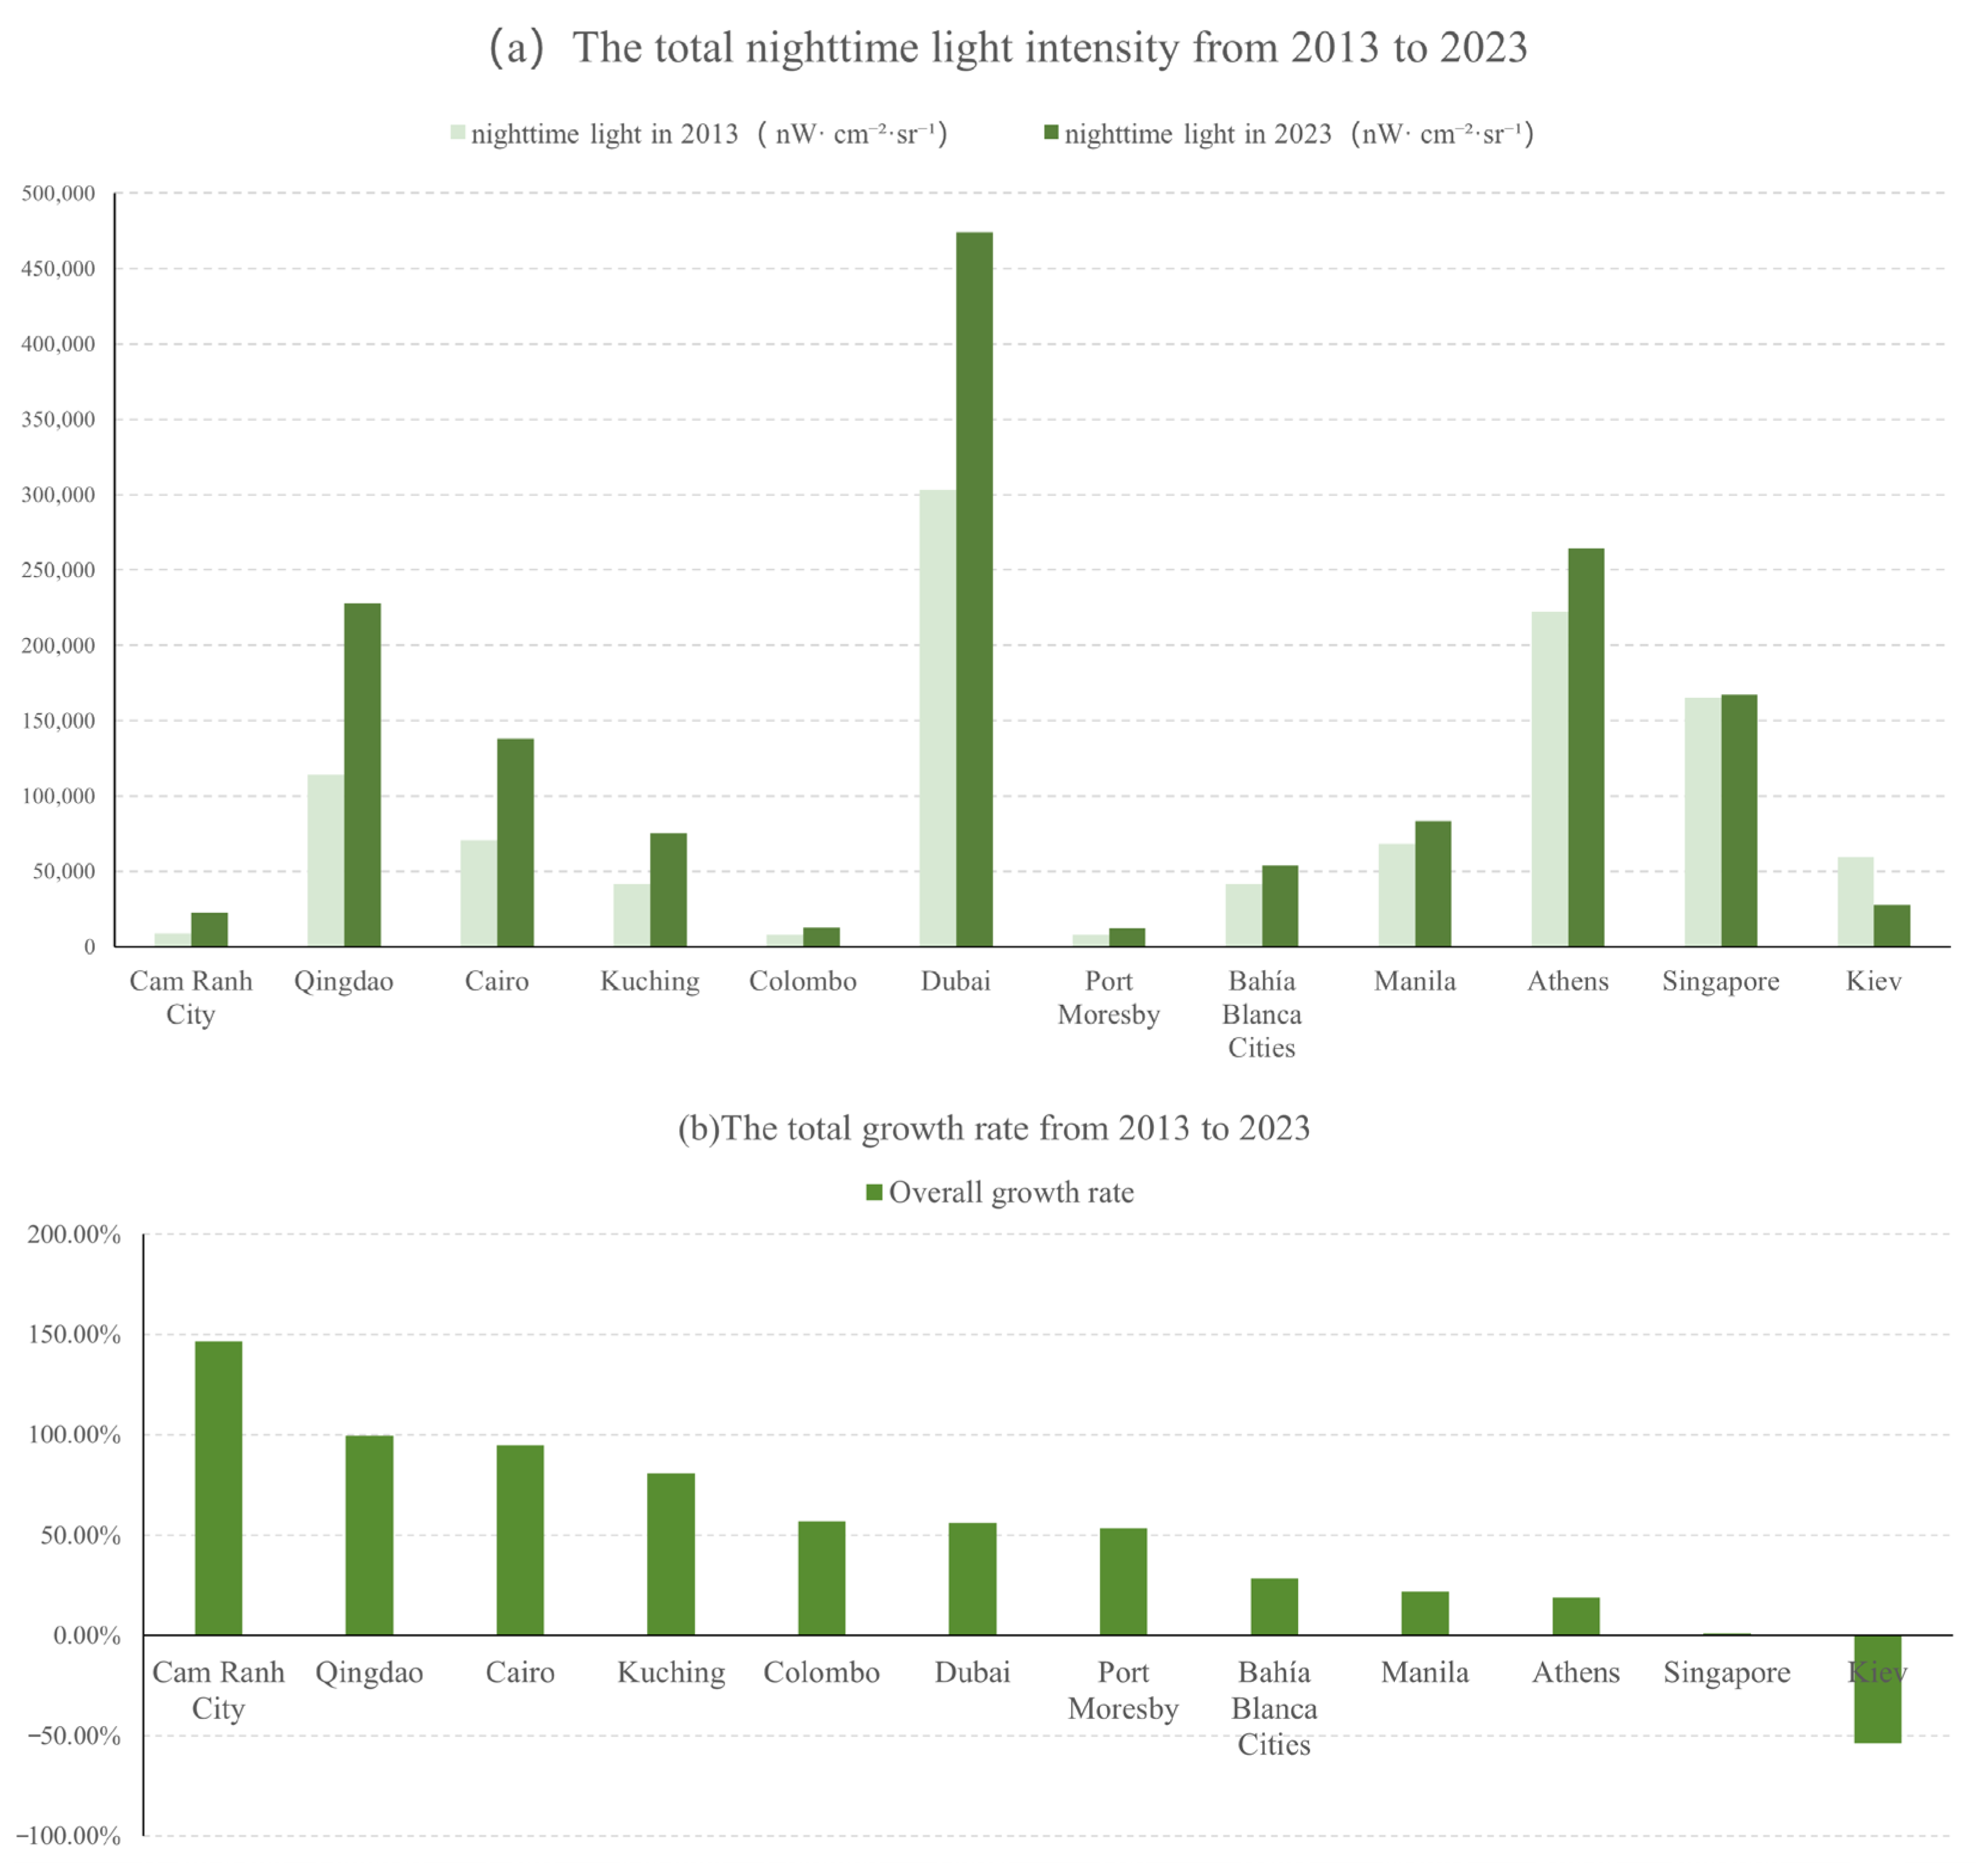
Analysis of NPP-VIIRS NTL data (2013–2023) reveals distinct regional patterns (Figure 3): Asian cities exhibit the widest variation (1.05–146.54%); African cities show emerging potential; European cities display polarized trajectories; and South American cities follow resource-dependent growth paths. These findings provide substantial remote sensing evidence for understanding global urbanization dynamics.
Figure 3.
The total NTL and overall growth rate of 12 port cities along the BRI from 2013 to 2023.
Asian cities exhibited the most pronounced NTL variations. NTL in Qingdao surged 99.52% (from 114,204 to 227,863 nW·cm−2·sr−1), characterized by coastal and new urban zone expansion, alongside a polycentric spatial pattern aligning with the ‘One-Core, Three-Wings’ development strategy. By contrast, Singapore exhibited near-saturation growth (1.05%), consistent with the luminosity-ceiling hypothesis [47]. This pattern contrasts sharply with rapidly growing Southeast Asian cities. Cam Ranh rose by 146.54% (from 9054 to 22,321 nW·cm−2·sr−1), concentrated around the deep-water port; Kuching grew by 80.66% (from 41,609 to 75,169 nW·cm−2·sr−1) with flattened density gradients; Manila increased by 21.80% (21.80%, from 68,277 to 83,159 nW·cm−2·sr−1) via peripheral sprawl; Colombo rose by 57.07% (from 8102 to 12,726 nW·cm−2·sr−1); Dubai increased by 56.25% (from 303,463 to 474,170 nW·cm−2·sr−1) with a multicentric distribution.
NTL in Cairo increased by 94.71% (from 70,809 to 137,871 nW·cm−2·sr−1), ranking second among all studied cities. This aligns with documented North African urban development trends. Spatial analysis revealed greater luminosity increases along the Nile riverbanks compared to the desert fringe areas, highlighting hydrological influences on urban development. Accelerated growth post-2018 may reflect impacts from Egypt’s new administrative capital development.
European cities demonstrated divergent patterns. NTL in Athens grew by 18.98% (from 222,154 to 264,312 nW·cm−2·sr−1), with stable luminosity in historical cores and most of the growth occurring in peripheral areas, exemplifying successful heritage conservation strategies. Conversely, Kyiv, Ukraine, experienced a 53.72% decline (from 59,251 to 27,423 nW·cm−2·sr−1), with abrupt decreases post-February 2022, quantitatively confirming conflict impacts on urban infrastructure.
Bahía Blanca showed 28.59% growth (from 41,690 to 53,610 nW·cm−2·sr−1), characteristic of mid-sized port cities. NTL expansion primarily followed transport corridors. Observed cyclical growth patterns provide new evidence regarding resource-dependent urban development.
3.2. Urban Land Use Dynamics and NTL Validation in Port City Clusters
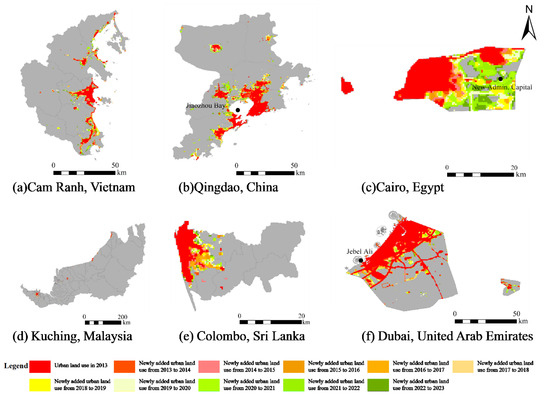
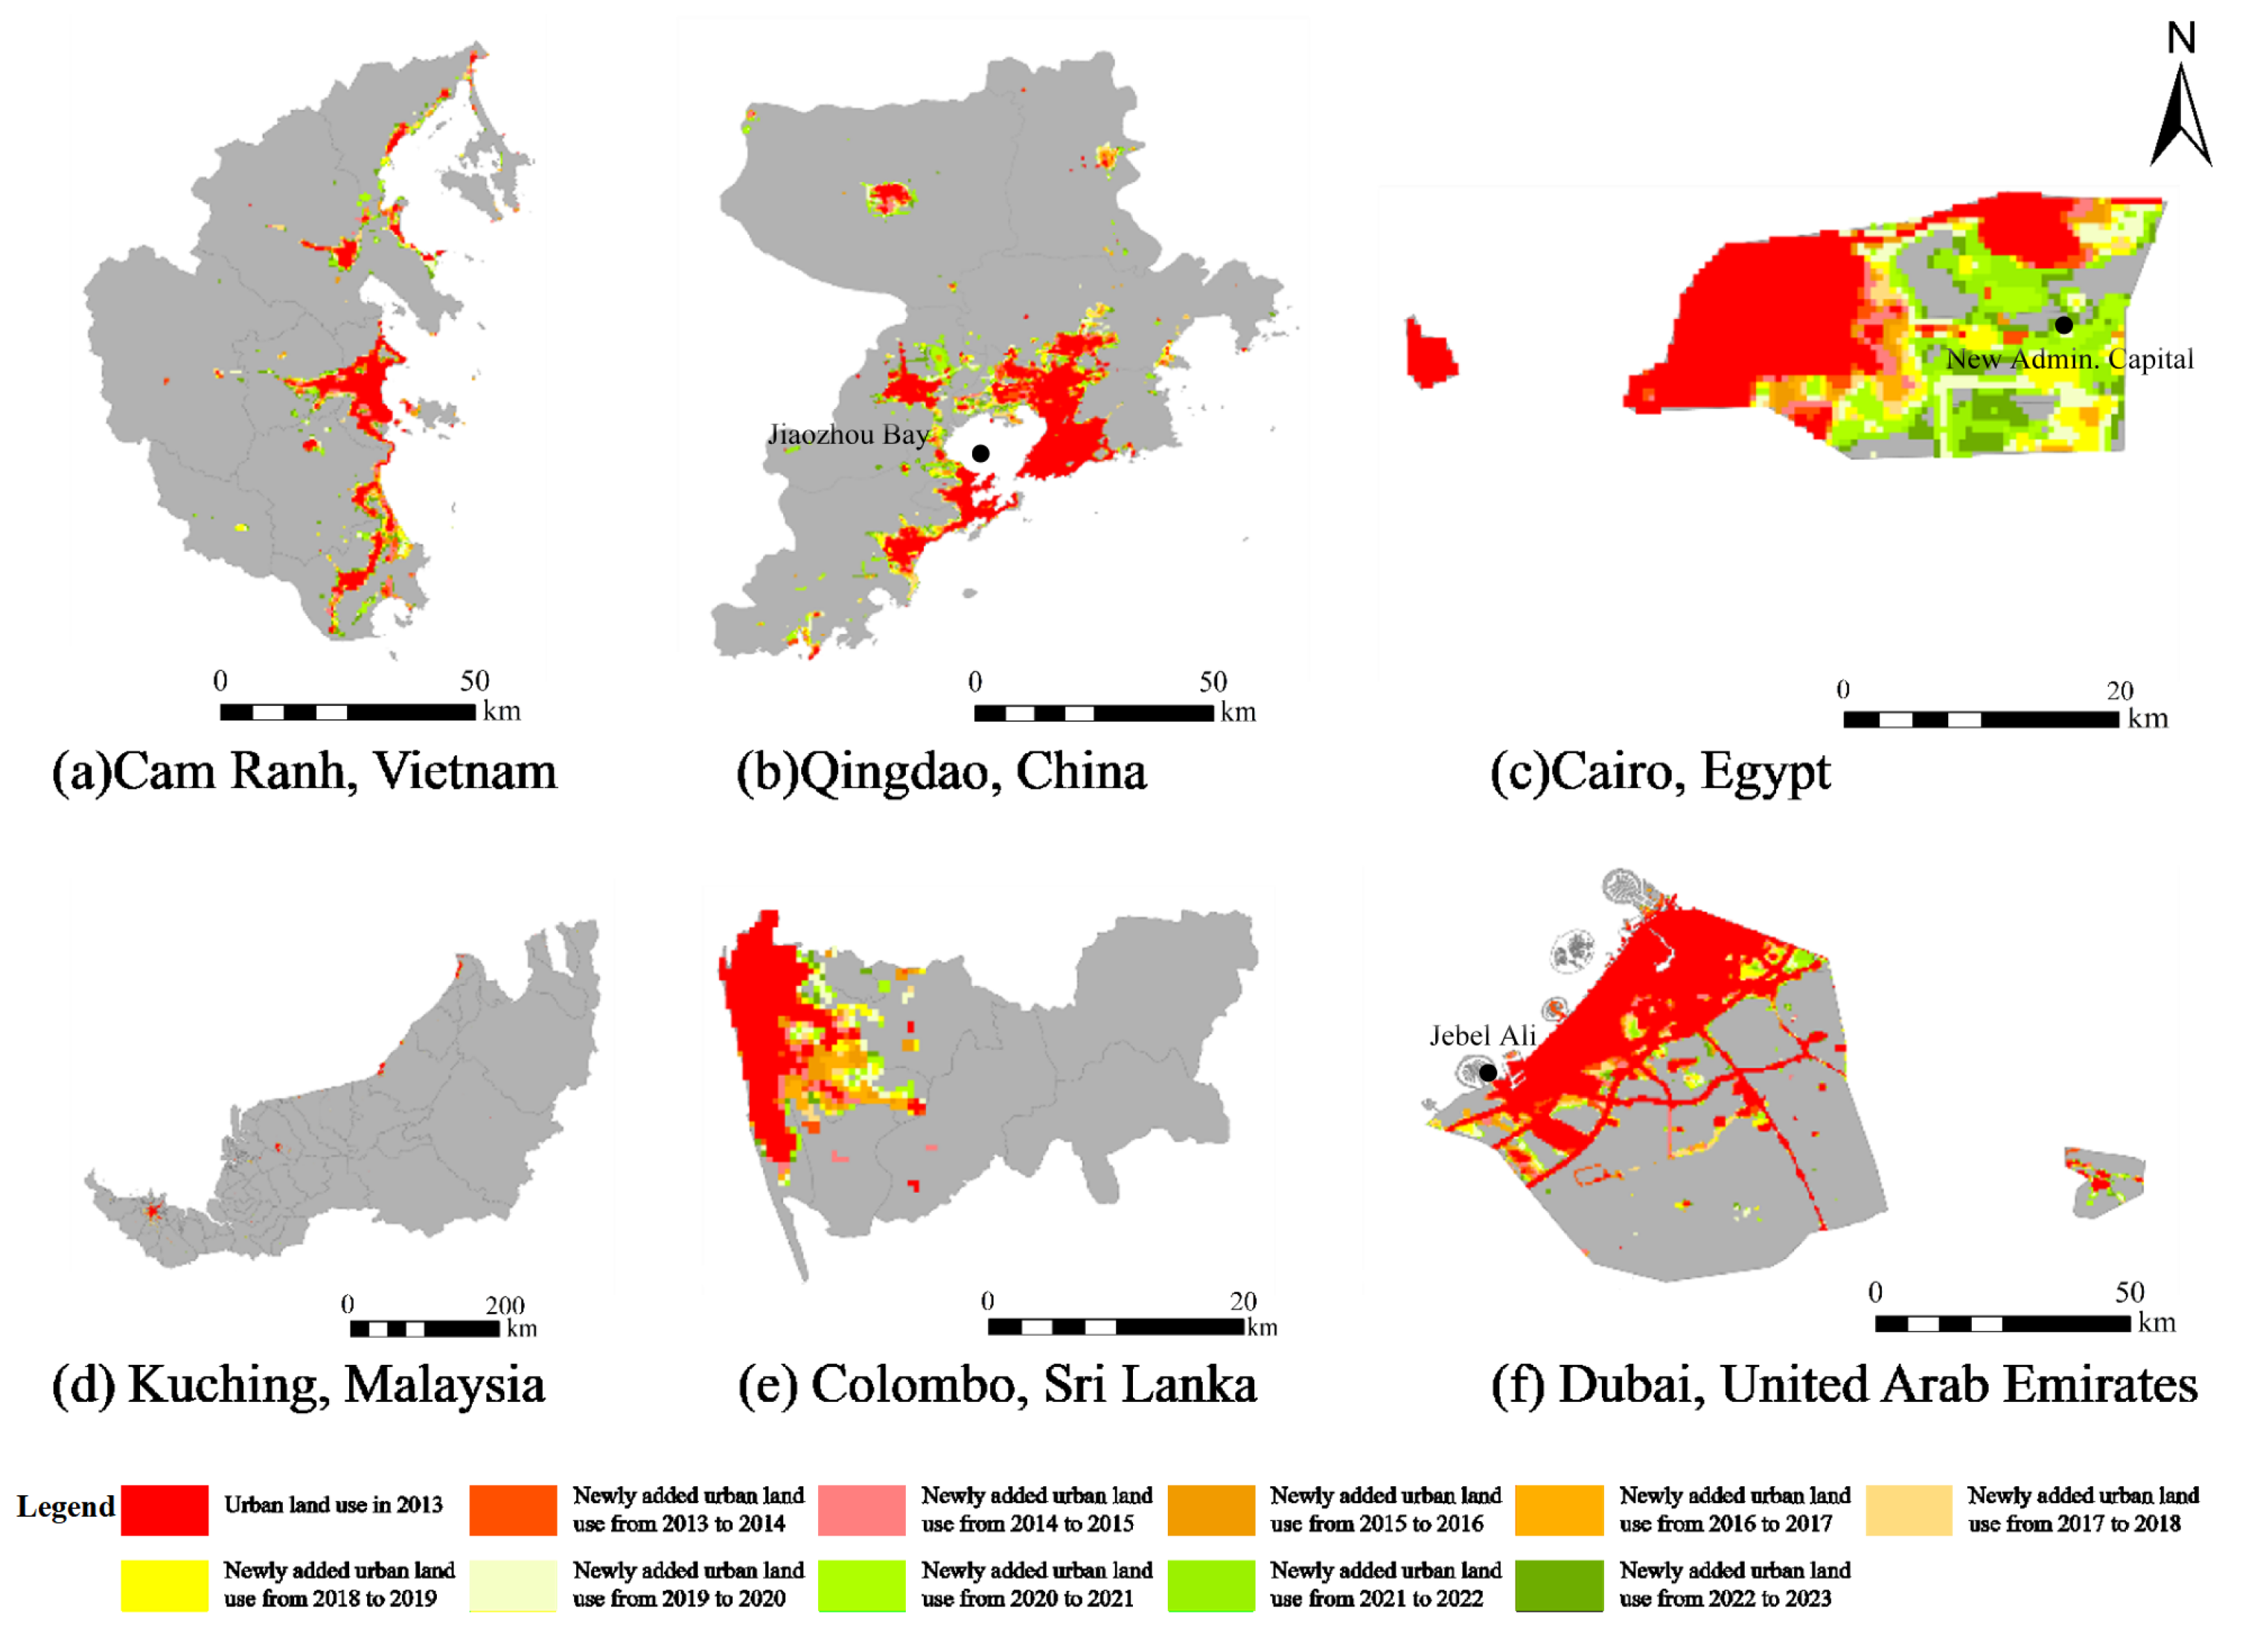
Urban land-use maps (2013–2023) reveal heterogeneous expansion among six ports (Figure 4). The selected cases—Cam Ranh (Vietnam), Qingdao (China), Cairo (Egypt), Kuching (Malaysia), Colombo (Sri Lanka), and Dubai (UAE)—demonstrate heterogeneous growth trajectories through sequential land cover changes visualized by temporal color gradients (deep red to light green).
Figure 4.
The spatiotemporal dynamics of urban land among six port cities from 2013 to 2023. For Kuching (Malaysia) and Cam Ranh (Vietnam), extended boundaries (Sarawak; Khánh Hòa) were applied to capture port-related hinterlands, while municipal cores are highlighted for clarity.
Asian port cities exhibit pronounced urban expansion patterns predominantly driven by infrastructure development. Qingdao added 78% of new urban land (2013–2018) around Jiaozhou Bay, with 62% within 5 km of the coast; Cam Ranh devoted 54% of additions (2015–2020) to logistics near the deep-water port; Kuching showed 41% leapfrog expansion beyond existing built-up areas after 2017; Colombo developed linearly along the Colombo–Katunayake corridor.
Middle Eastern and African port cities demonstrate distinct urban expansion trajectories characterized by strategic economic diversification. Dubai’s urban growth was polycentric, with three distinct hotspots: Jebel Ali Free Zone (2013–2015), Dubai South (2016–2018), and Deira waterfront (2019–2023). Only 28% of new land was port-adjacent, reflecting its transition to a service-oriented global city. Cairo displayed Nile-dependent expansion, where 81% of new urban land emerged within 3 km of the river. Post-2018 growth concentrated eastward toward the New Administrative Capital, showing state-led spatial redistribution—a phenomenon previously documented in satellite studies.
To strengthen the robustness of our NTL-based interpretations, we conducted a qualitative year-by-year comparison of NTL and GDP trajectories (2013–2023) to examine whether they move in the same direction. The purpose is to examine whether radiance dynamics broadly correspond to recognized socio-economic changes, rather than being artifacts of lighting policies or sensor noise. The results show strong directional consistency. We conducted a qualitative year-by-year comparison of NTL and GDP trajectories (2013–2023) to examine whether they move in the same direction. While no formal correlation test was conducted, the observed consistency in annual trends supports NTL’s validity as a proxy for economic development. Cairo’s radiance increase of +94.71% coincides with a population increase of +12.1%, reflecting demographic-driven urban intensification. Colombo’s NTL growth of +57.07% aligns with a +59.5% rise in port throughput, suggesting that port-related economic activity is effectively captured by nightlight dynamics.
3.3. Quantifying Spatiotemporal Patterns of NTL Distribution Through SDE Analysis
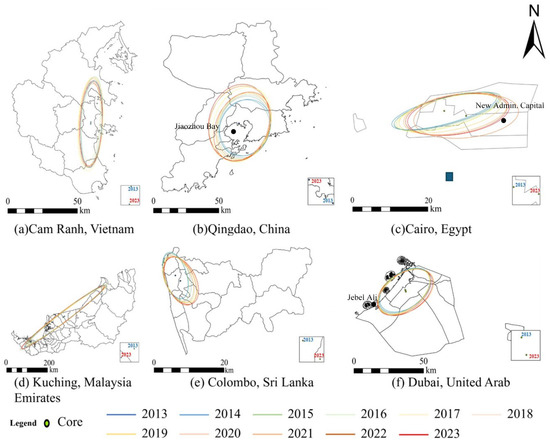
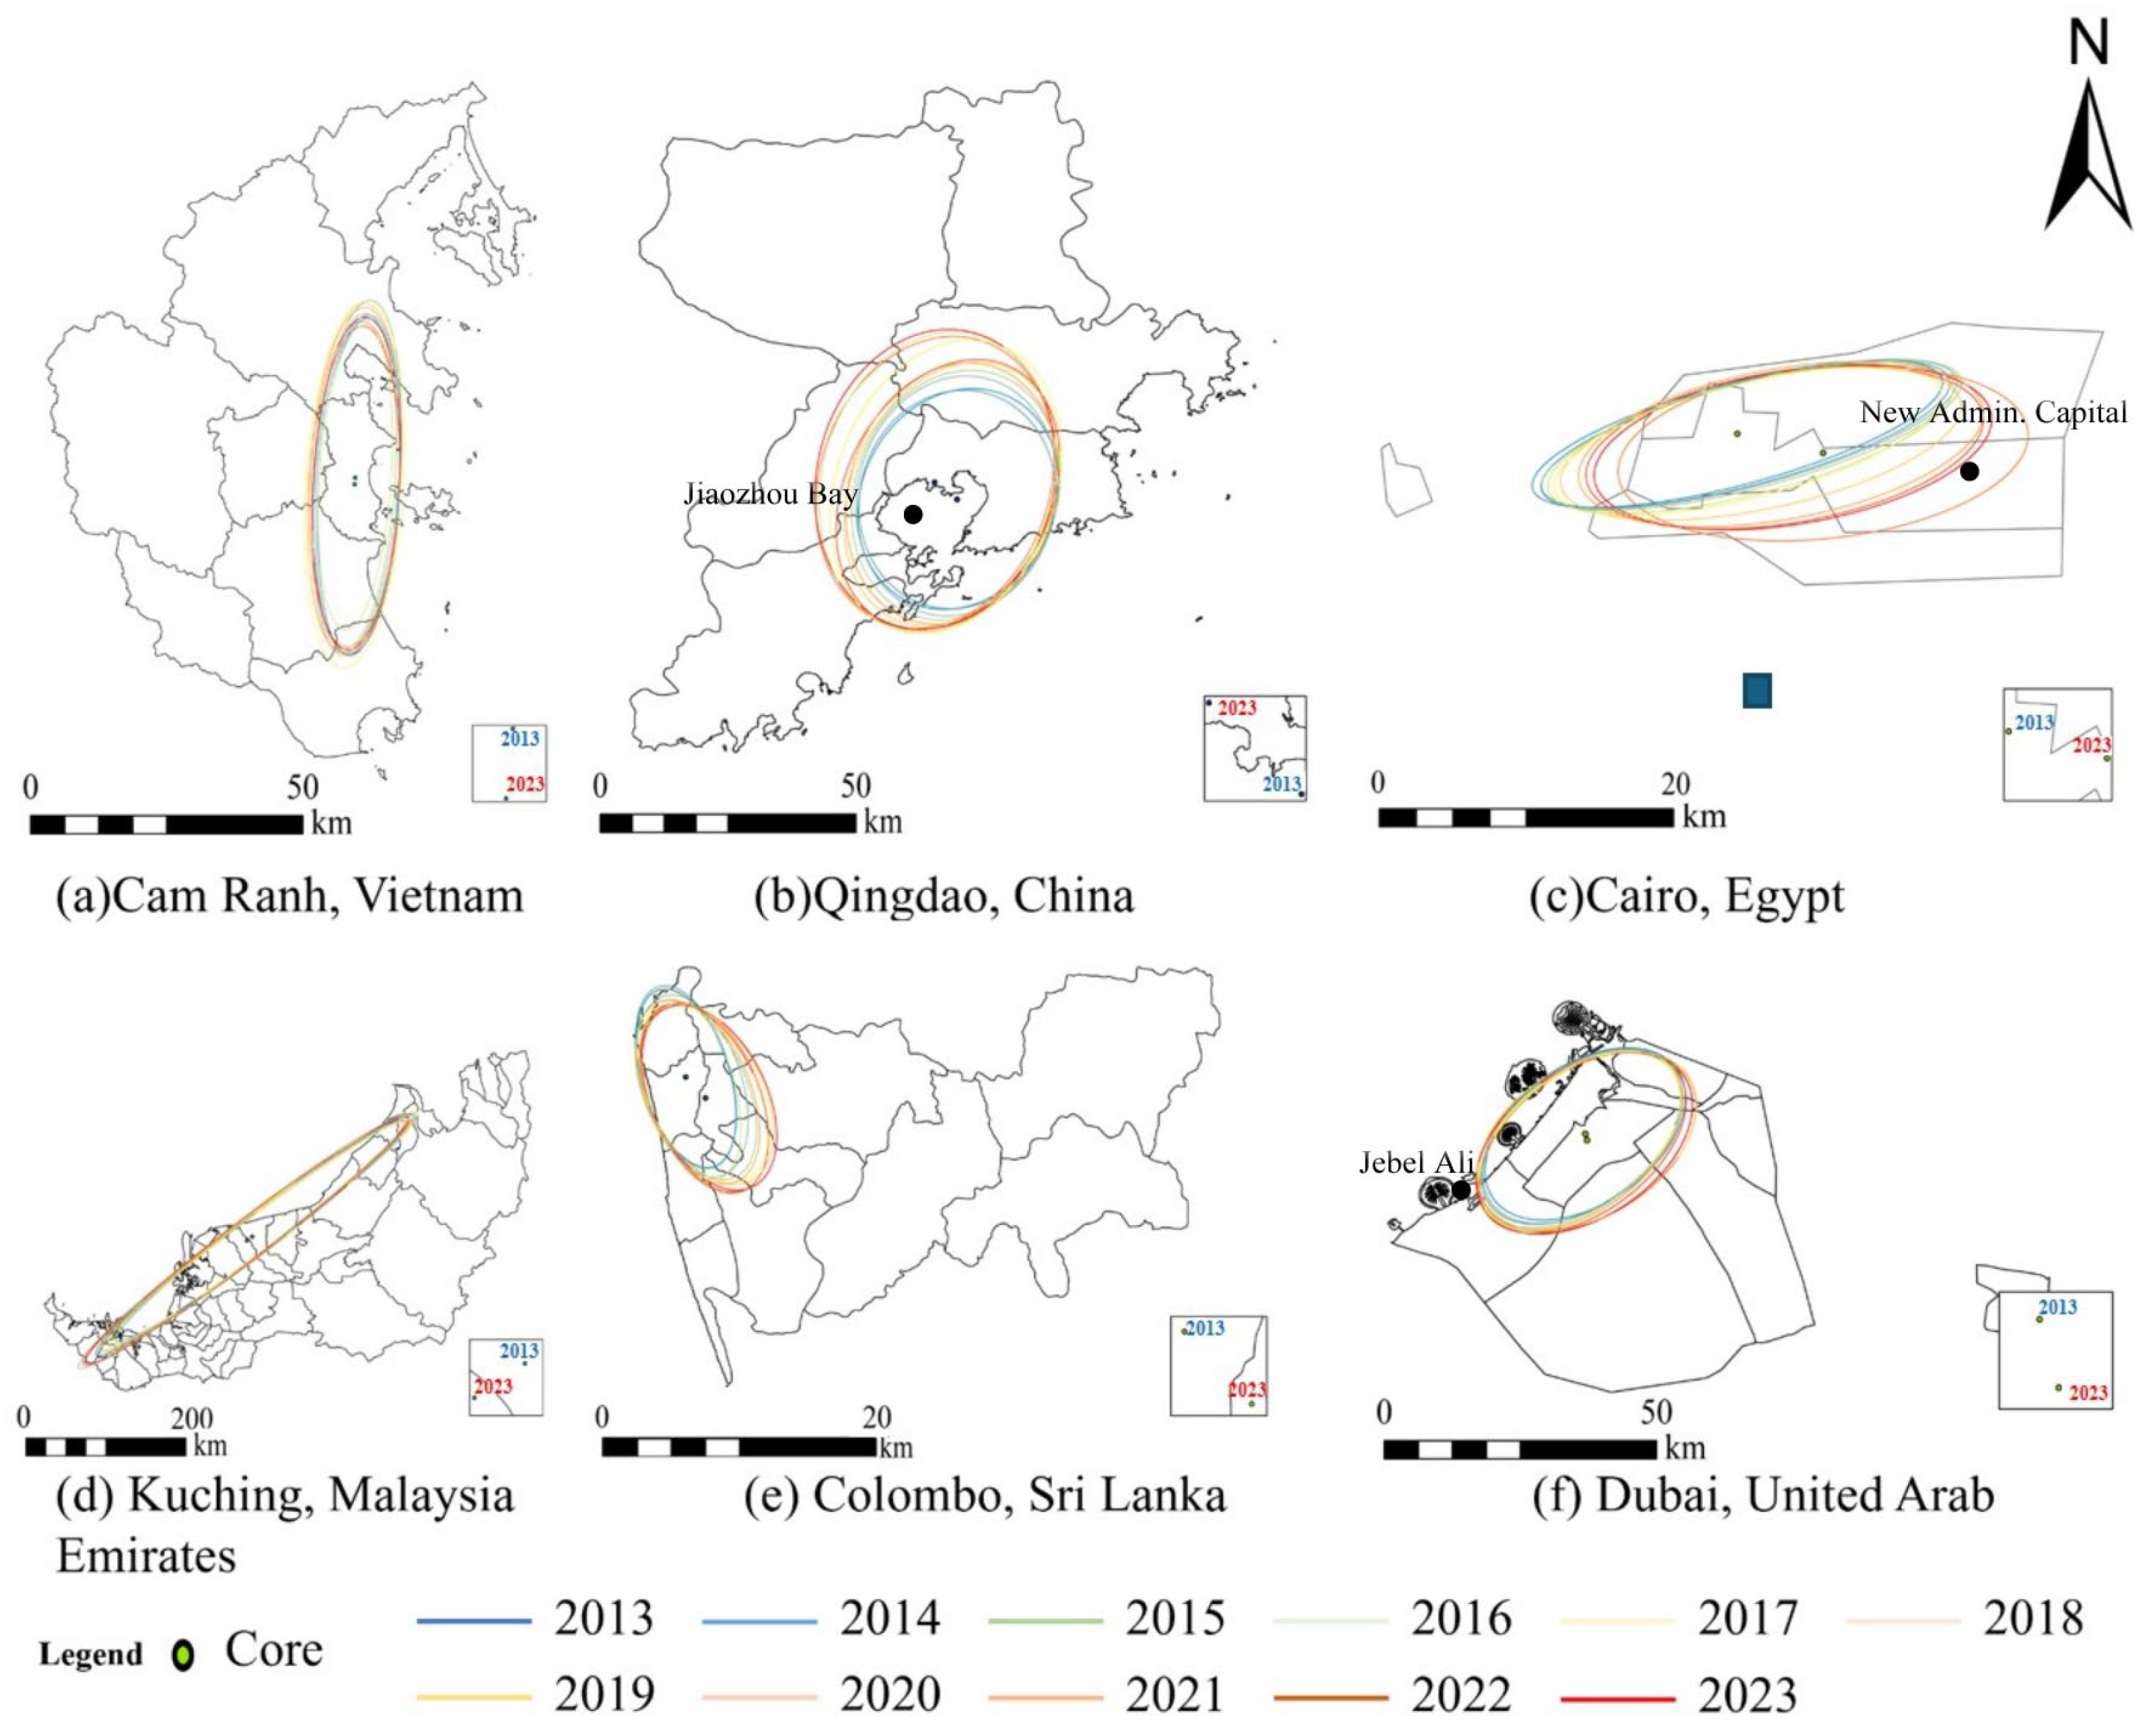
SDE analysis reveals distinct spatiotemporal dynamics in NTL expansion patterns across six port cities, reflecting varied urban–industrial growth models and maritime infrastructural transformations (Figure 5). These findings underscore the SDE method’s efficacy in quantifying not only the spatial spread but also the directional evolution of urban–industrial expansion around port cores. The observed divergence across cities reflects differentiated development strategies rooted in local geographic, institutional, and economic conditions.
Figure 5.
SDE change in six port cities from 2013 to 2023.
In Cam Ranh, Vietnam (a), ellipses display radial and concentric patterns centered around the deep-water port core (11.95° N, 109.21° E). The 2015–2018 ellipses exhibit dense clustering within a 5 km radius, indicative of intense infrastructure development and port activity consolidation. Notably, ellipses post-2020 shift northwestward, suggesting operational extensions beyond the traditional port zone, possibly linked to logistics decentralization or hinterland integration strategies.
Qingdao, China (b) exhibits a coastal-linear SDE orientation along Jiaozhou Bay with outward elongation toward the sea. Between 2013 and 2016, ellipses remained tightly bound within a 10 km zone near the port centroid (36.07° N, 120.33° E). From 2017 onward, there has been a notable outward elongation toward the sea, consistent with coastal expansion trends observed in high-tier Chinese maritime hubs.
In Cairo, Egypt (c), ellipses tightly align with the Nile River corridor, with approximately 85% of centroids located within 3 km of the riverbanks. The ellipses maintain a stable azimuth orientation over the decade, indicating a strong hydro-geographic constraint. A notable eastward trajectory shift post-2018 parallels the spatial shift of urban and logistic functions toward the New Administrative Capital, validating prior findings on spatial coupling between transport infrastructure and governance restructuring.
Contrasting patterns are evident in Kuching (d) and Colombo (e). In Kuching, post-2017 ellipses are highly fragmented, reflecting discontinuous peri-urban industrialization. Colombo, by contrast, develops an elongated corridor along the Colombo–Katunayake axis, consistent with planned economic zones and port–airport integration.
Dubai, UAE (f) displays a polycentric and phased SDE evolution, with three dominant clusters: Jebel Ali (2013–2015), Dubai South (2016–2018), and Deira Waterfront (2019–2023). Only 28% of ellipses intersect the legacy port area, suggesting a structural decoupling of modern logistics development from historical port geographies. This aligns with broader Gulf megacity trends toward inland logistics hub development.
3.4. Rank-Size Distribution Analysis of NTL
Double-logarithmic regression results of NTL across six Belt and Road port cities from 2013 to 2023 reveal pronounced differences in spatial hierarchy; most yearly fits have R2 > 0.75, indicating robust explanatory power. Five out of six cities show declining || values over time, indicating a broad trend toward spatial decentralization and growing complexity in urban form. Cam Ranh demonstrates the most rapid shift, while Kuching maintains the highest level of monocentric stability. These findings validate the effectiveness of rank-size analysis in diagnosing spatial structure changes using remote sensing and complementing prior models of urban scaling and hierarchy.
As shown in Table 3, the double-logarithmic regressions provide complete estimation results for the rank-size distributions of six representative BRI port cities, including slope parameters (), intercepts, and model fit statistics. While this detailed presentation ensures methodological transparency, it does not readily convey broader cross-city patterns. To facilitate comparison, Table 4 summarizes the evolution of the Zipf slopes () and goodness-of-fit values (R2) between 2013 and 2023, together with the changes (Δ). This condensed view highlights divergent hierarchical trajectories: for example, Qingdao and Cam Ranh experienced pronounced decentralization, Colombo moved closer to the Zipf benchmark (q ≈ 1), whereas Cairo reinforced primacy. By juxtaposing Table 3 and Table 4, we combine technical rigor with interpretive clarity, enabling both statistical evaluation and substantive insights.
Table 3.
Double Logarithmic Regression Results of the Rank-Size Distribution for Representative Port Cities along the BRI (2013–2023).
Table 4.
Summary of Zipf slopes (q) and goodness-of-fit (R2) for six representative BRI port cities (2013–2023).
Qingdao and Cam Ranh exhibit || values consistently greater than 1 across all observed years, characterizing classical primacy-type distributions with dominant first-tier NTL centers. Qingdao’s || values declined moderately from 2.13 in 2013 to 1.92 in 2023, representing a 9.86% reduction, which reflects a gradual diffusion of nighttime activity into secondary zones, although the city’s urban light structure remains dominated by its core area. Cam Ranh, by contrast, displays more pronounced volatility, with || peaking at 2.35 in 2019—likely corresponding with intensified infrastructure development—and declining to 1.91 by 2023, suggesting a strong decentralization trend and increased spatial heterogeneity within the urban system.
Kuching stands out for both consistency and concentration. Its || remains above 2.50 in all years, and R2 averages 0.94, implying a highly monocentric structure where NTL is concentrated in a singular dominant node, likely associated with industrial zoning and low urban diffusion. The lack of slope variation suggests that urban development remains tightly clustered, with limited evolution in spatial form. Colombo and Dubai represent more balanced or polycentric transition patterns. Colombo’s || declined from 1.80 to 1.63 over the decade, indicating a flattening hierarchy and the rise of mid-tier NTL centers, possibly linked to peri-urban expansion. Dubai’s slope remained within a narrow band (1.40–1.52), reflecting not only population and economic primacy but also the emergence of planned polycentric systems spanning Jebel Ali, Dubai South, and Deira. Cairo represents a divergent case, where || increased from 1.32 to 1.60, implying growing light concentration in the urban core amid weakening rank-order relationships. This shift likely reflects state-driven investment patterns, particularly linked to the spatial redirection of national capital infrastructure. These divergent trajectories are further discussed in Section 4, where we interpret deviations from Zipf’s law in light of geographic constraints and policy interventions.
4. Discussion
4.1. Relationship Between NTL Changes and Urban Development
The decadal NTL analysis (2013–2023) identifies three fundamental patterns in the urban development of BRI port cities. First, NTL growth rates display pronounced spatial heterogeneity that corresponds to different stages of urban development. Asian cities exhibit the most pronounced radiance surges, exemplified by Cam Ranh, Vietnam (+146.54%) and Qingdao, China (+99.52%), both representing prototypical cases of infrastructure-led expansion [48]. These growth patterns align with urban scaling theory [49,50], wherein emerging cities display superlinear scaling of infrastructure deployment. In contrast, mature hubs such as Singapore exhibit near-saturation growth (+1.05%), largely attributable to energy efficiency gains offsetting spatial expansion [51]. The polycentric light distribution in Qingdao, with 78% of NTL growth occurring within coastal zones, demonstrating how maritime infrastructure reshapes urban morphology.
Second, the SDE analysis uncovers how geophysical and institutional factors constrain urban expansion. Cairo’s Nile-aligned growth demonstrates riverine dominance on urban form [52], while Kuching’s persistent monocentricity (|| > 2.5 throughout the decade) reflects Malaysia’s rigid industrial zoning policies. These findings challenge the assumption of isotropic urban growth, instead showing that coastal cities exhibit seaward elongation, riverine cities maintain hydrological alignment, and policy-driven cities display artificial clustering. The SDE parameters effectively capture these differentiated urbanization trajectories, providing quantitative metrics for comparative urban studies.
Third, the rank-size analysis reveals a BRI-induced decentralization trend, with || values declining in 83% of studied cities (e.g., Qingdao’s 9.86% reduction). This contrasts sharply with traditional primate city models, suggesting that infrastructure investments are creating more balanced urban hierarchies. The exceptions prove insightful—Kuching’s stable high || values (2.50–2.76) correlate with its single-industry economic base, while Colombo’s fluctuating || (1.63–1.93) mirrors its ongoing transition from port-centric to diversified economy. These patterns demonstrate that NTL dynamics capture not just economic growth but also the spatial imprint of governance models and transnational infrastructure investments [53].
Importantly, these qualitative comparisons with external indicators confirm that NTL dynamics align with recognized socio-economic trends. While NTL cannot capture all aspects of development (such as efficiency improvements or policy-driven changes in lighting), the observed consistency with GDP growth, demographic expansion, and port throughput strengthens its credibility as a proxy. Nevertheless, we emphasize that NTL should be regarded as indicative rather than determinative, and should ideally be interpreted in conjunction with ground-based statistics.
4.2. Impact of the BRI on NTL Changes in Node Cities
The BRI has fundamentally transformed urban development trajectories across its port cities, with NTL dynamics serving as a robust proxy for assessing these multidimensional impacts. Our decade-long analysis (2013–2023) reveals that BRI’s influence operates through three synergistic mechanisms: infrastructure-led spatial restructuring, trade-induced economic reorganization, and policy-driven urban hierarchy transformation. The infrastructure investment component has been particularly transformative, generating distinctive NTL signatures across different development contexts. These patterns contrast sharply with mature hubs like Singapore (1.05% growth), where BRI investments primarily upgraded existing infrastructure rather than creating new urban footprints.
Trade facilitation measures have induced more complex NTL patterns that reflect evolving economic geographies. The establishment of 37 Special Economic Zones (SEZs) along maritime routes has created discontinuous luminosity clusters, with Dubai’s tripartite growth (Jebel Ali, Dubai South, Deira) showing a 56.25% aggregate increase, but with most of the new growth occurring outside traditional port areas. This spatial decoupling of port functions and urban expansion challenges conventional port-city models. Similarly, transport corridor effects manifest as elongated NTL patterns—Colombo’s linear growth along the Katunayake Expressway demonstrates how BRI reshapes urban form through mobility infrastructure [54].
As summarized in Table 3, the Zipf slopes () and associated fit statistics (R2) reveal divergent trajectories across the six representative port cities between 2013 and 2023. The results indicate heterogeneous hierarchical adjustments: Qingdao (Δ = −0.629) and Cam Ranh (Δ = −0.352) experienced notable decentralization, consistent with the emergence of secondary growth centers; Colombo (Δ = −0.178) also declined, moving closer to the canonical Zipf benchmark ( ≈ 1). By contrast, Cairo (Δ = +0.279) reinforced primacy, plausibly linked to the concentration of development near the New Administrative Capital [55]. Meanwhile, Kuching and Dubai remained stable, with minimal slope changes and consistently strong fits, suggesting relatively persistent hierarchical structures.
These deviations from Zipf’s law are analytically meaningful, but they should be interpreted with caution. The observed differences are likely shaped by a combination of demographic, geographic, and institutional conditions rather than any single causal mechanism. Our intention is not to infer causality, but rather to provide a comparative framework that highlights where and how port-city hierarchies diverge from theoretical expectations under the BRI context.
4.3. Comparison with Other Studies
Through a decade-long analysis (2013–2023) utilizing VIIRS NTL data, this study systematically evaluates urban development patterns within BRI regions. We identify and quantify four distinct growth typologies: (i) concentric industrialization (Cam Ranh’s clustering with most of new NTL within port zones), (ii) linear corridor development (Colombo’s expressway-aligned expansion contributing more than a half of total growth), (iii) strategic polycentricity (Dubai’s tripartite structure showing significant growth), and (iv) hydro-institutional determinism (Cairo’s Nile-oriented pattern with slight azimuth variation). These typologies reflect the increasingly polycentric structure of BRI port-city systems, consistent with recent VIIRS-based analyses [45,56,57] and spatial configuration studies of port networks [58,59].
At the same time, we acknowledge that we did not implement explicit spatial econometric models. Approaches such as the SAR, SEM, or SDM would allow for a more rigorous treatment of spatial autocorrelation, spillover effects, and regional linkages across cities [60,61]. Due to data and scope constraints, these models were not applied in the current analysis, but we regard them as a critical avenue for future research. Incorporating such frameworks will further strengthen the reliability of inferences on how spatial dependencies shape the evolution of Belt and Road port-city clusters. In addition, future studies could extend this framework by including non-BRI ports for comparison, thereby providing a broader context and deeper insights into development patterns influenced by the BRI.
5. Conclusions
5.1. Main Findings
This study analyzed the spatiotemporal dynamics of 12 Belt and Road port cities using decade-long VIIRS NTL data. Rather than reiterating all empirical results, we emphasize three broader implications: (i) BRI-related infrastructure investment has amplified spatial heterogeneity among port cities; (ii) the rank-size evidence points to a gradual shift toward more polycentric urban hierarchies; and (iii) NTL data provide a robust diagnostic tool for monitoring development trajectories in contexts where conventional socio-economic statistics are scarce. These findings move beyond descriptive outcomes to highlight the strategic role of NTL monitoring in guiding sustainable port-city development.
First, the observed heterogeneous NTL growth across BRI port cities may be associated with BRI-related infrastructure investments. Cam Ranh (Vietnam) recorded the highest average annual growth rate, concentrated around its deep-water port. In contrast, mature hubs like Singapore showed near-saturation growth. The SDE analysis further quantified directional tendencies of urban expansion, indicating that Qingdao exhibits a pronounced coastal-linear growth pattern with an estimated 15° axis rotation [62]. However, as our analysis does not directly model investment flows, we treat this as a correlation rather than a causal inference. Future research could explicitly compare BRI and non-BRI port cities to identify whether the observed heterogeneity can be attributed to infrastructure investments under the BRI framework.
Second, rank-size analysis reveals a counterintuitive trend toward polycentricity in BRI cities, challenging traditional primate-city models. Here we use “secondary cities” to denote the non-primate, next-ranked NTL-defined nodes within each port-city system; their strengthening—signaled by lower || together with stable SDE-based shape metrics—matters for polycentric growth, logistics redundancy, and the diffusion of benefits beyond the primate. While most cities exhibited declining || values (mean reduction: 18.7%), signaling decentralization, exceptions like Kuching (|| > 2.5 throughout) reflect rigid industrial zoning policies. Notably, Colombo’s || decline (1.80 to 1.63) correlates with its transition from a port-centric to a diversified economy, supported by BRI-induced transport corridors [63,64]. This divergence highlights BRI’s role in reshaping urban hierarchies through infrastructure bundling and secondary-city prioritization.
Third, NTL dynamics capture the spatial imprint of geopolitical and economic shocks. Kyiv’s 53.72% radiance decline post-2022 quantifies conflict-induced urban decay [65,66], while Dubai’s polycentric growth (56.25% increase) reflects its strategic decoupling from legacy port zones. These findings underscore NTL’s utility in monitoring BRI’s adaptive resilience, particularly in volatile regions. Mathematically, the study contributes a compact, reproducible formulation that couples SDE-based shape metrics with the Zipf exponent and a percentage-reduction measure to diagnose polycentric transition.
5.2. Policy Recommendations
Based on the empirical findings of this study, we propose three targeted policy recommendations to optimize the development of port cities along the BRI and enhance their sustainable urbanization trajectories.
First, infrastructure investments should prioritize polycentric and spatially balanced development to mitigate urban primacy risks. Our rank-size analysis reveals that BRI port cities exhibit varying degrees of decentralization (e.g., Colombo’s || decline from 1.80 to 1.63), yet some (e.g., Kuching, || > 2.5) remain overly concentrated due to rigid zoning policies. From a policy perspective, our results confirm the value of NTL as a proxy for monitoring urbanization in BRI port cities. The heterogeneous growth rates (Figure 3) and directional patterns identified by SDE analysis (Figure 5) show clear spatial disparities, which policymakers should consider in infrastructure and regional planning. While not prescribing industrial strategies, the study highlights path-dependent urban growth. Future research could test industrial spillover effects and assess NTL-based approaches to carbon auditing. Second, NTL monitoring should be institutionalized as a real-time tool for assessing BRI’s socioeconomic impacts. The study demonstrates NTL’s efficacy in tracking urbanization (e.g., Cairo’s 94.71% radiance growth), conflict impacts (Kyiv’s 53.72% decline post-2022), and industrial spillovers (Dubai’s 56.25% increase) [18,48,51]. We recommend establishing a BRI Urban Observatory that integrates VIIRS data with ground metrics (e.g., GDP, energy use) to create a Nightlight Development Index (NDI). This index could flag enclave risks and guide equitable resource allocation. Third, green energy investments must be scaled in tandem with port modernization to curb emissions from rapid urbanization. Asian BRI cities exhibited extreme NTL growth (up to 146.54%), often linked to fossil-fueled industrialization. Policies should mandate “green port certification,” requiring solar/wind integration (e.g., Singapore’s energy storage projects) and enforce NTL-based carbon audits to monitor compliance. The Global Urban Footprint (GUF) framework can quantify urban sprawl’s ecological costs, while machine learning (e.g., CNN land-use classification) can identify optimal sites for renewable energy zones.
5.3. Limitations and Future Research Directions
While this study advances the understanding of BRI port city development using NTL data, several limitations merit attention. First, the use of VIIRS NTL data faces spatial resolution constraints (500 m) and blooming effects that may blur functional land distinctions in dense port areas. Integrating high-resolution sensors (e.g., Luojia-1, Sentinel-2) and applying convolutional neural networks (CNNs) can improve classification accuracy and isolate true radiance sources [6,11,67]. Second, the aggregated nature of NTL obscures economic heterogeneity; future research may incorporate auxiliary datasets such as AIS ship traffic, industrial park boundaries, and mobile phone activity to model sector-specific dynamics. Third, the delineation of spatial units across national boundaries remains challenging. Applying functional urban area (FUA) frameworks and integrating multimodal indicators could improve robustness and early-warning capabilities under geopolitical shocks such as the Russia–Ukraine conflict [38]. Addressing these issues would enhance the analytical precision and policy relevance of future NTL-based urban models.
To deepen the mathematical modeling of urban dynamics along the BRI, future research should prioritize three interrelated directions. First, multi-source data integration is essential for enhancing classification accuracy in urban functional zones. By combining VIIRS NTL data with hyperspectral imagery or synthetic aperture radar (SAR), future studies can resolve persistent ambiguities in land-use interpretation, particularly in distinguishing between high-luminosity zones such as deep-water ports, logistics parks, and industrial corridors. Second, city-specific dynamic scaling models should be developed to estimate the elasticity between NTL and economic output. Establishing a time-varying NTL–GDP elasticity function for each city will allow for a more accurate quantification of economic spillover effects and infrastructure responsiveness under the BRI framework [47,68,69]. Third, there is a growing need for policy-adaptive mathematical frameworks. For example, a real-time “NTL Policy Dashboard” could be constructed using moving-window regressions or spatio-temporal clustering techniques to guide investment decisions, monitor development phases, and evaluate the effectiveness of regional plans dynamically.
Author Contributions
Formal analysis, R.Y. and T.S.; investigation, R.Y. and W.C.; methodology, R.Y. and S.J.; writing—original draft, R.Y. and T.S.; writing—review and editing, W.C. and J.Z. All authors have read and agreed to the published version of the manuscript.
Funding
This research was funded by National Science Foundation of China (41571508).
Data Availability Statement
The data presented in this study are available on request from the corresponding author due to their large size and format, which require reasonable arrangements for sharing.
Acknowledgments
The authors gratefully acknowledge the valuable assistance of Hanchen Yu, Zeyi Yan, and Jie Shen in data processing and spatial analysis, as well as their constructive comments that helped improve the clarity of this paper.
Conflicts of Interest
Author Weiwei Cao was employed by the CITIC Group Corporation. The remaining authors declare that the research was conducted in the absence of any commercial or financial relationships that could be construed as a potential conflict of interest.
Appendix A
Table A1.
Strategic Port Cities with BRI Investment Cooperation (2013–2023).
References
- Ruta, M.; Dappe, M.H.; Lall, S.V.; Zhang, C.; Constantinescu, C.; Lebrand, M.; Mulabdic, A.; Churchill, E. Belt and Road Economics: Opportunities and Risks of Transport Corridors; World Bank Group: Washington, DC, USA, 2019; Available online: https://searchworks.stanford.edu/view/13460440 (accessed on 21 October 2025).
- Ducruet, C.; Notteboom, T. The worldwide maritime network of container shipping: Spatial structure and regional dynamics. Glob. Netw. 2012, 12, 395–423. [Google Scholar] [CrossRef] [Scilit]
- Wilmsmeier, G.; Monios, J. Institutional structure and agency in the governance of spatial diversification of port system evolution in Latin America. J. Transp. Geogr. 2016, 51, 294–307. [Google Scholar] [CrossRef] [Scilit]
- Jean, N.; Burke, M.; Xie, M.; Alampay Davis, W.M.; Lobell, D.B.; Ermon, S. Combining satellite imagery and machine learning to predict poverty. Science 2016, 353, 790–794. [Google Scholar] [CrossRef] [Scilit] [PubMed]
- Wardrop, N.A.; Jochem, W.C.; Bird, T.J.; Chamberlain, H.R.; Clarke, D.; Kerr, D.; Bengtsson, L.; Juran, S.; Seaman, V.; Tatem, A.J. Spatially disaggregated population estimates in the absence of national population and housing census data. Proc. Natl. Acad. Sci. USA 2018, 115, 3529–3537. [Google Scholar] [CrossRef] [Scilit] [PubMed]
- Elvidge, C.D.; Baugh, K.; Zhizhin, M.; Hsu, F.C.; Ghosh, T. VIIRS night-time lights. In Remote Sensing of Night-Time Light; Routledge: Oxfordshire, UK, 2021; pp. 6–25. [Google Scholar]
- Li, X.; Zhou, Y. Urban mapping using DMSP/OLS stable night-time light: A review. Int. J. Remote Sens. 2017, 38, 6030–6046. [Google Scholar] [CrossRef] [Scilit]
- Liang, H.; Dong, L.; Tanikawa, H.; Zhang, N.; Gao, Z.; Luo, X. Feasibility of a new-generation nighttime light data for estimating in-use steel stock of buildings and civil engineering infrastructures. Resour. Conserv. Recycl. 2017, 123, 11–23. [Google Scholar] [CrossRef] [Scilit]
- Li, X.; Zhou, Y.; Zhao, M.; Zhao, X. A harmonized global nighttime light dataset 1992–2018. Sci. Data 2020, 7, 168. [Google Scholar] [CrossRef] [Scilit]
- Elvidge, C.D.; Baugh, K.E.; Zhizhin, M.; Hsu, F.-C. Why VIIRS data are superior to DMSP for mapping nighttime lights. Proc. Asia-Pac. Adv. Netw. 2013, 35, 62. [Google Scholar] [CrossRef] [Scilit]
- Zheng, Q.; Seto, K.C.; Zhou, Y.; You, S.; Weng, Q. Nighttime light remote sensing for urban applications: Progress, challenges, and prospects. ISPRS J. Photogramm. Remote Sens. 2023, 202, 125–141. [Google Scholar] [CrossRef] [Scilit]
- Hsu, F.-C.; Baugh, K.E.; Ghosh, T.; Zhizhin, M.; Elvidge, C.D. DMSP-OLS radiance calibrated nighttime lights time series with intercalibration. Remote Sens. 2015, 7, 1855–1876. [Google Scholar] [CrossRef] [Scilit]
- Wang, Z.; Shrestha, R.M.; Román, M.O.; Kalb, V.L. NASA’s black marble multiangle nighttime lights temporal composites. IEEE Geosci. Remote Sens. Lett. 2022, 19, 1–5. [Google Scholar] [CrossRef] [Scilit]
- Elvidge, C.D.; Keith, D.M.; Tuttle, B.T.; Baugh, K.E. Spectral identification of lighting type and character. Sensors 2010, 10, 3961–3988. [Google Scholar] [CrossRef] [Scilit]
- Zheng, Q.; Weng, Q.; Huang, L.; Wang, K.; Deng, J.; Jiang, R.; Ye, Z.; Gan, M. A new source of multi-spectral high spatial resolution night-time light imagery—JL1-3B. Remote Sens. Environ. 2018, 215, 300–312. [Google Scholar] [CrossRef] [Scilit]
- Ma, T. Multi-level relationships between satellite-derived nighttime lighting signals and social media–derived human population dynamics. Remote Sens. 2018, 10, 1128. [Google Scholar] [CrossRef] [Scilit]
- Liu, L.; Zhou, H.; Lan, M.; Wang, Z. Linking Luojia 1-01 nightlight imagery to urban crime. Appl. Geogr. 2020, 125, 102267. [Google Scholar] [CrossRef] [Scilit]
- Mård, J.; Di Baldassarre, G.; Mazzoleni, M. Nighttime light data reveal how flood protection shapes human proximity to rivers. Sci. Adv. 2018, 4, eaar5779. [Google Scholar] [CrossRef] [Scilit]
- Bauer, S.E.; Wagner, S.E.; Burch, J.; Bayakly, R.; Vena, J.E. A case-referent study: Light at night and breast cancer risk in Georgia. Int. J. Health Geogr. 2013, 12, 23. [Google Scholar] [CrossRef] [Scilit]
- Zheng, Q.; Teo, H.C.; Koh, L.P. Artificial light at night advances spring phenology in the United States. Remote Sens. 2021, 13, 399. [Google Scholar] [CrossRef] [Scilit]
- Richard, H.; Somers-Yeates, R.; Bennie, J.; Economou, T.; Hodgson, D.; Spalding, A.; McGregor, P.K. Light pollution is associated with earlier tree budburst across the United Kingdom. Proc. R. Soc. B Biol. Sci. 2016, 283, 20160813. [Google Scholar] [CrossRef] [Scilit]
- Wei, J.; He, G.; Yan, P.; Wang, G.; Wang, M. Application potentiality and prospects of nighttime light remote sensing in “the Belt and Road” initiative. J. Univ. Chin. Acad. Sci. 2017, 34, 296. [Google Scholar] [CrossRef]
- Li, D.; Yu, H.; Li, X. Spatiotemporal patterns of urban development in Belt and Road countries using nighttime light remote sensing. Geomat. Inf. Sci. Wuhan Univ. 2017, 42, 711–720. (In Chinese) [Google Scholar] [CrossRef]
- Hai, K.; Wang, S.; Ma, Y.; Yang, R.; Tu, P. Urban expansion and form changes along the Belt and Road Initiative. Acta Geogr. Sin. 2020, 75, 2092–2108. (In Chinese) [Google Scholar] [CrossRef]
- Stokes, E.C.; Seto, K.C. Characterizing urban infrastructural transitions for the Sustainable Development Goals using multi-temporal land, population, and nighttime light data. Remote Sens. Environ. 2019, 234, 111430. [Google Scholar] [CrossRef] [Scilit]
- Chaturvedi, V.; de Vries, W.T. Machine learning algorithms for urban land use planning: A review. Urban Sci. 2021, 5, 68. [Google Scholar] [CrossRef] [Scilit]
- Li, X.; Gong, P. Urban growth models: Progress and perspective. Sci. Bull. 2016, 61, 1637–1650. [Google Scholar] [CrossRef] [Scilit]
- Musa, S.I.; Hashim, M.; Reba, M.N.M. A review of geospatial-based urban growth models and modelling initiatives. Geocarto Int. 2017, 32, 813–833. [Google Scholar] [CrossRef] [Scilit]
- Unwin, D. Introductory Spatial Analysis; Routledge: Oxfordshire, UK, 2024. [Google Scholar]
- Palla, G.; Spitzer, H.; Klein, M.; Fischer, D.; Schaar, A.C.; Kuemmerle, L.B.; Rybakov, S.; Ibarra, I.L.; Holmberg, O.; Virshup, I. Squidpy: A scalable framework for spatial omics analysis. Nat. Methods 2022, 19, 171–178. [Google Scholar] [CrossRef] [Scilit]
- Zhao, E.; Stone, M.R.; Ren, X.; Guenthoer, J.; Smythe, K.S.; Pulliam, T.; Williams, S.R.; Uytingco, C.R.; Taylor, S.E.; Nghiem, P. Spatial transcriptomics at subspot resolution with BayesSpace. Nat. Biotechnol. 2021, 39, 1375–1384. [Google Scholar] [CrossRef] [Scilit]
- Wang, B.; Yu, M.; Zhu, Y.; Bao, P. Unveiling the driving factors of carbon emissions from industrial resource allocation in China: A spatial econometric perspective. Energy Policy 2021, 158, 112557. [Google Scholar] [CrossRef] [Scilit]
- Quito, B.; del Río, M.d.l.C.; Álvarez-García, J.; Bekun, F.V. Spatiotemporal influencing factors of energy efficiency in 43 european countries: A spatial econometric analysis. Renew. Sustain. Energy Rev. 2023, 182, 113340. [Google Scholar] [CrossRef] [Scilit]
- Anselin, L. Spatial Econometrics. In Handbook of Spatial Analysis in the Social Sciences; Springer: Dordrecht, The Netherlands, 2022; pp. 101–122. [Google Scholar]
- Saeed, N.; Cullinane, K.; Gekara, V.; Chhetri, P. Reconfiguring maritime networks due to the Belt and Road Initiative: Impact on bilateral trade flows. Marit. Econ. Logist. 2021, 23, 381. [Google Scholar] [CrossRef] [Scilit]
- Mou, N.; Ren, H.; Zheng, Y.; Chen, J.; Niu, J.; Yang, T.; Zhang, L.; Liu, F. Traffic inequality and relations in maritime silk road: A network flow analysis. ISPRS Int. J. Geo-Inf. 2021, 10, 40. [Google Scholar] [CrossRef] [Scilit]
- Anselin, L. Local indicators of spatial association—LISA. Geogr. Anal. 1995, 27, 93–115. [Google Scholar] [CrossRef] [Scilit]
- Florczyk, A.J.; Corbane, C.; Ehrlich, D.; Freire, S.; Kemper, T.; Maffenini, L.; Melchiorri, M.; Pesaresi, M.; Politis, P.; Schiavina, M. GHSL data package 2019. Luxemb. Eur 2019, 29788, 290498. [Google Scholar] [CrossRef]
- Rozenfeld, H.D.; Rybski, D.; Gabaix, X.; Makse, H.A. The area and population of cities: New insights from a different perspective on cities. Am. Econ. Rev. 2011, 101, 2205–2225. [Google Scholar] [CrossRef] [Scilit]
- Fragkias, M.; Seto, K.C. Evolving rank-size distributions of intra-metropolitan urban clusters in South China. Comput. Environ. Urban Syst. 2009, 33, 189–199. [Google Scholar] [CrossRef] [Scilit]
- Gabaix, X. Zipf’s law for cities: An explanation. Q. J. Econ. 1999, 114, 739–767. [Google Scholar] [CrossRef] [Scilit]
- Newman, M.E. Power laws, Pareto distributions and Zipf’s law. Contemp. Phys. 2005, 46, 323–351. [Google Scholar] [CrossRef] [Scilit]
- Bettencourt, L.M.; Lobo, J.; Helbing, D.; Kühnert, C.; West, G.B. Growth, innovation, scaling, and the pace of life in cities. Proc. Natl. Acad. Sci. USA 2007, 104, 7301–7306. [Google Scholar] [CrossRef] [Scilit]
- Tu, Y.; Chen, Z.; Wang, C.; Yu, B.; Liu, B. Quantitative analysis of urban polycentric interaction using nighttime light data: A case study of Shanghai, China. IEEE J. Sel. Top. Appl. Earth Obs. Remote Sens. 2021, 15, 1114–1122. [Google Scholar] [CrossRef] [Scilit]
- Yang, Z.; Chen, Y.; Guo, G.; Zheng, Z.; Wu, Z. Using nighttime light data to identify the structure of polycentric cities and evaluate urban centers. Sci. Total Environ. 2021, 780, 146586. [Google Scholar] [CrossRef] [Scilit]
- Soo, K.T. Zipf’s Law for cities: A cross-country investigation. Reg. Sci. Urban Econ. 2005, 35, 239–263. [Google Scholar] [CrossRef] [Scilit]
- Henderson, J.V.; Storeygard, A.; Weil, D.N. Measuring economic growth from outer space. Am. Econ. Rev. 2012, 102, 994–1028. [Google Scholar] [CrossRef] [Scilit] [PubMed]
- Cao, C.; Zhang, B.; Xia, F.; Bai, Y. Exploring VIIRS night light long-term time series with CNN/SI for urban change detection and aerosol monitoring. Remote Sens. 2022, 14, 3126. [Google Scholar] [CrossRef] [Scilit]
- Lobo, J.; Bettencourt, L.; Ortman, S.G. Urban scaling theory: Answers to frequent questions. Environ. Plan. B Urban Anal. City Sci. 2024, 52, 1701–1716. [Google Scholar] [CrossRef] [Scilit]
- Cao, Z.; Gao, F.; Wu, Z.; Zhang, Q.; Zheng, Z.; Li, Z.; Hai, X. Quantifying the spatiotemporal mismatches between energy consumption and population: A comparative study in Guangzhou and Shenzhen, China. Cities 2025, 156, 105522. [Google Scholar] [CrossRef] [Scilit]
- Small, C. Spatiotemporal characterization of VIIRS night light. Front. Remote Sens. 2021, 2, 775399. [Google Scholar] [CrossRef] [Scilit]
- Xu, G.; Zhou, Z.; Jiao, L.; Zhao, R. Compact urban form and expansion pattern slow down the decline in urban densities: A global perspective. Land Use Policy 2020, 94, 104563. [Google Scholar] [CrossRef] [Scilit]
- Tang, X.; Huang, X.; Tian, J.; Jiang, Y.; Ding, X.; Liu, W. A spatiotemporal framework for the joint risk assessments of urban flood and urban heat island. Int. J. Appl. Earth Obs. Geoinf. 2024, 127, 103686. [Google Scholar] [CrossRef] [Scilit]
- Apostolopoulou, E. Tracing the links between infrastructure-led development, urban transformation, and inequality in China’s belt and road initiative. Antipode 2021, 53, 831–858. [Google Scholar] [CrossRef] [Scilit]
- Elmouelhi, H. New administrative capital—Cairo. Power, urban development and social injustice—The official Egyptian model of neoliberalism. In Neoliberale Urbanisierung Stadtentwicklun; De Gruyter Brill: Berlin, Germany, 2019; pp. 215–254. [Google Scholar] [CrossRef] [Scilit]
- Chen, Z.; Yu, B.; Song, W.; Liu, H.; Wu, Q.; Shi, K.; Wu, J. A new approach for detecting urban centers and their spatial structure with nighttime light remote sensing. IEEE Trans. Geosci. Remote Sens. 2017, 55, 6305–6319. [Google Scholar] [CrossRef] [Scilit]
- Ma, M.; Lang, Q.; Yang, H.; Shi, K.; Ge, W. Identification of polycentric cities in China based on NPP-VIIRS nighttime light data. Remote Sens. 2020, 12, 3248. [Google Scholar] [CrossRef] [Scilit]
- Guo, J.; Qin, Y. Coupling characteristics of coastal ports and urban network systems based on flow space theory: Empirical evidence from China. Habitat Int. 2022, 126, 102624. [Google Scholar] [CrossRef] [Scilit]
- Tagawa, H.; Kawasaki, T.; Hanaoka, S. Evaluation of international maritime network configuration and impact of port cooperation on port hierarchy. Transp. Policy 2022, 123, 14–24. [Google Scholar] [CrossRef] [Scilit]
- Abdo, A.-B.; Li, B.; Zhang, X.; Lu, J.; Rasheed, A. Influence of FDI on environmental pollution in selected Arab countries: A spatial econometric analysis perspective. Environ. Sci. Pollut. Res. 2020, 27, 28222–28246. [Google Scholar] [CrossRef] [Scilit] [PubMed]
- Amidi, S.; Fagheh Majidi, A. Geographic proximity, trade and economic growth: A spatial econometrics approach. Ann. GIS 2020, 26, 49–63. [Google Scholar] [CrossRef] [Scilit]
- Lewis, P. Shaping Suburbia: How Political Institutions Organize Urban Development; University of Pittsburgh Pre: Pittsburgh, PA, USA, 2010. [Google Scholar] [CrossRef] [Scilit]
- Ullah, A.A. Connectivity and Mobility: The Transformative Impact of BRI on Migration Dynamics in the MENA. Politics Policy 2025, 53, e70048. [Google Scholar] [CrossRef] [Scilit]
- Chen, X. The Belt and Road Initiative at 10 and Corridor Connectivity; The World Financial Review: London, UK, 2023; Available online: https://worldfinancialreview.com/from-the-middle-out-and-bottom-up-the-belt-and-road-initiative-at-10-and-corridor-connectivity/ (accessed on 21 October 2025).
- Bartlett, A.; Alix–Garcia, J.; Saah, D.S. City growth under conflict conditions: The view from Nyala, Darfur. City Community 2012, 11, 151–170. [Google Scholar] [CrossRef] [Scilit]
- Büscher, K. African cities and violent conflict: The urban dimension of conflict and post conflict dynamics in Central and Eastern Africa. In Urban Africa and Violent Conflict; Routledge: Oxfordshire, UK, 2020; pp. 1–18. [Google Scholar] [CrossRef] [Scilit]
- Reichstein, M.; Camps-Valls, G.; Stevens, B.; Jung, M.; Denzler, J.; Carvalhais, N.; Prabhat, F. Deep learning and process understanding for data-driven Earth system science. Nature 2019, 566, 195–204. [Google Scholar] [CrossRef] [Scilit]
- Ashraf, J.; Luo, L.; Khan, M.A. The spillover effects of institutional quality and economic openness on economic growth for the belt and road initiative (BRI) countries. Spat. Stat. 2022, 47, 100566. [Google Scholar] [CrossRef] [Scilit]
- Hu, J.; Wang, S.; Huang, K.; Wei, Q.; Chen, H. Spillover-feedback effects of social, economic, and environmental footprints based on the “Belt and Road Initiative”. J. Environ. Manag. 2022, 305, 114414. [Google Scholar] [CrossRef] [Scilit] [PubMed]

Disclaimer/Publisher’s Note: The statements, opinions and data contained in all publications are solely those of the individual author(s) and contributor(s) and not of MDPI and/or the editor(s). MDPI and/or the editor(s) disclaim responsibility for any injury to people or property resulting from any ideas, methods, instructions or products referred to in the content. |
© 2025 by the authors. Licensee MDPI, Basel, Switzerland. This article is an open access article distributed under the terms and conditions of the Creative Commons Attribution (CC BY) license (https://creativecommons.org/licenses/by/4.0/).