


Abstract
Social-emotional development (SED) is foundational to early learning, yet its observable forms change from infancy through the primary grades. Assessments can describe children’s current behavior, but without an explicit developmental structure, it is difficult to interpret how observations at different ages relate to a continuing developmental process. This study presents a theory-informed developmental progression for SED, operationalized in the Desired Results Developmental Profile 2025 (DRDP 2025) and examines the degree to which educator ratings are consistent with its proposed structure. Using field study data from 2022 children rated by 314 educators, we applied Rasch-family item response modeling to evaluate threshold ordering, item fit, dimensionality, reliability, differential item functioning (DIF), and person fit. All five SED items fit within prespecified bounds, and thresholds for corresponding developmental levels clustered across items as hypothesized. Dimensionality analyses supported a unidimensional reporting structure, and person separation reliability was 0.97. No SED item showed DIF of concern across seven demographic contrasts. SED scores increased with age (r = 0.75), consistent with the proposed ordering, although the cross-sectional design does not establish within-child progression. Positive person misfit occurred for 12% of children overall and 26% of those assessed with the grade 1–3 form. Findings provide initial support for interpreting DRDP 2025 SED scores on a common developmental continuum spanning infancy through grade 3, while identifying grade 1–3 response profiles and educator rating processes as priorities for further validation.
1. Introduction
The importance of social and emotional development (SED) to early learning and later well-being is well established. D. E. Jones et al. (2015) followed 753 children from kindergarten to age 25 and found that kindergarten ratings of social competence—including sharing, cooperating, and helping others—predicted educational attainment, employment, and criminal justice involvement two decades later. For example, each one-point increase on a five-point social competence scale was associated with twice the odds of completing college. Moffitt et al. (2011), following approximately 1000 individuals from birth to age 32, found that childhood self-control predicted adult health, wealth, and public safety outcomes after accounting for intelligence and social class. Durlak et al.’s (2011) meta-analysis of 213 school-based social and emotional learning programs involving more than 270,000 students found an average 11-percentile-point gain in academic achievement, along with reductions in conduct problems and emotional distress.
Social-emotional development is also a central domain of early childhood learning frameworks because children’s capacities to regulate emotion, engage with adults and peers, and participate in shared activity shape their access to learning opportunities (National Education Goals Panel [NEGP], 1995). For early educators, SED assessment goes beyond describing children’s functioning to inform the environments, interactions, and supports that foster further learning (Yates et al., 2008).
The strong evidence for SED’s importance—in development and in education—creates a corresponding need for assessments that represent how social-emotional competencies develop. Many commonly used assessments ask a parent, caregiver, or teacher whether a child demonstrates a particular skill and how frequently it occurs. Although such ratings provide useful information about current behavior, frequency scores alone do not locate a child on a principled developmental trajectory indicating what typically precedes a skill, what the child may be consolidating, and what may emerge next. This developmental information can help teachers interpret current performance and plan instruction responsive to individual children (Dunphy, 2010; National Research Council [NRC], 2008). This paper presents and evaluates one approach to addressing that need: a theory-informed, empirically grounded learning progression (LP) for SED from infancy through grade 3, operationalized through the Desired Results Developmental Profile 2025 (DRDP 2025).
1.1. The Assessment Landscape and Its Structural Limits
Recognition of SED’s importance has contributed to the development of a wide range of assessments for use in educational settings, including rating scales, screeners, structured observations, and performance-based measures. Berg et al. (2017) reviewed 136 SED frameworks from 14 areas of study and found that fewer than 10% organized competencies into a developmental sequence; most relied primarily on theoretical rather than empirical support for their structure. Halle and Darling-Churchill (2016) reviewed 75 measures as candidates for large-scale use and identified only six as strong candidates based on psychometric and practical criteria. They also noted that similar item content was sometimes used to assess multiple subdomains, suggesting overlap in how constructs such as emotion regulation and self-management are operationally defined.
The underlying measurement challenge is what Denham et al. (2009) describe as heterotypic continuity: the observable form of a competency changes across developmental periods even as the underlying construct remains continuous. Emotion regulation, for example, may look qualitatively different in a four-year-old than in an eight-year-old, although both expressions reflect the same developing capacity. Many instruments are designed for a particular developmental period, and comparisons across age bands may therefore depend on continuity assumptions that have not been tested empirically. Darling-Churchill and Lippman (2016) concluded their review of the SED measurement landscape by calling for “a useful developmental taxonomy that would classify the subdomains of SED … within a clearly articulated framework and then map each classification onto psychometrically strong measures” (p. 6). This call frames the need for assessment systems that connect a clearly articulated developmental structure to an empirically evaluated measurement model.
Continuity across developmental periods matters in education because children’s underlying competencies continue to develop as they move from preschool to elementary school, even though their observable expressions and contexts change. A common progression can support continuity in observation, communication, and planning across settings. Recent work by Kamei et al. (2026), for example, involved collaborations with early childhood teachers to adapt and validate observational assessments and develop empirically calibrated progressions in social processes and emotional understanding for children ages 2 through 6. Their findings illustrate how developmentally ordered assessment information can support intentional teaching in early childhood. The present study extends this line of inquiry by evaluating whether five facets of SED can be represented on a common observational continuum spanning infancy through grade 3. This continuum is developmental rather than age- or grade-normative: it does not assume that children of the same age occupy the same level or that every child follows an identical sequence—an idea that is discussed throughout.
1.2. Developmental Progressions and Formative Use
In this paper, development refers to changes in children’s increasingly differentiated, coordinated, and autonomous SED functioning. Learning refers to changes supported through experience, interaction, participation, and instruction. The terms are related but not interchangeable: the progression describes a hypothesized developmental organization of competence, whereas its purpose in formative assessment is to help educators identify learning opportunities that will be maximally responsive to children’s current functioning.
An LP locates a child within an ordered sequence of qualitatively distinct developmental levels. Each level describes competencies that are likely to be established at that position and provides hypotheses about what may emerge next. Wilson (2023) formalizes these levels as waypoints: defined regions on a calibrated developmental continuum, each with a developmental description and an associated range of measurement uncertainty. Griffin (2007) described LP-based scores derived through Rasch calibration as “a code for a level of development” (p. 87), communicating current status while orienting educators toward possible next steps. Frequency-based ratings alone generally do not provide this developmental orientation.
Evidence for the formative use of LP-based assessments is growing. Harris et al. (2022) reviewed 59 empirical studies and found evidence that LP-based assessments can support judgments about learning, instructional decision-making, and teacher development. Twenty-three studies examined student achievement and generally reported positive effects, although only six used experimental designs capable of supporting causal inferences. In early childhood, Mangione et al. (2019) documented teachers’ use of DRDP learning progressions during weekly team-reflection meetings. Teachers reported that the LP levels helped them “anticipate what may come next,” and the study found improvements on associated measures of instructional quality. These findings support the potential utility of LP-based assessment while also pointing out open questions about the conditions needed for effective implementation.
1.3. SED as Hierarchically Organized Development
A core premise of this work is that social-emotional competence typically develops through increasingly complex forms of coordination, as earlier and less differentiated capacities are integrated into more sophisticated ones. Fischer and Bidell’s (2006) constructive web framework captures this process: skills develop from simpler to more complex forms through active construction in particular relational, cultural, and situational contexts. Development may therefore show both order and substantial variability across individuals, domains, settings, and occasions. An LP for SED does not posit a universal or deterministic sequence. Rather, it represents hypothesized, probabilistic pathways that characterize development across a population while allowing for variation in pace, sequence, and expression.
Developmental and neuroscientific research provides a broader foundation for this view. Immordino-Yang et al. (2019) emphasize that social, emotional, and cognitive processes are psychologically and neurobiologically intertwined; brain networks do not process only one of these forms of information. Similarly, Cantor et al. (2019) describe development as involving the integration of affective, cognitive, social, and emotional processes within relationships and sociocultural contexts. This literature therefore supports the premise that SED involves increasingly coordinated capacities developing through interactions between children and their environments. It does not, in itself, establish the particular sequence represented in the DRDP construct map; that sequence is an empirical hypothesis evaluated in the present study.
1.4. The Measurement Framework
Consistent with the Standards for Educational and Psychological Testing (AERA et al., 2014), validity is treated here as the degree to which evidence and theory support specified interpretations and uses of scores. The primary interpretation evaluated is that DRDP 2025 SED scores locate children on a probabilistic developmental continuum. The intended formative use is to interpret that location, together with item-level observations, to understand current functioning and consider possible next learning opportunities. The present study contributes primarily content and internal-structure evidence, with additional evidence concerning response processes, relations with age, and subgroup comparability; it does not directly test instructional effects or consequences of operational use.
The methodological foundation of this paper is Wilson’s (2023) construct modeling framework, operationalized through the Berkeley Evaluation and Assessment Research (BEAR) Assessment System (BAS; Wilson & Sloane, 2000). The BAS organizes both instrument design and validation around four building blocks: (1) a construct map—a theory- and research-grounded hypothesis about the structure of the construct; (2) an items design—a plan for creating tasks or prompts that elicit evidence interpretable in relation to the construct map; (3) an outcome space—ordered response categories with defined developmental meanings; and (4) a Wright map—a representation of person locations and item thresholds on a common Rasch measurement scale, used here to examine the degree to which observed response patterns are consistent with the hypothesized ordering. Together, the four building blocks support an integrated validity argument: theory guides design, empirical evidence evaluates the resulting measurement structure, and discrepancies can prompt revisions to the system.
The DRDP 2025 was developed through a multidisciplinary process involving child development researchers, subject matter experts, practicing early childhood educators, language specialists, and disability experts. The process included iterative review cycles and pilot psychometric analysis before the final item set was approved for the large-scale field study (Sussman et al., 2026). Item content development was driven by external subject matter expert panels organized around the span of the progressions. Seven experts reviewed the infant/toddler levels, and 24 reviewed the preschool-through-grade-3 levels, with one expert serving on both panels. The panels were intentionally multidisciplinary. Their collective expertise encompassed infant and child development; social-emotional development; early relationships; self-regulation and executive function; language, literacy, and multilingual development; disability and developmental assessment; motor and cognitive development; pediatric and clinical practice; early childhood and elementary education; teacher learning; and assessment design. This breadth was intended to ensure that the construct maps represented development across domains and age ranges while remaining observable and interpretable in educational settings.
Experts examined the construct definitions, developmental ordering, level descriptions, item content, and behavioral examples for construct relevance, developmental appropriateness, clarity, observability, and applicability across children with varied linguistic, cultural, and developmental characteristics. Experts focused on their area of expertise. Their feedback was used to identify gaps, refine distinctions between adjacent levels, revise examples and wording, and extend the progression into the primary grades. These expert reviews provide evidence based on test content; subsequent cognitive interviews, pilot testing, and psychometric analyses evaluated other features of the validity argument, including the degree to which educators interpreted and used the resulting content as intended.
Accessibility for multilingual learners and children with IEPs or IFSPs was incorporated into construct and item development. The teams of subject matter experts included specialists in multilingual development and bilingual assessment, special education, autism, visual impairment, physical disabilities, and alternative forms of communication. Experts and other interest holders reviewed the item level descriptions and behavioral examples for linguistic, communicative, sensory, and motor demands that were not essential to the constructs being assessed. Their recommendations led to revisions intended to make the same underlying competencies observable across a wider range of children.
Consistent with the universal design principles established for the DRDP 2015 (DCRG, 2018) and extended in the DRDP 2025, the instrument permits children to demonstrate competence through speech, sign, gesture, augmentative and alternative communication, and other routinely used adaptations. Rubric examples illustrate, for instance, communication through spoken or signed language and physical participation using mobility aids or other supports. Assessment may be conducted in any language. Bilingual review also identified potentially ambiguous descriptions and informed revisions and examples representing communication in Spanish, Mandarin, Vietnamese, and English. Within the SED domain, level descriptions and examples were revised so that verbal expression was not required when the intended competence could be demonstrated through nonverbal behavior, gesture, or sign.
These procedures were intended to reduce construct irrelevant linguistic, communicative, sensory, and physical access demands. Expert review and rubric revision contribute evidence based on test content; cognitive interviews and pilot testing contribute response process evidence to the extent that children and educators from the relevant groups were represented. The DIF analyses provide complementary empirical evidence by examining whether SED item functioning differed for multilingual learners, Spanish-speaking multilingual learners, and children receiving special education services after conditioning on estimated SED standing. An absence of DIF of concern in the contrasts examined is supportive of validity but of course does not, by itself, establish complete accessibility or fairness across disabilities, languages, settings, or forms of assessment use.
Hence, this development process contributes evidence based on test content to the emerging validity argument. The Rasch analyses that follow focus primarily on internal structure, including the extent to which the empirically estimated Thurstone thresholds are located as hypothesized by the developmental construct map.
1.5. Contributions of This Paper
The present study addresses three interrelated gaps in the literature:
- (1)
- A taxonomic gap: Berg et al. (2017) identified 136 SED frameworks, fewer than 10% of which specified a developmental sequence. This paper presents a theory-grounded, empirically testable construct map representing SED from infancy through grade 3 as a continuous developmental progression.
- (2)
- A psychometric gap: The previous version of the instrument, the DRDP 2015, provided evidence supporting an SED progression from infancy through kindergarten. To our knowledge, no published study has examined the degree to which that progression remains coherent when extended through grade 3. Drawing on an analytic sample of 2022 children from the DRDP 2025 field study (complete N = 2031 children), this paper presents Rasch-based evidence—including item fit, Wright map, dimensionality, person fit, and differential item functioning (DIF) analyses—concerning the developmental ordering and internal coherence of the extended scale and the consistency of item functioning across the demographic contrasts examined.
- (3)
- A measurement utility gap: This study extends prior work by evaluating a common, continuously calibrated observational SED progression spanning infancy through grade 3 and organizing the evidence around its intended developmental interpretation. Building on recent progress in developing empirically calibrated early childhood learning progressions, the present study examines how well a common SED continuum can be extended from infancy through the primary grades.
The evidence assembled here addresses the taxonomic and internal structure gaps directly and provides an initial basis for evaluating the scale’s intended formative use. The present study examines the degree to which early social-emotional development can be represented as a developmental progression that is theoretically motivated, empirically testable, and designed to support classroom use. The remainder of the paper is organized as follows. Section 2 describes the DRDP and the field study sample. Section 3, Section 4 and Section 5 contain the main analyses, contextualized in the four building blocks and related analyses, including DIF. Section 6 discusses the findings, their implications for P–3 SED assessment, and priorities for future research. A brief conclusion follows in Section 7.
2. Materials and Methods
2.1. The DRDP: Overview and Development History
The Desired Results Developmental Profile (DRDP) is a large-scale observational assessment system used in California, other U.S. states, and internationally. Its origins lie in the California Department of Education’s (CDE) implementation of an outcomes-based accountability system for state-funded early care and education programs (Kriener-Althen et al., 2020). Since 2001, CDE and the California Department of Social Services (CDSS) have collaborated with WestEd and the Berkeley Evaluation and Assessment Research (BEAR) Center at the University of California, Berkeley, to develop and evaluate successive generations of the instrument. The DRDP 2025 is the fifth generation of the assessment.
The instrument assesses children’s learning and development across five core dimensions: Approaches to Learning (ATL), Social and Emotional Development (SED), Foundational Language and Literacy Development (FLD), Cognition (COG, including early mathematics and science), and Physical Development–Health (PD-HLTH). This structure aligns with the five essential domains of school readiness articulated by National Education Goals Panel (NEGP, 1995) and subsequently reflected in the Head Start Early Learning Outcomes Framework (Office of Head Start, 2015).
The DRDP 2025 has three views designed for different populations and age ranges: the Infant/Toddler (IT) view, the Preschool/Transitional Kindergarten/Kindergarten (PTK) view, and the Preschool through Grade 3 (P–3) view. The views are linked to a common vertical scale through shared items and overlapping developmental levels, using the two-stage calibration procedure described in Section 2.4. In DRDP materials and practice, individual assessment items are referred to as measures.
The form labels identify intended educational settings, and although the assessments are aligned with California’s Early Learning Foundations, the labels are not linked with age- or grade-level performance standards. Generally speaking, programs for infants and toddlers serve children ages birth through three, and preschools typically serve children from two to five. In California, transitional kindergarten precedes kindergarten and serves younger children entering the public school system; presently children who are four years old on September 1 of the calendar year in which the school year begins. Grades 1–3 comprise the early elementary years and typically serve children ages six through nine. Because enrollment ages and developmental standing vary, age and grade are reported descriptively rather than used to define waypoint attainment. Section 2.3 contains more detailed information about these labels and the sample.
2.2. The DRDP 2025: Key Revisions to SED
The revision most relevant to this study is the extension of the SED scale through grade 3. The DRDP 2015 represented an SED continuum from infancy through the end of kindergarten; the DRDP 2025 extends that continuum through grade 3. This extension was developed by domain-specific, multidisciplinary teams through iterative rounds of expert review, interest-holder feedback, and pilot psychometric analysis. The extension through grade 3 is defined as the range of the instrument, not a grade-level expectation.
Additional revisions included alignment with California’s updated learning foundations, a reduction in the number of items to reduce educator assessment burden, and targeted changes intended to address the assessment needs of multilingual learners and children with Individualized Education Programs (IEPs) or Individualized Family Service Plans (IFSPs). The revisions were guided by the four-building-block framework described in the following sections.
2.3. Field Study: Sample and Procedure
The analyses reported in this paper draw on data from the DRDP 2025 Field Study, which was conducted to generate item response data for finalizing the instrument before statewide operational use. WestEd coordinated recruitment for the general education sample in collaboration with the CDE and CDSS. The Desired Results Access Project at the Napa County Office of Education coordinated recruitment for the special education sample. Sampling was purposive and stratified to obtain variation across setting type, geographic region, child race and ethnicity, home language, multilingual learner status, IEP or IFSP status, teaching experience, and prior DRDP experience. The sample was not selected using strict probability-based methods and should not be interpreted as statistically representative of California’s child or educator populations. Children’s demographic information was reported by their teachers. The study used the racial and ethnic classifications employed by CDE to describe the sample. These classifications are understood as socially constructed categories and are not interpreted as intrinsic explanations of children’s development or assessment performance. Racial and ethnic categories were examined because assessment performance and opportunity to demonstrate assessed behaviors may vary across social, cultural, linguistic, and institutional contexts. Children’s ethnicity may be identified as Hispanic or non-Hispanic separately from their racial classification. Children could be identified as multiracial: children identified as another race and White were grouped within the non-White race for this analysis.
The complete sample included 2031 children, but nine children were excluded because of data entry errors, yielding an analytic sample of 2022 children. Children were drawn from 34 counties in California: 18 from the northern part of the state, nine from the central part, and seven from the southern part. The age of the sample ranged from one to 112 months (M = 54.5, SD = 22.8). The children assessed with the IT instrument ranged in age from 5 to 46 months (M = 22.1, SD = 8.3), the children assessed with the PTK instrument ranged in age from 1 to 80 months (M = 54.8, SD = 11.0), and the 364 children assessed with the P–3 instrument ranged in age from 70 to 112 months (M = 88.4, SD = 10.0). The PTK instrument is suitable for young children, as it encompasses (and extends) the IT instrument. It may be selected by programs serving children of different ages, for simplicity and continuity.
Table 1 disaggregates the sample by several design factors: instrument, special education status, and number of teachers who rated children. The complete field study sample contained 1704 children in general education and 327 children in special education, rated by 314 educators across general and special education settings. Follow-up analysis showed that the median number of children rated per teacher was five in special education (range: 1 to 10) and seven in general education (range: 1 to 23). The table also separates the PTK instrument into two categories: preschool and transitional kindergarten/kindergarten. The table shows that the transitional kindergarten/kindergarten sample size was larger for general education, whereas the preschool sample was larger for special education.
Table 1.
DRDP 2025 Field Study—Complete Sample by Instrument.
Among general education children from preschool through grade 3, 45% to 50% were multilingual learners, depending on age group. Children identified by teachers as Latino/a represented 36% to 50% of each age group, with children identified as White, Asian, and Black also represented, in that relative order. Participating programs included rural and urban settings across northern, central, and southern California. Among participating educators, 76% had previous experience using the DRDP, whereas 24% were new to the instrument. The grade 1–3 educators were relatively inexperienced, with only four out of 22 reporting experience with the DRDP. It should be reinforced that in this design, instrument form, grade/age, educator group, and implementation context are difficult to separate.
Before data collection, participating educators completed approximately 10 h of webinars and online training designed to standardize the intended observation and rating process. Training introduced the developmental continuum underlying the DRDP, the organization of the instrument and its forms, and procedures for gathering evidence through repeated observations during ordinary activities, routines, and interactions across contexts. Educators were instructed to consider the level definitions and examples together and to assign the highest developmental level the child has consistently demonstrated (DCRG, 2018). Training activities provided opportunities to examine observational evidence and practice distinguishing among developmental levels, including cases in which a child’s behavior did not correspond to every example associated with a level. The examples were presented as illustrations of how a competency might be demonstrated rather than as a checklist of required behaviors. Educators were required to complete the training, but no post-training certification was required for participation in the field study.
DRDP ratings were based on naturalistic observations collected during regular classroom activities without modifications to daily routines. Educators entered ratings into the DRDP Online™ database. WestEd de-identified the data before transmitting them to the BEAR Center for psychometric analysis. Parents or guardians were notified of the study and could opt their children out of inclusion in the research. Data collection was completed in fall 2025.
2.4. Analytic Focus
Although the field study generated data across all five DRDP 2025 domains and the optional English Language Development dimension, the analyses presented in this paper focus exclusively on the SED domain. The full five-domain (multidimensional) calibration model was applied to the complete dataset (see Sussman et al., 2026). Unless otherwise specified, the SED-specific results reported here derive from this five-domain calibration. The IT, PTK, and P–3 instruments are linked through common items and overlapping developmental levels, providing a connected structure for placing SED ratings from all three instruments on a common continuum. Calibration proceeded in two stages within the five-domain multidimensional partial credit model. First, birth-through-kindergarten data established the core metric. Second, grade 1–3 data were added, with the previously estimated non-Extending step parameters held fixed while the parameters for the three new Extending levels were freely estimated. This anchored extension linked the upper portion of the SED progression to the established metric while preserving the earlier calibrated steps (see Sussman et al., 2026, for additional calibration details).
3. Building Block 1: The Construct Map
3.1. Structure of the Map
The construct map for the DRDP 2025 SED domain is presented in Figure 1. It specifies five major developmental waypoints—Responding, Exploring, Building, Integrating, and Extending—each subdivided into finer levels, yielding 13 ordered developmental waypoints (i.e., levels) in total. Moving from left to right across the map, each successive waypoint reflects a qualitatively distinct and generally more sophisticated form of social and emotional functioning. Children at Responding display observable responses to familiar caregivers and environmental stimuli. Those at Exploring begin to investigate their social environment and use early communication. Subsequent waypoints describe increasingly complex and coordinated capacities, culminating at Extending in flexible, independently deployed skills applied across varied social contexts.
Figure 1.
DRDP 2025 Construct Map.
These waypoints are not age anchors. Rather, they represent developmental positions—theoretically motivated hypotheses about the ordered structure of social-emotional competence, that can be evaluated empirically. A child at Building, for example, may be from age three to age seven; what the waypoint describes is not the child’s age, but a qualitative pattern of engagement with their social world.
3.2. Development of the Map
The DRDP construct map has been built iteratively across successive generations of the instrument. Beginning with the DRDP-R (2006), the earlier behavior-checklist format was replaced with developmental construct maps for infant/toddler and preschool growth, with theoretical and empirical linkages established between them (Karelitz et al., 2010). The initial maps were derived from a review of research in early childhood education and developmental psychology, refined with input from researchers and practitioners, and evaluated through pilot testing, cognitive interviews with teachers, Rasch calibration, and Wright map analysis (BEAR Center, 2006). The DRDP 2015 extended this work by incorporating new design principles such as universal design for learning (DCRG, 2018) and psychometrically linking children’s development into one vertically scaled continuum from infancy through the end of kindergarten (Draney et al., 2022).
For the DRDP 2025, the SED and ATL construct maps were extended through grade 3. Domain-specific multidisciplinary teams developed the extensions through iterative cycles of subject matter expert and interest-holder review, after which the new levels were psychometrically linked to the existing birth-through-kindergarten scale. The extension added a fifth major waypoint, Extending, with three levels (Earlier, Middle, and Later) to represent more sophisticated capacities expected to emerge during the primary grades. The construct maps for the COG, FLD, and PD-HLTH domains were retained from the DRDP 2015, with revisions focused on item wording, examples, and alignment with current standards.
Whereas the construct map defines what is to be measured, the three building blocks that follow operationalize and evaluate it: the items translate the developmental continuum into rating rubrics; the outcome space assigns developmental meaning to each rating; and the Wright map provides a means of evaluating how closely observed response patterns correspond to the hypothesized order.
4. Building Block 2: Items Design
4.1. Item Architecture
The DRDP construct map is directly embedded in the architecture of its items. Each item is a developmental rubric—a LP articulated as a sequence of qualitatively distinct levels and calibrated using the Rasch partial credit model described below. Teachers are asked to select the highest developmental level the child has consistently demonstrated based on naturalistic observation over a period of weeks. The 13 levels provide observable indicators of increasingly advanced behavior along the developmental continuum.
This rubric format is the form a construct map takes when operationalized as an observational assessment tool. The construct map specifies the overarching developmental theory, and each item translates that theory into descriptions of behavior that educators can observe, document, and rate during ordinary classroom activities. Figure 2 presents SED 2 (Social Awareness) as an example. Its 13 levels align with the levels of the construct map and describe increasingly advanced expressions of social awareness.
Figure 2.
DRDP Rubric Social and Emotional Development Item 2 (SED 2): Social Awareness.
Behavioral examples illustrate ways a developmental level may be demonstrated; they are not separate checklist requirements. Educators select the highest developmental level the child has consistently demonstrated during observations. A child need not display every illustrative example, and item ratings summarize evidence accumulated across ordinary activities rather than performance on a single occasion. Hence, the assessment is strengths-based and describes a child’s highest present level of functioning.
4.2. The Five SED Items as Progress Variables
The DRDP 2025 SED scale comprises five items, each operationalizing a theoretically distinct facet of social and emotional development. In Wilson and Sloane’s (2000) terminology, these items can be understood as progress variables: each represents an aspect of social-emotional competence as an ordered developmental trajectory from infancy through grade 3. Together, the items are designed to support the interpretation of children’s developmental standing and, when repeated observations are available, change over time.
The five facets reflect the differentiated but related structure of social-emotional competence described by Denham (2006) and represented in frameworks such as CASEL (2020) and S. M. Jones et al. (2019). Table 2 summarizes the five items, their developmental grounding, and their alignment with contemporary SED frameworks.
Table 2.
DRDP (2025) Social and Emotional Development Domain, Learning Progressions, and Alignment with Contemporary SED Frameworks.
Together, the five items span core dimensions of social-emotional competence identified across the developmental and applied literatures. SED 1 traces the development of self-awareness from early differentiation between self and others to increasingly nuanced self-understanding (Harter, 2006). SED 2 traces social awareness from responding to others’ emotions to recognizing differing perspectives, experiences, and social norms (Selman, 1980; Wellman, 2014). SED 3 and SED 4 address relationships but distinguish between relationships with familiar adults, which are initially asymmetric and caregiving-focused, and peer relationships, which are more reciprocal and negotiated among relative equals (Easterbrooks et al., 2013; Rubin et al., 2011). This distinction between adults and peers reflects both the early childhood literature and California’s early learning frameworks listed in Section 4.4. SED5 addresses emotional knowledge and regulation, tracing development from caregiver-supported regulation to more independent and context-sensitive strategies (Thompson et al., 2006).
The five DRDP items directly cover four of CASEL’s five competency areas. For the fifth CASEL competency area, Responsible Decision-Making, the DRDP subsumes some of these subskills in its ATL domain (e.g., curiosity) whereas other skills are incorporated into the learning progressions for relationships (e.g., conflict resolution). Readers may note that CASEL’s Responsible Decision-Making and Relationship Skills competency areas partially overlap: the former area’s more general focus on identifying solutions to personal and social problems is a broader skill that can apply to the latter’s more specific focus on conflict resolution. Again, the DRDP’s deliberate separation of adult and peer relationships into distinct items (SED 3 and SED 4) reflects an early childhood-specific developmental distinction that single-category relationship frameworks designed for older students do not capture.
4.3. Observational Assessment Design
The DRDP treats sustained observation by an educator who knows the child well as a primary source of developmental evidence. The learning progression rubric format, introduced with the DRDP-R (2006), was intended to reduce ambiguity around mastery judgments by providing observable behavioral descriptors at each level and a common framework for locating children on the developmental continuum.
This design also raises an important validity consideration. Systematic differences in raters’ tendencies—including leniency, severity, halo effects, and avoidance of extreme categories—can introduce variation unrelated to children’s developmental standing (Waterman et al., 2012). The DRDP seeks to limit such variation through educator training, structured rubric language, and psychometric monitoring. The available evidence and limitations concerning rater consistency are addressed throughout this paper.
4.4. Item Development and Pilot Study Evidence
The five SED items were developed through iterative cycles of design, review, and revision. A pilot study conducted in fall 2024 (N = 827 children rated by 159 educators) examined preliminary item functioning before the full field study. The pilot combined Rasch calibration with educator usability surveys and think-aloud interviews. Items were considered for revision when usability concerns, such as uncertainty about the meaning of a level or difficulty observing the target behavior, occurred alongside anomalies in the response data, such as infrequently used categories or item fit statistics outside the prespecified range.
All five SED items were retained following the pilot. Revisions focused on developmental-level descriptors, illustrative examples, and adjustments to align the assessment with California’s Early Learning Foundations—including the Infant–Toddler Learning and Development Foundations (ITLDF; CDSS, 2025), and the Preschool/Transitional Kindergarten Learning Foundations (PTKLF; CDE, 2024). Educator interviews indicated that preschool and TK/K educators generally understood the learning-progression rubric format. Grade 1–3 educators, for whom the DRDP was a new instrument, reported somewhat greater initial uncertainty about the rating procedures. These findings informed subsequent revisions and provided relevant context for interpreting the person fit results reported below.
5. Building Blocks 3 and 4: Outcome Space and Wright Map
5.1. The Outcome Space
The outcome space is the third building block of the BAS: the structured set of possible responses to each item, and the interpretive framework that gives those responses developmental meaning. Whereas the construct map defines the latent variable in qualitative terms, and the items operationalize it through observational rubrics, the outcome space specifies how each possible response is interpreted relative to the developmental continuum.
For the DRDP 2025 SED domain, the outcome space for each of the five items consists of the 13 ordered developmental levels, scored as consecutive integers 0 through 12: Responding Earlier (RE), Responding Later (RL), Exploring Earlier (EE), Exploring Later (EL), Building Earlier (BE), Building Middle (BM), Building Later (BL), Integrating Earlier (IE), Integrating Middle (IM), Integrating Later (IL), Extending Earlier (EXE), Extending Middle (EXM), and Extending Later (EXL). Each level is accompanied by behavioral descriptors that educators use as observational anchors (see Figure 2).
A notable feature of the waypoint structure is that all five SED items share the same 13-level framework, with identically named levels and parallel behavioral descriptions tailored to each item’s content. This common architecture aligns the items conceptually within an intended developmental framework and supports interpretation of a child’s response profile across the five SED facets.
The common framework alone, however, does not establish that corresponding levels are located at the same point on the latent continuum or function equivalently across items. Item response theory (IRT) modeling is used to estimate the locations of item thresholds, examine category functioning, account for differences among items, and place children and item thresholds on a common latent metric. The resulting domain scores represent each child’s estimated standing on the SED continuum, whereas the calibrated item thresholds indicate where the behavioral levels associated with each item are located on that continuum. Thus, the waypoint structure provides conceptual alignment and developmental meaning, whereas IRT provides the statistical model needed to evaluate and scale the observed responses. The partial credit model (PCM; Masters, 1982), a member of the Rasch family of IRT models, provides the framework for converting the ordered categorical responses into estimates on a common logit metric representing the latent SED continuum.
5.2. The Partial Credit Model (PCM)
The full DRDP calibration used a multidimensional extension of the Rasch PCM, estimated within the multidimensional random-coefficients multinomial logit (MRCML) framework (Adams et al., 1997) and implemented using ConQuest version 5.29 (Adams et al., 2020) and TAM version 4.4-2 (Robitzsch et al., 2025) in R version 4.5.1. The PCM is appropriate for ordered polytomous items such as the DRDP’s 13-level rubrics. It places children’s estimated developmental standing and item-category thresholds on a common logit metric within each domain.
For a single dimension, the probability that child n is rated in category k on item i is
where θn is the estimated developmental standing of child n, δij is the step parameter associated with the transition to category j of item i, and mi + 1 is the number of response categories for item i. For notational convenience, The step parameters represent the locations on the latent continuum at which the relative probability of a response shifts between adjacent categories. This structure allows category transitions to occur at different locations across items, reflecting differences in when particular behaviors are likely to be observed. In developmental terms, the model accommodates the fact that some skills and behaviors emerge and consolidate at different rates.
The PCM models the ordered item responses but does not, by itself, establish that children master every earlier behavior before demonstrating a later one. Rather, the construct map specifies the hypothesized developmental ordering, and the calibration results provide evidence about the extent to which observed rating patterns are consistent with that ordering. This distinction is important because the learning progression is probabilistic rather than deterministic.
Calibration proceeded in two stages. The first established a stable birth-through-kindergarten metric; the second estimated the locations of the new Extending levels in the ATL and SED domains. After the first step, domain scales were then aligned using the DDA method (Feuerstahler & Wilson, 2021), which placed the five domain metrics within a common reporting framework while preserving their interpretation as distinct developmental dimensions. Finally, logit estimates were transformed linearly to operational reporting scales ranging from 1 to 1200 for ATL and SED, which include the new Extending levels, and from 1 to 1000 for COG, FLD, and PD-HLTH, which retain the DRDP 2015 waypoint range.
5.3. Thurstone Thresholds and Waypoint Cut Scores
Raw integer ratings from 0 to 12 are the immediate product of teacher observation. Their interpretation depends on the waypoint structure. Waypoints are qualitatively defined, ordered reference points along the construct map that divide the latent continuum into meaningful developmental bands. In the BAS framework, they serve as interpretive anchors for situating a child’s Rasch-scaled score within a broader developmental progression (e.g., Diakow et al., 2013; Torres Irribarra et al., 2015).
For item i, let Xni denote child n’s rating, with ordered categories 0,…,mi, and let θn denote the child’s location on the latent SED variable. The Thurstone threshold for category k is the location at which the probability of a rating in category k or above equals 0.50:
Equivalently, we can write the cumulative probability explicitly,
Thus, at , the combined probability of ratings in category k or above equals the combined probability of ratings below category k. Unlike adjacent-category step parameters, Thurstone thresholds are based on cumulative category probabilities and are necessarily ordered.
For a waypoint boundary corresponding to category k, the domain-level cut score is defined as the median of the corresponding item-level Thurstone thresholds:
where I = 5 for the SED domain. Using the median reduces the influence of an unusually high or low item threshold and provides a representative domain-level location for the waypoint boundary.
Operationally, each SED waypoint cut score is computed on the latent variable as the median of the corresponding Thurstone thresholds across the five items. For example, the cut score between Building Earlier and Building Middle is the median of the five item thresholds marking that transition in SED 1 through SED 5.
A child whose Rasch scaled score falls within the Building Later waypoint is therefore interpreted as being located in that region of the SED progression. This placement suggests that behaviors associated with earlier waypoints are generally more likely to be observed, whereas behaviors associated with later waypoints are less likely or may be emerging. It does not imply that Building Later is the child’s rating on every SED item or that all earlier behaviors have been uniformly consolidated. Rather, the waypoint provides a psychometrically accurate, domain-level summary that educators can interpret alongside other information, such as the child’s item-level profile, observed behavior, and developmental context. Table 3 distinguishes between this complementary information provided to educators in reports from DRDP Online: item ratings reveal micro-level variation, whereas the domain score summarizes overall location on the developmental continuum. A domain-score confidence interval communicates uncertainty in that estimate (see Section 5.7). These outputs can be interpreted together to provide complementary information: the domain summary provides a general orientation, but examination of the item profile can reveal intra-individual patterns of strengths and weaknesses.
Table 3.
Interpretation and Use of SED Score Outputs.
Importantly, waypoint placement is probabilistic rather than deterministic. Learning progressions do not require every child to follow a fixed or uniformly ordered developmental trajectory (e.g., Empson, 2011). Professional judgment, informed by the behavioral descriptors and contextual knowledge of the child, therefore remains essential.
5.4. Prior Psychometric Grounding in Previous Generations of DRDP Instruments
The waypoint structure leads to an empirical prediction: if the 13-level outcome space represents a common underlying developmental continuum, then Thurstone thresholds for same-named levels should be located near one another on the logit scale, with greater separation between levels than within levels. Previous Wright map analyses of the DRDP 2015 SED domain provided initial support for this prediction: “the thresholds line up very well with one another within each level” (Draney et al., 2022, p. 17). The DRDP 2025 field study revisits and extends this evaluation using the revised instrument and current item calibrations.
5.5. The Wright Map
The Wright map for the SED domain (Figure 3) permits evaluation of the degree to which the Thurstone threshold locations are consistent with the developmental structure represented in the construct map. The Wright map displays two distributions on a common vertical logit scale: children’s estimated locations on the left and the Thurstone thresholds for each item on the right, color-coded by waypoint. At a given threshold, a child has a 50% probability of being rated at the corresponding level or higher. Further above the threshold, that probability exceeds 50%; further below it, the probability is less than 50%.
Figure 3.
Wright Map for the DRDP 2025 SED Dimension with Color-Coded and Labeled Thresholds.
The Wright map indicates that the item thresholds are generally well targeted to the field study sample. They span the central range of the child distribution, with particularly dense coverage in the preschool and TK/K ranges, where many children in the sample are located. Fewer than 1% of children are estimated below the lowest threshold or above the highest threshold, indicating limited floor and ceiling effects in this sample.
The central question is how closely the threshold locations align across items with the developmental structure hypothesized in the construct map. Figure 4 presents the Thurstone thresholds together with the waypoint cut scores. As described above, each cut score is calculated as the median of the corresponding Thurstone thresholds across SED 1 through SED 5. Thresholds associated with the same developmental transition clustered near their corresponding domain-level cut scores. Across the five items, the highest Thurstone threshold for category k did not exceed the lowest threshold for category k + 1, for any pair of adjacent categories. This pattern of within-waypoint clustering and between-waypoint separation supports the hypothesized alignment of developmental levels across the five SED rubrics and the use of waypoint bands as an interpretive framework.
Figure 4.
Item Map for the DRDP 2025 SED Dimension with Waypoint Cut Scores.
Figure 5 hypothetically illustrates how the calibrated developmental continuum can be translated into an educator-facing score report. The vertical measurement scale is presented horizontally, the item thresholds are omitted, and the waypoint bands appear as labeled regions along the continuum. A child’s scaled score is represented by a vertical line, and the accompanying horizontal bar represents the model-based 95% confidence interval. The example includes fall, winter, and spring assessment occasions, allowing educators to view the child’s estimated location and its uncertainty at each time point.
Figure 5.
A Hypothetical Child Score Report that Would be Shown to a Teacher, Showing the Child’s Location (Along with a 95% Confidence Interval) at Three Points in Time. Note. Illustrative report only; adapted historical illustration from the DRDP 2015; the three scores do not represent longitudinal observations from the field study sample.
In this example, the child’s fall score is located in Building Later. At this point on the SED continuum, the child may be moving beyond participation in social and emotional experiences toward communicating and reasoning about them—for example, describing personal preferences, recognizing that another person’s behavior may reflect that person’s preferences or experiences, initiating sustained cooperative play with preferred peers, and connecting basic emotions with their causes.
By winter, the child’s estimated location is near the boundary between Integrating Earlier and Integrating Middle. At these levels, social-emotional functioning becomes more reciprocal, reflective, and coordinated. The child may compare personal feelings or preferences with those of others, recognize that another person’s thoughts or feelings may differ from their own, cooperate with familiar adults during sustained activities, co-create peer activities involving rules and roles, and use emerging strategies to process emotions.
By spring, the child’s estimated location is within Integrating Middle. At this level, the developmental emphasis increasingly includes attending to contextual and nonverbal social information, accommodating others’ interests or goals, compromising with peers to pursue shared purposes, and connecting emotional experiences with sensory experiences. The example therefore illustrates how changes in scaled scores may be interpreted as changes in the qualitative forms of behavior described by the progression, rather than simply as increases in a numerical score. The model-based confidence intervals communicate the uncertainty associated with each estimated location; their overlap should be considered before interpreting differences across occasions as evidence of change.
Rather than reporting only a domain total, age-based comparison, or set of item-level ratings, this approach is designed to interpret a child’s estimated standing in relation to increasingly sophisticated ways of understanding self and others, regulating emotion, and participating in relationships.
5.6. Item Fit and Dimensionality
Item fit statistics evaluate the degree to which responses to each item are consistent with the fitted model. Weighted mean square (WMS; Wright & Masters, 1982), also called infit, summarizes standardized item-response residuals while giving greater weight to observations near the child’s estimated location, where responses are most informative (Müller, 2020). Values near 1 indicate residual variation consistent with model expectations; values above 1 indicate more unexplained variation than expected, whereas values below 1 indicate less variation than expected.
For the present analyses, WMS values between 0.75 and 1.33 were considered acceptable (Adams & Khoo, 1996). Values above 1.33 may indicate that responses are affected by construct-irrelevant variation, multidimensionality, ambiguous level descriptors, or other departures from model expectations. Values below 0.75 indicate greater predictability than expected and may reflect item redundancy, local dependence, or other sources of reduced residual variation. Because statistical tests of fit are sensitive to sample size, an item was classified as misfitting only when its WMS fell outside the prespecified range and the associated t statistic was statistically significant.
Table 4 presents the item fit results. All five SED items had WMS values within the prespecified range, with slight overfit. Values ranged from 0.82 to 0.88, indicating somewhat less residual variation than expected under the model. The associated t tests were statistically significant, but the WMS effect sizes remained within the acceptable range. Consequently, none of the items were classified as misfitting. These findings support coherent functioning of closely related SED facets but do not by themselves distinguish substantive consistency across related facets from parallel rubric architecture, local dependence, or rater-induced consistency.
Table 4.
Item Fit Statistics for DRDP 2025 SED Items.
These results provide internal structure evidence that responses to the five SED items were generally consistent with the fitted model in this field study sample. Substantial departures from the hypothesized structure could produce positive misfit if children’s observed response patterns were inconsistent with model expectations. We note that acceptable item fit does not establish that individual children develop longitudinally through the proposed sequence, but, when considered alongside the Wright map and threshold results, the fit statistics indicate that the five developmental rubrics functioned coherently under the fitted model.
Traditional item analyses provide complementary evidence of internal structure. The mean estimated SED locations shown in Figure 6 increased monotonically across the response categories for all five items, and all item-rest and item-total correlations exceeded 0.90. These results indicate strong correspondence between each item and the overall SED scale. In addition, item step estimates (δij) were examined for consistent ordering. Adjacent-category step estimates were ordered for all five items—no disordered steps were observed. Thus, the category probability curves showed consistent shifts toward higher ratings as estimated SED standing increased (See Supplementary Materials). Together with the monotonically increasing observed-category means, these results indicate that educators used the ordered levels in a manner broadly consistent with the intended rating structure. Because high item correlations and ordered thresholds do not by themselves establish dimensionality, the scale’s dimensional structure was also evaluated through model comparisons.
Figure 6.
Traditional Item Analysis: Mean Ability by Response Category for SED 1–5. Note. Error bars represent 68% confidence intervals.
As an SED-only diagnostic test, a unidimensional model (deviance = 35,767.5, AIC = 35,772, BIC = 35,783) was compared with all 15 unique two-dimensional partitions of the five SED items. All models used the same five SED items, with item parameters fixed at their operational values. Latent means, variances, and covariances were estimated freely. The best-fitting two-dimensional model reduced deviance by 79.67 relative to the unidimensional model; AIC and BIC were lower by 73.67 and 56.84, respectively. However, this improvement in statistical fit did not correspond to substantively distinct dimensions. Correlations between the two latent dimensions ranged from 0.988 to 0.997 across the 15 partitions and were 0.988 in the best-fitting two-dimensional model. Thus, although the two-dimensional model improved statistical fit, the resulting dimensions were nearly indistinguishable empirically. These findings support treating the SED scale as essentially unidimensional for the present calibration and reporting purposes.
5.7. Reliability and Score Precision
Person separation reliability1 for the SED domain was 0.97, indicating strong model-based differentiation among children in the field study sample. This estimate reflects the consistency with which the fitted model distinguishes children at different locations on the SED continuum. The result supports data use including aggregate description and formative interpretation when combined with professional judgment. However, these results are foundational building blocks in the DRDP 2025 validity argument that would be further strengthened by research that establishes the accuracy of individual classifications and by interrater reliability evidence.
Figure 7 shows the model-based standard error of measurement across the SED scale. As expected, measurement precision is greatest near the middle of the scale, where the item thresholds and children’s estimated locations are most concentrated, and decreases toward the lower and upper extremes. The figure also displays approximate 68% confidence intervals around selected scores, allowing the uncertainty of a child’s estimated location to be considered in relation to the waypoint bands for the 13 developmental levels.
Figure 7.
SED Waypoints and Scaled Scores (Logits) with 68% Confidence Intervals.
Across the complete score range, the approximate 68% intervals extend across no more than two adjacent waypoint bands, with a single exception around 0 logits. This describes model-based uncertainty relative to the reporting framework. Placement may remain uncertain near reporting boundaries. Scores should therefore be interpreted alongside these intervals, item-level ratings, and observational evidence, with attention to the child’s developmental context.
5.8. Person Fit and the P–3 Pattern
Person fit was examined to determine how closely each child’s pattern of ratings across the five SED items conformed to the fitted Rasch model. Information-weighted mean-square infit was used because it emphasizes unexpected responses on items targeted to the child’s estimated developmental location. Following conventional criteria, infit above 1.33 was classified as positive misfit indicating greater across-item variation than predicted, whereas infit below 0.75 was classified as negative misfit, indicating less variation than predicted (Sussman et al., 2025; Wright & Masters, 1982). Negative misfit is generally less concerning for identifying inconsistent profiles, although extreme values may indicate redundancy or overly uniform ratings.
Person and item fit address different questions. Item misfit may indicate that an item does not function as expected within the construct, whereas person misfit identifies an individual response profile that is less consistent with model expectations. Such profiles are not necessarily invalid and may reflect developmental unevenness, contextual variation, rater variability, multidimensionality, or other measurement factors. Person fit statistics identify atypical profiles but do not determine their cause.
Across the full analytic sample, 12% of children showed positive person misfit, defined as SED person infit above 1.33, compared with 26% in the P–3 sample. Logistic regression examined associations between positive misfit and instrument form, special education status, gender, multilingual learner status, and Hispanic ethnicity. Instrument form showed the strongest adjusted association: model-based marginal probabilities were 3% for IT, 13% for PTK, and 35% for P–3 (see Supplementary Materials). These adjusted probabilities are distinct from the observed percentages reported above. Gender, multilingual learner status, and Hispanic ethnicity showed small or inconsistent adjusted associations. Special education status was associated with a modest elevation in misfit, but no children receiving special education services were included in the P–3 sample. The association between P–3 form use and positive misfit remained after adjustment for the measured demographic characteristics, but the analysis cannot isolate an instrument-form effect or rule out other compositional or contextual influences.
The P–3 findings were based on 364 children in grades one through three rated by 22 educators across 18 sites, with all three grades represented. The sample therefore extended across multiple educators and sites, although it represented a relatively limited set of implementation contexts, and only four of the 22 educators had prior DRDP experience. Moreover, P–3 form assignment was inseparable from children’s age and grade, educator group, and implementation context. The association therefore cannot be interpreted as an effect of the form itself.
The elevated P–3 rate qualifies the otherwise favorable internal structure evidence. Response profiles were broadly consistent with model expectations across the full sample, but consistency was lower among children assessed with the P–3 form. The finding identifies the grade 1–3 extension as a priority for continued validation using operational data, including examination of high-misfit profiles, educator and classroom effects, rater experience and training, and fit across score regions. Multilevel models incorporating educator effects could be especially useful for distinguishing child-level developmental unevenness from systematic variation in rating practices.
5.9. Score Distributions by Instrument Form
Figure 8 displays the distribution of children’s SED scores across waypoint bands by instrument form. The Infant/Toddler (IT) distribution, shown in blue, is concentrated toward the lower end of the scale. The Preschool/TK/K (PTK) distribution, shown in maroon, overlaps with the upper portion of the IT distribution and has a pronounced mode near the center of the scale. The Grades 1–3 (P–3) distribution, shown in green, is concentrated in the upper portion of the continuum. The thick lines in the corresponding colors indicate group medians: Exploring Earlier for IT, Building Middle for PTK, and Integrating Later for P–3. This ordering is consistent with the construct map’s expectation that developmental standing will generally increase with age, while allowing substantial variation among children within each group.
Figure 8.
Distribution and Median of SED Scores Across Waypoint Bands by Form (IT, PTK, P–3).
The shape of the P–3 distribution is also noteworthy. Whereas the IT and, especially, PTK scores cluster around relatively pronounced modal regions, the P–3 scores are distributed more broadly across the upper portion of the continuum, from Building through Extending. One plausible substantive explanation is that children’s social-emotional profiles become increasingly differentiated as more complex capacities develop from earlier skills and as children accumulate diverse relational, cultural, and educational experiences (Fischer & Bidell, 2006; Cantor et al., 2019). However, our cross-sectional data cannot establish that developmental differentiation produced the wider P–3 distribution. Differences among forms, educational settings, rating practices, or educators’ familiarity with the DRDP may also have contributed, particularly given the elevated P–3 person misfit rate reported in Section 5.8.
Across the full sample, age was strongly and positively correlated with estimated SED score, r = 0.75. This association provides validity evidence based on relations with another variable: children’s estimated locations on the SED continuum increased with age in the direction predicted by the construct map. The result deserves cautious interpretation because the analysis is cross-sectional and age is closely related to instrument form and educational setting. Longitudinal analyses are needed to determine how individual children move through the continuum in the hypothesized developmental direction over time.
5.10. Differential Item Functioning: Fairness Evidence
A necessary condition for DRDP interpretation is that items function similarly across the demographic groups the instrument is intended to serve. Differential item functioning (DIF) occurs when children from different groups who have the same estimated standing on the latent variable nevertheless have different probabilities of receiving a particular item rating. DIF may indicate construct-irrelevant difficulty or advantage associated with group membership rather than with the developmental attribute the item is intended to measure (Holland & Wainer, 1993; AERA et al., 2014). However, it is important to remember that DIF is a statistical signal rather than proof of an item’s bias; determining bias requires substantive examination of the item and its meaning, and the contexts in which ratings were produced.
DIF in the DRDP 2025 was evaluated for seven planned subgroup contrasts. For each item and contrast, a PCM constraining item parameters to be equal across groups was compared with a model permitting group-specific item parameters (Wilson, 2023). This DIF model allows overall item location shifts (i.e., a test for uniform, mean item DIF). Following Paek and Wilson (2011), the magnitude of DIF was classified as negligible when the absolute difference was less than 0.426 logits, moderate when it ranged from 0.426 to 0.638 logits, and severe when it exceeded 0.638 logits. Across the full DRDP instrument and all dimensions, 33 items were evaluated in seven contrasts, yielding 231 item-by-contrast tests. Four signals showed DIF > 0.426, but none occurred among the five SED items. Table 5 presents the seven contrasts.
Table 5.
DIF Contrasts, in Order of Focus Group Size.
Across the 35 SED item-by-contrast comparisons, five items evaluated for seven contrasts, all estimated DIF effects were negligible. Thus, within the demographic classifications and field study sample examined, no SED item showed evidence of practically meaningful differences in difficulty after conditioning on estimated SED standing. This result provides favorable item-level fairness evidence for the comparability of SED score interpretations across the tested groups.
The DIF results complement the other internal structure evidence reported above. Item fit analyses assessed how well each SED item functioned coherently with the developmental model in the sample as a whole, whereas the DIF analyses examined whether item functioning varied detectably across selected demographic groups, after accounting for estimated developmental standing. The absence of moderate or severe DIF is consistent with the intended broad applicability of the SED progression and is especially relevant given concerns about the cultural and linguistic applicability of developmental assessments (First 5, 2022).
These findings should be interpreted within the scope of the analysis. The absence of mean item DIF does not establish the absence of all forms of cultural, linguistic, disability-related, or rater-mediated bias. DIF analyses assess conditional differences in item functioning for the particular groups, sample, model, and contrasts examined; they do not directly evaluate whether the construct is equally comprehensive across cultures, whether behaviors are equally observable in different settings, whether raters apply the rubrics similarly, or whether assessment use has equitable consequences. Continued fairness evaluation should therefore include subgroup monitoring in operational samples, review of rating processes, and investigation of rater and contextual effects.
6. Discussion
6.1. Developmental Interpretation and Validity Evidence
This study addressed three gaps identified in the introduction: a taxonomic gap, a psychometric gap, and a measurement utility gap. The construct map addresses the taxonomic gap by specifying a theoretically grounded developmental progression for SED from infancy through grade 3. The field study analyses address the psychometric gap by evaluating the coherence, ordering, precision, and subgroup comparability of scores derived from that progression. The findings also provide an initial foundation for addressing the measurement utility gap by supporting developmental interpretations that could inform observation and instruction. They do not, however, establish how effectively educators use that information in practice, which remains an important subject for implementation research.
A central feature of the BEAR Assessment System (BAS) is the integration of assessment design and validation. The construct map articulates the developmental hypothesis; the items and outcome space translate that hypothesis into observable performances and ordered ratings; and the Wright map and associated diagnostics evaluate the extent to which observed response patterns support the proposed structure. Developmental ordering is therefore treated as a probabilistic and empirically testable claim. The model does not require every child to follow an identical sequence. Rather, it proposes a general ordering while allowing meaningful individual variation in children’s developmental profiles and pathways.
The resulting internal structure evidence was broadly favorable. The five SED items fit the partial credit model, same-level Thurstone thresholds clustered within their intended waypoint regions, and dimensionality analyses supported a unidimensional reporting structure. Score precision supported waypoint-level interpretation, and category functioning analyses provided additional evidence concerning educators’ use of the ordered levels. No SED item displayed DIF of concern in the seven demographic contrasts examined. Together, these results support interpreting the five facets as distinct developmental progress variables that contribute coherently to a common SED continuum. Of course, they do not imply that the facets are interchangeable or that every child develops uniformly across them.
The study also provides initial support for extending the progression through grade 3. Continuity is defined here as the use of a common developmental construct and linked measurement scale across early childhood and primary grade settings. There is no expectation that children of the same age or grade occupy the same level. The new Extending levels occupied the upper portion of the continuum, grade 1–3 scores reached those levels, and scores increased with age as hypothesized. The DRDP 2025 therefore contributes a continuously linked SED progression spanning infancy through the early elementary grades and advances Darling-Churchill and Lippman’s (2016) call for a developmental taxonomy connected to psychometrically sound measures.
The evidence assembled in this study is cumulative: different sources address different parts of the proposed interpretation and use of the SED scale. As summarized in Table 6 using the five main sources of validity evidence (AERA et al., 2014), the strongest evidence concerns the content and internal structure of the scale, supported by multidisciplinary development and field study analyses. The study also provides initial evidence concerning rating processes, relations with age, fairness, and intended use. The remaining needs identify appropriate directions for continued validation of an operational assessment system.
Table 6.
Summary of Validity Evidence and Noteworthy Remaining Needs.
Taken together, the evidence provides initial support for the intended developmental interpretation and operational use of the SED scale. The remaining needs reflect the continuing validation expected of an operational assessment system.
6.2. Contribution to P–3 Practice
A developmental interpretation is necessary, but not sufficient, for formative use. Assessment results must do more than locate a child on a numerical scale: they must help educators understand the capacities the child has consolidated, capacities that may be emerging, and productive directions for further observation and support. Dunphy (2010) emphasizes that formative assessment in early childhood depends on educators’ developmental knowledge and their ability to use observations to plan appropriate learning opportunities. Similarly, Griffin (2007) proposed that scores derived from Rasch-calibrated learning progressions can function as a “code for a level of development,” communicating current standing while directing attention toward next steps.
The DRDP 2025 SED scale is designed to provide this developmental orientation. At the Integrating waypoint, children increasingly coordinate self-regulation, perspective-taking, and social problem-solving across contexts; at Extending, they use these competencies with greater independence and flexibility. These descriptions provide a shared language for interpreting development across preschool and elementary settings without treating waypoint locations as age- or grade-level standards.
Item ratings and the domain score contribute different information to this interpretation. The five item ratings preserve micro-level variation and point to children’s relative strengths, unevenness, and areas for further observation or support. The domain score summarizes overall location on the developmental continuum and connects that estimate to the waypoint descriptions. The confidence interval communicates uncertainty around that location. These outputs are therefore intended to be interpreted together: the domain score provides an overall developmental orientation but should not replace professional judgment or be treated as more precise than the evidence supports.
This continuity may help address the fragmentation among SED standards, assessment, instruction, and professional learning identified by McKown (2019). A shared developmental progression, linked to state early learning foundations, can support communication and planning across the transition into elementary school, particularly when educators work in systems that otherwise use disconnected frameworks or age-specific instruments. The present study supports the developmental interpretation underlying that use; direct evidence concerning its effects on educational practice remains to be established.
6.3. Remaining Uncertainties
The principal qualification concerns person fit for the P–3 form. Positive person misfit was more common among children assessed with that form, indicating that ratings across the five items were less consistent with model expectations for a substantial subset of the grade 1–3 sample. The result was based on 364 children rated by 22 educators across 18 sites and was therefore broader than a single educator or classroom. Nevertheless, form assignment was inseparable from age, grade, educator group, and implementation context, and only four of the 22 educators had prior DRDP experience. The association therefore cannot be interpreted as an effect of the form itself.
Person fit does not identify why a profile departs from model expectations. The P–3 pattern could reflect greater differentiation across various aspects of SED in the settings, characteristics of the newly extended levels, differences in elementary observation contexts, differences in the elementary raters, or a combination of these factors. Because these explanations cannot be distinguished with the present data, the result should be treated as an initial field study result requiring further response process and rater research.
The single-rater design limits the conclusions that can be drawn about rater agreement and severity. Consistency across SED items may reflect children’s shared standing across related facets, as theory predicts (Denham, 2006; S. M. Jones & Bouffard, 2012), but it may also be influenced by raters’ general impressions of children. The present design cannot separate these sources of consistency. Interrater reliability studies of the DRDP 2015 provide relevant prior evidence, but they did not examine the DRDP 2025 or grades 1–3 directly (Chen-Gaddini et al., 2022). Independent ratings are therefore needed to evaluate rater agreement and severity for the revised scale.
This field study did not directly evaluate the instructional benefits or other consequences of using the DRDP 2025 SED scale. The DRDP is intended for developmental observation, formative planning, and aggregate program information. The present study does not evaluate use of the results for diagnosis, eligibility determination, educator evaluation, or high-stakes placements. Such uses would require additional study, including the degree to which these uses could encourage narrow rating practices or lead users to overinterpret results. The present study supports the developmental interpretation underlying that use; future implementation research can examine how educators use the revised SED scale and its effects on educational practice.
6.4. Limitations and Next Studies
The cross-sectional design supports evaluation of the degree to which observed rating patterns are consistent with the proposed developmental structure, but it does not directly establish within-child developmental trajectories. Confirming that children move through the progression in the hypothesized manner requires repeated assessment of the same children across multiple occasions. Longitudinal research should also examine how changes in scores relate to later social, behavioral, and academic outcomes.
The study also did not evaluate relations with external criterion measures. Linking DRDP scores with independently collected measures would provide additional evidence concerning interpretation, although such associations require care when the assessment is used formatively. If assessment results prompt effective support, that intervention may change later outcomes and weaken associations between initial and subsequent scores. This feedback is analogous to the screening paradox, in which successful screening and treatment reduce prevalence and thereby lower subsequent positive predictive value (Balayla, 2021). Studies of predictive relationships should therefore proceed with caution and document how assessment results were used between measurement occasions.
Continued validation should examine how consistently the scale functions in operational use, how children’s scores change over time, and how educators use the resulting information in practice. This includes questions about the degree to which grade 1–3 educators apply the levels consistently, whether individual children demonstrate the hypothesized progression longitudinally, how item- and domain-level results influence educational planning, and whether intended and unintended consequences arise in operational use. Analyses of interrater reliability and educator effects are important for strengthening the validity evidence. Longitudinal and implementation studies would address the progression’s developmental and practical utility. Together, these studies would extend the present content and internal structure evidence into a more complete evaluation of the DRDP 2025 SED scale’s use across P–3 settings.
7. Conclusions
Social and emotional development is foundational to early life, yet many assessments provide snapshots rather than developmental perspectives. This study presents and evaluates an alternative: a theory-informed progression spanning infancy through grade 3, operationalized in the DRDP 2025 through the four building blocks of the BEAR Assessment System.
Taken together, the evidence provides an initial foundation for the intended developmental interpretation and operational uses described in this paper. Item thresholds generally followed the hypothesized ordering, all five items fit the Rasch Partial Credit Model, dimensionality analyses supported a unidimensional reporting structure, and no DIF of concern was detected across the seven demographic contrasts examined. The higher frequency of positive person misfit in the grade 1–3 sample identifies consistency of individual response profiles in that group as a priority for further validation, including investigation of rating processes and educator effects.
The scale is designed to support developmental observation, formative planning, and aggregate reporting. Its promise depends not only on its technical quality but also on educators’ preparation and support in using developmental observations and interpreting results. Continued interrater, longitudinal, and implementation research is a priority for the ongoing validation of the DRDP 2025 and will further clarify how the scale supports practice and children’s learning and development.
Supplementary Materials
The following supporting information can be downloaded at: https://www.mdpi.com/article/10.3390/educsci16111937/s1, Figure S1.1. Distributions of Rasch Person Infit by Domain, Figure S2.1: Item Category Characteristic Curves for Item SED 1, Figure S2.2: Item Category Characteristic Curves for Item SED 2, Figure S2.3: Item Category Characteristic Curves for Item SED 3, Figure S2.4: Item Category Characteristic Curves for Item SED 4, Figure S2.5: Item Category Characteristic Curves for Item SED 5; Table S1.1. Analytic Sample Characteristics by Instrument Form, Table S1.2. Descriptive Statistics for Person Infit by Domain, Table S1.3. Percentage of Cases with Positive Person Misfit, Table S1.4. Single-Level Logistic Regression Models Predicting Positive Person Misfit, Table S1.5. Adjusted Marginal Probability of Positive Person Misfit by Domain and Form.
Author Contributions
Conceptualization, J.S. and M.W.; methodology, J.S. and M.W.; software, J.S.; validation, J.S.; formal analysis, J.S.; investigation, J.S. and M.W.; data curation, J.S.; writing—original draft preparation, J.S.; writing—review and editing, J.S. and M.W.; visualization, J.S.; supervision, M.W.; project administration, J.S. and M.W. All authors have read and agreed to the submitted version of the manuscript.
Funding
This research received no external funding.
Institutional Review Board Statement
The WestEd Institutional Review Board reviewed the DRDP 2025 Assessment Pilot and Field Studies protocol and determined it to be exempt from further IRB review (Protocol HE-2024-57. Date approved: 29 July 2025).
Informed Consent Statement
The WestEd Institutional Review Board approved a waiver of informed consent for child participation using a passive, opt-out parent/guardian permission process. Parents/guardians received study information in English and Spanish, with additional translations available upon request, and could decline their child’s inclusion. Educators’ observations occurred during ordinary classroom or program activities, with no research-specific tasks imposed on children. Data provided to the University of California, Berkeley BEAR Center for the analyses reported here were de-identified.
Data Availability Statement
Analytic code sufficient to reproduce the reported analyses is available from the corresponding author upon reasonable request, subject to restrictions required to protect the confidentiality and governance conditions of the underlying data. The data analyzed in this study are not publicly available due to participant privacy and confidentiality restrictions.
Conflicts of Interest
J.S. and M.W. participated in the development and psychometric evaluation of the DRDP assessment system. The authors’ roles are disclosed to support transparent interpretation of the findings. California Department of Education and California Department of Social Services had no role in the design of the present study; in the writing of the manuscript; or in the decision to publish the results.
Note
| 1 | Reliability was estimated using the WLE person separation coefficient, which is analogous to the usual Cronbach’s alpha. |
References
- Adams, R. J., & Khoo, S. T. (1996). Quest: Interactive test analysis system [Computer software]. Australian Council for Educational Research. [Google Scholar]
- Adams, R. J., Wilson, M., & Wang, W.-C. (1997). The multidimensional random coefficients multinomial logit model. Applied Psychological Measurement, 21(1), 1–23. [Google Scholar] [CrossRef] [Scilit]
- Adams, R. J., Wu, M. L., Cloney, D., Berezner, A., & Wilson, M. (2020). ACER ConQuest: Generalised item response modelling software (Version 5.29) [Computer software]. Australian Council for Educational Research. Available online: https://www.acer.org/au/conquest (accessed on 1 October 2026).
- American Educational Research Association [AERA], American Psychological Association [APA] & National Council on Measurement in Education [NCME]. (2014). Standards for educational and psychological testing. American Educational Research Association. [Google Scholar]
- Balayla, J. (2021). On the formalism of the screening paradox. PLoS ONE, 16(9), e0256645. [Google Scholar] [CrossRef] [Scilit] [PubMed]
- BEAR Center. (2006). DRDP-R development and validation technical report. University of California, Berkeley, Graduate School of Education. [Google Scholar]
- Berg, J., Osher, D., Same, M. R., Nolan, E., Benson, D., & Jacobs, N. (2017). Identifying, defining, and measuring social and emotional competencies. American Institutes for Research. [Google Scholar]
- California Department of Education [CDE]. (2024). Preschool/Transitional Kindergarten Learning Foundations (PTKLF). California Department of Education.
- California Department of Social Services [CDSS]. (2025). Infant–Toddler Learning and Development Foundations (ITLDF), 2nd ed.; California Department of Social Services.
- Cantor, P., Osher, D., Berg, J., Steyer, L., & Rose, T. (2019). Malleability, plasticity, and individuality: How children learn and develop in context. Applied Developmental Science, 23(4), 307–337. [Google Scholar] [CrossRef] [Scilit]
- CASEL. (2020). CASEL’s SEL framework: What are the core competence areas and where are they promoted? Collaborative for Academic, Social, and Emotional Learning. [Google Scholar]
- Chen-Gaddini, M., Sussman, J., Newton, E., Ruiz Jiminez, G. S., Kriener-Althen, K., Gochyyev, P., Draney, K., & Mangione, P. (2022). DRDP technical report for early infancy through kindergarten: Interrater reliability. WestEd. [Google Scholar]
- Darling-Churchill, K. E., & Lippman, L. (2016). Early childhood social and emotional development: Advancing the field of measurement. Journal of Applied Developmental Psychology, 45, 1–7. [Google Scholar] [CrossRef] [Scilit]
- Denham, S. A. (2006). Social-emotional competence as support for school readiness: What is it and how do we assess it? Early Education and Development, 17(1), 57–89. [Google Scholar] [CrossRef] [Scilit] [PubMed]
- Denham, S. A., Wyatt, T. M., Bassett, H. H., Echeverria, D., & Knox, S. S. (2009). Assessing social-emotional development in children from a longitudinal perspective. Journal of Epidemiology and Community Health, 63(1), 37–52. [Google Scholar] [CrossRef] [Scilit] [PubMed]
- Desired Results for Children and Families Collaborative Group [DCRG]. (2018). DRDP 2015 preschool through kindergarten research summary. WestEd.
- Diakow, R., Irribarra, D. T., & Wilson, M. (2013). Some comments on representing construct levels in psychometric models. In R. E. Millsap, L. A. van der Ark, D. M. Bolt, & C. M. Woods (Eds.), New developments in quantitative psychology (pp. 319–334). Springer. [Google Scholar] [CrossRef] [Scilit]
- Draney, K., Sussman, J., Gochyyev, P., Kriener-Althen, K., Newton, E., & Mangione, P. (2022). DRDP technical report for early infancy through kindergarten: Structural validity and reliability information for the desired results developmental profile. WestEd. [Google Scholar]
- Dunn, J. (2004). Children’s friendships: The beginnings of intimacy. Blackwell. [Google Scholar]
- Dunphy, E. (2010). Assessing early learning through formative assessment: Key issues and considerations. Irish Educational Studies, 29(1), 41–56. [Google Scholar] [CrossRef] [Scilit]
- Durlak, J. A., Weissberg, R. P., Dymnicki, A. B., Taylor, R. D., & Schellinger, K. B. (2011). The impact of enhancing students’ social and emotional learning: A meta-analysis of school-based universal interventions. Child Development, 82(1), 405–432. [Google Scholar] [CrossRef] [Scilit] [PubMed]
- Easterbrooks, M. A., Bartlett, J. D., Beeghly, M., & Thompson, R. A. (2013). Social and emotional development in infancy. In R. M. Lerner, M. A. Easterbrooks, J. Mistry, & I. B. Weiner (Eds.), Handbook of psychology: Vol. 6. Developmental psychology (2nd ed., pp. 91–120). Wiley. [Google Scholar]
- Empson, S. (2011). On the idea of learning trajectories: Promises and pitfalls. The Mathematics Enthusiast, 8(3), 571–598. [Google Scholar] [CrossRef] [Scilit]
- Feuerstahler, L., & Wilson, M. (2021). Scale alignment in the between-item multidimensional partial credit model. Applied Psychological Measurement, 45(4), 268–282. [Google Scholar] [CrossRef] [Scilit] [PubMed]
- First 5. (2022). Improving racial equity in kindergarten readiness inventory efforts. First 5 Center for Children’s Policy. [Google Scholar]
- Fischer, K. W., & Bidell, T. R. (2006). Dynamic development of action and thought. In W. Damon, & R. M. Lerner (Eds.), Handbook of child psychology: Vol. 1. Theoretical models of human development (6th ed., pp. 313–399). Wiley. [Google Scholar]
- Griffin, P. (2007). The comfort of competence and the uncertainty of assessment. Studies in Educational Evaluation, 33(1), 87–99. [Google Scholar] [CrossRef] [Scilit]
- Halle, T. G., & Darling-Churchill, K. E. (2016). Review of measures of social and emotional development. Journal of Applied Developmental Psychology, 45, 8–18. [Google Scholar] [CrossRef] [Scilit]
- Harris, L. R., Adie, L., & Wyatt-Smith, C. (2022). Learning progression–based assessments: A systematic review of student and teacher uses. Review of Educational Research, 92(6), 996–1040. [Google Scholar] [CrossRef] [Scilit]
- Harter, S. (2006). The self. In N. Eisenberg (Ed.), Handbook of child psychology (6th ed., Vol. 3, pp. 505–570). Wiley. [Google Scholar]
- Holland, P. W., & Wainer, H. (Eds.). (1993). Differential item functioning. Lawrence Erlbaum Associates. [Google Scholar] [CrossRef] [Scilit]
- Immordino-Yang, M. H., Darling-Hammond, L., & Krone, C. R. (2019). Nurturing nature: How brain development is inherently social and emotional, and what this means for education. Educational Psychologist, 54(3), 185–204. [Google Scholar] [CrossRef] [Scilit]
- Jones, D. E., Greenberg, M., & Crowley, M. (2015). Early social-emotional functioning and public health: The relationship between kindergarten social competence and future wellness. American Journal of Public Health, 105(11), 2283–2290. [Google Scholar] [CrossRef] [Scilit] [PubMed]
- Jones, S. M., & Bouffard, S. M. (2012). Social and emotional learning in schools: From programs to strategies. Social Policy Report, 26(4), 1–33. [Google Scholar] [CrossRef] [Scilit]
- Jones, S. M., McGarrah, M. W., & Kahn, J. (2019). Social-emotional learning: A principled science of human development in context. Educational Psychologist, 54(3), 129–143. [Google Scholar] [CrossRef] [Scilit]
- Kamei, T., Page, J., Eadie, P., & Nguyen, C. (2026). Collaboration with teachers to adapt and validate assessments to support intentional teaching practice in early childhood education. Australasian Journal of Early Childhood, 1–16, Advance online publication. [Google Scholar] [CrossRef] [Scilit]
- Karelitz, T. M., Parrish, D. M., Yamada, H., & Wilson, M. (2010). Articulating assessments across childhood: The cross-age validity of the desired results developmental profile–revised. Educational Assessment, 15(1), 1–26. [Google Scholar] [CrossRef] [Scilit]
- Kriener-Althen, K., Newton, E. K., Draney, K., & Mangione, P. L. (2020). Measuring readiness for kindergarten using the desired results developmental profile. Early Education and Development, 31(5), 739–763. [Google Scholar] [CrossRef] [Scilit]
- Mangione, P. L., Osborne, T., & Mendenhall, H. (2019). What’s next? How learning progressions help teachers support children’s development and learning. Young Children, 74(3), 20–25. [Google Scholar]
- Masters, G. N. (1982). A Rasch model for partial credit scoring. Psychometrika, 47(2), 149–174. [Google Scholar] [CrossRef] [Scilit]
- McKown, C. (2019). Challenges and opportunities in the applied assessment of student social and emotional learning. Educational Psychologist, 54(3), 205–221. [Google Scholar] [CrossRef] [Scilit]
- Moffitt, T. E., Arseneault, L., Belsky, D., Dickson, N., Hancox, R. J., Harrington, H., Houts, R., Poulton, R., Roberts, B. W., Ross, S., Sears, M. R., Thomson, W. M., & Caspi, A. (2011). A gradient of childhood self-control predicts health, wealth, and public safety. Proceedings of the National Academy of Sciences, 108(7), 2693–2698. [Google Scholar] [CrossRef] [Scilit] [PubMed]
- Müller, M. (2020). Item fit statistics for Rasch analysis: Can we trust them? Journal of Statistical Distributions and Applications, 7(1), 5. [Google Scholar] [CrossRef] [Scilit]
- National Education Goals Panel [NEGP]. (1995). Reconsidering children’s early development and learning: Toward common views and vocabulary (Goal 1 Technical Planning Group Report No. 95-03). National Education Goals Panel. Available online: http://eric.ed.gov/?id=ED391576 (accessed on 1 October 2026).
- National Research Council [NRC]. (2008). Early childhood assessment: Why, what, and how. National Academies Press. [Google Scholar] [CrossRef] [Scilit] [PubMed]
- Office of Head Start. (2015). Head Start early learning outcomes framework: Ages birth to five. U.S. Department of Health and Human Services. Available online: https://eclkc.ohs.acf.hhs.gov/sites/default/files/pdf/elof-ohs-framework.pdf (accessed on 1 October 2026).
- Paek, I., & Wilson, M. (2011). Formulating the Rasch differential item functioning model under the marginal maximum likelihood estimation context and its comparison with Mantel–Haenszel procedure in short test and small sample conditions. Educational and Psychological Measurement, 71(6), 1023–1046. [Google Scholar] [CrossRef] [Scilit]
- Robitzsch, A., Kiefer, T., & Wu, M. (2025). TAM: Test analysis modules (Version 4.4-2). R package.
- Rose-Krasnor, L. (1997). The nature of social competence: A theoretical review. Social Development, 6(1), 111–135. [Google Scholar] [CrossRef] [Scilit]
- Rubin, K. H., Coplan, R., Chen, X., Bowker, J., & McDonald, K. L. (2011). Peer relationships in childhood. In M. E. Lamb, & M. H. Bornstein (Eds.), Social and personality development: An advanced textbook (pp. 317–368). Psychology Press. [Google Scholar] [CrossRef] [Scilit]
- Selman, R. L. (1980). The growth of interpersonal understanding. Academic Press. [Google Scholar]
- Sussman, J., Draney, K., & Wilson, M. (2025). Cultural sensitivity of early childhood assessments based on learning progressions: A Rasch person fit analysis. Educational Assessment, Evaluation, and Accountability, 37, 171–203. [Google Scholar] [CrossRef] [Scilit]
- Sussman, J., Kriener-Althen, K., & Draney, K. (2026). Desired Results Developmental Profile (2025): Preliminary technical report—Evidence from the 2024 Pilot Study and 2025 Field Study [Preliminary technical report prepared for the DRDP 2025 Technical Assistance Committee California Department of Education]. Available online: https://drive.google.com/file/d/1G762vMovNLn-y70vGOH47T0J1N7_UY5D/view (accessed on 1 October 2026).
- Thompson, R. A., Goodvin, R., & Meyer, S. (2006). Social development: Psychological understanding, self understanding, and relationships. In J. Luby (Ed.), Handbook of preschool mental health: Development, disorders and treatment (pp. 3–22). Guilford. [Google Scholar]
- Torres Irribarra, D., Diakow, R., Freund, R., & Wilson, M. (2015). Modeling for directly setting theory-based performance levels. Psychological Test and Assessment Modeling, 57(3), 396–422. [Google Scholar]
- Waterman, C., McDermott, P. A., Fantuzzo, J. W., & Gadsden, V. L. (2012). The matter of assessor variance in early childhood education—Or whose score is it anyway? Early Childhood Research Quarterly, 27, 46–54. [Google Scholar] [CrossRef] [Scilit]
- Wellman, H. M. (2014). Making minds: How theory of mind develops. Oxford University Press. [Google Scholar]
- Wilson, M. (2023). Constructing measures: An item response modeling approach (2nd ed.). Routledge. [Google Scholar] [CrossRef] [Scilit]
- Wilson, M., & Sloane, K. (2000). From principles to practice: An embedded assessment system. Applied Measurement in Education, 13(2), 181–208. [Google Scholar] [CrossRef] [Scilit] [PubMed]
- Wright, B. D., & Masters, G. N. (1982). Rating scale analysis. MESA Press. [Google Scholar]
- Yates, T., Ostrosky, M. M., Cheatham, G. A., Fettig, A., Shaffer, L., & Santos, R. M. (2008). Research synthesis on screening and assessing social-emotional competence. The Center on the Social and Emotional Foundations for Early Learning. Available online: http://www.eita-pa.org/assets/Copy-of-rs_screening_assessment-4.pdf (accessed on 1 October 2026).
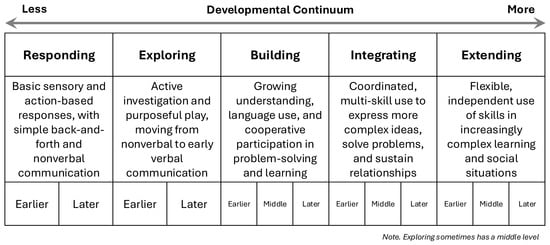
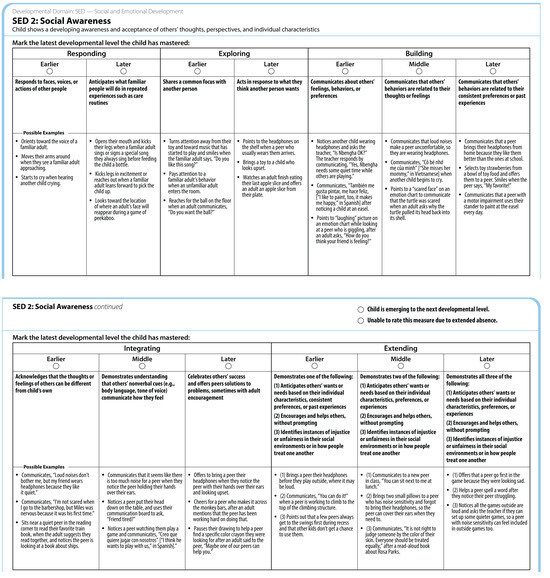
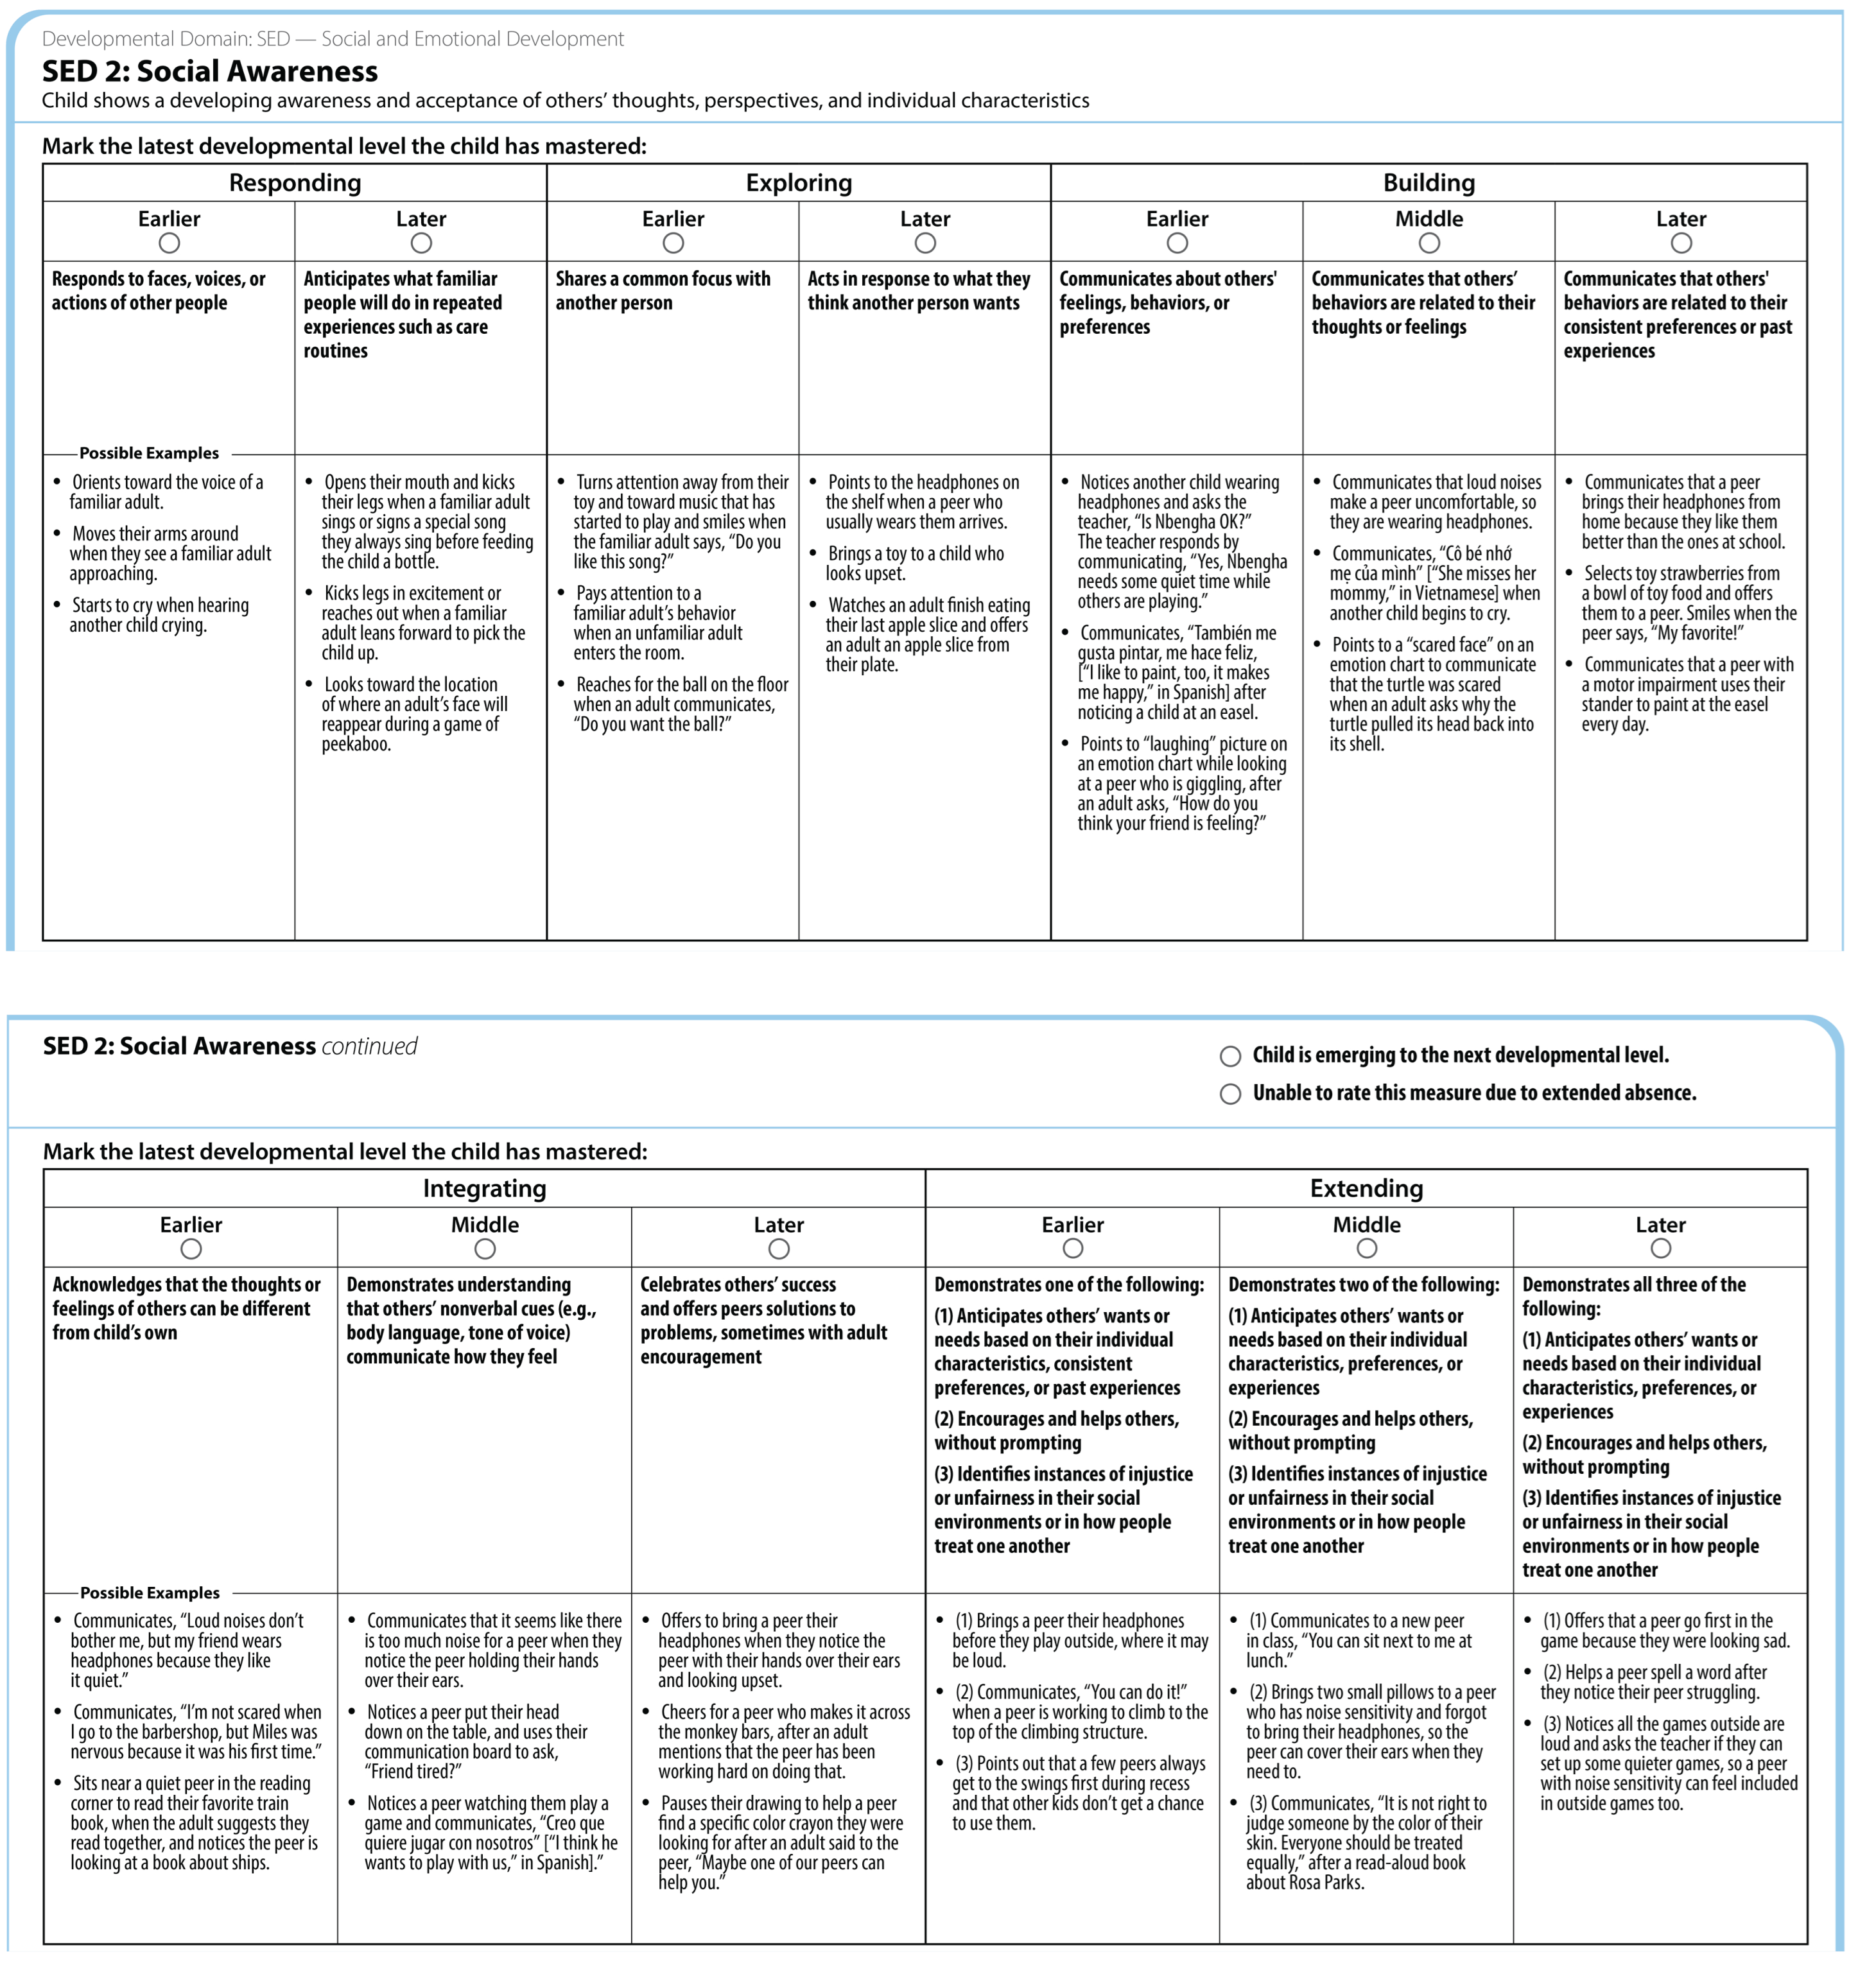
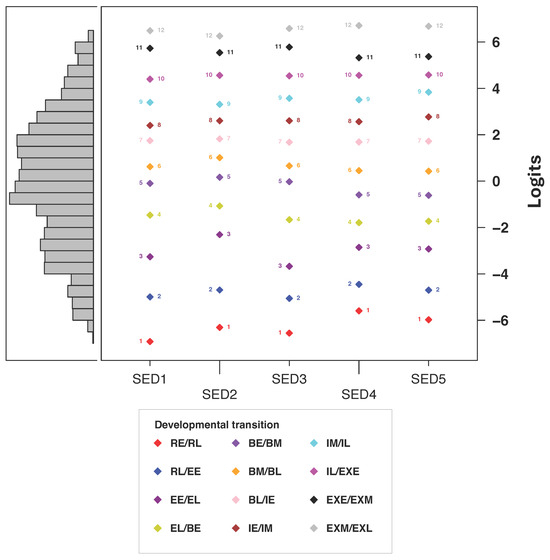
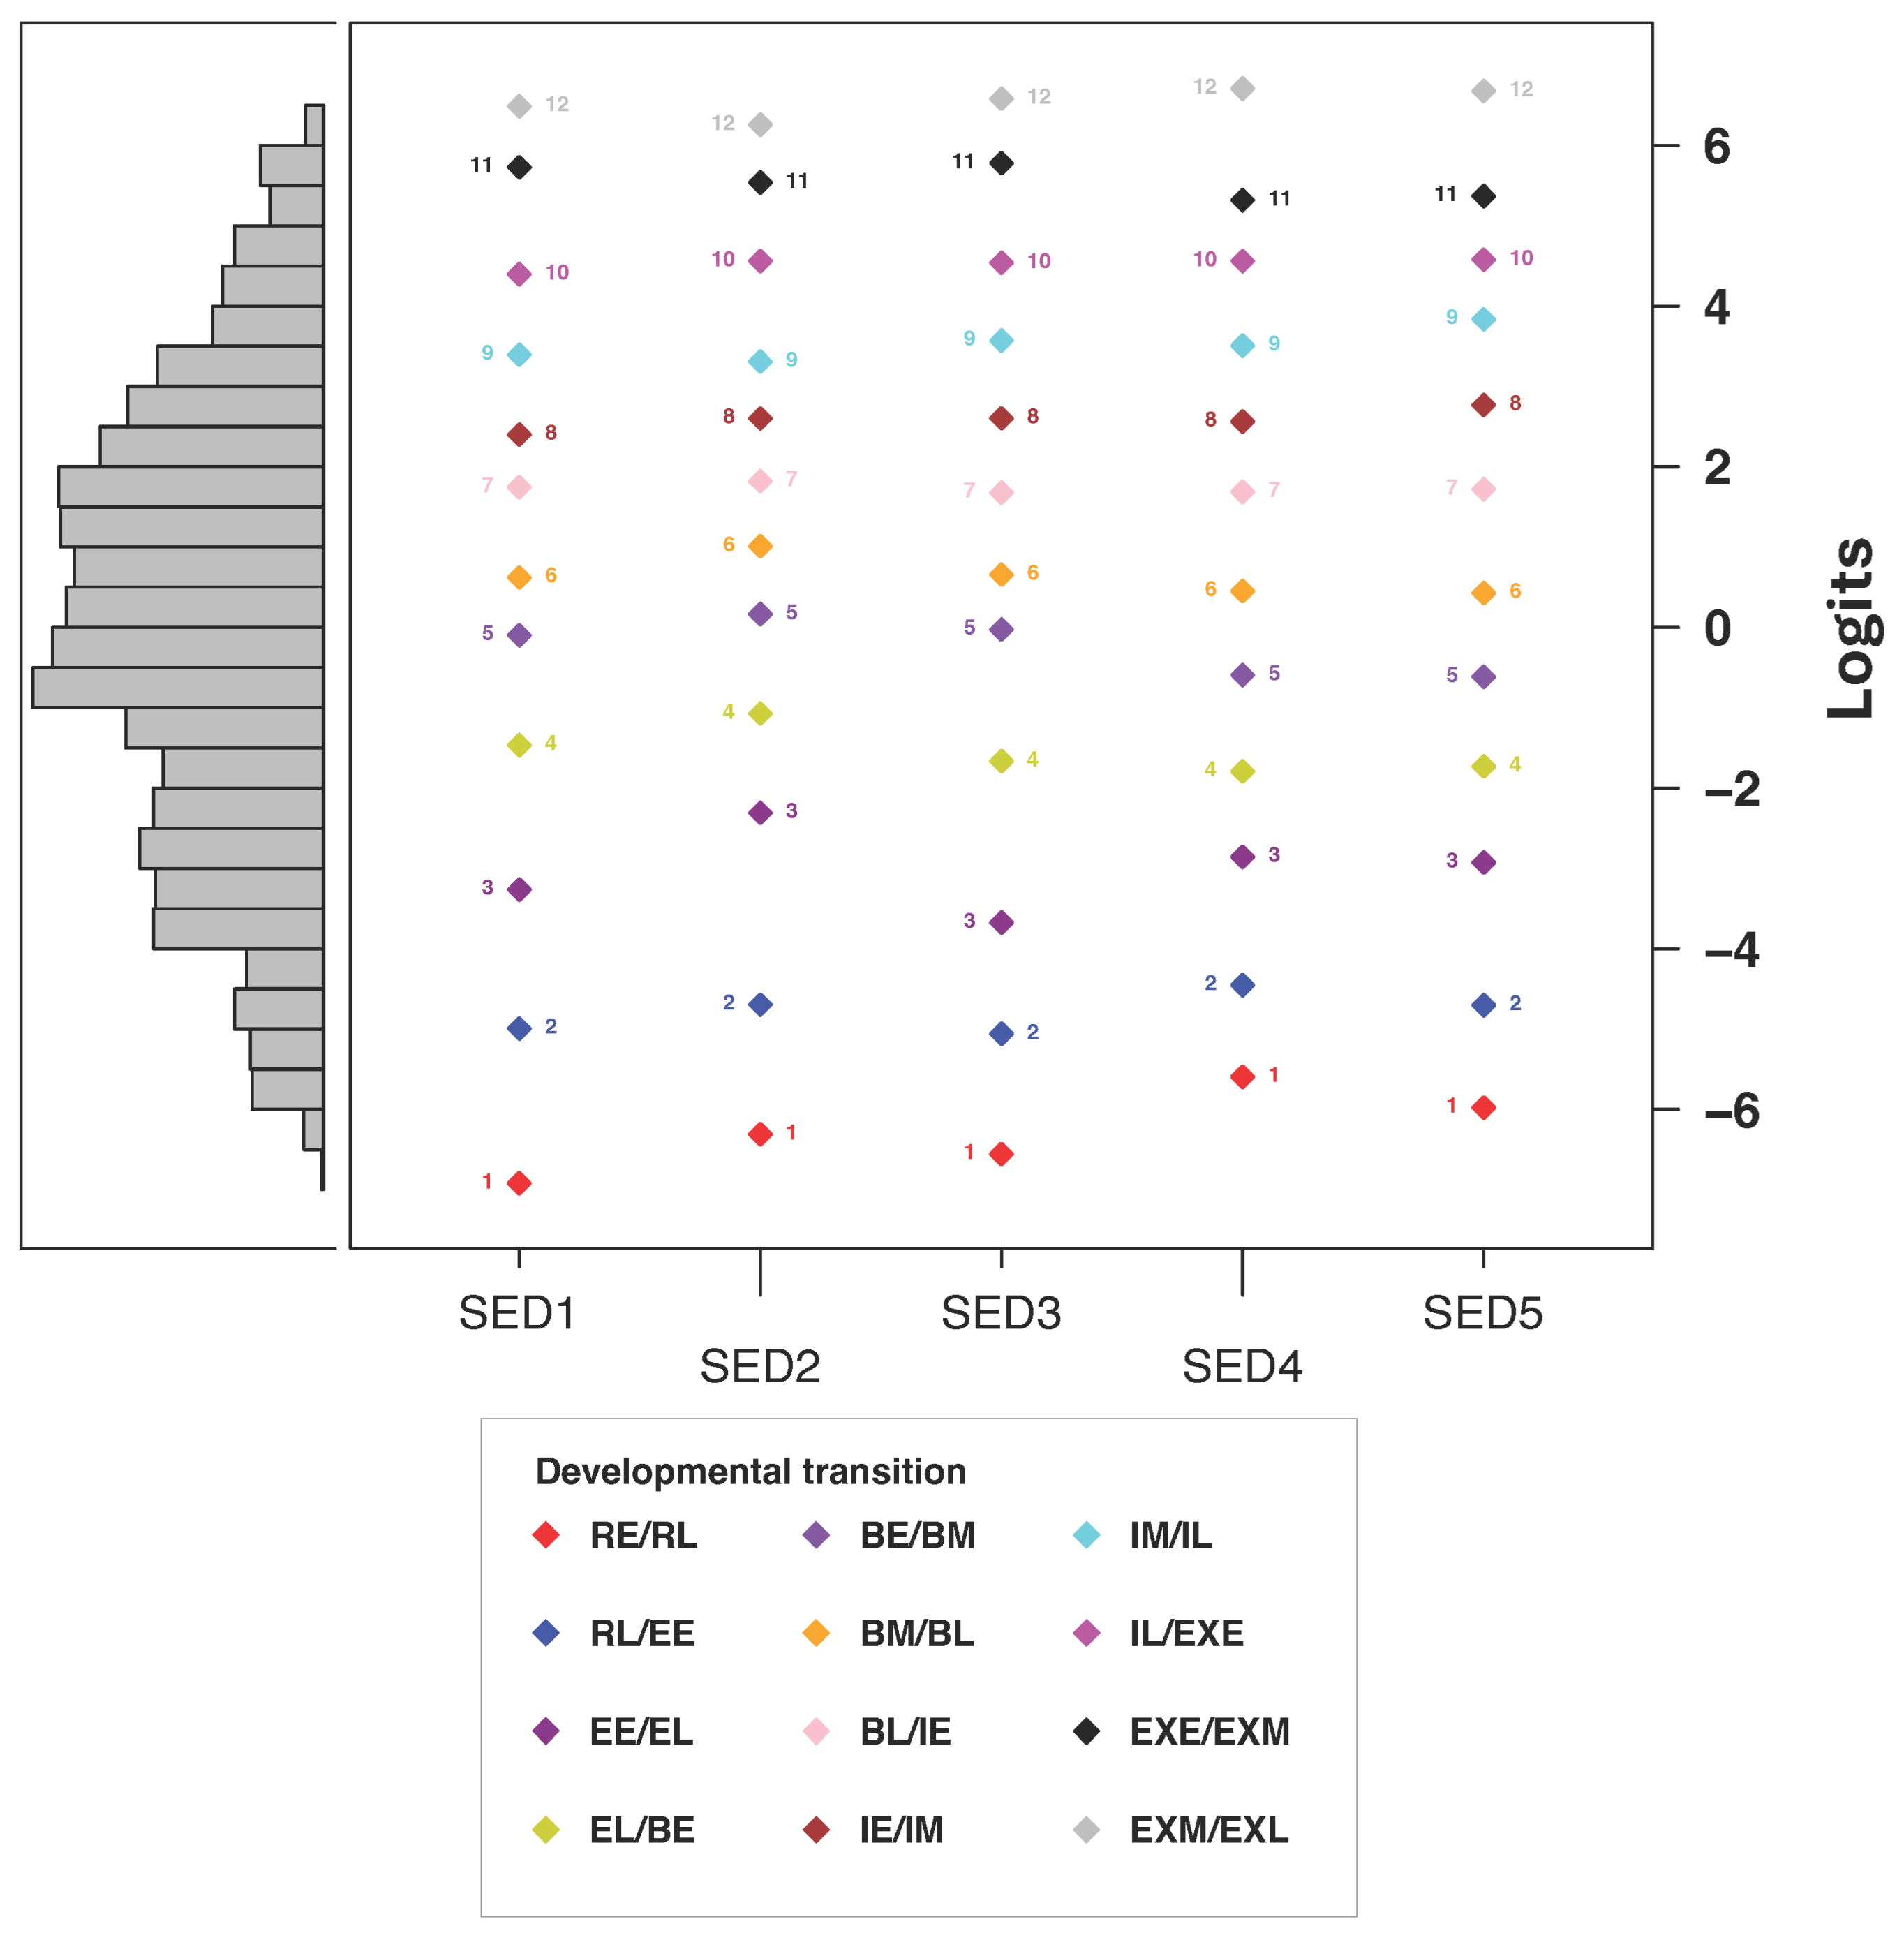
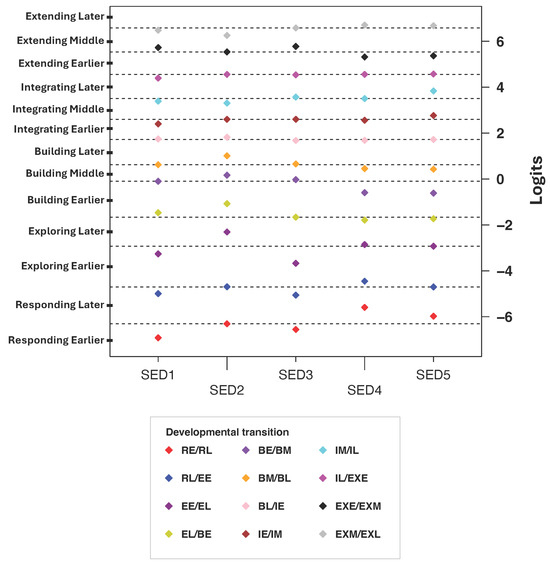
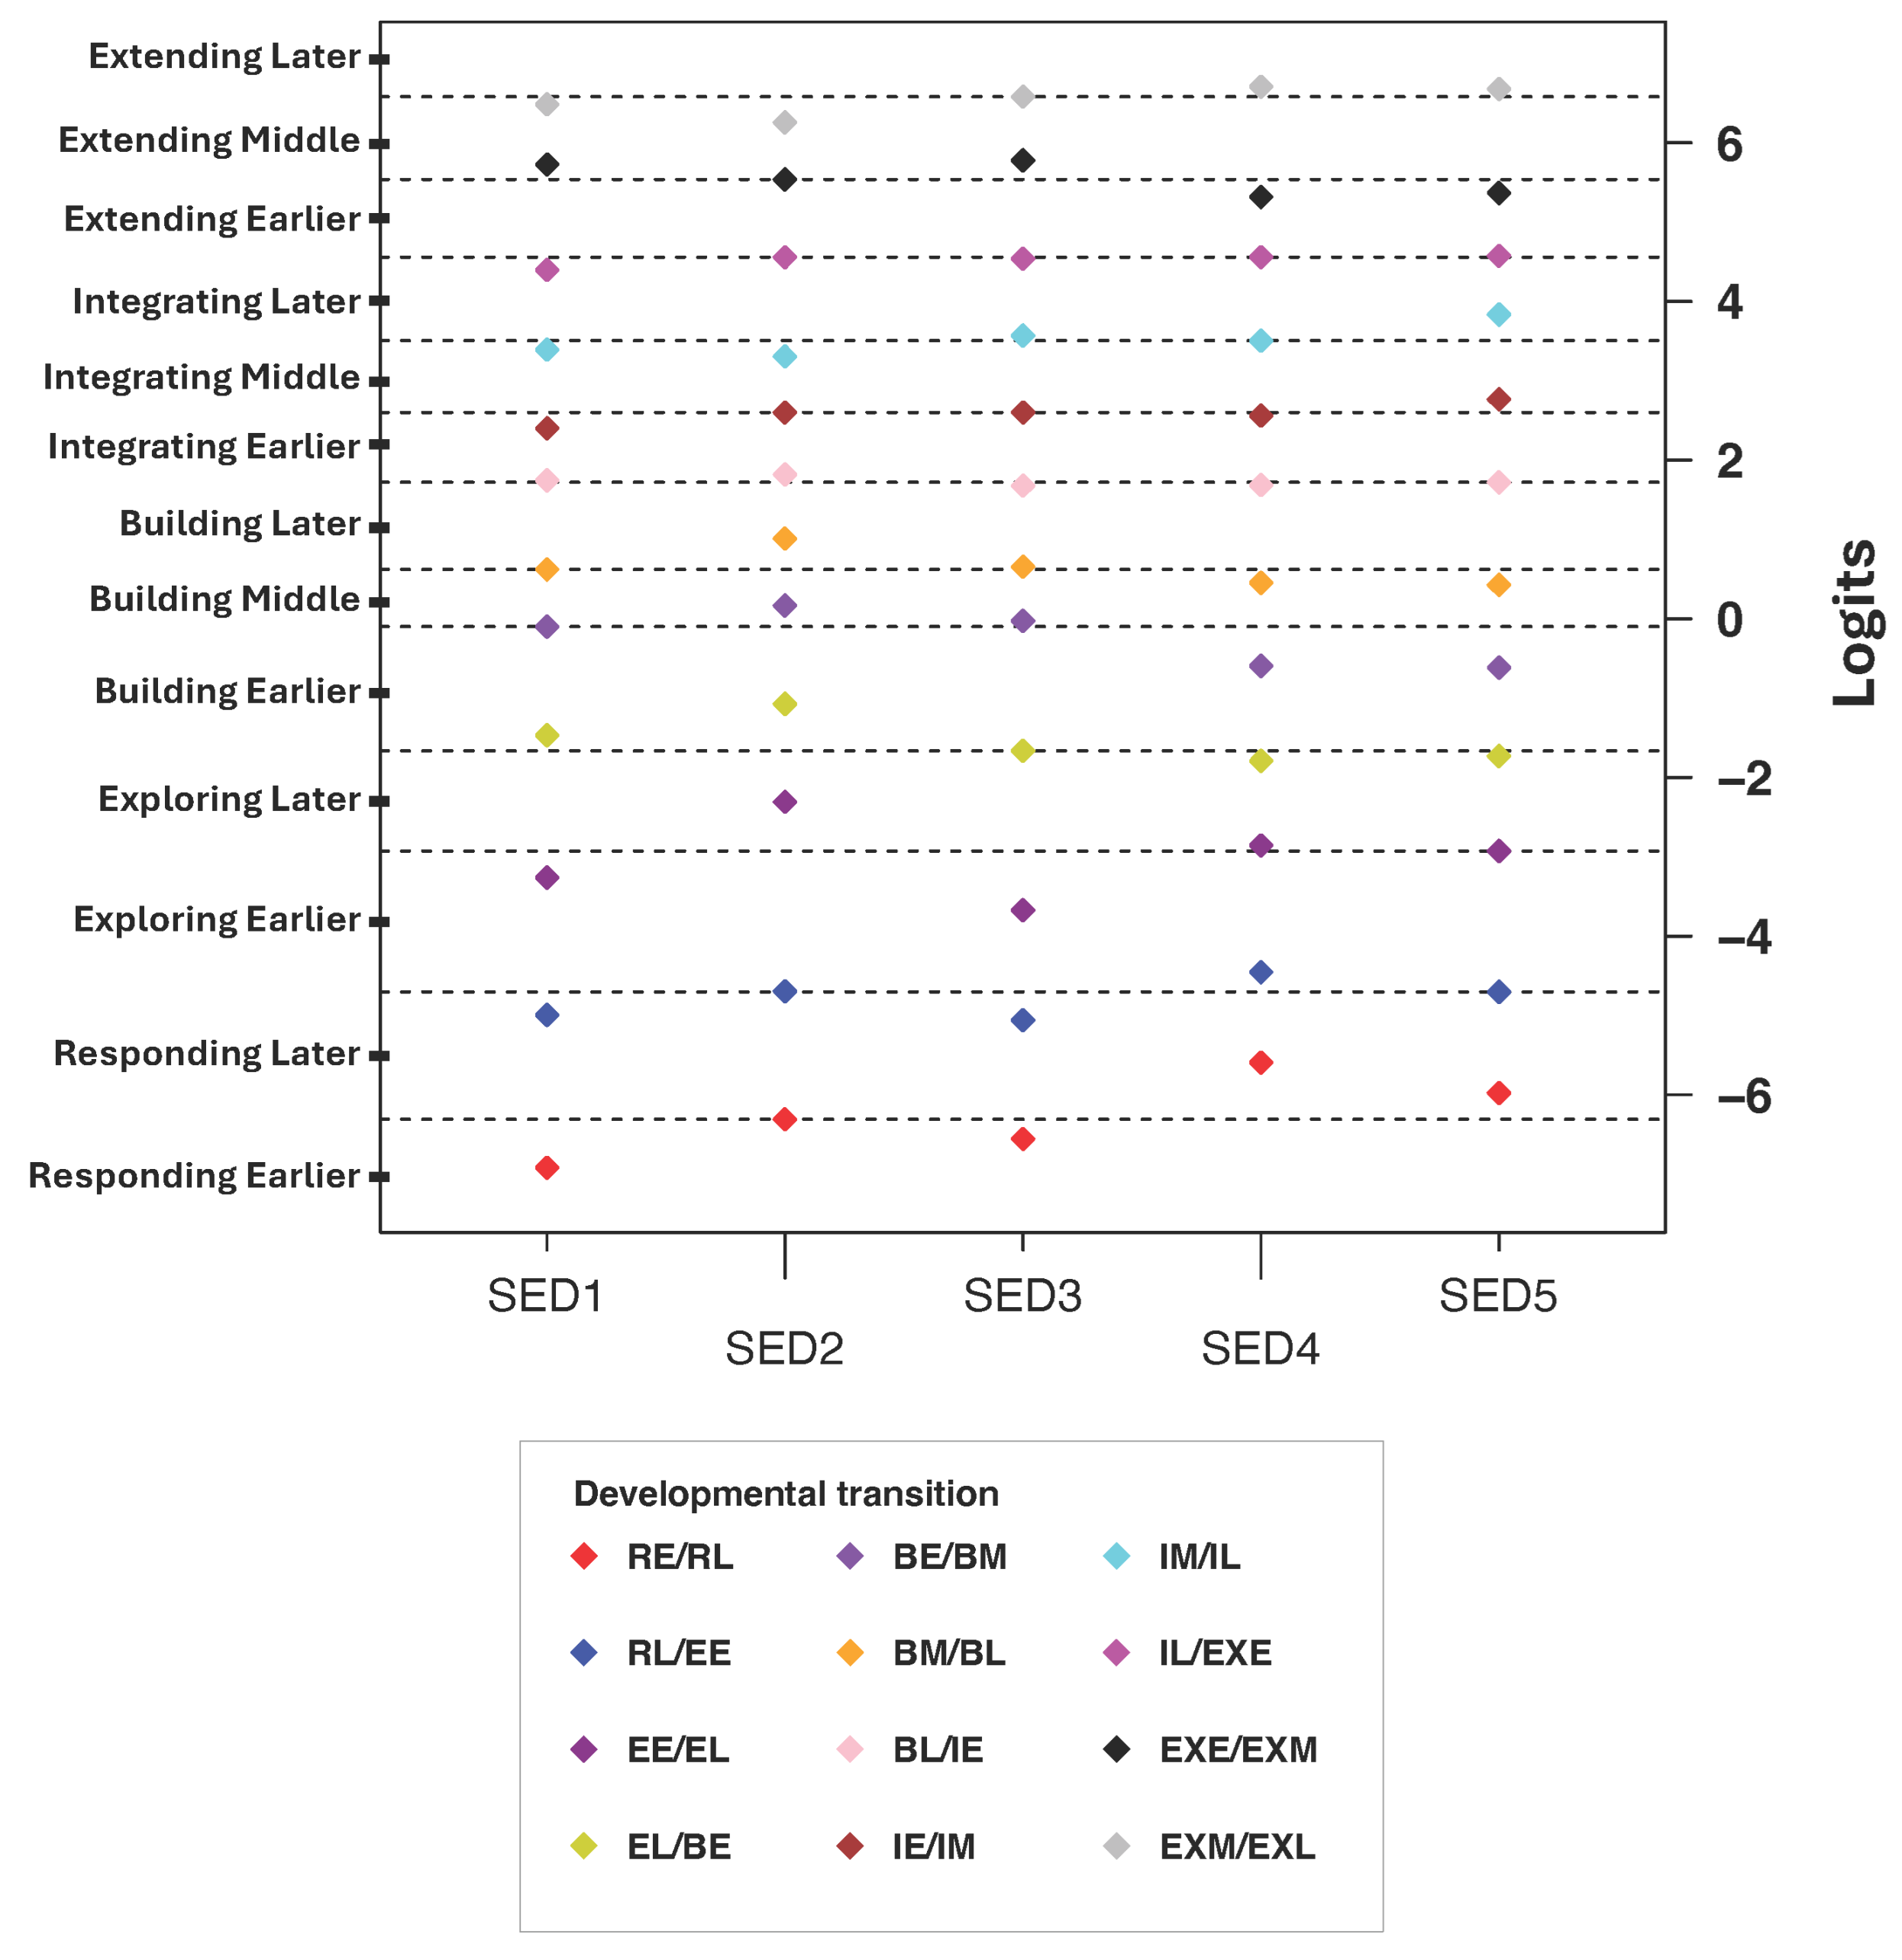
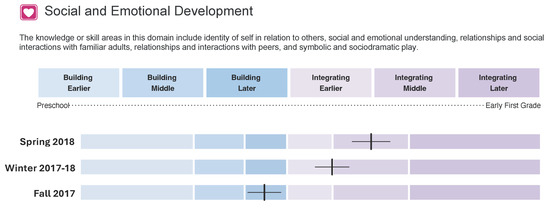
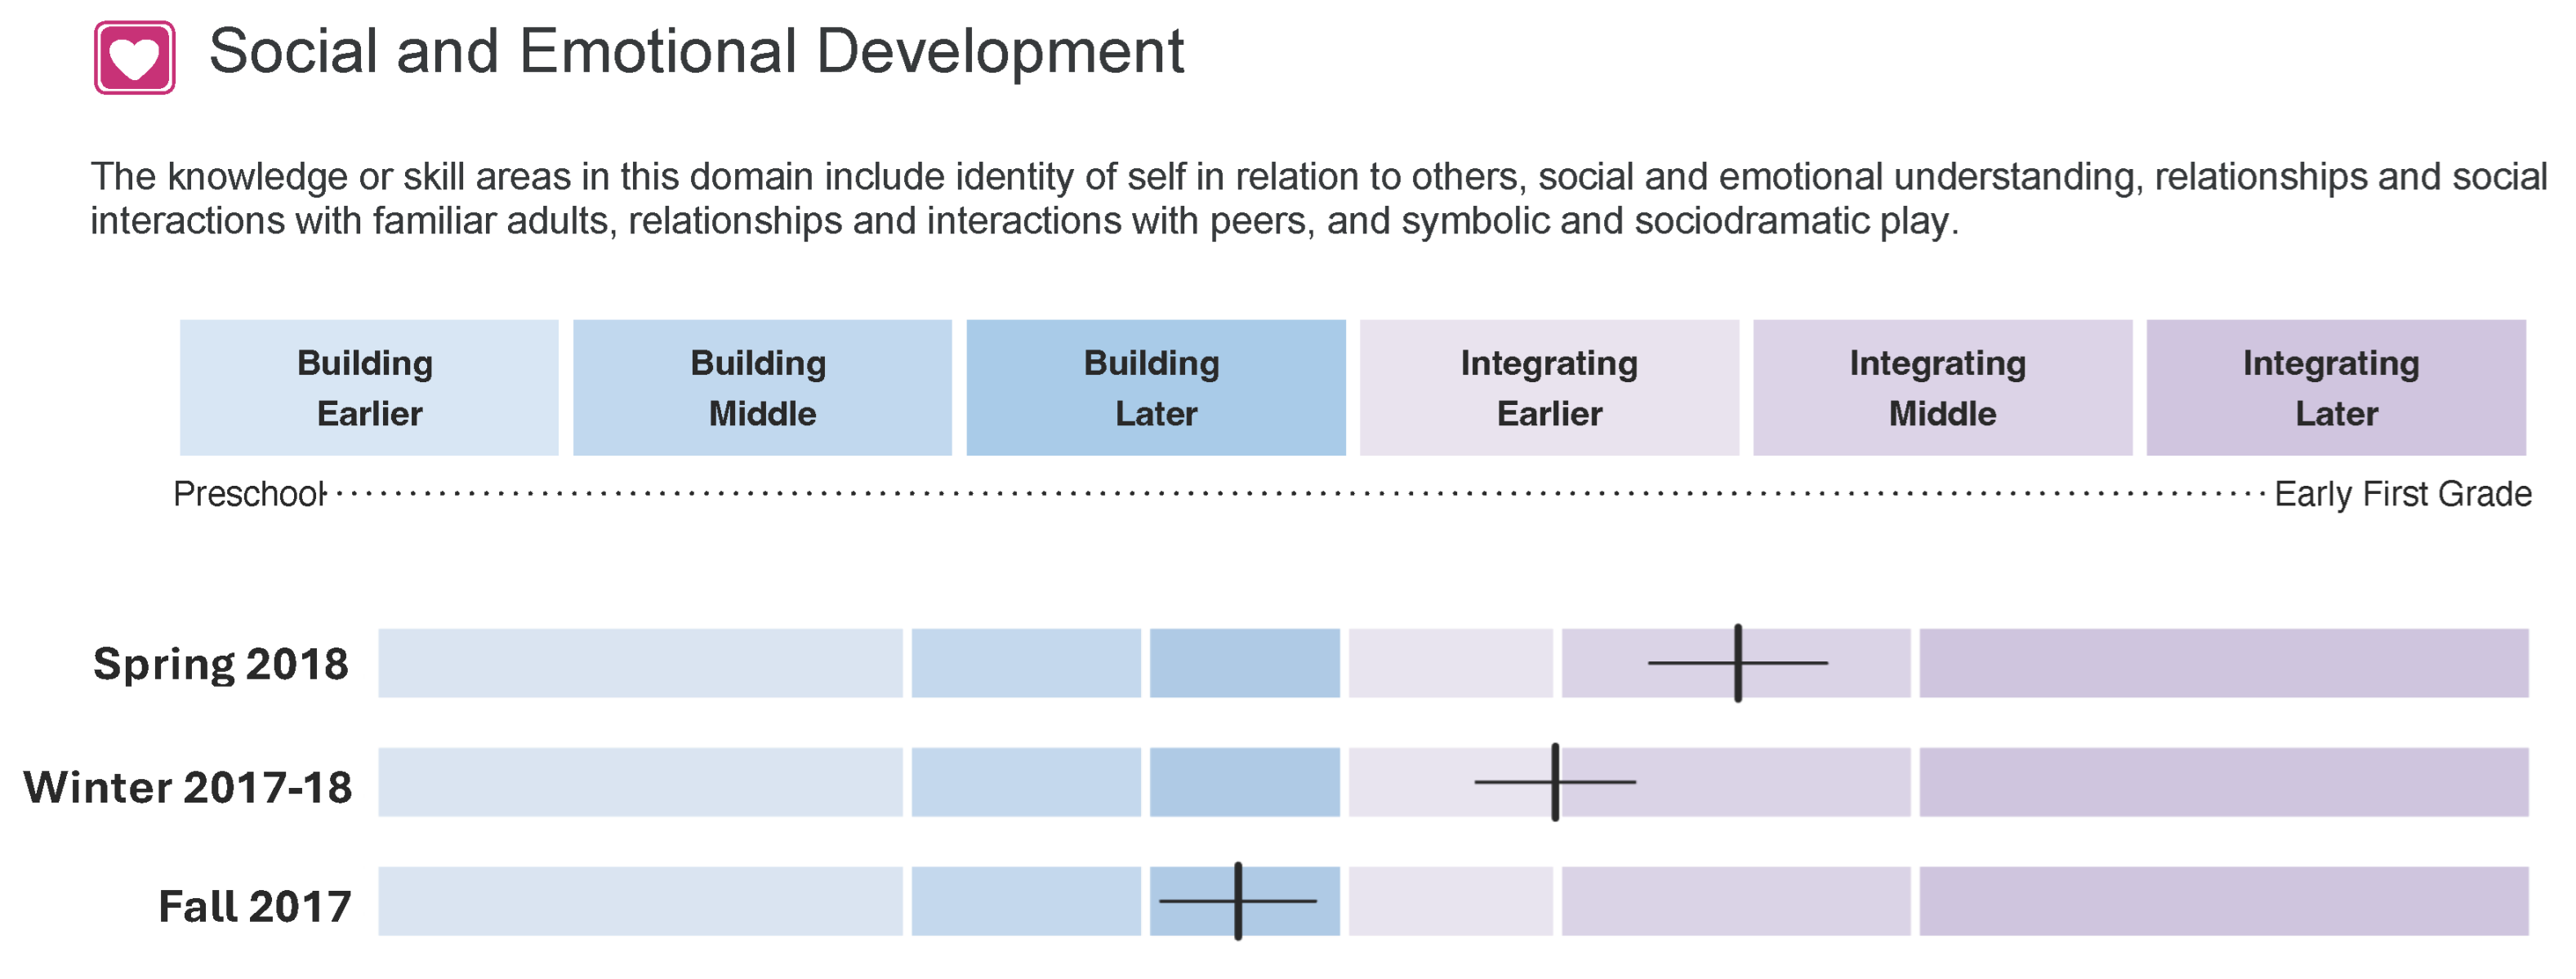
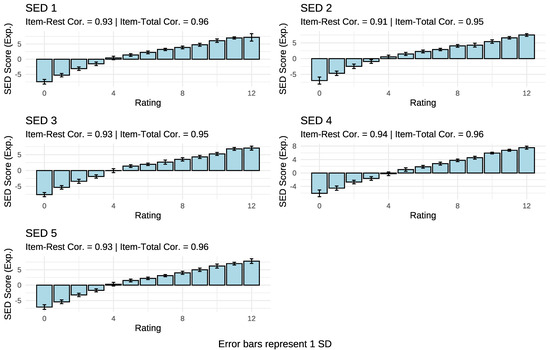
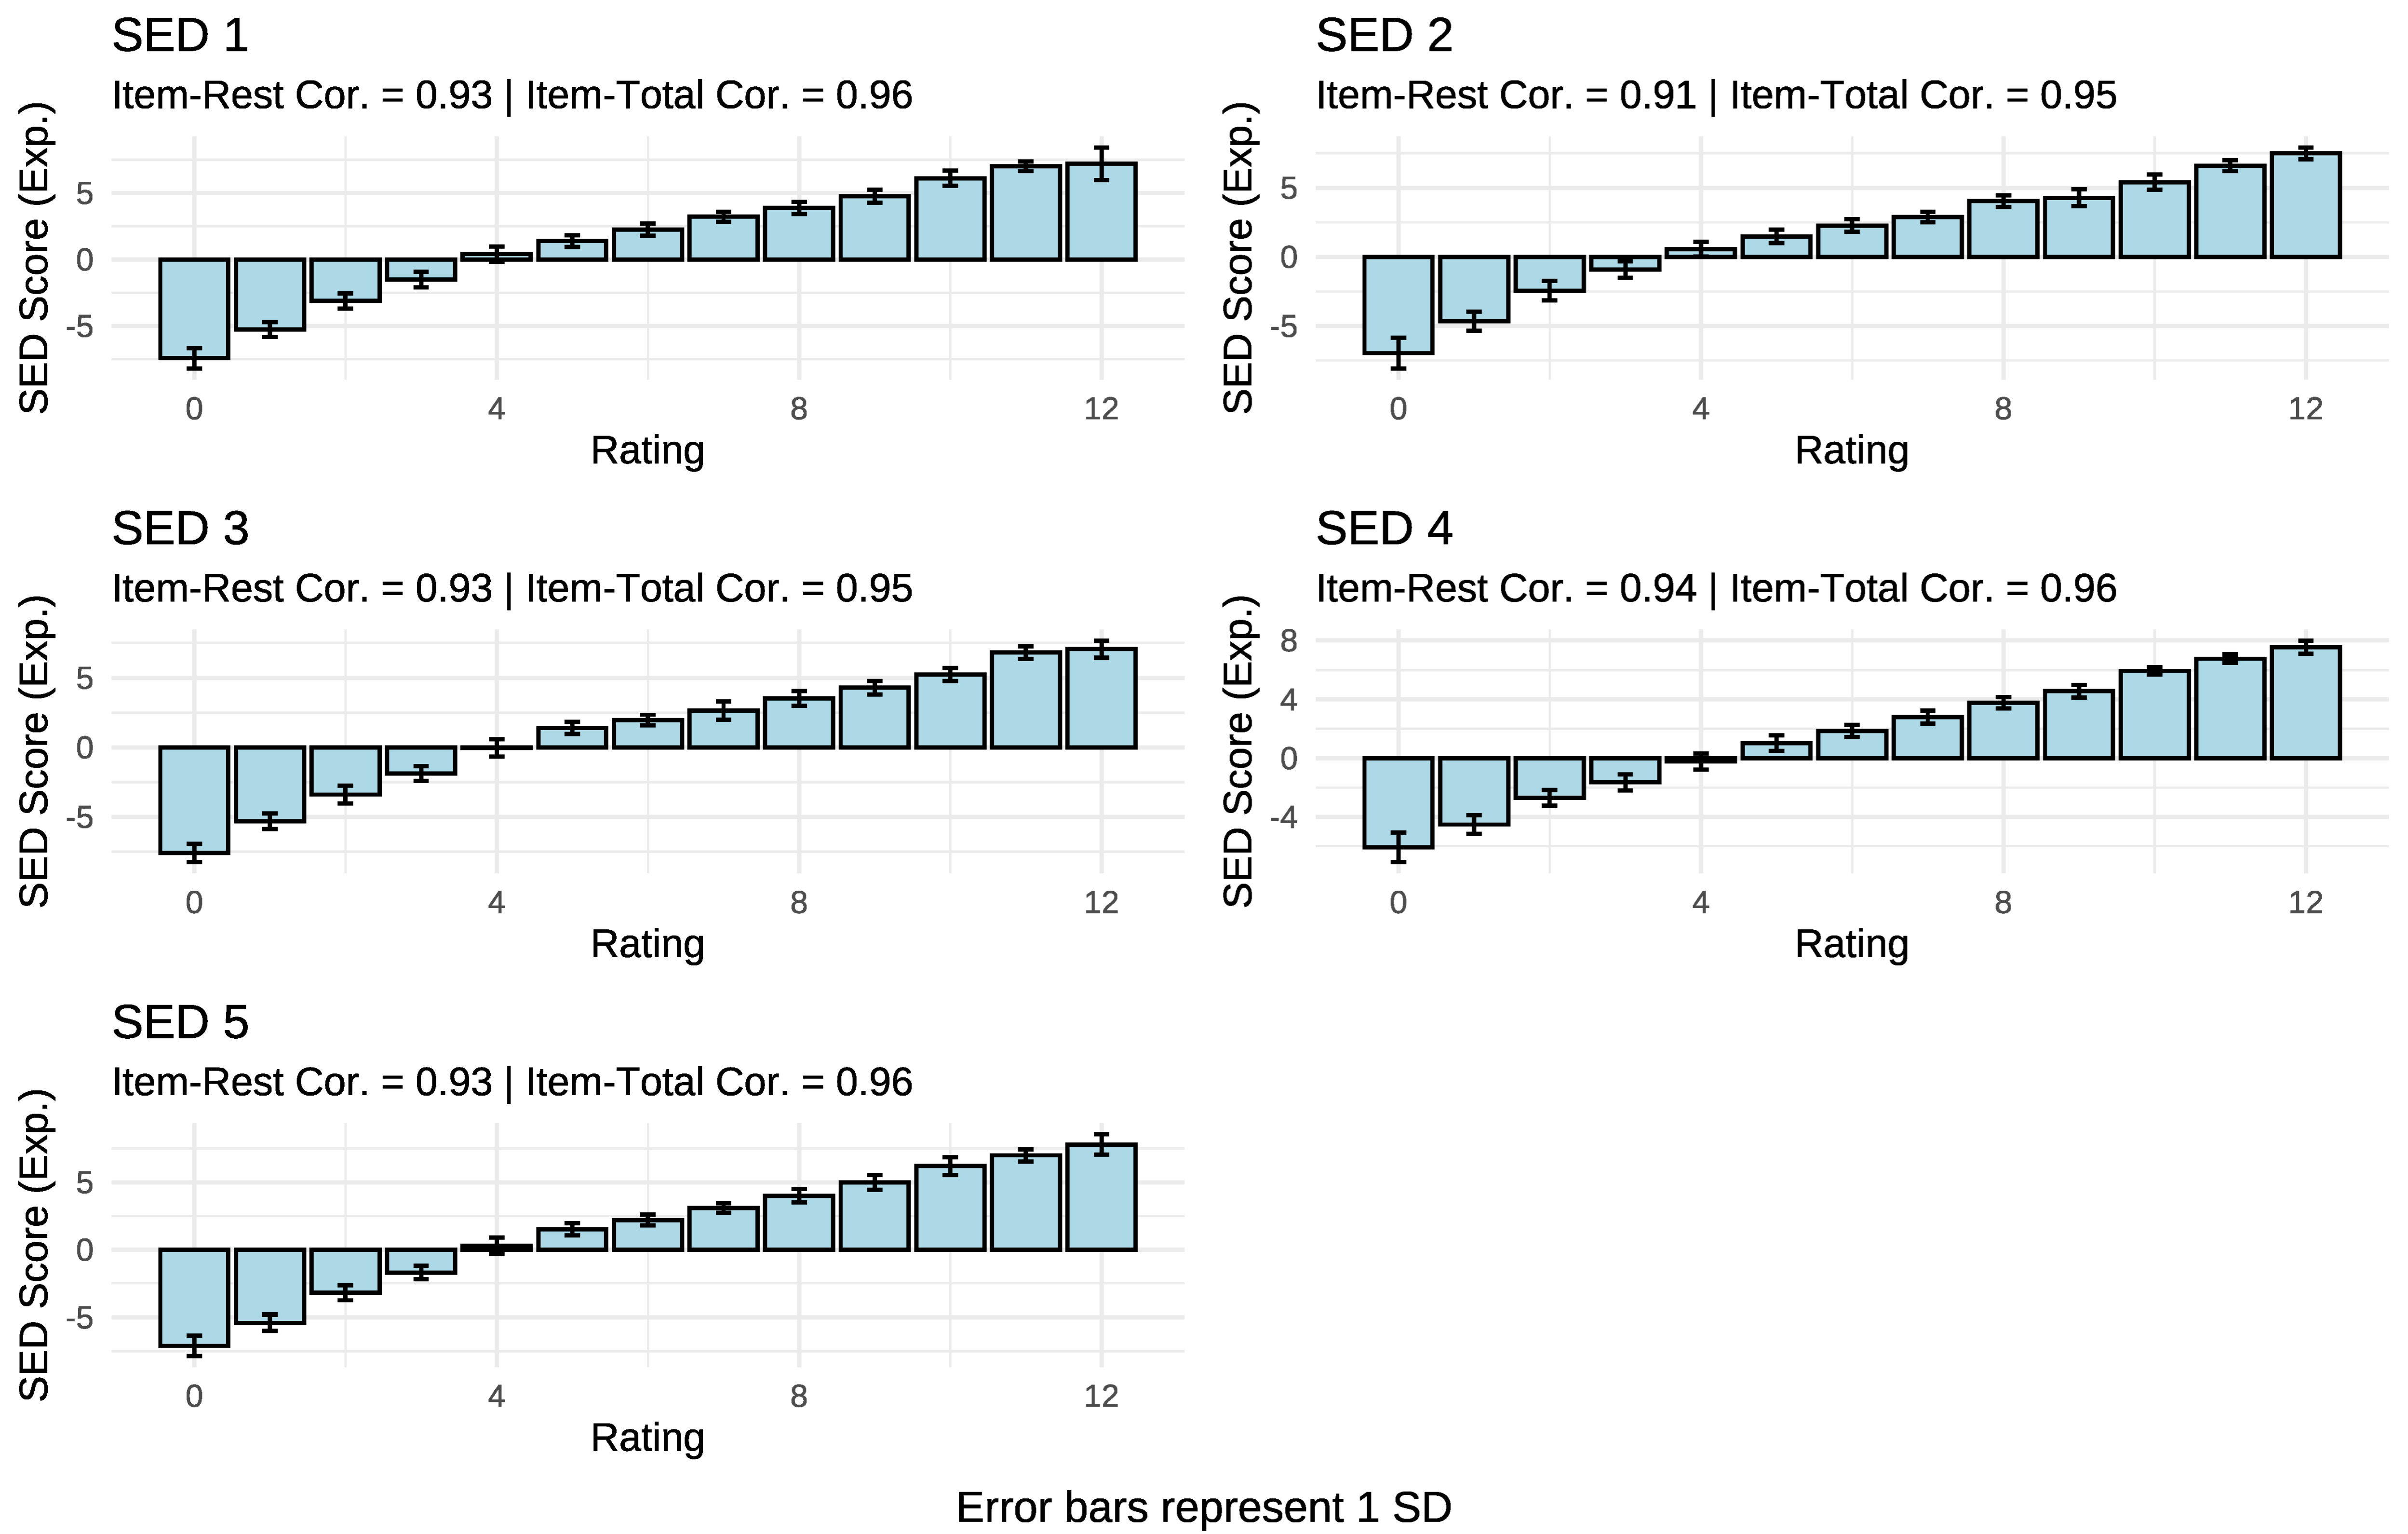
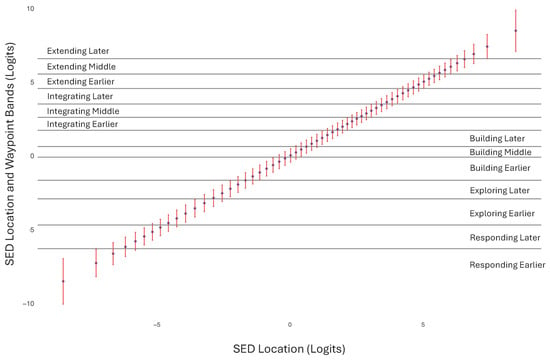
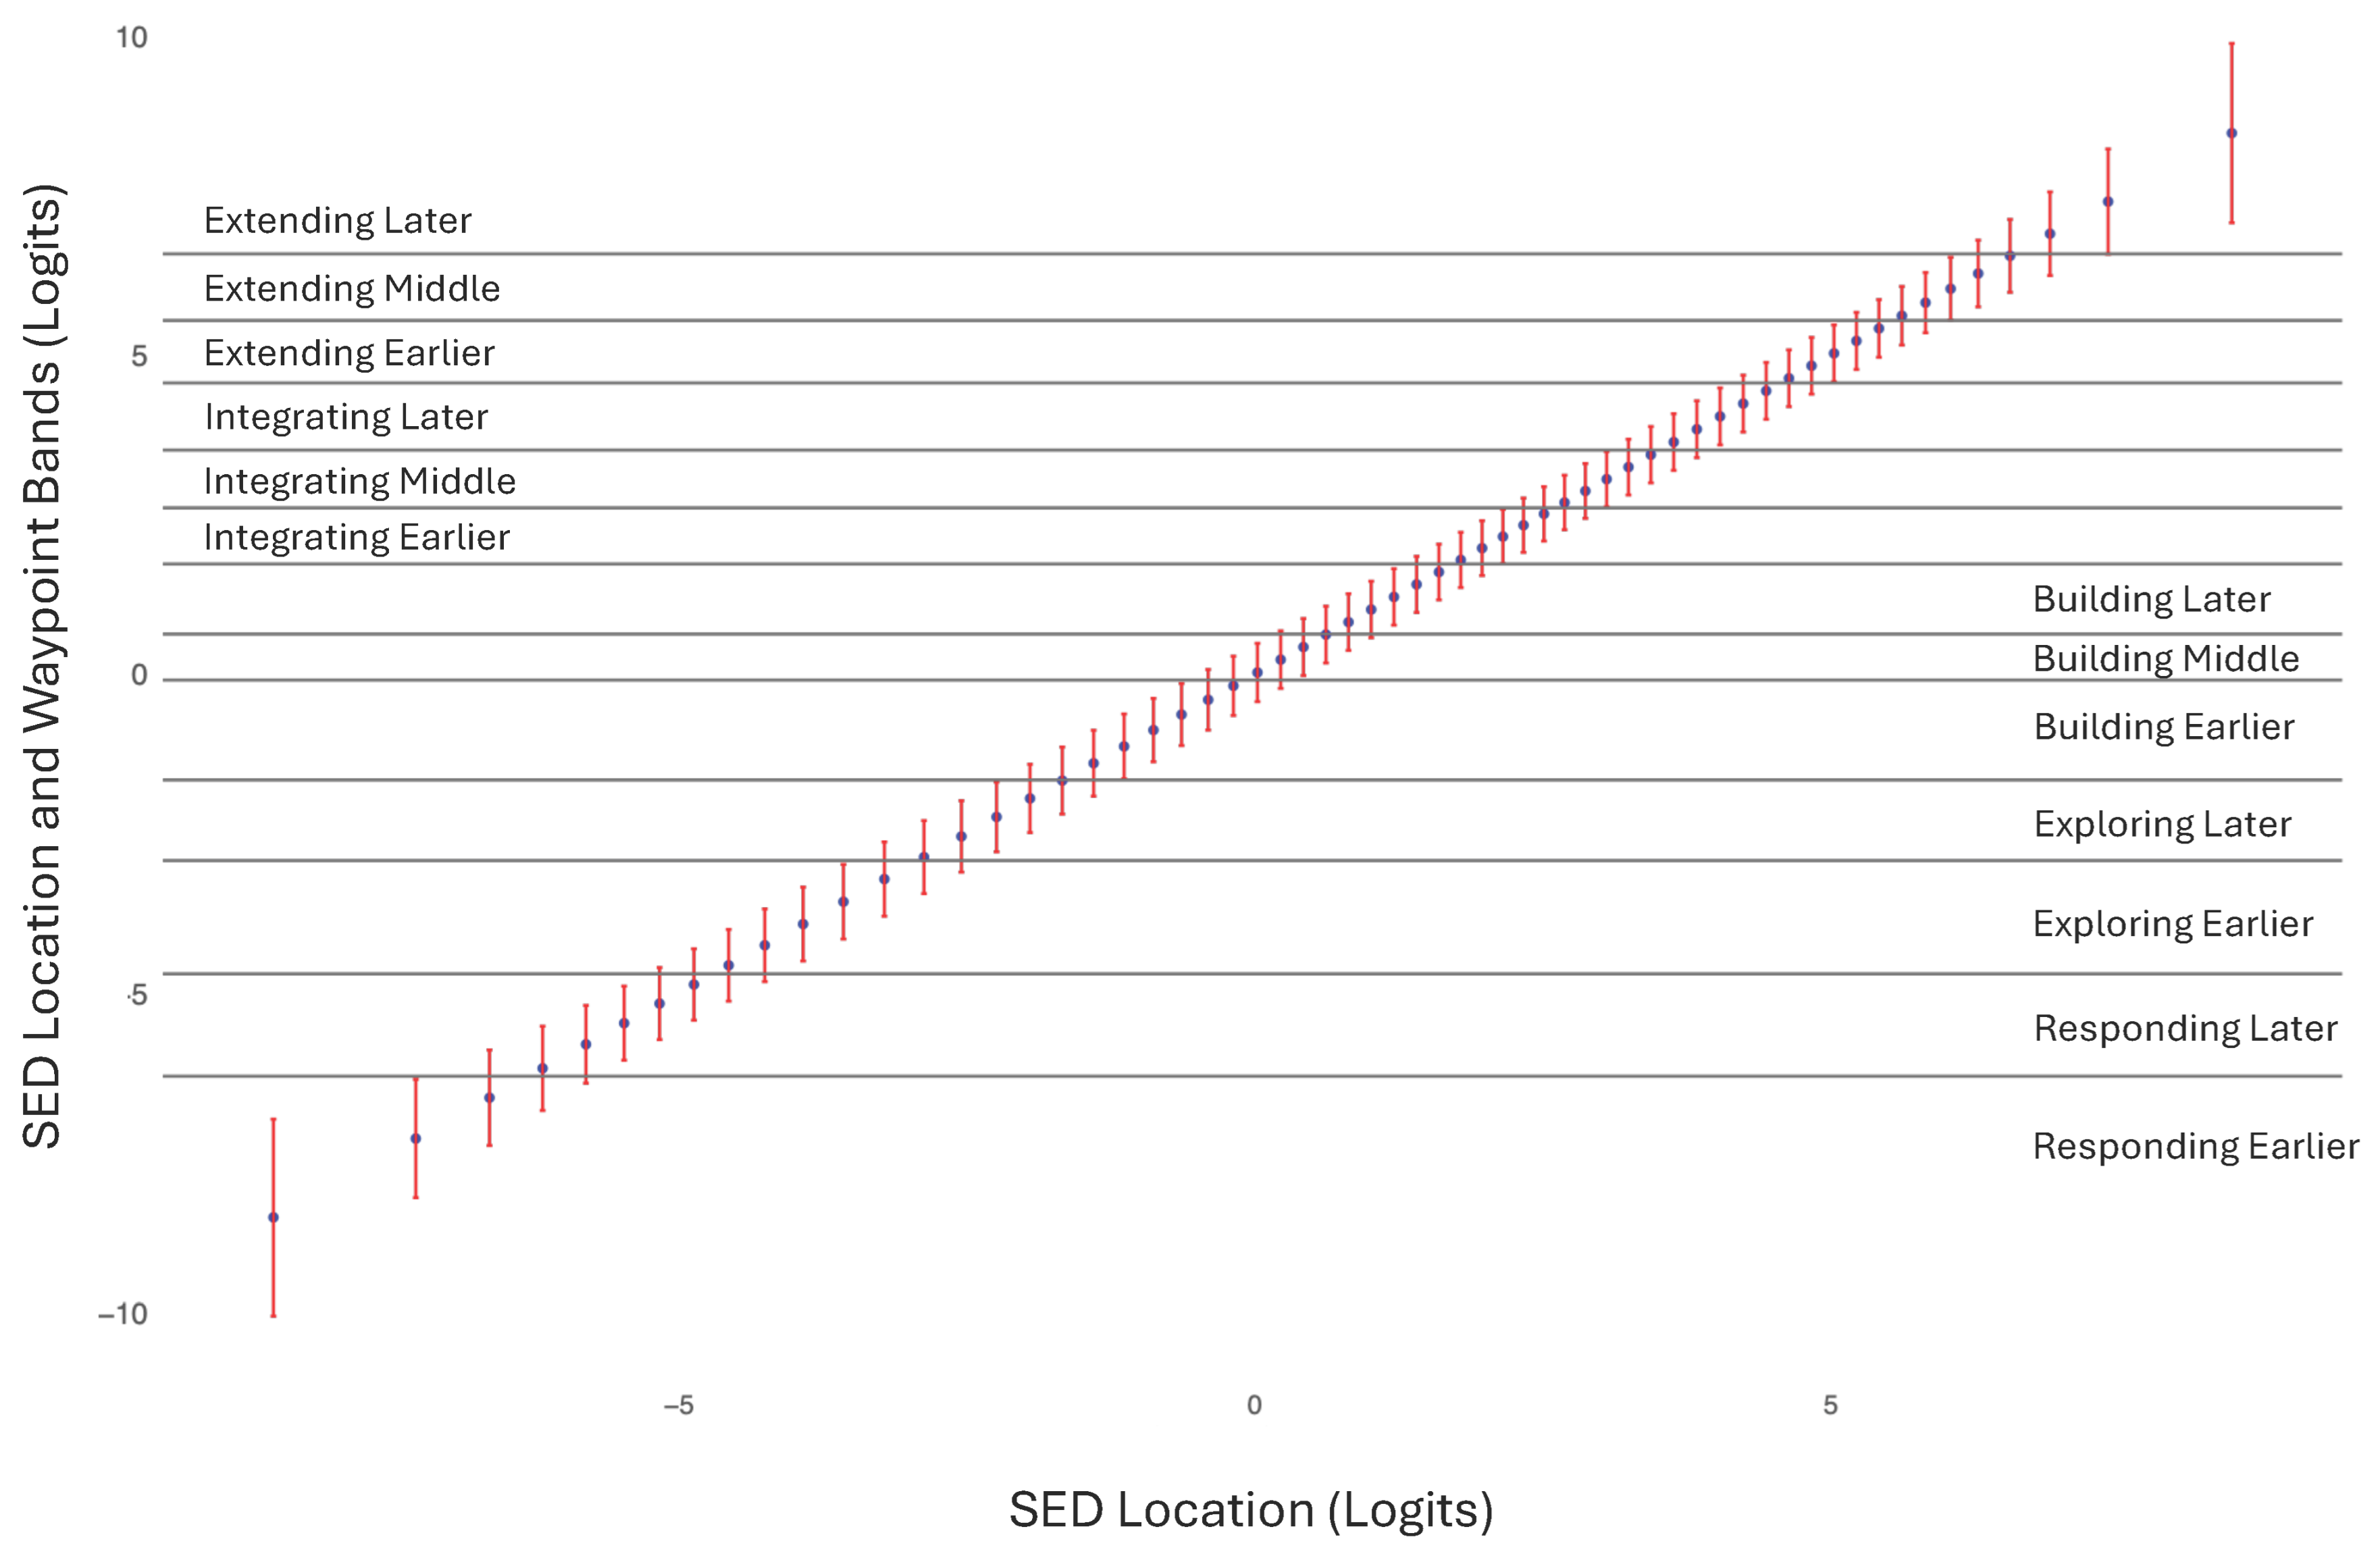
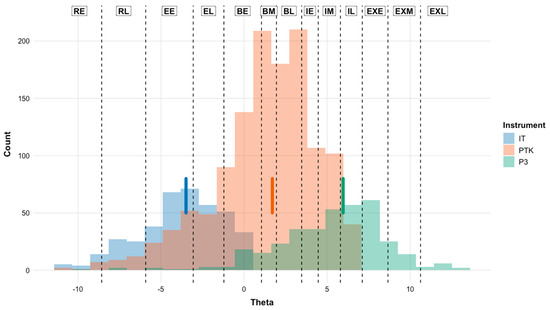
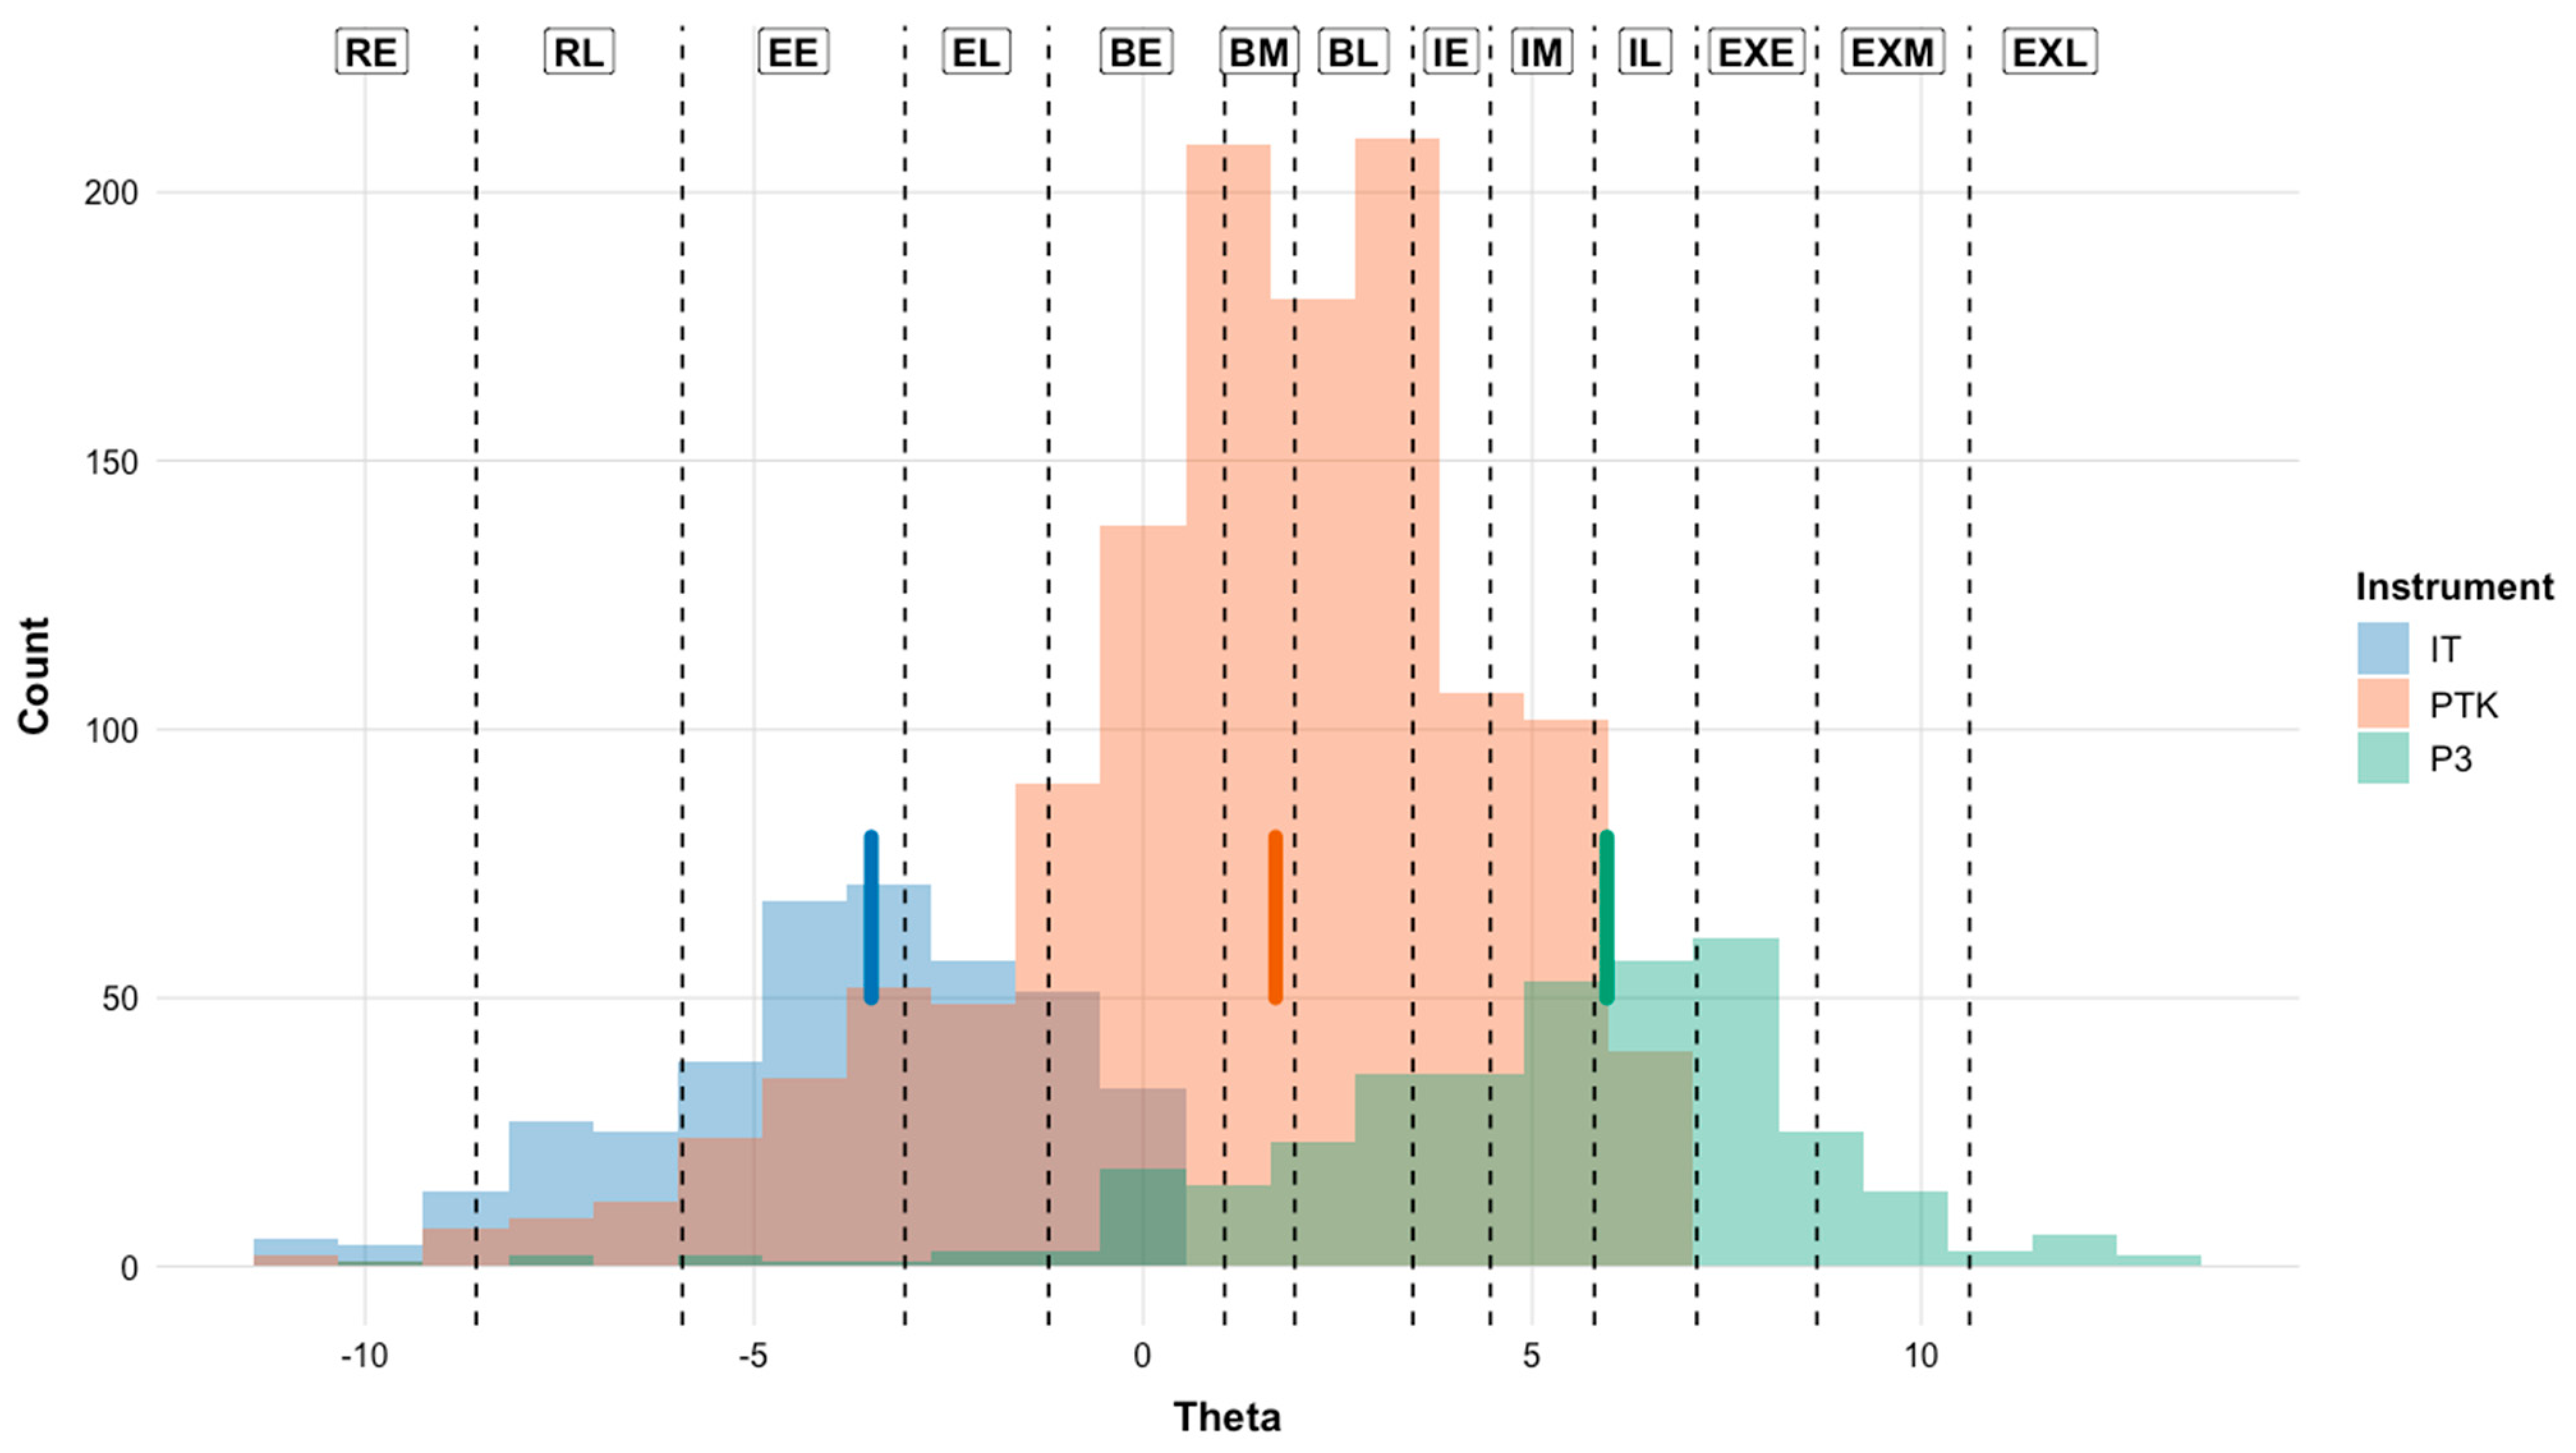

Disclaimer/Publisher’s Note: The statements, opinions and data contained in all publications are solely those of the individual author(s) and contributor(s) and not of MDPI and/or the editor(s). MDPI and/or the editor(s) disclaim responsibility for any injury to people or property resulting from any ideas, methods, instructions or products referred to in the content. |
© 2026 by the authors. Licensee MDPI, Basel, Switzerland. This article is an open access article distributed under the terms and conditions of the Creative Commons Attribution (CC BY) license.