


Abstract
Governments across Latin America and the Caribbean have invested heavily in home devices and connectivity, yet whether these resources narrow or widen socioeconomic achievement gaps remains unclear. Using Programme for International Student Assessment (PISA) 2022 microdata from 13 education systems (N = 89,339), this study examines whether home digital resources (ICTRES) moderate the socioeconomic gradient (ESCS) in mathematics and reading, using plausible values, multiple imputation, and Fay-corrected replicate weights. The results point to amplification rather than compensation: the ESCS × ICTRES interaction was positive in mathematics (β = 2.90) and reading (β = 1.83), and the mathematics gradient rose from 9.05 points at low ICTRES to 15.57 at high ICTRES. This pattern held when ESCS was residualized on ICTRES. Adding ICTRES reduced the baseline mathematics gradient (19.46 points) by 37.0%, but this attenuation largely reflects variance shared by two partially overlapping indices, so the accompanying decomposition is reported only descriptively. Country gradients ranged from 12.02 points (Dominican Republic) to 22.13 (Chile), with significant cross-national heterogeneity. These cross-sectional associations show that more home technology is not, by itself, accompanied by narrower socioeconomic gaps; read alongside prior intervention research, they suggest that access-only digital equity policies are unlikely to close them.
1. Introduction
Between 2006 and 2012, twenty countries in Latin America and the Caribbean distributed nearly ten million laptops to public-school students, placing technology at the center of regional equity policy (Arias Ortiz & Cristia, 2014). The COVID-19 pandemic renewed that policy impulse: once schooling moved into the home, connectivity and digital equipment became not only learning supports but basic conditions for participation. Yet the core policy question remains unresolved. Do home digital resources subsidized or promoted by governments narrow socioeconomic achievement gaps, or do they allow already advantaged students to pull further ahead? The distinction matters because compensatory and amplifying technologies require different policy designs, even when both expand access. This study addresses this question with Programme for International Student Assessment (PISA) 2022 microdata, treating home digital resources not as a generic correlate of achievement but as a policy-relevant resource whose distributive associations can be estimated.
This issue has become more relevant following the recent decline in learning outcomes. Compared with 2018, PISA 2022 recorded unprecedented declines of almost 15 score points in mathematics and 10 in reading on average across the Organisation for Economic Co-operation and Development (OECD) countries, with mean performance falling in most participating systems (OECD, 2023b). These declines test how well education systems protect disadvantaged students during and after disruption. In a systematic review and meta-analysis, Betthäuser et al. (2023) synthesized evidence on pandemic-era learning loss and found substantial learning deficits that were particularly large among children from lower socioeconomic backgrounds. Large-scale assessments have therefore become essential for monitoring both average performance and unequal recovery. Identifying which resources sustain, reduce, or amplify these gaps remains a central task for comparative education policy.
Socioeconomic status is one of the most consistent predictors of achievement in large-scale assessments. In PISA, this is captured through the Index of Economic, Social and Cultural Status (ESCS), which combines parental education, occupational status, and household possessions. The regression of achievement on ESCS defines the socioeconomic gradient. In PISA 2022, a one-unit increase in ESCS was associated with a 39-point difference in mathematics on average across OECD countries, with slopes ranging from less than 20 points in 17 countries and economies to 53 points in the steepest system (OECD, 2023b). Such gradients are widely used as indicators of inequality of opportunity. Willms (2006) traced this pattern in early international assessments and proposed within-school and between-school learning divides as core policy diagnostics. More recently, Maheshwari and Koria (2025), using PISA 2022 data, found that students in OECD countries generally achieved higher scores and had better access to digital devices than their peers in non-OECD countries, and that food insecurity was more strongly associated with lower performance in non-OECD countries.
Home digital resources are particularly relevant to this inequality structure. Devices and connectivity can extend learning beyond the classroom, but they are themselves unequally distributed across families. As a result, technological endowment may either buffer socioeconomic disadvantages or intensify them. The latter possibility is often described as a Matthew effect: the benefits of digital engagement accrue disproportionately to those who already have more offline resources (van Deursen & Helsper, 2015), a concern also raised for online education (Saleh & Sanders, 2014). Prior evidence also suggests that the association between school technology and achievement is partly mediated by students’ use of technology at home (Formichella & Alderete, 2018).
Evidence from device-distribution programs has been less consistent than initially expected. A large-scale randomized evaluation of One Laptop per Child in 318 rural Peruvian primary schools raised the computer-per-student ratio from 0.12 to 1.18 but produced no detectable gains in mathematics or reading after fifteen months (Cristia et al., 2017), and a companion experiment placing laptops directly in homes reached the same conclusion for achievement (Beuermann et al., 2015). Uruguay’s Plan Ceibal provides a different example: the program substantially narrowed the gap in household computer access between income groups (Pittaluga & Rivoir, 2012). A meta-analysis of one-to-one laptop programs found positive average effects on achievement, and the accompanying research synthesis linked successful implementation to teacher support and professional development (Zheng et al., 2016). Tedesco (2014) argued, for Latin America, that the democratizing potential of digital technology depends on the pedagogical and social conditions that organize its use.
This distinction between access and learning is particularly important in a region marked by long-standing structural inequality. Students in Latin America and the Caribbean remain well below the OECD mean in mathematics and reading (OECD, 2019, 2023b), and public-school students in several countries lag behind their private-school peers (Pagliarani, 2026). The magnitude of the socioeconomic gradient is also uneven across systems: in the covariate-adjusted country models estimated in this study (Section 3.5), the ESCS coefficient in mathematics ranged from roughly 12 PISA points in Guatemala and the Dominican Republic to more than 21 points in Chile, Peru, and Uruguay, a spread that motivates a comparative examination of the socioeconomic conditions under which digital resources are used. Herrera et al. (2025) identified persistent gaps in both infrastructure and pedagogical integration of digital competences across the region. Rivera-Vargas et al. (2023) argued that the expansion of digital platforms in schooling, in a context dominated by large technology corporations, raises new challenges for educational equity, data governance, student privacy, and children’s rights. Murillo and Carrillo (2020) documented high socioeconomic segregation across Peruvian secondary schools, with marked variation across regions, and Wyss et al. (2022) mapped EdTech initiatives in Latin America and the Caribbean and examined their design and implementation in relation to their potential for impact at scale. Although device distribution has expanded, young people typically first experience digital devices as platforms for communication and games and only later, and to a lesser extent, use them for formal learning; advantaged students are also more likely than disadvantaged students to use the Internet to obtain information or read news (OECD, 2015).
Material resources are not the only conditions that shape unequal achievement. School climate and socioemotional well-being influence how students respond to disadvantages and how they use available learning resources. A positive school climate, including supportive teacher–student relations and an orderly disciplinary climate, may weaken the association between socioeconomic disadvantage and achievement, although most of this evidence is correlational (Berkowitz et al., 2017). Quintero Pena et al. (2025) showed, using PISA data from Canada, the United States, Australia, New Zealand, and Europe, that the pandemic was associated with a short-term decline in students’ sense of belonging and a decline in growth mindset, with effects concentrated among girls, migrant students, and economically disadvantaged students. Mathematics anxiety is especially relevant because its negative association with mathematics achievement is consistent across studies (Barroso et al., 2021) and because it may be related to students’ access to digital learning resources at home (Yang et al., 2025).
Despite the accumulated evidence on socioeconomic, contextual, and psychosocial predictors of achievement, research that uses PISA 2022 microdata to examine digital inequality in middle-income contexts is still emerging. Enchikova et al. (2024), reviewing two decades of PISA-based research on socioeconomic equity, summarized reported trends in equality of opportunity, equality of outcome, segregation, and resilience according to method and geography. Most recently, Guerra et al. (2026) documented substantial variation in ESCS gradients in PISA 2022 mathematics within Latin America and the Caribbean and found that digital-resource indicators contribute to predicted achievement mainly within broader socioeconomic and institutional contexts; however, they did not formally test whether home digital resources moderate the gradient, and they did not examine reading. Kastorff et al. (2025) synthesized PISA 2022 evidence on how digital media availability and use relate to students’ digital competence, but a global synthesis does not resolve whether home digital resources alter the slope of the ESCS–achievement association within Latin American and Caribbean systems. Warschauer and Matuchniak (2010) organized the technology-and-equity literature around access, use, and outcomes and, for U.S. youth, concluded that gaps in home access remained substantial while inequalities in technology use and outcomes were even greater. The present study moves beyond average resource–achievement associations by combining moderation of the socioeconomic gradient in mathematics and reading, a descriptive statistical decomposition of the mathematics gradient, and country-specific estimates across 13 regional systems.
Against this background, this study examines the relationships among socioeconomic status, home digital resources, school climate, and achievement across 13 Latin American and Caribbean education systems. Using data from 89,339 students, the study has two objectives: first, to examine whether home digital resources moderate the socioeconomic gradient in mathematics and reading, and second, to quantify the component of the ESCS–mathematics association statistically linked to home digital resources measured by the OECD index of information and communication technology (ICT) resources at home (ICTRES). The cross-national variation in the socioeconomic gradient across the 13 systems is described as context that motivates these objectives rather than as a separate research aim. ICTRES is treated as a partially overlapping indicator of household material resources, not as a fully independent causal mediator. Three hypotheses guide the analysis. H1: ESCS is positively associated with achievement in mathematics and reading across the 13 systems. H2: The ESCS × ICTRES interaction is non-zero, with two competing possibilities: H2a, amplification, indicated by a positive interaction consistent with a digital Matthew effect, and H2b, compensation, indicated by a negative interaction consistent with technology as an equalizer. H3: The ICTRES-associated component represents a substantively non-trivial share of the model-implied ESCS–mathematics association, while reflecting partial measurement overlap between the two indices.
2. Materials and Methods
2.1. Study Design and Data Source
This study used secondary data from PISA 2022, the OECD-coordinated international assessment of 15-year-old students in mathematics, reading, and science. Student microdata were taken from the CY08MSP_STU_QQQ file in the PISA 2022 Public Use Files. All analyses were conducted on anonymized records under the terms of use of the PISA 2022 Database.
PISA 2022 uses a stratified two-stage cluster design. Schools are selected probabilistically within national strata, and students are then randomly sampled within schools. This design requires the use of final student weights and 80 balanced repeated replication (BRR) weights with Fay’s adjustment (ρ = 0.50) for valid variance estimation (Lumley, 2010; OECD, 2024). The pooled analyses retained the OECD final student weights; consequently, the regional coefficients estimate student-population-weighted associations across the 13 included systems rather than an equally weighted average of country-specific coefficients. Country fixed effects were included to account for mean differences between systems. Because the study relied exclusively on anonymized public-use microdata, no additional ethical approval was required.
2.2. Population and Sample
The target population comprised 15-year-old students enrolled in formal education in 13 Latin American and Caribbean education systems: Argentina, Brazil, Chile, Colombia, the Dominican Republic, El Salvador, Guatemala, Jamaica, Mexico, Panama, Paraguay, Peru, and Uruguay. National sample sizes ranged from 3873 students in Jamaica to 12,111 in Argentina, with a mean of 6872 students per system. The analytic file was restricted to these 13 national samples.
Costa Rica was excluded because ESCS and ICTRES, the two focal predictors, were not reported in the PISA 2022 public-use file for that country (100% item nonresponse for both indices among the 6113 sampled Costa Rican students); the OECD likewise excludes Costa Rica from its ESCS-based analyses (OECD, 2023b). Although school-climate and demographic variables were available with reasonable response rates, the absence of the focal predictors prevented meaningful estimation of the socioeconomic gradient or its decomposition through home digital resources. After this exclusion, the restricted analytic sample comprised 89,339 students. Raw valid-case counts are reported only descriptively; regression models were estimated on the multiply imputed restricted sample.
2.3. Variables and Indicators
Variable selection followed the PISA 2022 context questionnaire framework (OECD, 2023a), which situates student outcomes within student background, home resources, and school and classroom processes. All continuous indices were standardized to a mean of 0 and standard deviation of 1 in the OECD reference population. ESCS is an OECD-constructed composite of three sub-indices: parental education (highest of the two parents, converted into years of schooling), parental occupational status (highest International Socio-Economic Index of Occupational Status, ISEI, of the two parents), and household possessions (a scaled index of cultural, educational, and material items reported by the student). ICTRES is an OECD-constructed index derived from 11 Student Questionnaire items on the availability of information and communication technology resources at home (questions ST250, ST253, and ST254), such as a computer that can be used for schoolwork, digital devices with screens, and Internet access. The construction of ESCS is reviewed by Avvisati (2020), and both indices are documented in the PISA 2022 technical report (OECD, 2024). Table 1 summarizes the variables, their analytical role, metric, and weighted descriptive statistics.
Table 1.
Variables included in the analysis, with weighted descriptive statistics.
Two predictors require explicit measurement caution. ESCS includes a household-possessions component (HOMEPOS) that overlaps with ICTRES because, in PISA 2022, all three question blocks were used to scale ICTRES (ST250, ST253, and ST254) also feed HOMEPOS (OECD, 2024; see also Avvisati, 2020). ICTRES is the OECD-constructed index of home digital resources, focused on connectivity and digital equipment. Its association with ESCS is therefore structurally elevated by shared content: across these samples the weighted correlation between the two indices is 0.67, substantial enough to reflect shared content but not so high as to imply redundancy, as the collinearity diagnostics reported in Section 3.2 show. The statistical decomposition should consequently be read as shared variance between correlated indicators of household resources, not as a causal mediation analysis.
The ten plausible values in each domain were treated as multiple imputations of latent proficiency and used to estimate population parameters rather than individual scores (Jewsbury et al., 2024; Wu, 2005). Because ESCS and ICTRES are standardized, their regression coefficients represent the expected change in PISA points associated with a one-standard-deviation increase in the OECD reference population.
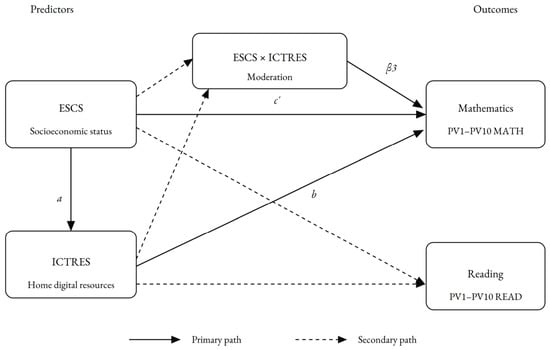
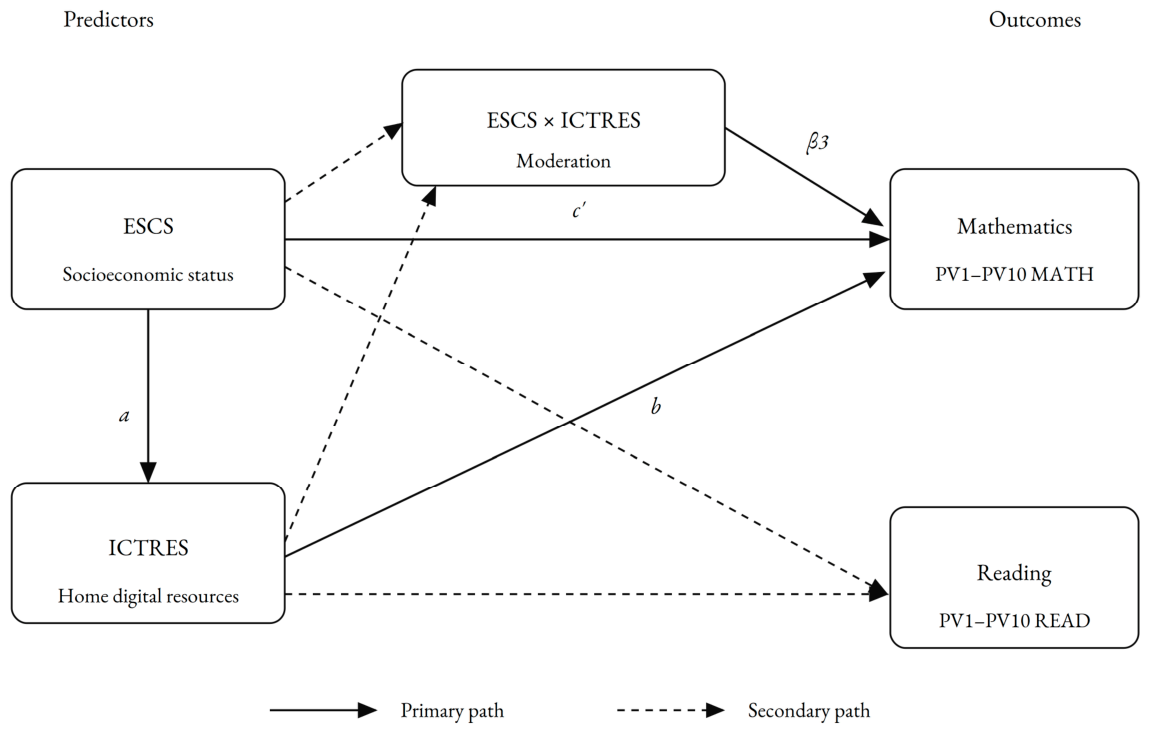
Figure 1 presents the conceptual structure of the analysis and the hypothesized relationships tested in models M1–M3 and in the interaction specification. Primary paths correspond to the core effects of interest, whereas secondary paths represent additional associations estimated in the fully adjusted model but not central to the research questions.
Figure 1.
Conceptual model of the relationships among socioeconomic status, home digital resources, and achievement outcomes. Path a represents the association between the index of economic, social, and cultural status (ESCS) and the home digital resources index (ICTRES); path b represents the association between ICTRES and mathematics controlling for ESCS; path c′ is the direct ESCS–mathematics association; and β3 the ESCS × ICTRES interaction. The same structure applies to reading, with analogous ICTRES–reading and direct ESCS–reading paths; the statistical decomposition is reported for mathematics only, whereas the moderation analysis (β3) is estimated for both outcomes. Secondary paths indicate additional modeled associations.
2.4. Data Quality Audit and Multiple Imputation
Item nonresponse was estimated by variable and country. Missingness was below 5% for ESCS (2.94%) and ICTRES (3.13%), moderate for most school-climate indices (9–21%), and highest for mathematics anxiety (30.37%).
Multiple imputation was applied under a missing at random (MAR) assumption using the mice package in R (van Buuren, 2018; van Buuren & Groothuis-Oudshoorn, 2011). Predictive mean matching was used for continuous variables, ordinal logistic regression was used for grade, binary logistic regression for gender, home language, and grade repetition, and polytomous regression for migration status, with m = 10 datasets and seeds = 123. The imputation model included ESCS, ICTRES, school-climate and well-being indices, demographic controls, and country identifiers used in the analytical models. The ten plausible values were not entered into the chained equations because they were treated as multiple draws of latent proficiency and incorporated during the subsequent large-scale-assessment estimation stage rather than as observed student scores. This separation means that imputations of missing covariates were not conditioned directly on achievement and is therefore acknowledged as a limitation. Within each imputed dataset, coefficients for mathematics and reading models were combined across the ten plausible values and their Fay-corrected BRR variances. Pooled estimates were then combined across the ten imputed datasets using Rubin’s rules (Rubin, 1987).
2.5. Analytical Strategy
The analysis proceeded in five stages, following the conceptual structure summarized in Figure 1 (Section 2.3), and was complemented by a set of sensitivity analyses (residualized ESCS, complete-case, equal-country weights, and a specification excluding mathematics anxiety) reported in Section 3.6. First, weighted descriptive statistics were computed from the restricted raw file using the final student weight; post-imputation descriptives were used only as internal consistency checks. Second, scaled generalized variance inflation factors, GVIF^(1/(2·df)), were assessed for the fully specified mathematics model within each imputed dataset and summarized across imputations; all values remained below 1.50 and are reported in Supplementary Table S1. Third, three hierarchical models were estimated for each domain. M1 included ESCS, controls, and country fixed effects to capture the baseline socioeconomic gradient. M2 added ICTRES to estimate its adjusted association and the attenuation of the ESCS coefficient. M3 added school-climate and well-being indices to obtain fully adjusted associations. School-climate and well-being indices were treated as contextual correlates of achievement rather than as confounders of the ESCS–ICTRES relationship, because several of them may themselves be shaped by socioeconomic circumstances; the comparison between M2 and M3 therefore describes how these correlates modify the estimated ESCS and ICTRES coefficients within the adjusted specification rather than serving as a formal control for confounding. Fourth, moderation and statistical decomposition analyses examined how digital resources relate to the socioeconomic gradient, following the ESCS × ICTRES specification represented by path β3 in Figure 1. Fifth, country-specific baseline mathematics models with student-level controls were estimated to describe cross-national variation in the ESCS coefficient. A country-level omnibus Cochran Q test was then computed on these coefficients to assess whether the cross-national spread exceeded sampling variability.
Moderation was assessed by adding the ESCS × ICTRES term to the fully adjusted model. Simple slopes of ESCS were derived by recentering ICTRES at the pooled weighted regional mean and at one pooled weighted standard deviation below and above that mean. For mathematics, a descriptive statistical decomposition partitioned the model-implied ESCS–mathematics association into a direct component (path c′ in Figure 1) and an ICTRES-associated component using the product-of-coefficients approach (Hayes, 2018; MacKinnon, 2008). The ICTRES-associated component was computed within each imputed dataset as the product of the ESCS-to-ICTRES path (a) and the ICTRES-to-mathematics path (b). Because ESCS and ICTRES partially overlap in measurement and the ESCS × ICTRES interaction was significant, this quantity is interpreted as a descriptive summary of shared model variance rather than an unconditional mediated or causal effect. Full estimates are reported in Supplementary Table S2.
2.6. Software
Analyses were conducted in R version 4.6.1 (R Core Team, 2026). Data management used the tidyverse packages, including haven (Wickham et al., 2019); visualizations used ggplot2 (Wickham, 2016); imputation used mice (van Buuren, 2018); and collinearity diagnostics used car (Fox & Weisberg, 2019). BRR–Fay variance estimation, plausible-value combination, and multiple-imputation pooling followed the standard formulas for weighted linear models with plausible values and replicate weights described in the PISA 2022 technical report (OECD, 2024) and the combining rules of Rubin (1987). The overall analytical workflow is summarized in Supplementary Figure S1, and a fixed seed was used for the stochastic imputation step.
3. Results
3.1. Sample Composition and Descriptive Statistics
The analytic sample included 89,339 students from 13 Latin American and Caribbean education systems. Item missingness was low for the focal predictors and highest for mathematics anxiety, as shown in Table 1. On average, the regional sample was approximately one standard deviation below the OECD reference in both socioeconomic status (weighted M = −0.98) and home digital resources (weighted M = −1.21), reflecting the lower average socioeconomic and digital endowment of these systems relative to the OECD reference population. Mathematics anxiety was above the OECD reference (M = 0.54), teacher support was also above the reference (M = 0.40), and sense of school belonging was below it (M = −0.20).
3.2. Collinearity and Hierarchical Models
Collinearity was assessed with generalized variance inflation factors scaled as GVIF^(1/(2·df)) (Fox & Weisberg, 2019), which for single-coefficient terms equal the square root of the conventional variance inflation factor (VIF). All values were below 1.50; the highest were observed for grade repetition (1.47) and ICTRES (1.40), corresponding to conventional VIFs of about 2.2 and 2.0, well below commonly used cutoffs of 5 or 10, indicating no serious collinearity concerns across the ten imputed datasets (Supplementary Table S1). Table 2 reports coefficients with significance levels, and the corresponding 95% confidence intervals appear in Supplementary Table S3; Table 3 and Section 3.4, Section 3.5 and Section 3.6 report point estimates with 95% confidence intervals; a coefficient is statistically distinguishable from zero when its interval does not contain zero, and the width of the interval reflects the precision of the estimate.
Table 2.
Associations of ESCS, home digital resources, and school-climate indicators with mathematics and reading across hierarchical models M1–M3.
Table 3.
Interaction between socioeconomic status and home digital resources, and simple slopes of the socioeconomic gradient in mathematics and reading.
Adding ICTRES to the baseline model attenuated the ESCS coefficient in mathematics by 37.0% and produced an independent ICTRES association of 11.59 points; the fully adjusted M3 estimates were stable, and the reading models followed a comparable pattern, with a 35.6% reduction in the ESCS coefficient from M1 to M2 (Table 2).
School-climate and well-being indicators also showed domain-specific associations with achievement (Table 2). Mathematics anxiety carried the largest negative coefficient (particularly in mathematics), followed by bullying exposure, which was negative in both domains. Belonging, teacher–student relations, and disciplinary climate were consistently positive in both subjects. Teacher support had a small negative association with mathematics (β = −0.92, p < 0.05) and no statistically significant association with reading; this unexpected pattern is considered in the Discussion.
3.3. Moderation by Home Digital Resources
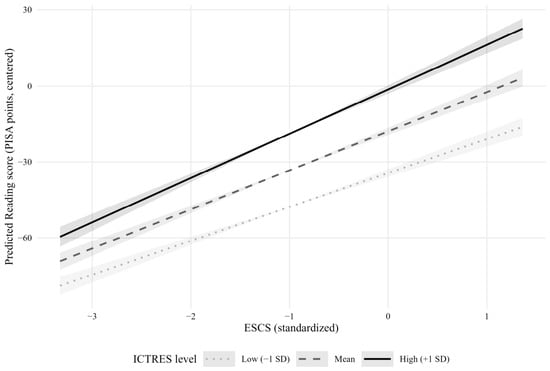
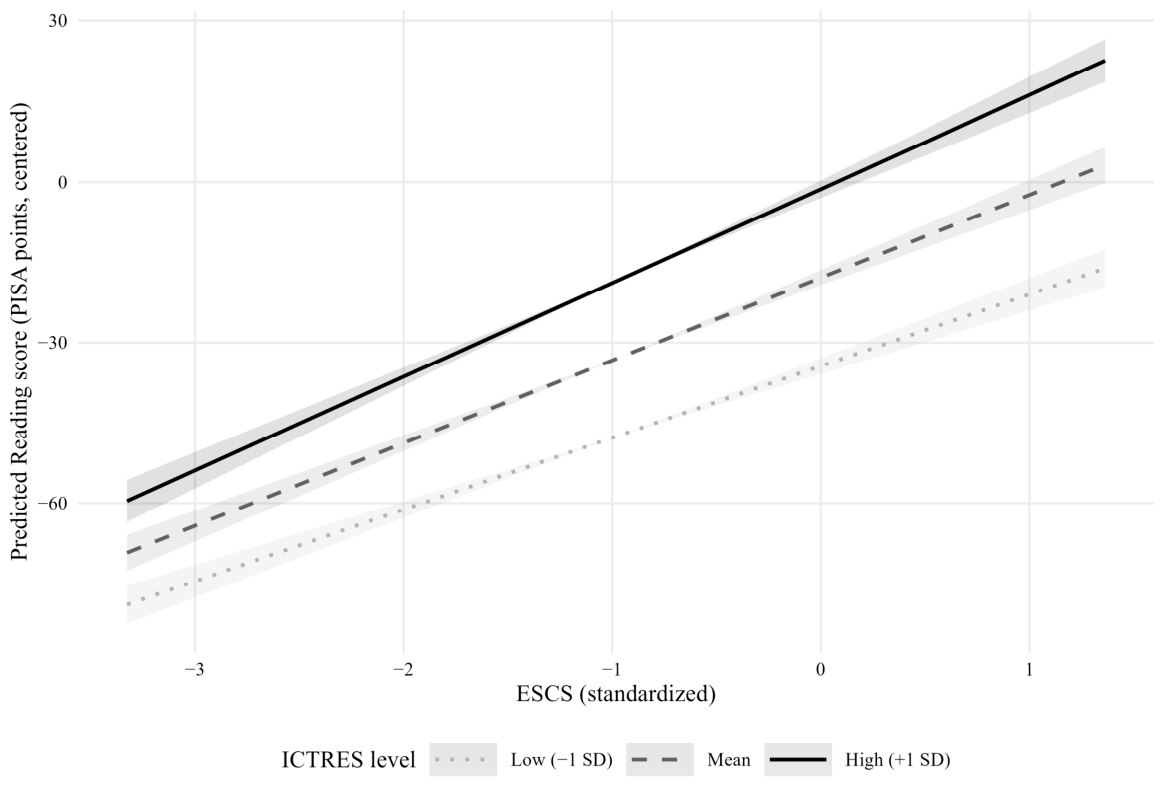
The ESCS × ICTRES interaction was positive and statistically significant for mathematics (β = 2.90, 95% CI [2.36, 3.43]) and reading (β = 1.83, 95% CI [1.19, 2.46]). This positive interaction indicates that the ESCS–achievement association becomes steeper at higher levels of home digital resources, a pattern more consistent with amplification than with compensation of socioeconomic advantage.
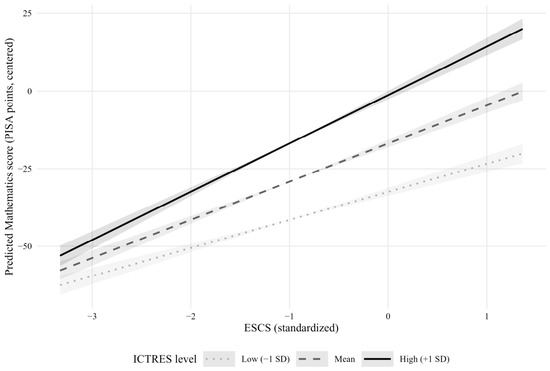
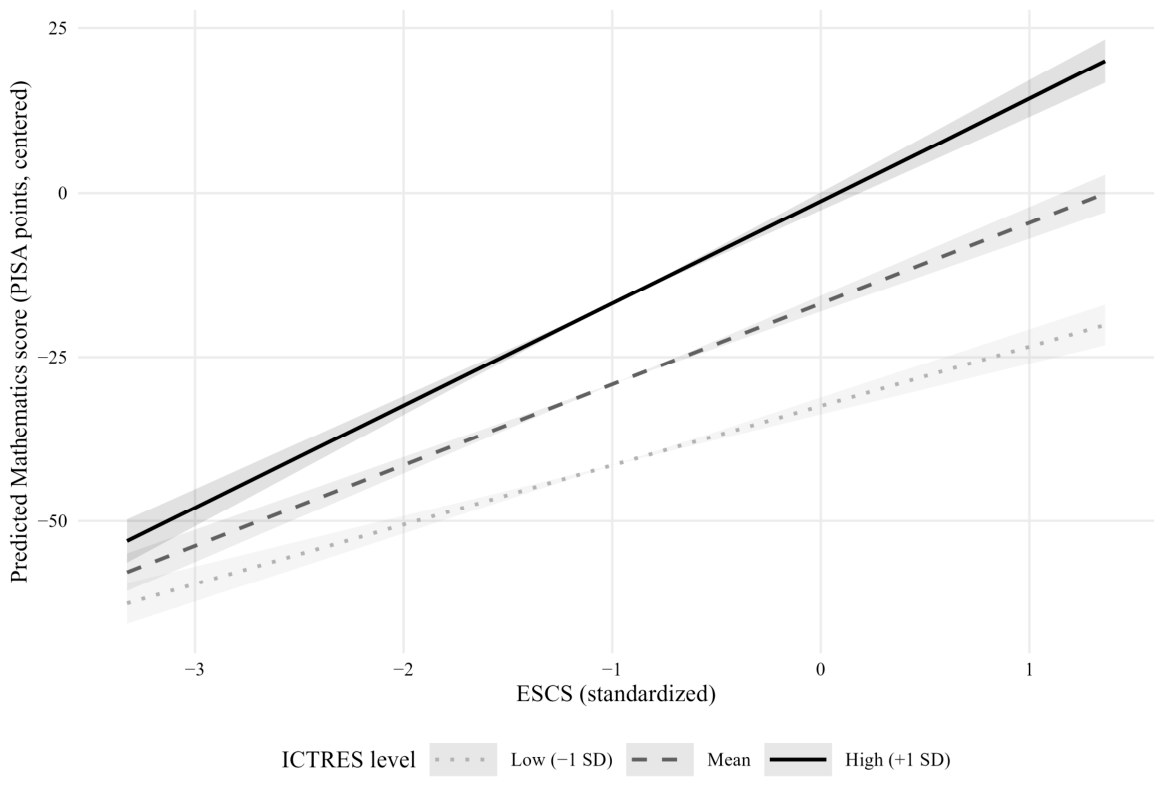
Simple slopes illustrated this amplification pattern. At low ICTRES (−1 SD), the socioeconomic gradient in mathematics was 9.05 points (95% CI [7.73, 10.36]). At the weighted regional mean, it was 12.31 points (95% CI [11.09, 13.53]); at high ICTRES (+1 SD), it reached 15.57 points (95% CI [14.17, 16.97]). In reading, the corresponding slopes were 13.41 points (95% CI [11.89, 14.93]) at low ICTRES, 15.46 points (95% CI [14.03, 16.90]) at the regional mean, and 17.52 points (95% CI [15.84, 19.20]) at high ICTRES. A one-standard-deviation increase in ICTRES (regional SD in the imputed data ≈ 1.13) was associated with an approximately 3.26-point increase in the mathematics gradient and a 2.06-point increase in the reading gradient; this increase is constant across the ICTRES distribution by construction of the linear interaction term, and nonlinear or threshold patterns were not tested. Table 3 reports the interaction coefficients and simple slopes; Figure 2 and Figure 3 display the interaction visually for mathematics and reading, respectively.
Figure 2.
Interaction between socioeconomic status and home digital resources in mathematics. Lines represent the estimated ESCS gradient in PISA mathematics points at three levels of ICTRES (regional mean and ± 1 SD). Shaded bands show the 95% confidence interval of each simple slope, anchored at the regional mean of ESCS. Estimates use the fully adjusted M3 specification with the ESCS × ICTRES product term, country fixed effects, and student-level controls.
Figure 3.
Interaction between socioeconomic status and home digital resources in reading. Lines represent the estimated ESCS gradient in PISA reading points at three levels of ICTRES (regional mean and ± 1 SD). Shaded bands show the 95% confidence interval of each simple slope, anchored at the regional mean of ESCS. Estimates use the fully adjusted M3 specification with the ESCS × ICTRES product term, country fixed effects, and student-level controls.
3.4. Statistical Decomposition Through Home Digital Resources
Because ESCS and ICTRES share items and the ESCS × ICTRES interaction was statistically significant, the ICTRES-associated component of the ESCS–mathematics association is not a single, unconditional value. Two complementary summaries are therefore reported. First, an average descriptive decomposition partitioned the model-implied ESCS–mathematics association (18.95 points, 95% CI [17.91, 19.98]) into a direct component of 12.17 points (95% CI [10.94, 13.40]) and an ICTRES-associated component of 6.77 points (95% CI [6.07, 7.48]), equal to 35.7% of the total; the a-path (the covariate-adjusted ESCS-to-ICTRES slope) was 0.62 and the b-path (ICTRES-to-mathematics net of ESCS) was 10.96 (the ICTRES-associated component was computed within each imputed dataset as the product of the two paths and then pooled; the direct and ICTRES-associated components sum to the pooled total of 18.95, which is estimated with the full M3 covariate set and therefore differs from the M1 coefficient of 19.46). Second, because the significant interaction implies that the direct ESCS component varies with ICTRES, the conditional share was recomputed at three ICTRES levels: 48.6% at −1 SD (indirect 8.56 of total 17.61), 41.0% at the regional mean of ICTRES (indirect 8.56 of total 20.87), and 35.5% at +1 SD (indirect 8.56 of total 24.13). In this conditional summary, the ICTRES-associated component (8.56) was obtained by multiplying the same a-path as in the average decomposition (0.62) by the ICTRES coefficient of the interaction model (13.85), which refers to students at the OECD mean of ESCS, and it was held constant across ICTRES levels; the conditional totals are therefore not directly comparable with the average decomposition and illustrate how the relative share changes with the conditional direct component. The higher percentages at lower ICTRES therefore reflect a smaller conditional direct ESCS component (the denominator), not a larger indirect path. Neither summary should be interpreted as a causal mediated effect. Full estimates appear in Supplementary Tables S2 and S6. Both summaries should also be read together with the residualization analysis reported in Section 3.6.
3.5. Cross-National Variation
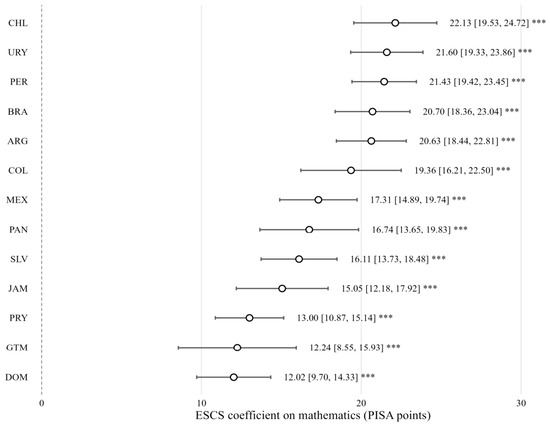
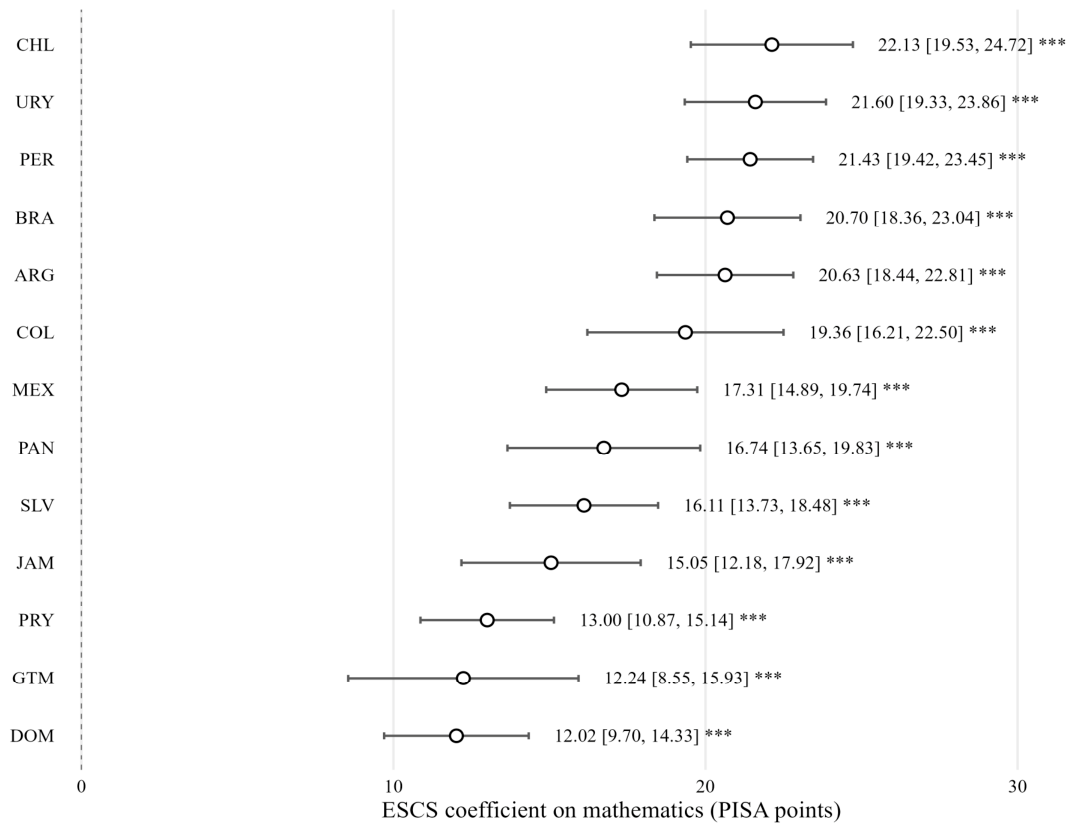
The estimated socioeconomic gradient varied across the 13 national samples, ranging from 12.02 points in the Dominican Republic to 22.13 in Chile. Chile (22.13), Uruguay (21.60), Peru (21.43), Brazil (20.70), and Argentina (20.63) were located at the high end, whereas Paraguay (13.00), Guatemala (12.24), and the Dominican Republic (12.02) had estimates close to 12–13 points. Figure 4 displays the country-specific ESCS coefficients and 95% confidence intervals, ordered from highest to lowest; numeric estimates and a specification additionally adjusted for ICTRES appear in Supplementary Table S7. A Cochran Q test (Cochran, 1954) of slope heterogeneity across the 13 country-specific ESCS coefficients was statistically significant (Q = 105.20; df = 12; p < 0.001; I2 = 88.6%; fixed-effect pooled estimate = 17.89 PISA points), indicating that the country-specific gradients differ by more than would be expected from sampling variability alone (Supplementary Table S8). I2 expresses the percentage of variation across country estimates that is attributable to heterogeneity rather than sampling error (Higgins & Thompson, 2002).
Figure 4.
Forest plot of ESCS coefficients on mathematics by country. Points represent the estimated ESCS slope for each national sample with 95% confidence intervals, ordered from highest to lowest gradient. Models controlled for age, grade, gender, migration status, home–test language concordance, and grade repetition. *** p < 0.001.
3.6. Sensitivity Analyses
Four sensitivity analyses examined whether the main findings held under alternative modeling choices; full results appear in Supplementary Tables S9–S12. First, ESCS was residualized on ICTRES within each imputed dataset to reduce the measurement overlap between the two indices. In this residualized specification, the baseline ESCS gradient in mathematics was 12.20 points, close to the 12.25 estimated in M2 with ICTRES included as a covariate. This near-equality is expected, because removing the variance that ESCS shares with ICTRES is algebraically close to adjusting for ICTRES as a covariate; the residualized specification therefore restates, rather than independently tests, that the 37.0% attenuation from M1 to M2 corresponds to the portion of ESCS that overlaps with ICTRES. Given the partial item overlap between the two indices, this portion cannot be attributed solely to an independent contribution of digital resources to the socioeconomic gradient. The ESCS × ICTRES interaction remained positive and statistically significant in the residualized specification (β = 6.09, 95% CI [5.36, 6.83] for mathematics; β = 7.43, 95% CI [6.49, 8.38] for reading), supporting the robustness of the moderation finding to the measurement overlap concern; these coefficients are not directly comparable in magnitude with those of the main specification because the product term is defined on the residualized ESCS (Supplementary Table S9).
Second, complete-case analysis restricted to students with no missing values on any focal or covariate variable (N = 53,803) reproduced the direction and approximate magnitude of the main coefficients (M1 ESCS = 20.85; M2 ESCS = 13.66; M3 ESCS = 13.43; M3 ICTRES = 11.04 for mathematics; Supplementary Table S10). Third, equal-country weighting—in which each of the 13 national samples contributed equally rather than being weighted by student population—produced M3 ESCS = 10.99, M3 ICTRES = 9.51, and ESCS × ICTRES = 2.55 in mathematics and ESCS × ICTRES = 1.62 in reading, indicating that the amplification pattern is not driven by the largest education systems (Supplementary Table S11). Fourth, a specification that excluded mathematics anxiety (ANXMAT) from the M3 covariate set, addressing the sensitivity of the results to the high country-level missingness on that variable, produced M3 ESCS = 12.30, M3 ICTRES = 11.17, and ESCS × ICTRES = 3.00 in mathematics and 1.88 in reading, all close to the reported estimates (Supplementary Table S12). Taken together, these analyses indicate that the main coefficients and the moderation finding are stable across the alternative specifications examined. The average decomposition attributed to ICTRES should, however, be interpreted in light of the residualization result and the partial measurement overlap between ESCS and ICTRES.
4. Discussion
The results can be summarized against the three hypotheses. H1 was supported: ESCS was positively associated with achievement in both domains in the pooled models (19.46 points in mathematics and 23.65 in reading in M1), and the country-specific mathematics gradients were positive and statistically significant in all 13 systems (12.02 to 22.13 points); for reading, H1 was examined in the pooled models only. For H2, the positive ESCS × ICTRES interaction in mathematics (2.90) and reading (1.83) supports the amplification alternative (H2a) rather than compensation (H2b), and the interaction remained positive in both domains in the residualized, equal-country-weighting, and mathematics-anxiety-excluded specifications. H3 was supported only in a descriptive sense: the ICTRES-associated component represented 35.7% of the model-implied ESCS–mathematics association, but, given the partial item overlap between ESCS and ICTRES, this share reflects variance shared by the two indices rather than an independent digital contribution, as anticipated in the formulation of H3. The following paragraphs discuss each result in turn.
Across Latin America and the Caribbean, mathematics scores were 19.46 PISA points higher for each one-unit increase in ESCS, and the baseline gradient in reading was even steeper (23.65 points). These estimates are about half the unadjusted OECD-average gradient of 39 points in mathematics, which is expected given that the models include demographic controls and country fixed effects, but the mathematics gradient approaches, and the reading gradient exceeds the 20-point benchmark that the OECD uses to describe a large score difference (OECD, 2023b). Persistent socioeconomic achievement gaps have also been documented elsewhere; in the United States, for example, gaps between the top and bottom quartiles of the socioeconomic distribution have narrowed by only about 0.05 standard deviations per decade (Hanushek et al., 2022). Fernández et al. (2025) similarly characterized educational inequality in the region as persistent in international comparisons. The present results therefore reaffirm a central fact of regional education systems: family background remains strongly associated with academic performance.
The role of digital resources becomes visible when ICTRES enters the model. In mathematics, the ESCS coefficient fell from 19.46 points in M1 to 12.25 in M2, a 37.0% reduction; the average statistical decomposition assigned 35.7% of the model-implied ESCS–mathematics association to the ICTRES-associated component. A sensitivity analysis in which ESCS was residualized on ICTRES within each imputed dataset yielded a baseline ESCS gradient in mathematics of 12.20 points, very close to the 12.25 estimated in M2 when ICTRES enters as a covariate. This near-equality is expected algebraically, because residualizing ESCS on ICTRES removes the same shared variance that ICTRES absorbs as a covariate in M2; the attenuation from M1 to M2 therefore identifies the portion of the socioeconomic gradient that ESCS shares with ICTRES, which, given the partial item overlap between the indices, cannot be attributed solely to an independent digital contribution. The moderation finding, in contrast, remained positive and statistically significant in the residualized specification, so it is robust to this measurement concern (Supplementary Table S9). Together, these results indicate that technological endowment is embedded within the broader inequality structure captured by PISA, but that the size of its independent contribution to the ESCS coefficient should not be inferred from the M1-to-M2 reduction alone. These findings are consistent with earlier PISA-based evidence that the relationship between students’ ICT use and achievement is not uniformly positive (Zhang & Liu, 2016) and contrast with Kastorff et al. (2025), whose meta-analysis of PISA 2022 data found that adequate availability and high-quality use of digital media can weaken the association between socioeconomic status and digital competence, an outcome different from the achievement measures examined here.
The moderation results provide further evidence for this interpretation. The ESCS × ICTRES interaction was positive, at +2.90 points in mathematics and +1.83 in reading. Rather than serving as a universal equalizer, home digital resources were associated with a steeper socioeconomic gradient. This observational interaction does not establish that digital resources cause achievement gaps to widen; it shows that the association between socioeconomic status and achievement was stronger at higher ICTRES levels. The pattern echoes the warning in Students, Computers and Learning that device provision does not automatically translate into achievement gains (OECD, 2015) and is consistent with a digital Matthew effect, in which the benefits of digital resources accrue disproportionately to those who already hold more offline resources (van Deursen & Helsper, 2015). A study from North Carolina reached a similarly cautious conclusion: the introduction of home computers and broadband was associated with modest but persistent negative effects on students’ mathematics and reading scores, and the authors concluded that universal home access would widen rather than narrow achievement gaps (Vigdor et al., 2014).
The simple-slope results illustrate this amplification pattern. Among students with low levels of home technology, the socioeconomic difference in mathematics was 9.05 points. At the regional average, it was 12.31 points; at high levels of access, it reached 15.57 points. A one-standard-deviation increase in ICTRES was associated with an approximately 3.26-point increase in the socioeconomic gradient. By construction of the linear interaction term, the gradient increases linearly with ICTRES; nonlinear or threshold patterns were not tested. To give a sense of scale, the OECD treats 20 score points, roughly the average annual learning gain of 15-year-olds across PISA systems, as the benchmark for a large difference, while advising against converting score differences into years of schooling because learning gains vary across countries; in mathematics, for example, annual gains are about 12 points in Brazil (OECD, 2023b). The 6.52-point steepening of the socioeconomic gradient between low and high ICTRES is about one-third of that benchmark. The difference is modest at the level of an individual comparison but becomes educationally meaningful when it applies systematically across the socioeconomic distribution.
Research on the second- and third-level digital divide offers a plausible explanation for these results (van Deursen & Helsper, 2015). Physical access does not capture how technology is used, for what purposes, or under what forms of guidance. What students do with available devices matters more than availability alone, and those uses are partly shaped by cultural and educational resources within the household (Warschauer & Matuchniak, 2010). Reich (2019) described this as the usage divide: closing the access gap leaves unresolved the question of whether technology supports higher-order learning or routine, low-rigor tasks. Perrotta and Pangrazio (2023) extended this concern to the platform infrastructures that increasingly mediate schooling, calling for closer scrutiny of how their governance and design shape educational practice and equity. Yang et al. (2025), using PISA 2022, also found that the link between digital learning resource accessibility and mathematics anxiety depends on contextual factors such as teacher support and students’ sense of belonging. This body of work is consistent with the view that hardware access alone is insufficient to close achievement gaps.
The country-level estimates also indicate that digital and socioeconomic stratification should not be treated as a uniform regional experience. Chile, Peru, and Uruguay had mathematics gradients above 21 points per ESCS standard deviation, whereas Guatemala and the Dominican Republic had estimates between 12.02 and 12.24 points. The Cochran Q test reported in Section 3.5 confirms that these differences exceed what would be expected from sampling variability alone (Q = 105.20, p < 0.001; I2 = 88.6%), and the pattern is consistent with prior evidence on high levels of socioeconomic school segregation within Latin American and Caribbean systems (Krüger, 2019), uneven effects of pandemic-era education policies (Delprato, 2026), and marked variation in PISA 2022 outcomes across the region (Arias Ortiz et al., 2024). The ranking of individual countries, however, still involves multiple pairwise contrasts and should be interpreted with appropriate caution.
The findings also show that material and digital resources are only part of the equity problem. School psychosocial conditions were consistently associated with achievement. Sense of belonging, teacher–student relations, and disciplinary climate had positive coefficients of 2.37, 2.56, and 2.60 points in mathematics, respectively. Bullying and mathematics anxiety were associated with lower performance, with mathematics anxiety showing the largest negative coefficient (−7.55 points). Li et al. (2025), comparing PISA 2018 and PISA 2022 in six education systems that included Mexico and Panama, reported significantly lower subjective well-being in 2022 than in 2018, a negative association between bullying and well-being, and a mediating role of school belonging, suggesting that these dimensions remain policy-relevant after the pandemic. The small negative coefficient for teacher support (−0.92) should be interpreted cautiously; it may reflect compensatory support directed toward students already struggling rather than a negative pedagogical effect of support itself.
4.1. Policy Implications
The findings have implications for digital equity policy in Latin America and the Caribbean, although these implications are informed by the wider literature rather than established by the present analysis. The central result is not simply that home digital resources were associated with higher achievement, but that they were also associated with a steeper socioeconomic gradient. This observational pattern does not demonstrate that device provision causes wider achievement gaps; it is consistent with the view that access alone is unlikely to guarantee equal learning returns. This interpretation aligns with the experimental record: One Laptop per Child in Peru expanded access without improving mathematics or reading outcomes (Beuermann et al., 2015; Cristia et al., 2017). The present results offer a plausible observational account of how access gains can coexist with unequal learning returns: students whose achievement is most strongly associated with access to devices are often those who already have material, cultural, and instructional support at home. Drawing on this prior implementation evidence rather than on the present analysis alone, ministries considering large-scale hardware procurement should pair distribution with pedagogical integration, teacher professional development, structured guidance for academic use at home, and evaluation metrics that move beyond units delivered (Gottschalk & Weise, 2023).
The statistical decomposition assigned 35.7% of the model-implied mathematics gradient to the ICTRES-associated component. This percentage largely reflects variance shared by two overlapping indices and should not be read as the proportion causally mediated by technology; it is the positive interaction, rather than the decomposition, that makes digital equity a substantive dimension of the broader opportunity gap. Connectivity, equipment, and learning-equity policies may therefore benefit from being planned jointly rather than as parallel initiatives. Evidence from Peru and Uruguay is instructive, although it concerns different outcomes: in Peru, One Laptop per Child expanded access without detectable gains in mathematics or reading (Cristia et al., 2017), whereas Uruguay’s Plan Ceibal narrowed income-related gaps in household computer access (Pittaluga & Rivoir, 2012). Neither result shows that access alone improves learning. Programs that subsidize connectivity for low-income households may be more defensible when they also include curriculum-aligned content, teacher guidance, and support for academic use.
The descriptive cross-national variation also cautions against uniform regional prescriptions. Gradients ranged from roughly 12 points in Guatemala and the Dominican Republic to more than 21 in Chile, Peru, and Uruguay. Although these estimates do not establish country-specific intervention effects, they suggest that policy responses should be calibrated to segregation levels, infrastructure baselines, and post-pandemic recovery trajectories in each system. Finally, the consistent associations between school climate and achievement indicate that belonging, teacher–student relations, disciplinary climate, bullying, and mathematics anxiety belong within the same equity agenda as material and digital resources rather than being treated as a separate well-being portfolio.
4.2. Limitations
The use of plausible values and Fay-corrected replicate weights addresses key features of the complex PISA design, but several limitations remain. First, the cross-sectional design prevents causal interpretation. The observed relationships may be bidirectional: higher-achieving students may come from families more likely to invest in educational technology, while students with more home technology may also have more opportunities to learn. Self-reported context questionnaires may introduce social-desirability or recall bias. In addition, ESCS and ICTRES share household-resource content. The statistical decomposition therefore summarizes shared model variance and should not be interpreted as identifying a causal mediating mechanism, particularly because the ESCS × ICTRES interaction indicates that the ICTRES-associated component may vary across the ESCS distribution.
Second, multiple imputation depends on the missing-at-random assumption under heterogeneous item nonresponse. Mathematics anxiety had 30.37% missingness in the regional sample, with higher country-specific rates in Panama (53.83%), the Dominican Republic (51.32%), and Jamaica (40.05%). Moreover, plausible values were not included in the chained-equations model, so imputations of missing covariates were not conditioned directly on achievement. This choice preserves the treatment of plausible values as latent-proficiency draws but may attenuate covariate–outcome associations if achievement predicts missing variables beyond the information included in the imputation model. The focal predictors had lower item nonresponse (2.94% for ESCS and 3.13% for ICTRES), but the estimates should still be interpreted under the stated MAR assumption. Future analyses should examine sensitivity to alternative imputation specifications and to missing-not-at-random mechanisms.
Third, pooled regional models retained the OECD final student weights and therefore described student-population-weighted associations across the included systems; they do not represent an equally weighted average of 13 national coefficients. A sensitivity analysis with equal country weights (Section 3.6) shows that the moderation pattern is not driven by the largest systems, but the results still exclude education systems without the focal variables and cannot be generalized to all of Latin America and the Caribbean. Finally, although the Cochran Q test confirms that the country-specific coefficients differ overall, no multilevel random-slope specification was fitted; specific pairwise contrasts between countries should therefore be interpreted with caution. Longitudinal designs and more granular measures of instructional quality and pedagogical technology use would be needed to extend these findings (see Lan et al., 2026, for an example of a longitudinal design).
5. Conclusions
This study examined whether home digital resources attenuate or intensify the socioeconomic gradient in achievement across Latin America and the Caribbean, and found a pattern more consistent with amplification than with compensation. The positive ESCS × ICTRES interaction indicates a steeper socioeconomic gradient at higher levels of home digital resources; a residualization sensitivity analysis shows that the moderation remains after the variance shared by ESCS and ICTRES is removed, whereas the attenuation of the ESCS coefficient corresponds to that shared variance and cannot be attributed solely to an independent digital contribution. Neither result should be interpreted causally.
The socioeconomic gradient itself varied meaningfully across the region, with the Cochran Q test confirming cross-national heterogeneity beyond sampling variability. School-climate indicators were also associated with achievement net of material and demographic covariates. Taken together—and under the caveats imposed by the cross-sectional design and the imputation assumptions—the findings show that greater availability of home digital resources is not necessarily associated with a narrower socioeconomic achievement gradient. The present analysis does not test whether particular policies would reduce that gradient. Read alongside prior experimental and implementation research (e.g., Cristia et al., 2017; Gottschalk & Weise, 2023), however, the results suggest that device and connectivity policies may be more effective when paired with pedagogical integration, support for meaningful academic use at home, and attention to the school and structural conditions that shape who benefits from digital resources.
Supplementary Materials
The following supporting information can be downloaded at https://www.mdpi.com/article/10.3390/educsci16101709/s1. Figure S1: Analytical workflow; Table S1: Scaled generalized variance inflation factors across imputations; Table S2: Average descriptive statistical decomposition; Table S3: Full hierarchical model output (M1–M3), mathematics and reading; Table S4: Full interaction model output; Table S5: Simple slopes at three ICTRES levels; Table S6: Conditional decomposition at three ICTRES levels; Table S7: Country-specific ESCS coefficients (baseline models and models additionally adjusted for ICTRES); Table S8: Cochran Q test of slope heterogeneity; Table S9: Sensitivity analysis with ESCS residualized on ICTRES; Table S10: Sensitivity analysis with complete cases; Table S11: Sensitivity analysis with equal country weights; Table S12: Sensitivity analysis excluding mathematics anxiety.
Author Contributions
Conceptualization, L.H.T.-O. and I.I.-V.; methodology, I.I.-V. and P.J.F.-A.; software, I.I.-V. and P.J.F.-A.; formal analysis, P.J.F.-A. and I.I.-V.; data curation, P.J.F.-A. and S.I.R.M.; writing—original draft preparation, L.H.T.-O., I.I.-V., P.J.F.-A. and S.I.R.M.; writing—review and editing, V.G.C.D. and J.T.C.C.; visualization, P.J.F.-A.; supervision, L.H.T.-O., V.G.C.D. and J.T.C.C. All authors have read and agreed to the published version of the manuscript.
Funding
This research received no external funding.
Institutional Review Board Statement
Not applicable. This study involved the secondary analysis of publicly available, fully anonymized microdata from the OECD PISA 2022 international assessment. The authors did not recruit or contact participants and did not access personally identifiable information; therefore, institutional ethical review and approval were not required.
Informed Consent Statement
Not applicable. The authors did not recruit or contact participants or collect primary data. The analysis was based exclusively on anonymized public-use data collected as part of PISA 2022 under the procedures established by the OECD and the participating education systems.
Data Availability Statement
The PISA 2022 microdata analyzed in this study (student questionnaire data file CY08MSP_STU_QQQ), together with the questionnaires, codebooks, and technical documentation, are publicly available from the OECD PISA 2022 Database at https://www.oecd.org/en/data/datasets/pisa-2022-database.html (accessed on 16 February 2026). The supplementary results are provided with this article, and the R code used for all analyses is openly available in Zenodo at https://doi.org/10.5281/zenodo.22962495 (Isa-Vargas & Fajardo-Aguilar, 2026).
Acknowledgments
During the preparation of this manuscript, the authors used Claude Opus 4.6 to help organize ideas, improve the clarity of the content, and translate it into English. The authors reviewed and edited the tool’s suggestions and take full responsibility for the content, accuracy, and integrity of the published version.
Conflicts of Interest
The authors declare no conflicts of interest.
References
- Arias Ortiz, E., Bos, M. S., Chen Peraza, J., Giambruno, C., Levin, V., Oubiña, V., Pineda, J. A., & Zoido, P. (2024). Learning can’t wait: Lessons for Latin America and the Caribbean from PISA 2022. Inter-American Development Bank. [Google Scholar] [CrossRef] [Scilit]
- Arias Ortiz, E., & Cristia, J. (2014). The IDB and technology in education: How to promote effective programs? (IDB Technical Note No. IDB-TN-670). Inter-American Development Bank. [CrossRef] [Scilit]
- Avvisati, F. (2020). The measure of socio-economic status in PISA: A review and some suggested improvements. Large-Scale Assessments in Education, 8, 8. [Google Scholar] [CrossRef] [Scilit]
- Barroso, C., Ganley, C. M., McGraw, A. L., Geer, E. A., Hart, S. A., & Daucourt, M. C. (2021). A meta-analysis of the relation between math anxiety and math achievement. Psychological Bulletin, 147, 134–168. [Google Scholar] [CrossRef] [Scilit] [PubMed]
- Berkowitz, R., Moore, H., Astor, R. A., & Benbenishty, R. (2017). A research synthesis of the associations between socioeconomic background, inequality, school climate, and academic achievement. Review of Educational Research, 87, 425–469. [Google Scholar] [CrossRef] [Scilit]
- Betthäuser, B. A., Bach-Mortensen, A. M., & Engzell, P. (2023). A systematic review and meta-analysis of the evidence on learning during the COVID-19 pandemic. Nature Human Behaviour, 7, 375–385. [Google Scholar] [CrossRef] [Scilit] [PubMed]
- Beuermann, D. W., Cristia, J., Cueto, S., Malamud, O., & Cruz-Aguayo, Y. (2015). One Laptop per Child at home: Short-term impacts from a randomized experiment in Peru. American Economic Journal: Applied Economics, 7, 53–80. [Google Scholar] [CrossRef] [Scilit]
- Cochran, W. G. (1954). The combination of estimates from different experiments. Biometrics, 10, 101–129. [Google Scholar] [CrossRef] [Scilit] [PubMed]
- Cristia, J., Ibarrarán, P., Cueto, S., Santiago, A., & Severín, E. (2017). Technology and child development: Evidence from the One Laptop per Child program. American Economic Journal: Applied Economics, 9, 295–320. [Google Scholar] [CrossRef] [Scilit]
- Delprato, M. (2026). Effects of COVID-19 education policies on students’ learning proficiency in Latin America: Insights from PISA 2022. International Journal of Educational Development, 120, 103483. [Google Scholar] [CrossRef] [Scilit]
- Enchikova, E., Neves, T., Toledo, C., & Nata, G. (2024). Change in socioeconomic educational equity after 20 years of PISA: A systematic literature review. International Journal of Educational Research Open, 7, 100359. [Google Scholar] [CrossRef] [Scilit]
- Fernández, R., Pagés, C., Székely, M., & Acevedo, I. (2025). Education inequalities in Latin America and the Caribbean. Oxford Open Economics, 4(Suppl. 1), i55–i76. [Google Scholar] [CrossRef] [Scilit]
- Formichella, M. M., & Alderete, M. V. (2018). TIC en la escuela y rendimiento educativo: El efecto mediador del uso de las TIC en el hogar [ICT at school and educational performance: The mediating effect of ICT use at home]. Cuadernos de Investigación Educativa, 9, 75–93. [Google Scholar] [CrossRef] [Scilit]
- Fox, J., & Weisberg, S. (2019). An R companion to applied regression (3rd ed.). Sage. [Google Scholar]
- Gottschalk, F., & Weise, C. (2023). Digital equity and inclusion in education: An overview of practice and policy in OECD countries (OECD Education Working Papers No. 299). OECD Publishing. [CrossRef] [Scilit]
- Guerra, J., Roblez, G., Vargas, V., Meneses, M., & Basantes-Andrade, A. (2026). Digital equity and socioeconomic gradients in PISA 2022 mathematics: An integrated equity-diagnostic framework for Latin America and the Caribbean. Frontiers in Education, 11, 1810210. [Google Scholar] [CrossRef] [Scilit]
- Hanushek, E. A., Light, J. D., Peterson, P. E., Talpey, L. M., & Woessmann, L. (2022). Long-run trends in the U.S. SES–achievement gap. Education Finance and Policy, 17, 608–640. [Google Scholar] [CrossRef] [Scilit]
- Hayes, A. F. (2018). Introduction to mediation, moderation, and conditional process analysis: A regression-based approach (2nd ed.). Guilford Press. [Google Scholar]
- Herrera, P., Huepe, M., & Trucco, D. (2025). Education and the development of digital competences in Latin America and the Caribbean (LC/TS.2025/3). Economic Commission for Latin America and the Caribbean. [Google Scholar]
- Higgins, J. P. T., & Thompson, S. G. (2002). Quantifying heterogeneity in a meta-analysis. Statistics in Medicine, 21, 1539–1558. [Google Scholar] [CrossRef] [Scilit] [PubMed]
- Isa-Vargas, I., & Fajardo-Aguilar, P. J. (2026). Replication code for “Do home digital resources bridge or widen the achievement gap? Evidence from PISA 2022 in Latin America and the Caribbean” (Version 1.0.0) [Computer software]. Zenodo. [CrossRef]
- Jewsbury, P. A., Jia, Y., & Gonzalez, E. J. (2024). Considerations for the use of plausible values in large-scale assessments. Large-Scale Assessments in Education, 12, 24. [Google Scholar] [CrossRef] [Scilit]
- Kastorff, T., Müller, M., & Greiff, S. (2025). Digital media use and availability can mitigate the digital divide: Meta-analytic insights from PISA 2022. Computers & Education, 238, 105409. [Google Scholar] [CrossRef] [Scilit]
- Krüger, N. (2019). La segregación por nivel socioeconómico como dimensión de la exclusión educativa: 15 años de evolución en América Latina [Socioeconomic segregation as a dimension of educational exclusion: 15 years of evolution in Latin America]. Education Policy Analysis Archives, 27, 8. [Google Scholar] [CrossRef] [Scilit]
- Lan, M., Tao, S., Pan, Q., Liang, Q., Tan, C. Y., & Law, N. W. Y. (2026). Three-year development of digital literacy among primary and secondary school students: The role of digital activity participation and demographic characteristics. Interactive Learning Environments. Advance online publication. [Google Scholar] [CrossRef] [Scilit]
- Li, J., Xue, E., Zhou, W., Guo, S., & Zheng, Y. (2025). Students’ subjective well-being, school bullying, and belonging during the COVID-19 pandemic: Comparison between PISA 2018 and PISA 2022. Humanities and Social Sciences Communications, 12, 16. [Google Scholar] [CrossRef] [Scilit]
- Lumley, T. (2010). Complex surveys: A guide to analysis using R. John Wiley & Sons. [Google Scholar] [CrossRef] [Scilit]
- MacKinnon, D. P. (2008). Introduction to statistical mediation analysis. Lawrence Erlbaum Associates. [Google Scholar]
- Maheshwari, A., & Koria, A. (2025). Educational inequality: A country-level comparison between OECD and non-OECD countries. Policy Futures in Education, 23, 1313–1334. [Google Scholar] [CrossRef] [Scilit]
- Murillo, F. J., & Carrillo, S. (2020). Segregación escolar por nivel socioeconómico en educación secundaria en Perú y sus regiones [School segregation by socioeconomic level in secondary education in Peru and its regions]. Revista Peruana de Investigación Educativa, 12(12), 7–32. [Google Scholar] [CrossRef] [Scilit]
- OECD. (2015). Students, computers and learning: Making the connection. OECD Publishing. [Google Scholar] [CrossRef] [Scilit]
- OECD. (2019). PISA 2018 results (Volume II): Where all students can succeed. OECD Publishing. [Google Scholar] [CrossRef] [Scilit]
- OECD. (2023a). PISA 2022 assessment and analytical framework. OECD Publishing. [Google Scholar] [CrossRef] [Scilit]
- OECD. (2023b). PISA 2022 results (Volume I): The state of learning and equity in education. OECD Publishing. [Google Scholar] [CrossRef] [Scilit]
- OECD. (2024). PISA 2022 technical report. OECD Publishing. [Google Scholar] [CrossRef] [Scilit]
- Pagliarani, S. (2026). Improving the performance of public schools: Evidence from Latin American countries in PISA 2022. Journal of Latinos and Education, 25, 183–196. [Google Scholar] [CrossRef] [Scilit]
- Perrotta, C., & Pangrazio, L. (2023). The critical study of digital platforms and infrastructures: Current issues and new agendas for education technology research. Education Policy Analysis Archives, 31, 131. [Google Scholar] [CrossRef] [Scilit]
- Pittaluga, L., & Rivoir, A. (2012). One Laptop per Child and bridging the digital divide: The case of Plan CEIBAL in Uruguay. Information Technologies & International Development, 8, 145–159. [Google Scholar]
- Quintero Pena, J. W., Volante, L., & De Witte, K. (2025). The impact of the pandemic and school closures on non-cognitive characteristics: Evidence from PISA. International Journal of Educational Research Open, 9, 100489. [Google Scholar] [CrossRef] [Scilit]
- R Core Team. (2026). R: A language and environment for statistical computing (Version 4.6.1) [Computer software]. R Foundation for Statistical Computing.
- Reich, J. (2019). Teaching our way to digital equity. Educational Leadership, 76(5), 30–35. [Google Scholar]
- Rivera-Vargas, P., Parcerisa, L., & Fardella, C. (2023). Digital education platforms and schooling: New challenges and alternatives towards educational equity and children’s rights. Education Policy Analysis Archives, 31, 130. [Google Scholar] [CrossRef] [Scilit]
- Rubin, D. B. (1987). Multiple imputation for nonresponse in surveys. John Wiley & Sons. [Google Scholar] [CrossRef] [Scilit]
- Saleh, A., & Sanders, H. (2014). The wolf in sheep’s clothing: The Matthew effect in online education. International Journal of Sociology of Education, 3, 26–50. [Google Scholar] [CrossRef] [Scilit]
- Tedesco, J. C. (2014). Tecnologías de la información y desigualdad educativa en América Latina [Information technologies and educational inequality in Latin America]. Education Policy Analysis Archives, 22, 48. [Google Scholar] [CrossRef] [Scilit][Green Version]
- van Buuren, S. (2018). Flexible imputation of missing data (2nd ed.). Chapman and Hall/CRC. [Google Scholar] [CrossRef] [Scilit]
- van Buuren, S., & Groothuis-Oudshoorn, K. (2011). mice: Multivariate imputation by chained equations in R. Journal of Statistical Software, 45, 1–67. [Google Scholar] [CrossRef] [Scilit]
- van Deursen, A. J. A. M., & Helsper, E. J. (2015). The third-level digital divide: Who benefits most from being online? In L. Robinson, S. R. Cotten, J. Schulz, T. M. Hale, & A. Williams (Eds.), Communication and information technologies annual: Digital distinctions and inequalities (Vol. 10, pp. 29–52). Emerald Group Publishing. [Google Scholar] [CrossRef] [Scilit]
- Vigdor, J. L., Ladd, H. F., & Martinez, E. (2014). Scaling the digital divide: Home computer technology and student achievement. Economic Inquiry, 52, 1103–1119. [Google Scholar] [CrossRef] [Scilit]
- Warschauer, M., & Matuchniak, T. (2010). New technology and digital worlds: Analyzing evidence of equity in access, use, and outcomes. Review of Research in Education, 34, 179–225. [Google Scholar] [CrossRef] [Scilit]
- Wickham, H. (2016). ggplot2: Elegant graphics for data analysis (2nd ed.). Springer. [Google Scholar] [CrossRef] [Scilit]
- Wickham, H., Averick, M., Bryan, J., Chang, W., D’Agostino McGowan, L., François, R., Grolemund, G., Hayes, A., Henry, L., Hester, J., Kuhn, M., Pedersen, T. L., Miller, E., Bache, S. M., Müller, K., Ooms, J., Robinson, D., Seidel, D. P., Spinu, V., … Yutani, H. (2019). Welcome to the tidyverse. Journal of Open Source Software, 4, 1686. [Google Scholar] [CrossRef] [Scilit]
- Willms, J. D. (2006). Learning divides: Ten policy questions about the performance and equity of schools and schooling systems (UIS Working Paper No. 5). UNESCO Institute for Statistics.
- Wu, M. (2005). The role of plausible values in large-scale surveys. Studies in Educational Evaluation, 31, 114–128. [Google Scholar] [CrossRef] [Scilit]
- Wyss, N., Myers, C., Villavicencio Peralta, X., & Coflan, C. (2022). Mapping and analysing EdTech initiatives in Latin America and the Caribbean. EdTech Hub. [Google Scholar] [CrossRef] [Scilit]
- Yang, G., Wang, C., Cui, H., Ming, Y., & Sun, Z. (2025). How does digital learning resource accessibility affects math learning anxiety in high school—An empirical analysis based on PISA 2022. Frontiers in Psychology, 16, 1646854. [Google Scholar] [CrossRef] [Scilit] [PubMed]
- Zhang, D., & Liu, L. (2016). How does ICT use influence students’ achievements in math and science over time? Evidence from PISA 2000 to 2012. EURASIA Journal of Mathematics, Science and Technology Education, 12, 2431–2449. [Google Scholar] [CrossRef] [Scilit]
- Zheng, B., Warschauer, M., Lin, C.-H., & Chang, C. (2016). Learning in one-to-one laptop environments: A meta-analysis and research synthesis. Review of Educational Research, 86, 1052–1084. [Google Scholar] [CrossRef] [Scilit]

Disclaimer/Publisher’s Note: The statements, opinions and data contained in all publications are solely those of the individual author(s) and contributor(s) and not of MDPI and/or the editor(s). MDPI and/or the editor(s) disclaim responsibility for any injury to people or property resulting from any ideas, methods, instructions or products referred to in the content. |
© 2026 by the authors. Licensee MDPI, Basel, Switzerland. This article is an open access article distributed under the terms and conditions of the Creative Commons Attribution (CC BY) license.