1. Introduction
Surveying education plays a critical role in preparing construction engineering students to measure, model, and interpret the physical environment. Traditionally, this instruction has focused on fundamental techniques using tools such as automatic levels and total stations, with clearly defined procedures and instructor-led labs. However, construction is rapidly evolving with the adoption of digitally enabled technologies such as LiDAR, drones, and photogrammetry systems. This shift necessitates a new generation of construction engineers who are competent in modern tools, data-rich workflows, and integrated decision-making. Although industry professionals increasingly adopt these new technologies, curricula often lag due to legacy course structures, limited budgets, and slow pedagogical change.
Closing this gap requires a rethinking both what is taught and how it is taught. Grounded in a constructivist theory of learning, experiential learning flips the teaching model from passive knowledge transmission to learner-based exploration. It enables students to construct understanding through direct experience with real-world tools and tasks, fostering critical thinking, problem-solving, and decision-making skills alongside knowledge acquisition. With reference to surveying, this implies that students are trained not only to operate instruments but also to interpret and integrate information from multiple sources, as they would in professional practice. Open-ended technology-enabled laboratories provide opportunities for deeper cognitive engagement, as students must independently set up experiments, make on-the-spot decisions, and reflect on outcomes.
Recent studies of construction and engineering have incorporated emerging sensing and visualization technologies into construction and surveying courses and reported improvements in student engagement, spatial understanding, and perceived usefulness (
Behzadan et al., 2011;
Wang and Hasanzadeh, 2022). Nevertheless, most of the past work focuses on engagement or perceptions alone, without systematically connecting technology acceptance to cognitive learning outcomes.
Unified Theory of Acceptance and Use of Technology (UTAUT) (
Venkatesh et al., 2003) is a most-used framework of studies in educational technology that is a systematic approach to analyzing students’ behavioral intention as well as technology adoption. Moreover, Bloom’s Taxonomy (
Anderson & Krathwohl, 2001) is a hierarchy for measuring learning outcomes, from basic recall to sophisticated analysis and creation. Learning results in this work are specifically set as students’ self-perceived cognitive improvement assessed through survey instead of grades of a course or instructor appraisal.
Despite growing interest in technology-enhanced learning in engineering education, there remains a gap in literature that simultaneously measures both technology acceptance and cognitive learning results in applications-discipline, discipline-based situations like construction surveying. This paper helps to fill that gap through simultaneous measurement of students’ UTAUT and their perceived learning results (Bloom) within a constructivist, experiential course design.
This study was directed by the following research questions:
Research Question 1 (RQ1): To what extent do construction surveying students accept and intend to apply emerging surveying technologies?
Research Question 2 (RQ2): To what degree do students think that they have cognitively learned through use of these technologies?
Research Question 3 (RQ3): To what extent do experiential, open-ended laboratories affect students’ engagement, critical thinking, and perceptions of technology usefulness?
To operationalize RQ1 more rigorously, this study draws on the UTAUT framework. In keeping with prior UTAUT-based educational research, we developed a set of construct-level analytical sub-questions (Section Instructional Context and Exposure Conditions) corresponding to performance expectancy, effort expectancy, social influence, facilitating conditions, anxiety, and behavioral intention.
By contrast, RQ2 and RQ3 focus on students’ perceived cognitive learning gains and the influence of experiential learning structures. These aspects are investigated through Bloom’s Taxonomy and the course’s pedagogical design, rather than through additional construct-level analytical questions.
2. Theoretical Framework and Literature Review
2.1. Technology Acceptance in Construction and Engineering Education
Construction is undergoing rapid digitalization under the broader framework of Construction 4.0. This transformation is marked by the increasing integration of technologies such as drones, LiDAR, and digital modeling. Even so, adoption of such technologies remains slow and reactive, driven by a need to address short-term issues rather than driving proactive innovation (
Wang & Hasanzadeh, 2022). This slow industrywide adoption makes it important to expose students to technology earlier to prepare them for a technology-enabled workforce.
Work applies the UTAUT (
Venkatesh et al., 2003) to explore student usage of new instruments in learning environments. UTAUT integrates eight previous models of technology adoption and incorporates four core antecedents of technology usage: Performance Expectancy, Effort Expectancy, Social Influence, and Facilitating Conditions, all of which influence Behavioral Intention. These factors assist in measuring whether learners view new technologies as useful, user-friendly, socialized, and available in the learning setting.
The Unified Theory of Acceptance and Use of Technology (UTAUT) was chosen over other widely used acceptance models such as the Technology Acceptance Model (TAM), the Theory of Planned Behavior (TPB), and the Innovation Diffusion Theory (IDT). Compared with these earlier frameworks, UTAUT provides a more comprehensive integration of eight theoretical perspectives, thereby capturing both individual and contextual determinants of technology use (
Venkatesh et al., 2003). While TAM primarily focuses on perceived usefulness and ease of use, and TPB emphasizes individual intention, UTAUT extends these perspectives by incorporating social influence and facilitating conditions—two factors particularly relevant to educational settings where institutional support and peer interactions play critical roles. Furthermore, empirical studies have shown that UTAUT demonstrates stronger explanatory power in educational technology contexts, accounting for up to 70 percent of variance in behavioral intention (
Zou et al., 2025). Given that construction programs often involve collective decision-making and resource-dependent learning environments, UTAUT was deemed the most appropriate framework for analyzing student acceptance of emerging surveying technologies.
Numerous studies have extended the UTAUT framework into educational contexts to explain students’ acceptance of emerging digital and learning technologies. The extended version of the model, UTAUT2 (
Venkatesh et al., 2012), originally developed for consumer settings, has provided a foundation for subsequent educational adaptations
Teo (
2011) applied UTAUT to predict teachers’ intentions to adopt classroom technology, confirming its robustness in education. In construction and engineering programs,
Wen et al. (
2024) assessed students’ perceptions of construction technologies, and discovered that although numerous students were aware of tools such as Procore, few actually had hands-on experience. Those with a prior exposure (e.g., through work experiences) revealed significantly stronger acceptance and intention to exploit the technology. Similarly,
Wang and Hasanzadeh (
2022) found that training on technology adoption theory in an active learning environment where students chose a technology, created a “sales pitch,” and completed “client” questionnaires fostered more favorable attitudes toward innovation. Furthermore,
Abdalla and AlSalti (
2025) integrated UTAUT2 with Bloom’s Taxonomy to link behavioral intention and cognitive development, suggesting the growing convergence of acceptance and learning-outcome perspectives in higher education. These precedents provide a strong basis for applying UTAUT to the current study’s investigation of technology adoption in construction surveying education. These results further strengthen the argument that learning environments must do more than present tools but must also create behavioral conditions that will propel later professional usage.
2.2. Cognitive Learning Outcomes and Bloom’s Taxonomy
In parallel with technology acceptance, this research measures learning depth with Bloom’s Taxonomy (
Anderson & Krathwohl, 2001). The cognitive model organizes learning into six ascending levels: Remember, Understand, Apply, Analyze, Evaluate, and Create. The model has emerged as a seminal model of curriculum design and learning research, particularly of STEM subjects.
In construction education, Bloom’s Taxonomy was utilized to assess student learning via labs, simulations, and design-build activities. Sustainable construction classes utilizing problem-based learning (PBL), for instance, made use of Bloom’s model to examine students’ capacity to scrutinize intricate systems and advance innovative solutions (
Pierrakos et al., 2014).
Beyond its application in construction education, Bloom’s framework continues to serve as a foundation for outcome-based design and assessment across engineering and higher education disciplines.
Krathwohl (
2002) refined the taxonomy to emphasize active cognitive processes and metacognitive reflection, while
Adams (
2015) illustrated its adaptability to modern higher-education curricula.
Biggs et al. (
2022) further operationalized Bloom’s hierarchy through the concept of constructive alignment, translating cognitive levels into measurable course objectives. Collectively, these studies demonstrate the taxonomy’s sustained relevance for analyzing how experiential and problem-based learning environments cultivate higher-order reasoning and creative synthesis.
In our research, students conducted a self-assessment aligned with Bloom’s cognitive levels after participating in an open-ended technology-integrated laboratory. It revealed not only surface-level conceptual recall but also higher levels of understanding that were developed through hands-on experiences, collaboration, and problem-solving.
2.3. Constructivism, Experiential, and Active Learning
The pedagogical foundation of this research is established on constructivist theory, including experiential learning (
Kolb, 1984) and PBL. Constructivism stresses that learning is best achieved through active engagement to construct knowledge through meaningful experiences rather than by receiving information passively (
Vygotsky, 1978). Experiential learning is a cyclical process involving concrete experience, reflective observation, abstract conceptualization, and active experimentation (
Kolb, 1984).
This theoretical foundation aligns well with the open-ended lab used in the study (see details in the following sections). The open-ended project necessitated planning, research, and troubleshooting by students to mimic real-world building conditions and foster independence.
Active and experiential learning have proven effective specifically within construction education. Research concluded that student-centered and motivational pedagogies enhance knowledge transfer, self-efficacy, and critical thinking (
Freeman et al., 2014). The inclusion of new technologies (e.g., VR, AR, drones) within experiential formats has been shown to improve enthusiasm and skill transfer beyond the confines of conventional lecture formats (
Behzadan et al., 2011;
Santos et al., 2013).
Recent comparative research further supports this pedagogical direction.
Bishop and Verleger (
2013) summarized that flipped and technology-enhanced learning consistently outperform traditional lectures in fostering engagement and higher-order thinking. In construction education,
Pikas et al. (
2013) demonstrated how BIM-based curricula enhanced collaborative and problem-solving competencies. More recently,
Zhao et al. (
2025) reported that AI-assisted estimation instruction improved both efficiency and conceptual understanding, while
Zhao and Na (
2024) found that augmented-reality modules significantly enhanced spatial cognition and learner engagement. Collectively, these findings indicate that digital technologies, when integrated into active and experiential formats, can advance both skill acquisition and cognitive development.
Additionally,
Wen et al. (
2024) emphasized the significance of recognizing student motivation and their willingness to adopt new tools. Motivation frameworks of learning within construction education posit that learning experiences that are authentic, iterative, and collaborative can enhance deeper engagement, particularly if coupled with real-world significance.
2.4. Research Gap and Contribution
While both UTAUT and Bloom’s Taxonomy are well-established in educational research, their integration within the same study, particularly in the context of construction surveying education, is rare. Most studies either focus on students’ perceived learning outcomes or on their perceptions of technology in isolation. Even fewer take place in truly open-ended, real-world-inspired learning environments that simulate the decision-making complexity of professional practice.
This research fills that gap by assessing technology acceptance and cognitive learning outcomes concurrently and integrating the assessment within a realistic, multi-device, open-ended laboratory that mirrors professional surveying activities. Through the integration of UTAUT, Bloom’s Taxonomy, and experiential learning design, this research offers educators seeking to innovate surveying and construction curricula with solutions that can inform practice. The research additionally proposes a model that can be applied to assess affective and cognitive outcomes within hands-on, technology-enhanced learning settings.
3. Methods
3.1. Overview and Pedagogical Design
This study was descriptive in nature and was not designed as an experimental or causal-comparative investigation; rather, it aimed to document students’ perceived experiences with each technology and lab format. This research examines undergraduate construction engineering students’ reactions to various surveying technologies concerning perceived learning outcomes and technology acceptance. An emphasis is placed on the utilization of traditional, semi-guided, and open-ended laboratory activities with technologies including total station (Nikon K 5″, Nikon Corporation, Tokyo, Japan), RTK-enabled drone, terrestrial laser scanning (Leica BLK360, Leica Geosystems AG, Heerbrugg, Switzerland), consumer camera drone (Tello, DJI Technology Co., Ltd., Shenzhen, China), and iPad Pro with LiDAR (Apple Inc., Cupertino, CA, USA). The teaching method was guided by constructivist learning theory and applied via active and experiential learning pedagogies.
Constructivism theory posits that learners construct knowledge through interaction with real-world problems. Experiential and active learning were selected because they emphasize learner autonomy, critical thinking, and reflection, which are critical in technology-rich, real-world construction environments. These pedagogies allow students to move beyond passive information acquisition and into deep engagement with tools, tasks, and collaboration. In this study, they were applied through structured labs with detailed instructions and demonstrations, as well as open-ended labs that required students to research, plan, and execute tasks with minimal guidance.
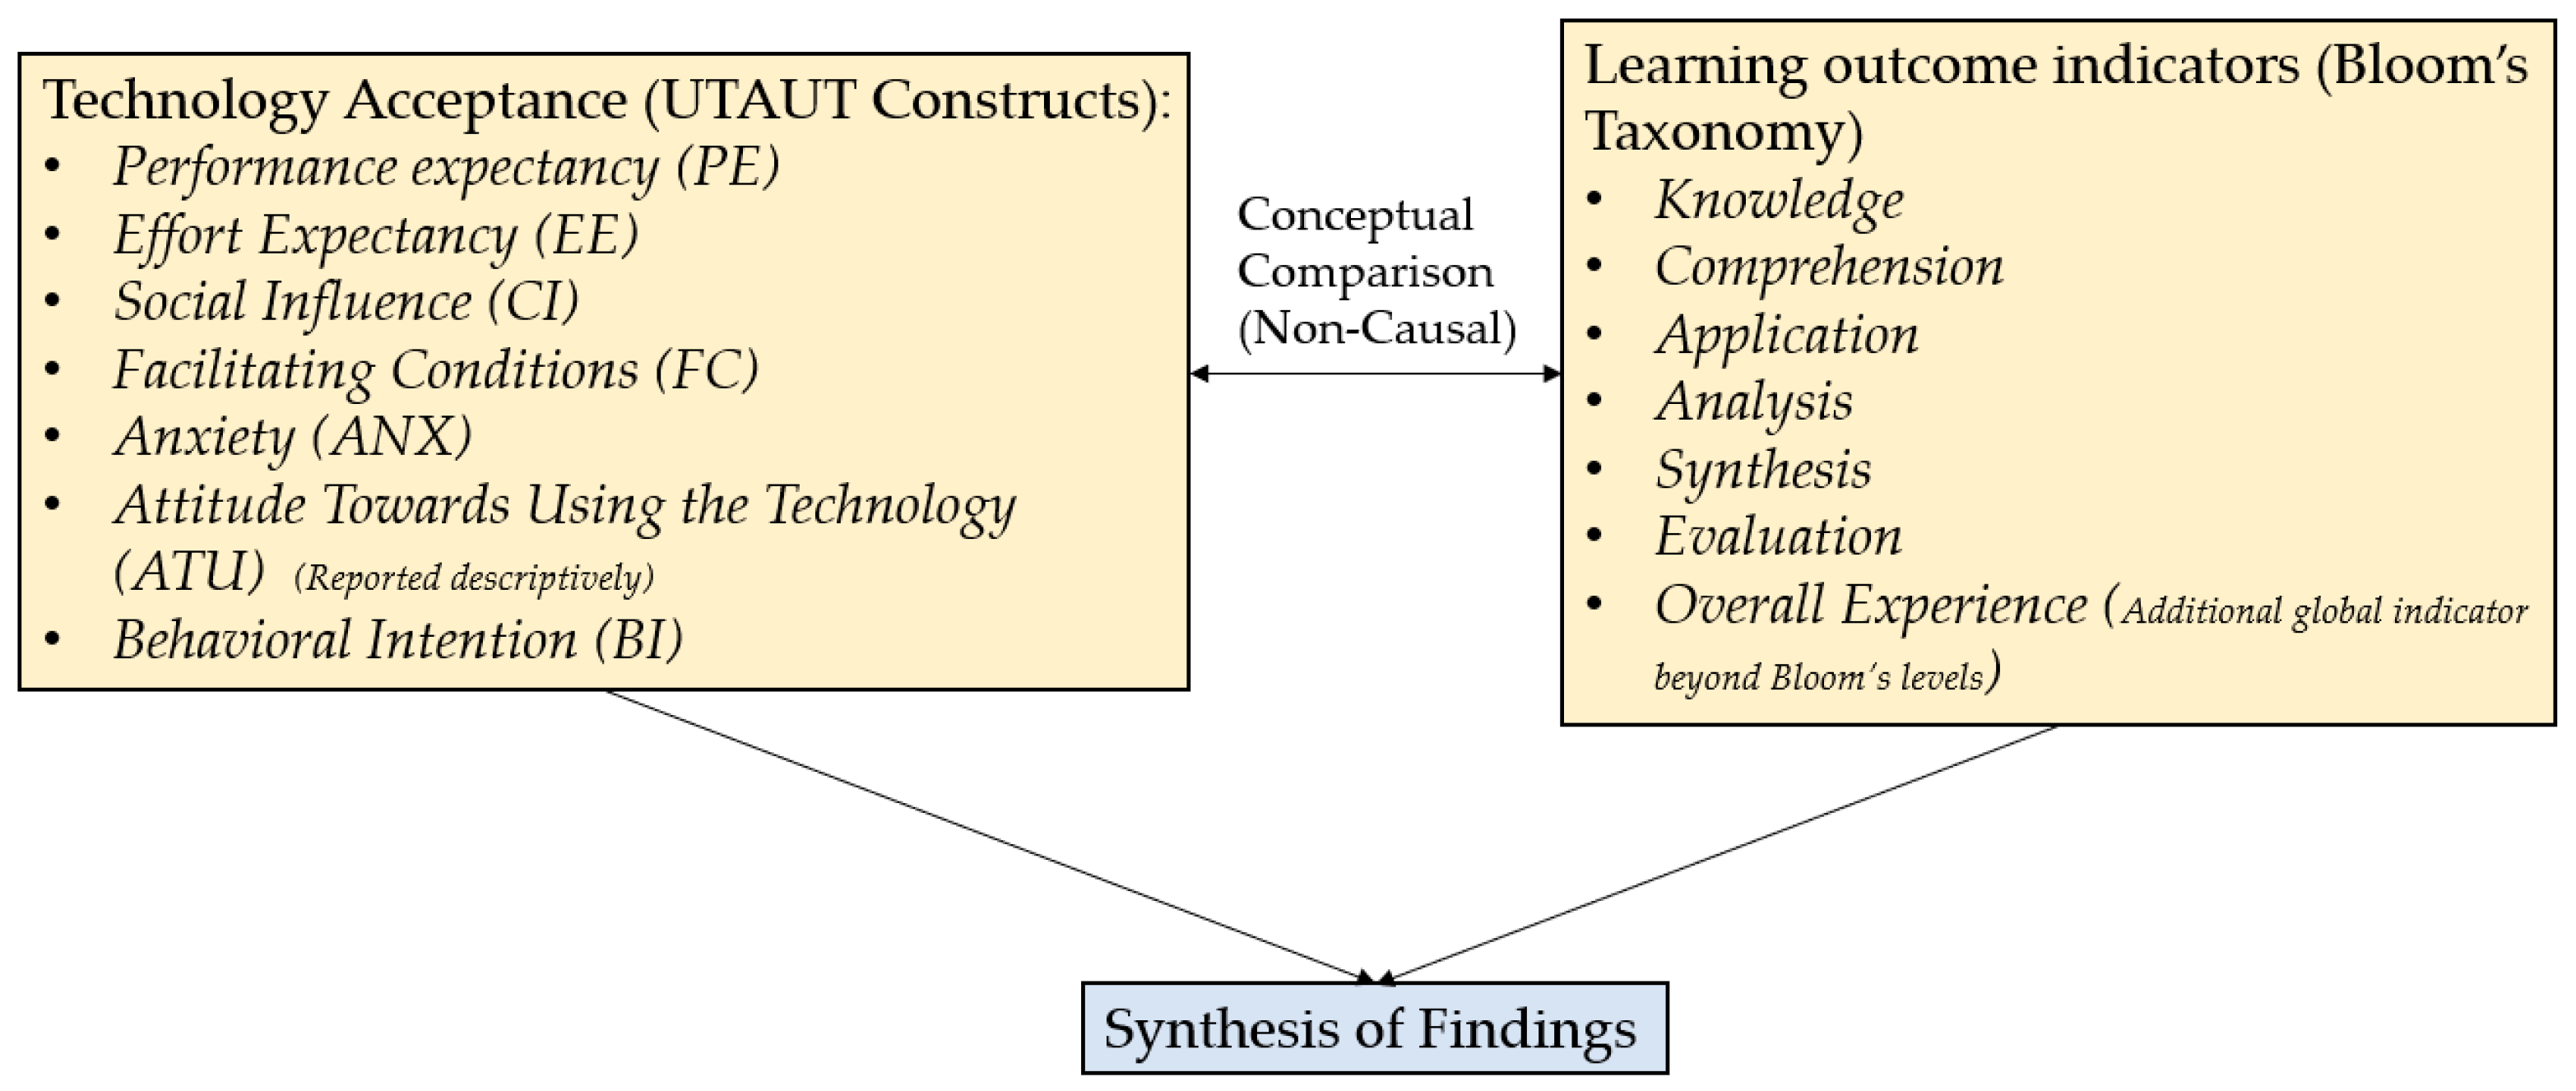
Figure 1 presents the conceptual framework guiding this study. It integrates the key constructs measured including technology acceptance (UTAUT) and cognitive learning outcomes (Bloom’s Taxonomy) and illustrates their non-causal conceptual relationship. Rather than depicting procedural details or lab sequencing, the figure highlights the theoretical foundations and measured variables that informed the design of the learning activities and the subsequent analysis of student outcomes.
In this experiment, the pedagogies were implemented using structured laboratories with clear instructions and open-ended laboratories where the students researched, planned, and conducted activities with little guidance. The core pedagogical experiment involved a continuum of laboratory types: the structured total station laboratories, the semi-structured RTK drone observation campus walkthroughs lab, and the open-ended “Exploring Point Cloud Generation” lab. In the open-ended experiment, the students were tasked with generating three-point cloud models using different software tools with minimal instruction. Students had to develop their own protocols, identify areas of difficulty, and write a report discussing their procedures and results. This instructional choice was intended to reflect the actual construction situations where precise procedures may not be available, and success relies on planning, adaptation, and coordination.
Instructional Context and Exposure Conditions
Throughout the semester, students engaged with the five technologies through intentionally varied modalities. The total station was used in several structured lab sessions, providing students with numerous opportunities for practice. The laser scanner was featured in one open-ended lab session, while the RTK drone was featured mostly in demonstration-oriented settings. The Tello drone and iPad LiDAR technology sessions included exploratory/semi-guided activities. These instructional variations were not evaluative outcomes but rather part of the planned pedagogical design and are described here to contextualize subsequent performance and perception outcomes.
3.2. Participants
The research was conducted during the Spring Semester 2025 in an undergraduate course, Engineering Surveying and Geomatics, at a research university in the US, which is a mandatory 15-week course of the Construction Engineering and Management program. The course included a weekly 1-h lecture and weekly laboratory of 3 h. The perceived learning outcomes were to be able to carry out field surveys, make engineering judgments based on data, and utilize contemporary surveying equipment.
Thirty-seven students enrolled in the course (
Table 1). One student did not complete the survey and was excluded from analysis, yielding a final sample of 36 students (22 juniors, 14 sophomores; 6-female, 30-male). Students worked in 13 lab groups (eleven 3-person and two 2-person groups) across a variety of labs, including traditional skill-based labs and exploratory labs using newer digital tools. All labs were completed collaboratively, while the post-lab survey questionnaire was completed individually.
3.3. Instructional Scope and Technology Use
The labs relevant to this study are summarized in
Table 2, which outlines lab schedule, objectives, instructional modes and technology.
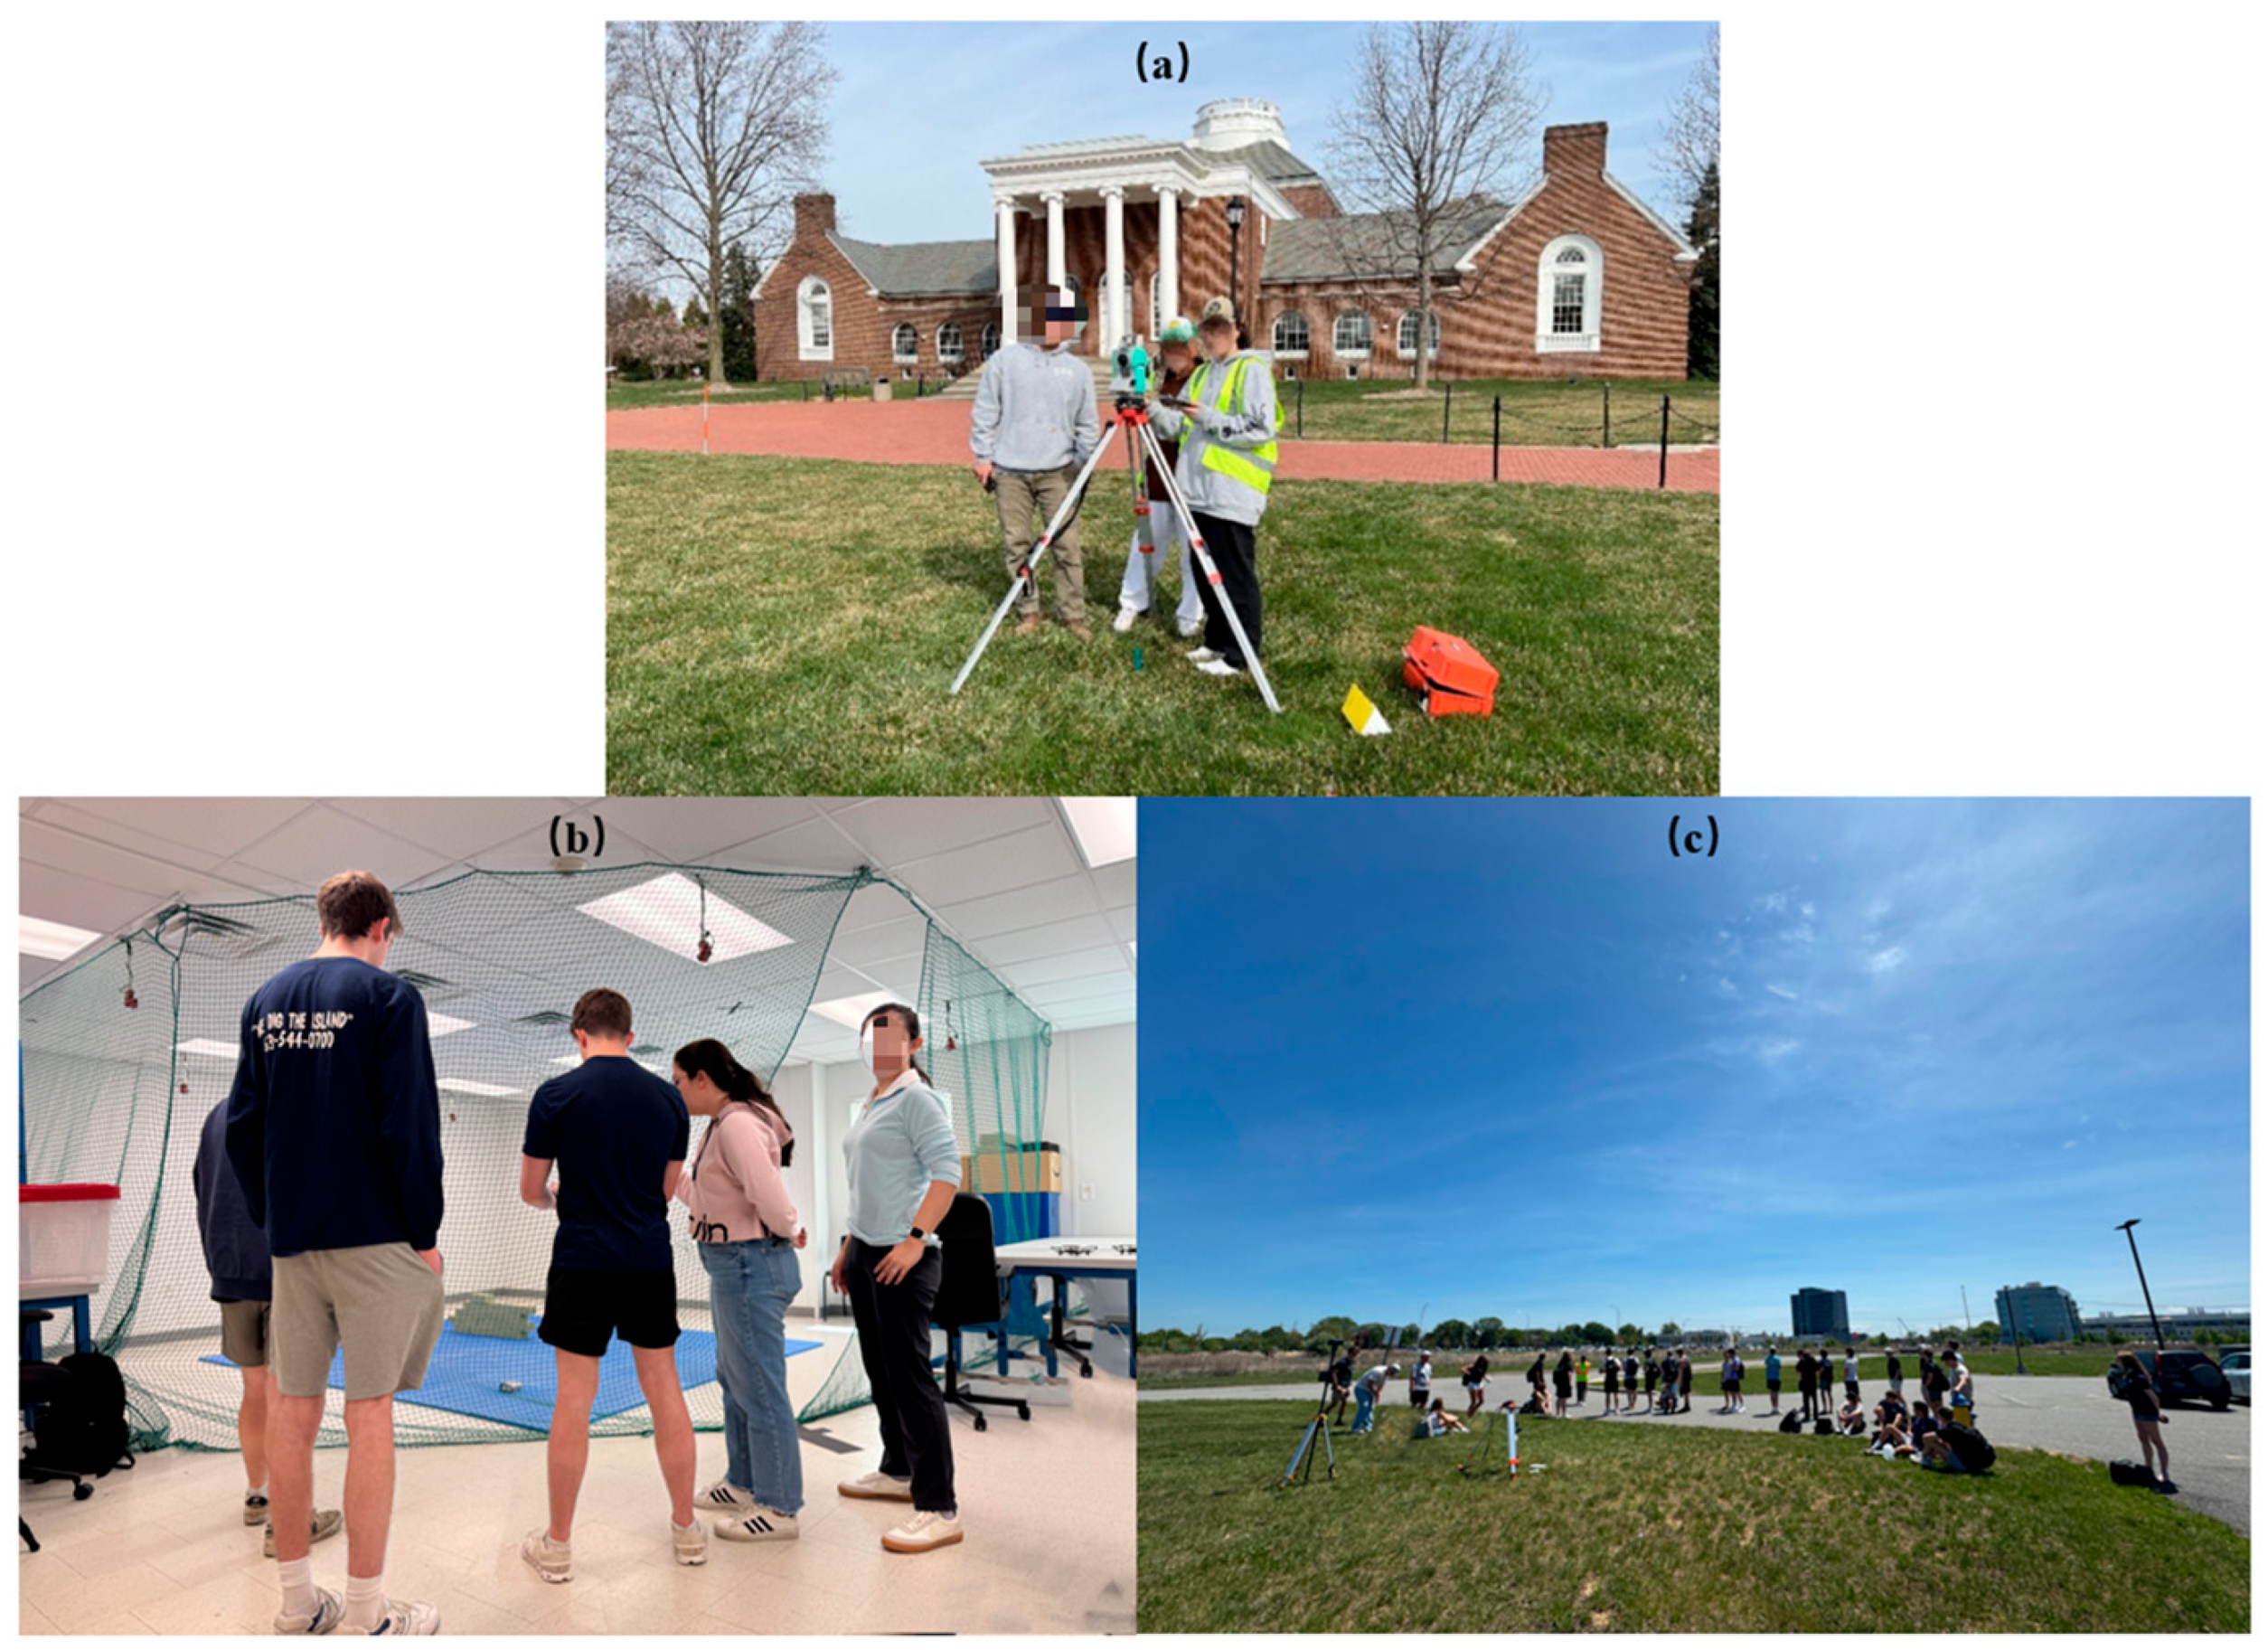
Figure 2 provides an example of photos taken during the related labs. These visuals illustrate the progression from traditional to advanced labs. The technologies used in the course spanned both traditional and advanced tools, which are illustrated in
Table 3.
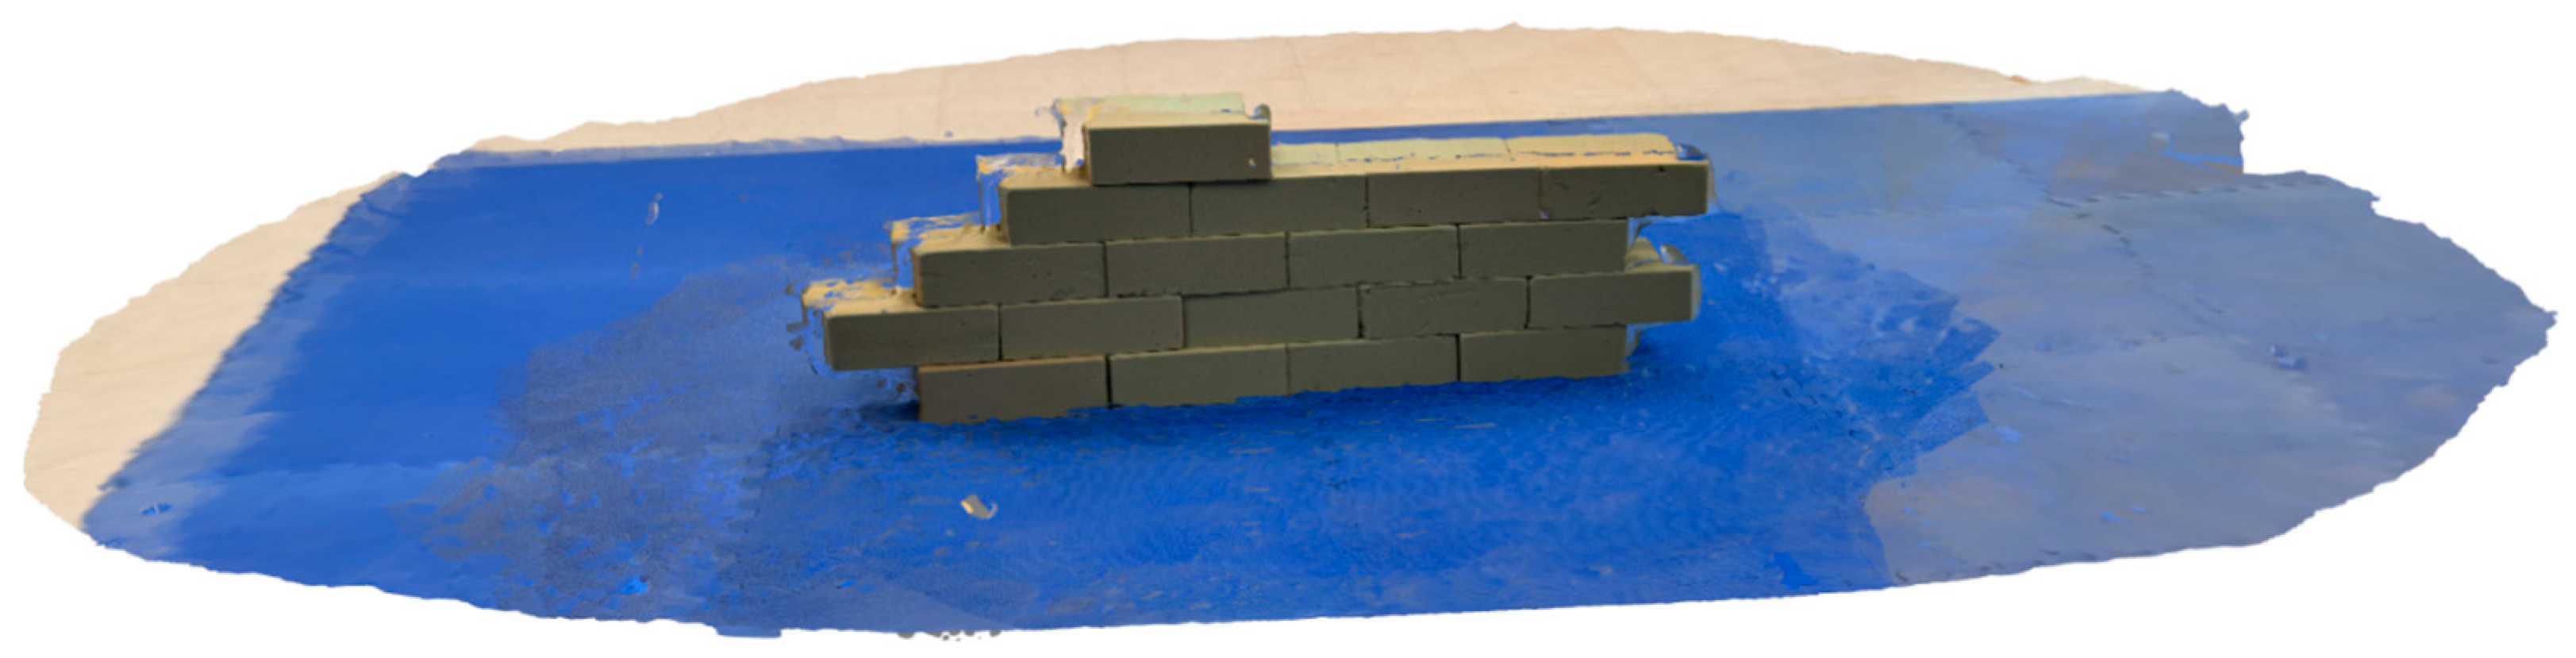
Figure 3 further illustrates this progression by showing a representative output from the Point Cloud Lab, highlighting the type of deliverable students produced in the open-ended exercise.
The total station was used in three structured labs (
Figure 2a) with instructor demonstrations and detailed step-by-step guidance. The labs’ objectives are (1) Use Direct/Reverse pointing and Doubling the Angle to close the horizon. Use a method to layout horizontal angles. (2) Use a total station for trigonometric leveling and for surveying the corners of a plot of land by radial traversing. (3) Use a total station for closed traversing and calculate the area.
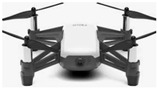
The BLK360 laser scanner, Tello drone, and SiteScape app on an iPad Pro were all introduced in the point cloud lab under open-ended, problem-based conditions. In this lab, Students were provided only minimal instructions for the open-ended lab, which emphasized critical thinking, planning, and teamwork. Each group was required to generate point cloud models of a brick wall section (
Figure 2b) located in an indoor lab using each tool, document their workflows in a written report, and reflect on the challenges encountered.
The RTK drone was used in a semi-guided observation lab (
Figure 2c), during which the instructor and teaching assistant conducted a demonstration. Detailed instructions were provided beforehand to help students understand the lab procedures. For safety reasons and due to drone pilot licensing requirements, students were not permitted to operate the drone.
It is important to note that this paper focuses on technology acceptance rather than student performance in each lab. Thus, the data used was not the students’ scores for each lab but the results from the survey questionnaires. Details of the survey instruments and data collection are provided in
Section 3.4.
3.4. Survey Instruments and Data Collection
Students were required to complete an individual survey after all related labs were completed to evaluate their technology acceptance and self-perceived learning outcomes. Two post-course surveys were conducted via Canvas. A full coding table for the technologies mentioned in
Table 3 is provided in
Table 4.
Note that Codes 1–7 are used for both frameworks to maintain consistency across the survey instruments. Rows 1–7 (upper section) correspond to constructs from the UTAUT framework. Among them, Performance Expectancy, Effort Expectancy, Social Influence, and Facilitating Conditions are the four core UTAUT constructs. Anxiety and Attitude Toward Use are extended constructs drawn from TAM and educational technology literature, while Behavioral Intention is included as a supplementary outcome-related category. Rows 1–7 (lower section) map the same numeric codes onto Bloom’s Taxonomy categories used to evaluate perceived learning outcomes.
3.4.1. UTAUT-Based Technology Acceptance Survey
To determine students’ perceptions and behavioral intentions toward technologies employed, the research adopted UTAUT (
Venkatesh et al., 2003). The model was chosen because of its excellent empirical backing and applicability to educational technology settings. The questionnaire (
Appendix A) comprised seven dimensions: Performance Expectancy, Effort Expectancy, Social Influence, Facilitating Conditions, Anxiety, Attitude Toward Use, and Behavioral Intention. Each item represented a 7-point Likert scale (1 = Strongly Disagree, 7 = Strongly Agree) across each of the five technologies. Cronbach’s alpha was 0.87, 0.84, 0.93, 0.90, 0.87, 0.76, and 0.88 for Performance Expectancy, Effort Expectancy, Social Influence, Facilitating Conditions, Anxiety, Attitude Towards Use, and Behavioral Intention, respectively, indicating the validity of the survey.
Because the study does not employ a predictive or structural modeling approach, analyses such as CR, AVE, factor loadings, regression, or path analysis are not applicable. Instead, internal consistency reliability was assessed using Cronbach’s α to ensure internal consistency reliability appropriate to the study design.
3.4.2. Bloom’s Taxonomy-Based Perceived Learning Outcomes Survey
To evaluate learning impact, students completed a second survey (
Appendix B) measuring self-perceived learning across the six levels of Bloom’s Taxonomy (
Anderson & Krathwohl, 2001), which consists of Knowledge, Comprehension, Application, Analysis, Synthesis, and Evaluation. In addition to these six cognitive levels, the survey included a supplemental construct, Overall Experience, which integrates affective, social, and metacognitive impressions (Q7–Q9). Although not part of Bloom’s cognitive hierarchy, this construct was included as an external perception-based category to capture students’ holistic impressions of each technology. Consistent with the comparative analytical approach, ‘Overall Experience’ was evaluated alongside the six Bloom levels using Friedman tests to identify technology-specific differences in overall experiential perception.
The system was selected because its perceived learning outcomes correspond with those of Accreditation Board for Engineering and Technology (ABET) (
ABET, 2023), its systematic evaluation of various cognitive domains, and its use is common in engineering education research. Cronbach’s alpha was 0.86, 0.89, 0.91, 0.91, 0.89, 0.92, and 0.95 for Knowledge, Comprehension, Application, Analysis, Synthesis, Evaluation, and Overall Experience, respectively, indicating the reliability of the survey. As mentioned, Because the study does not employ a predictive or structural model, reliability was evaluated using Cronbach’s α rather than structural modeling metrics such as CR or AVE.
It is important to note that graded performance or instructor evaluation was not the focus of this study. All perceived learning outcomes were evaluated through students’ own perceptions on a Bloom’s Taxonomy-based survey tool conducted during the terminal of the course.
3.4.3. Analytical Framework for Technology Acceptance and Self-Perceived Learning Outcomes
This study examined students’ responses using two complementary frameworks aligned with the three research questions (RQ1–RQ3). Technology acceptance (RQ1) was evaluated using the Unified Theory of Acceptance and Use of Technology (UTAUT), while perceived learning outcomes (RQ2 and RQ3) were assessed using Bloom’s Taxonomy. The present subsection outlines the analytical framework for RQ1, which required operationalizing the UTAUT constructs into a set of factor-level analytical sub-questions.
To examine RQ1, the following analytical questions were used to model the UTAUT portion of the research:
AQ1 (C1: Performance Expectancy): What are the perceptions of the students as to the usefulness of various surveying tools and technology?
AQ2 (C2: Effort Expectancy): How do students rate the ease of use of each technology?
AQ3 (C3: Social Influence): How much does peer or instructional influence affect the acceptance of each technology by the students?
AQ4 (C4: Facilitating Conditions): How are the perceived availability of resources, support, and infrastructure for use of the tools by the students?
AQ5 (C5: Anxiety): How comfortable or apprehensive are the students about the use of each technology tool mentioned above?
AQ6 (C7: Behavioral Intention): In what manner is each technology related to the students’ intention to use similar tools in the future?
These analytical questions serve as the operational framework for addressing Research Question 1 (RQ1) and align with the comparative statistical approach used in this study (Friedman tests, post hoc comparisons, and boxplots). Note that the analytical results correspond to the six constructs linked to AQ1–AQ6. Attitude Toward Use (C6) is reported descriptively but was not included in the analytical sub-questions.
Because this study uses non-parametric comparative analyses rather than a predictive structural-equation model, directional hypotheses are not analytically required. Following prior engineering-education research that evaluates UTAUT constructs at the factor level (e.g.,
Wang & Hasanzadeh, 2022;
Wen et al., 2024;
Abdalla & AlSalti, 2025), we operationalized RQ1 using analytical questions instead of hypotheses.
Evaluations corresponding to RQ2 and RQ3 (perceived learning outcomes based on Bloom’s Taxonomy) are addressed in
Section 3.5 through descriptive and inferential analyses of the Bloom survey data.
3.5. Data Analysis
The procedures described in this section were applied to both the UTAUT data (addressing RQ1) and the Bloom-based perceived learning outcomes data (addressing RQ2 and RQ3). These shared descriptive and non-parametric analyses enabled consistent comparisons across technologies and across cognitive levels. Data were computed with an integration of descriptive, inferential, and non-parametric statistical procedures crafted to examine overall patterns and comparisons specific to each tool.
Box plots were created on all survey dimensions to inspect distribution patterns and outliers. As the data involved ordinal ratings in a 7-point Likert scale, entailed repeat measurements across the five technologies along with the relatively low number of participants (N = 36), the assumptions for the ANOVA test were not met. Distributional characteristics were examined using boxplots to assess symmetry and variability across constructs. In accordance with best practices for ordinal repeated-measures data, the Friedman test was selected as the appropriate non-parametric alternative. All inferential analyses reported in this study are therefore based solely on Friedman tests, with Dunn–Šidák post hoc comparisons conducted when omnibus results were statistically significant (p < 0.05). For each category, we build X(i,j) = mean score of participant i on tech j, and participants’ technology-specific scores were ranked from lowest to highest. Bar charts were used to show the mean ranks, where higher ranks mean better performance. Spider (Radar) plots was used to represent each technology’s outline over UTAUT and Bloom classifications.
This analytical design enabled comparisons on both whole and fine-grained levels between technologies and learning effect, thus enhancing the validity of findings and facilitating multi-perspective understanding of students’ experiences.
3.6. Pedagogical Design and ABET Alignment
The lab pedagogic sequence was carefully structured to progressively scaffold student learning consistent with ABET accrediting standards. It guaranteed professional engineering graduate capabilities that were required by regulation and offers useful context in terms of measuring perception against perceived lab learning.
The transition progressed students from an ordered, skill development lab environment to an unstructured, problem-centered challenge. The initial, prescriptive Total Station labs (LAB06, LAB07, LAB09) provided grounding in lower-level cognitive abilities and central engineering skills such as solving problems (ABET SO-1) and experimenting with data (SO-6), with teamwork per se being naturally fostered (SO-5).
The difficulty was amplified in the unstructured Point Cloud Lab (LAB11-PCLD), on which the entire assessment of advanced-ordered abilities was built. Here students had to interpret data across various sources (SO-1, SO-6), integrate knowledge in developing a brand-new workflow for data capture (SO-2: Engineering Design), as well as interpret their results. Importantly, its minimal-directives structure was meant for developing independent acquisition as well as utilization of new knowledge (SO-7: Lifelong Learning), as students had no choice but to research and debug technologies in order to make progress.
Compared to this, the RTK Drone Observation (LAB13-RTK), as a demonstration project, was more responsible for advanced method knowledge bases but could not offer the experience required for advanced use or autonomous learning.
This deliberate design reflects a gradual progression from guided practicum to independent problem solving. This intended to get students away from mere competence toward the kind of critical thinking and lifelong learning that was being demanded by today’s engineers.
To summarize this instructional design,
Table 5 presents a structured mapping of each laboratory activity to its corresponding Bloom’s Taxonomy levels and ABET Student Outcomes. This table formalizes the pedagogical intent of the course and provides methodological context for understanding the perceived learning outcomes discussed in
Section 5.2.
It is important to note that the subsequent analysis of perceived learning outcomes (
Section 4.2) employs an 80% student attainment rate as the benchmark for evaluating the success of each lab activity against these intended design goals.
3.7. Ethical Considerations
This study was approved under an IRB exemption granted by the corresponding author’s institution (Protocol ID: 2288942-1, dated 4 February 2025). Participation in the survey was voluntary, and all data were de-identified and collected only after final course grades were submitted. Data were stored securely and analyzed only by the research team in compliance with university policies for human subject research.
4. Findings
The descriptive statistics on the questionnaires helped provide thorough insights into students’ acceptance towards the five surveying technologies as well as their perceived learning achievements. These findings are displayed under two primary sections: Technology Acceptance, founded on the UTAUT model, and Perceived Learning Achievements, founded on Bloom’s Taxonomy. Both sections combine an in-depth discussion on the respective figures towards offering a transparent as well as facts-backed narrative.
4.1. Technology Acceptance (UTAUT)
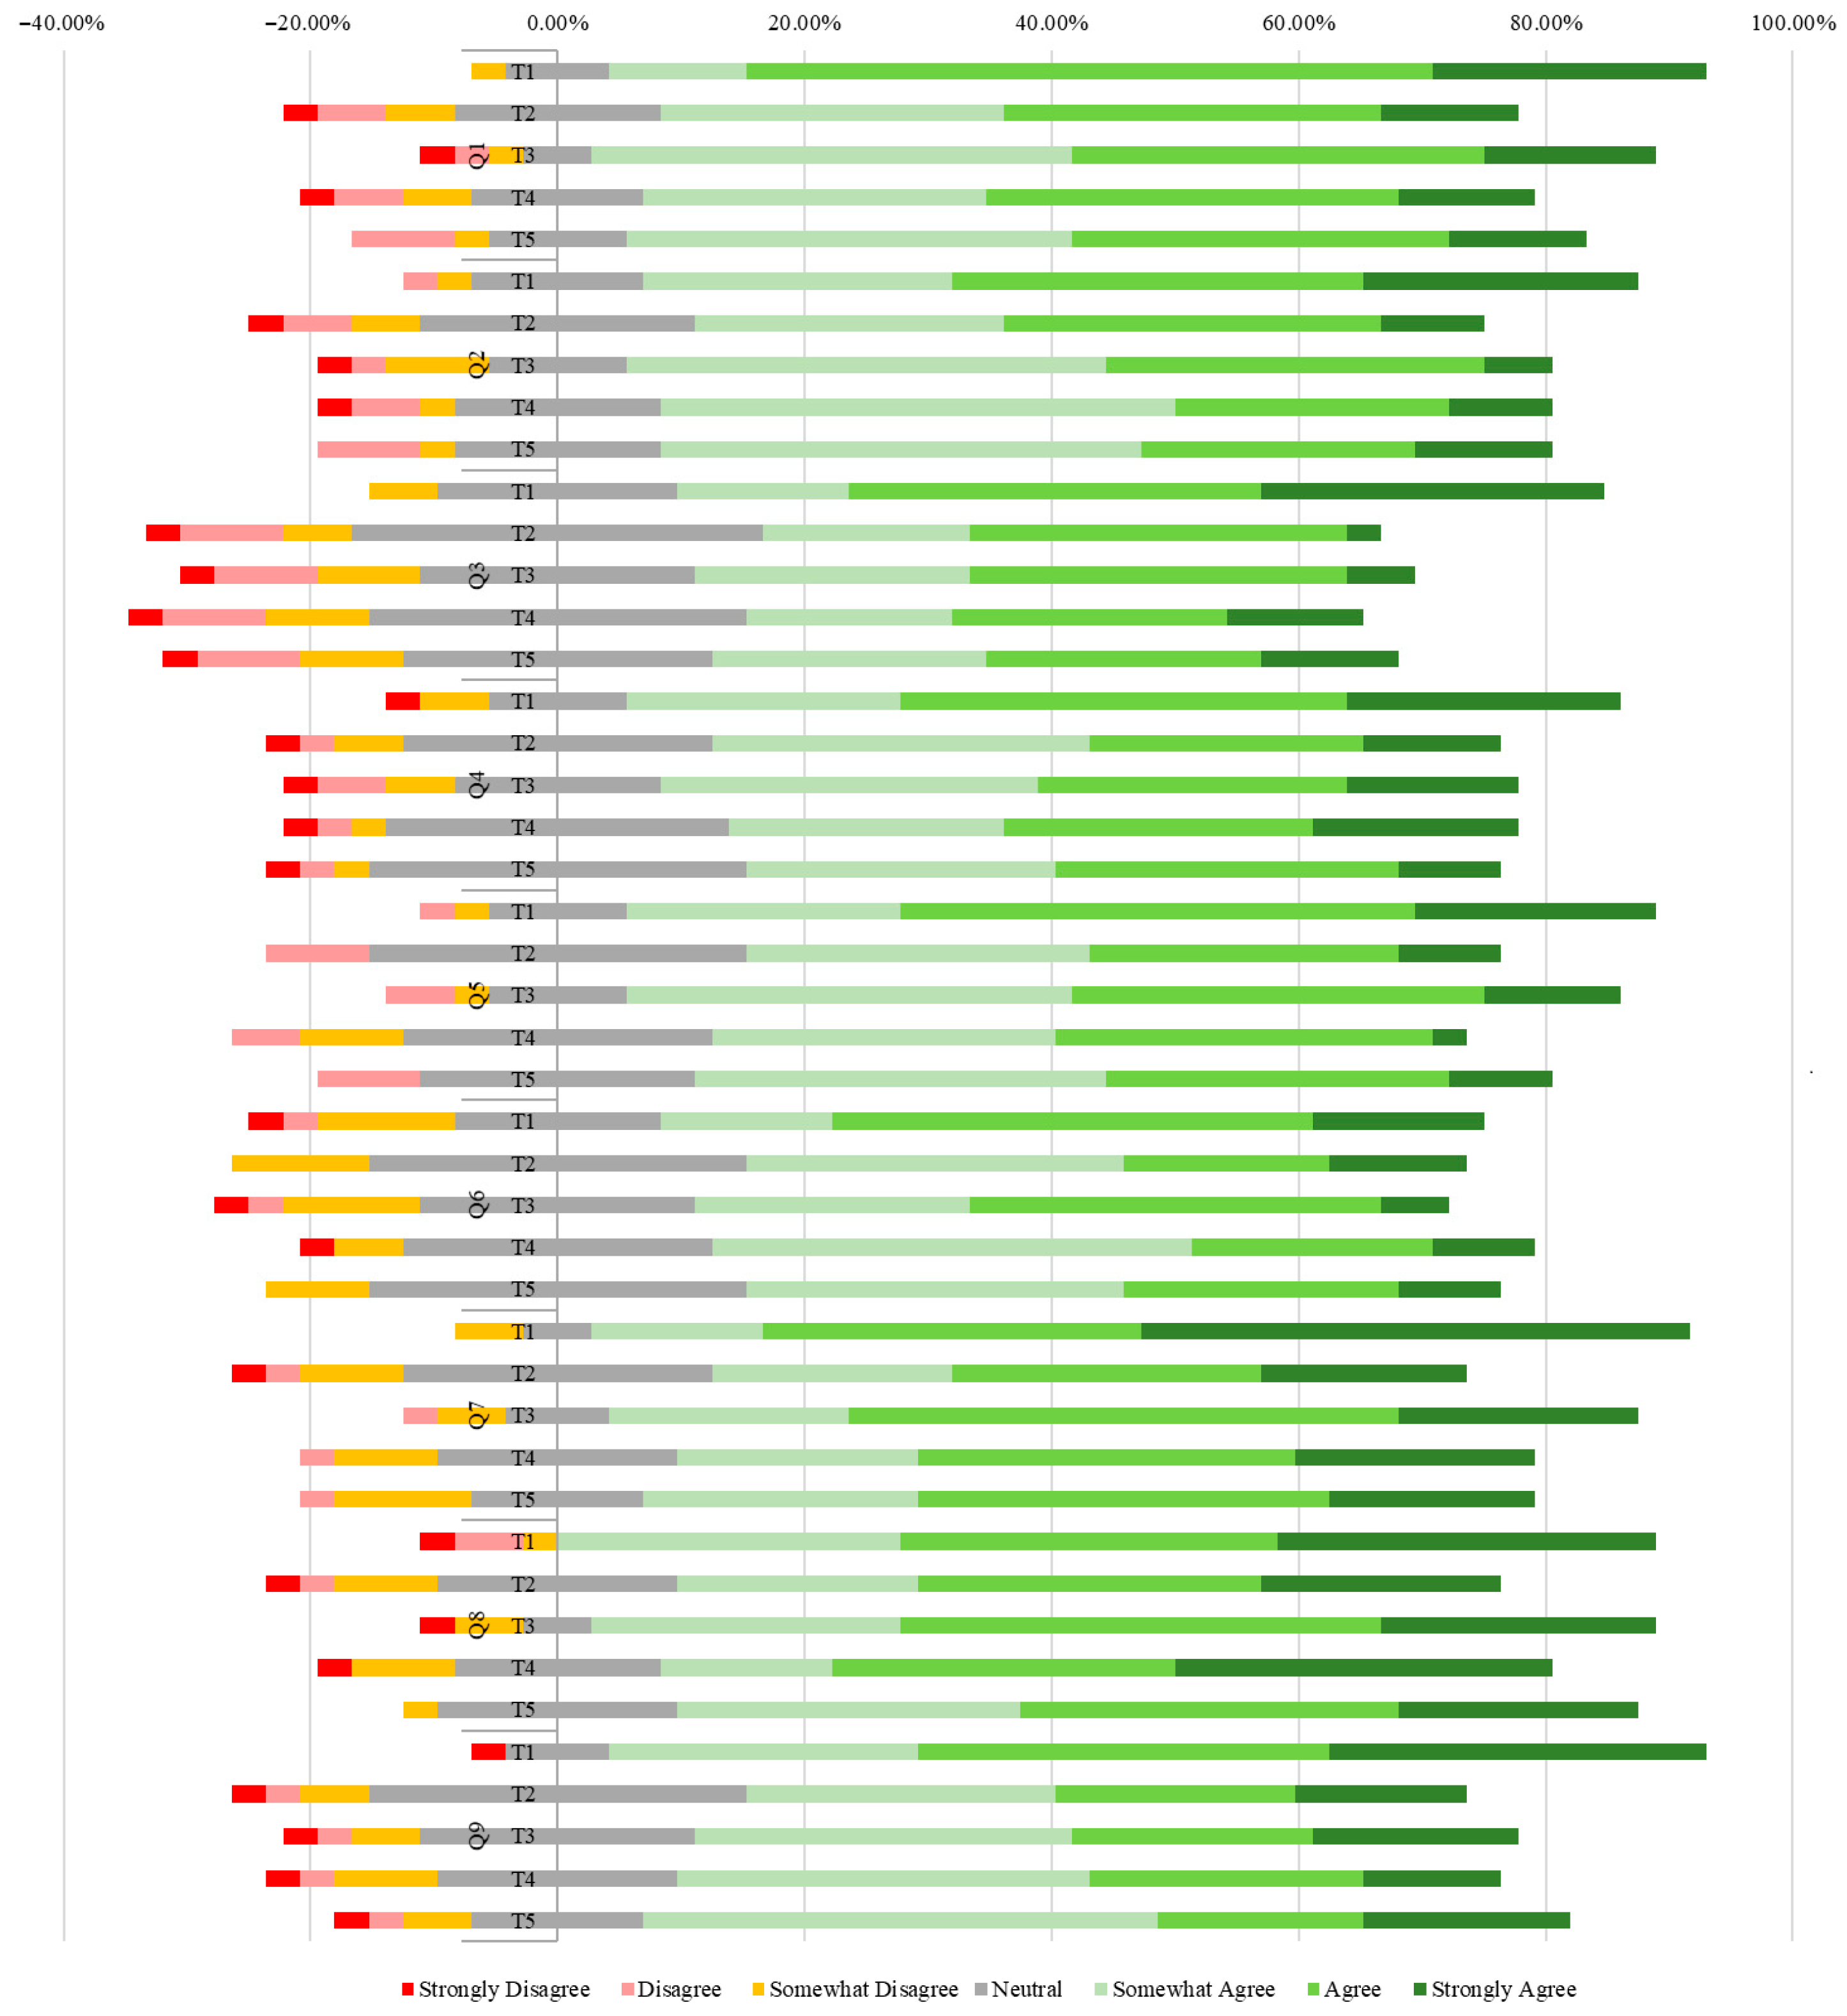
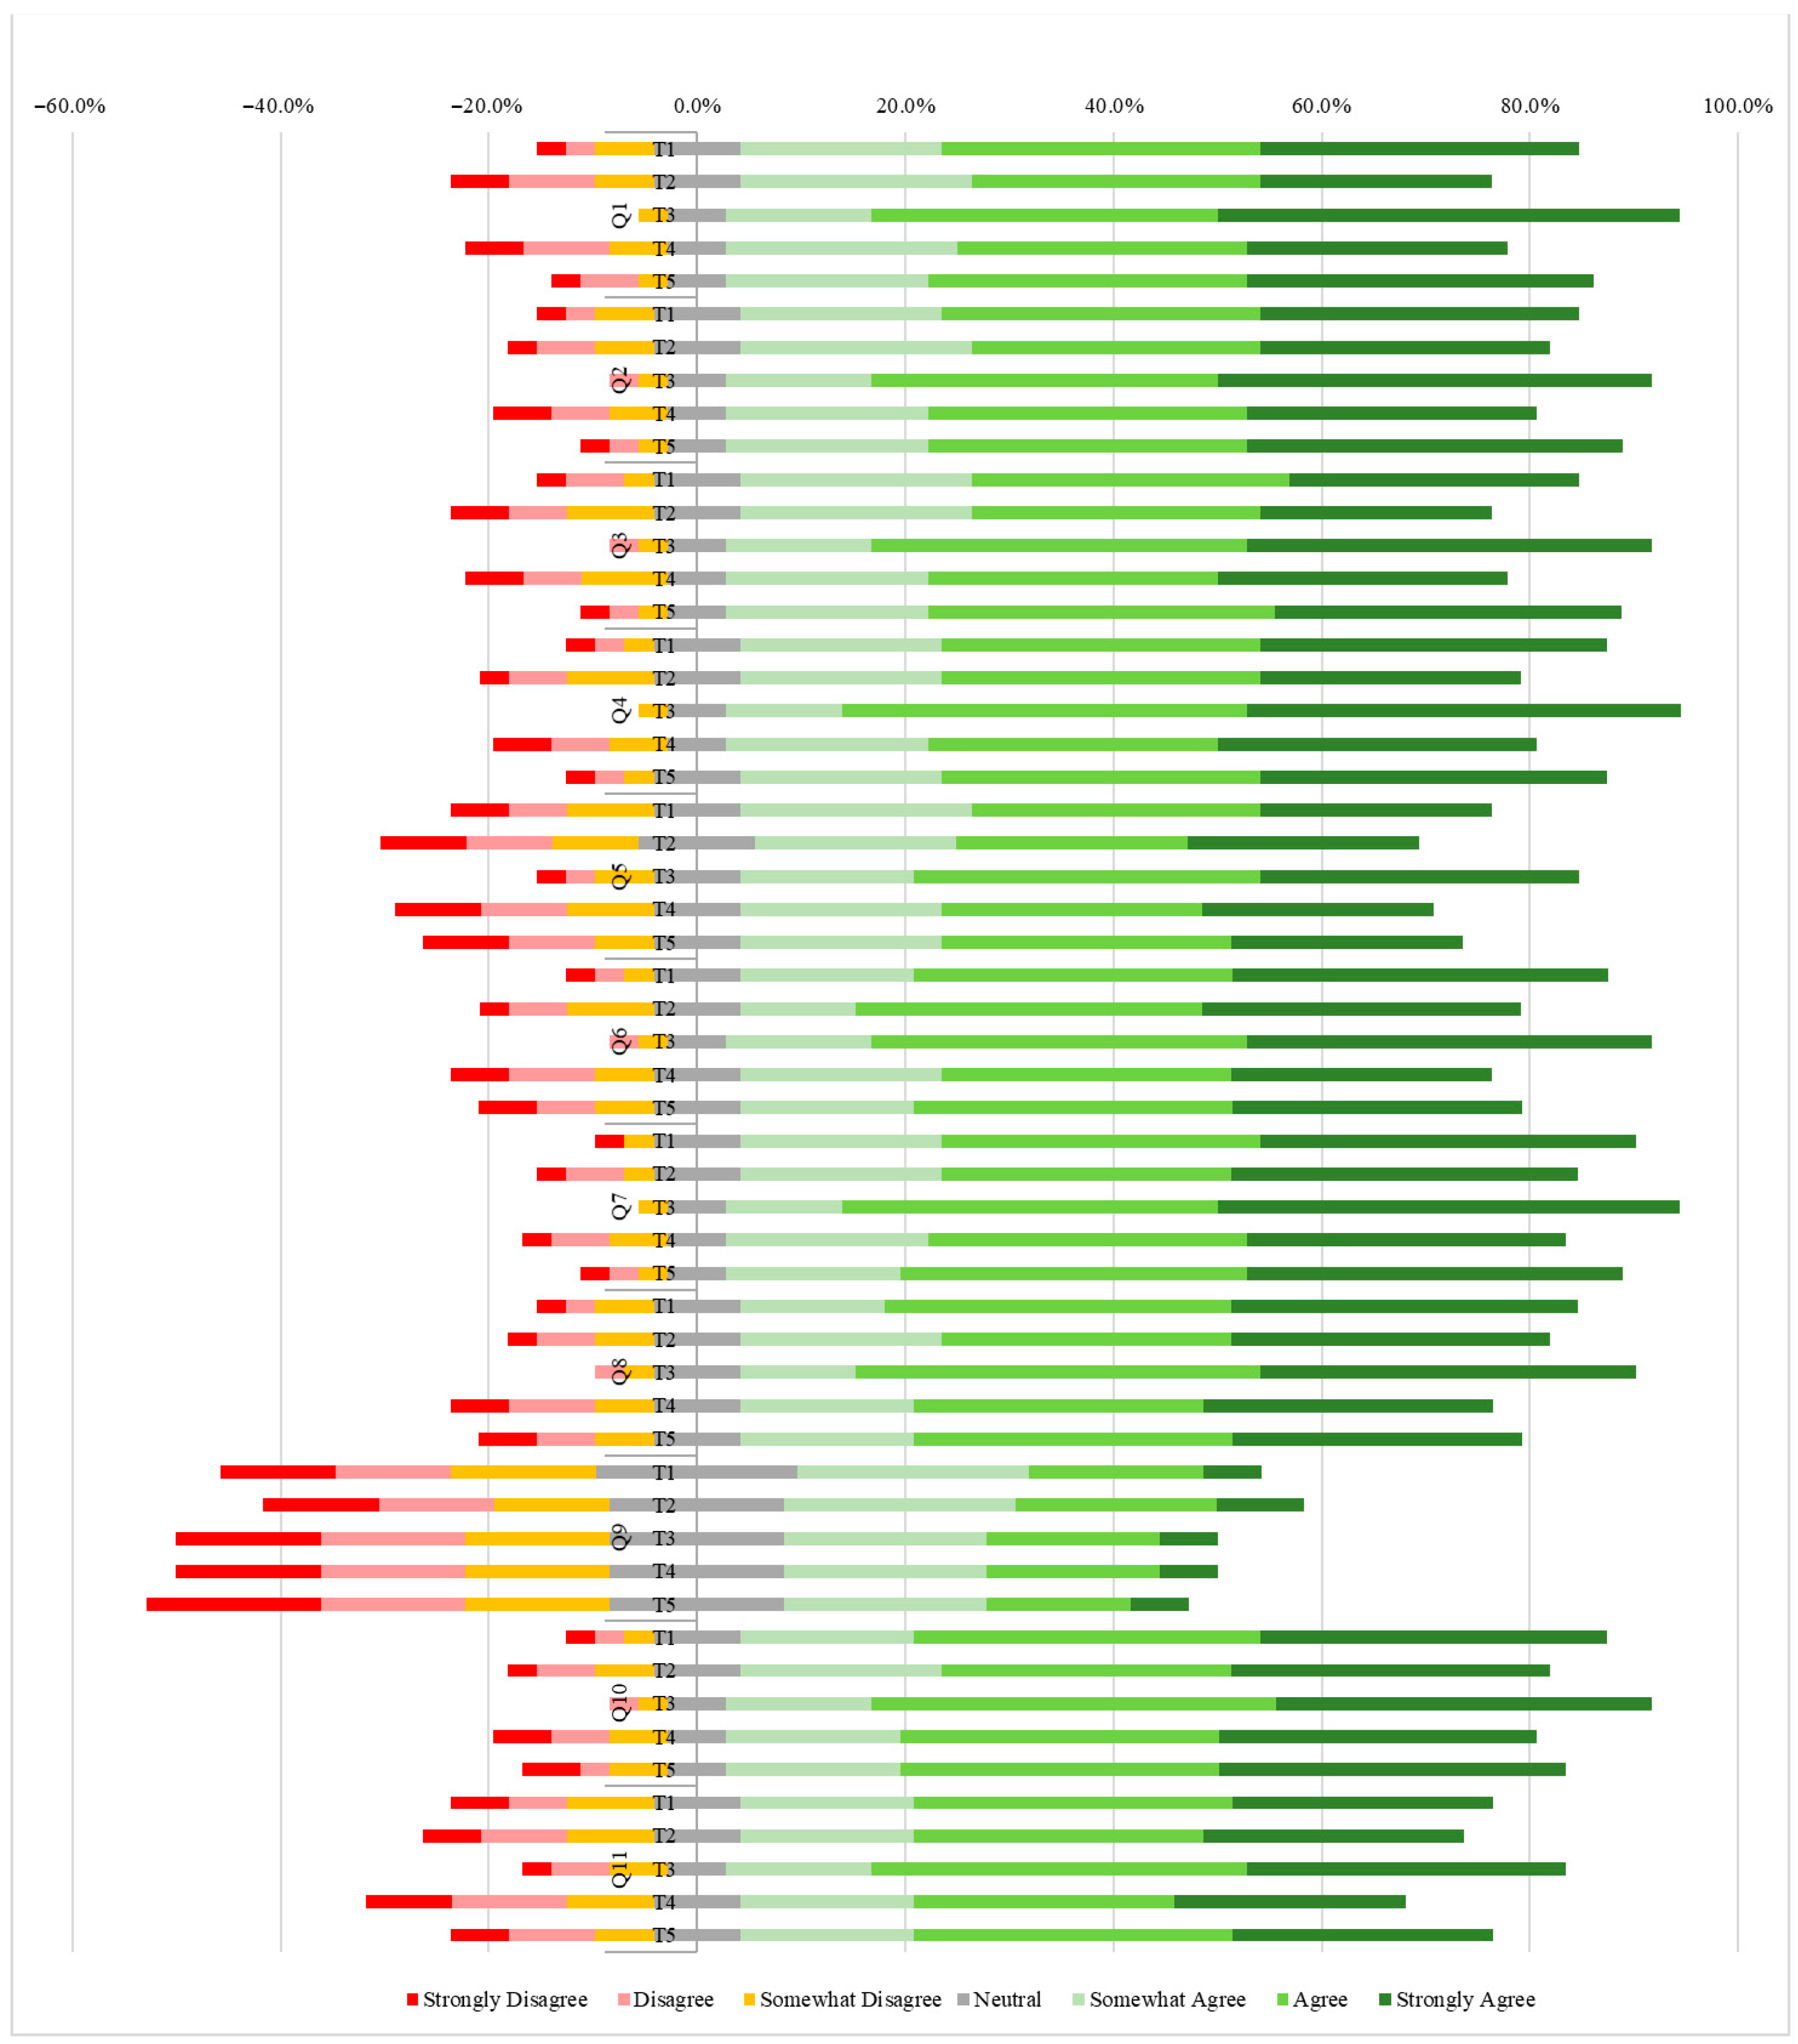
Figure 4 provides the raw response distributions for all UTAUT items as well as technologies with a holistic picture of where students placed themselves on the 7-point Likert scale. This picture-in-picture frame captures the context for the later boxplots in that, for example, the majority of responses congregate around the ‘Agree’ as well as ‘Strongly Agree’ category but Anxiety items under Category 5-Question 9 maintain more spread. The figure also addresses RQ1 through results linked to the six UTAUT analytical questions (AQ1–AQ6).
Figure 5,
Figure 6,
Figure 7 and
Figure 8 as a group describe how students assessed the five surveying technologies by means of the UTAUT framework. A preliminary descriptive review of the boxplots suggested broadly similar acceptance patterns across the five tools. Because inferential analyses in this study were conducted at the category level, no aggregated “overall acceptance” score was statistically tested. However, the Friedman results showed no consistent pattern of significant differences across categories, and the Dunn–Šidák comparisons further confirmed the absence of significant pairwise differences at this general level. Taken together, the descriptive and inferential evidence indicate that students perceived the technologies as similarly acceptable when viewed in a broad, overall sense.
Nevertheless, a disaggregate examination at each UTAUT category showed a more differentiated profile. Friedman tests on category-level scores identified significant differences across specific UTAUT dimensions, indicating that student perceptions varied depending on the construct being examined, for example, ease of use or social influence. These category-specific distinctions are further illustrated in the following figures and detailed through the corresponding Dunn–Šidák post hoc comparisons.
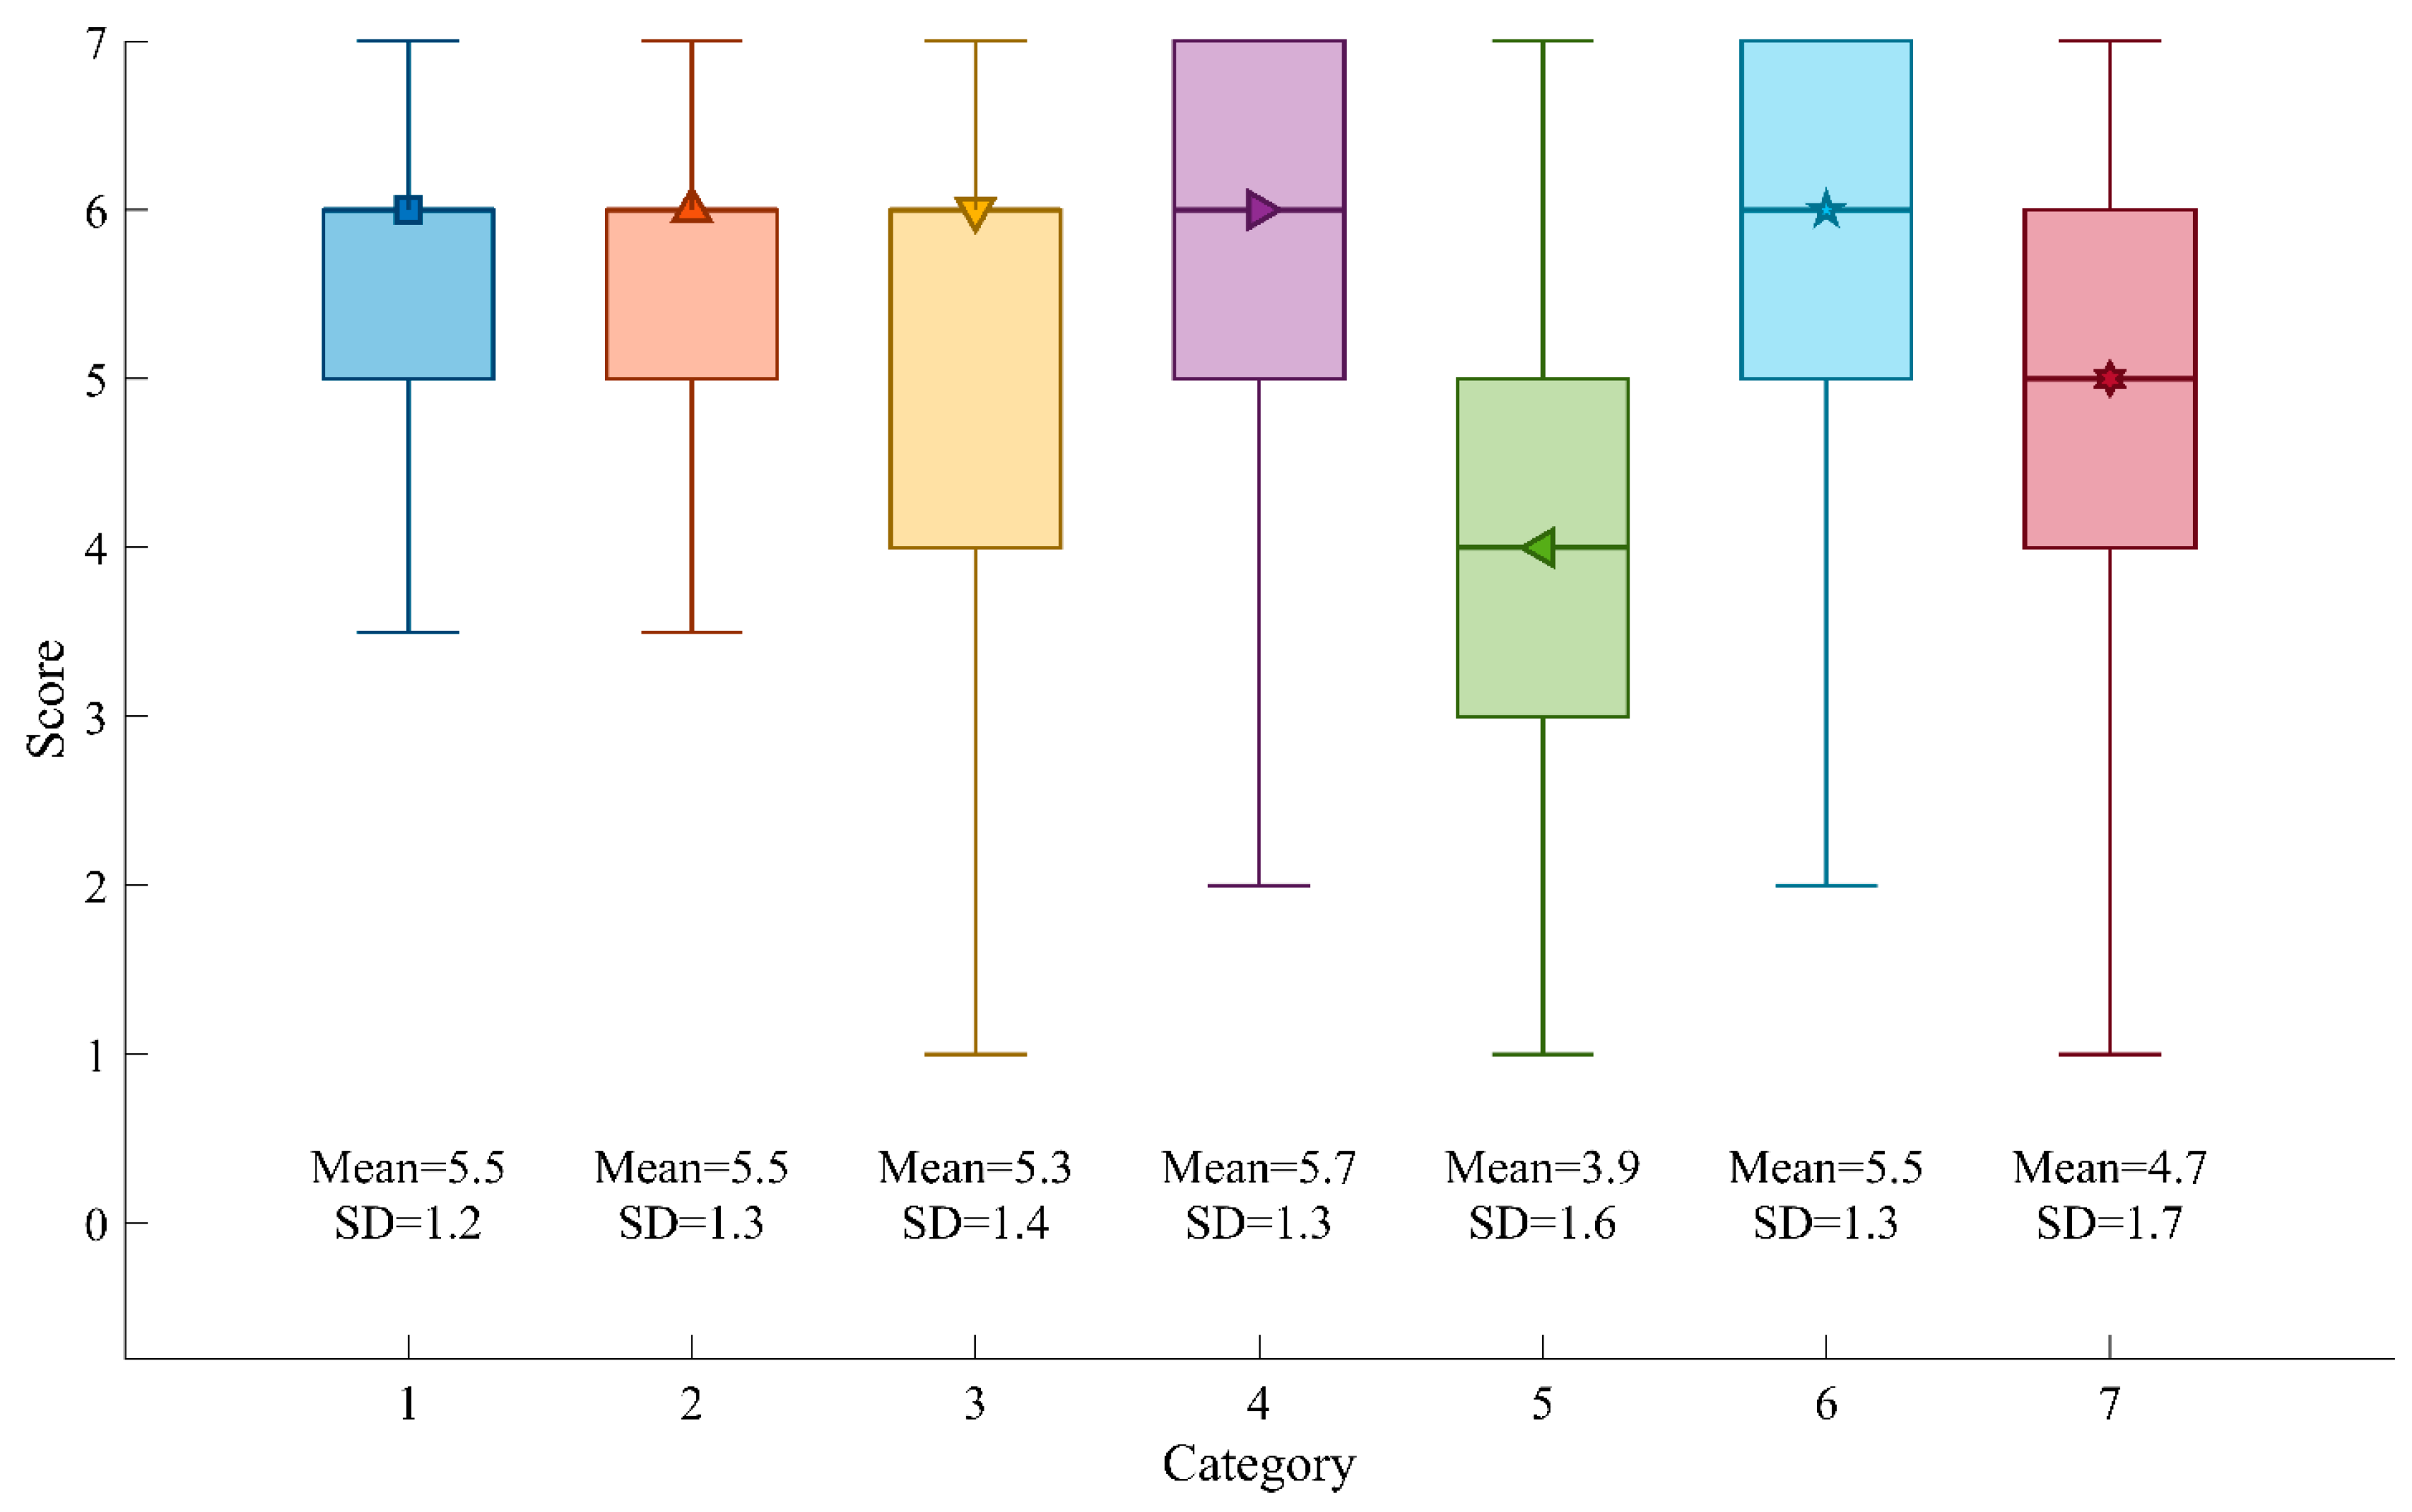
Figure 5 UTAUT Boxplots by Category gives a dimensional focus where clear patterns emerge across the seven UTAUT constructs. These patterns, together, cover AQ1–AQ6. Category 1-Performance Expectancy (usefulness perception) and Category 6-Attitude Towards Use-registered the highest median values for all technology types, indicating students perceived these tools to be useful and pleasant to use, aligning with AQ1. Category 2-Effort Expectancy (ease of use)-and Category 7-Behavioral Intention-also grouped heavily in the highest region of the scales, indicating students saw these tools to be easy to use, with expectations to utilize other such technology in the future, aligning with AQ2 and AQ6. Category 3-Social Influence-and Category 4-Facilitating Conditions-registered moderate to high values with varying levels, indicating ambivalence on perceptions concerning industry expectations and support, aligning with AQ3 & AQ4. Category 5-Anxiety-recorded the lowest values on each type, with consistency, indicating some level of concern due to their perceived complexity with scope for error, in these tools, aligning with AQ5. Overall, these provide a combined explanation regarding students’ acceptance levels for each of these six analytical questions.
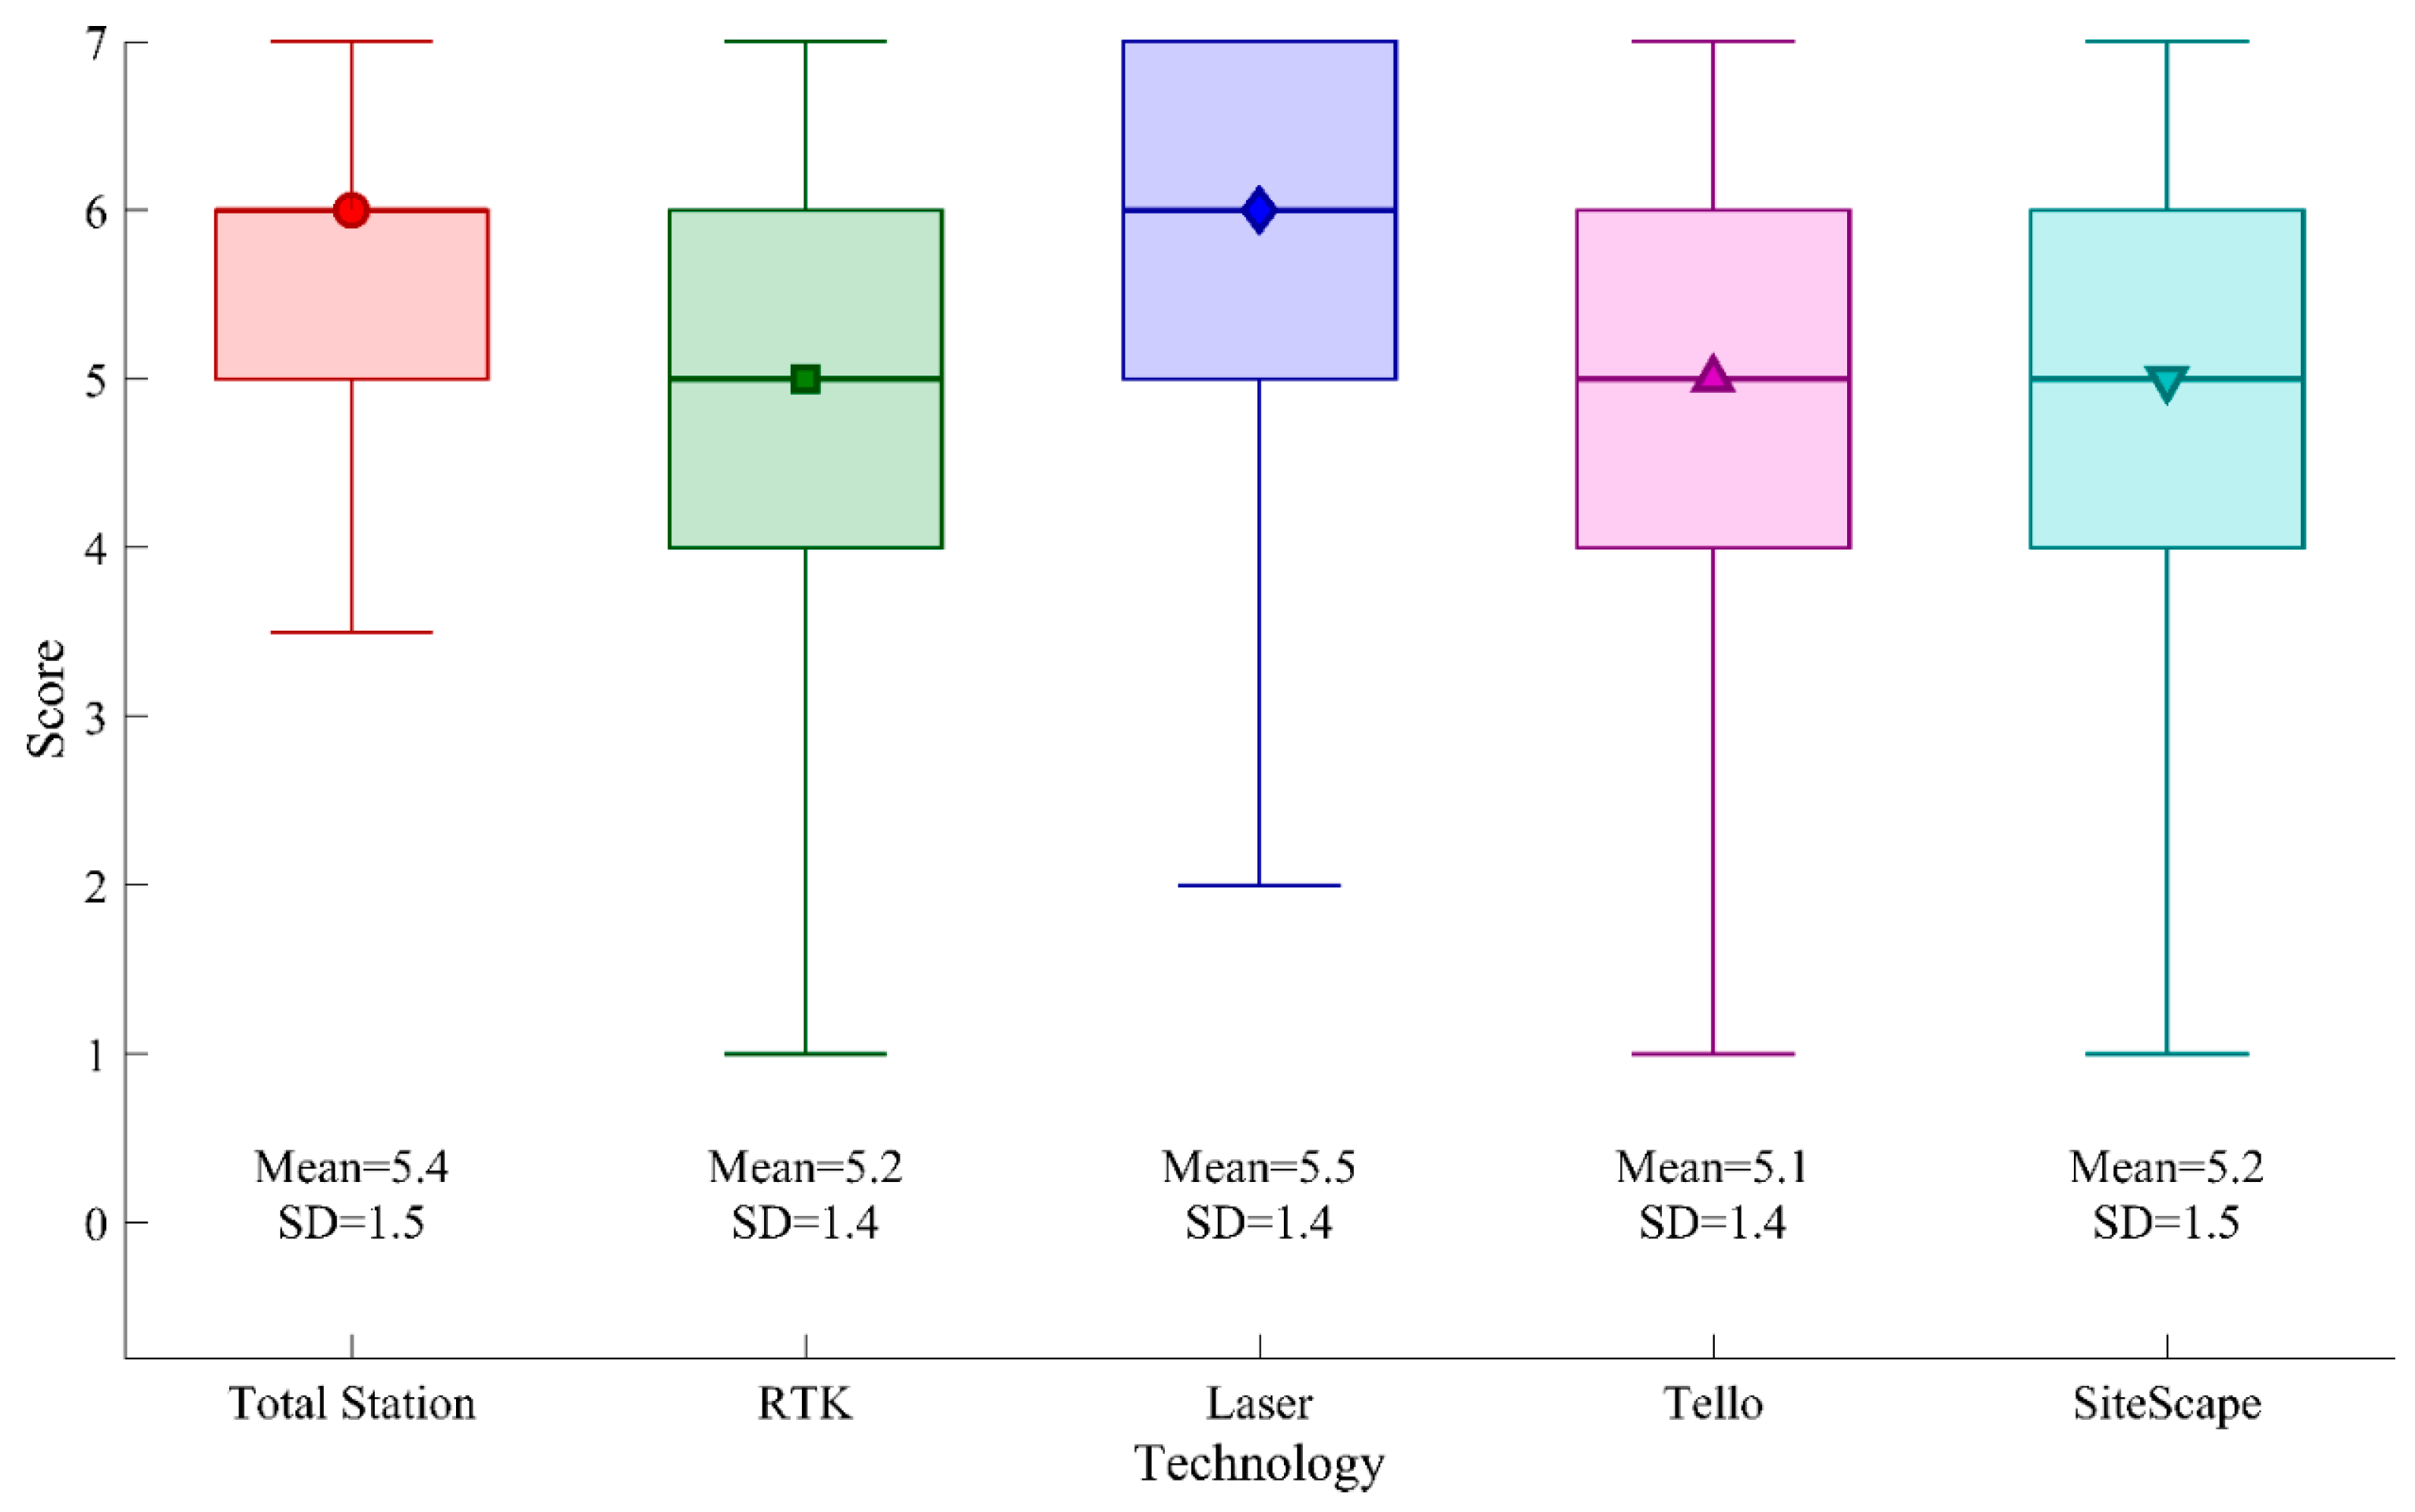
Figure 6 UTAUT Boxplots by Technology offers an important tool-centric perspective on the acceptance data. An overriding super-pattern is that the individual technologies were rated relatively highly, indicating that, overall, the reception was positive. But the variance in the clustering of the data holds significant implications for student familiarity and confidence.
The Total Station shows a remarkably compact group with extremely short whiskers, consistently on the top-left corner of the scale. This consistency indicates high student confidence.
The BLK360 Laser Scanner ends up with a strong median score that even matches or exceeds the Total Station in agreement with its perceived value. Nonetheless, its cluster ends up being significantly wider. This trend reflects our second observation: students knew its promise as an easy-ride fast solution (thus the strong median for attributes such as Performance and Effort Expectancy). This brief but intensive exposure likely resulted in varied confidence levels, reflected in more variable scores.
The RTK Drone, Tello Drone, and iPad LiDAR (SiteScape) exhibit equally broad interquartile ranges and lengthy whiskers. This reflects an equal extent of diffused opinions and divergent experience with these three tools across the board. In the case of the RTK Drone, students saw its great usefulness but could not operate it hands-on, so they had diverse views as to how easy it was to use. In the case of consumer-level Tello Drone and iPad LiDAR, the technologies showed broad Interquartile Range (IQRs) and longer whiskers, indicating more varied perceptions among students.
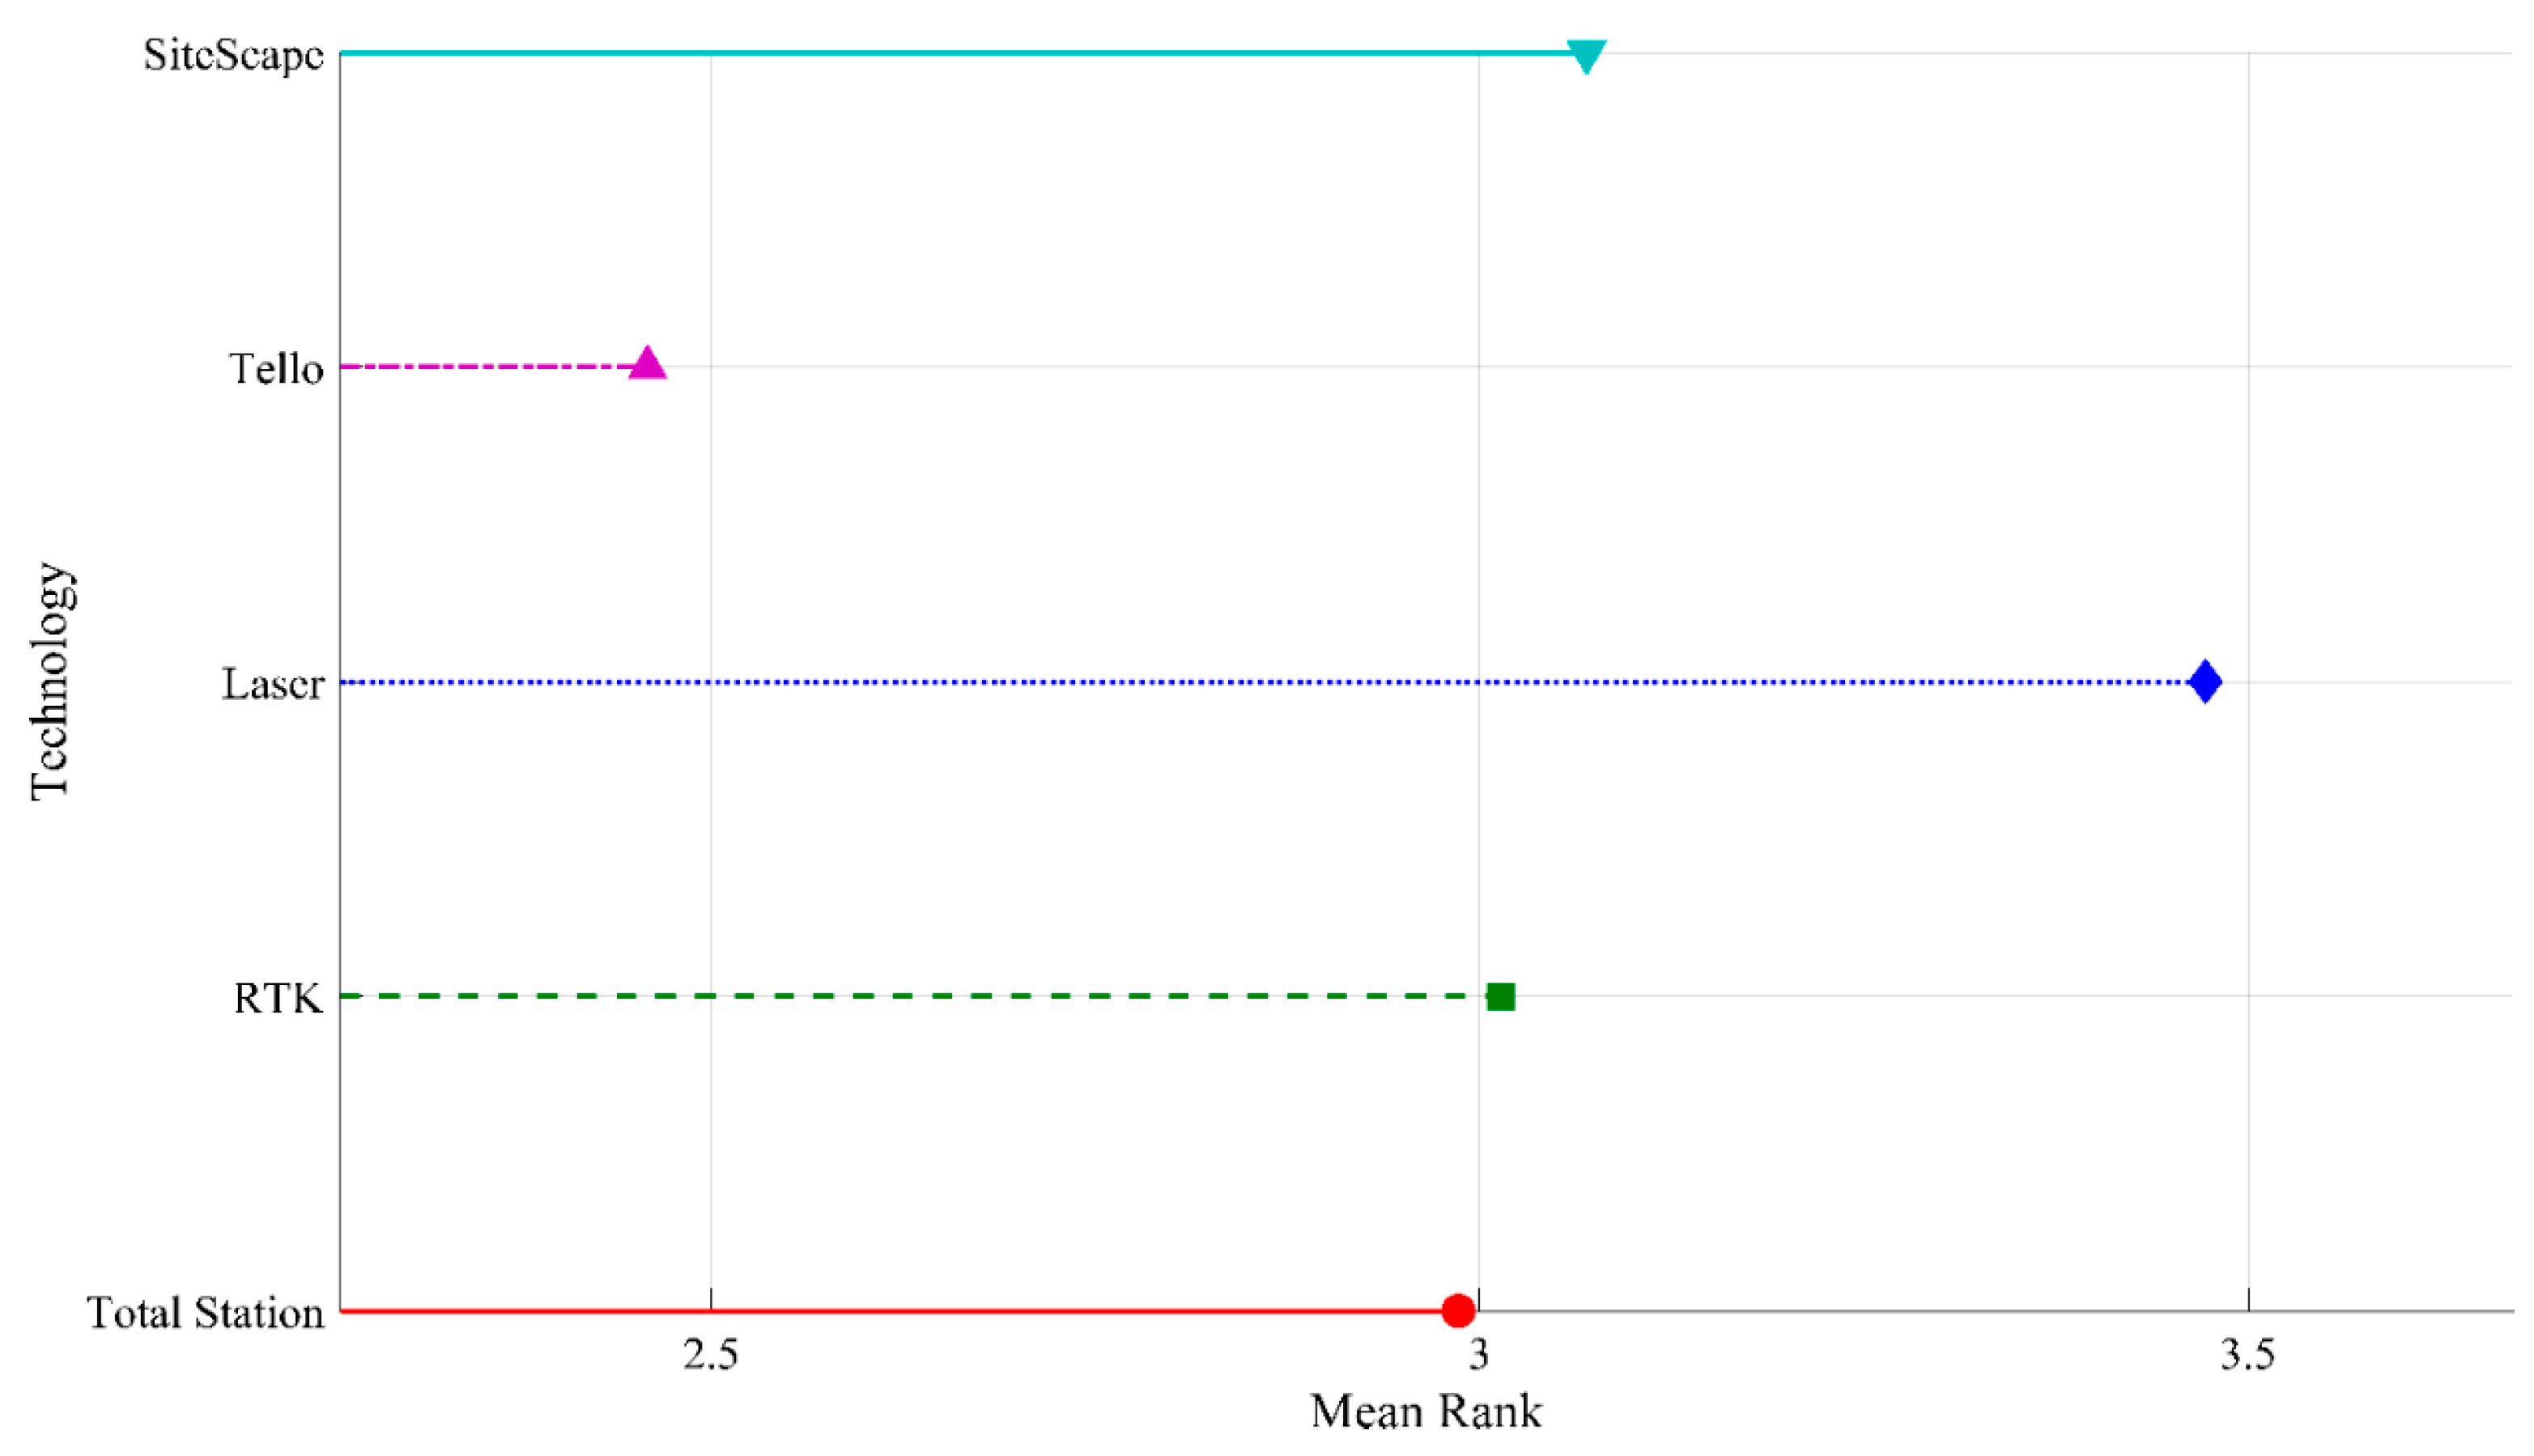
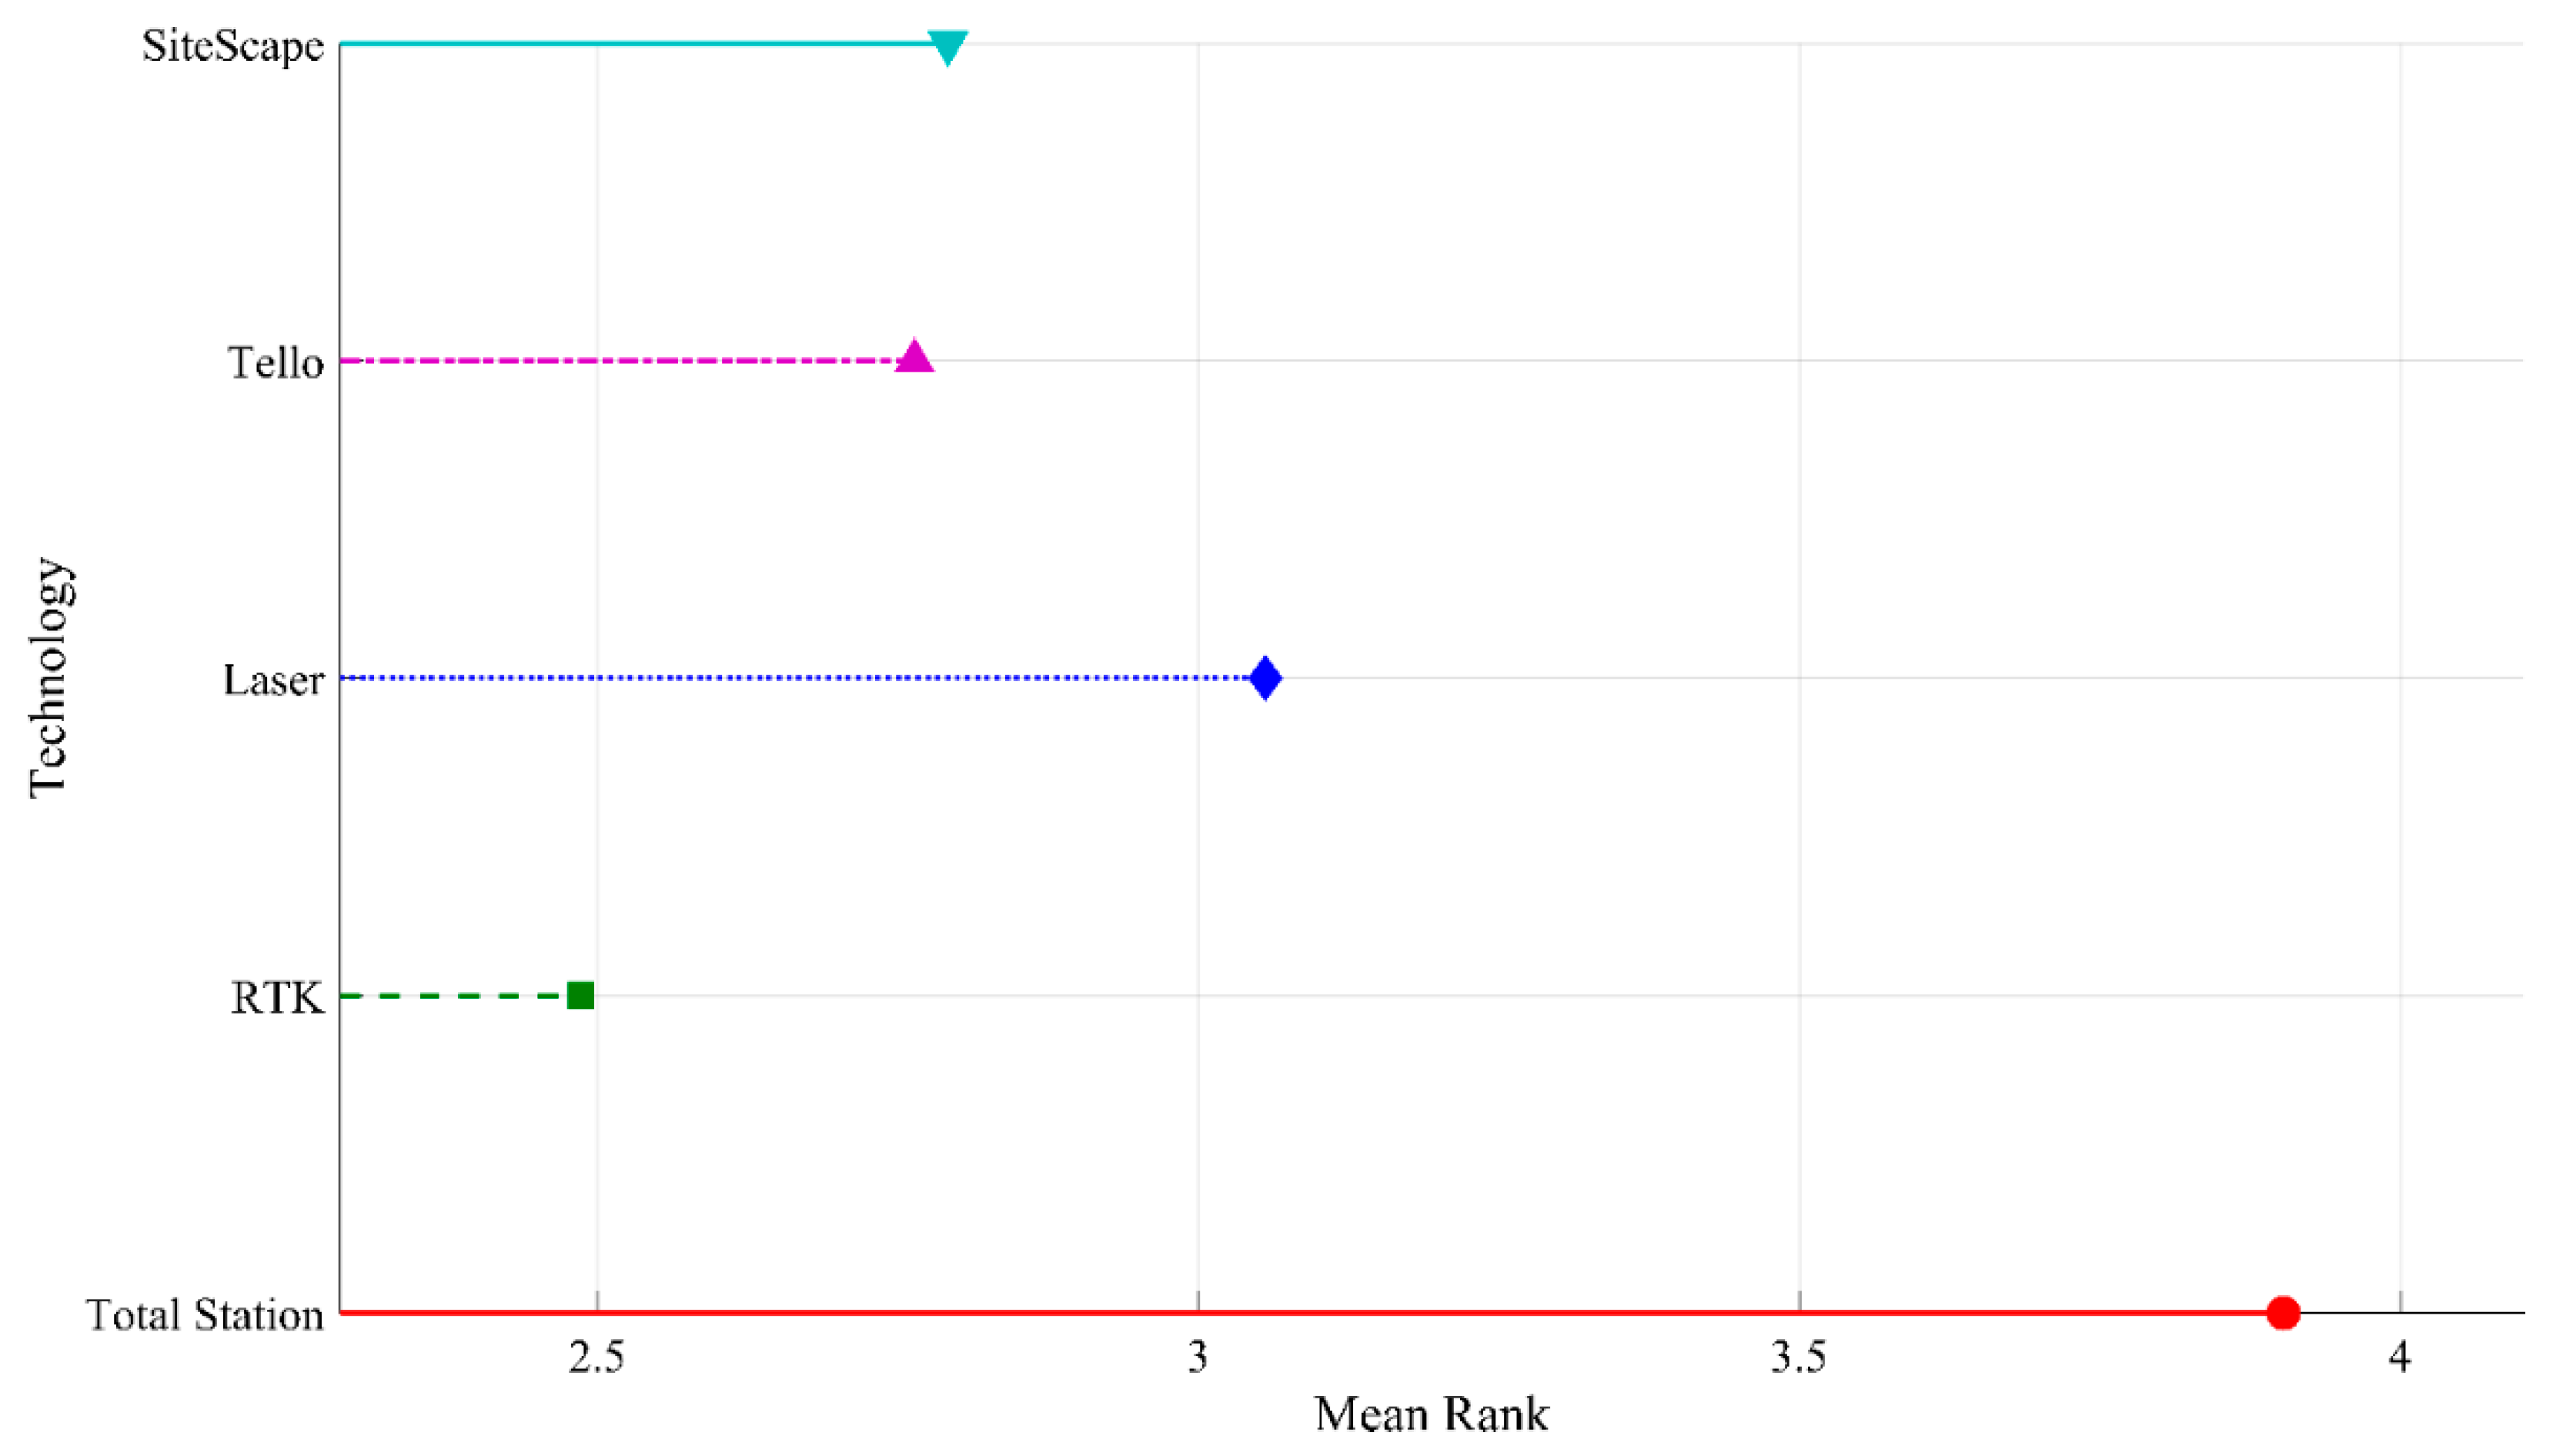
Friedman mean rank lollipop chart (
Figure 7) presents a straightforward non-parametric ranking of the technologies by their cumulative UTAUT scores. There was the highest mean rank for the Laser Scanner indicating it was best received technology of all. It had the lowest mean rank for the Tello Drone indicating it was the least accepted. The remaining three technologies (RTK Drone, Total Station, Total Station, iPad LiDAR) bunched together toward the center of the chart with comparable ranks.
Post hoc Friedman tests using Dunn-Šidák comparisons determined some significant pairwise differences between technologies by certain UTAUT categories. Those findings most directly relevant for education researchers are summarized as follows in
Table 6:
No other pairwise differences statistically significant at the 0.05 level were located in the rest of the UTAUT categories (Category 1-Performance Expectancy, Category 5-Anxiety, and Category 6-Attitude Toward Use) for the data set.
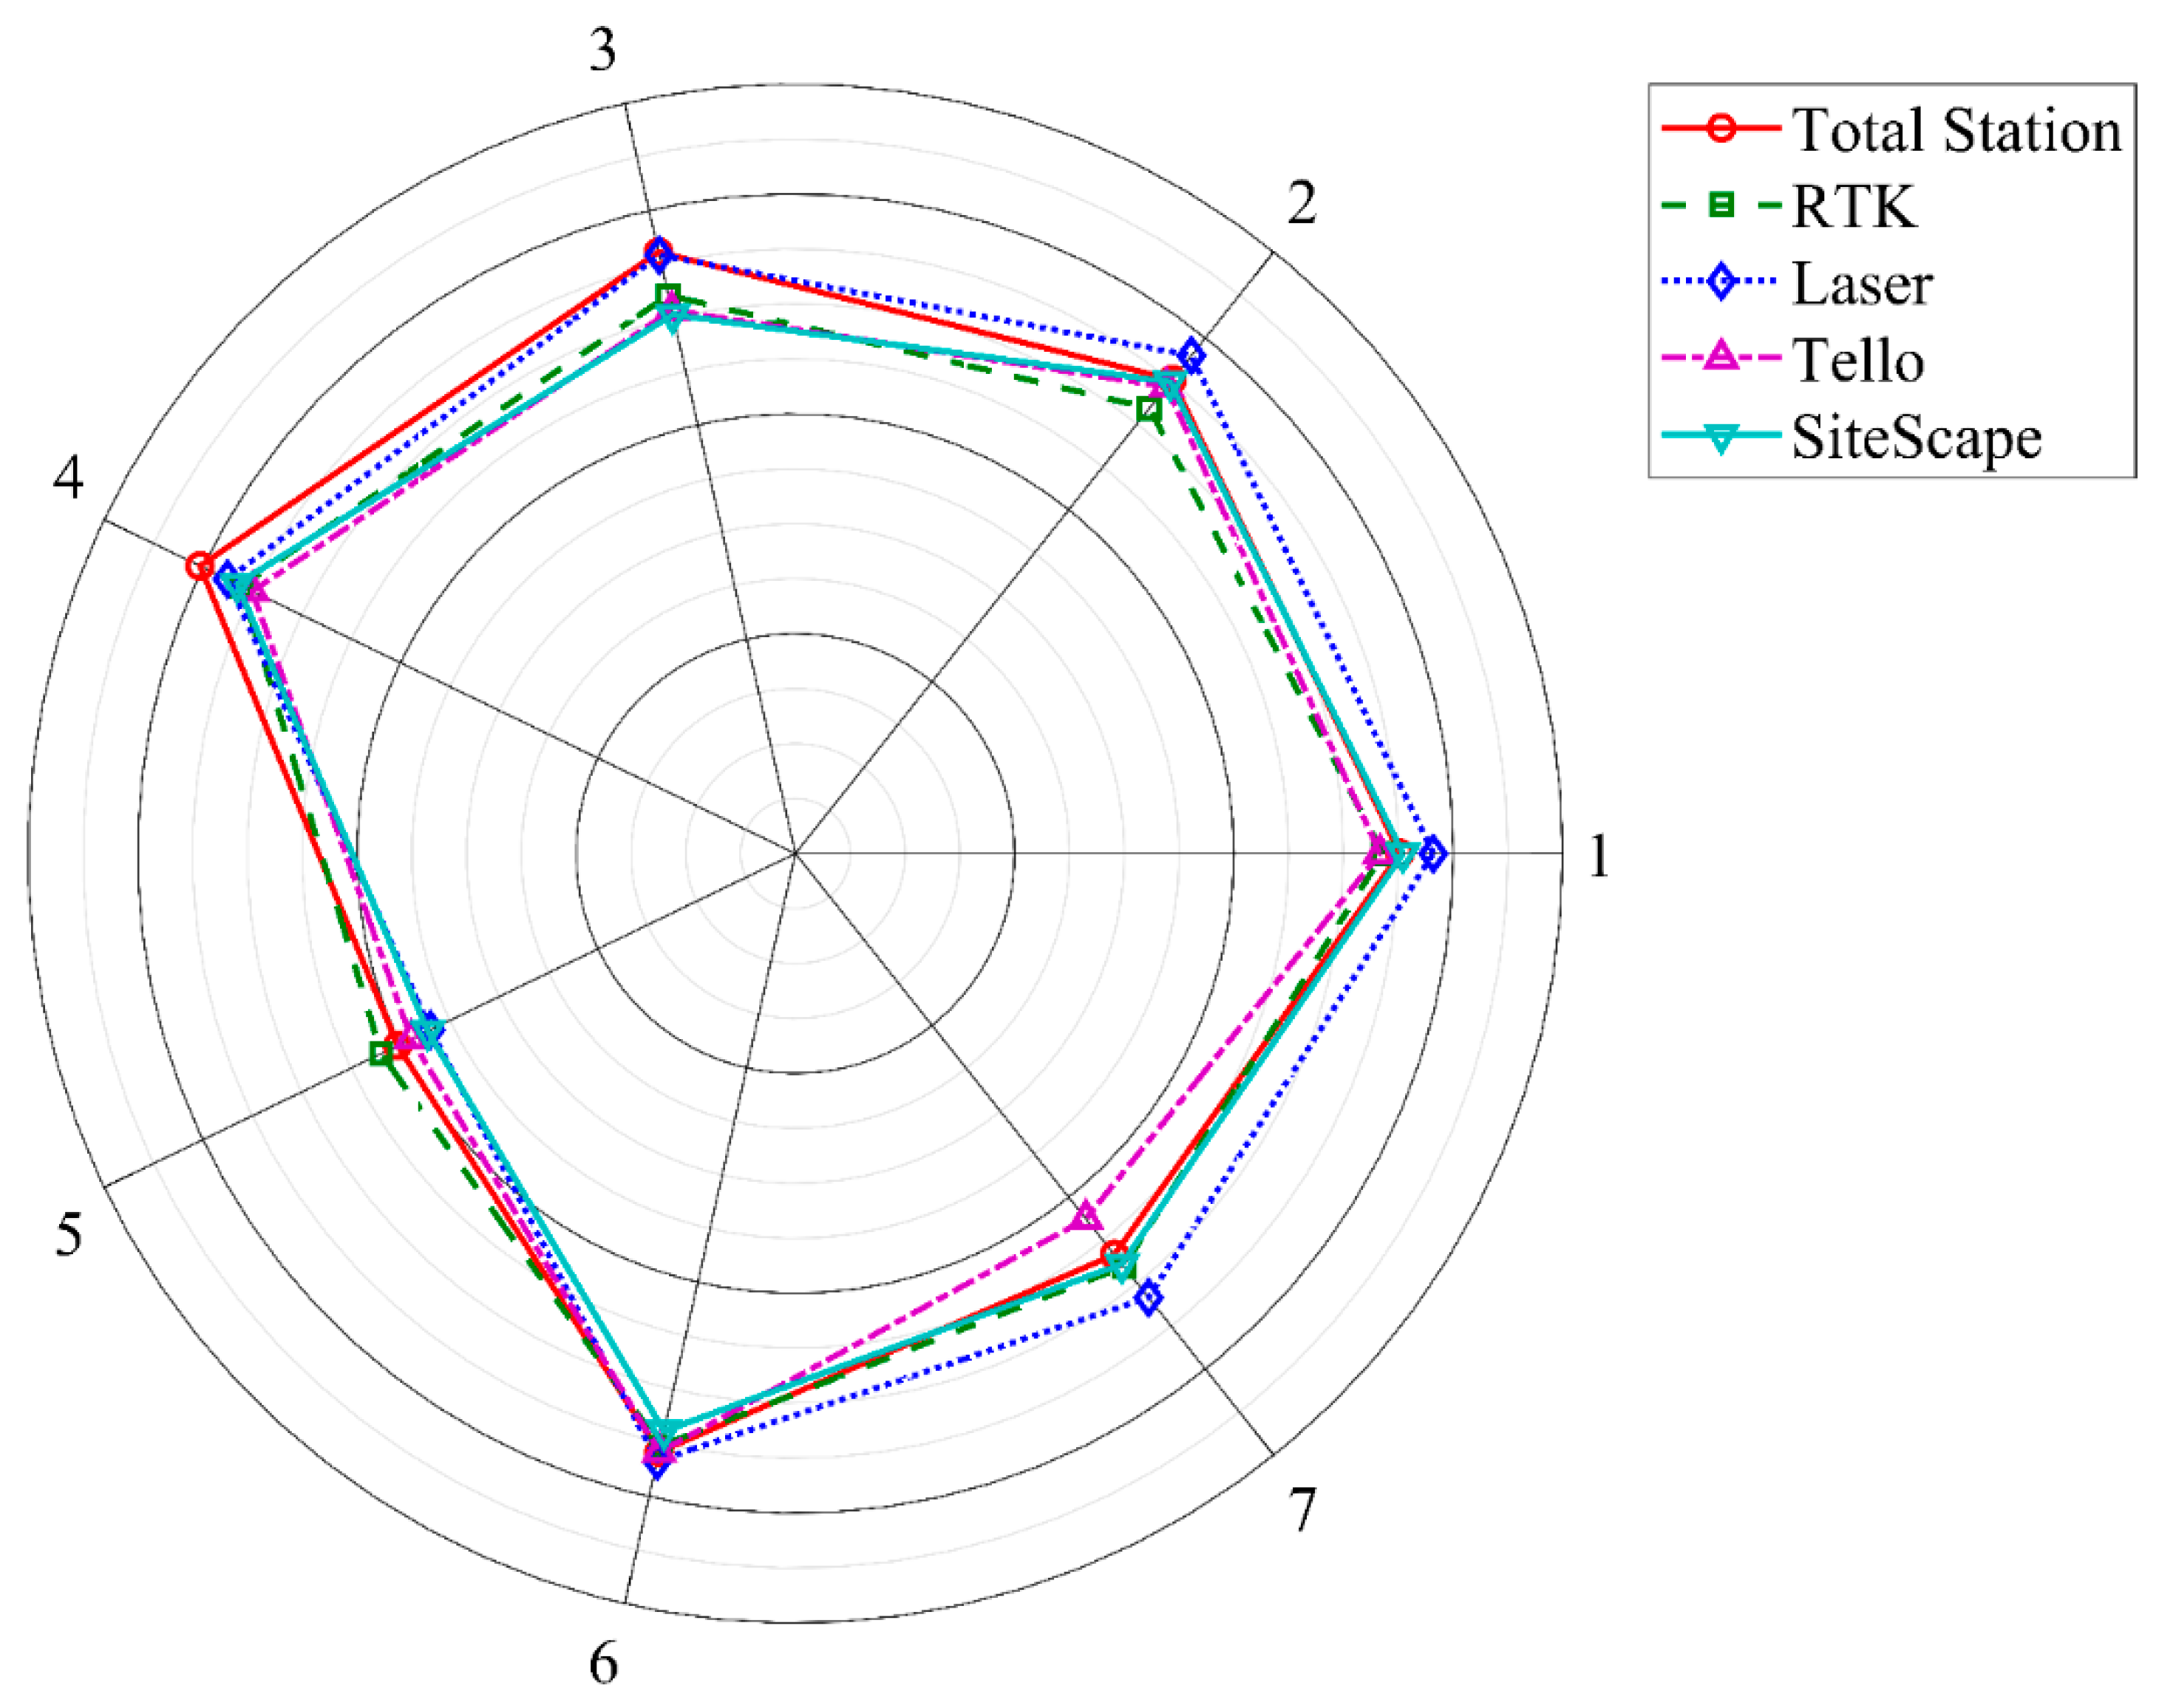
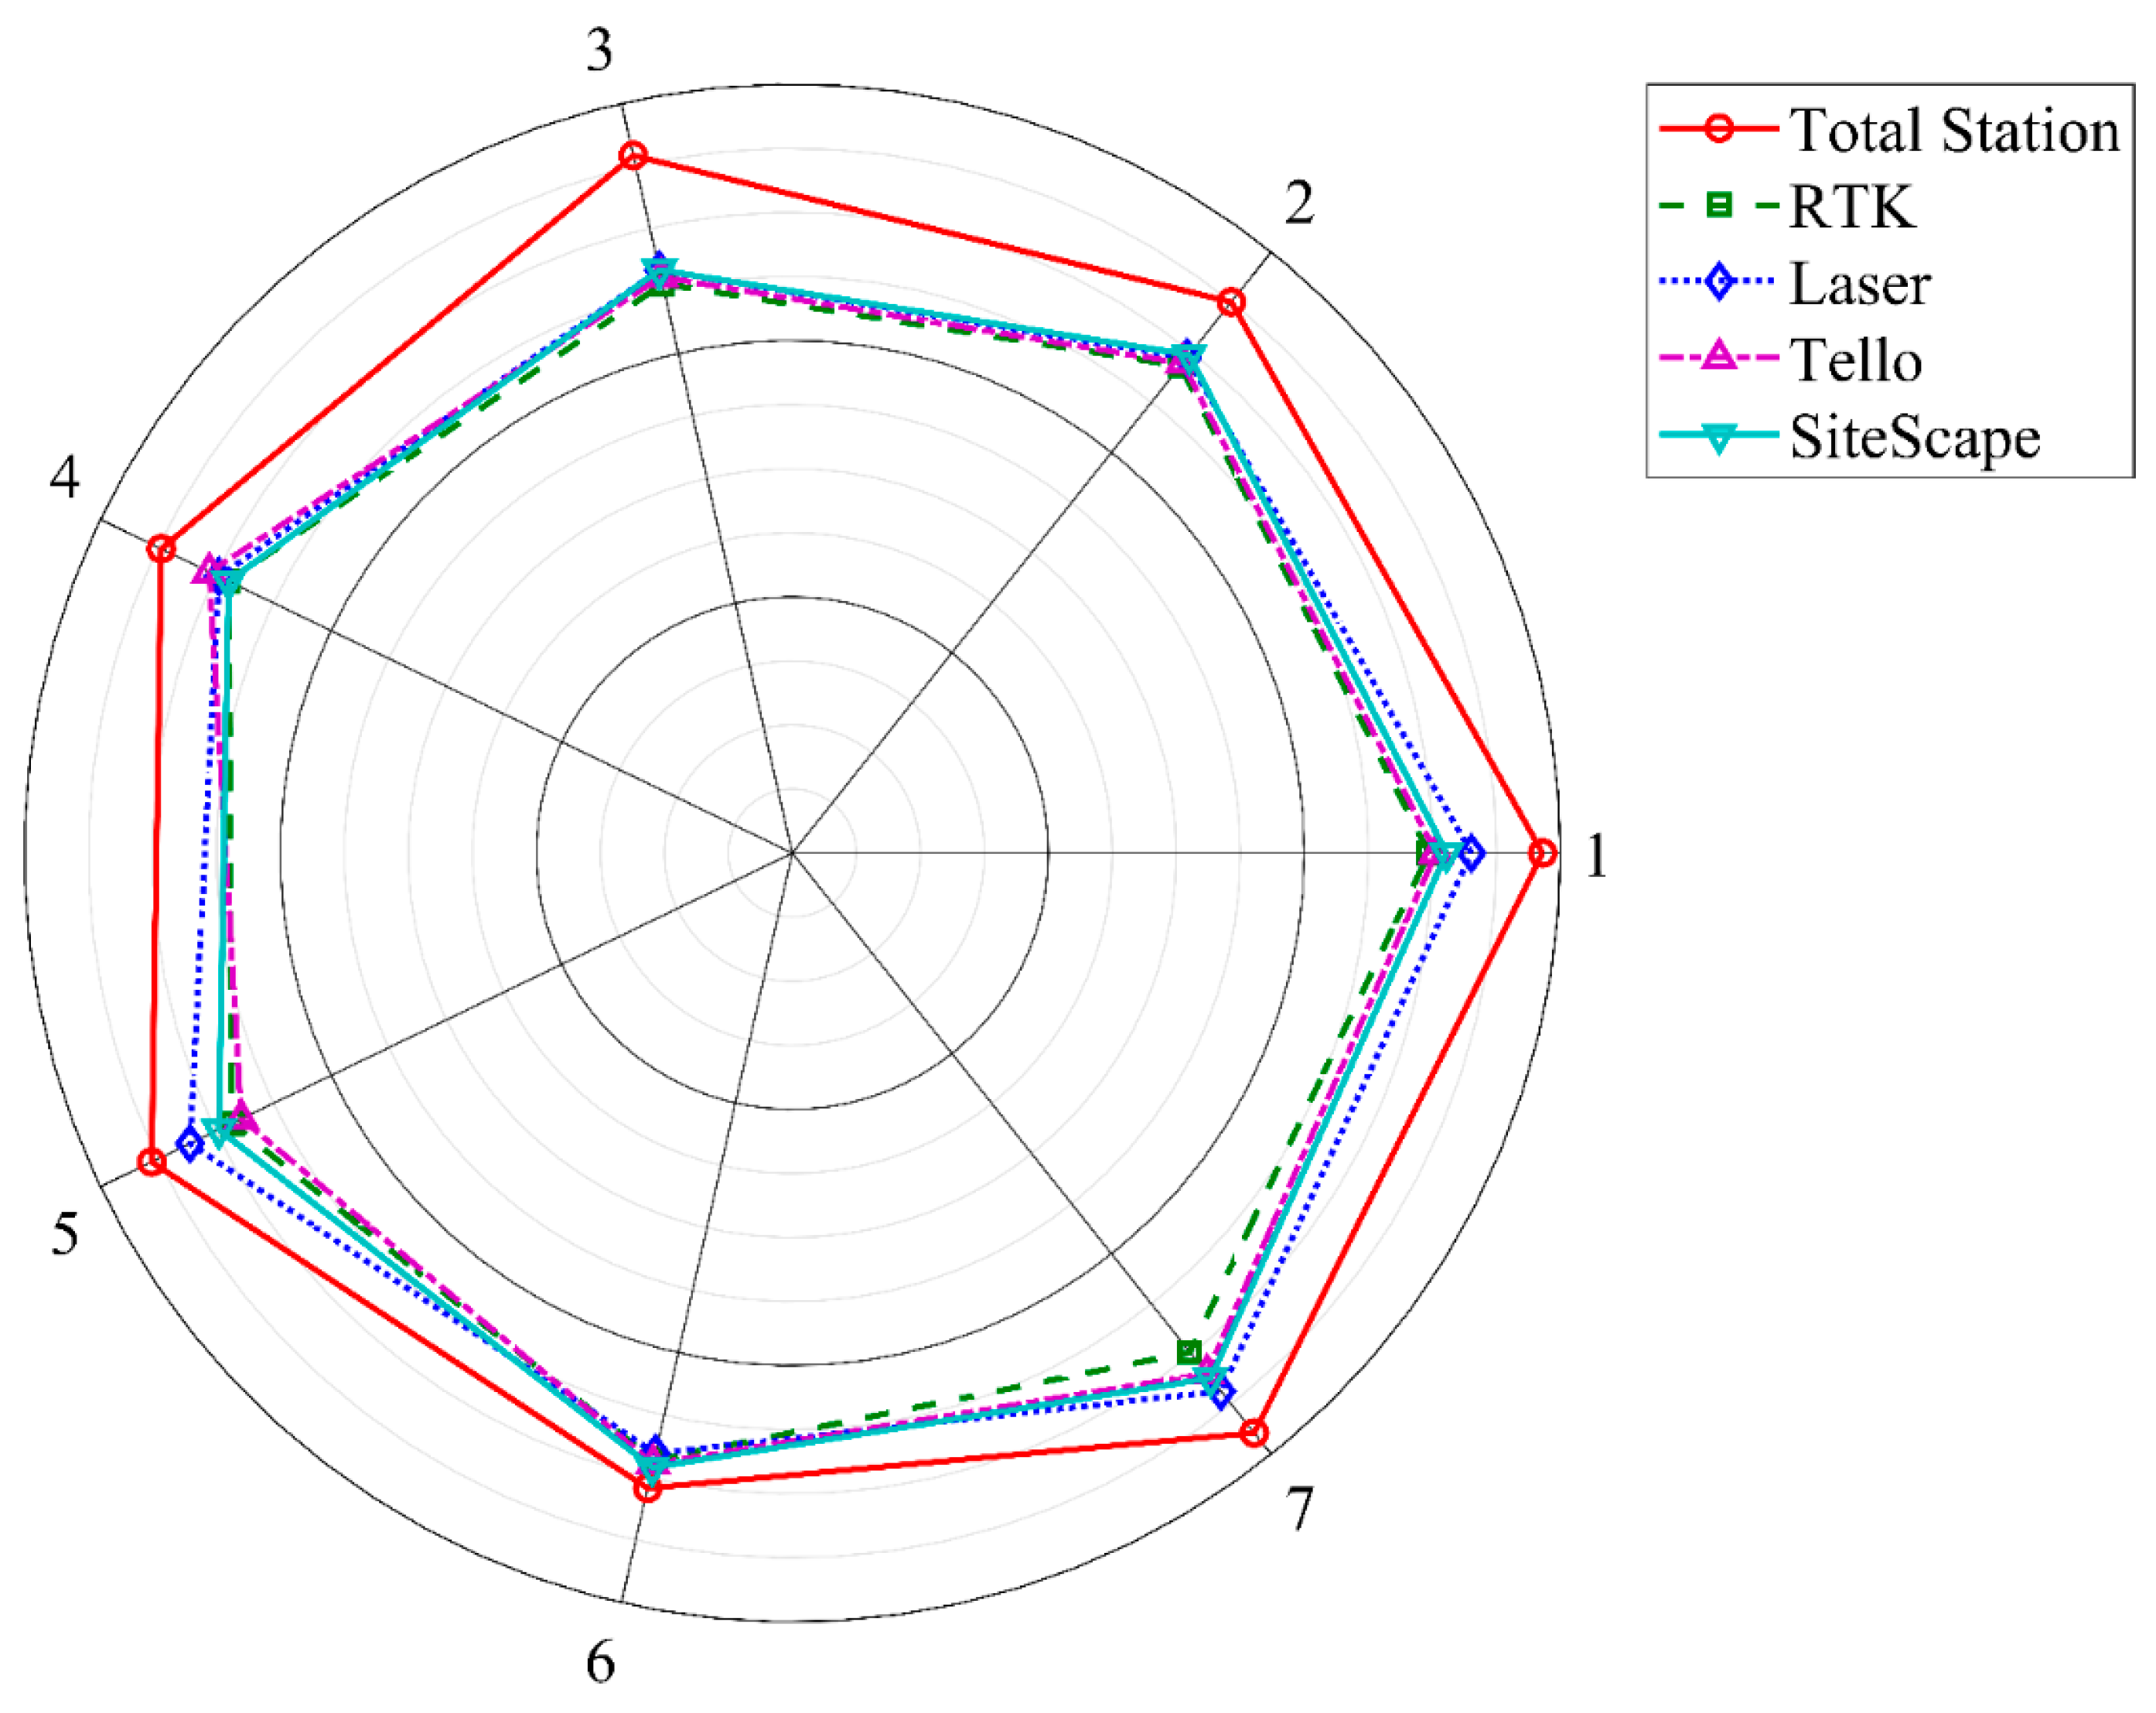
Lastly, the radar chart (
Figure 8) provides an integrated, multi-dimensional overview of each technology. It visibly demonstrates the Laser Scanner’s leadership, as its polygon covers the greatest area in the majority of the dimensions. Total Station’s polygon indicates clear strengths in Category 3-Social Influence and Category 4-Facilitating Conditions but weaknesses in Category 2-Effort Expectancy and Category 7-Behavioral Intention. It suggests that while students acknowledged its professional importance as well as the assistance it provided, they had less enthusiasm for it as well as less individual motivation for using it within the future compared to the Laser Scanner.
4.2. Perceived Learning Outcomes (Bloom’s Taxonomy)
Figure 9 provides the complete distribution of the responses for all items of Bloom’s for the five technologies. As was the case for the UTAUT outcomes, the distributions tend toward agreement but with differences between technologies. For instance, the responses for the Total Station (T1) cluster in the ‘Strongly Agree’ category, whereas those for the RTK Drone (T2) tend to vary more. It should be noted that this descriptive profile precedes the existence of statistically significant differences accessed in the later analysis.
The analysis of perceived learning outcomes based on Bloom’s Taxonomy showed large differences between the technologies. This was very different from the similar acceptance levels reported in the UTAUT study (
Section 4.1). Friedman tests showed clear differences in how students viewed each tool’s educational value. Some tools were considered more effective for building certain cognitive skills. That difference emphasizes the point that although students may accept a set of technologies generally, they draw sharp distinctions between them where they report on learning.
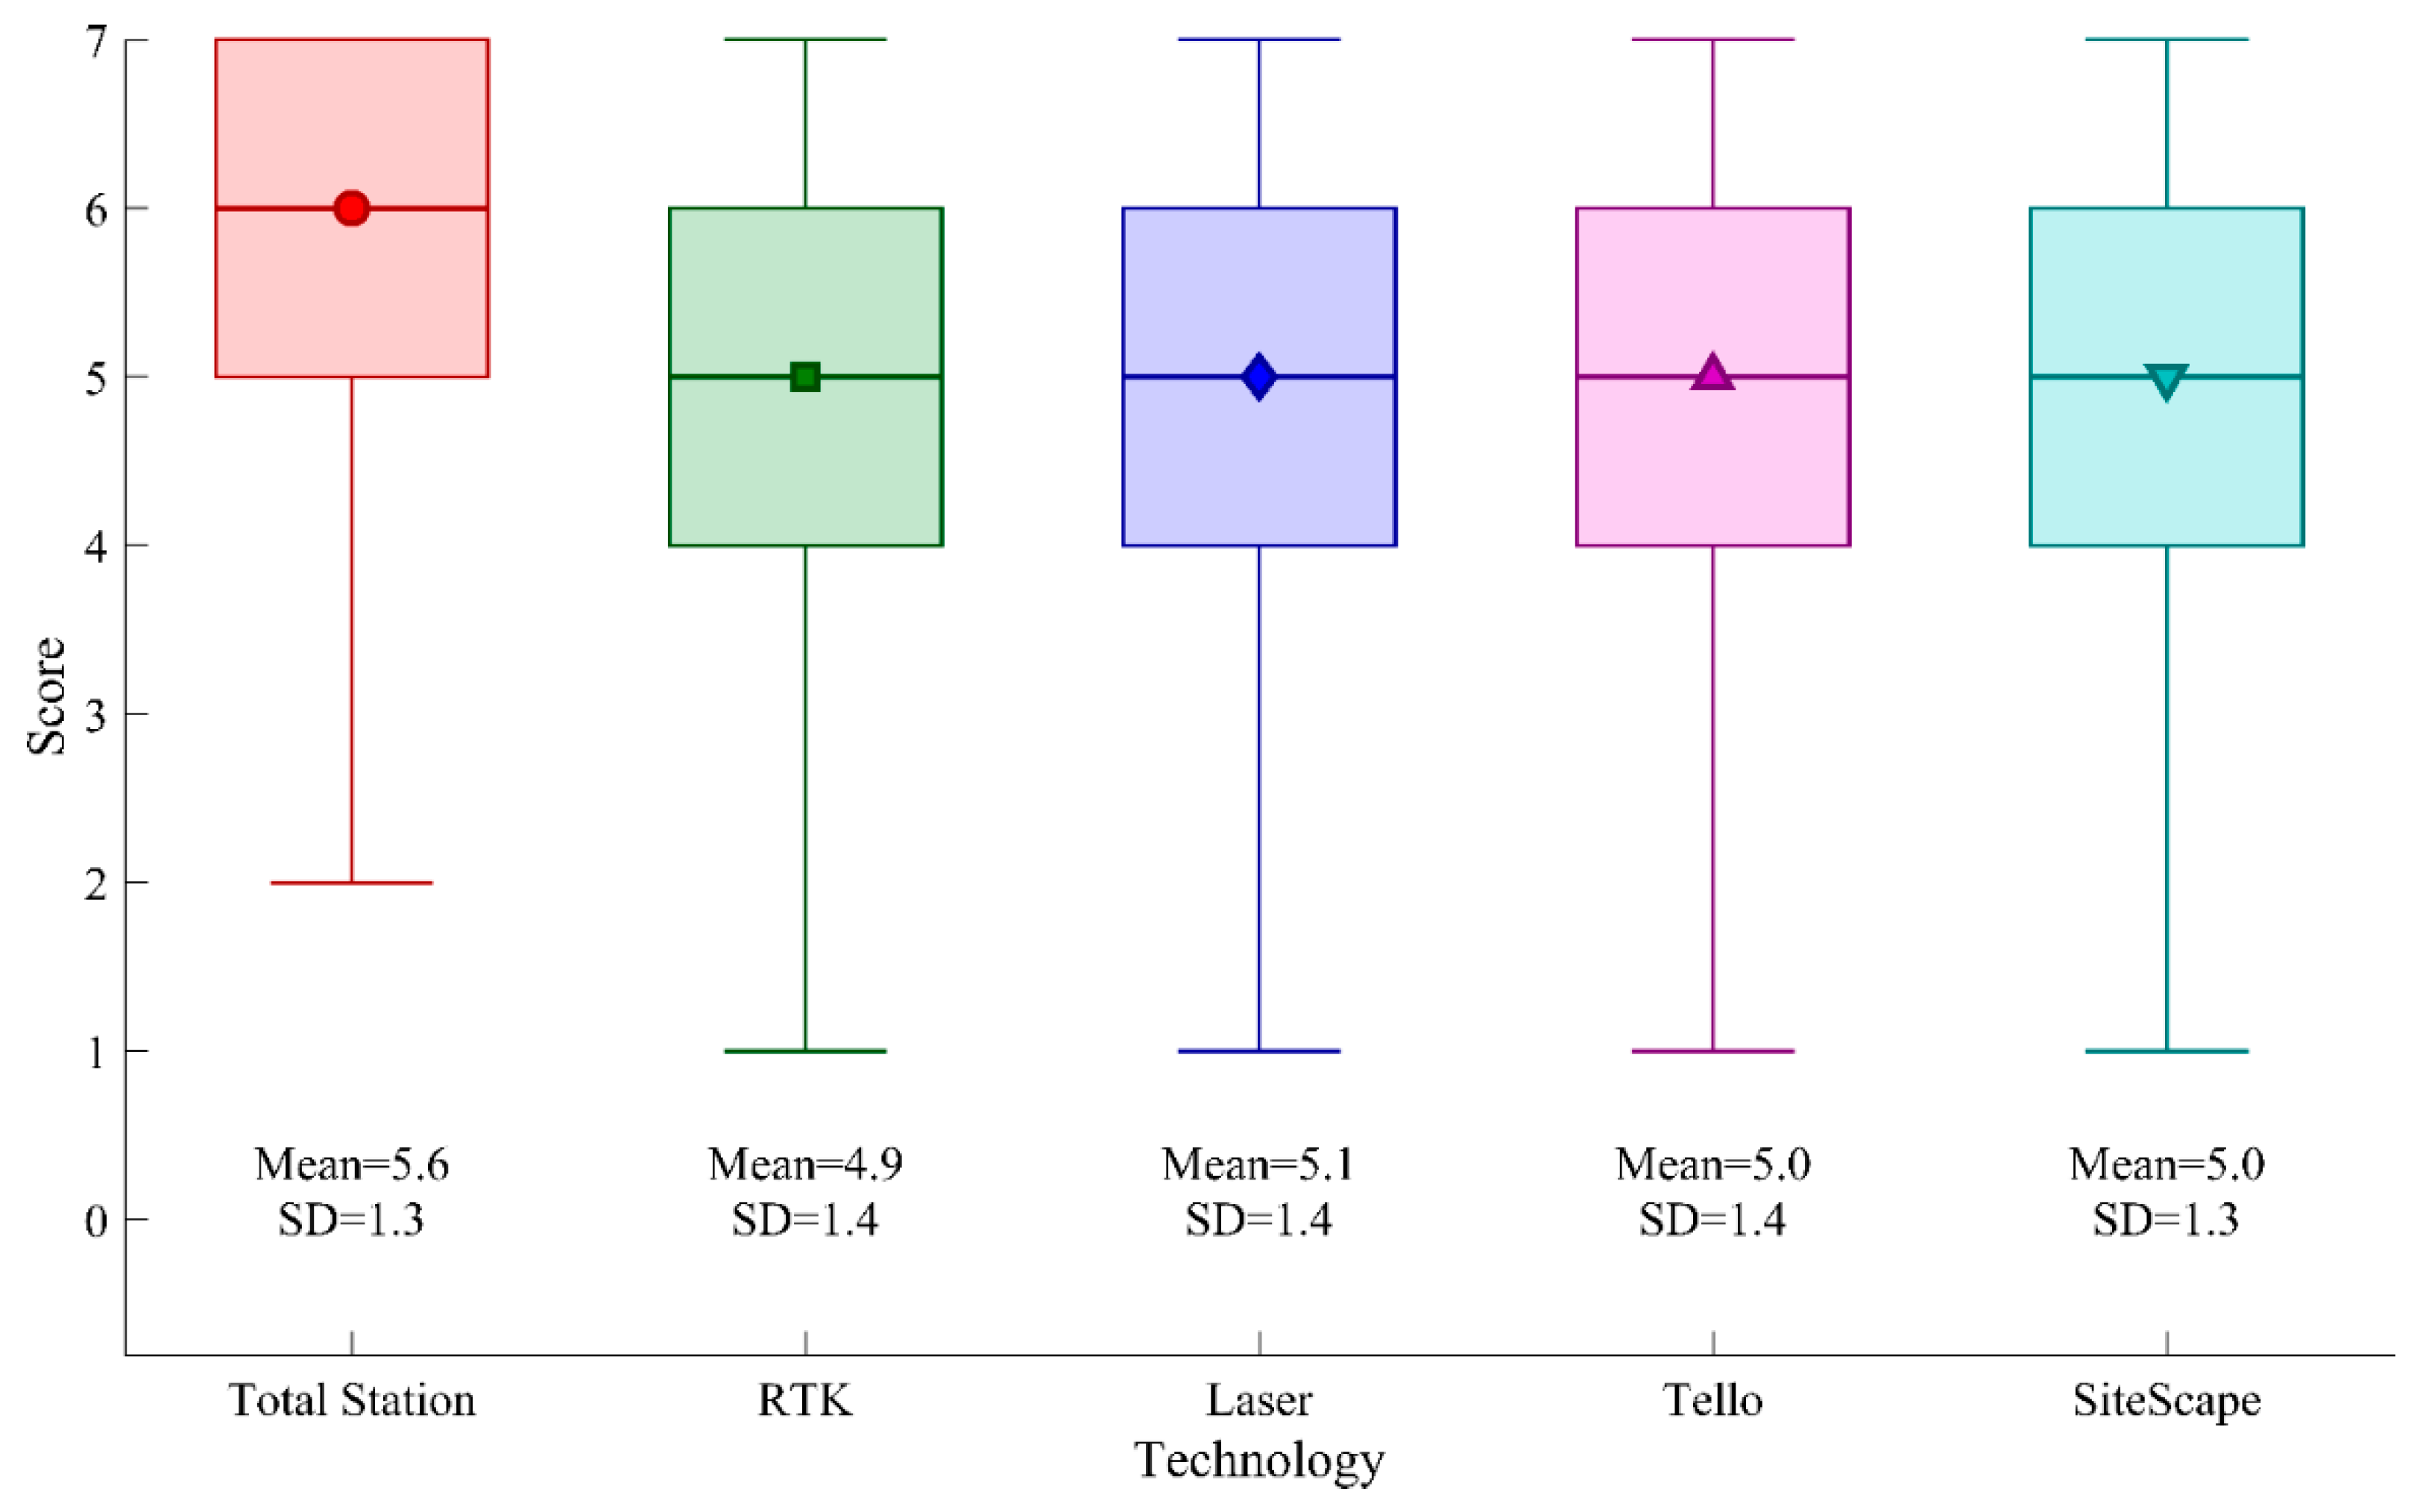
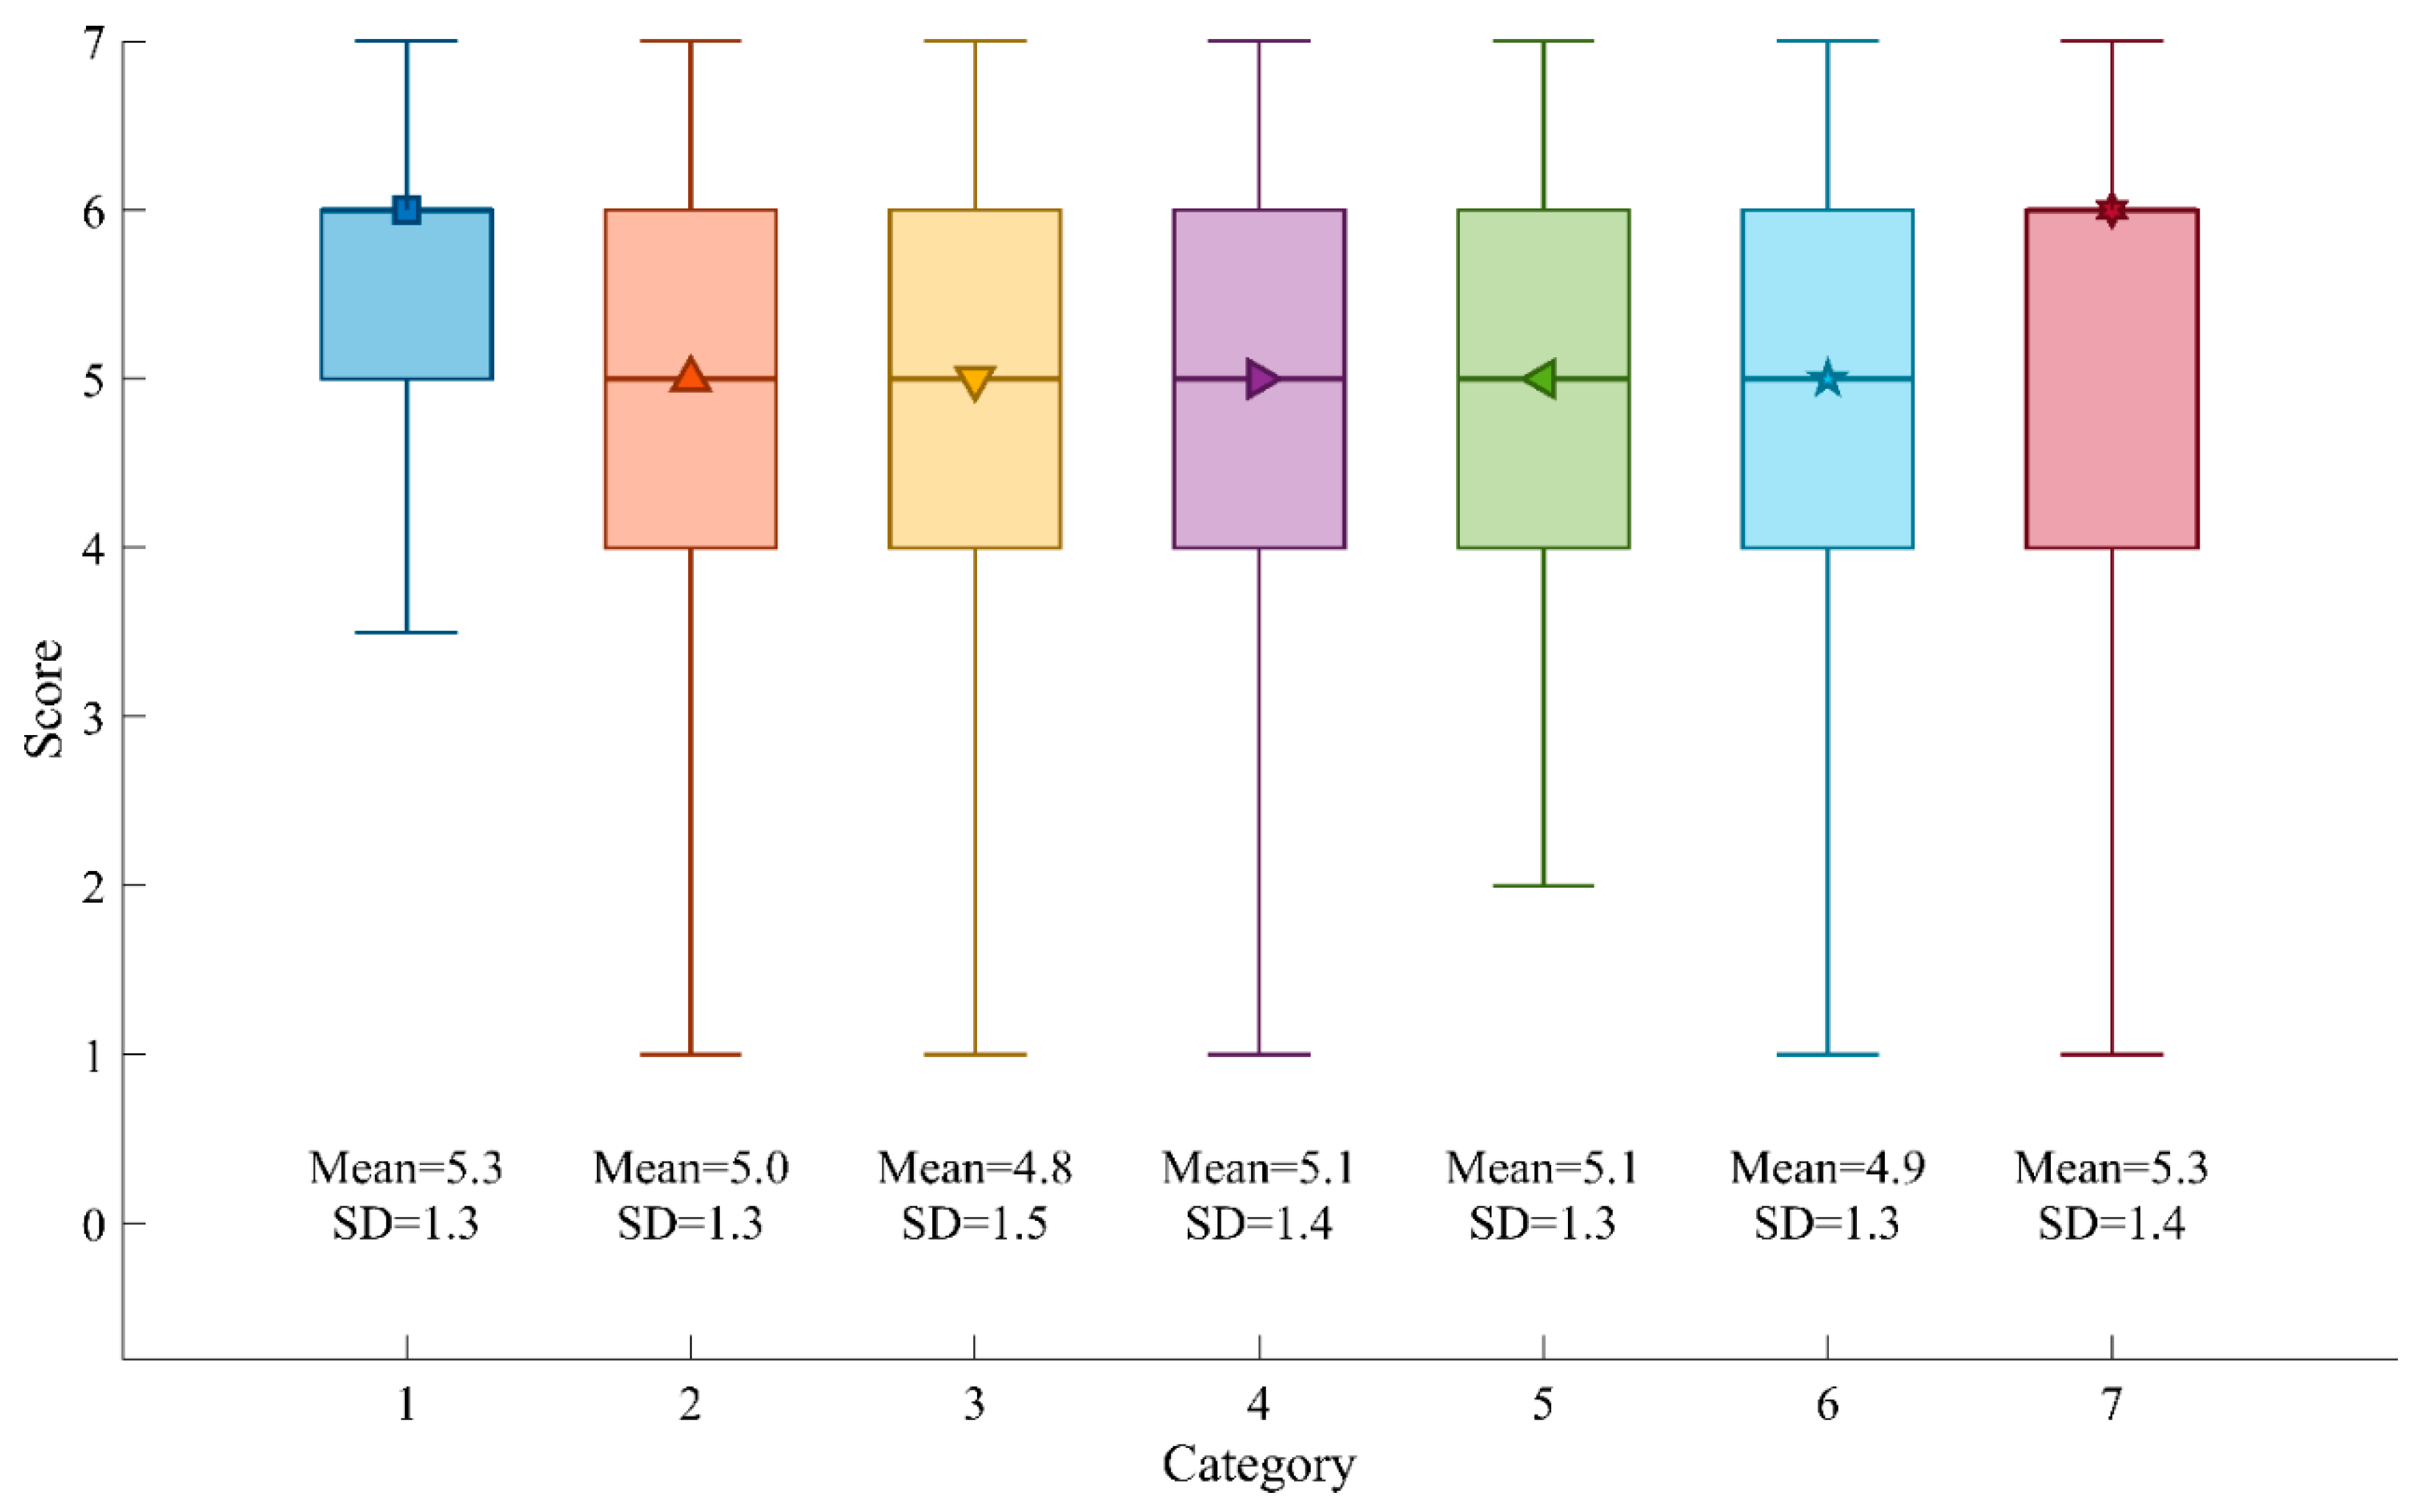
Figure 10 (Bloom Boxplots by Category) reveals the mean scores were uniformly positive, bunched in the upper-middle on the scale (with means between 4.8–5.3 on the 7-point scale). The scores are significantly uniform on all six cognitive levels of Bloom’s Taxonomy as well as the supplemental Overall Experience category. Category 3 (Application) and Category 6 (Evaluation) had the lowest set means (both 4.8–4.9), although they remained at the “Agree” borderline and were not statistically different from the others. This uniform pattern reveals the students saw the activities in the course as productive aiding the whole range of learning from the basic knowledge attainment up towards the higher cognitive skills without any level being significantly underdeveloped.
Figure 11 (Bloom Boxplots by Technology) illuminates the sharp contrast between the perception of how each tool added to learning. There the Total Station cluster was all bunched at the top of the scale, as it was universally viewed as having the greatest learning impact. In comparison, the RTK Drone cluster was situated notably lower on the scale compared to other technology.
Friedman mean rank lollipop chart for Bloom’s (
Figure 12) makes the clear ranking evident: The Total Station as highest, i.e., the most useful for learning; RTK Drone as the lowest.
The stronger Friedman post hoc tests established numerous significant differences, highlighting the Total Station’s stronger perceived learning effect (
Table 7):
The Friedman post hoc test showed that the Total Station had the highest ranking in perceived learning outcomes perceived throughout nearly all cognitive levels of Bloom’s Taxonomy, followed by the RTK Drone observation as the lowest ranking. Such contrasting ranking highlights the extreme difference in the effect of active, hands-on learning versus passive observation. Dominance of the Total Station was not at the single cognitive level but was significantly higher in mean score when compared to all others for the technology level of Knowledge, and for the Application, Synthesis, and Overall Experience when compared individually to the RTK Drone, Tello Drone, and SiteScape (all p < 0.05).
Radar chart (
Figure 13) summarizes these results as the Total Station having the highest polygon area of all the Bloom categories way ahead of the others, especially the RTK Drone.
To contextualize the perceived learning outcomes within the pedagogical framework of the course,
Table 8 summarizes the levels of self-reported attainment for each Bloom category relative to the 80% reference point. The scaffolded instructional design—progressing from structured, skill-focused activities to an open-ended problem—was intended to expose students to a range of cognitive tasks from foundational knowledge to more complex thinking.
The data in
Table 8 show a consistent pattern in students’ perceived attainment levels. Structured laboratories, particularly LAB06-ANG and LAB09-CLTRV, were reported by students as achieving higher perceived attainment in lower-order skills (Knowledge and Comprehension). In contrast, perceived attainment for higher-order skills (Application, Analysis, Synthesis, and Evaluation) was more variable and was often reported at lower levels across all lab types. This was most evident in Synthesis and Evaluation, which were primarily captured in the open-ended Point Cloud Lab (LAB11-PCLD), where students reported substantially lower perceived attainment.
4.3. Integrated Observations
The combined results from UTAUT and Bloom perception-based analyses reveal a nuanced relationship between technology acceptance and perceived learning:
Total Station was highest on perceived Bloom outcomes but only moderately on UTAUT
Laser Scanner was best in UTAUT, particularly for facilitating use as well as future use intention, but second-best in perceived Bloom
Tello Drone and iPad LiDAR (SiteScape) scored at the bottom in both UTAUT and perceived Bloom.
RTK Drone revealed a distinct pattern, which was weak in perceived Bloom but relatively stronger in UTAUT.
Collectively, these findings suggest that each of the five technologies was perceived differently along various dimensions of acceptance and learning, thereby underlining that acceptance and perceived learning may not necessarily be correlated.
4.4. Qualitative Insights
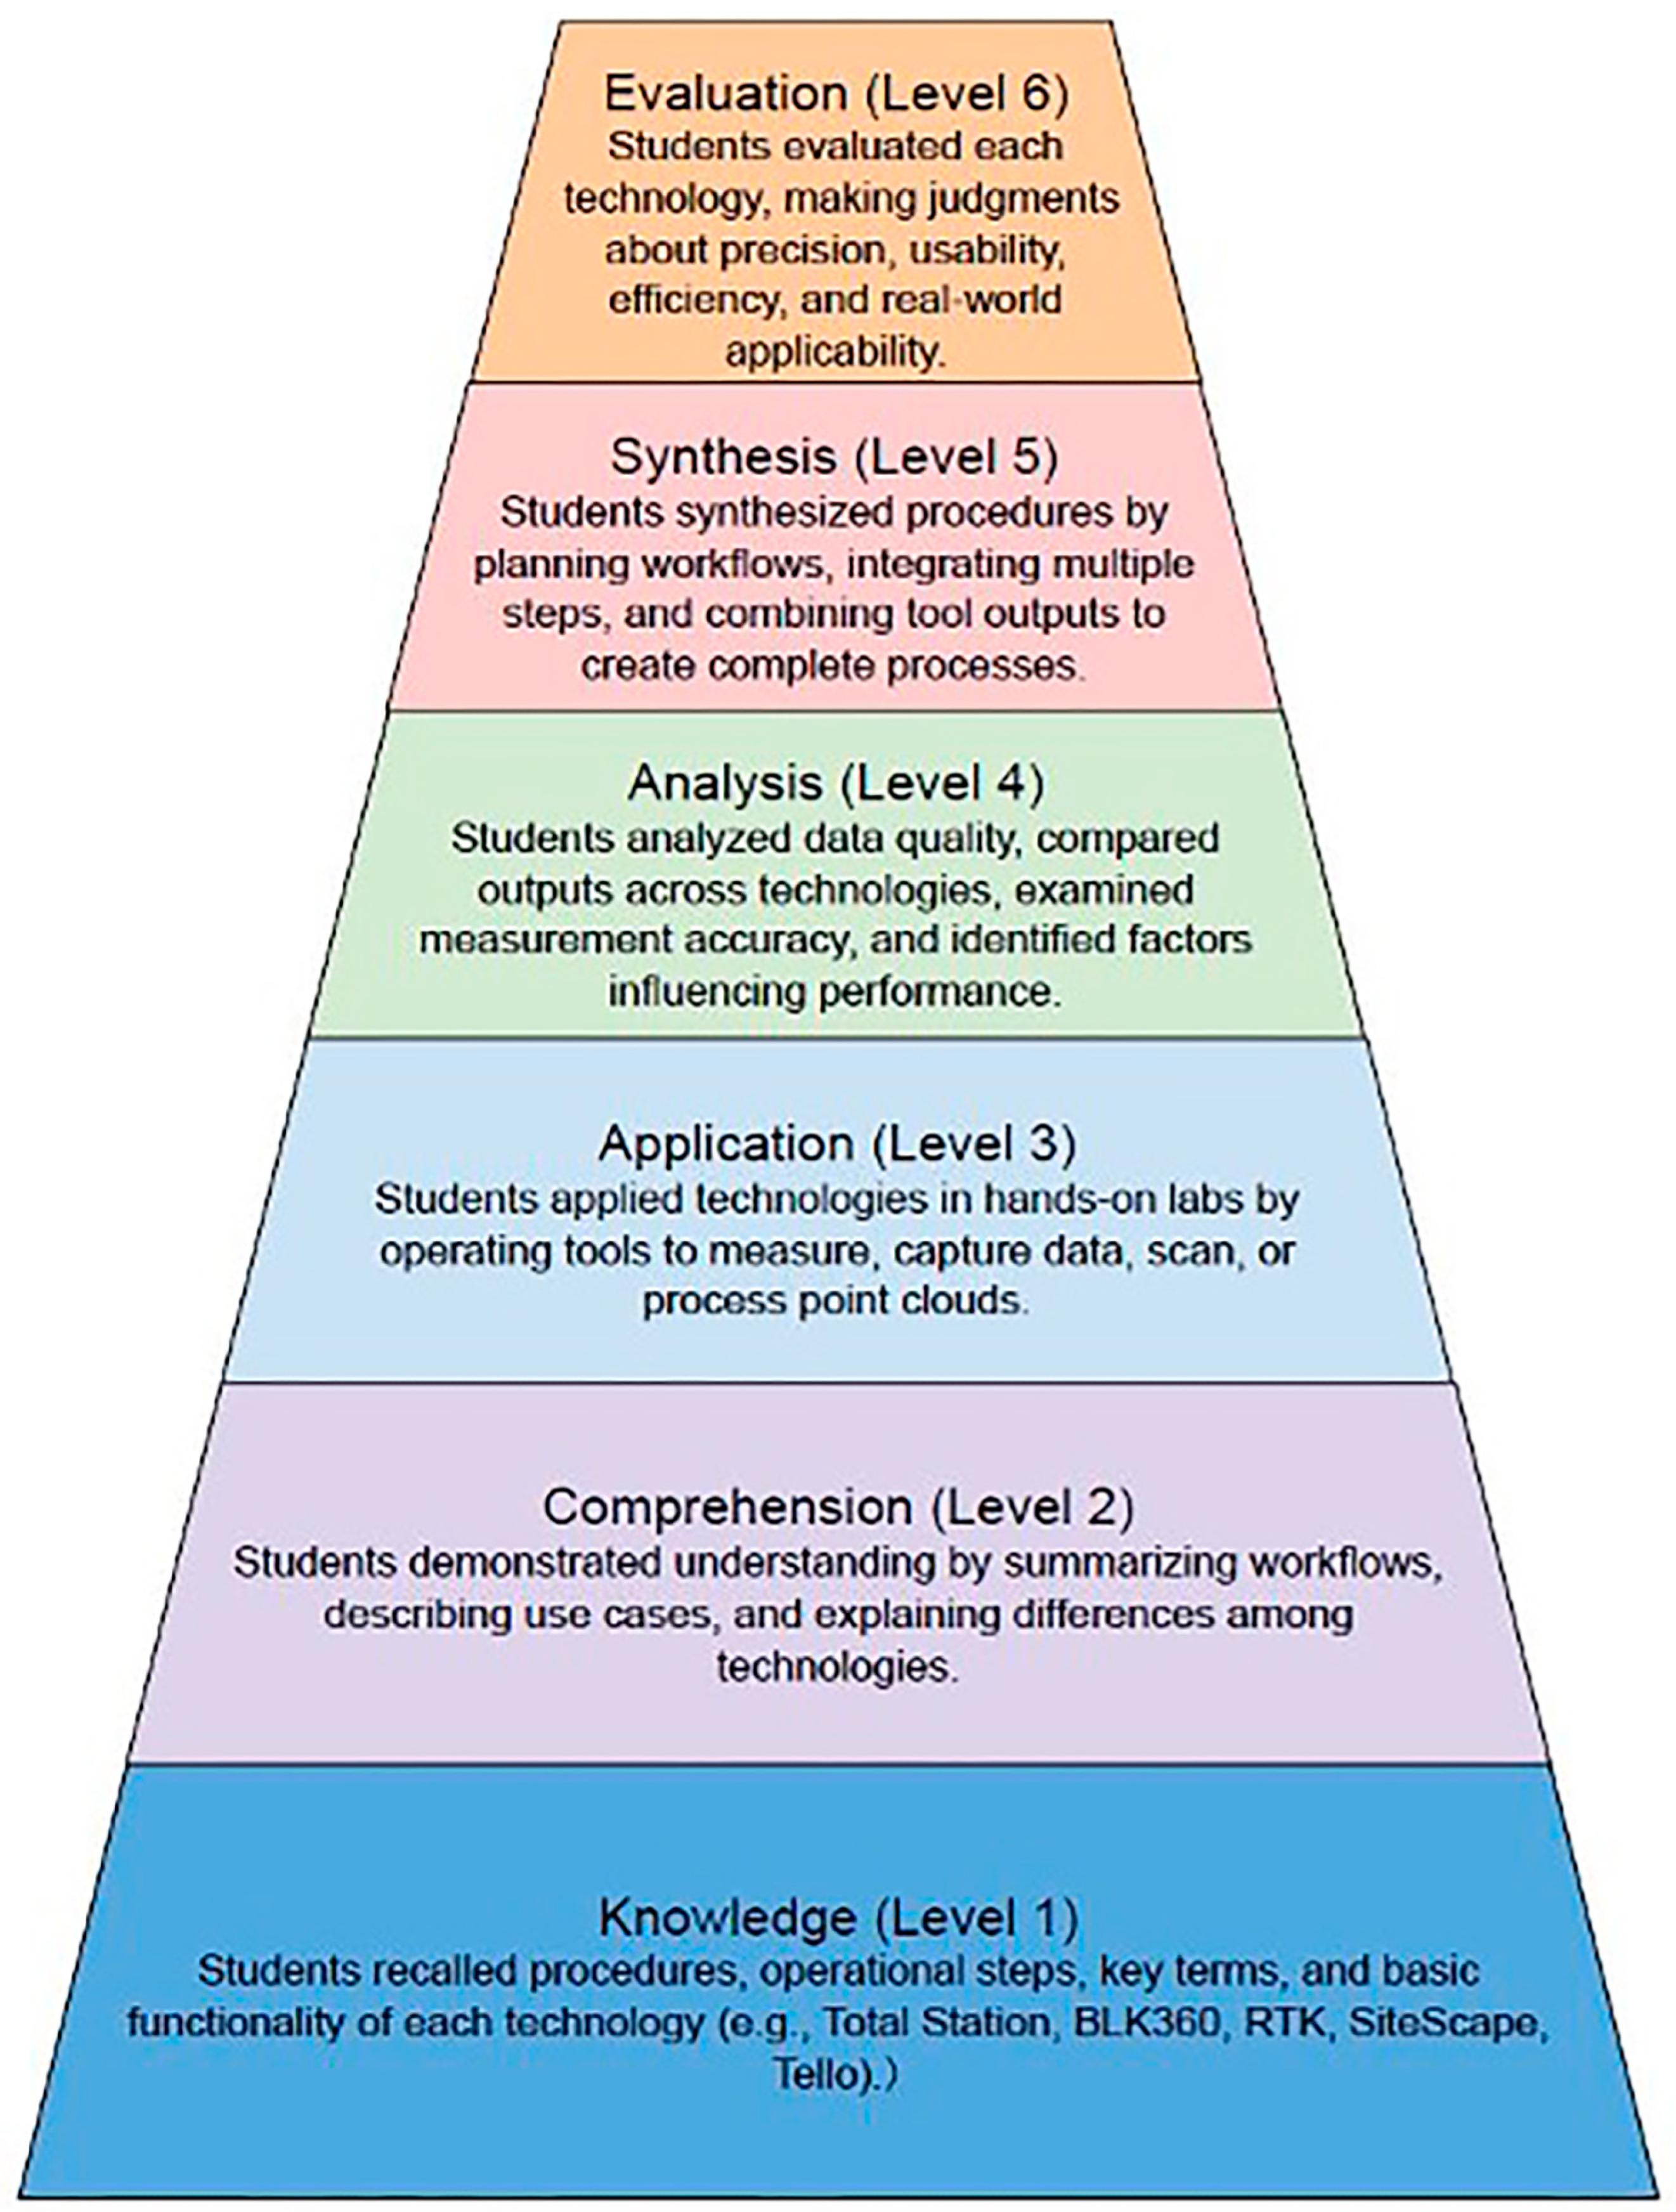
Beyond the quantitative survey data, student reflections provided rich evidence that the course supported learning across all six levels of Bloom’s Taxonomy. As illustrated in
Figure 14, a visual summary of how these six levels were scaffolded across the labs is provided.
Appendix C presents one representative quote per Bloom level, illustrating alignment between the qualitative reflections and Bloom’s hierarchy. The integration of the figure and the appendix confirms how students developed from remember-iterated technologies as evidence the course facilitated development through Bloom’s whole cognitive hierarchy.
Knowledge (Remembering). On the most basic level, the students showed robust Knowledge by remembering how each technology was utilized and was run. As commented by one student, “Using a total station definitely helped me learn the step-by-step procedure and gave me more respect for accuracy” (Total Station). In the same vein, commentary on the BLK360 was about how it had an effective workflow where the ability was remembered for remembering key steps, validating high retention for procedural knowledge.
Comprehension. Students also demonstrated strong Comprehension by summarizing the processes and range of use for each tool in their own words. For instance, a student noted the SiteScape app on the iPad LiDAR was “a pretty straightforward process and very similar to the scanner workflow, just faster and more accessible”, demonstrating how they could link and describe similarity between technologies.
Application. Reflections also showed application as students linked their reflections directly to hands-on application. As one noted, “It made things easier to understand because I was actually using it in the field rather than just seeing pictures” (Total Station). These indicate all the more that students not only learned concepts but applied them significantly in lab situations.
Analysis. At the higher levels, students performed Analysis by making comparisons and thinking about practical applications in the field. As one student noted, “The BLK360 made precise scans that could certainly be used for construction documentation” (LiDAR), another highlighted the advantage and disadvantage of various capture methods when captured inside (Tello). Such comments demonstrate their data quality evaluation as well as applicability assessment.
Synthesis. There was also synthesis as students explained designing workflows as follows: “We had to think about and decide the best way to configure each system so it could scan the same wall, it gave us a detailed procedure for how to use each tool” (Overall Experience).
Evaluation. Lastly, Evaluation made its first appearance in students’ critical assessments of tool usefulness: “The RTK system was impressive for its precision, but I think I could see challenges using it without the proper licensing and training” (RTK). In their evaluative insights alone, it is clear students thought beyond the classroom walls, making tradeoffs and considering professional applications.
5. Discussion and Implications
5.1. Technology Engagement vs. Perceived Learning Outcomes
This directly addresses RQ1, which investigated students’ acceptance of technologies, and RQ2, which quantified perceived learning outcomes as perceived. These interpretations build upon the acceptance patterns identified through AQ1–AQ6, which together characterize students’ perceptions of usefulness, ease of use, social and institutional support, anxiety, and future intention. While students widely accepted all technologies, the findings showed an absolute divergence: acceptance did not necessarily correlate with learning outcome. Professional-level tools like the Laser Scanner had high acceptance, but the Total Station was most learning-impactful. It follows then that acceptance as an indicator of educational value falls short. What was more crucial was the way of engagement: frequent, hands-on use facilitated deeper learning, but demonstration-use only hindered student growth irrespective of high perceptions about the ability of the tool. In construction programs, this highlights the necessity for the development of the experience for students where the students themselves are placed in an active mode irrespective of the technology being highly technical or being confined.
It is worth noting that while UTAUT has been widely applied in construction and engineering education contexts, and Bloom’s Taxonomy remains a central framework for structuring and analyzing cognitive learning outcomes, published work that
simultaneously operationalizes both frameworks in surveying, architecture, or built-environment technology education is extremely rare. The study by
Abdalla and AlSalti (
2025) provides one recent example across higher education generally, but domain-specific applications remain limited. Accordingly, this study addresses a significant gap by integrating technology acceptance (UTAUT) and cognitive outcome assessment (Bloom’s Taxonomy) within a construction surveying technology learning environment.
Further interpretative patterns emerge when analysis is undertaken by considering outcomes of acceptance and learning simultaneously. The high Bloom outcome of Total Station can be well matched with its high actual usage, as described in Section Instructional Context and Exposure Conditions, with increased potential to achieve high-order thinking skills. The high level of Laser Scanner acceptance and relatively lower perceived learning outcomes can be correlated with its restricted usage and teaching time. The lower ratings of Tello and Ipad LiDAR can be well justified by their restricted usage in industry, as perceived by students. Finally, the last item, RTK Drone, with its poor Bloom outcomes, can be well correlated with its entirely demonstrational context, with students not experiencing actual usage.
In this context, the ‘Overall Experience’ construct captures students’ holistic impressions across affective, social, and metacognitive domains. As such, it is theoretically distinct from Bloom’s six cognitive levels. Its inclusion in the comparative statistical analysis is therefore best interpreted as complementary and exploratory, providing an additional but non-cognitive perspective on students’ experiences with each technology. Future research may analyze such holistic constructs separately or develop multidimensional learning frameworks that systematically integrate cognitive, affective, and social domains.
5.2. Scaffolding Higher-Order Learning
The finding that the Total Station, despite being a less ‘sophisticated’ tool, generated the highest perceived learning outcomes is consistent with the scaffolded, hands-on pedagogical design of the course, which was grounded in constructivist and experiential learning theories. As detailed in the methodological framework (
Section 3.6), students worked extensively, repeatedly, and hands-on with the Total Station across three structured laboratories. This intensive practical experience was crucial for building confidence and perceived ability. In contrast, the demonstration-oriented nature of the RTK Drone lab, which provided no opportunity for direct manipulation, was associated with substantially lower perceived learning gains despite the tool’s technical sophistication. This pattern indicates that students’ perceived learning is shaped more by how they engage with a technology than by the technology’s complexity itself.
Student reflections further illustrate this point. Several students spontaneously proposed creative, real-world uses for the technologies that extended beyond the lab. For example, one student remarked, “This tripod laser scanner could be put in this structure to develop a model to help engineers and contractors develop plans regarding that structure. The thermal camera could be used for many applications, one of which being to identify the status of concrete curing” (
Appendix C). Such reflections demonstrate not only understanding but also evaluative and forward-looking thinking that surpasses what is typically captured in survey scores.
This pedagogical sequencing was deliberately aligned with ABET accreditation standards to target specific professional competencies (SO-1, SO-2, SO-5, SO-6, SO-7), as illustrated in
Table 5. The progression from structured skill-building to open-ended problem-solving provided the context in which students could advance beyond basic operational ability towards the critical thinking, problem-solving, and lifelong learning skills required of contemporary construction engineers.
However, the data also reveal the specific challenges in cultivating the highest levels of cognitive skills. It addresses RQ2 and RQ3: while students saw growth throughout Bloom’s levels, the uneven attainment in open-ended labs—particularly for Synthesis and Evaluation, which fell below the 80% benchmark (
Table 8)—demonstrates the value of additional structured scaffolding within the experiential activities. Furthermore, instead of being seen as a deficiency measure, these results indicate the developmental nature of synthesis and evaluation skills.These findings carry significant instructive implications. Structured labs consistently reinforced lower-order mastery, but the open-ended point cloud exercise prompted students toward higher order thinking but showed uneven mastery. Mastery at higher Bloom’s levels involves something more substantial than one-off access; it involves scaffolding, iteration, and reflection. Whereas students are certainly gaining confidence as well as competence in foundational skills, the inclusion of structured reflection exercises, multi-week projects, or staged cycles of feedback may help span the gap between procedural mastery and higher cognitive outcomes. This interpretation aligns with broader findings that structured scaffolding is crucial for students’ progression through Bloom’s higher cognitive levels (
Biggs et al., 2022;
Adams, 2015), reinforcing that synthesis and evaluation require iterative opportunities rather than single exposures. In this way, the findings should not necessarily be taken as evidence toward proving the inadequacy of some measure but as informative toward iterative curricular refinement.
5.3. Professional Relevance and Curricular Design
In regard to RQ1, students accurately separated professional-grade and consumer-grade tools, reporting acceptance reliance on ease of use as well as on subjective relevance for industry practice. These observations are consistent with recent empirical work demonstrating how digital and AI-supported tools enhance both perceived relevance and learning quality in construction education (
Zhao et al., 2025;
Zhao & Na, 2024). Consumer-grade technologies offer access and early exposure but potentially undermine their value for students unless justified as steps on the way to high-end systems. For the curriculum designer, the issue then becomes how best to strike the balance between authenticity and access: providing students with authentic experience using industry-standard tools whilst using the consumer-grade technologies as steps on the way to enhancing confidence and foundational skills. Students’ comments echoed this need for authentic engagement with field-ready technologies. As one student explained, “There are times where accessing the structure may be impossible by foot, so drones can be utilized in order to view the structure.” Statements such as this highlight students’ ability to envision credible, professional-grade uses of the tools beyond the classroom (
Appendix C). That type of framing undercuts students’ perception of being job ready as well as illuminating the complementary nature of the range of tools within the curriculum.
5.4. Accreditation and Pedagogical Orchestration
Alignment of the study’s labs with the ABET outcomes reveals how open technologies may facilitate important professional competences like teamwork, engineering judgment, and lifelong learning. But the indicated gaps in higher-order achievement indicate where tool acquisition falls short in meeting the purposes of accreditation. Where pedagogical orchestration comes in—integrating technologies into meaningful, student-centered activities requiring interpretation, critique, and design—technology use becomes an avenue for the development of not only technical expertise but also the higher-order competences required in Construction 4.0 contexts. Students’ reflections strongly reinforced this interpretation. One student noted, “Some parts of the lab were a little confusing. It helped that we were working as a group. We asked each other questions, made a plan, and kept trying until things worked.” Another shared, “Honestly, it made the whole thing way more interesting. Instead of sitting through a lecture, we were up, testing things out, and figuring things out ourselves.” These perspectives illustrate how collaborative, experiential orchestration supported persistence, teamwork, and sustained engagement—competencies emphasized in ABET outcomes. What these finds accord with is RQ3, whereby it was queried how open-ended, experiential laboratories affect engagement and value as perceived. What the findings indicate is ending the purposes of accreditation best when technologies serve integrated parts of active, student-centered activities as opposed to demonstration.
Altogether, these findings discussed in
Section 5.1,
Section 5.2,
Section 5.3 and
Section 5.4 directly resolve the three research questions: (RQ1) students widely accepted emergent technologies but made distinctions between professional- and consumer-level tools; (RQ2) students reported perceived learning across all levels of Bloom’s Taxonomy, with structured labs associated with higher perceived attainment of basic skills and open-ended labs perceived as providing more uneven support for higher-order thinking; and (RQ3) the use of open-ended, experiential labs increased engagement and value perception but their effect was highly dependent on the opportunity for manipulation use.
6. Conclusions and Future Work
6.1. Summary of Key Findings
In this experiment, undergraduate acceptance of new surveying technologies was tested using the UTAUT model and learning outcome using Bloom’s taxonomy. Overall, technology acceptance did not necessarily align with perceived cognitive learning gains: professional-level equipment like the Laser Scanner was extremely accepted, but the Total Station (in ubiquitous hands-on lab use) indeed generated the highest level of perceived learning outcome.
6.2. Implications for Engineering Instruction
For engineering educators, the study provides a pragmatic, sequenced model of integrating traditional, semi-structured, and open-ended labs to progressively develop both technical proficiency and cognitive skills. Instructors may adapt this framework by:
Ensuring repeated, hands-on use of central technologies before the addition of open-ended problem-solving activities.
Incorporating compact, well-organized reflective activities and iterative rounds of feedback in order to develop stronger higher-order capabilities of synthesis and evaluation.
Positioning consumer-grade or accessible technologies as low-barrier, pre-lab “stepping stones” building familiarity before passing on to professional-grade tools.
Aligning each lab with targeted Bloom levels and relevant ABET student outcomes to support intentional and progressive skill development.
These implications provide a practical guide for designing technology-enhanced laboratory experiences across engineering curricula.
6.3. Limitations and Scope
The results of this work must be translated within the study’s bounds. Data were gathered at just one institution on a single course using the fairly modest number of students as the sample set, so generalizability was restricted. In particular, the small and non-diverse sample limits the extent to which these findings can be generalized beyond this cohort of construction students or to broader engineering populations, especially programs with different demographic or international compositions.
Analysis utilized self-report instead of performance measures for perceived learning outcomes, thereby injecting subjectivity despite the rigid application of quantitative procedures. Because these instruments capture students’ subjective perceptions rather than demonstrated performance, the results should not be interpreted as evidence of actual skill acquisition or mastery of Bloom-level competencies. The study relied on ordinal Likert-scale data with a modest sample size; accordingly, non-parametric methods were used in place of parametric ANOVA to respect the data’s measurement properties. Although groups were randomly assigned and each student had equal access to the technologies, group-based work may still introduce shared perceptions or within-group clustering that was not modeled in the analysis.
The course-specific nature of the context where an emphasis was placed on construction surveying implies the results must only cautiously be applied to the rest of the engineering disciplines. Other restrictions include possible instructor-effect (one instructor) and brief window of exposure, both of which might suppress or inflate apparent gains (ceiling/floor effect).
Additionally, the time allocated to each technology was not identical, as professional tools such as the Total Station required multiple structured sessions, while some advanced tools were limited to single open-ended demonstrations. This distribution reflects normal pedagogical sequencing in construction surveying courses rather than an experimental imbalance, but it may have introduced minor variation in exposure intensity across tools. Non-random enrollment also restricts causal claims.
Given that the study did not include a control or comparison group, the findings should not be interpreted as causal evidence of the effectiveness of any specific pedagogical format. Because no pre-course baseline was collected, the analysis reflects perceived outcomes at a single post-course time point.
6.4. Directions for Future Research
Future research should broaden the sampling frame to several institutions, larger student groups, and diverse engineering courses. Use of quasi-experimental or crossover design (common rubrics, matched sections) would improve inference. Integrating the self-perceptions measure with objective measures (e.g., graded projects, demonstration of skills) plus process measures like time-on-task, error rates, and quality of revision would give a richer and more robust measure of learning outcomes. Self-reported instruments will continue to play a useful role in capturing students’ subjective learning experiences, but future work can complement them with performance-based assessments. Future iterations would also benefit from implementing pre–post measurements to allow for difference-score analyses, providing a clearer understanding of changes in perceived learning over time. Longitudinal studies could also investigate whether students’ acceptance of technologies and behavioral intention gets translated into professional use upon graduation.
Following the work of
Wen et al. (
2024), an important future direction is to explore (1) the influence of student background: pre-programming internship experience, preseason comfort with technology, or (2) major-related concentration—on technology acceptance (UTAUT) as well as on Bloom’s Taxonomy of perceived learning outcomes. Factors of access and equity (e.g., preseason device familiarity, app affordability) need also to be explored as possible moderators to facilitate teachers’ differentiation of instruction and scaffolding so as to provide for students with different backgrounds of prior experience.
Another valuable extension for future work is to incorporate instructor and TA perspectives, including potential implementation constraints and opportunities for co-design, to better understand how educator facilitation shapes students’ engagement with technology-enabled laboratory instruction.
Finally, design-based research could test refined instructional interventions, such as multi-week, iterative open-ended labs, cross-technology “compare-and-decide” projects, or industry-partnered challenges with authentic constraints, to strengthen higher-order outcomes and broaden curricular impact. Future studies could further explore balanced exposure or factorial arrangements to disentangle the relative effects of tool type and instructional mode.
A practical deliverable for educators is an “Engagement × Sophistication” design matrix that pairs each technology with (a) the recommended mode of engagement and (b) the targeted cognitive outcomes: providing a transferable planning tool beyond construction surveying. In this way, the combined use of UTAUT, Bloom’s Taxonomy, and experiential design becomes not just an evaluative lens but a replicable blueprint for technology-enhanced learning across engineering disciplines and accreditation contexts.