


Abstract
This study addresses the growing complexity and heterogeneity of global decarbonization processes, which limit the effectiveness of traditional linear forecasting and policy approaches, and aims to develop an integrated model for coordinated forecasting and management at the macroeconomic level. The proposed D-CPFR (Decarbonization—Collaborative Planning, Forecasting and Replenishment) framework combines country clustering based on self-organizing maps, nonlinear forecasting using multilayer perceptrons, and scenario-based multi-criteria optimization. The results demonstrate that clustering serves not only as an analytical tool but also as a structural basis for forming network interactions among countries with similar decarbonization characteristics, enabling coordinated decision-making and policy alignment. The model provides a mechanism for integrating forecasting outputs with joint management processes, including information exchange, scenario coordination, and investment planning within and across clusters. The findings confirm that the hybrid approach improves the representation of nonlinear relationships and supports more accurate and differentiated modeling of decarbonization trajectories. The proposed framework can be applied to the development of adaptive climate strategies, enhancement of resource allocation efficiency, and support of sustainable economic development across countries with varying levels of economic and energy development.
1. Introduction
Modern global decarbonization processes are characterized by a high level of complexity, reflected in the nonlinear relationships between economic, energy, and institutional variables, as well as significant cross-country heterogeneity. These features limit the applicability of traditional linear approaches to forecasting CO2 emissions and climate policymaking and highlight the need for more adaptive and integrated analytical frameworks (Intergovernmental Panel on Climate Change, 2022).
The study addresses three research questions: 1. What theoretical foundations support hybrid forecasting based on cluster and neural network methods? 2. How can the D-CPFR model integrate forecasting with collaborative planning for structurally heterogeneous countries? 3. How can the proposed approach support the formation of differentiated climate policies and coordinated decarbonization strategies?
Researchers Kiv et al. (2020), Zhytkevych and Brochado (2022), Zharova et al. (2022), and Abdel-Rahman Tubishat et al. (2024), among others, emphasize the importance of combining innovative and interdisciplinary approaches to address complex sustainable development challenges. In particular, Leal Filho et al. (2024) demonstrate that design-oriented approaches facilitate the development of human-centered and practically applicable solutions, enhancing the effectiveness of Sustainable Development Goal implementation. Such approaches are particularly relevant in the context of decarbonization, which represents a multidimensional and systemic transformation process.
The existing literature highlights the importance of economic, energy, and institutional factors in shaping decarbonization pathways. In particular, the works of Zatonatska et al. (2025) consider approaches to the application of ESG criteria in the planning and assessment of energy projects and the functioning of the energy sector, which can be useful for improving the quality of investment analysis and supporting Sustainable Development Goals. Miroshnychenko et al. (2021) demonstrate the application of intelligent forecasting methods to the analysis of renewable energy generation, which allows taking into account the nonlinear and dynamic characteristics of energy processes, particularly in developing countries. The study results of Güney (2024) indicate a significant role of institutional and economic conditions, in particular the business climate, in explaining the fluctuations in CO2 emissions, which indicates the importance of the institutional environment along with energy factors in decarbonization studies.
In the context of climate policy, Lyu et al. (2023) show that the impact of low-carbon development policies can be heterogeneous over time and across groups, highlighting the heterogeneity of value considerations in the evaluation of policy interventions. Xiang et al. (2023) analyzed optimization pathways for industrial production processes and their environmental–economic impacts, demonstrating that technological and structural production conditions significantly influence emission outcomes. Leal Filho et al. (2024) confirm the presence of nonlinear dependencies between urban structure and CO2 emissions from transport, which justifies the feasibility of using machine learning methods to model complex multidimensional relationships. Lee et al. (2022) demonstrate that the effectiveness of environmental impact assessment procedures may depend on the quality of communication between stakeholders, as different interpretations and approaches to information exchange can affect the process formation and decision coordination. Chen et al. (2025) show that a significant part of the research on the application of machine learning in the field of CO2 emission estimation focuses on the prediction and selection of factors affecting the task, while the issue of structural heterogeneity and the complexity of the relationships between variables remains open.
However, despite these advances, existing studies primarily focus on isolated aspects of decarbonization and do not provide an integrated framework that simultaneously accounts for structural heterogeneity, nonlinear relationships and coordinated governance mechanisms. In this context, the goal of the study is to develop an integrated decarbonization model, D-CPFR, which combines hybrid methods of forecasting decarbonization potential with collaborative governance mechanisms, as well as to substantiate its application for the formation of coordinated climate strategies at the macroeconomic level. The scientific novelty of the proposed framework does not lie in developing new algorithms, but in their methodological integration: country clustering is used to identify structurally homogeneous groups, cluster-specific AI models are applied to capture heterogeneous nonlinear relationships, and the resulting forecasts are incorporated into a coordinated multi-criteria decision-making framework for decarbonization scenarios. Thus, the proposed approach integrates econometric modeling with AI-driven components within a unified framework, enabling improved forecasting accuracy while linking prediction with coordinated climate policy development.
2. Methodology
2.1. Research Design
This study employs a hybrid methodological framework that integrates cluster analysis, machine learning, and multi-criteria optimization to assess and forecast the decarbonization potential of countries. The approach is implemented in sequential stages of data preprocessing, linear modeling, clustering using self-organizing maps (SOM), cluster-specific nonlinear modeling using multilayer perceptrons (MLP) and scenario-based optimization within the D-CPFR framework. The complete workflow of the proposed approach is presented as: (1) data collection, (2) data preprocessing, (3) SOM clustering, (4) cluster identification, (5) cluster-specific MLP prediction, (6) model validation, and (7) scenario optimization via intracluster and intercluster coordination.
The predictive component of the study is not intended to provide general macroeconomic forecasts. Rather, it evaluates the ability of the proposed cluster-specific models to estimate the CO2 emission factor from the selected economic, energy, and environmental predictors within the available country-year observations. Accordingly, the results are interpreted as conditional model-based forecasts supporting decarbonization scenario analysis rather than as comprehensive predictions of national economic performance.
In accordance with the stated goal, the study’s set of tasks includes:
- formation of theoretical foundations of hybrid forecasting based on econometric, cluster and neural network methods;
- justification of the integrated D-CPFR model for collaborative planning and forecasting;
- representation of practical application of the modeling approach in the formation of climate policy of states.
2.2. Implementation
The models are implemented in Python (version 3.11) using standard libraries, including NumPy, Pandas, Scikit-learn and MiniSom (version 2.3.5). The models were implemented in Python (version 3.11) using NumPy, Pandas, and Scikit-learn; MiniSom (version 2.3.5) and scikit-fuzzy (version 0.5.0) were additionally used for the clustering analysis. Optimization is performed using gradient-based methods (Adam optimizer). The full modeling pipeline, including preprocessing, clustering, and neural network training, can be reproduced based on the described procedures. The main model specifications, including the input variables, standardization procedure, clustering method, network architecture, activation functions, optimization algorithm, evaluation measures and fragments of code and detailed results, are provided in the appendices.
2.3. Data and Code Availability
The data used in this study are obtained from publicly accessible databases (EnerData, 2024; World Bank, 2024; Geopolitical Risk Index, 2025). Processed datasets and model outputs are available from the authors upon reasonable request.
2.4. Ethical and AI Use Statement
This study does not involve human or animal subjects; therefore, ethical approval is not required.
No generative artificial intelligence tools were used for data generation, modeling, or analysis. AI-assisted tools were used only for code correcting and minor language editing, translation and formatting, without affecting the scientific content of the study.
2.5. Formation of Theoretical Foundations of Hybrid Forecasting Based on Econometric, Cluster and Neural Network Methods
Within the framework of the implementation of above stated tasks, the functional dependence between multiple input parameters and a set of output solutions of the decarbonization potential of countries is presented in the form of systems (1), (2) and (3). The proposed model integrates AI-driven components, including unsupervised learning for clustering and supervised deep learning, multilayer perceptrons for nonlinear prediction, combined with multi-criteria optimization. This allows taking into account the structural heterogeneity of countries, the scenario nature of decarbonization processes and ensuring the formation of economically sound, energy-efficient and socially stable solutions.
Mathematical model:
Consistency condition:
where —standardized feature vector (12 variables) for country at time ; —set of primary (non-standardized) input variables; —standardization operator (z-score normalization) of the predictors calculated based on ; —aggregated cluster-level representation obtained via SOM; —aggregation function that maps the set of standardized country-level observations into a cluster-level representation (SOM); —set of observations (countries by years) belonging to cluster , where ; —AI-based cluster-specific nonlinear prediction function implemented as MLP with parameters , trained on historical data of the countries in cluster c; —parameter vector (weights and biases) of the neural network for cluster ; —optimal scenario obtained as the solution to the optimization problem, where is the vector of scenario variables; —feasible set of scenarios for cluster , defined by economic, institutional, and technological constraints; the loss function incorporates environmental, economic, risk, and social components; —predicted CO2 emission level in cluster , defined as the aggregate of individual country-level predictions; and —predicted CO2 emission level for country at time , obtained using the c cluster-specific model.
The subsequent sections provide a formal representation of the proposed model, followed by a detailed description of its core functions and their roles within the overall framework.
2.6. Data Formalization and Model Input Specification
To ensure consistency between the empirical dataset and the proposed model, collected indicators are formally embedded into its structure. The study estimates the decarbonization potential for 45 countries for the period 2014–2023. The information base is formed on the basis of internationally comparable sources (EnerData, 2024; World Bank, 2024; Geopolitical Risk Index, 2025) and includes 13 annual indicators that characterize energy, economic, demographic, institutional, and environmental aspects of development (Zhytkevych, 2025a).
The primary data are presented as a set of unstandardized indicators , which are transformed into a standardized feature space according to Equation (1). The set of factors for each country k at a given point in time is given by the vector. Based on these variables, a set of twelve explanatory predictors was constructed using feature engineering procedures, including variable selection, transformation of absolute indicators into relative measures, and calculation of derived variables describing the energy, economic and environmental characteristics of each country. Consequently, each country at time (year) is represented by the feature vector:
where each element of the vector represents the value of one of the twelve explanatory predictors for country at time . These predictors are subsequently standardized according to Equation (1) to obtain the normalized feature vector , which is used as the input to the clustering and prediction models.
The explanatory variables include macroeconomic, energy, institutional and innovation indicators that form a multidimensional factor space and have passed the multicollinearity test. For the statistical correctness of the used software, standardization was applied, which is integrated into the formalization of the model (1). The fragment of the dataset is presented in Appendix A (Table A1) with the list of indicators and countries (Table A2).
The authors define the “decarbonization potential of a country” as its ability to sustainably reduce the carbon intensity of its economy in the medium and long term. The target variable—the logarithm of the average CO2 emission factor—is used as the model output for training AI-based prediction functions and for the subsequent optimization of decarbonization scenarios. A logarithmic transformation was applied to address the asymmetric distribution of this indicator and presence of extreme values, thereby ensuring statistical stability of the estimates. Also, for model construction and validation, the dataset was divided into training and test samples in a ratio of 70/30, which corresponds to standard approaches in econometrics and machine learning problems.
2.7. Initial Model Specification: Multiple Linear Regression
At the initial stage of the study, the model used linear regression (LR), which was estimated using the pooled dataset containing observations for all countries and all years, without prior clustering. The objective of this stage was to evaluate the overall linear relationship between the response variable and the explanatory predictors (5) and to establish a benchmark for comparison with subsequent nonlinear models.
where is the logarithm of the average emission factor CO2 for the country during the period ; are model parameters; and is the error term.
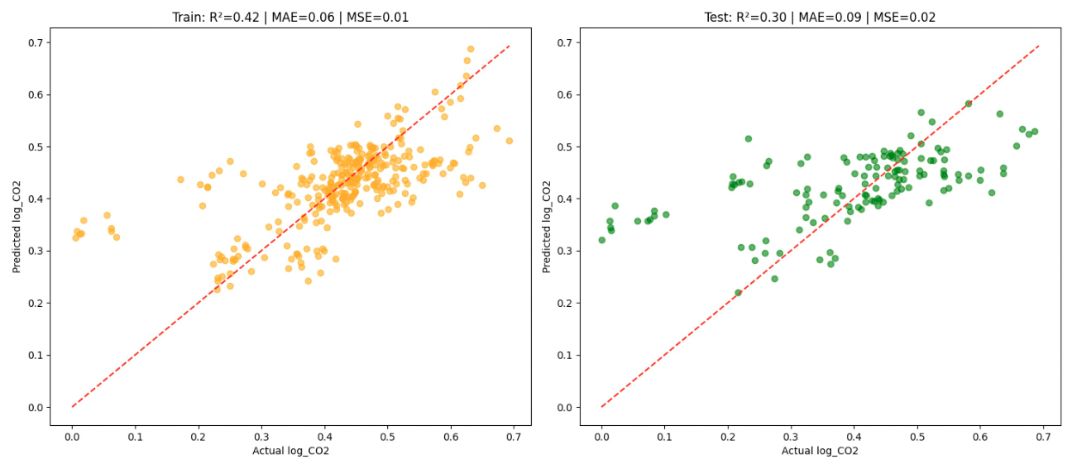
The parameters were estimated using the least squares method, and the quality of the constructed model was assessed using the coefficient of determination R2 and MAE and MSE indicators. Based on the empirical studies conducted, it was found that the linear regression model built on a full set of indicators is characterized by an insufficient value of R2 and relatively high MAE and MSE values, which indicates its insufficient explanatory power (see Figure A1, Appendix B). Thus, such a model is not sufficiently adequate to describe the studied dependencies. Since basic modeling has a limited ability to take into account nonlinear relationships between variables, it is necessary to use more complex approaches, which are considered at the next stages of the study.
2.8. Clustering Using Self-Organizing Maps
Artificial neural networks, by analogy with natural nervous systems, consist of interconnected neurons that form a network of interneuronal connections. Such connections are a functional analog of synapses in biological systems and provide signal scaling using weighting coefficients that reflect the strength of the corresponding connection. Within the framework of this study, the neural network approach was used at two levels: for clustering the multidimensional feature space and for building nonlinear predictive models within the formed groups of countries.
To take into account inter-country heterogeneity, a self-organization map was used, which provides a nonlinear projection of the multidimensional space while preserving the topological structure (Kohonen, 2013).
At the previous stage of our empirical study, a comparative analysis of various clustering methods was conducted, in particular K-means, Gaussian mixture models and self-organizing maps for the data set. The results of the analysis indicate the absence of a universally optimal algorithm, which makes it advisable to choose a method taking into account the specifics of the data. In particular, it was found that the self-organizing map demonstrates superior ability to detect complex nonlinear structures, preserve topological connections between observations, and provide high-quality clustering by internal metrics compared to alternative approaches. This is supported by the results of previous studies (Zhytkevych & Brochado, 2022; Zhytkevych et al., 2023; Zhytkevych, 2025b), in which SOM is identified as the most suitable method for analyzing the decarbonization potential of countries based on multidimensional indicators, in particular due to its scalability, noise resistance, and ability to work with high-dimensional data. Thus, the choice of SOM in this study is justified from both theoretical and empirical points of view and provides a solid basis for further cluster-specific modeling.
Since clustering is performed based on generalized characteristics of countries, an aggregated feature vector is formed for each country k and observation year t, obtained from standardized observations, and then a mapping is applied . Therefore, this process is defined as a mapping function which assigns each country-specific vector to a discrete cluster:
The optimal C was determined based on internal clustering quality criteria, in particular the Silhouette, Davies–Bouldin and Calinski–Harabasz indices. The selection of seven clusters follows the internal clustering quality criteria described in the methodology and is consistent with the clustering approach applied in our previous studies (Zhytkevych et al., 2023; Zhytkevych, 2025a). The analysis results formed seven clusters of countries with similar characteristics of decarbonization development. Application of the SOM-based clustering procedure identified seven country groups with distinct structural characteristics. The resulting clusters are further characterized in terms of their main economic, energy, and environmental features, which are presented in Table A3 (Appendix C).
The identified clusters can be interpreted as representing differentiated positions in the low-carbon transition (see Figure A2, Appendix C). For example, Clusters 0 and 5 comprise countries with relatively advanced energy-transition characteristics and may therefore be regarded as potential decarbonization hubs or transition leaders. Clusters 1 and 6 can be interpreted as intermediate or transitioning profiles, reflecting different combinations of economic development, energy structure, and decarbonization characteristics. Clusters 2, 3, and 4 represent more heterogeneous transition profiles, with their relative position determined by differences in fossil-fuel dependence, energy intensity, renewable-energy penetration, electrification, and CO2 emission intensity rather than by income level alone.
Thus, the use of SOM not only increases the accuracy of further forecasting based on homogeneous datasets obtained through segmenting data but also provides a deeper understanding of structural differences between countries.
It is important that in this study, clustering performs not only an analytical function but also forms the basis for integration mechanisms of joint governance. Countries within the same cluster have similar structural characteristics, level of development and decarbonization goals, which create the prerequisites for effective interaction. In this format, clusters can be viewed as network groups for information exchange, scenario creation, emission reductions, and coordination of investment and management decisions. Hence, this provides a practical basis for the application of D-CPFR models, where countries act as partners in joint planning and forecasting processes.
Thus, at this stage, clustering moves from a statistical analysis tool to the formation of key elements of agreed decarbonization strategies, combining analytical, forecasting, and management levels of research.
2.9. Cluster-Specific Nonlinear Modeling Using Multilayer Perceptrons
To take into account the complex nonlinear relationships between economic, energy, and institutional factors, a separate predictive modeling based on a multilayer perceptron is implemented within each formed cluster. This approach avoids the problems of global model specifications and increases the accuracy of forecasting, taking into account the structural homogeneity within the clusters.
For each cluster, the nonlinear relationship between the standardized predictor vector and the logarithm of the CO2 emission factor is approximated by a cluster-specific multilayer perceptron (MLP). The network produces an individual prediction for each country-year observation belonging to cluster . The MLP implements a sequence of nonlinear transformations across layers and is represented based on (Hagan et al., 2014):
where is the standardized input feature vector; denotes the output of layer l; and are layer-specific weight matrices and bias vectors; —layer index; —the total number of layers in the network; and is the activation function applied at layer . In the implementation, logistic activation was used for hidden layers and a linear activation was used in the output layer, which is standard for regression problems.
The network parameters are estimated by minimizing the mean squared error (MSE) loss function over the observations belonging to cluster c (Hagan et al., 2014):
where is the set of observations belonging to cluster ; is the number of observations in cluster ; and is the corresponding prediction produced by the cluster-specific MLP.
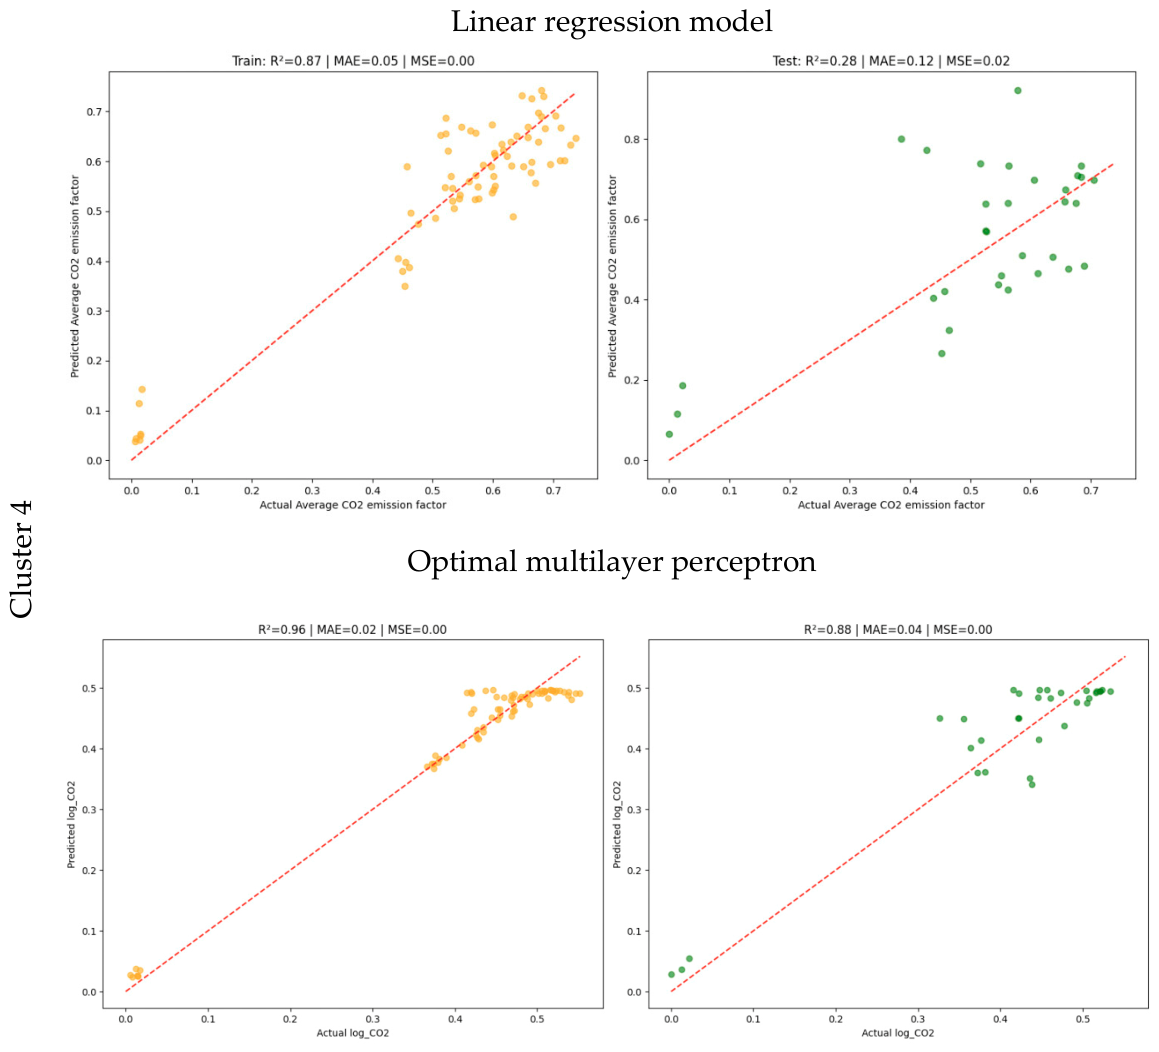
Implementation models accomplished from application languages, such as Python programming, using specialized libraries, in particular NumPy, Pandas, and Scikit-learn, provide correctness calculations and reproducibility results. Optimization of the parameters of MLP is carried out using the method of gradient descent and its modifications (Adam), which provides effective settings of models in conditions of high-dimensional data. The principal implementation and training specifications are summarized in Table A4 (Appendix D). A fragment of the Python code is presented in Appendix D, and simulation results, including accuracy estimates and model comparisons for cluster 4, are shown in Figure A3, which exhibits the highest quality scores compared to the linear model.
Comparative analysis of modeling results indicates that using MLP within the framework of a cluster approach provides an essential increase in accurate prognostication compared to the linear model (Figure A3, Appendix E). This is explained by the ability of neural networks to approximate complex nonlinear dependencies and also take into account the specificity of individual groups of countries. This feature is especially significant for improving the quality of forecasts of transitional economies, which are characterized by high volatility indicators and structural instability.
The simulation results presented in Table A5, Appendix F, indicate the heterogeneous nature of the relationships between decarbonization factors and CO2 emissions across country clusters. For clusters 2, 3, 4 and 6, the nonlinear MLP model demonstrated higher prediction quality than multiple linear regression, which confirms the increase in R2 and the decrease in MAE and MSE in the test samples. The most pronounced effect is observed for cluster 4, where the coefficient value changes from R2 = 0.28 for the linear model to R2 = 0.88 for the MLP model, which assumes the presence of complex nonlinear relationships between the studied factors. At the same time, for clusters 0, 1, and 5, the results of the linear and nonlinear models are close, which indicates a fairly stable structure of dependencies. Thus, in cluster 0, both approaches provide an equally high level of explanatory power (R2 = 0.97), which allows the use of simpler linear models without significant loss of accuracy.
A qualitative analysis was also conducted to assess the economic interpretability of the estimated models before and after clustering. The objective was to determine whether the identified relationships between explanatory variables and CO2 emissions are economically meaningful and whether clustering improves their consistency with theoretical expectations. The analysis demonstrated that the influence of explanatory variables differs substantially across clusters, reflecting the structural heterogeneity of the countries. Indicators related to renewable energy development and economic growth generally exhibit economically consistent relationships with CO2 emissions across most clusters, whereas variables associated with fossil fuel consumption show greater variation in both the magnitude and the direction of their estimated effects. In particular, the indicator x6 “Share of wind and solar in electrification”, although statistically significant, has a negative coefficient only in Cluster 0 (Canada, New Zealand, Norway, and Sweden), where a high penetration of renewable energy is associated with lower CO2 emissions. In the remaining clusters, the coefficient is positive, suggesting that the expansion of wind and solar generation is primarily associated with overall economic development and increasing electricity demand rather than an immediate reduction in emissions. These results indicate that the economic interpretation of the same indicator depends on the structural characteristics and stage of the energy transition within each country group. Overall, the cluster-specific models provide relationships that are more economically interpretable than those obtained from a single global model estimated on the full dataset. This confirms the value of clustering for identifying structurally homogeneous groups of countries and for selecting explanatory variables whose effects are consistent with the underlying economic and energy characteristics of each cluster (Zhytkevych, 2025a). Consequently, the findings support the use of differentiated modeling strategies tailored to the structural characteristics of individual country clusters. Therefore, the combination of clustering and nonlinear modeling forms a hybrid analytical framework that not only allows for increasing the accuracy of forecasting the decarbonization potential but also creates a basis for further integration of the results into the joint management system within the framework of the D-CPFR model.
3. Results
The proposed model integrates the processes of data collection and exchange, forecasting, decision-making and implementation of climate policy into a single analytical and management system at the macro level. A fundamentally important feature of the model is its application after the stage of country clustering, which allows adapting management decisions and forecasting models to the specifics of each group of countries and taking into account the identified heterogeneity of the impact of factors in the relevant group.
The integration of a cluster-oriented approach with joint planning mechanisms creates the prerequisites for the development of interstate networks and coordination of logistics flows, which is critically important in the context of decarbonization. In particular, modern research confirms that digitalization and integration of supply chains contribute to increasing the resilience, adaptability and overall efficiency of logistics processes, as well as improving coordination between network participants (Zhao et al., 2023).
The theoretical foundation of the D-CPFR framework combines economic theories of environmental externalities and green development with mathematical theories of clustering, nonlinear approximation, and optimization. From an economic perspective, Pigouvian externality theory provides the rationale for corrective environmental policies and the internalization of environmental costs, while institutional approaches to externalities emphasize the role of coordination and cooperation in addressing cross-border environmental effects (Pigou, 1920; Coase, 1960). Green growth perspectives further emphasize the role of technological change and investment in transforming economic structures toward lower-carbon development. From a mathematical perspective, the framework represents decarbonization potential as a multidimensional function of economic, energy, environmental, and institutional factors. SOM clustering is used to identify structurally similar country groups, while cluster-specific MLP models approximate potentially nonlinear relationships between the selected predictors and the CO2 emission factor. The optimization component then evaluates alternative scenarios, while the intercluster coordination term extends the analysis from independent cluster-level decisions toward coordinated decarbonization planning.
In this context, D-CPFR extends the classical principles of CPFR to the macro level, where countries act as elements of a single network capable of not only coordinating decarbonization policies, but also optimizing logistics and infrastructure interaction, which is crucial for reducing global CO2 emissions.
Within each cluster, a collaborative environmental governance framework is formed, which can be formalized as a set of interacting agents:
where nc denotes the number of countries in cluster c. While the clustering model is estimated using country-year observations , the collaborative governance framework is formulated at the country level. Therefore, each agent represents one country participating in collaborative decision-making within cluster .
Therefore, each country s is characterized by an information set Ik, and the collaborative information space of cluster c is defined as the union of individual information sets :
where represents the set of energy indicators, denotes the emission level, refers to investment indicators and characterizes the technological development of country k.
The prediction process at the cluster level is determined by the function , given in model (2), which is implemented as an MLP. Within the collaborative forecasting framework, an important component is the set of policy and investment scenarios . The key element of the D-CPFR model is the coordination function, which formalizes the collective decision-making process within the cluster and the problem of selecting the optimal scenario is reduced to minimizing the cluster loss function:
where each scenario represents a coordinated combination of policy , investment , technological , and regulatory decisions. The loss function aggregates and evaluates each candidate scenario by combining four quantitative criteria: environmental deviation from the target emission level, implementation cost, implementation risk, and social benefit. Each criterion is represented by a normalized quantitative indicator derived from the corresponding policy scenario. denotes the set of admissible strategies for country ; is the target CO2 emission level for cluster ; denotes the implementation cost; represents geopolitical, financial, or technological uncertainty; and denotes the expected social benefit, including energy accessibility, institutional stability, and inequality reduction. The coefficients determine the relative importance of the environmental, economic, risk, and social objectives in the optimization problem.
Thus, represents the subset of jointly feasible strategies for all countries within the cluster c and forms the basis for collaborative decision-making. The scenario set acts as a controlling factor in the forecasting (2) and loss (11) functions, shaping the cluster’s decarbonization trajectory. Consequently, countries within the same cluster can exchange information on emissions and energy balances, coordinate decarbonization scenarios, harmonize investment decisions, and implement joint management actions. This enables a transition from subjective national decision-making toward collective network-based governance of decarbonization processes. As a result, policy and investment decisions directly affect both the projected decarbonization trajectory and the value of the loss function, forming an integrated collaborative decision-making system within the cluster.
As noted earlier, an important structural element of the D-CPFR model is the integration of the principles of socially responsible governance; within the framework of the proposed model (11), the social component is formalized through the variable Social(c), which reflects institutional stability, the level of social inequality and access to energy resources. Modern research in the field of sustainable supply chain management confirms that the effectiveness of transformational (in particular, decarbonization) strategies is determined not only by economic parameters but also by the level of process transparency, technological maturity, institutional support and integration of environmental and social dimensions into the management system (Arabshahi & Garza-Reyes, 2025).
In particular, increasing the transparency of supply chains and their structural resilience is considered a key mechanism for reducing information asymmetry, operational risks and financial instability, which directly affects the effectiveness of implementing decarbonization policies and achieving climate goals (Hosseini Shekarabi et al., 2025). At the same time, insufficient integration of these components into the governance model leads to increased systemic risks and reduced efficiency of green transformations.
In the context of transition economies, institutional frictions and uneven distribution of resources can be formalized as an increase in dispersion in the component, which can potentially reduce the efficiency of implementing decarbonization strategies.
A particularly important implication of the proposed framework is that countries are grouped within the same cluster function not only as objects of comparative analysis but also as interconnected agents of a collaborative decarbonization management system. Such interaction supports data exchange, coordination of development scenarios, harmonization of investment strategies, and partial alignment of management decisions based on common structural characteristics.
4. Discussion
Based on the formed cluster structure within the D-CPFR model, it is proposed to distinguish two interrelated scenarios of its application: intracluster and intercluster. These scenarios should be interpreted as prospective policy options rather than empirically established causal effects, as the proposed coordination mechanisms were not directly implemented or tested in the present study.
The intracluster scenario applies to countries with similar structural characteristics, in particular high dependence on fossil energy sources and institutional instability (e.g., ). In this case, the D-CPFR model performs as a mechanism for coordinating transformations in a relatively homogeneous environment, where interaction is based on structural similarity and policy alignment. Dynamism cluster structures can be represented by transitions:
which reflects the structural evolution of national economies under the influence of policy reforms, investment decisions, technological progress and external economic conditions. The implementation of an optimal collaborative scenario does not necessarily imply that a country remains in the same cluster. Depending on the achieved structural changes, a country may either improve its position within the current cluster or move to another cluster characterized by a higher level of decarbonization performance. Such transitions are especially important because countries may gradually move toward positions that are structurally closer to decarbonization leaders within the cluster. Therefore, the intracluster scenario represents a coordinated pathway through which countries with similar structural characteristics gradually converge toward more advanced decarbonization trajectories by adopting more effective policy measures, investment priorities and technological solutions observed within the cluster. As a result, these movements contribute to the acceleration of decarbonization processes and the reduction of carbon intensity.
Forecasting within a cluster is carried out using cluster-specific functions , while the optimal scenario is determined by minimizing the loss function defined in Equation (11). Since the prediction function is estimated using historical country-year observations, the implementation of alternative collaborative scenarios leads to different predicted CO2 emission trajectories for the countries belonging to cluster . Consequently, the model captures the expected evolution of emissions through changes in the predicted values , without introducing an additional dynamic equation.
In contrast, the intercluster scenario describes cooperation between structurally heterogeneous clusters aimed at accelerating the diffusion of successful decarbonization practices. Unlike the intracluster scenario, where countries coordinate policies within groups of similar structural characteristics, the intercluster scenario focuses on knowledge exchange, technology transfer, investment cooperation and dissemination of institutional best practices between clusters with different levels of decarbonization performance. For example, cooperation between a cluster with advanced decarbonization performance (e.g., Canada, Norway and Sweden) and a cluster characterized by higher carbon intensity (e.g., China, Kazakhstan and Ukraine) may facilitate the adoption of cleaner technologies, institutional reforms and investment mechanisms. Consequently, intercluster collaboration does not require a separate forecasting model or loss function. Instead, it expands the feasible set of coordinated policy scenarios by incorporating external technological, financial and institutional opportunities available through cooperation with more advanced clusters.
The fundamental difference between the scenarios lies in the nature of the interactions: intracluster coordination is based on homogeneity, while intercluster coordination is based on structural complementarity and asymmetric exchange of resources. The D-CPFR model extends the cluster-specific optimization problem to a global coordination framework by introducing an intercluster coordination term:
where is the coordination coefficient describing the intensity of cooperation between clusters and , and performs role coordination mechanism that simultaneously takes into account synergistic effects cooperation and structural differences between all clusters.
The intracluster scenario, supported by the collaborative structures defined in Equations (9)–(11), is most effective for countries with similar structural characteristics, where policy synchronization, investment alignment, and collaborative governance may support improved decarbonization outcomes by facilitating the coordination of policy priorities and investment decisions across countries. Within this framework, countries belonging to the same cluster coordinate policy measures, exchange best practices, and implement compatible investment strategies. Such coordination could help reduce differences in development pathways, facilitate the diffusion of successful management approaches, and increase resilience to structural economic and energy shocks.
In contrast, the intercluster scenario reflects interactions between structurally heterogeneous groups of countries and enables technology transfer, investment redistribution, and dissemination of best practices. Such cooperation allows countries with more advanced decarbonization experience to support less advanced partners through knowledge sharing, technological cooperation, and coordinated investment initiatives. Consequently, the effectiveness of intercluster collaboration depends not only on the availability of financial and technological resources but also on the institutional capacity of recipient countries to adopt and effectively implement these measures. An important theoretical result is the transition from local optimization problems toward a global coordination framework formalized in Equation (13), where intercluster interaction terms represent convergence and cooperation effects between different decarbonization systems. Hence, the D-CPFR model can be interpreted primarily as a multi-level system of global coordination of decarbonization processes. This framework forms a comprehensive theoretical and methodological basis for building adaptive AI-driven systems for forecasting, coordinating and managing decarbonization processes through the integration of machine learning, cluster analysis, scenario optimization, and collaborative governance principles formalized throughout the proposed system of equations.
The practical application of D-CPFR can be illustrated through two coordination scenarios. Intracluster coordination involves countries with similar structural characteristics jointly developing decarbonization policies, investment priorities, and technological measures, while intercluster coordination focuses on technology transfer, investment cooperation, and the exchange of institutional practices between structurally different groups. Thus, cluster-specific forecasts can support coordinated policy and investment decisions. These scenarios are illustrative applications of the framework rather than empirically implemented policy interventions.
Despite the obtained results, several limitations should be acknowledged. First, the analysis is constrained by the availability and comparability of country-level data and covers 45 countries over 2014–2023; therefore, the findings may not fully represent countries outside the sample or periods beyond the study horizon. Second, the predictive results depend on the selected indicators, clustering structure, and modeling assumptions, while alternative machine-learning specifications may produce different results. Third, the cluster-specific findings should not be interpreted as universally generalizable because the identified groups reflect the characteristics of the selected sample and period. Finally, the proposed collaborative coordination scenarios have not yet been implemented in real-world policy settings.
The present study primarily evaluates whether cluster-specific nonlinear modeling improves predictive performance relative to a global linear benchmark; therefore, comparisons with additional machine-learning methods (e.g., Random Forest, Gradient Boosting, XGBoost or Support Vector Regression), together with cross-validation or robustness analysis, are identified as important directions for future research. Other prospects for further research include empirical validation of the framework using extended panel datasets and dynamic time-series observations, integration of additional financial and technological indicators, development of digital decision-support platforms for collaborative decarbonization management, and investigation of inter-cluster coordination mechanisms within global climate governance systems.
5. Conclusions
The developed integrated approach to assessing and forecasting the decarbonization potential of countries combines cluster analysis, machine learning and collaborative governance methods within the D-CPFR framework. The proposed methodology makes it possible to account for the nonlinear relationships between economic, energy, institutional, technological, and social determinants of decarbonization, while simultaneously considering significant cross-country heterogeneity, which is critical for the adequate modeling of climate trajectories.
The scientific novelty of the study lies in extending the classical CPFR concept to the macroeconomic governance of decarbonization processes and integrating it with AI-driven cluster-specific forecasting models based on SOM and MLP. An additional contribution is the formalization of scenario-oriented decision-making through the multi-criteria optimization function, which integrates climate objectives, economic costs, technological and geopolitical risks and social consequences.
The empirical results confirm the effectiveness of the hybrid AI-driven approach compared with traditional linear models. In particular, the integration of clustering and nonlinear neural-network forecasting functions significantly improves prediction accuracy for clusters characterized by complex nonlinear structures and transformation dynamics. The obtained results demonstrate that clustering reduces structural forecasting errors and reveals hidden dependencies that cannot be adequately captured within global linear specifications. Consequently, the D-CPFR framework transforms forecasting from an isolated analytical procedure into an integrated collaborative management system for decarbonization processes.
However, the present empirical analysis does not directly test the effectiveness of collaborative governance mechanisms or their real-world climate-policy outcomes. Therefore, the proposed intracluster and intercluster coordination mechanisms should be interpreted as potential applications of the framework rather than empirically demonstrated effects.
At the same time, the findings should be interpreted in light of the study’s limitations, including the country and time coverage of the dataset, modeling assumptions, and the absence of real-world implementation of the proposed coordination scenarios. Further research should therefore examine additional machine-learning methods, robustness and cross-validation procedures, broader country and time coverage, and empirical case studies to assess the practical effectiveness of the D-CPFR framework.
The practical significance of the proposed approach lies in its applicability for supporting climate and energy policymaking at national and supranational levels, designing green investment strategies, and coordinating long-term energy transition scenarios. The framework is especially relevant for economies in transition, where institutional instability, resource constraints, and high structural volatility require adaptive AI-driven analytical instruments.
Author Contributions
Conceptualization, O.Z. and A.M.; methodology, O.Z. and A.M.; software, O.Z.; validation, O.Z., A.M. and N.O.; formal analysis, O.Z.; investigation, O.Z.; resources, data curation, O.Z. and A.M.; writing—original draft preparation, O.Z. and A.M.; writing—review and editing, O.Z., A.M. and N.O.; visualization, O.Z.; supervision, A.M.; project administration, N.O. All authors have read and agreed to the published version of the manuscript.
Funding
The research received no specific funding but that the APC was funded by Lulea University of Technology.
Institutional Review Board Statement
Not applicable.
Informed Consent Statement
Not applicable.
Data Availability Statement
The data used in this study are publicly available from EnerData (2024), World Bank (2024), and Geopolitical Risk Index (2025). All datasets are properly cited in the reference list. No proprietary or restricted datasets were used. The processed dataset and code used for modeling can be made available from the corresponding author upon reasonable request.
Acknowledgments
During the preparation of this manuscript, the authors used ChatGPT (OpenAI) solely for language editing, code correction and formatting assistance. The authors have reviewed and edited all outputs and take full responsibility for the content of this publication. The authors also acknowledge institutional support from the American University of Kurdistan, Kyiv National Economic University named after Vadym Hetman, and Luleå University of Technology.
Conflicts of Interest
The authors declare no conflicts of interest. The funders had no role in the design of the study; in the collection, analyses, or interpretation of data; in the writing of the manuscript; or in the decision to publish the results.
Abbreviations
The following abbreviations are used in this manuscript:
| AI | Artificial Intelligence |
| SOM | Self-organizing Map |
| D-CPFR | Decarbonization–Collaborative Planning, Forecasting and Replenishment |
| MLP | Multilayer Perceptron |
| ESG | Environmental, Social and Governance |
Appendix A
Table A1.
A fragment of the dataset with 13 indicators after data standardization.
Table A2.
The list of 13 indicators and 45 countries used in the dataset.
Appendix B
Figure A1.
Actual and predicted CO2 values for training and test samples based on a linear regression model built for the entire set of countries (Zhytkevych, 2025a).
Appendix C
Figure A2.
Graphical illustration of self-organizing map of seven clusters for 45 countries based on 12 indicators for the period of 2014–2023.
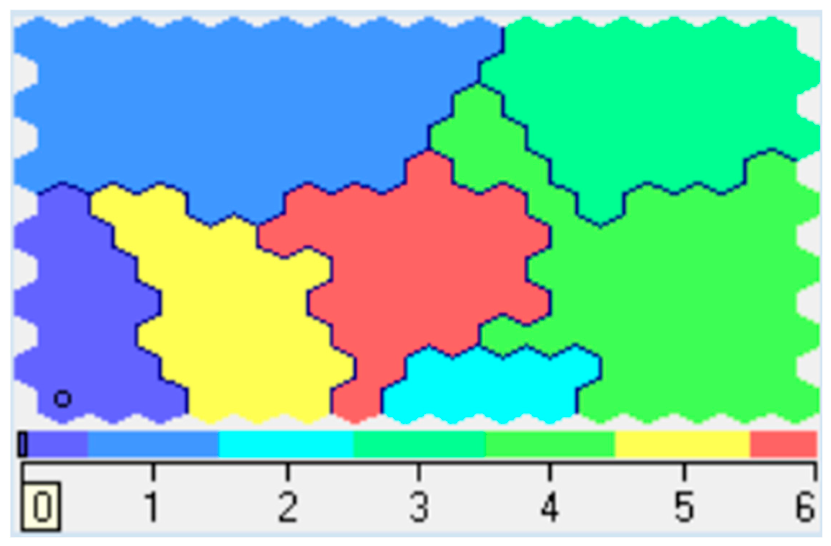
Table A3.
Outcomes of clustering based on 12 indicators for 45 countries (2014–2023).
Appendix D
Code fragment for implementing model training by minimizing MSE using the Adam algorithm:
(“mlp”, MLPRegressor(
hidden_layer_sizes = arch,
activation = “logistic”,
solver = “adam”,
max_iter = 3000,
early_stopping = True,
learning_rate = “adaptive”
))
The predicted values of the model are defined as:
y_pred = model.predict(X)
Model performance is evaluated using:
mse = mean_squared_error(y, y_pred)
Table A4.
Model specification and validation settings.
Appendix E
Figure A3.
Statistical characteristics of LR and MLP models for cluster 4.
Appendix F
Table A5.
The simulation results obtained from test dataset and recommended modeling method per cluster.
References
- Abdel-Rahman Tubishat, B. M., Alazzam, F. A. F., Hryhoruk, P., Blikhar, M., Zhyhulin, O., & Karvatska, N. (2024). Sustainable legal development in the region: Strategy for integrating e-commerce platforms in the domestic market in the era of Industry 5.0. International Journal of Sustainable Development and Planning, 19(6), 2221–2228. [Google Scholar] [CrossRef] [Scilit]
- Arabshahi, M., & Garza-Reyes, J. A. (2025). Advancing sustainable supply chain management: Emerging trends, challenges and determinants of success. Modern Supply Chain Research and Applications, 8(1), 1–21. [Google Scholar] [CrossRef] [Scilit]
- Chen, Z., Zhang, M., Bai, J., Wu, J., & Chang, I.-S. (2025). A review of the application of machine learning in carbon emission assessment studies: Prediction optimization and driving factor selection. Science of the Total Environment, 987, 179678. [Google Scholar] [CrossRef] [Scilit] [PubMed]
- Coase, R. H. (1960). The problem of social cost. The Journal of Law and Economics, 3(1), 1–44. [Google Scholar] [CrossRef] [Scilit]
- EnerData. (2024). World energy & climate statistics—Yearbook 2024 [Dataset]. Available online: https://yearbook.enerdata.net/total-energy/world-consumption-statistics.html (accessed on 11 May 2026).
- Geopolitical Risk Index. (2025). Geopolitical risk index [Dataset]. Available online: https://www.geopriskindex.com/results-final-risk-index/ (accessed on 11 May 2026).
- Güney, T. (2024). How effective is business climate on CO2 emissions? A MMQR analysis for OECD countries. Journal of Environmental Management, 370, 122893. [Google Scholar] [CrossRef] [Scilit] [PubMed]
- Hagan, M. T., Demuth, H. B., Beale, M. H., & De Jesús, O. (2014). Neural network design (2nd ed.). Martin Hagan. Available online: https://dl.acm.org/doi/abs/10.5555/2721661 (accessed on 11 May 2026).
- Hosseini Shekarabi, S. A., Kiani Mavi, R., & Romero Macau, F. (2025). Supply chain resilience: A critical review of risk mitigation, robust optimisation, and technological solutions and future research directions. Global Journal of Flexible Systems Management, 26(3), 681–735. [Google Scholar] [CrossRef] [Scilit]
- Intergovernmental Panel on Climate Change. (2022). Climate change 2022: Impacts, adaptation, and vulnerability. Cambridge University Press. [Google Scholar] [CrossRef] [Scilit]
- Kiv, A., Hryhoruk, P., Khvostina, I., Solovieva, V., Soloviev, V., & Semerikov, S. (2020). Machine learning of emerging markets in pandemic times. In A. Kiv (Ed.), Machine learning for prediction of emergent economy dynamics: Proceedings of the selected papers of the special edition of International Conference on Monitoring, Modelling & Management of Emergent Economy (M3E2-MLPEED 2020) (Vol. 2713, pp. 1–20). CEUR Workshop Proceedings. Available online: https://ceur-ws.org/Vol-2713/paper00.pdf (accessed on 11 May 2026).
- Kohonen, T. (2013). Essentials of the self-organizing map. Neural Networks, 37, 52–65. [Google Scholar] [CrossRef] [Scilit] [PubMed]
- Leal Filho, W., Schmidberger, I., Sharifi, A., Vargas, V. R., Rampasso, I. S., Dibbern, T., Liakh, O., Aina, Y. A., Trevisan, L. V., Mbah, M. F., Anholon, R., & Kozlova, V. (2024). Design thinking for sustainable development: A bibliometric analysis and case study research. Journal of Cleaner Production, 455, 142285. [Google Scholar] [CrossRef] [Scilit]
- Lee, J., Shin, K., Park, J., Kim, C., & Cho, K. (2022). Communication problems and alternatives in environmental impact assessment. Environmental Impact Assessment Review, 95, 106781. [Google Scholar] [CrossRef] [Scilit]
- Lyu, J., Liu, T., Cai, B., Qi, Y., & Zhang, X. (2023). Heterogeneous effects of China’s low-carbon city pilots policy. Journal of Environmental Management, 344, 118329. [Google Scholar] [CrossRef] [Scilit] [PubMed]
- Miroshnychenko, I., Kravchenko, T., & Drobyna, Y. (2021). Forecasting electricity generation from renewable sources in developing countries. Neuro-Fuzzy Modeling Techniques in Economics, 10, 164–198. [Google Scholar] [CrossRef] [Scilit]
- Pigou, A. C. (1920). The economics of welfare. Macmillan and Co., Limited. [Google Scholar]
- World Bank. (2024). World development indicators [Dataset]. Available online: https://datacatalog.worldbank.org/search/dataset/0037712 (accessed on 11 May 2026).
- Xiang, N., Li, S., Shu, C., & Xu, F. (2023). Dynamic material flow analysis of Chinese ethylene production processes. Journal of Cleaner Production, 392, 136282. [Google Scholar] [CrossRef] [Scilit]
- Zatonatska, T., Soboliev, O., Artyukhov, A., Zatonatskiy, D., Balan, V., Wołowiec, T., & Woźniak, D. (2025). Sustainable energy investments: ESG-centric evaluation and planning of energy projects. Energies, 18(8), 1942. [Google Scholar] [CrossRef] [Scilit]
- Zhao, N., Hong, J., & Lau, K. H. (2023). Impact of supply chain digitalization. International Journal of Production Economics, 259, 108817. [Google Scholar] [CrossRef] [Scilit] [PubMed]
- Zharova, L., Zhytkevych, O., & Chaplynska, N. (2022). Ukrainian firms’ transition toward a low-carbon economy: How to be proactive. International Journal of Energy, Environment and Economics, 30(3), 365–384. [Google Scholar]
- Zhytkevych, O. (2025a). Review and selection of clustering algorithms for datasets in the context of countries’ decarbonization. Economy of Ukraine, 68(11), 43–55. [Google Scholar] [CrossRef] [Scilit]
- Zhytkevych, O. (2025b). Step by step modeling of CO2 emissions using Kohonen self-organizing maps. Modeling and Information System in Economics, 105, 45–70. [Google Scholar] [CrossRef] [Scilit]
- Zhytkevych, O., & Brochado, A. (2022). Modeling national decarbonization capabilities using Kohonen maps. Neuro-Fuzzy Modeling Techniques in Economics, 11, 3–24. [Google Scholar] [CrossRef]
- Zhytkevych, O., Matviychuk, A., & Kmytiuk, T. (2023). Modeling nations’ decarbonisation potential. In F. Ortiz-Rodríguez, S. Tiwari, P. Usoro Usip, & R. Palma (Eds.), Electronic governance with emerging technologies (Vol. 1888, pp. 60–77). Communications in Computer and Information Science. Springer. [Google Scholar] [CrossRef] [Scilit]
Disclaimer/Publisher’s Note: The statements, opinions and data contained in all publications are solely those of the individual author(s) and contributor(s) and not of MDPI and/or the editor(s). MDPI and/or the editor(s) disclaim responsibility for any injury to people or property resulting from any ideas, methods, instructions or products referred to in the content. |
© 2026 by the authors. Licensee MDPI, Basel, Switzerland. This article is an open access article distributed under the terms and conditions of the Creative Commons Attribution (CC BY) license.