


Abstract
Brazil’s agricultural sector is characterized by persistent productive duality: a technologically advanced export-oriented segment coexists with a large stratum of smallholders generating low economic returns. Understanding the economic determinants of this gap requires moving beyond individual farm surveys toward systemic, nationally representative evidence. This study examines the socioeconomic drivers of sustainable technology adoption and their effect on the Gross Value of Production (GVP) in Brazilian agriculture, using data from the 2017 Agricultural Census aggregated to 558 micro-regions and Partial Least Squares Structural Equation Modeling (PLS-SEM). Unlike prior survey-based studies, the census-based approach reduces sample selection bias relative to small-sample surveys and supports a macro-level, ecological analysis grounded in complete census coverage. The structural model explains 69.2% of the variance in technology adoption (R2adj = 0.692) and 47.4% of the variance in GVP (R2adj = 0.474). The results show that rural cooperatives are the dominant institutional mechanism driving both credit access (β = 0.733) and technical assistance (β = 0.746), with effect sizes far exceeding those of individual-level factors. Access to technical information (β = 0.215) and technology adoption itself (β = 0.179) also positively influence GVP. These findings indicate that overcoming productive duality requires a systemic policy approach centered on rural cooperativism, digital connectivity, and institutional capacity.
Keywords:
sustainable agriculture; technology adoption; PLS-SEM; productive duality; census data; collective organizations; Brazil JEL Classification:
Q12; Q16; Q18
1. Introduction
Climate change threatens food production by raising global temperatures and increasing levels of atmospheric CO2—one of the main greenhouse gases. These changes trigger extreme weather events, including droughts, heavy rainfall, heatwaves, cold snaps, and shifts in precipitation patterns (Malhi et al., 2021). Such temperature variations reduce agricultural productivity across various countries, affecting staple crops like cotton, rice, barley, sugarcane, sunflower, cassava, maize, soybean, and sorghum.
Technological intensification in agriculture primarily aims to increase productivity and enhance food output. However, these strategies often harm soil health. Consequences include declines in soil organic matter and biological diversity, increased erosion and physical degradation, reduced nutrient-use efficiency, groundwater pollution, and higher greenhouse gas (GHG) emissions (Kopittke et al., 2019; Kabato et al., 2025). Soil degradation essentially involves the loss of biological, physical, and chemical characteristics necessary for plant development (Gao et al., 2024).
Adopting sustainable technologies is essential for building resilience against climate variability, raising productivity, and conserving natural resources such as water, biodiversity, and soil (Ogwu & Kosoe, 2025). Agricultural sustainability, in this sense, rests on redesigning production systems to integrate ecological processes—nutrient cycling, pest regulation, and soil-forming processes—into farm management while making productive use of farmers’ collective knowledge and capacities (Pretty, 2008). Evidence from sustainable-intensification programs elsewhere in the developing world shows that such integration can raise yields and resource-use efficiency at scale when supported by appropriate institutions and knowledge-sharing networks (Pretty et al., 2011). Key technologies that contribute to soil conservation include crop rotation, no-till systems, and the use of inputs, correctives, and fertilizers (Manda et al., 2016; Topa et al., 2025). Despite their importance, adoption rates in Brazil remain low. According to the 2017 Agricultural Census, out of 5.07 million rural properties nationwide, only 946,600 used crop rotation (18.66%), 553,380 used no-till systems (10.91%), 2.14 million used fertilizers (42.27%), and 728,540 used soil correctives (14.36%) (IBGE, 2019).
Technology adoption in agriculture is a complex process shaped by environmental, cultural, economic, institutional, political, and social factors. These can be grouped into three categories: (a) characteristics of the socio-economic environment where the farm is located, (b) farm characteristics, and (c) farmer characteristics (Munguia & Llewellyn, 2020; Procópio et al., 2024; Procópio, 2024). This process is consistent with diffusion-of-innovations theory, which frames adoption as a sequential, socially embedded learning process rather than a single binary decision (Rogers, 2003). At the systemic level, the innovation-systems perspective further emphasizes that adoption outcomes depend not only on individual farm attributes but also on the density and quality of institutional linkages—extension services, cooperatives, credit providers, and research organizations—that structure the flow of knowledge and resources to producers (Spielman & Birner, 2008). Empirical evidence from other developing-country contexts corroborates this systemic view: extension access and cooperative membership have been shown to jointly enhance technology adoption and household welfare, with effects that are amplified when combined with formal credit access (Wossen et al., 2017).
Brazilian agriculture exhibits a persistent duality. On one hand, a group of highly technical and specialized agents produces food and raw materials for processing industries and domestic and international markets. On the other, a large segment of rural producers lives in socioeconomic vulnerability, producing mainly for family subsistence. These producers need financial resources, land access, and appropriate technologies to increase their productivity and output (Pereira et al., 2024).
The 2017 Census illustrates this gap. Most rural properties had low agricultural productivity: approximately 3.73 million establishments (73.98% of the total) generated an annual Gross Value of Production (GVP) of up to BRL 25,000 (about US$ 7837) (IBGE, 2019). Despite the potential of sustainable technologies to mitigate climate impacts and improve economic outcomes, the complex interplay among socioeconomic drivers, technology adoption, and GVP remains underexplored in Brazil (Procópio, 2024; Tanure et al., 2024).
This study examines the socioeconomic determinants of sustainable technology adoption and analyzes their influence on GVP in the Brazilian agricultural sector. Structural Equation Modeling (SEM) is employed to analyze the interactions among farm-level characteristics, technological choices, and economic performance, thereby uncovering the structural barriers that perpetuate productive duality. Unlike prior farm-level surveys with limited geographic scope, this research draws on national census data aggregated to 558 micro-regions, providing a macro-level, ecological analysis grounded in complete national census coverage of the determinants of adoption and their economic consequences.
2. Materials and Methods
2.1. Study Area and Data Source
The data for this study were obtained from the 2017 Agricultural Census, conducted by the Brazilian Institute of Geography and Statistics (IBGE). This census represents the official survey of the Brazilian agricultural sector, collecting data on land use, the technological patterns of production systems, and the socioeconomic conditions of rural producers. The unit of analysis was the Brazilian micro-region, comprising 558 units.
2.2. Theoretical Model and Hypotheses
Properly understanding the technology adoption process in the agricultural sector requires moving beyond the traditional binary decision framework (adopt or not adopt) and treating the phenomenon as a dynamic, multi-stage learning process. A central premise is that farmers are motivated to improve their current situation, which could be driven by economic factors (increasing productivity and profit, for example) or be related to the family’s living conditions (incorporating labor-saving technologies so that the producer has more time to spend with family members). Moreover, it must be recognized that producers have limited resources (time, money, information, and cognitive capacity) and cannot immediately determine which technologies offer the greatest relative advantages for achieving their personal goals (Weersink & Fulton, 2020).
Adopting technology in the agricultural sector generally involves a social process, as farmers seek information from networks of contacts (trade associations, cooperatives, associations, extension companies, other farmers, etc.) or operate as part of a family team that manages the farm. When a decision on technology adoption is very complex, the producer’s decision-making process tends to be a shared social endeavor (Pannell et al., 2006).
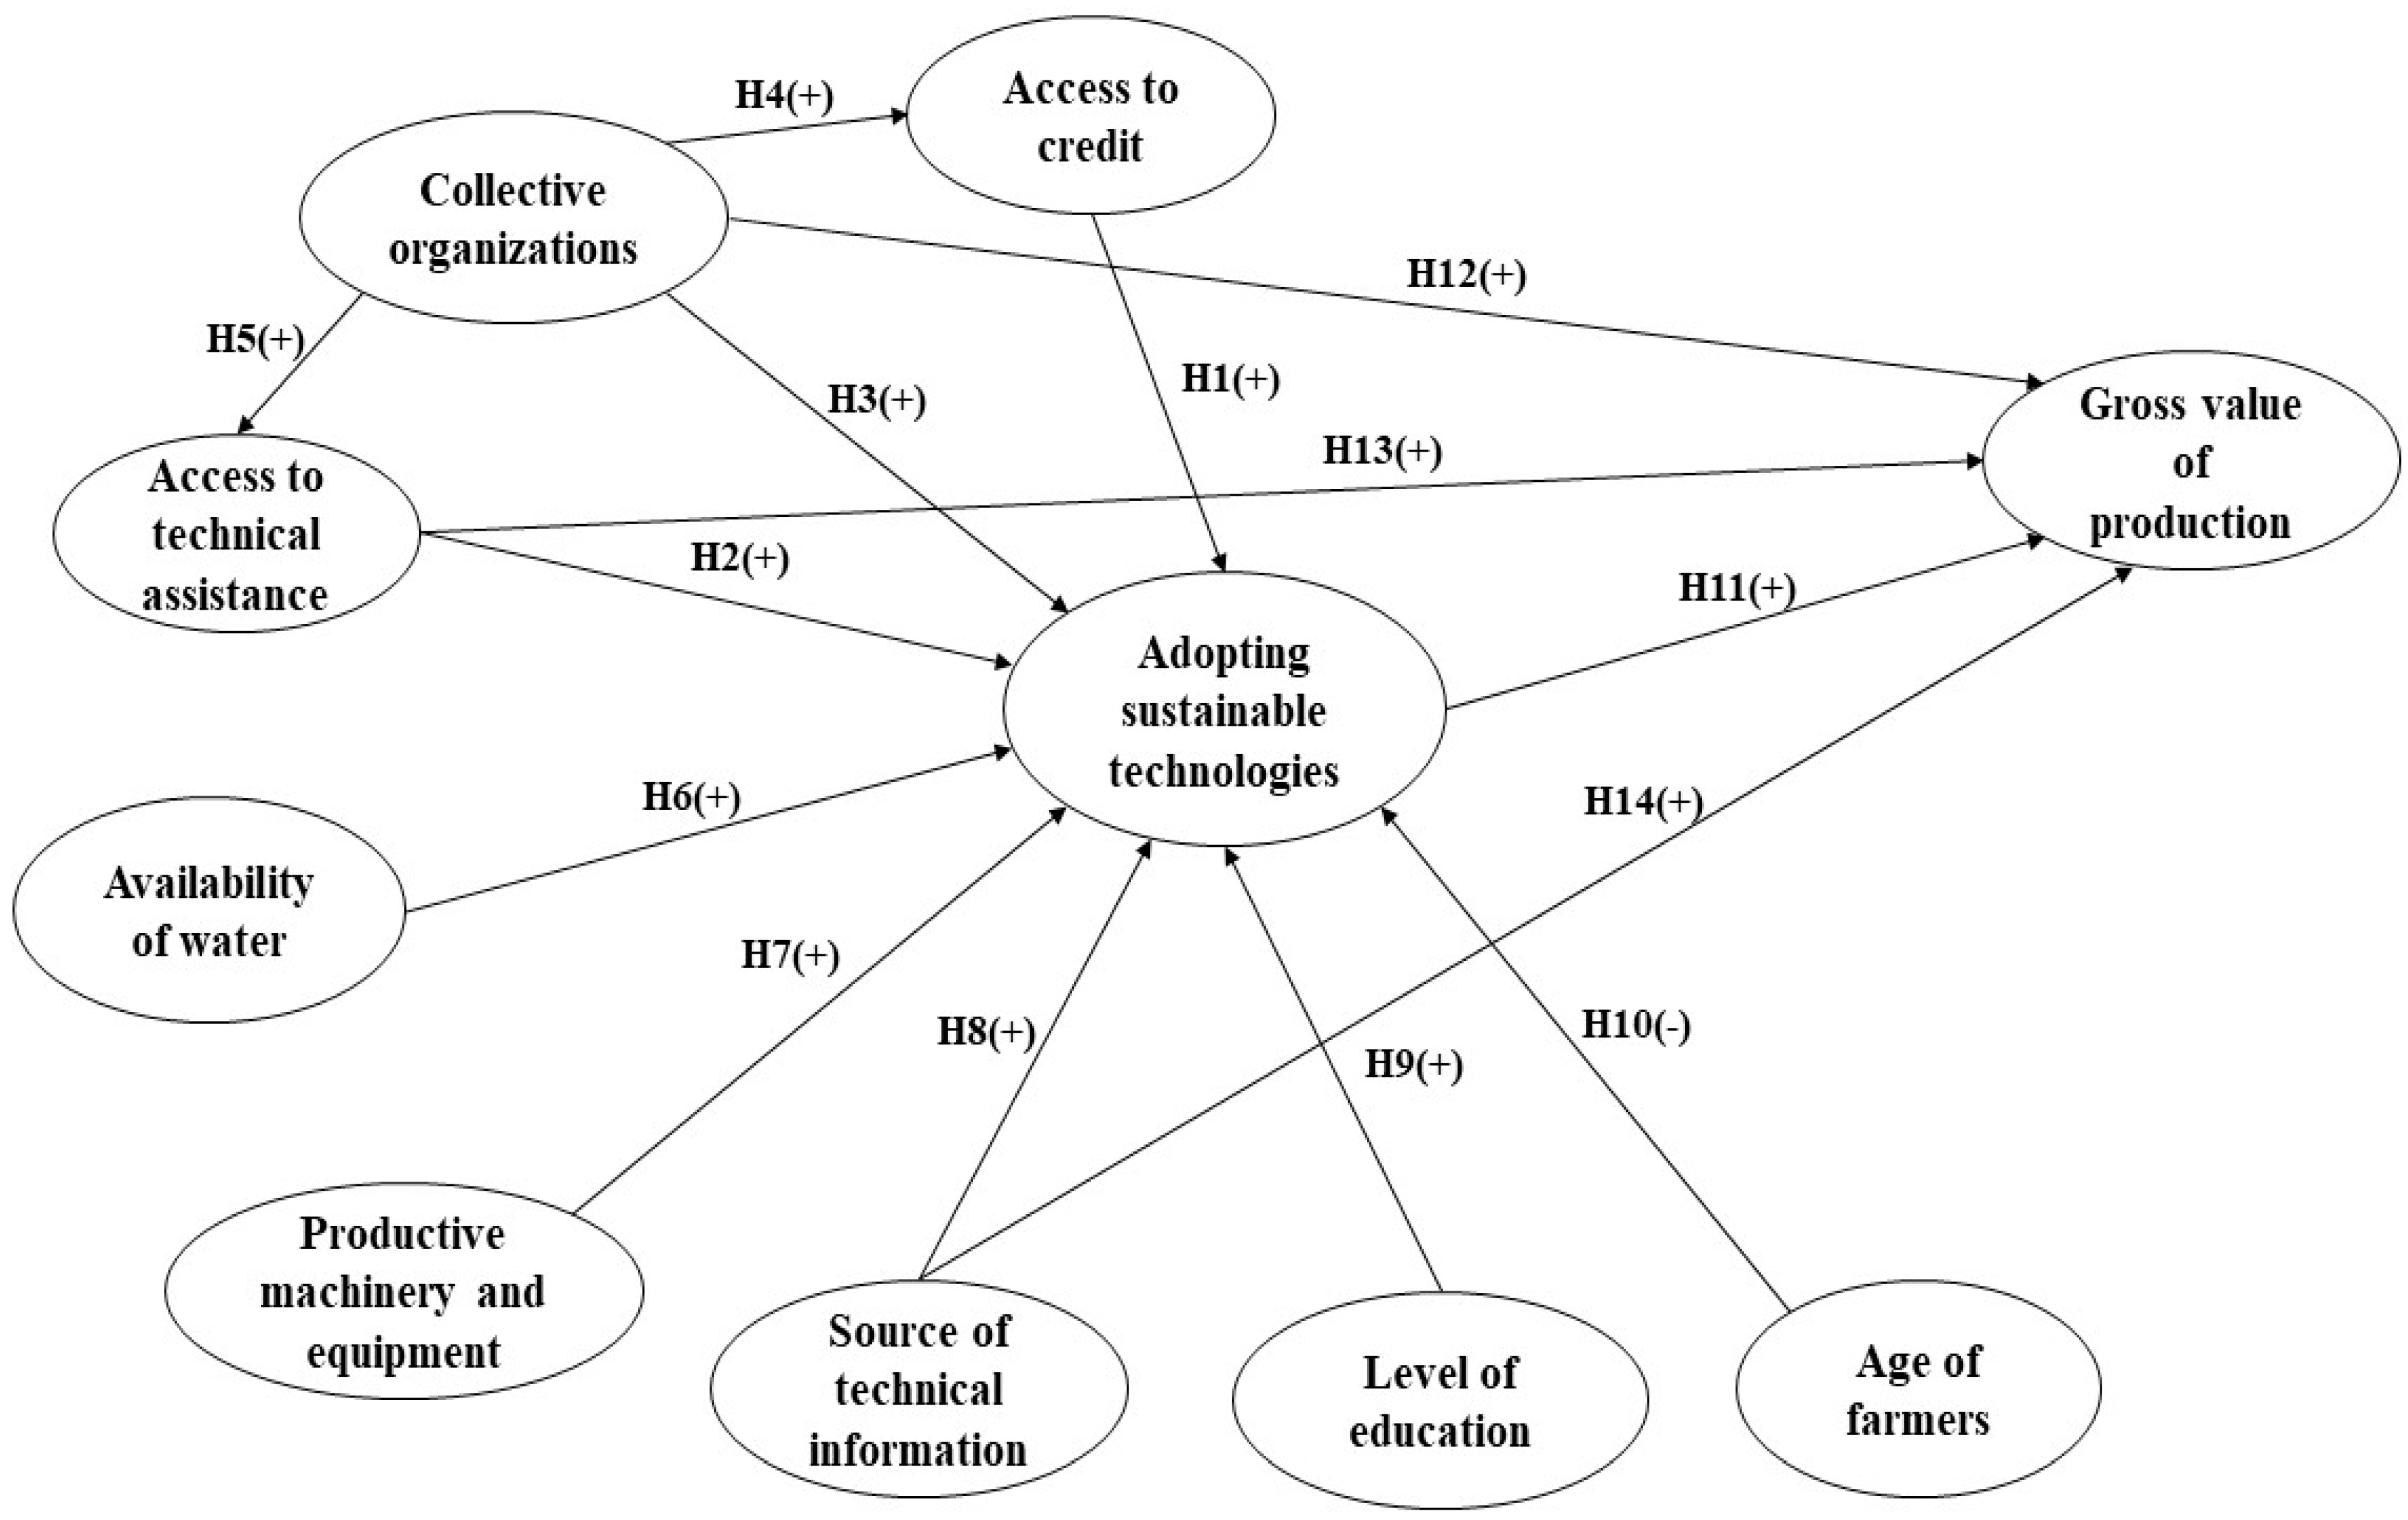
The adoption of technology in the agricultural sector is positively influenced by access to credit (H1) and technical assistance (H2) (Ruzzante et al., 2021). The participation of rural producers in collective action entities facilitates the exchange and acquisition of technical information on and experience in the use of technologies in agricultural production systems, thereby contributing to technology adoption (H3) (Zhang et al., 2020). It also facilitates access to technical assistance services (H4) and credit (H5) (Markelova et al., 2009).
Water availability on rural properties contributes to the adoption of technology in the rural sector (H6) (Kharel et al., 2023). The presence of productive machinery and equipment (H7) (Jones-Garcia & Krishna, 2021), as well as sources of technical information (newspapers, magazines, and devices with internet connection) (H8) (Giua et al., 2021), also exerts a positive influence on the technology adoption process in the agricultural sector.
Higher levels of education among rural producers positively influence the adoption of agricultural technologies (H9) (Paltasingh & Goyari, 2018). Farmer age is negatively associated with technology adoption in the rural sector (H10). Older rural producers may exhibit less energy, have a shorter planning horizon (compared to younger individuals), and show greater resistance to changes needed in the production system when implementing new technology (Souza Filho et al., 2011).
Beyond the determinants of adoption, the structural model assesses the factors driving economic performance. First, the adoption of technology is hypothesized to exert a significant positive influence on GVP (H11), as technological intensification optimizes resource use and increases agricultural output (Geng et al., 2024). Similarly, the participation of rural producers in collective action organizations—such as cooperatives and associations—is expected to positively impact GVP (H12) by strengthening bargaining power, reducing transaction costs, and improving market positioning (Mutonyi, 2019).
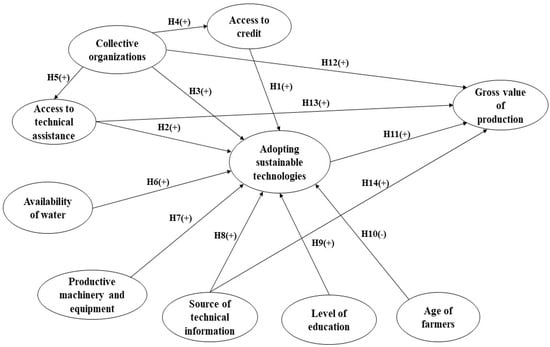
Furthermore, access to technical assistance services is considered a crucial driver of economic success, positively influencing GVP by professionalizing farm management and precisely applying productive inputs (H13) (Danso-Abbeam et al., 2018). Finally, access to diverse sources of technical information also positively influences GVP (H14) by reducing information asymmetry and enabling producers to adopt more efficient, data-driven production strategies (Nikam et al., 2022). The relationships among the hypotheses are presented in Table 1 and Figure 1.
Table 1.
Hypotheses of the theoretical model.
Figure 1.
Proposed theoretical model and research hypotheses. Source: the authors (2026).
2.3. Technical Data Analysis
Data were analyzed using Structural Equation Modeling (SEM), a multivariate statistical technique that describes the relationships among constructs—latent variables measured through multiple indicators (Hair et al., 2017; Quevedo-Silva & Pereira, 2022). This study employs Partial Least Squares (PLS-SEM), an approach where a series of least-squares regressions estimates the model parameters. PLS-SEM involves the assessment of two models: the measurement model (outer model), which evaluates the relationships between constructs and their indicators (observable variables), and the structural model (inner model), which assesses the relationships among the constructs themselves to validate the theoretical hypotheses (Nascimento & Macedo, 2016).
Initially, 42 observable variables were selected from the 2017 Agricultural Census to represent the constructs in the theoretical framework (Figure 1). To ensure comparability, these variables were normalized by the total number of properties (NP), the total area of properties (AP), or the total personnel employed (PE) (Gomes et al., 2024).
The choice of denominator follows the nature of the raw census count for each indicator (e.g., counts of establishments using a given input are normalized by NP, while counts tied to farmed area or hired labor are normalized by AP or PE, respectively), and indicators within the same construct generally share a denominator by design, since they describe the same underlying unit of observation; this is a modeling choice made for conceptual consistency within each construct rather than a source of purely mechanical correlation, though we acknowledge that shared denominators can inflate within-construct correlations to some degree, which is a further reason to prioritize robustness checks using alternative normalizations and raw counts with appropriate controls for micro-region size.
Rate-based normalization of this kind—expressing establishment counts relative to the number of properties, area, or personnel in each micro-region—follows the same denominator logic previously employed for census-based agricultural indicators in Brazil (Gomes et al., 2024) and mirrors the approach used in other agricultural-census-based regional studies—for example, Xavier et al. (2022), who normalize Portuguese municipal-level agricultural census indicators by number of farms and by hectare of utilized agricultural area for the same reason: raw counts are not directly comparable across regions of very different size.
We have not, however, formally re-estimated the structural model using an alternative normalization base (e.g., raw counts with micro-region-size controls) to confirm that path coefficients are unaffected by this specific choice; this remains an open robustness check, which we flag explicitly in the Limitations (Section 5) rather than assume it is not relevant.
All statistical procedures were performed using SmartPLS® 3 software (SmartPLS GmbH, Bönningstedt, Germany).
Variable selection began with all census indicators conceptually linked to each construct in the theoretical framework (Figure 1); indicators were retained in the initial 42-variable model when they had a plausible theoretical link to their target construct and adequate cross-micro-region variability. Indicators were subsequently removed from the measurement model when their standardized outer loading fell below 0.40 or when their retention deteriorated the AVE or CR of the corresponding construct below the 0.50/0.70 thresholds (Hair et al., 2017); indicators with loadings between 0.40 and 0.70 were retained when their removal did not improve AVE/CR, following the recommendation that loadings in this intermediate range be evaluated by their impact on convergent validity rather than dropped automatically.
The AST construct combines fertilizer use with crop rotation, no-till systems, and soil correctives. Fertilizer use alone is not inherently a sustainable practice, since its environmental performance depends on type, application rate, timing, and agronomic context that the census does not capture. In this model, fertilizer use is retained as an AST indicator because, in combination with the other three indicators—each of which is unambiguously a conservation practice—it serves as a proxy for a broader pattern of technified, input-intensive management that typically co-occurs with conservation adoption in the Brazilian context; it should therefore be read as part of a composite indicator of technological intensification with a conservation orientation, rather than as an independent claim that fertilizer application is itself environmentally sustainable.
Regarding model specification, most constructs in this study (AST, ATA, AC, STI, CO, GVP) are treated as reflective, consistent with the assumption that their indicators are interchangeable manifestations of an underlying latent trait and are expected to co-vary, which the acceptable AVE and CR values in Table 2 support. Three constructs—PME (machinery and equipment), AW (water sources), and AF (age brackets)—combine indicators that could plausibly be specified as formative, since each indicator captures a distinct type of asset or age bracket rather than a strictly interchangeable manifestation of the same trait. These constructs were nonetheless evaluated using reflective criteria (loadings, AVE, CR) for consistency with the rest of the measurement model and because their indicators are conceptually correlated (e.g., ownership of one type of machinery is associated with ownership of others in more capitalized establishments), and they achieved acceptable reflective fit statistics (Table 2). We acknowledge this as a modeling simplification; a formative respecification of these three constructs is a direction for future refinement of the model.
Table 2.
Correlation matrix between latent variables.
Full definitions, denominators, and elimination status for the 42 initial observable variables are provided in Table A1 below, together with the normalization formulas and indicator-elimination criteria described in Section 2.3. In place of individual IBGE SIDRA table/cell identifiers, we provide complete variable definitions and formulas, which we consider sufficient for independent replication from the publicly available 2017 Agricultural Census microdata; the underlying census query parameters are available from the corresponding author upon direct request.
In accordance with journal policy on generative artificial intelligence (GenAI), we disclose that a GenAI large language model (Claude Sonnet 5, Anthropic, San Francisco, CA, USA) was used during the preparation of this manuscript for textual adjustment and structural organization of the article. The authors have reviewed and edited all GenAI-assisted output and take full responsibility for the content of this publication.
3. Results
3.1. Measurement Model
The first stage of the SEM involves validating the measurement model through convergent validity, discriminant validity, and Composite Reliability. Convergent validity was assessed using the Average Variance Extracted (AVE), with a cutoff value of 0.50. Discriminant validity, which ensures the distinction of a construct from others, was evaluated using cross-loadings and the Fornell and Larcker (1981) criterion. According to this criterion, the square root of the AVE for each latent variable must be greater than its correlations with all other constructs in the model. Furthermore, Composite Reliability (CR) for the constructs was used to assess sample bias and was required to be greater than 0.70 (Hair et al., 2017).
The initial model, comprising 42 observable variables, did not initially meet all measurement model criteria. Consequently, iterative adjustments were made to the measurement model until it achieved adequate fit (AVE > 0.50; CR > 0.70) (Table 2). This was accomplished by removing low-loading indicators and applying a logarithmic transformation to the GVP indicator. The logarithmic transformation is essential for reducing skewness in the data distribution and improving the model’s predictive properties (Fávero et al., 2014).
The HTMT results (Appendix A, Table A2) reveal a substantial discriminant-validity concern that qualifies the interpretation of several structural paths. Using the conservative HTMT ≤ 0.85 threshold (Henseler et al., 2015), 13 of the 45 construct pairs (29%) exceed this threshold, and six pairs—ATA–AC, ATA–AST, CO–AC, CO–ATA, GVP–ATA, and STI–ATA—exceed 1.00, indicating that these construct pairs are not clearly distinguishable on the basis of the available indicators. The violations concentrate heavily around ATA and CO, the two constructs retained with only two indicators each (ATA2/ATA3 and CO1/CO4, respectively) after measurement-model refinement; two-indicator reflective constructs are known to produce less stable, and often inflated, HTMT estimates in PLS-SEM. Substantively, ATA’s poor discriminability from AC, AST, CO, GVP, and STI, and CO’s poor discriminability from AC and PME, are consistent with this study’s central empirical narrative that rural cooperatives channel credit, technical assistance, and collective action through the same institutional structure (Section 4.3); statistically, however, this makes it difficult to attribute fully independent, uniquely identified effects to AC, ATA, and CO individually. We report this result transparently rather than omit it: the path coefficients for AC, ATA, and CO should be interpreted as capturing a broader dimension of institutional support channeled substantially through cooperatives, rather than as fully separable constructs, and we flag this as a priority for future model refinement—for example, respecifying AC, ATA, and CO as reflective indicators of a single higher-order “institutional support” construct, or enriching the ATA and CO measurement blocks with additional census indicators to stabilize their estimates.
Table 3 presents information on the adjusted measurement model, including the observable variables and their corresponding factor loadings (ranging from 0.379 to 0.938).
Table 3.
Observable variables of the adjusted measurement model.
To support discriminant validity, the factor loadings for the observed variables should exceed 0.70 (Hair et al., 2017). The variables AC3 (0.473), ATA2 (0.658), AW3 (0.379), STI2 (0.582), and LE1 (0.479) had factor loadings below 0.70. However, maintaining the largest possible number of indicators in the measurement model is advisable to avoid compromising the content validity of the constructs (Bido & Silva, 2019). In exploratory PLS-SEM models, Hair et al. (2017, p. 115) acknowledge that loadings between 0.40 and 0.70 may be retained when their removal would reduce AVE or CR below acceptable thresholds, or when the indicator captures theoretically relevant content not represented by other items in the construct.
A related specification concern is that ATA3 and CO1 are both drawn from census counts of cooperatives per property (cooperatives/np) but load on different constructs—ATA (access to technical assistance) and CO (collective organizations), respectively. This reflects two conceptually distinct roles that cooperatives play in the theoretical model rather than a duplicated measure: ATA3 captures cooperatives as a channel through which producers access technical assistance, whereas CO1 captures cooperative membership/participation itself as a form of collective organization. Discriminant validity between ATA and CO was nonetheless confirmed by the Fornell–Larcker criterion (Table 2), where the square root of the AVE for each construct exceeds their cross-construct correlation (0.746), supporting their treatment as distinct latent variables despite drawing on related census items.
One indicator, AW3 (artesian wells), falls below even the 0.40–0.70 exploratory range at 0.379. Its retention is justified primarily on content-validity grounds rather than statistical grounds alone: content validity concerns whether a construct’s indicator set adequately represents the full conceptual domain it is meant to measure (Nunnally & Bernstein, 1994), which is a criterion distinct from—and not fully substitutable by—the convergent-validity statistics (loadings, AVE, CR) used elsewhere in the measurement model. Water availability, as a construct, spans structurally distinct sources with different reliability, seasonality, and infrastructure requirements; artesian wells (AW3) capture a source qualitatively different from surface springs (AW1) and rivers/streams (AW2), namely groundwater accessed through fixed infrastructure rather than surface collection. Removing AW3 would leave the construct representing only surface-water sources, narrowing its content coverage and threatening construct validity even though doing so would mechanically raise the average loading. The full measurement-model assessment was re-run with AW3 included, and the AW construct meets the AVE (0.502) and CR (0.732) thresholds under this specification (Table 2), supporting its retention on both content and (minimally sufficient) statistical grounds.
We nonetheless flag AW3 as the weakest indicator in the model. As a robustness check, the structural model was re-estimated with AW3 excluded (AW measured by AW1 and AW2 only). All 14 structural path coefficients remained within 0.009 of their original values, and AW → AST, far from being driven by AW3, was slightly stronger and more precisely estimated without it (β = 0.066 vs. 0.057; p = 0.022 vs. 0.048). Discriminant validity for AW also improved: the LE–AW HTMT ratio dropped from 0.933 to 0.842, resolving that violation, while the six HTMT violations exceeding 1.00 (all involving ATA or CO) were unaffected, confirming they are unrelated to AW3 and specific to the thin ATA/CO measurement blocks discussed above.
3.2. Structural Model
The structural model was evaluated using Pearson’s coefficients of determination, multicollinearity analysis, f2 effect size, and the significance of the coefficients (Ringle et al., 2014; Bido & Silva, 2019) (Table 4). R2 measures the proportion of the variance in the endogenous latent variables (AST, AC, ATA, and GVP) explained by the structural model (Ringle et al., 2014). The adjusted R2 accounts for model complexity and sample size and ranges from 0 to 1 (Henseler et al., 2016).
Table 4.
Results of the structural model.
The model explained 69.20% (0.692) of the variance in the adoption of sustainable technologies (AST) in the Brazilian agricultural sector. In the constructs of access to technical assistance services (ATA) and credit (AC), the adjusted R2 values were 55.60% (0.556) and 53.60% (0.536), respectively. For the GVP construct, the adjusted R2 for GVP was 47.40% (0.474) (Table 4).
Collinearity was assessed using variance inflation factors (VIFs) for the latent variables. In the PLS-SEM approach, a VIF value below 5.00—equivalently, a tolerance (1/VIF) above 0.20—is used as the threshold to avoid collinearity in the model (Hair et al., 2017). For all causal relationships (H1 to H14), the VIF value was within the recommended range (Table 4).
4. Discussion
4.1. Robustness Check: Alternative Indicator Normalization
As requested during review, the structural model was re-estimated using an alternative, single-denominator normalization: all 27 retained observable variables were expressed relative to the number of properties (NP) in each micro-region, replacing the mixed NP/AP/PE scheme used in the main analysis for five indicators (AST3, ATA2, STI2, LE1, and GVP2). The model structure, indicator set, and estimation procedure (PLS-SEM, path weighting scheme, 5000-resample bootstrapping) were otherwise identical to the main analysis. Table 5 compares the two specifications.
Table 5.
Structural path coefficients under the original (mixed NP/AP/PE) and alternative (NP-only) normalization schemes.
Nine of the fourteen structural paths remain statistically significant and in the same direction under the alternative normalization, including all paths originating from CO (collective organizations), which strengthen rather than weaken (CO → AST rises from β = 0.160 to 0.380; CO → AC and CO → ATA are essentially unchanged). AW → AST, LE → AST, AC → AST, AST → GVP, and STI → GVP also remain significant, the latter more than 50% larger under the alternative specification. However, five paths do not survive the alternative normalization: ATA → AST (H2) and ATA → GVP (H13) both lose significance and ATA → AST changes sign; CO → GVP (H12) loses significance; STI → AST (H8) loses significance and changes sign; and AF → AST (H10) falls just short of the 5% threshold (p = 0.054).
This pattern is not random with respect to the model’s other diagnostics. The four paths that lose significance are precisely those originating from, or terminating in, the constructs already identified in the HTMT analysis (Section 3.1; Appendix A, Table A2) as having the weakest discriminant validity: ATA and CO show the most severe HTMT violations of any construct pair in the model, and STI’s discriminant validity with ATA is likewise poor (HTMT = 1.180). When the shared variance among these overlapping constructs is reshuffled by a change in indicator normalization, their individually estimated effects on AST and GVP shift accordingly—while CO’s paths, drawing on a comparatively better-identified construct, absorb more of that variance and strengthen. We therefore treat the specific direct effects of ATA (H2, H13) and STI on AST (H8) as not robust to normalization choice, and interpret them with corresponding caution in Section 4.2 and Section 4.4; the finding that collective organizations (CO) are the central institutional driver of adoption and GVP, and that STI’s effect on GVP is robust, is reinforced rather than undermined by this check.
4.2. Determinants of Sustainable Technology Adoption
The structural model confirms that adoption of sustainable technologies (AST) in Brazilian agriculture is a multidimensional phenomenon. The high explanatory power of this construct (R2adj = 0.692) demonstrates that integrating economic, informational, and individual factors provides a robust framework for understanding sustainable technological modernization. In social science research, an R2 above 0.40 indicates strong explanatory power (Yusuf et al., 2020).
The socioeconomic environment plays a central role. Access to credit (H1: β = 0.245, p < 0.01) positively influences adoption, with a small effect size (f2 = 0.083). Technical assistance (H2: β = 0.151, p < 0.01, f2 = 0.027) also shows a positive association in the main specification, but this path did not survive the alternative-normalization robustness check (Section 4.1) and should be interpreted with caution. This indicates that isolated credit or extension interventions have limited impact without broader institutional support. Technical assistance bridges the gap between innovation and field application, reducing knowledge gaps inherent to sustainable practices (Osumba et al., 2021). Credit enables “trialability,” providing liquidity for producers to test capital-intensive practices before scaling up (Pannell et al., 2006). These institutional mechanisms are reinforced by collective organizations (H3: β = 0.160, p < 0.01), which facilitate information exchange through peer networks (Souza Filho et al., 2011).
Farm characteristics also matter, though with modest effects. Water availability (H6: β = 0.057, p < 0.05) and possession of machinery (H7: β = 0.126, p < 0.01) were confirmed to play a role. Access to technical information sources shows a positive association with adoption in the main specification (H8: β = 0.233, p < 0.01; f2 = 0.082), consistent with informational infrastructure—including internet connectivity and specialized media—being relevant for managing sustainable intensification requirements (Giua et al., 2021); however, as with H2, this specific direct path did not survive the alternative-normalization robustness check (Section 4.1), and we discuss why below.
Farmer characteristics define cognitive capacity. Education level (H9: β = 0.157, p < 0.01; f2 = 0.043) contributes positively but does not constitute an isolated solution (Franchini et al., 2011). Regarding age (H10), the positive coefficient (β = 0.113) indicates that higher proportions of younger producers (under 45 years) are associated with greater adoption. However, the sharp decline in this demographic—from 38.79% in 2006 to 29.14% in 2017—represents a structural threat to future adoption. This directional finding is a direct consequence of measurement-model refinement rather than an ad hoc reinterpretation. The age construct was initially specified with six observable variables spanning the full age distribution of rural producers (under 25; 25–35; 35–45; 45–55; 55–65; and 65 years or older; Appendix A). During refinement (Section 2.3), the three oldest brackets did not meet the retention criteria and were removed, while the three youngest brackets (AF1–AF3, covering producers under 45) were retained with adequate loadings (0.710–0.867; Table 3). Because the six original brackets partition the same producer population in each micro-region, a higher share of younger producers is arithmetically the mirror image of a lower share of older producers. The positive coefficient on the retained AF construct is therefore consistent with—not a departure from—the original theoretical expectation that a larger share of older producers is associated with lower technology adoption; the refinement process simply identified the younger end of the age distribution as the statistically stronger empirical proxy for this relationship.
This analysis uses census-based data aggregated to 558 micro-regions. Unlike individual farm surveys with limited geographic scope, this approach reduces sample selection bias relative to small farm surveys and provides complete census coverage, though the resulting inferences are macro-level and ecological—describing relationships among micro-region aggregates rather than individual farm behavior—and remain subject to spatial aggregation effects and modifiable-areal-unit sensitivity.
4.3. The Role of Collective Organizations in Resource Access
Collective organizations (CO) emerge as fundamental catalysts for sustainable agricultural modernization. Hypotheses H4 (β = 0.733, p < 0.01) and H5 (β = 0.746, p < 0.01) were confirmed, with large effect sizes (f2 = 1.161 and 1.256, respectively). Based on Cohen’s (1988) criteria, these values indicate a substantial practical effect, exceeding those of individual-level predictors.
Cooperatives mitigate market failures by reducing transaction costs that often exclude smaller agents from formal markets (Neves et al., 2021). The large effect on technical assistance (H5) indicates that cooperatives complement or substitute state-provided extension services, offering more specialized and continuous support (Weybright et al., 2024). Similarly, the influence on credit access (H4) underscores the importance of credit cooperatives and collective bargaining power required by financial institutions (Jiang et al., 2024).
In a sector characterized by productive duality, collective participation is a strategic economic necessity, not merely a social trait. These organizations provide structural support that enables producers to overcome limited individual endowments, sharing and mitigating the technical and financial risks associated with new technologies (Ma et al., 2023). These effect sizes should nonetheless be interpreted with some caution: the HTMT analysis (Section 3.1; Appendix A, Table A2) indicates limited discriminant validity between CO and AC (HTMT = 1.028) and between CO and ATA (HTMT = 1.147), meaning collective organizations, credit access, and technical assistance are not fully statistically distinguishable in this model. The magnitude of H4 and H5 is therefore best read as evidence for a broader cooperative-centered institutional dimension—rather than as three fully independent, precisely separable effects—a distinction that does not overturn the substantive conclusion that cooperatives are central to resource access, but does temper how finely that conclusion can be decomposed with the current measurement model.
4.4. Impacts on the Gross Value of Production (GVP)
Technology adoption positively affects GVP (H11: β = 0.179, p < 0.01), though with a small effect size (f2 = 0.023). This suggests that while soil conservation and technical inputs are fundamental for productivity, their revenue impact is mediated by external factors such as price volatility and climatic stability (Lee, 2026).
Collective organizations (H12: β = 0.223, p < 0.01) and technical assistance (H13: β = 0.182, p < 0.01) also show positive associations with economic outcomes in the main specification. Neither path, however, survived the alternative-normalization robustness check (Section 4.1): CO’s direct effect on GVP became non-significant, though CO’s effect on AST—the other route through which collective organizations influence economic outcomes—strengthened substantially, so the broader conclusion that cooperative bargaining power matters for GVP is not overturned, only the specific direct CO → GVP and ATA → GVP paths reported here. Access to technical information (H14: β = 0.215, p < 0.01) further enhances GVP by reducing information asymmetry and enabling data-driven decisions (Bolfe et al., 2020).
Together, these determinants explain 47.4% of GVP variance (R2adj = 0.474), considered robust for economic performance models given agriculture’s inherent instability (Yusuf et al., 2020). These results reinforce the central premise: overcoming productive duality requires integrating sustainable practices with institutional support and information infrastructure (Vieira Filho & Fishlow, 2017). These results suggest that integrating sustainable practices with institutional support mechanisms and information infrastructure is closely associated with stronger economic performance from technological modernization, though the cross-sectional design of this study precludes establishing this relationship as strictly causal.
5. Conclusions
This study identified the socioeconomic determinants of sustainable technology adoption and their influence on the Gross Value of Production (GVP) in Brazilian agriculture. The evidence demonstrates that sustainable technological modernization is a systemic process in which institutional support, informational infrastructure, and cognitive capacity outweigh the mere availability of physical resources.
Main findings. Three results are particularly noteworthy. First, collective organizations—especially cooperatives—serve as structural catalysts for both credit access and technical assistance, with effect sizes (f2 = 1.161 and 1.256) that far exceed all other predictors. Second, technical information sources (digital connectivity and specialized media) significantly and robustly influence GVP; their positive association with adoption, though present in the main specification, did not survive the alternative-normalization robustness check (Section 4.1) and is reported with corresponding caution. This underscores the importance of rural informational infrastructure primarily through its economic-outcome channel. Third, the relatively small individual effects of credit and technical assistance indicate that isolated interventions are insufficient without complementary institutional arrangements, and the technical assistance path itself was not robust to normalization choice, reinforcing the case for institutional, rather than isolated, interventions.
Policy implications. Strategies to promote sustainable agriculture must move beyond credit lines. Interventions should focus on three pillars: (i) strengthening cooperativism to manage transaction costs and risks; (ii) investing in rural connectivity to support data-driven decision-making; and (iii) establishing targeted programs for younger farmers, whose propensity for innovation directly affects sectoral resilience.
Limitations and future research. The analysis is constrained by two main factors. First, the model does not capture external variables such as climate variability and global price fluctuations, which affect GVP beyond farm-level decisions.
Second, the study relies on 2017 Census data, as the subsequent census had not been published at the time of this research. While this does not compromise the validity of the structural relationships identified, the results should be interpreted within the institutional and economic context of that period.
Third, because the data are cross-sectional, the structural relationships estimated by PLS-SEM should be interpreted as statistical associations consistent with the hypothesized model rather than as strict causal effects; unobserved micro-region heterogeneity and reverse-causality pathways cannot be ruled out. Reverse causality is particularly plausible for the paths terminating in GVP: more productive micro-regions may be better able to attract or sustain cooperatives, machinery investment, information infrastructure, and technical assistance, rather than these institutional factors being purely exogenous drivers of GVP.
Fourth, because the unit of analysis is the micro-region rather than the individual farm, the results are subject to ecological-inference limitations and modifiable-areal-unit sensitivity: relationships observed among micro-region aggregates do not necessarily hold at the level of individual farms, and different aggregation boundaries could yield different estimates.
Fifth, the HTMT analysis (Section 3.1; Appendix A, Table A2) identified discriminant-validity violations for 13 of the 45 construct pairs, concentrated around ATA and CO—both measured with only two retained indicators—with six pairs exceeding the conservative threshold of 1.00. This limits the precision with which AC, ATA, CO, and, to a lesser extent, PME can be treated as fully independent constructs, and should be considered when interpreting the magnitude and relative ranking of their structural effects. Enriching the ATA and CO measurement blocks, or respecifying them as a single higher-order institutional-support construct, is identified as a priority for future model refinement.
Sixth, the census-based indicators were normalized by number of properties, area, or personnel employed following the established precedent (Section 2.3; Gomes et al., 2024; Xavier et al., 2022). A robustness check re-estimating the model with a single, NP-only normalization (Section 4.1, Table 5) confirms that most structural paths are stable, but four paths—ATA → AST (H2), ATA → GVP (H13), CO → GVP (H12), and STI → AST (H8)—lose statistical significance under this alternative specification, and a fifth (AF → AST, H10) becomes marginal. These are precisely the paths connecting the constructs already flagged for weak discriminant validity in the HTMT analysis (ATA, CO, STI), reinforcing that conclusions about these constructs’ individually estimated direct effects should be treated as provisional pending the measurement-model refinements discussed above, even though the broader role of collective organizations in adoption and GVP is, if anything, corroborated by the same check. (A separate robustness check excluding the weakest indicator, AW3, was also completed—see Section 3.1—and left all path coefficients materially unchanged.) Future research using longitudinal data could track how adoption patterns respond to climatic events and policy changes.
Conclusion. Addressing the persistent duality of Brazilian agriculture requires more than distributing credit or promoting individual technologies. Sustainable intensification depends on integrating conservation practices with robust institutional networks and modern information support. Institutional support and information infrastructure thus appear to be key enabling conditions for sustainable technologies to translate into stronger economic outcomes.
Author Contributions
Conceptualization, D.P.P.; methodology, D.P.P.; validation, D.P.P. and M.W.G.P.; formal analysis, D.P.P. and M.W.G.P.; investigation, D.P.P.; resources, D.P.P.; data curation, D.P.P.; writing—original draft preparation, D.P.P.; writing—review and editing, M.W.G.P., R.L.S. and E.A.F.; visualization, D.P.P. All authors have read and agreed to the published version of the manuscript.
Funding
This research received no external funding.
Institutional Review Board Statement
Not applicable.
Informed Consent Statement
Not applicable.
Data Availability Statement
The data used in this study are publicly available from the Brazilian Institute of Geography and Statistics (IBGE) through the 2017 Agricultural Census. Data can be accessed at: https://sidra.ibge.gov.br/pesquisa/censo-agropecuario/censo-agropecuario-2017 (accessed on 22 January 2026).
Acknowledgments
The authors gratefully acknowledge the institutional support of the Universidade Federal de Mato Grosso (UFMT) in the development of this research. During the preparation of this manuscript, the author(s) used Claude Sonnet 5 (Anthropic, San Francisco, CA, USA) for textual adjustment and structural organization of the article. The authors have reviewed and edited the output and take full responsibility for the content of this publication.
Conflicts of Interest
The authors declare no conflicts of interest.
Appendix A
Appendix A.1. Initial Set of Observable Variables (2017 Agricultural Census)
Table A1 lists all 42 observable variables initially selected from the 2017 Agricultural Census (IBGE, 2019) to represent the theoretical constructs (Figure 1), before measurement-model refinement. All counts are establishment-level census totals, normalized by the total number of properties (NP), the total area of properties (AP), or the total personnel employed (PE) in the corresponding micro-region, following the denominator logic described in Section 2.3. Variables retained in the final measurement model are cross-referenced to their code in Table 3; variables not listed in Table 3 were eliminated during the iterative refinement described in Section 2.3 (standardized loading below 0.40, or removal improving the construct’s AVE/CR). Four retained indicators (AST3, ATA2, STI2, LE1) are reported in Table 3 with a denominator (AP or PE) that differs from the NP denominator used for the rest of their construct; this was confirmed by the corresponding author to be correct (AST3 and LE1 are normalized by personnel employed (PE), and ATA2 and STI2 by area of properties (AP)) and is reflected accordingly in the Denom. column below.
Table A1.
Initial set of 42 observable variables selected from the 2017 Agricultural Census, and their status after measurement-model refinement.
Appendix A.2. Heterotrait–Monotrait (HTMT) Ratio Matrix
Table A2 reports the Heterotrait–Monotrait (HTMT) ratio for all 45 construct pairs, computed in SmartPLS as an additional, more conservative discriminant-validity check requested during review (see Section 3.1 for discussion). Values shown in red exceed the conservative HTMT ≤ 0.85 threshold (Henseler et al., 2015); several of these exceed 1.00.
Table A2.
Heterotrait–Monotrait (HTMT) ratio matrix.
References
- Bido, D. S., & Silva, D. (2019). SmartPLS 3: Especificação, estimação, avaliação e relato. Administração: Ensino e Pesquisa, 20(2), 488–536. [Google Scholar] [CrossRef] [Scilit]
- Bolfe, É. L., Jorge, L. A. C., Sanches, I. D., Luchiari Júnior, A., da Costa, C. C., Victoria, D. C., Inamasu, R. Y., Grego, C. R., Ferreira, V. R., & Ramirez, A. R. (2020). Precision and digital agriculture: Adoption of technologies and perception of Brazilian farmers. Agriculture, 10(12), 653. [Google Scholar] [CrossRef] [Scilit]
- Cohen, J. (1988). Statistical power analysis for the behavioral sciences. Psychology Press. [Google Scholar]
- Danso-Abbeam, G., Ehiakpor, D. S., & Aidoo, R. (2018). Agricultural extension and its effects on farm productivity and income: Insight from Northern Ghana. Agriculture & Food Security, 7(1), 74. [Google Scholar] [CrossRef] [Scilit]
- Fávero, L. P., Belfiore, P., Takamatsu, R. T., & Suzart, J. (2014). Métodos quantitativos com Stata. Elsevier. [Google Scholar]
- Fornell, C., & Larcker, D. F. (1981). Evaluating structural equation models with unobservable variables and measurement error. Journal of Marketing Research, 18(1), 39–50. [Google Scholar] [CrossRef] [Scilit]
- Franchini, J. C., Costa, J. M., Debiasi, H., & Torres, E. (2011). Importância da rotação de culturas para a produção agrícola sustentável no Paraná. EMBRAPA. [Google Scholar]
- Gao, M., Li, M., Wang, S., & Lu, X. (2024). Land degradation affects soil microbial properties, organic matter composition, and maize yield. Agronomy, 14(7), 1348. [Google Scholar] [CrossRef] [Scilit]
- Geng, W., Liu, L., Zhao, J., Kang, X., & Wang, W. (2024). Digital technologies adoption and economic benefits in agriculture: A mixed-methods approach. Sustainability, 16(11), 4431. [Google Scholar] [CrossRef] [Scilit]
- Giua, C., Materia, V. C., & Camanzi, L. (2021). Management information system adoption at the farm level: Evidence from the literature. British Food Journal, 123(3), 884–909. [Google Scholar] [CrossRef] [Scilit]
- Gomes, C. S., Procópio, D. P., Arruda-Oliveira, J. C., Lima, H. J. D., & Silva, R. B. B. (2024). Modernização agropecuária no Brasil. Revista em Agronegócio e Meio Ambiente, 17(4), e12845. [Google Scholar] [CrossRef] [Scilit]
- Hair, J. F., Hult, G. T. M., Ringle, C. M., & Sarstedt, M. (2017). A primer on partial least squares structural equation modeling (PLS-SEM). SAGE. [Google Scholar]
- Henseler, J., Hubona, G., & Ray, P. A. (2016). Using PLS path modeling in new technology research: Updated guidelines. Industrial Management & Data Systems, 116(1), 2–20. [Google Scholar] [CrossRef] [Scilit]
- Henseler, J., Ringle, C. M., & Sarstedt, M. (2015). A new criterion for assessing discriminant validity in variance-based structural equation modeling. Journal of the Academy of Marketing Science, 43(1), 115–135. [Google Scholar] [CrossRef] [Scilit]
- IBGE. (2019). Censo agropecuário 2017. Available online: https://sidra.ibge.gov.br/pesquisa/censo-agropecuario/censo-agropecuario-2017/resultados-definitivos (accessed on 22 January 2026).
- Jiang, M., Li, J., & Mi, Y. (2024). Farmers’ cooperatives and smallholder farmers’ access to credit: Evidence from China. Journal of Asian Economics, 92, 101746. [Google Scholar] [CrossRef] [Scilit]
- Jones-Garcia, E., & Krishna, V. V. (2021). Agronomic management transitions in tropical agriculture: A systematic review of evidence and knowledge gaps. Advances in Agronomy, 168, 139–223. [Google Scholar] [CrossRef] [Scilit]
- Kabato, W., Hailegnaw, N., Mutum, L., & Molnar, Z. (2025). Managing soil health for climate resilience and crop productivity in a changing environment. Science of the Total Environment, 1000, 180460. [Google Scholar] [CrossRef] [Scilit] [PubMed]
- Kharel, M., Raut, N., & Dahal, B. M. (2023). An assessment of good agriculture practices for safe and sustainable vegetable production in mid-hills of Nepal. Journal of Agriculture and Food Research, 11, 100518. [Google Scholar] [CrossRef] [Scilit]
- Kopittke, P. M., Menzies, N. W., Wang, P., McKenna, B. A., & Lombi, E. (2019). Soil and the intensification of agriculture for global food security. Environment International, 132, 105078. [Google Scholar] [CrossRef] [Scilit] [PubMed]
- Lee, S. (2026). Effects of extreme heat events on crop revenues for U.S. corn and soybeans. American Journal of Agricultural Economics, 108(1), 176–203. [Google Scholar]
- Ma, W., Marini, M. A., & Rhut, D. B. (2023). Farmers’ organisations and sustainable development: An introduction. Annals of Public and Cooperative Economics, 94(3), 683–700. [Google Scholar] [CrossRef] [Scilit]
- Malhi, G. S., Kaur, M., & Kaushik, P. (2021). Impact of climate change on agriculture and its mitigation strategies: A review. Sustainability, 13(3), 1318. [Google Scholar] [CrossRef] [Scilit]
- Manda, J., Alene, A. D., Gardebroek, C., Kassie, M., & Tembo, G. (2016). Adoption and impacts of sustainable agricultural practices on maize yields and incomes: Evidence from rural Zambia. Journal of Agricultural Economics, 67(1), 130–153. [Google Scholar] [CrossRef] [Scilit]
- Markelova, H., Meinzen-Dick, R., Hellin, J., & Dohrn, S. (2009). Collective action for smallholder market access. Food Policy, 34(1), 1–7. [Google Scholar] [CrossRef] [Scilit]
- Munguia, O. M. O., & Llewellyn, R. (2020). The adopters versus the technology: Which matters more when predicting or explaining adoption? Applied Economics Perspectives and Policy, 42(1), 80–91. [Google Scholar] [CrossRef] [Scilit]
- Mutonyi, S. (2019). The effect of collective action on smallholder income and asset holdings in Kenya. World Development Perspectives, 14, 100099. [Google Scholar] [CrossRef] [Scilit]
- Nascimento, J. C. H. B., & Macedo, M. A. S. (2016). Modelagem de equações estruturais com mínimos quadrados parciais. Revista de Educação e Pesquisa em Contabilidade, 10(3), 289–313. [Google Scholar] [CrossRef] [Scilit]
- Neves, M. C. R., Silva, F. F., Freitas, C. O., & Braga, M. J. (2021). The role of cooperatives in Brazilian agricultural production. Agriculture, 11(10), 948. [Google Scholar] [CrossRef] [Scilit]
- Nikam, V., Ashok, A., & Pal, S. (2022). Farmers’ information needs, access and its impact. Agricultural Systems, 196, 103317. [Google Scholar] [CrossRef] [Scilit]
- Nunnally, J. C., & Bernstein, I. H. (1994). Psychometric theory (3rd ed.). McGraw-Hill. [Google Scholar]
- Ogwu, M. C., & Kosoe, E. A. (2025). Integrating green infrastructure into sustainable agriculture to enhance soil health, biodiversity, and microclimate resilience. Sustainability, 17(9), 3838. [Google Scholar] [CrossRef] [Scilit]
- Osumba, J. J. L., Recha, J. W., & Oroma, G. W. (2021). Transforming agricultural extension service delivery through innovative climate-resilient agribusiness farmer field schools. Sustainability, 13(7), 3938. [Google Scholar] [CrossRef] [Scilit]
- Paltasingh, K. R., & Goyari, P. (2018). Impact of farmer education on farm productivity under varying technologies. Agricultural and Food Economics, 6(7), 7. [Google Scholar] [CrossRef] [Scilit]
- Pannell, D. J., Marshall, G. R., Barr, N., Curtis, A., Vanclay, F., & Wilkinson, R. (2006). Understanding and promoting adoption of conservation practices by rural landholders. Australian Journal of Experimental Agriculture, 46(11), 1407–1424. [Google Scholar] [CrossRef] [Scilit]
- Pereira, K. V., Siluk, J. C. M., Michelin, C. F., Rigo, P. D., Quiroga, D. O., & Manosso, T. S. (2024). Factors that impact on Brazilian rural producers’ decision-making. International Journal on Food System Dynamics, 15(2), 169–184. [Google Scholar] [CrossRef] [Scilit]
- Pretty, J. (2008). Agricultural sustainability: Concepts, principles and evidence. Philosophical Transactions of the Royal Society B: Biological Sciences, 363(1491), 447–465. [Google Scholar] [CrossRef] [Scilit] [PubMed]
- Pretty, J., Toulmin, C., & Williams, S. (2011). Sustainable intensification in African agriculture. International Journal of Agricultural Sustainability, 9(1), 5–24. [Google Scholar] [CrossRef] [Scilit]
- Procópio, D. P. (2024). Factors associated with the adoption of soil conservation technologies in Brazilian family farming. Rural Sustainability Research, 52(347), 1–12. [Google Scholar] [CrossRef] [Scilit]
- Procópio, D. P., Binotto, E., & Pereira, M. W. G. (2024). Fatores associados à adoção de tecnologia no setor agropecuário. Revista Eletrônica de Administração, 30(1), 844–874. [Google Scholar] [CrossRef] [Scilit]
- Quevedo-Silva, F., & Pereira, J. B. (2022). Factors affecting consumers’ cultivated meat purchase intentions. Sustainability, 14(19), 12501. [Google Scholar] [CrossRef] [Scilit]
- Ringle, C. M., Silva, D., & Bido, D. (2014). Modelagem de equações estruturais com utilização do SmartPLS. Revista Brasileira de Marketing, 13(2), 56–73. [Google Scholar] [CrossRef] [Scilit]
- Rogers, E. M. (2003). Diffusion of innovations (5th ed.). Free Press. [Google Scholar]
- Ruzzante, S., Labarta, R., & Bilton, A. (2021). Adoption of agricultural technology in the developing world: A meta-analysis of the empirical literature. World Development, 146, 105599. [Google Scholar] [CrossRef] [Scilit]
- Souza Filho, H. M., Buainain, A. M., Silveira, J. M. F. J., & Vinholis, M. M. B. (2011). Condicionantes da adoção de inovações tecnológicas na agricultura. Cadernos de Ciência & Tecnologia, 28(1), 223–255. [Google Scholar]
- Spielman, D. J., & Birner, R. (2008). How innovative is your agriculture? Using innovation indicators and benchmarks to strengthen national agricultural innovation systems (Agriculture and Rural Development Discussion Paper 41). World Bank. [Google Scholar]
- Tanure, T., Campos, R. F. A., Reis, J. C., Benzeev, R., Newton, P., Rodrigues, R. A. R., & Oliveira, A. M. H. C. (2024). Farmers’ perceptions of climate change affect their adoption of sustainable agricultural technologies in the Brazilian Amazon and Atlantic forest biomes. Climatic Change, 177(8), 8. [Google Scholar] [CrossRef] [Scilit]
- Topa, D.-C., Căpşună, S., Calitru, A.-C., & Ailincăi, C. (2025). Sustainable practices for enhancing soil health and crop quality in modern agriculture: A review. Agriculture, 15(9), 998. [Google Scholar] [CrossRef] [Scilit]
- Vieira Filho, J. E. R., & Fishlow, A. (2017). Agricultura e indústria no Brasil: Inovação e competitividade. IPEA. [Google Scholar]
- Weersink, A., & Fulton, M. (2020). Limits to profit maximization as a guide to behavior change. Applied Economics Perspectives and Policy, 42(1), 67–79. [Google Scholar] [CrossRef] [Scilit]
- Weybright, E., Phibbs, S., Watters, C., Myers, A., Peavy, M., & Martin, A. (2024). The role of cooperative extension in delivering training and technical assistance to support evidence-based behavioral health practices in rural communities. Evaluation & the Health Professions, 47(2), 192–203. [Google Scholar] [CrossRef] [Scilit]
- Wossen, T., Abdoulaye, T., Alene, A., Haile, M. G., Feleke, S., Olanrewaju, A., & Manyong, V. (2017). Impacts of extension access and cooperative membership on technology adoption and household welfare. Journal of Rural Studies, 54, 223–233. [Google Scholar] [CrossRef] [Scilit] [PubMed]
- Xavier, A., Costa Freitas, M. B., Fragoso, R., & Rosário, M. S. (2022). Analysing the recent dynamics of agricultural sustainability in Portugal using a compromise programming approach. Sustainability, 14(19), 12512. [Google Scholar] [CrossRef] [Scilit]
- Yusuf, S., Hafeez-Baig, A., Soar, J., & Teik, D. O. L. (2020). PLS-SEM path analysis to determine the predictive relevance of e-health readiness assessment model. Health and Technology, 10, 1497–1513. [Google Scholar] [CrossRef] [Scilit]
- Zhang, S., Sun, Z., Ma, W., & Valentinov, V. (2020). The effect of cooperative membership on agricultural technology adoption in Sichuan, China. China Economic Review, 62, 101334. [Google Scholar] [CrossRef] [Scilit]

Disclaimer/Publisher’s Note: The statements, opinions and data contained in all publications are solely those of the individual author(s) and contributor(s) and not of MDPI and/or the editor(s). MDPI and/or the editor(s) disclaim responsibility for any injury to people or property resulting from any ideas, methods, instructions or products referred to in the content. |
© 2026 by the authors. Licensee MDPI, Basel, Switzerland. This article is an open access article distributed under the terms and conditions of the Creative Commons Attribution (CC BY) license.