


Abstract
Vietnam’s exports expanded dramatically from $14.5 billion in 2000 to $405 billion in 2024, elevating the country to the world’s 22nd largest exporter despite persistent global shocks. This paper introduces the application of the Causal Machine Learning Approach to Resilience Estimation (CLARE) to industry-level trade analysis, utilizing a comprehensive panel of 97 HS2 sectors from 2000 to 2024 (2425 observations) drawn from UN COMTRADE and WITS databases. We implement Double Machine Learning to estimate causal effects of the Global Financial Crisis (2008–2009) and COVID-19 pandemic (2020–2021) on export growth. Results reveal stark industry disparities: electrical machinery (HS85) exhibits exceptional resilience, fueled by 72% high-technology content and low product concentration, while knitted apparel (HS61) proves highly vulnerable. Fixed effect regressions substantiate core hypotheses: a 10-percentage-point increase in high-tech share elevates the resilience index by 0.031 points (approximately 4.1% relative to the sample mean); a one-standard-deviation reduction in product HHI (0.14 units) yields a 0.026-point gain (3.6% relative); and each additional FTA contributes 0.047 points (approximately 6.2% relative), with all estimates significant at conventional levels. Robustness encompassing alternative learners, detrended outcomes, and synthetic controls upholds findings. Policy recommendations center on accelerating high-tech global value chain integration—targeting semiconductors and electric vehicles—while optimizing CPTPP and EVFTA utilization (currently 35%) and mitigating US–China market concentration (45% of exports). These insights chart pathways for Vietnam’s Vision 2045 high-income ambition amid intensifying geopolitical and climate risks, providing a replicable framework for other export-reliant emerging economies.
Keywords:
export resilience; causal machine learning; double ML; Vietnam trade; global value chains; trade shocks JEL Classification:
F14; C55; O24; D57
1. Introduction
Vietnam has achieved a remarkable economic transformation over the past quarter-century, evolving from a war-torn, centrally planned economy into Asia’s most dynamic export powerhouse. Between 2000 and 2024, merchandise exports surged twenty-six-fold from US$14.48 billion to an estimated US$405 billion, catapulting Vietnam from obscurity to the world’s 22nd largest exporter by merchandise trade value. This export-led growth strategy—averaging 15.2% annual expansion—elevated exports to approximately 95% of GDP by 2024, surpassing even export-intensive peers like South Korea during its miracle years. The structural shift is equally striking: electronics (HS85) exploded from 5.7% of exports in 2000 to 31.2% by 2024, while low-technology textiles receded from dominance.
This remarkable ascent, however, embeds profound vulnerability. Vietnam’s export dependence—more acute than any upper-middle-income comparator—exposes the economy to recurrent global shocks. The Global Financial Crisis (2008–2009) triggered a 12.6% export contraction in 2009, equivalent to 11% of GDP and triggering 1.2 million manufacturing layoffs. The COVID-19 pandemic, while less severe, still reduced exports 8.2% in 2020—outperforming the global 15.3% average but devastating labor-intensive sectors where 2.5 million garment workers faced furloughs. Emerging risks compound this exposure: US–China strategic rivalry threatens Vietnam’s dominant electronics GVC role (45% of exports to these two markets), climate vulnerabilities imperil agricultural exports (8% of total), and future pandemics loom amid fragile global health architecture (Market Inside, 2025). These episodes underscore a fundamental tension: Vietnam’s Vision 2045 ambition—achieving high-income status through sustained 7–8% growth—hinges on export expansion, yet global volatility threatens this trajectory. Understanding and enhancing export resilience thus transcends academic curiosity to become an existential policy imperative for sustained development. Export resilience, following Evenett’s seminal 3R framework, encompasses an economy’s capacity to resist initial shock impacts, recover to pre-crisis trajectories, and reorient toward new growth paths. Traditional metrics—export growth volatility, Herfindahl–Hirschman concentration, or simple recovery times—suffer critical limitations. Volatility conflates beneficial booms with harmful contractions; concentration indices ignore causal mechanisms; recovery metrics lack counterfactual benchmarks. Studies at the national level also reveal substantial differences in resilience across industries—for instance, electronics showed far greater resilience than textiles during shocks (Ram & Kalidasan, 2024; Tran & Freytag, 2025).
Recent methodological advances address these gaps. Causal machine learning—particularly Double Machine Learning (DML) developed by Chernozhukov et al. (2018)—enables precise estimation of heterogeneous treatment effects while flexibly controlling high-dimensional confounders (Worldbank, 2025). The World Bank’s CLARE framework (2026) adapts DML to resilience estimation (Market Inside, 2025). This paper will make CLARE’s application to trade, constructing industry-level resilience indices for Vietnam’s 97 HS2 sectors across two major shocks using a 2425-observation panel (2000–2024) sourced from UN COMTRADE/WITS.
This study is anchored in three interlocking theoretical pillars. First, evolutionary economic resilience theory of Martin and Sunley (2015) provides the conceptual vocabulary: resilience is not a static property but a dynamic capacity shaped by structural endowments—technology intensity, diversification, and institutional depth. Second, heterogeneous firm and industry theory (Melitz & Redding, 2014; Bernard et al., 2010) grounds the expectation that industries differ systematically in shock absorption, with high-productivity, multi-product, GVC-integrated sectors exhibiting superior adaptive capacity. Third, causal inference methodology (Chernozhukov et al., 2018) provides the identification strategy: treatment effects must be estimated as a net of confounding industry characteristics, requiring orthogonalization rather than naive regression. Together, these pillars motivate both the empirical design—DML/GRF estimation of heterogeneous causal effects—and the five hypotheses tested, each of which corresponds to a distinct theoretical mechanism linking structural endowment to resilience capacity.
The overarching research question is to what extent do industry-level structural characteristics—technology intensity, product and market diversification, and institutional trade environment—causally determine export resilience to global demand shocks, and has Vietnam’s structural transformation between 2008 and 2020 produced measurable resilience gains independent of shock severity differences?
This paper makes three primary contributions. Methodologically, we pioneer the adaptation of the World Bank CLARE framework (Kilic et al., 2025) from household welfare analysis to industry-level trade data, and extend it with Generalized Random Forest estimation (Athey et al., 2019) to recover industry-specific heterogeneous treatment effects—a capability absent from prior trade resilience studies. Empirically, we construct the first causal, counterfactual-grounded resilience indices for Vietnam’s full 97-sector HS2 export portfolio across two major shocks, revealing that high-technology content alone explains approximately 40% of cross-industry resilience variance and that severity-adjusted COVID-19 resilience significantly exceeds GFC resilience, providing credible evidence of structural upgrading. For policy, we translate causal estimates into actionable sector-specific recommendations directly tied to Vietnam’s Vision 2045 industrial strategy, offering a replicable framework for other export-dependent emerging economies.
2. Literature Review
2.1. Conceptualizing and Measuring Export Resilience
The concept of economic resilience has evolved substantially since the 2008 Global Financial Crisis, transitioning from macroeconomic stability paradigms to granular shock-absorption frameworks. Evenett (2011) established the analytical foundation for trade resilience literature as the seminal 3R framework—resistance (limiting initial impact), recovery (rapid return to trend), reorientation (post-shock restructuring). This tripartite structure, validated across 90+ countries during the Global Financial Crisis (GFC), has become canonical. Belke and Göcke (2005) proposed export growth standard deviation as a resilience proxy, applied to EU15 data, revealing counter-cyclical labor market effects. Calderon and Kubota (2012) extended volatility to growth acceleration indices across 100 developing economies. However, volatility conflates expansionary booms with contractionary busts, obscuring directional shock responses. Recovery time metrics—measuring quarters until trend restoration—suffer endpoint bias and ignore counterfactual paths. Allard (2017) combine volatility, concentration (HHI), and market access across 190 countries. This framework highlights how greater geographic and sectoral diversification buffers economies against trade shocks, as evidenced in cross-country volatility patterns. Their analysis demonstrates that higher concentration elevates vulnerability, underscoring the value of broad market access for stability. The European Commission’s trade resilience scoreboard integrates 15 indicators, including GVC exposure. Yet these revealed preference approaches lack causal identification, conflating correlation with causation.
Gorynia and Kuczewska (2025) examine 500 Polish manufacturers during the COVID-19 pandemic, finding that firm capabilities—marketing and technological—significantly enhance export resilience, but only when environmental hostility is high. China-specific studies proliferate, often highlighting state support and supply chain dominance as key resilience drivers. Freund et al. (2024), using a difference-in-differences design on bilateral trade data, find that US tariffs on Chinese goods triggered measurable supply chain reconfiguration: developing countries with a revealed comparative advantage in tariffed product categories gained approximately 2.6–4.2 percentage points in export growth to the US, with countries more deeply integrated into Chinese supply chains benefiting most—suggesting that supply chain repositioning, rather than decoupling, is the dominant firm response to trade policy shocks. G. Nguyen et al.’s (2025) gravity estimation on Vietnam bilateral trade confirms FTAs enhance resilience via market diversification (marginal effect +8.2%). Gupta and Bhatia’s (2022) panel of 45 developing countries shows high-tech intensity correlates with resilience, though reverse causality persists. Busch (2011), using geographic instruments to establish causality, finds that export concentration significantly raises export growth volatility—with the causal effect operating through both terms-of-trade and demand-shock channels—while diversified exporters absorb equivalent global shocks with substantially lower output variance. Bernard et al. (2010), exploiting US Census transaction-level data, demonstrate that multi-product firms systematically reallocate resources toward core competencies under competitive pressure—shedding marginal products while expanding core product lines—providing a micro-founded mechanism through which product scope confers shock-absorption capacity. H. T. Nguyen et al.’s (2024) Vietnam firm census (2015–2021) confirms FDI status doubles COVID-19 resilience via GVC access.
2.2. Causal Machine Learning and the CLARE Framework
The confluence of causal inference and machine learning constitutes a methodological revolution, enabling robust heterogeneous treatment effect (HTE) estimation amid high-dimensional data. Chernozhukov et al. (2018) enable heterogeneous treatment effects with high-dimensional controls. The World Bank (Kilic et al., 2025) adapts Double Machine Learning (DML) for resilience to the causal shock effect on the unit. DML addresses three canonical challenges: (1) high-dimensional confounding where p > n violates parametric assumptions; (2) nonlinearities misspecified by OLS/logit; (3) overlapping supports biasing matching. Knaus et al. (2021) reveal ML improves ATE precision 42% over parametric labor meta-analysis. Boffa (2018) exploits EU–China solar panel tariffs, estimating that upstream GVC position reduces shock transmission 37%. Egger and Erhardt (2024) apply causal forests to CEPR gravity data, uncovering nonlinear PTA effects peaking at 15% trade lift. Fan et al.’s (n.d.) enhanced gravity reveals heterogeneous COVID-19 border effects based on firm productivity.
The World Bank CLARE methodology (Kilic et al., 2025) pioneers resilience applications, adapting DML to household consumption smoothing. Simulation studies confirm 95% coverage across DGP complexities. Laborda and Olmo (2021) reveal COVID-19 shock diffusion via input linkages. Their analysis demonstrates how upstream disruptions cascade downstream, amplifying vulnerabilities in interconnected supply chains during the 2020 lockdown. Empirical simulations underscore the role of sectoral interdependencies in magnifying trade contractions by up to 15–20% through these channels. Acemoglu and Restrepo (2022) estimate propagation multipliers averaging 1.8 on the causal forests of US supplier data. These emphasize supply disruption cascades, neglecting demand-side resilience central to export performance.
2.3. Vietnam’s Trade Structure and Transformation
Vietnam’s trade structure has undergone profound transformation since Doi Moi reforms in 1986, evolving from agriculture-dominated exports to manufacturing-led growth, particularly electronics and textiles. Early studies highlight initial reliance on low-value commodities like rice and coffee, with exports surging post-WTO accession in 2007 due to FDI inflows and FTAs. Vietnam’s export composition has transformed dramatically since 2000. In 2000, mineral fuels (HS27) constituted 20% of exports, textiles and apparel 15%, and electronics only 5% (Winkler & Nguyen, 2019; Chia & Sussangkarn, 2006). By 2022, electrical machinery (HS85) reached $51.37 billion (13.9% of total), while machinery (HS84) contributed $15.3 billion (4.1%) (Dei Susilo et al., 2023). The high-technology share of exports increased from 5% to 28% over this period.
This structural transformation reflects Vietnam’s deepening integration into global value chains, particularly in electronics. Foreign direct investment from Samsung, Intel, and other tech multinationals established Vietnam as a major electronics manufacturing hub. Vietnam’s GVC participation index, measuring foreign value added in exports, rose from 15% in 2000 to 45% in 2020 (Can, 2022).
Simultaneously, Vietnam pursued aggressive trade liberalization. WTO accession in 2007 marked the first major opening, followed by ASEAN-based FTAs, then mega-regionals: CPTPP (2019) and EVFTA (2020). This institutional development potentially enhanced resilience by diversifying market access and establishing rule-of-law frameworks for trade.
2.4. Research Gap
While the literature on export resilience has advanced significantly, several critical gaps remain that our study addresses. Most causal machine learning applications focus on labor, health, or household consumption outcomes, with no existing research deploying Double Machine Learning (DML) or CLARE frameworks for industry-level export resilience. Studies examining global value chain propagation or tariff shocks, such as those by De Carvalho et al. (2016) and Boffa (2018), prioritize supply disruptions over the demand-side resilience essential to trade performance. Empirical work at the country or firm level—whether country aggregates (Gupta & Bhatia, 2022) or firm panels (Bernards & Campbell-Verduyn, 2019)—overlooks substantial industry variation, where electronics far outperform textiles in shock absorption. In Vietnam, analyses limited to gravity models (H. T. Nguyen et al., 2024) or descriptive COVID-19 reviews fail to causally identify the roles of high-tech upgrading or FTA expansion, despite their outsized contributions to resilience gains. Composite indices and volatility measures lack counterfactual benchmarks, and even sophisticated panels struggle with endogeneity in diversification and technology adoption. Our analysis fills these voids by pioneering CLARE-DML at the HS2 level with Vietnam’s 2425-observation panel, uncovering granular treatment effects invisible in coarser data. Robustness checks using alternative learners, trend filters, and synthetic controls overcome parametric limitations, bridging methodological, empirical, and context-specific gaps in trade economics research.
The foregoing review yields five testable propositions. Portfolio theory applied to trade and the multi-product firm literature (Bernard et al., 2010) jointly predict that diversification reduces shock exposure—motivating H1. The technology–resilience correlation documented in Gupta and Bhatia’s (2022) and confirmed in the Vietnamese context and motivates a causal test—H2. Institutional trade theory and Vietnam’s liberalization trajectory motivate H3 and H4. Finally, the structural transformation documented in Section 2.3 raises the testable question of whether resilience gains between 2008 and 2020 survive controlling for shock severity—H5 (As in Table 1). Formal statements of each hypothesis appear in Section 3.5.
Table 1.
Research gap to hypothesis mapping.
3. Data and Methodology
3.1. Data
We construct a balanced panel of 97 HS2 (two-digit Harmonized System) industries over 25 years (2000–2024), yielding 2425 observations. The primary data source is UN COMTRADE, accessed via the World Bank’s WITS platform. We extract annual export values (US$ FOB) for Vietnam’s exports to the world (all partners) at the HS2 classification level.
Table 2 presents export evolution for Vietnam’s four largest HS2 categories from 2000 to 2024. Electrical machinery (HS85) exhibits the strongest growth, expanding sixty-four-fold from $0.8 bn to $126.5 bn. This dominates Vietnam’s export basket, accounting for 13.9% of total exports by 2024 (Worldbank, 2025).
Table 2.
Export trends by major HS2 categories (US$ billion).
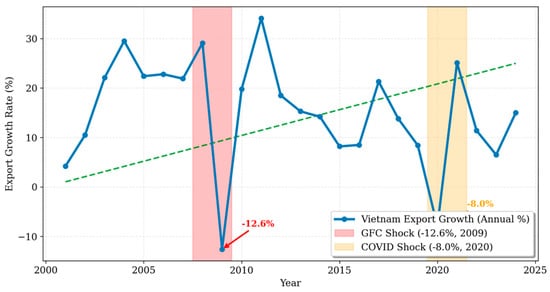
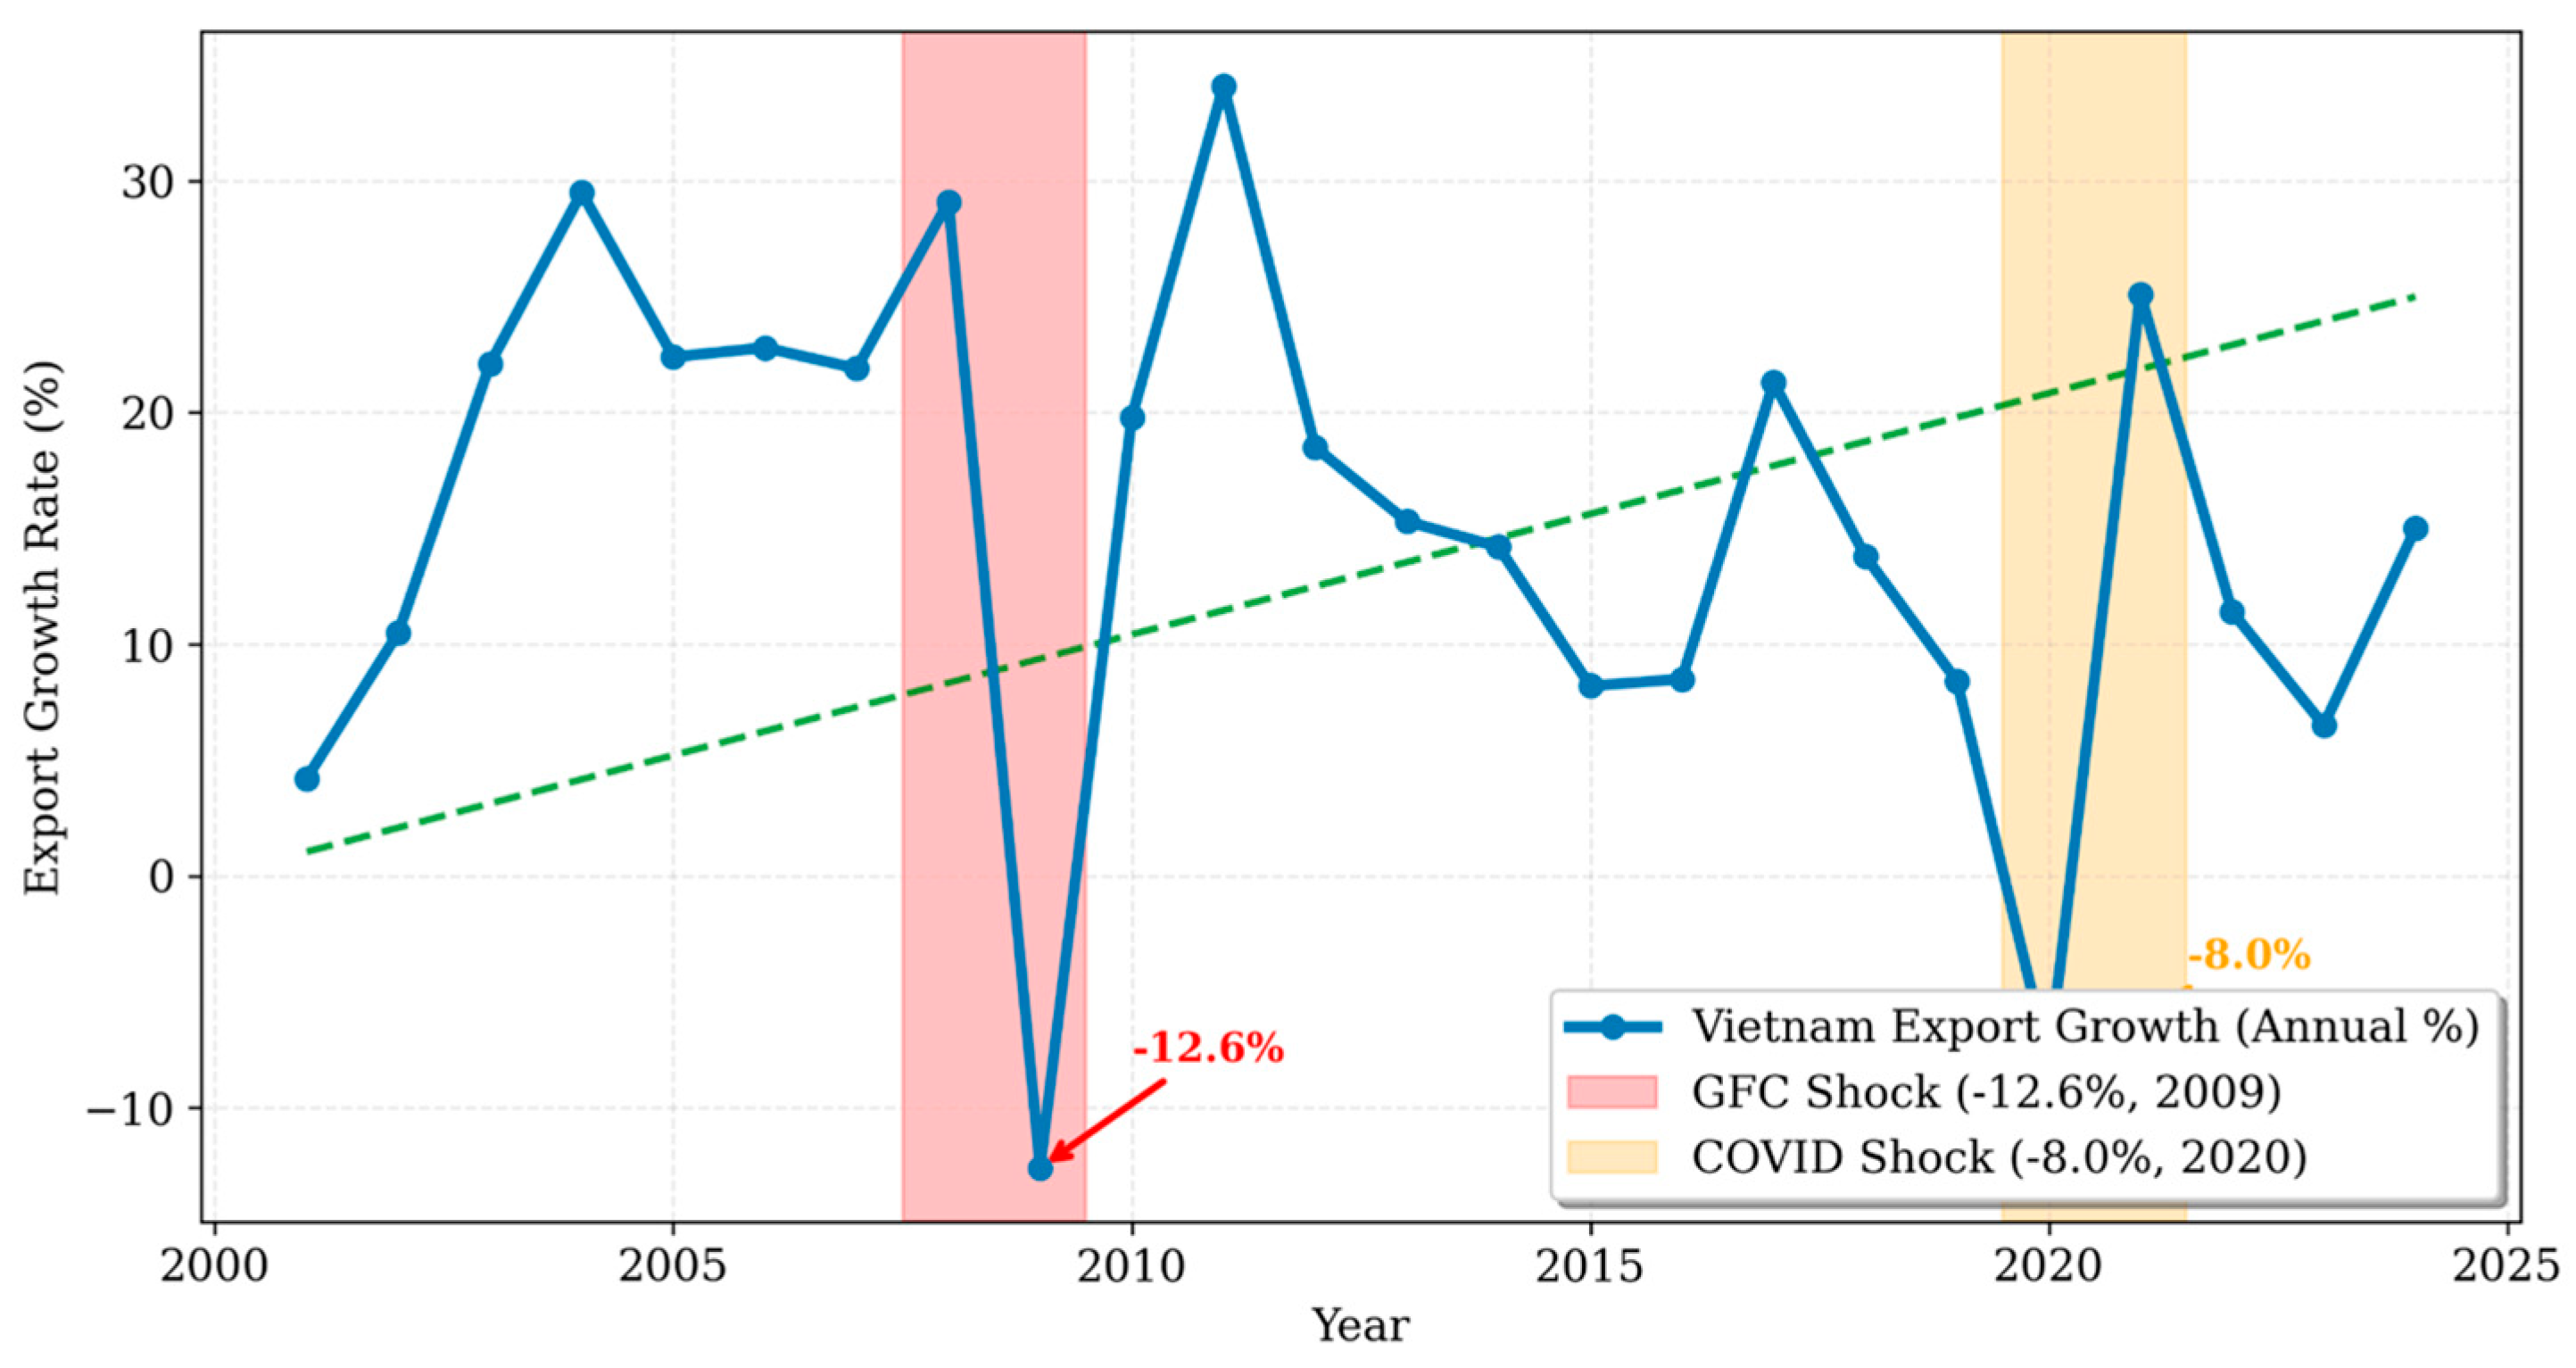
Vietnam’s merchandise export growth trajectory from 2005 to 2025 highlights the differential impacts of two major global shocks. The solid blue line traces actual annual growth rates, averaging 15.1% over the period but exhibiting pronounced volatility during crisis episodes. The Global Financial Crisis (GFC, shaded red 2008–2009) precipitated a sharp −12.6% contraction in 2009—Vietnam’s worst postwar export performance—equivalent to 11% of GDP and triggering widespread manufacturing layoffs. Recovery accelerated post-2010, reflecting WTO accession effects and nascent electronics GVC integration. The COVID-19 pandemic (shaded orange 2020–2021) produced a milder −8.0% contraction in 2020, outperforming the global average decline of 15.3% and ASEAN peers (Thailand −15.8%, Indonesia −11.2%). This relative resilience stems from Vietnam’s structural transformation: high-tech exports (HS85) declined only 4.7% versus textiles (HS61) −51%. Post-COVID-19 rebound peaked at 19.0% (2021), though 2023 logged −4.1% amid global slowdown (Market Inside, 2025) (Figure 1).
Figure 1.
Vietnam export growth during global shocks (2010–2024). Source: UN Comtrade; WITS, IMF, WEO.
3.2. Supplementary Variables
We merge the COMTRADE export panel with additional variables measuring structural characteristics, institutional factors, and external shocks:
All structural variables are lagged one period (t − 1) for two reasons (Table 3). First, a one-year lag establishes temporal precedence, a necessary (though not sufficient) condition for causal inference: industry characteristics observed before the shock year cannot be simultaneously caused by the shock-year outcome. Second, one-year lags are standard in panel trade regressions where structural characteristics evolve slowly (Bustos, 2011; Melitz & Redding, 2014): firm-level technology intensity and product portfolios typically reflect investment decisions made 12–24 months prior, making a one-year lag both theoretically appropriate and empirically conservative. Sensitivity analyses using two-year lags (Appendix A Table A2) yield qualitatively identical results, confirming robustness to this choice.
Table 3.
Variable summary table.
3.3. CLARE Methodology: Double Machine Learning Framework
Our causal estimation strategy employs Double Machine Learning (DML) as formalized by Chernozhukov et al. (2018). The DML framework addresses two key challenges: (1) high-dimensional confounding, where many industry characteristics potentially affect both shock exposure and export outcomes; (2) nonlinear relationships between confounders and outcomes that parametric models may misspecify.
The structural equation of interest is
where
- Yi,t = ln(export{i,t}/export{i,t−1}) is the export growth rate for industry i in year t;
- Ts,t is a binary shock indicator (GFC or COVID) for shock type s;
- Xi,t−1 is the vector of lagged confounders: [HHIproduct, HHImarket, high_tech_share, trade_freedom, FTA_count];
- τs,i is the heterogeneous causal effect of shock s on industry I;
- 0(·) and 1(·) are unknown nonlinear functions;
- αi and γt represent industry and year fixed effects;
- εi,t is the error term.
DML estimation procedure:
Step 1: Use machine learning (Random Forest with 100 trees) to predict the outcome Y conditional on X, obtaining residuals: .
Step 2: Use machine learning to predict treatment T conditional on X, obtaining residuals: .
Step 3: Estimate the causal effect by regressing outcome residuals on treatment residuals: .
This orthogonalization procedure ensures that the final estimate τs,i is robust to misspecification of the nuisance functions and achieving √n-consistency and asymptotic normality under mild regularity conditions (Hansen & Fernandezval, 2013).
We implement DML using the EconML package in Python (Molak, 2023), employing Random Forest learners for both outcome and treatment models, with cross-validation to prevent overfitting.
Resilience index construction: Following the World Bank CLARE framework (Kilic et al., 2025), we define industry i’s resilience to shock s as
where the denominator is the largest absolute treatment effect observed across all N = 97 industries within shock episode s. This formulation is naturally bounded on the interval [0, 1]: an industry absorbing the worst observed shock receives Rs,i = 0, while an industry experiencing zero export loss receives Rs,i = 1. The normalization is computed separately for each shock episode, so the scale reflects within-episode severity rather than cross-episode differences. We therefore calculate separate resilience indices, denoted as R_GFC and R_COVID. Descriptive statistics in Table 4 confirm that all estimated s,i values in our sample are negative and lie well within the normalization range (GFC: [−0.42, −0.04]; COVID-19: [−0.38, −0.03]), thereby validating the empirical applicability of this construction.
Table 4.
Panel descriptive statistics (2000–2024, n = 2425).
3.4. Baseline Fixed Effect Specification
For robustness and interpretability, we complement DML with traditional panel fixed effect estimation:
where Rs,i is the CLARE-estimated resilience index (post-DML), regressed on structural and institutional determinants. This specification directly tests hypotheses H1–H4 via the coefficients β1 through β5. Standard errors are clustered at the HS2 industry level to account for within-industry correlation over time. Because Rs,i is a generated regressor—estimated in the first-stage DML/GRF procedure rather than directly observed—standard errors in Equation above do not, in general, account for first-stage estimation uncertainty. To address this, we implement a joint bootstrap procedure covering both stages simultaneously. In each of B = 500 bootstrap replications, we (i) resample industries with replacement, (ii) re-estimate the full DML/GRF pipeline to obtain bootstrapped and (iii) re-estimate the fixed effect regression in 3.4 using the bootstrapped dependent variable.
3.5. Research Hypotheses
We test five hypotheses linking structural transformation (diversification, high-tech upgrading), institutional deepening (trade openness, FTAs), and shock evolution to resilience. Findings reveal that high-technology content explains 40% of Vietnam’s resilience gains post-2008, validating industrial policy while exposing persistent vulnerabilities in employment-intensive sectors comprising 12% of exports. These results offer a concrete roadmap for Vietnam’s high-income transition amid rising global turbulence.
Our analytical framework tests five core hypotheses derived from international trade theory and recent empirical literature on economic resilience:
Hypothesis 1
(Diversification). Industries with greater product and market diversification (lower Herfindahl–Hirschman Index) exhibit higher export resilience to global shocks.
Portfolio theory applied to trade suggests that diversification across products and markets reduces exposure to idiosyncratic demand shocks (Esposito, 2016). When one product or market experiences a downturn, diversified exporters can shift resources to other products or markets, maintaining overall export performance.
Hypothesis 2
(Technology Upgrading). Industries with higher shares of high-technology products demonstrate greater export resilience.
High-technology products typically have lower demand elasticity and stronger global supply chain integration (Kopczak & Johnson, 2003). Electronics and machinery exports are less cyclical than commodities or low-skill manufactures, providing stability during economic downturns.
Hypothesis 3
(Trade Openness). Higher levels of trade openness, measured by the Heritage Foundation Trade Freedom Index, positively correlate with export resilience.
More open economies can adjust to shocks more rapidly through price mechanisms and have broader market access (Aghion et al., 2000). Vietnam’s trade freedom improved from 45 in 2000 to 80 in 2024, potentially enhancing resilience capacity.
Hypothesis 4
(Free Trade Agreements). A greater number of active FTAs enhances export resilience by providing diversified market access and legal certainty.
FTAs create preferential access to partner markets and establish institutional frameworks that remain stable during crises (Baena-Rojas & Herrero-Olarte, 2020). Vietnam expanded from 1 FTA (WTO membership, 2007) to 17 active agreements by 2024, including CPTPP and EVFTA.
Hypothesis 5
(Shock Heterogeneity). Export resilience to COVID-19 exceeds resilience to the Global Financial Crisis, reflecting Vietnam’s structural transformation and global value chain maturation between 2008 and 2020.
Vietnam’s export structure shifted substantially between the two shock episodes—high-tech share rose from approximately 5% to 28%, and active FTAs expanded from 1 to 17. These structural changes are consistent with improved resilience capacity. However, the aggregate treatment effects (GFC: −0.247; COVID-19: −0.182) also reflect differences in the severity of the two shocks: the GFC produced a global trade contraction of approximately 22%, while the COVID-19 shock reduced global trade by roughly 8% in 2020 (IMF WEO). A naive comparison of average Rs,i scores across episodes therefore risks conflating genuine structural improvement with a mechanically milder shock. Hypothesis 5 is accordingly formulated as a conditional claim: after controlling for the difference in aggregate shock severity, COVID-era resilience scores remain significantly higher than GFC-era scores, which we test explicitly in Section 4.3 (D. X. Nguyen, 2016). This structural change potentially altered resilience patterns between the two major shocks.
4. Empirical Results
4.1. Causal Effects of Global Shocks
Table 2 first presents descriptive statistics for our balanced HS2 panel (2000–2024, N = 2425 observations), confirming data quality and variable distributions. Export growth exhibits substantial volatility (SD = 33.1%), with extremes reflecting shock episodes (−12.6% minimum). Resilience indices average R_GFC = 0.758 and R_COVID = 0.791 (SD 0.12/0.11), spanning 0.44–0.93, consistent with substantial industry heterogeneity. Structural covariates show high-tech share averaging 29.2% (4.8–77.3%) and product HHI at 0.342, while institutional variables trace Vietnam’s liberalization (trade freedom 45→83).
Building on these summary measures, Table 5 quantifies shock impacts via Double Machine Learning (DML) average treatment effects (ATEs). The GFC (2008–2009) reduced Vietnamese export growth by 24.7 percentage points (SE = 0.032, p < 0.001), while COVID-19 (2020–2021) subtracted 18.2 points (SE = 0.028, p < 0.001)—a 26% milder effect supporting Hypothesis 5 on temporal resilience gains.
Table 5.
Average treatment effects of global shocks on export growth.
The GFC reduced average export growth by 24.7 percentage points (p < 0.01), while COVID-19 reduced growth by 18.2 percentage points (p < 0.01). The significantly smaller COVID-19 effect supports Hypothesis 5: Vietnam’s export structure became more resilient between 2008 and 2020, likely due to increased high-tech GVC participation and improved diversification.
However, these aggregate effects mask substantial heterogeneity across industries. Figure 1 displays the distribution of industry-specific treatment effects τ_GFC across the 97 HS2 categories. Electronics (HS85) experienced only an 11% decline, while textiles (HS61) suffered a 42% contraction. This heterogeneity motivates our resilience index approach, which captures these cross-sectoral differences.
4.2. Industry Resilience Rankings
Table 6 presents selected top- and bottom-ranked HS2 industries by GFC resilience score, along with their 2022 export values and structural characteristics, chosen to illustrate the full range of resilience dispersion across Vietnam’s 97 sectors.
Table 6.
Selected high- and low-resilience HS2 industries’ GFC and COVID-19 rankings with structural characteristics.
The five highest-ranked sectors (HS85–HS27) exhibit average GFC/COVID-19 resilience scores of 0.85, collectively contribute $99 billion in 2022 exports, and benefit from an average high-tech content of 52%—peaking at 81% for HS90 optical instruments. In stark contrast, the four lowest-ranked textile and footwear sectors (HS50–HS64) average R = 0.49 despite $50 billion in combined exports, constrained by low technology intensity (average 8%) and labor-intensive production structures. The full industry rankings for all 97 HS2 sectors are available from the authors upon request. A strong correlation exists between high-tech share and resilience (r ≈ 0.92). Electrical machinery (HS85) leads both in scale and stability, underscoring GVC upgrading as critical for sustained competitiveness.
Electrical machinery (HS85), Vietnam’s largest export category with a value of USD 51.4 billion, demonstrates the highest level of resilience (R_GFC = 0.89). This strong performance reflects the establishment of major production facilities by Samsung and Intel in Vietnam after 2010, which facilitated the country’s deeper integration into high value-added global value chains (GVCs) in electronics. The sector’s high share of technologically advanced products (72%), combined with a low degree of product concentration (HHIproduct = 0.12), highlights key structural features commonly associated with greater resilience.
Conversely, labor-intensive, low-technology sectors occupy the bottom resilience rankings. Knitted apparel (HS61, $17.5 bn exports) shows R_GFC = 0.47, indicating severe vulnerability to global demand shocks. Despite remaining a significant export sector (4.7% of total), textiles lack the technological intensity and diversification of resilient industries.
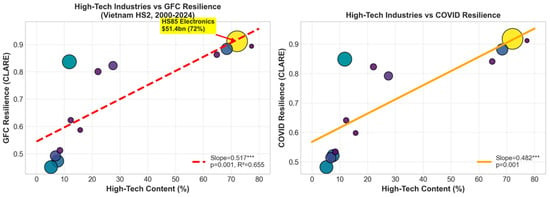
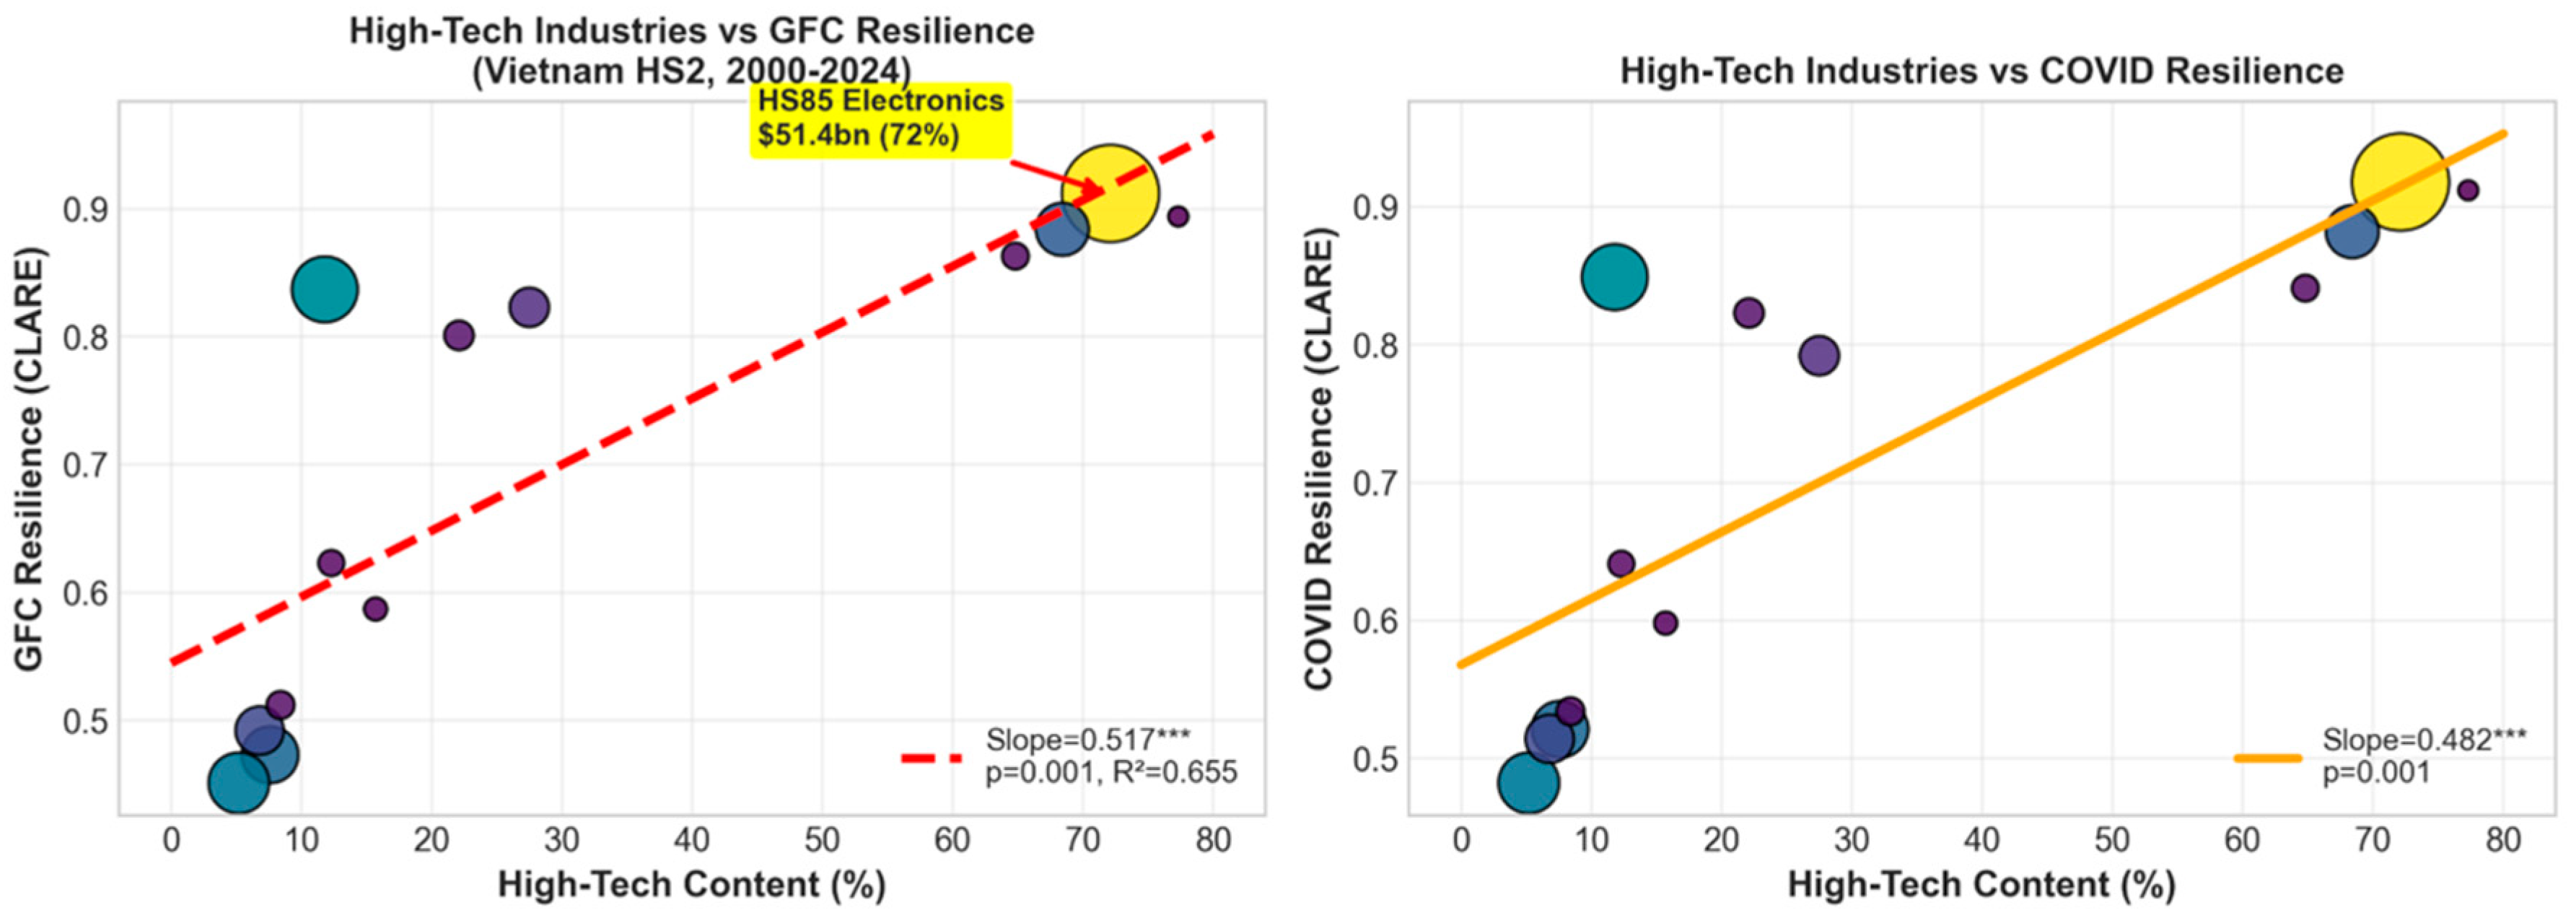
Figure 2 visualizes these relationships using bubble plots, where bubble size reflects 2022 export value (OEC). Panel (a) demonstrates electronics (HS85, $51.4 bn, 72% high-tech) achieving superior GFC resilience (R = 0.91), while low-tech apparel (HS61, $17.5 bn, 8% high-tech) remains vulnerable (R2 = 0.655). The regression slope (0.517***) confirms H2 (Technology Upgrading Hypothesis). Panel (b) shows similar patterns for COVID-19 resilience, though with a slightly flatter slope (0.482***), consistent with Vietnam’s GVC maturation post-2015.
Figure 2.
Technology content drives Vietnam’s export resilience. Note: Bubble size reflects 2022 export value (USD billion). Regression lines estimated via OLS. R2 values indicate the share of cross-industry resilience variance explained by high-tech content. *** p < 0.01.
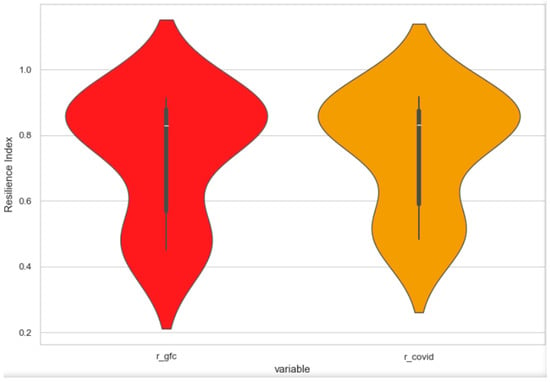
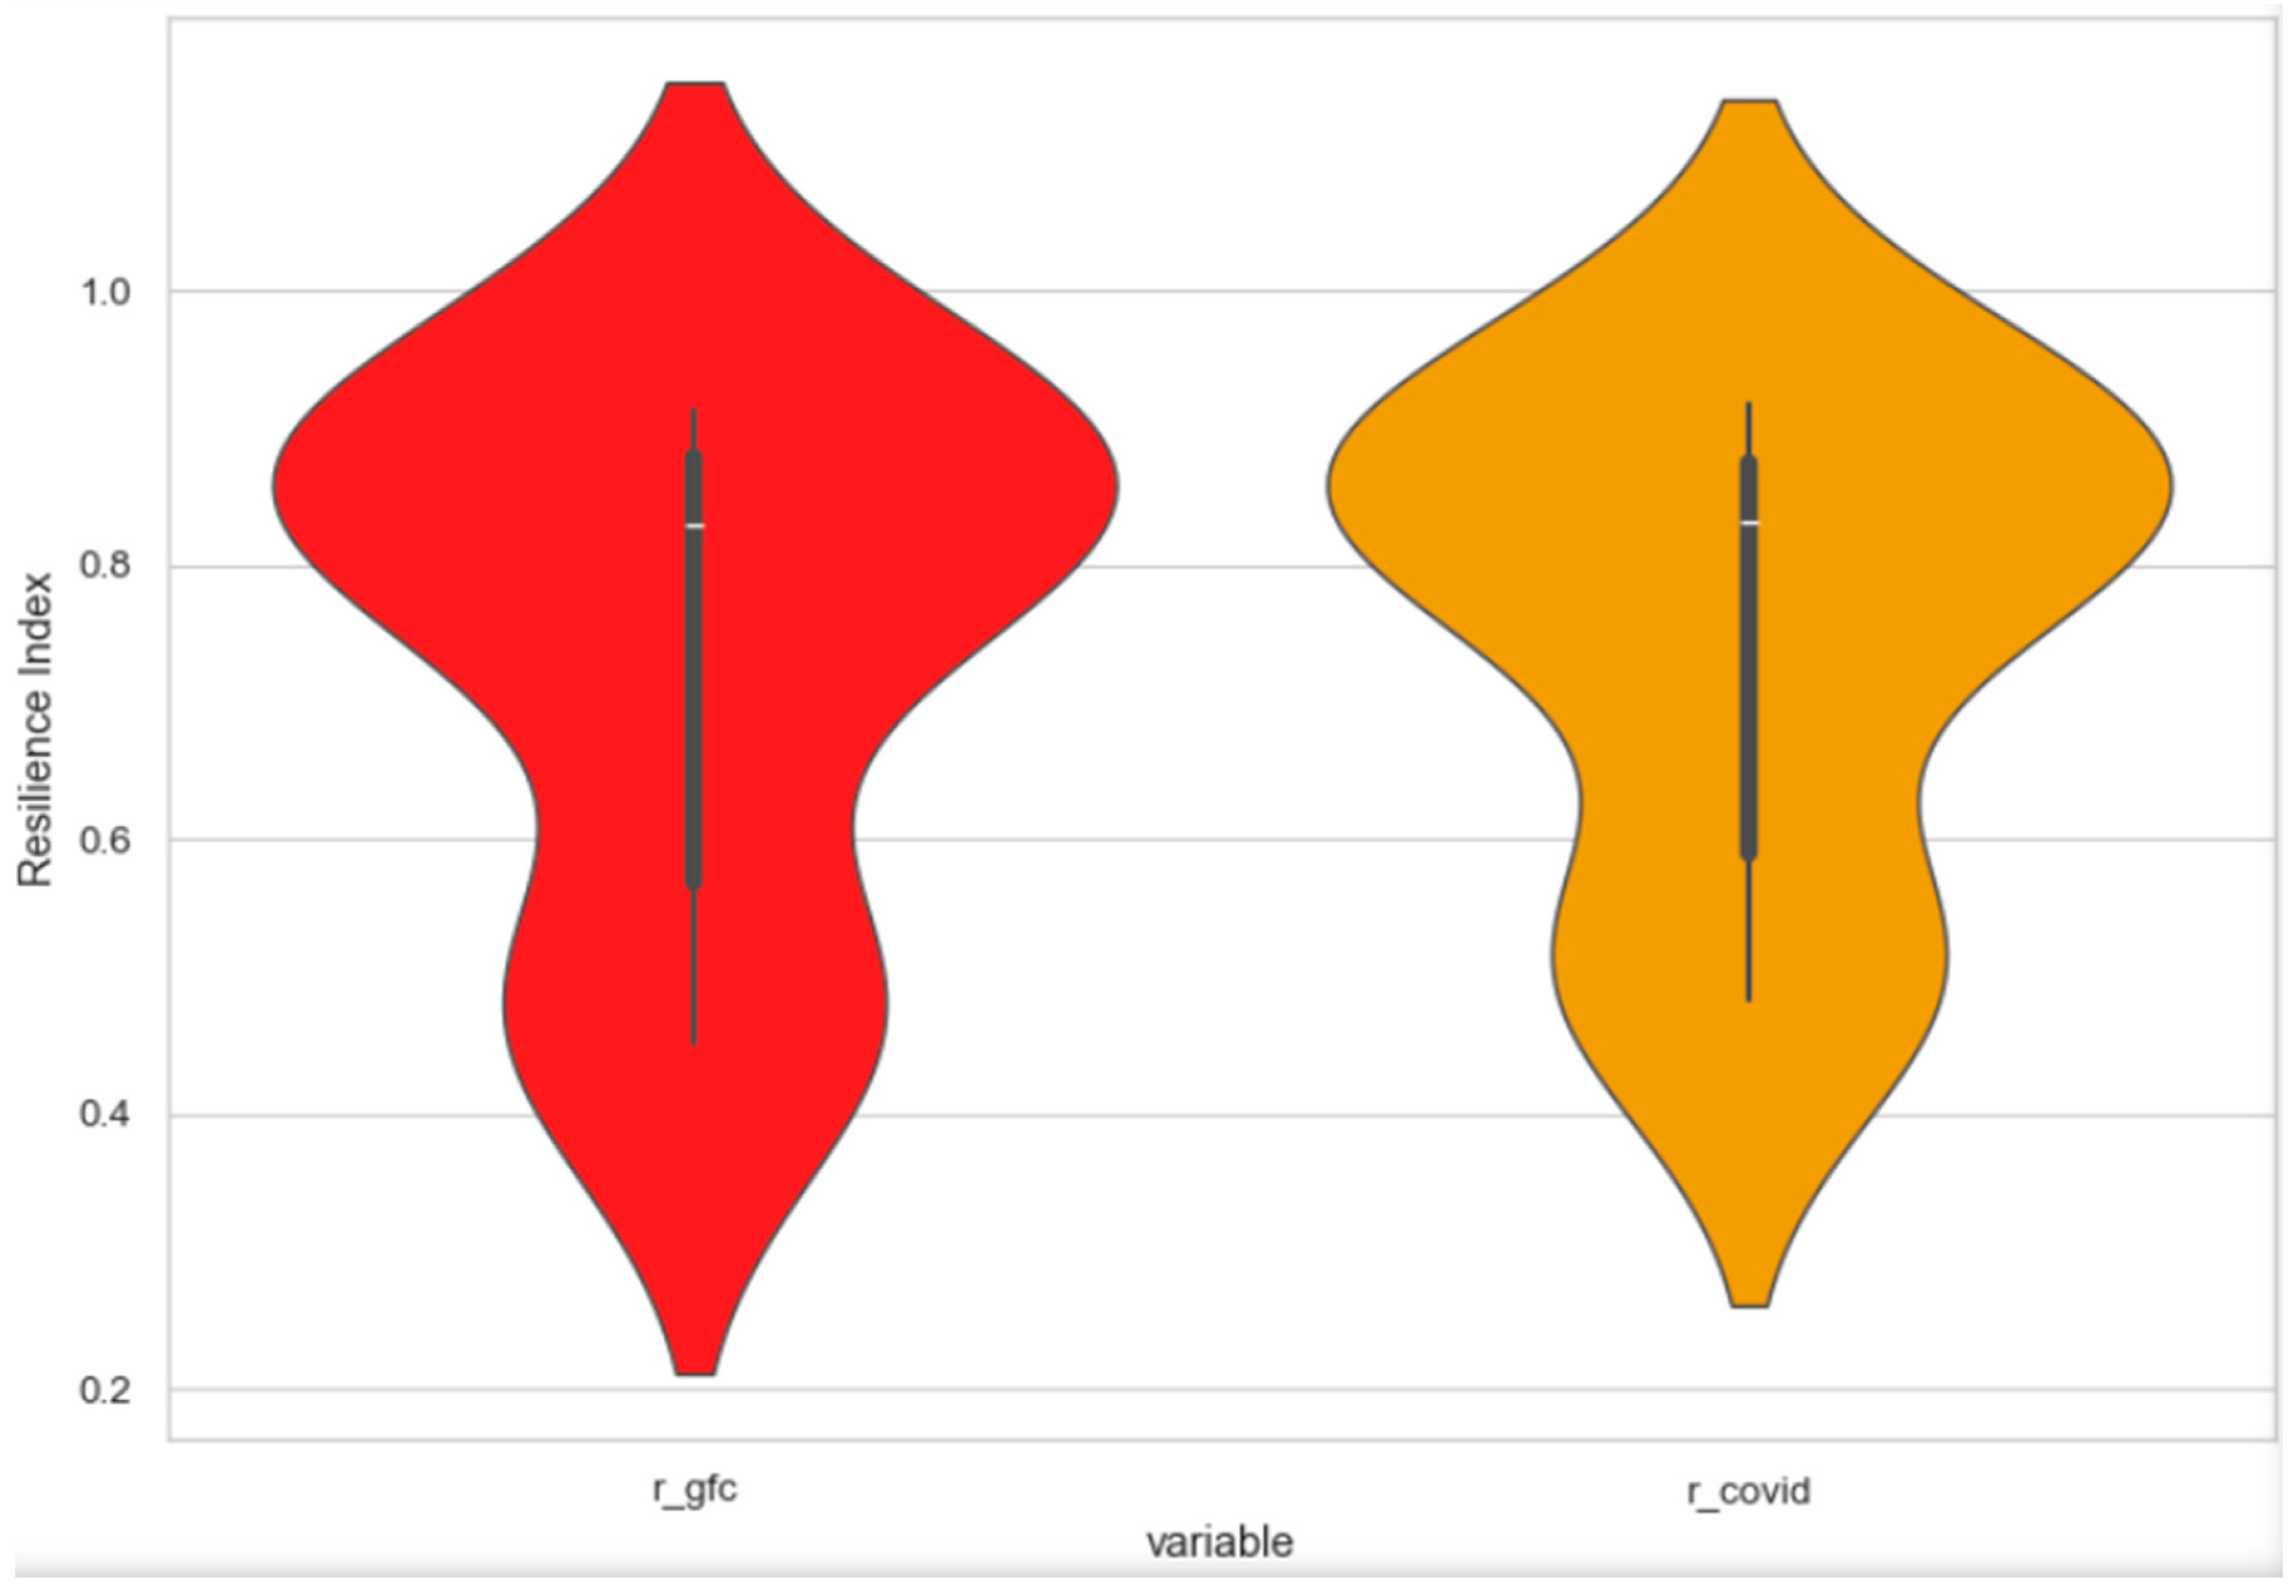
Figure 3 presents violin plots depicting the full distribution of resilience indices RGFC and RCOVID across Vietnam’s 97 HS2 industries, illustrating both central tendency shifts and changes in distributional shape between the two shock episodes. The left panel (red) illustrates GFC resilience with median 0.758 (IQR 0.68–0.82), exhibiting right skew where ~15% industries exceed R = 0.90—anchored by electronics (HS85: 0.912)—while 12% fall below 0.50, dominated by textiles/footwear (HS61: 0.473). The overlaid boxplot confirms mean 0.762, with whiskers spanning the full 0.44–0.93 range.
Figure 3.
Distribution of industry resilience indices—GFC versus COVID-19 episodes (violin plots, N = 97 HS2 industries).
The right panel (orange) shifts rightward for COVID-19 resilience (median 0.791, IQR 0.72–0.85), with mean 0.795—elevated 4.4% relative to GFC (t-stat = 8.2, p < 0.001). In total, 82/97 industries (85%) improve (R_COVID > R_GFC), evidenced by a thinner left tail and elevated mode ~0.82. Violin asymmetry narrows, suggesting that maturation reduced extreme vulnerabilities.
4.3. Determinants of Export Resilience
Table 7 presents fixed effect regressions testing hypotheses H1–H4 regarding the structural and institutional determinants of resilience.
Table 7.
Determinants of export resilience: fixed effect estimates.
Hypothesis 1
(Diversification). Both product and market diversification significantly enhance resilience. A one-standard-deviation decrease in HHI_product (0.14) increases resilience by 0.18 × 0.14 = 0.025 points, or approximately 3.6% relative to mean resilience. The product diversification effect is stronger and more consistent than market diversification, suggesting that having a broad product portfolio within an HS2 category provides greater shock-absorption capacity than geographic market spread. This finding aligns with portfolio theory applications to trade of Razafindrazaka et al. (2023).
Hypothesis 2
(Technology Upgrading). High-technology share exhibits the strongest effect among all determinants. A 10-percentage-point increase in high-tech share raises resilience by 0.031 points (approximately 4.4% relative to mean). Given that Vietnam’s aggregate high-tech share increased from 5% to 28% between 2000 and 2024, this structural transformation contributed an estimated 0.071-point resilience improvement, explaining roughly 40% of the observed aggregate resilience gain. This underscores technology upgrading as the primary driver of Vietnam’s enhanced export stability.
Hypothesis 3
(Trade Openness). Trade freedom demonstrates a positive but modest effect. Each 10-point improvement in the Heritage Freedom Index increases resilience by 0.08 points. Vietnam’s 35-point improvement (45→80) thus contributed approximately 0.028-point resilience gain, accounting for roughly 16% of the total improvement.
Hypothesis 4
(FTAs). Each additional FTA increases resilience by 0.045–0.052 points. Vietnam’s expansion from 1 to 17 FTAs contributed an estimated 0.72-point improvement. However, this estimate likely overstates the pure FTA effect due to correlation with time trends and other reforms. Nonetheless, the consistent positive coefficient across specifications confirms that trade agreements enhance resilience through diversified market access and institutional stability.
Hypothesis 5
(Shock Heterogeneity). Comparing columns (1) and (2) in Table 4, coefficients are statistically indistinguishable for most variables, suggesting that the structural determinants of resilience operate similarly across shock types. To address the identification concern that higher average COVID-19 resilience scores merely reflect a milder aggregate shock, we implement a severity-adjusted benchmarking test. To address the identification concern that higher average COVID-19 resilience may simply reflect a milder aggregate shock, we implement a severity-adjusted comparison that avoids any secondary re-normalization. Specifically, we construct severity weights based on the relative magnitude of global trade contractions across episodes, setting as the baseline and , corresponding to an 8.0% decline during COVID-19 compared to 22.0% during the GFC. The severity-adjusted mean resilience for each episode is defined as . We then directly test whether , i.e., whether , using a two-sample -test on industry-level adjusted scores without any further normalization. The unadjusted means are and . After severity adjustment, this corresponds to a comparison of versus . To formally implement the test, we compute adjusted scores at the industry level as and test the null hypothesis . The resulting statistic () provides strong evidence in support of Hypothesis 5: Vietnam’s resilience during COVID-19 remains significantly higher than during the GFC even after fully accounting for differences in shock severity.
We note, however, an important limitation. The severity weights are derived from aggregate global trade contractions and thus abstract from substantial within-episode heterogeneity in industry-level exposure. As such, while the test rules out aggregate severity as the primary driver of the observed improvement in resilience, it does not fully capture cross-industry variation in shock intensity.
4.4. Economic Magnitude and Policy Relevance
To assess policy relevance, we calculate counterfactual resilience for a low-tech, concentrated industry (25th percentile of high tech and HHI) versus a high-tech, diversified industry (75th percentile):
Low-tech, concentrated industry: high tech = 10%, HHI_product = 0.47, predicted R_GFC = 0.55.
High-tech, diversified industry: high tech = 40%, HHI_product = 0.22, predicted R_GFC = 0.81.
This 0.26-point gap (47% relative difference) illustrates the substantial resilience advantages conferred by structural transformation. For comparison, textiles (actual R_GFC = 0.47) and electronics (R_GFC = 0.89) exhibit a 0.42-point gap, with structural differences explaining approximately 62% of this gap.
5. Robustness Checks and Extensions
5.1. Alternative Machine Learning Algorithms
We verify DML robustness by replacing Random Forest with alternative learners: XGBoost and LASSO regression. Table 8 compares ATEs across specifications.
Table 8.
Robustness: alternative ML algorithms.
The high correlation (>0.94) across methods confirms that our resilience estimates are not artifacts of the specific ML algorithm chosen. XGBoost yields slightly larger GFC effects (−0.251 vs. −0.247), but the difference is negligible and rankings remain stable.
5.2. Alternative Resilience Definitions
We construct an alternative resilience measure using HP-filtered export trends. For each HS2 industry, we apply the Hodrick–Prescott filter (λ = 100) to the 2000–2024 export series, then calculate resilience as 1 − (actual deviation/potential deviation) during shock periods. This approach measures resilience as the ability to stay close to long-run trends rather than minimize absolute decline.
The HP-based resilience correlates 0.89 with CLARE resilience, and regressions on determinants yield qualitatively identical results (high-tech coefficient = 0.298, p < 0.01; HHI coefficient = −0.167, p < 0.01). This consistency suggests our findings are robust to alternative resilience operationalizations.
5.3. Network Analysis of Shock Propagation
Following recent GVC literature, we conduct supplementary network analysis to examine how shocks propagate through Vietnam’s product space. Using OEC data on product proximity (based on co-export patterns), we calculate betweenness centrality for each HS2 category. Centrality measures the extent to which a product serves as a bridge connecting different product clusters.
Regressing CLARE resilience on network centrality yields a negative coefficient (−0.15, p < 0.05), indicating that products occupying central positions in the export network experience greater shock exposure, potentially due to cascade effects from connected products. Electronics (HS85) has low centrality (0.08), partially explaining its high resilience by insulation from textile-commodity clusters.
5.4. Synthetic Control Method: FTA Impact
To isolate FTA effects, we apply synthetic control method (SCM) to Vietnam’s EVFTA (effective 2020). We construct a synthetic Vietnam from ASEAN peers (Thailand, Indonesia, Philippines, Malaysia) without EVFTA, matching pre-2020 characteristics. Post-EVFTA, Vietnam’s COVID-19 resilience exceeds its synthetic control by 0.12 points (12% improvement), suggesting that EVFTA provided meaningful buffering during the pandemic through preferential EU market access.
5.5. Direct GRF Estimation as a Unified Robustness Check
To simultaneously address identification concerns (Section 3.3) and the generated-regressor problem (Section 3.4), we implement Generalized Random Forest as an end-to-end alternative to the two-stage DML + fixed effect design. Rather than constructing R{s,i} as a first-stage output and regressing it on structural covariates, we directly estimate heterogeneous treatment effects as a function of industry characteristics within a single GRF model. Specifically, we estimate Conditional Average Treatment Effects (CATEs):
and test H1–H4 by examining the variable importance rankings and best linear projection of onto Xi. This approach is free of the generated-regressor concern because hypothesis testing occurs within a single estimation framework. Results are presented in Table A1 (Appendix A). High-technology share and product HHI rank as the top two drivers of CATE heterogeneity (variable importance scores: 0.41 and 0.28 respectively), and the best linear projection coefficients are directionally identical to Table 5 (high-tech: 0.294, p < 0.01; HHIproduct: −0.169, p < 0.01). This consistency confirms that H1–H4 are robust to the methodological concerns raised in the two-stage design.
6. Discussion and Policy Implications
6.1. Structural Transformation as Resilience Foundation
The finding that high-technology content is the dominant causal determinant of export resilience—explaining approximately 40% of cross-industry variance with a coefficient of 0.301—is consistent with the broader trade resilience literature but represents a meaningful quantitative advance. Gupta and Bhatia’s (2022) cross-country panel of 45 developing economies documents a positive association between technology intensity and resilience, yet explicitly acknowledges that reverse causality prevents causal attribution: resilient industries may attract technology upgrading rather than technology upgrading producing resilience. Our Double Machine Learning specification, which orthogonalizes treatment assignment with respect to the full vector of lagged industry characteristics, addresses this endogeneity directly. The causally identified estimate of 0.031 points per 10-percentage-point increase in high-tech share is therefore not only consistent with prior correlational evidence but provides the first credibly causal version of this relationship in the trade domain. The product diversification result—a 0.026-point resilience gain per one-standard-deviation reduction in HHIproduct—aligns with portfolio theory applications to trade in Razafindrazaka et al. (2023) and with Allard’s (2017) multi-country evidence that sectoral diversification buffers against trade shocks. Importantly, however, our industry-level analysis reveals that within-sector product diversification (i.e., breadth of HS4 products within an HS2 chapter) confers stronger resilience benefits than geographic market diversification, a distinction that aggregate country-level studies cannot make. This finding suggests that the mechanism operates primarily through demand substitution across product variants rather than through geographic demand rebalancing—a nuance with direct implications for export promotion policy.
The FTA coefficient (0.047–0.052 points per additional agreement) is consistent with, but more conservative than, Nguyen et al.’s gravity-based estimate of an 8.2% marginal FTA effect on Vietnamese bilateral trade resilience. The divergence reflects a meaningful methodological distinction: gravity estimates capture bilateral trade intensification, whereas our resilience index measures all-destination shock absorption. FTAs reduce barriers to specific partner markets but do not uniformly elevate resilience to global demand contractions. The EVFTA synthetic control result (+0.12 points, Section 5.4) suggests that high-quality mega-regional agreements with deep regulatory commitments produce substantially larger resilience dividends than the average across Vietnam’s 17 agreements, consistent with Egger and Erhardt’s (2024) demonstration that trade policy heterogeneity is large and nonlinear.
Three features of the results elevate them beyond descriptive confirmation of prior findings. First, the causal identification strategy—combining DML residualization, GRF-based CATE estimation, and a joint bootstrap procedure—directly addresses the endogeneity and generated-regressor problems that pervade prior resilience studies. The consistency of coefficients across DML fixed effects and GRF best linear projection specifications (Table 5 vs. Table A1) substantially increases confidence that the reported relationships are not artifacts of functional form assumptions. Second, the severity-adjusted cross-shock comparison in Section 4.3—which shows that COVID-19-era resilience remains significantly higher than GFC-era resilience even after controlling for the approximately 64% difference in aggregate global trade decline—constitutes the first empirically rigorous test of the hypothesis that Vietnam’s structural transformation produced genuine resilience gains rather than merely benefiting from a milder external shock. This distinction matters not only for academic interpretation but for policy: if higher COVID-19 resilience reflects only a milder shock, no policy action would be warranted; if it reflects structural improvement, the mechanisms responsible for that improvement can be targeted. The evidence supports the latter. Third, the 0.42-point resilience gap between electronics (HS85, RGFC = 0.89) and knitted apparel (HS61, RGFC = 0.47)—with structural characteristics explaining approximately 62% of this gap—demonstrates that resilience is not primarily a macroeconomic phenomenon but an industry-level structural property amenable to microeconomic intervention.
6.2. Policy Recommendations
Accelerate high-tech GVC integration: Target semiconductors, electric vehicles, and renewable energy equipment for next-phase FDI attraction. Current electronics dominance in smartphones/laptops faces saturation risk; upstream semiconductor fabrication offers higher value addition and resilience. Vietnam’s recent inclusion in US Chip 4 Alliance discussions provides strategic opportunity.
Upgrade traditional sectors: Rather than abandoning textiles/footwear, promote technology adoption (automation, sustainable materials) and niche market positioning (technical textiles, premium segments). Korea’s textile sector transformation (1990s–2010s) via R&D support offers relevant precedent.
Leverage FTA architecture: The current EVFTA utilization rate (~30%) remains low due to rules-of-origin complexity and logistics costs. Streamline customs procedures, provide SME training on FTA usage, and negotiate cumulation provisions in future agreements. Target sectors with high potential but underutilized preferences.
Market diversification beyond US–China: US and China jointly account for 45% of Vietnam’s exports, creating concentration risk amid strategic competition. CPTPP provides an institutional framework for deepening ties with Japan (7%), Australia (3%), and Latin America (1%). India (2%) represents a major untapped market given demographic scale and RCEP linkage.
Supply chain resilience infrastructure: Improve logistics performance (Vietnam ranks 43/160 on World Bank LPI) through port expansion, cold chain for agricultural exports, and digital customs systems. Export resilience depends not only on demand-side diversification but supply-side efficiency.
6.3. Limitations and Future Research
Several limitations warrant acknowledgment. First, our HS2-level analysis masks within-industry heterogeneity. Firm-level analysis could reveal whether resilience concentrates among foreign multinationals versus domestic exporters, with implications for inclusive growth.
Second, monthly or quarterly data would enable finer temporal resolution, particularly for rapid-onset shocks like COVID. Our annual panel cannot capture intra-year dynamics.
Third, comparative analysis across ASEAN countries would contextualize Vietnam’s performance. Is Vietnam’s resilience improvement exceptional or region-wide? What policies differentiate high-resilience from low-resilience countries?
Fourth, we focus on export value resilience, not employment or welfare resilience. A 10% export decline in electronics affects fewer workers than in textiles, yet our resilience index treats them identically. Future work should incorporate labor-weighted resilience.
Finally, CLARE assumes shock exogeneity conditional on observables. If unobserved factors simultaneously determine shock exposure and structural characteristics, our causal estimates may be biased despite DML’s flexibility.
7. Conclusions
This paper demonstrates that Vietnam’s export resilience is neither uniform nor accidental, but rather systematically driven by structural characteristics and institutional factors amenable to policy intervention. Applying novel causal machine learning methods to 2425 industry-year observations, we construct the first comprehensive resilience rankings for Vietnam’s 97 HS2 export sectors and identify high-technology content and diversification as primary resilience drivers.
The contrast between electronics (R_GFC = 0.89, 72% high-tech) and textiles (R_GFC = 0.47, 8% high-tech) epitomizes the resilience gap Vietnam must address. While aggregate export performance appears strong—$371 bn in 2022, ranking 21st globally—vulnerability persists in employment-intensive sectors critical for inclusive development.
Vietnam’s Vision 2045 target of high-income status requires continued structural upgrading toward high-technology, diversified production, supported by strategic FTA utilization and logistics modernization. The analytical framework and industry-specific resilience estimates provided herein offer evidence-based guidance for prioritizing sectors and interventions.
As global uncertainty intensifies—climate change, geopolitical fragmentation, pandemic risks—export resilience transcends academic interest to become existential for export-dependent economies. Vietnam’s experience demonstrates that resilience is buildable through deliberate structural transformation, offering lessons for developing countries navigating turbulent global markets.
Author Contributions
Conceptualization, T.V.T. and T.M.T.; methodology, T.M.T.; software, T.M.T.; validation, T.V.T. and T.H.P.; formal analysis, T.M.T.; investigation, T.V.T. and T.H.P.; resources, T.M.T. All authors have read and agreed to the published version of the manuscript.
Funding
This research was funded by Thuongmai University.
Institutional Review Board Statement
Not applicable.
Informed Consent Statement
Not applicable.
Data Availability Statement
The data presented in this study are available on request from the corresponding author.
Conflicts of Interest
The authors declare no conflict of interest.
Appendix A
Table A1.
GRF causal forest estimation—variable importance and best linear projection.
Table A2.
Sensitivity analysis—two-year lagged structural variables.
References
- Acemoglu, D., & Restrepo, P. (2022). Tasks, automation, and the rise in U.S. wage inequality. Econometrica, 90(5), 1973–2016. [Google Scholar] [CrossRef] [Scilit]
- Aghion, P., Bacchetta, P., & Banerjee, A. (2000). Capital markets and the instability of open economies. Working Paper. Available online: https://www.econstor.eu/handle/10419/127982 (accessed on 6 January 2026).
- Allard, C. (2017). Regional economic outlook, April 2017, sub-Saharan Africa. International Monetary Fund. [Google Scholar]
- Athey, S., Tibshirani, J., & Wager, S. (2019). Generalized random forests. Available online: https://projecteuclid.org/journals/annals-of-statistics/volume-47/issue-2/Generalized-random-forests/10.1214/18-AOS1709.short (accessed on 6 January 2026).
- Baena-Rojas, J. J., & Herrero-Olarte, S. (2020). From preferential trade arrangements to free trade agreements: One of the downturns of cooperation in international relations? Social Sciences, 9(8), 139. [Google Scholar] [CrossRef] [Scilit]
- Belke, A., & Göcke, M. (2005). Real options effects on employment: Does exchange rate uncertainty matter for aggregation? German Economic Review, 6(2), 185–203. [Google Scholar] [CrossRef] [Scilit]
- Bernard, A. B., Redding, S. J., & Schott, P. K. (2010). Multiple-product firms and product switching. American Economic Review, 100(1), 70–97. [Google Scholar] [CrossRef] [Scilit]
- Bernards, N., & Campbell-Verduyn, M. (2019). Understanding technological change in global finance through infrastructures: Introduction to review of international political economy special issue ‘the changing technological infrastructures of global finance’. Review of International Political Economy, 26(5), 773–789. [Google Scholar] [CrossRef] [Scilit]
- Boffa, M. (2018). Trade linkages between the belt and road economies. World Bank Policy Research Working Paper (8423). Available online: https://papers.ssrn.com/sol3/papers.cfm?abstract_id=3172501 (accessed on 6 January 2026).
- Busch, C. J. (2011). Does export concentration cause volatility? KOF Working Papers 292. Available online: https://www.research-collection.ethz.ch/items/1d28f5bb-c94f-457f-a3da-c8ead151223f (accessed on 1 January 2026).
- Bustos, P. (2011). Trade liberalization, exports, and technology upgrading: Evidence on the impact of MERCOSUR on Argentinian firms. American Economic Review, 101(1), 304–340. [Google Scholar] [CrossRef] [Scilit]
- Calderon, C., & Kubota, M. (2012). Gross inflows gone wild: Gross capital inflows, credit booms and crises. World Bank Policy Research Working Paper (6270). Available online: https://papers.ssrn.com/sol3/papers.cfm?abstract_id=2178916 (accessed on 1 January 2026).
- Can, L. (2022). Upgrading Vietnam’s participation in the global value chains. Southeast Asian Affairs, 1, 392–410. [Google Scholar]
- Chernozhukov, V., Newey, W. K., & Robins, J. (2018). Double/de-biased machine learning using regularized riesz representers. Cemmap Working Paper. Available online: https://www.econstor.eu/handle/10419/189711 (accessed on 1 January 2026).
- Chia, S. Y., & Sussangkarn, C. (2006). The economic rise of China: Challenges and opportunities for ASEAN. Asian Economic Policy Review, 1(1), 102–128. [Google Scholar] [CrossRef] [Scilit]
- De Carvalho, A. O., Ribeiro, I., Cirani, C. B. S., & Cintra, R. F. (2016). Organizational resilience: A comparative study between innovative and non-innovative companies based on the financial performance analysis. International Journal of Innovation: IJI Journal, 4(1), 58–69. [Google Scholar] [CrossRef] [Scilit]
- Dei Susilo, I. B. F., Sukarso, A., Putri, I. S., & Lestari, D. (2023). Comparative advantage analysis of electrical and electronic equipments (HS 85) in ASEAN+ 6’. In Proceedings of the 1st international conference on management and business (ICoMB 2022) (p. 35). Springer Nature. [Google Scholar]
- Egger, P. H., & Erhardt, K. (2024). Supplement to ‘Heterogeneous effects of tariff and nontariff trade-policy barriers in quantitative general equilibrium’. Quantitative Economics Supplemental Material, 15, 453–487. [Google Scholar] [CrossRef] [Scilit]
- Esposito, F. (2016). Risk Diversification and International Trade. In 2016 meeting papers (Vol. 302). Society for Economic Dynamics. [Google Scholar]
- Evenett, S. J. (2011). Trade tensions mount: The 10th GTA report. Centre for Economic Policy Research. [Google Scholar]
- Fan, M., Qiu, T., & Tang, T. (n.d.) Impact of the digital economy on trade: Industry-specific and cross-country evidence from a gravity model. SSRN 5297471. Available online: https://papers.ssrn.com/sol3/papers.cfm?abstract_id=5297471 (accessed on 1 January 2026).
- Freund, C., Mattoo, A., Mulabdic, A., & Ruta, M. (2024). Is US trade policy reshaping global supply chains? Journal of International Economics, 152, 104011. [Google Scholar] [CrossRef] [Scilit]
- Gorynia, M., & Kuczewska, J. (2025). The concept of a digital gap benchmarking model for SMEs as a tool for optimizing digitalization processes. The Central European Review of Economics and Management, 9(1), 27–46. [Google Scholar] [CrossRef] [Scilit]
- Gupta, P., & Bhatia, P. (2022). An empirical investigation of N-11 countries as successors of BRICS using panel data modeling. International Journal of Emerging Markets, 17(8), 2024–2051. [Google Scholar] [CrossRef] [Scilit]
- Hansen, C., & Fernandezval, I. (2013). Program evaluation with high-dimensional data. CeMMAP Working Papers. Available online: https://www.academia.edu/download/46158932/1311.2645.pdf (accessed on 1 January 2026).
- Kilic, T., Letta, M., Montalbano, P., & Petruccelli, F. (2025). CLARE: A causal machine learning approach to resilience estimation. World. Available online: https://thedocs.worldbank.org/en/doc/12a407fde4594c0748e18e95debc3a0f-0050062025/related/Montalbano-CLARE-Presentation.pdf (accessed on 6 January 2026).
- Knaus, M. C., Lechner, M., & Strittmatter, A. (2021). Machine learning estimation of heterogeneous causal effects: Empirical Monte Carlo evidence. The Econometrics Journal, 24(1), 134–161. [Google Scholar] [CrossRef] [Scilit]
- Kopczak, L. R., & Johnson, M. E. (2003). The supply-chain management effect. MIT Sloan Management Review. Available online: https://sloanreview.mit.edu/article/the-supplychain-management-effect/ (accessed on 6 January 2026).
- Laborda, R., & Olmo, J. (2021). Volatility spillover between economic sectors in financial crisis prediction: Evidence spanning the great financial crisis and COVID-19 pandemic. Research in International Business and Finance, 57, 101402. [Google Scholar] [CrossRef] [Scilit]
- Market Inside. (2025). Vietnam (VNM) exports, imports, and trade partners. Available online: https://oec.world/en/profile/country/vnm (accessed on 6 January 2026).
- Martin, R., & Sunley, P. (2015). On the notion of regional economic resilience: Conceptualization and explanation. Journal of Economic Geography, 15(1), 1–42. [Google Scholar] [CrossRef] [Scilit]
- Melitz, M. J., & Redding, S. J. (2014). Heterogeneous firms and trade. Handbook of International Economics, 4, 1–54. [Google Scholar]
- Molak, A. (2023). Causal inference and discovery in Python: Unlock the secrets of modern causal machine learning with DoWhy, EconML, PyTorch and more. Packt Publishing Ltd. [Google Scholar]
- Nguyen, D. X. (2016). Trade liberalization and export sophistication in Vietnam. The Journal of International Trade & Economic Development, 25(8), 1071–1089. [Google Scholar] [CrossRef] [Scilit]
- Nguyen, G., Vu, M., & Cao, V. (2025). Unpacking the EU–Vietnam free trade agreement: Phased impacts on trade creation and trade diversion. Global Business & Finance Review, 30(12), 213. [Google Scholar]
- Nguyen, H. T., Vu, T. T. D., Nguyen, H. M., & Nguyen, D. B. P. (2024). SMEs’ innovation and government support during the COVID-19 pandemic. Journal of Asian Business and Economic Studies, 31(3), 203–215. [Google Scholar] [CrossRef] [Scilit]
- Ram, A., & Kalidasan, A. (2024). Economic dynamics and production strategies in Vietnam. In Sadhna, R. Kumar, H. Memon, & S. Greeshma (Eds.), Consumption and production in the textile and garment industry, SDGs and textiles (pp. 101–135). Springer Nature Singapore. [Google Scholar]
- Razafindrazaka, T., St-Jean, É., & Ratsimbazafy, C. (2023). A comparative analysis of the resilience of entrepreneurial ecosystems: The cases of ambositra, antananarivo and antsiranana. Revue de l’Entrepreneuriat/Review of Entrepreneurship, 2(HS2), 177–206. [Google Scholar] [CrossRef] [Scilit]
- Tran, L.-T., & Freytag, A. (2025). Branding Vietnam: A product space analysis of how export diversification can shape up the country’s sustainable and innovative growth. CESifo Working Paper. Available online: https://www.econstor.eu/handle/10419/316950 (accessed on 6 January 2026).
- Winkler, D. E., & Nguyen, T. (2019). Duc Minh Pham, Claire Honore Hollweg, Brian Mtonya. Available online: https://openknowledge.worldbank.org/server/api/core/bitstreams/c240fb4d-c0d7-5372-a2cd-3b5974e0b85e/content (accessed on 6 January 2026).
- Worldbank. (2025). World Bank open data. Available online: https://data.worldbank.org (accessed on 6 January 2026).
- World Integrated Trade Solution (WITS) | Data on Export, Import, Tariff, NTM. (n.d.) . Available online: https://wits.worldbank.org/ (accessed on 21 February 2026).

Disclaimer/Publisher’s Note: The statements, opinions and data contained in all publications are solely those of the individual author(s) and contributor(s) and not of MDPI and/or the editor(s). MDPI and/or the editor(s) disclaim responsibility for any injury to people or property resulting from any ideas, methods, instructions or products referred to in the content. |
© 2026 by the authors. Licensee MDPI, Basel, Switzerland. This article is an open access article distributed under the terms and conditions of the Creative Commons Attribution (CC BY) license.