Article

Long-Run Heterogeneous Effects of Entrepreneurship, Institutional Quality, and Macroeconomic Stability on GDP per Capita: Evidence from EU-26 Countries


by
Sadokat Khalikchaeva
1,
Yuldoshboy Sobirov
2,*,
Daniyor Kurbanov
3,
Nuriddin Shanyazov
4,
Nilufar Nabiyeva
5,
Samariddin Makhmudov
6,7 and
Jurabek Kuralbaev
8
1
Department of Tax and Taxation, Tashkent State University of Economics, Tashkent 100066, Uzbekistan
2
Department of Accounting, Mamun University, Khiva 220900, Uzbekistan
3
Department of Business Management, Tashkent State University of Economics, Tashkent 100066, Uzbekistan
4
Department of Economics, Mamun University, Khiva 220900, Uzbekistan
5
Department of International Tourism and Economy, Kokand University, Kokand 150700, Uzbekistan
6
Department of Finance and Tourism, Termez University of Economics and Service, Termez 190111, Uzbekistan
7
Department of Finance, Alfraganus University, Tashkent 100190, Uzbekistan
8
Department of Tourism, Urgench State University named after Abu Rayhan Beruni, Urgench 220100, Uzbekistan
*
Author to whom correspondence should be addressed.
Economies 2026, 14(5), 150; https://doi.org/10.3390/economies14050150
Submission received: 10 March 2026 / Revised: 9 April 2026 / Accepted: 16 April 2026 / Published: 25 April 2026
(This article belongs to the Special Issue Regional Economic Development: Policies, Strategies and Prospects)

Abstract

This study investigates the determinants of GDP per capita across 26 European Union member states over the period of 2006–2024, with a particular focus on entrepreneurship, institutional quality, and macroeconomic factors. Given the presence of long-run income differences across EU countries, the analysis explicitly accounts for structural heterogeneity in economic development and institutional capacity. To ensure robust estimation in the presence of cross-sectional dependence and slope heterogeneity, the study employs advanced panel econometric techniques, including tests for cross-sectional dependence, unit roots, and cointegration. Long-run relationships and short-run dynamics are estimated using the Cross-Sectionally Augmented Autoregressive Distributed Lag (CS-ARDL) model, complemented by robustness checks based on the Augmented Mean Group (AMG) and Common Correlated Effects Mean Group (CCEMG) estimators. In addition, the Method of Moments Quantile Regression (MMQR) is applied to capture heterogeneity across different points of the income distribution, thereby reflecting long-run income disparities among EU member states. The empirical results confirm the existence of a stable long-run equilibrium relationship among the variables. The baseline CS-ARDL estimates indicate that institutional quality, entrepreneurial activity, trade openness, and government expenditure exert positive and statistically significant effects on GDP per capita, while financial development exhibits a negative effect and foreign direct investment remains insignificant. In the short run, entrepreneurship and trade openness contribute positively to GDP per capita, whereas government expenditure and credit expansion generate contractionary effects. The robustness analysis using AMG and CCEMG estimators largely supports these findings, as the direction of the coefficients remains consistent across alternative specifications, although some variation in statistical significance is observed due to differences in the treatment of cross-sectional dependence and unobserved common factors. The MMQR results further reveal substantial heterogeneity across the income distribution, indicating that the effects of key determinants vary depending on countries’ long-run income levels. In particular, trade openness and institutional quality exert stronger positive effects in lower-income quantiles, while the adverse effects of excessive financial development are more pronounced in higher-income quantiles. Overall, the findings underscore the importance of promoting productive entrepreneurship, strengthening institutional frameworks, facilitating trade integration, and ensuring efficient financial intermediation to enhance GDP per capita within the European Union. The results also highlight the need for differentiated policy approaches that explicitly account for long-run income heterogeneity, structural differences, and varying institutional capacities across EU member states.

1. Introduction

Understanding the determinants of economic performance has long been a central concern in economic theory and empirical research. Since the seminal contributions of Solow (1956) and the development of endogenous growth models by Romer (1986) and Lucas (1988), an extensive body of literature has sought to explain cross-country differences in income levels and long-term growth trajectories. While the neoclassical framework emphasizes capital accumulation, labor expansion, and exogenous technological progress, endogenous growth theory highlights innovation, knowledge spillovers, and human capital accumulation as fundamental drivers of sustained economic growth. In the context of the European Union (EU), the analysis of growth determinants remains particularly relevant given the region’s heterogeneous and evolving economic landscape. Despite decades of economic integration and cohesion policies, income convergence across member states remains incomplete. Recent evidence indicates that economic growth in the EU is moderate and uneven, with overall GDP growth projected at around 1.1–1.4% in 2025, reflecting a modest recovery under conditions of persistent global uncertainty. Significant cross-country variation persists: while some economies such as Spain have recorded relatively strong growth (around 2.8%), others—including Germany—have experienced near stagnation.
Moreover, the EU economy continues to face structural and cyclical challenges. Although inflation has gradually declined toward the European Central Bank’s target of approximately 2%, fiscal pressures remain elevated, with public debt and budget deficits increasing in several member states. At the same time, geopolitical tensions, energy market disruptions, and global trade uncertainties continue to constrain economic performance and investment. These developments underscore the importance of reassessing the key drivers of growth, particularly those related to structural efficiency and long-term productivity. Within this framework, entrepreneurship has emerged as a critical engine of economic dynamism and structural transformation. Drawing on the Schumpeterian concept of “creative destruction,” entrepreneurial activity facilitates the introduction of new technologies, products, and business models, thereby enhancing productivity and fostering economic growth. Empirical studies (Audretsch et al., 2006; Acs & Audretsch, 2010; Urbano et al., 2019) consistently demonstrate a positive relationship between entrepreneurship and economic performance. Recent evidence further suggests that entrepreneurship contributes to growth by promoting innovation, accelerating technology adoption, and supporting job creation across sectors, particularly in economies undergoing structural transformation.
However, the growth-enhancing effects of entrepreneurship are not uniform across countries and depend critically on contextual factors. Opportunity-driven entrepreneurship-motivated by innovation and market opportunities-tends to generate stronger productivity gains than necessity-driven entrepreneurship. Furthermore, the effectiveness of entrepreneurial activity is conditioned by the broader economic environment, including institutional quality, access to finance, regulatory efficiency, and the level of human capital. In the absence of supportive institutional frameworks, entrepreneurial efforts may remain concentrated in low-productivity sectors, thereby limiting their contribution to long-term growth. Institutional quality, therefore, represents a fundamental determinant of economic performance. As emphasized by North (1990), institutions shape economic incentives by reducing transaction costs and ensuring the enforcement of property rights. Acemoglu et al. (2004) further demonstrate that inclusive institutions are closely associated with higher levels of economic development. Despite the harmonizing influence of EU governance structures, institutional heterogeneity remains pronounced. Western and Nordic countries generally exhibit higher governance quality and regulatory effectiveness, while several Central and Eastern European economies continue to face challenges related to corruption, bureaucratic inefficiencies, and weaker judicial systems. These institutional disparities significantly influence investment decisions, entrepreneurial activity, and policy effectiveness across the region.
Macroeconomic stability constitutes another essential pillar of economic performance. A stable macroeconomic environment—characterized by low and predictable inflation, sustainable fiscal policies, and openness to trade and capital flows—creates favorable conditions for long-term investment. Empirical evidence (Fischer, 1993; Barro, 1995) indicates that high and volatile inflation negatively affects economic performance by increasing uncertainty and distorting resource allocation, whereas price stability enhances economic efficiency. Trade openness, rooted in the principle of comparative advantage and extended by Krugman (1980), enables economies to benefit from specialization, larger markets, and technological diffusion. Similarly, foreign direct investment (FDI) facilitates the transfer of technology and managerial expertise, although its effectiveness depends on the absorptive capacity of the host economy, particularly in terms of institutional quality and human capital (Sobirov et al., 2025). Finally, government expenditure and financial development play complex and interrelated roles in shaping economic performance. Productive public investment in infrastructure, education, and research and development can enhance long-term growth prospects, whereas inefficient or excessive spending may hinder private sector activity. Financial development improves capital allocation and access to credit, thereby supporting entrepreneurship and innovation, although excessive credit expansion may generate financial vulnerabilities.
Against this backdrop, the study is guided by a set of research questions aimed at identifying the structural determinants of economic performance within the European Union. Specifically, the analysis addresses the following questions: (i) To what extent do entrepreneurship, institutional quality, and macroeconomic stability influence economic performance, as reflected in differences in GDP per capita across EU member states? (ii) Do these factors contribute to conditional convergence in economic performance trajectories over time? (iii) How do these relationships vary across the conditional distribution of GDP per capita? By addressing these questions, the study seeks to uncover the underlying drivers of cross-country differences in economic performance while accounting for long-run income heterogeneity, structural disparities, and institutional differences among EU member states. In doing so, the study provides empirical evidence on how key economic and institutional factors shape variations in GDP per capita and offers policy-relevant insights for promoting balanced and sustainable improvements in economic performance across the European Union.
This study contributes to the existing literature in several important ways. First, it employs an updated dataset covering the period 2006–2024, encompassing major economic shocks such as the Global Financial Crisis, the European sovereign debt crisis, the COVID-19 pandemic, and the post-pandemic recovery. This allows the analysis to capture the dynamics of growth determinants under conditions of heightened macroeconomic volatility. Second, the study constructs a composite index of institutional quality using Principal Component Analysis (PCA) based on the six dimensions of the Worldwide Governance Indicators—voice and accountability, political stability, government effectiveness, regulatory quality, rule of law, and control of corruption. This approach provides a comprehensive and parsimonious measure of governance while reducing multicollinearity among individual indicators. Third, the empirical analysis applies advanced second-generation panel data techniques that account for cross-sectional dependence and slope heterogeneity across EU member states. Specifically, the study employs the Cross-Sectionally Augmented Autoregressive Distributed Lag (CS-ARDL) model (Chudik & Pesaran, 2015), the Augmented Mean Group (AMG) estimator (Eberhardt & Bond, 2009), and the Common Correlated Effects Mean Group (CCEMG) estimator (Pesaran, 2006), ensuring robust and reliable estimation. Fourth, the study utilizes the Method of Moments Quantile Regression (MMQR) approach (Machado & Santos Silva, 2019) to examine whether the effects of growth determinants vary across different levels of GDP per capita. This enables the identification of heterogeneous impacts across income distribution, providing valuable insights for the EU’s objective of economic convergence. Fifth, the analysis explicitly accounts for heterogeneity among EU economies, distinguishing between more advanced and catching-up countries. By doing so, it reveals potential differences in how entrepreneurship, institutional quality, and macroeconomic stability influence growth across varying stages of development. Sixth, the study integrates entrepreneurship, institutional quality, and macroeconomic stability within a unified empirical framework, addressing a gap in the literature where these factors are often examined in isolation. This comprehensive approach allows for a deeper understanding of their joint influence on economic performance. Finally, the study contributes to policy discussions by providing evidence-based recommendations tailored to the diverse economic and institutional contexts of EU member states. In particular, it highlights how strengthening governance, fostering entrepreneurial activity, and maintaining macroeconomic stability can be jointly leveraged to promote sustainable and inclusive growth across the European Union.
The remainder of this paper is organized as follows. Section 2 provides a comprehensive review of the theoretical and empirical literature on economic growth determinants, entrepreneurship, institutional quality, and macroeconomic stability. Section 3 describes the dataset, variable definitions, and the econometric framework and estimation strategies employed in the empirical analysis. Section 4 presents the empirical results and Section 5 discusses the empirical results, highlighting both long-run relationships and distributional heterogeneity across EU economies. Finally, Section 6 concludes with policy implications and identifies potential avenues for future research aimed at deepening our understanding of the complex interactions between institutions, entrepreneurship, macroeconomic stability, and economic growth.

2. Literature Review

Economic performance remains one of the central themes in development economics, with extensive literature emphasizing the roles of entrepreneurship, institutional quality, and macroeconomic conditions in shaping growth trajectories. While early growth theories primarily focused on capital accumulation and labor productivity, more recent empirical and theoretical contributions highlight the importance of innovation, institutional frameworks, and policy environments in determining long-run economic performance. The contemporary literature therefore views economic growth as a multidimensional process influenced by entrepreneurial dynamics, governance quality, and macroeconomic policy effectiveness.

2.1. Entrepreneurship and Economic Performance

The relationship between entrepreneurship and economic performance has been widely examined in the empirical literature, with a growing consensus that entrepreneurial activity can serve as a catalyst for productivity growth, structural transformation, and inclusive development. However, contemporary research increasingly emphasizes that the economic impact of entrepreneurship depends not only on its scale but also on its type, quality, and the institutional and economic contexts in which it occurs. A large body of empirical evidence supports the positive contribution of entrepreneurship to economic performance. For instance, Tahir and Burki (2023) analyzed BRICS economies over the period 2002–2021 and found that entrepreneurship exerts a positive and statistically significant effect on economic growth alongside trade openness, physical capital, and human capital. Their results also indicate a unidirectional causal relationship running from entrepreneurship to economic growth, reinforcing the argument that entrepreneurial activity functions as an important driver of macroeconomic expansion. Similarly, cross-country evidence further highlights the role of entrepreneurial dynamics in shaping economic performance. Ziane et al. (2025), examining six major economies—Germany, the United Kingdom, Brazil, India, Japan, and Italy—between 2011 and 2022, show that the impact of entrepreneurship and innovation on per capita income depends on the econometric framework employed. In static models, increases in the number of new limited-liability firms and higher levels of high-technology exports contribute positively to income growth. However, when dynamic specifications are applied, persistent increases in firm numbers may exert a negative effect on income if they are not accompanied by improvements in firm quality, innovation, and productivity. These findings highlight the importance of distinguishing between quantitative expansion in entrepreneurship and qualitative improvements in entrepreneurial activity. Additional empirical evidence from Europe further illustrates the heterogeneous nature of the entrepreneurship–growth relationship. Stoica et al. (2020), analyzing 22 European countries between 2002 and 2018, find that early-stage and opportunity-driven entrepreneurship are key drivers of economic growth. Their results indicate that opportunity-driven entrepreneurship plays a particularly important role in transition economies, whereas necessity-driven entrepreneurship exerts greater influence in innovation-driven economies. However, the latter often reflects self-employment motivated by limited employment opportunities rather than innovation-driven business creation, which may reduce its overall contribution to productivity growth. A broader perspective is provided by systematic reviews and meta-analyses that synthesize the rapidly expanding literature on entrepreneurship and economic development. Neumann (2020), reviewing 102 empirical studies on entrepreneurship and welfare, concludes that entrepreneurship constitutes an important determinant of macroeconomic development, although its effects vary significantly depending on contextual factors such as firm survival, internationalization, and the educational and professional qualifications of entrepreneurs. Likewise, Urbano et al. (2019), reviewing 25 years of research on institutions, entrepreneurship, and growth, argue that institutional quality influences economic growth primarily through its effect on entrepreneurial activity. Their work highlights the importance of governance quality, regulatory efficiency, and property-rights protection in shaping the conditions under which entrepreneurship can contribute to economic expansion. Complementing this perspective, Bjørnskov and Foss (2016) note that much of the empirical literature tends to measure entrepreneurship using proxies such as start-ups or self-employment rates, which may fail to capture the complexity of entrepreneurial processes. They further emphasize methodological challenges, including issues related to causality, omitted variables, and insufficient theoretical integration across different levels of analysis. In recent years, increasing attention has also been devoted to the concept of sustainable entrepreneurship, which integrates economic performance with environmental and social objectives. Terán-Yépez et al. (2020) provide a bibliometric review documenting a significant increase in studies examining how sustainable entrepreneurial activities contribute to both economic growth and sustainable development. Similarly, Shabbir (2023) highlights the growing importance of sustainable entrepreneurship in achieving Sustainable Development Goal 8, which promotes decent work and economic growth. Empirical evidence further suggests that sustainable entrepreneurship contributes to economic growth, job creation, and innovation, particularly in environmentally oriented sectors such as renewable energy and waste management (Ebabu et al., 2025). Moreover, financial inclusion mechanisms such as microfinance can indirectly promote inclusive economic growth by enabling entrepreneurial activity among underserved populations, thereby contributing to poverty reduction, gender empowerment, and improvements in household welfare (Shamsi et al., 2025). Beyond sustainability, emerging research also focuses on the role of entrepreneurial ecosystems, digital transformation, and open innovation in shaping economic outcomes. A large-scale bibliometric analysis conducted by Ngo (2025) identifies entrepreneurial ecosystems, digitalization, and collaborative innovation as central themes explaining how entrepreneurship contributes to sustainable and inclusive growth. Similarly, Sun (2024) emphasizes the macroeconomic importance of entrepreneurs in generating employment opportunities, increasing tax revenues, and stimulating economic growth, while calling for future research to differentiate among types of entrepreneurship and broaden welfare indicators beyond traditional income measures. Technological change has further transformed the entrepreneurial landscape. Daraojimba et al. (2023) argue that advances in digital technologies and innovation have expanded entrepreneurial opportunities and contributed to financial and economic growth, although they also introduce new risks such as technological obsolescence and intensified market competition. More recent empirical studies further refine the understanding of how different forms of entrepreneurship influence economic growth. Entrepreneurship is consistently framed as a key engine of productivity, structural change, and inclusive development, yet the literature increasingly stresses that the effects of entrepreneurship depend critically on the type of entrepreneurial activity, its geographic context, and the conditions under which it occurs. While entrepreneurial activity can stimulate economic growth through innovation, competition, and knowledge spillovers, aggregate measures of entrepreneurship may produce neutral or even negative outcomes when dominated by low-productivity or necessity-driven activities (Gomes et al., 2022; Ziane et al., 2025; Ivanović-Đukić et al., 2022). Recent efforts to measure entrepreneurship more accurately have therefore moved beyond simple start-up counts toward multidimensional indices capturing entrepreneurial quality. Gu and Wang (2022), for example, develop a time-varying index of sustainable entrepreneurship that incorporates innovative, opportunity-oriented, and socially responsible decision-making. Their analysis of Chinese regional economies shows that sustainable entrepreneurship exerts a statistically significant positive impact on regional economic growth, with technological research and development acting as an important mediating channel. Moreover, financial intermediation strengthens this relationship, demonstrating the importance of complementary financial and innovation systems in enhancing the growth effects of entrepreneurial activity. Evidence from developing and emerging economies further highlights the diverse mechanisms through which entrepreneurship contributes to economic performance. Using Global Entrepreneurship Monitor (GEM) data for South American countries, Munyo and Veiga (2022) find that intrapreneurial activity—entrepreneurship within existing organizations—has a positive and significant relationship with GDP growth even when controlling for major external shocks. Similarly, research on OECD economies shows that entrepreneurial framework conditions, including regulatory regimes, tax systems, research and development transfer mechanisms, and infrastructure quality, exert heterogeneous effects on economic growth depending on the level of economic development (Gomes et al., 2022). In transition economies, the transfer of research and development outputs appears to stimulate economic growth, whereas in innovation-driven economies, infrastructure quality and supportive regulatory environments play a more prominent role in facilitating growth-enhancing entrepreneurial activity. Empirical studies from emerging markets further reinforce the importance of entrepreneurial quality. Panel data evidence from 20 emerging economies between 2011 and 2018 indicates that high-growth-expectation entrepreneurship has the strongest positive impact on economic growth, whereas necessity-driven and informal entrepreneurial activities are associated with negative growth outcomes. Moreover, total entrepreneurial activity shows only a weak relationship with economic performance, again highlighting the importance of distinguishing between productive and low-productivity forms of entrepreneurship (Ivanović-Đukić et al., 2022). Long-run historical evidence from Spain similarly demonstrates that entrepreneurship, measured by the number of new firms per million inhabitants, significantly increases GDP per capita and labor productivity, although the contribution of entrepreneurship varies across periods depending on firm size structures and legal organizational forms (Hernández-Barahona et al., 2025). Small and medium-sized enterprises (SMEs) play a particularly important role in transmitting the effects of entrepreneurship to the broader economy. Numerous studies identify SMEs as critical drivers of employment creation, innovation diffusion, and regional economic development. Empirical research and systematic reviews demonstrate that SME growth is strongly associated with innovation capability, strategic partnerships, marketing competencies, and human capital development (Fajarika et al., 2024; Garcia-Martinez et al., 2023). In developing countries, SMEs also play an essential role in poverty reduction, job creation, and local economic stabilization. However, their growth potential is often constrained by limited access to finance, inadequate infrastructure, and persistent skills shortages (Enaifoghe, 2024; Enaifoghe & Ramsuraj, 2023; Akhmetgareeva et al., 2025; John et al., 2025;). When effectively integrated into regional innovation strategies, innovative SMEs can significantly enhance competitiveness, promote technological renewal, and support long-term regional sustainability (Lavrova, 2025). Overall, the literature increasingly converges on the conclusion that innovative and opportunity-driven entrepreneurship represents the form of entrepreneurial activity most strongly associated with economic growth. Cross-country analyses using GEM microdata show that innovative entrepreneurship—measured through product innovation, adoption of new technologies, and export intensity—serves as a robust determinant of economic growth (Ordeñana et al., 2024). In contrast, entrepreneurship defined solely by employment growth expectations does not consistently translate into broader economic expansion. Similarly, studies distinguishing between opportunity-driven and necessity-driven entrepreneurship consistently find that opportunity entrepreneurship has positive effects on economic growth, particularly in countries with stronger institutions and higher levels of industrial development, whereas necessity entrepreneurship often exhibits neutral or negative effects on macroeconomic performance (Negi, 2022; Ziane et al., 2025; Ivanović-Đukić et al., 2022). At the regional and community levels, entrepreneurship and innovation are also associated with employment generation, income growth, and poverty alleviation, particularly when embedded within supportive entrepreneurial ecosystems that provide access to finance, knowledge networks, infrastructure, and policy support (Rahmawati, 2025). In this context, open innovation collaborations between SMEs and start-ups have emerged as important microfoundations for regional economic upgrading and technological development. These partnerships facilitate knowledge exchange, accelerate innovation diffusion, and enhance regional competitiveness, although their effectiveness depends on the alignment of strategic objectives, resource availability, and institutional incentives (Re et al., 2025).

2.2. Institutional Quality and Economic Performance

A substantial body of empirical literature highlights the critical role of institutional quality in shaping economic performance outcomes across countries and regions. Institutional quality—commonly proxied by indicators such as rule of law, corruption control, regulatory quality, government effectiveness, and political stability—has been widely recognized as a fundamental determinant of economic performance.
Several studies provide strong empirical support for the positive relationship between institutional quality and economic growth. For instance, Singh and Pradhan (2020) examined South Asian economies and found that control of corruption, accountability, and rule of law exert positive and statistically significant long-run effects on economic growth using dynamic heterogeneous panel ARDL estimators. Similarly, Tashtamirov (2023) analyzed six major economies—the United States, United Kingdom, Germany, Turkey, Russia, and China—over the period 1996–2019 and reported that institutional quality indicators such as rule of law, corruption control, and regulatory effectiveness positively influence economic development, although the magnitude of each institutional dimension varies across countries (Tashtamirov, 2023). Country-specific studies further reinforce these findings. Akwe et al. (2025) investigated Nigeria using OLS techniques for the period 1986–2023 and found that institutional quality has a positive and statistically significant impact on economic growth, although the composite governance index appears positive but statistically insignificant. The study also reports mixed effects of other macroeconomic variables, with trade openness negatively affecting growth while capital formation and population demonstrate varying impacts (Akwe et al., 2025). Likewise, Pinjaman et al. (2025) examined Malaysia from 2000–2021 and found that political stability and government effectiveness significantly improve long-run economic growth, while regulatory quality and rule of law have positive but insignificant effects. Interestingly, control of corruption shows a negative long-run relationship with growth, possibly reflecting short-term adjustment costs associated with anti-corruption reforms (Pinjaman et al., 2025). Cross-regional studies also demonstrate that institutional quality strengthens the effectiveness of other economic drivers. Xu and Wubishet (2024) analyzed 18 East African countries between 1995 and 2021 and found that financial development contributes to economic growth, but its positive impact is significantly larger in countries with stronger institutions, including government stability, rule of law, and lower military involvement in politics. This suggests that institutional quality amplifies finance-led growth (Xu & Wubishet, 2024). Similarly, Ghosh and Saha (2025) examined 135 developing economies from 1996–2020 and documented that foreign direct investment (FDI) positively affects growth, with government effectiveness, regulatory quality, and rule of law significantly enhancing the growth benefits of FDI, thereby highlighting institutional quality as a key prerequisite for successful FDI-led development. Regional evidence further reveals heterogeneous institutional impacts. Degbedji et al. (2023) assessed countries within the West African Economic and Monetary Union (WAEMU) and found that institutional quality supports green economic growth in Côte d’Ivoire, Mali, Niger, Senegal, and Togo. In contrast, weaker institutional frameworks in Benin and Burkina Faso are associated with deteriorating green growth performance, underscoring the uneven institutional landscape within the region (Degbedji et al., 2023). Likewise, Jomi and Baye (2025) examined 38 Sub-Saharan African countries from 2003–2020 and reported that stronger institutional quality significantly improves macroeconomic productivity. Their findings further suggest that countries with English legal heritage display stronger institutional–productivity relationships than those with French legal traditions. Institutional quality also shapes the effectiveness of macroeconomic policies. Fadare and Oladipo (2025) demonstrated that institutional quality positively moderates the relationship between public expenditure and economic growth in a small open economy, while high inflation and lending rates negatively affect growth. The authors recommend strengthening rule of law and anti-corruption measures to maximize the growth benefits of fiscal spending. In a similar vein, Pastpipatkul and Ko (2025) examined Thailand between 2003 and 2023 and found that voice and accountability as well as corruption control enhance the effectiveness of monetary policy and export-led growth while mitigating shocks arising from household debt and energy constraints. These findings suggest that strong institutions contribute to macroeconomic stability and policy effectiveness. Comparative cross-country analyses further highlight differences in how institutional mechanisms influence growth across development levels. Tanjung and Shimada (2025) analyzed 15 ASEAN and developed economies using system GMM and found that corruption control, government effectiveness, and regulatory quality are robust predictors of economic growth. However, in developed countries, government effectiveness emerges as the only governance indicator with a substantial positive effect, indicating that institutional priorities vary across income levels. While most studies confirm the positive role of institutions, Jomi and Baye (2025) note that debates remain regarding the direction of causality and the underlying mechanisms linking institutions and growth, as different econometric methodologies often produce heterogeneous results across contexts. Overall, the literature consistently demonstrates that institutional quality plays a crucial role in fostering economic growth by strengthening governance structures, improving policy effectiveness, enhancing investment outcomes, and supporting sustainable development.

2.3. Macroeconomic Drivers of Economic Performance

Beyond institutional factors, numerous macroeconomic variables significantly influence economic growth dynamics. A growing body of research emphasizes the roles of investment, trade, human capital, fiscal policy, technological innovation, and macroeconomic stability as key drivers of long-term economic performance. Empirical evidence from developing regions highlights the importance of investment and trade as primary engines of growth. Gafsi and Bakari (2025) examined 54 African countries from 1999–2023 and identified domestic investment, final consumption expenditure, and exports as the most significant determinants of economic growth. However, their findings suggest that financial development, urbanization, and digitalization exhibit weaker or statistically insignificant effects. Notably, CO2 emissions are found to be positively associated with growth, raising concerns regarding the environmental sustainability of current development patterns. Similarly, Silaban (2025) synthesized global evidence and concluded that both domestic and foreign investment, improvements in labor force quality, and supportive government policies are essential drivers of economic growth. The study further emphasizes the growing importance of technological advancement and innovation in enhancing productivity and strengthening international competitiveness. In addition, external economic factors—such as trade integration and international capital flows—play significant roles in shaping growth trajectories.
Macroeconomic growth is also strongly linked to the traditional production factors emphasized in economic theory. Using Toda-Yamamoto causality tests for Turkey over the period 1990–2021, Turna (2025) found bidirectional causal relationships between economic growth and capital accumulation, employment, and technological progress. These findings align with both the Solow growth model and endogenous growth theories, which emphasize the role of capital formation and technological innovation in sustaining long-run growth. Cross-country empirical analyses further reveal heterogeneous growth dynamics across income groups. Khan et al. (2022) employed quantile regression techniques on global panel data and found that capital formation, labor force participation, renewable energy adoption, and technological innovation positively influence economic growth across countries. However, the strength of these relationships varies depending on development levels and growth quantiles, indicating the presence of nonlinear macroeconomic growth patterns. Fiscal and monetary policy also play critical roles in shaping growth outcomes. Huy et al. (2025) analyzed Vietnam’s economy from 1996–2023 using Bayesian Vector Autoregression (BVAR) and wavelet coherence techniques and found that fiscal policy—particularly public consumption—has a strong positive effect on economic growth, especially during major economic events such as WTO accession and global crises including the COVID-19 pandemic and international trade tensions. In contrast, excessive monetary expansion sometimes reduces growth due to inflationary pressures, suggesting that counter-cyclical fiscal policy may be more effective in certain contexts (Huy et al., 2025). Evidence from systematic reviews also highlights the importance of institutional capacity in determining the effectiveness of macroeconomic policies. Hakimah (2025) found that in low-income countries, economic growth is largely driven by public investment in infrastructure and human capital, trade openness, and sound monetary management. However, these macroeconomic instruments depend heavily on institutional quality to prevent policy instability, inflation, and vulnerability to external shocks. Country-specific studies further emphasize the importance of coordinated macroeconomic policy frameworks. Elhakim and Ali (2023) reviewed empirical evidence from Indonesia and concluded that fiscal policy, monetary policy, and international trade significantly influence economic growth, highlighting the importance of policy coordination in maintaining macroeconomic stability. Meanwhile, Gafsi and Bakari (2025) note that factors such as heavy reliance on imports, weak labor force contributions, and limited financial sector depth can constrain the growth benefits derived from investment and trade, thereby pointing to the need for complementary structural reforms. The composition of fiscal spending also plays a critical role in shaping long-term growth outcomes. Martínez-Baltodano and Fonseca-Mairena (2025) developed a theoretical model demonstrating that the allocation of government spending between infrastructure development and human capital investment significantly affects long-run economic growth. The authors argue that political pressures can distort fiscal allocations away from growth-maximizing levels, potentially leading to persistent growth traps. Finally, recent research has highlighted the distributional implications of macroeconomic policies. Ramadhani et al. (2025) examined Indonesian provincial data and found that domestic investment and human capital improvements contribute to reductions in poverty and income inequality. However, tighter monetary policy—through higher interest rates—can increase inequality and unemployment while weakening the inclusive growth effects of investment. Fiscal policy, on the other hand, strengthens the poverty-reducing effects of human capital investments but may also increase unemployment, demonstrating the complex trade-offs associated with macroeconomic policy design.
Taken together, the literature suggests that sustainable economic growth depends on a combination of sound macroeconomic policies, strategic public investment, technological progress, and strong institutional frameworks that collectively enhance productivity, stability, and inclusive development.

2.4. Hypothesis Development

Based on theoretical insights and empirical evidence, the study formulates the following hypotheses regarding the determinants of GDP per capita in the 26 EU member states over 2006–2024:
H1. 
Entrepreneurship positively influences GDP per capita in EU member states, with effects varying across countries depending on long-run income levels.
Entrepreneurial activity, measured by new business registrations, is expected to enhance economic performance across EU countries by generating employment, expanding market demand, and fostering innovation-led structural transformation. Firm entry introduces competitive pressures, facilitates knowledge spillovers, and encourages experimentation within the economy. Empirical evidence from Europe shows that entrepreneurship consistently acts as a catalyst for productivity improvements and structural change (Stoica et al., 2020; Ziane et al., 2025). While the magnitude of these effects may vary depending on the quality and innovation intensity of entrepreneurial ventures, as well as differences in long-run income levels and structural conditions across countries, a positive association with GDP per capita is expected across EU member states.
H2. 
Institutional quality is positively associated with GDP per capita in EU member states, with effects differing across countries depending on long-run income levels.
Institutional quality—including rule of law, regulatory effectiveness, and corruption control—is expected to enhance economic performance by providing a predictable and efficient environment for investment, entrepreneurship, and policy implementation. Strong institutions improve the effectiveness of economic policies, enhance investment outcomes, and reduce transaction costs, thereby supporting higher levels of GDP per capita (Singh & Pradhan, 2020; Tashtamirov, 2023). However, the strength of this relationship may vary across EU member states depending on long-run income levels, as higher-income economies typically possess more developed institutional frameworks and greater capacity to enforce regulations, thereby amplifying the positive effects of institutional quality on GDP per capita.
H3. 
Trade openness positively affects GDP per capita in EU member states, with effects varying across countries depending on long-run income levels.
Greater integration into international markets provides EU countries access to larger markets, encourages technology transfer, and increases competitive pressure, thereby enhancing productivity and economic performance. Empirical studies show that trade openness generally supports economic performance in European economies by fostering export activities, knowledge spillovers, and efficient resource allocation (Gafsi & Bakari, 2025; Mtar & Belazreg, 2021). However, the magnitude of these effects may differ across EU member states depending on long-run income levels, as lower- and middle-income countries may benefit more from trade-driven convergence and technology diffusion, while higher-income economies may experience gains through specialization and efficiency improvements.
H4. 
Excessive financial development may negatively affect GDP per capita in EU member states, with effects varying across countries depending on long-run income levels.
While moderate financial deepening supports economic performance by facilitating productive investment, excessive credit expansion can promote speculative activities, resource misallocation, and financial fragility. This “too much finance” effect implies that the relationship between financial development and GDP per capita may be nonlinear, as observed in advanced European financial systems (Law & Singh, 2014; Atanasova et al., 2019). However, the extent of this adverse effect may differ across EU member states depending on long-run income levels, as higher-income economies with more developed financial sectors may be more susceptible to over-financialization, whereas lower-income countries may still benefit from financial deepening up to a certain threshold.
H5. 
The effect of government expenditure on GDP per capita depends on fiscal efficiency and composition in EU member states, with impacts varying across countries according to long-run income levels.
Government spending can promote economic performance when efficiently allocated to productive investments, such as infrastructure and human capital development. Conversely, inefficient or poorly targeted fiscal policies may weaken economic performance. Evidence suggests that the design and composition of fiscal expenditures, rather than their size alone, significantly influence their impact on GDP per capita (Martínez-Baltodano & Fonseca-Mairena, 2025; Fadare & Oladipo, 2025). However, the effectiveness of government expenditure is likely to differ across EU member states depending on long-run income levels, as higher-income economies generally exhibit stronger fiscal capacity and institutional efficiency, while lower-income countries may face constraints in public resource allocation and implementation.
In summary, the hypotheses developed in this study are grounded in both theoretical foundations and empirical evidence, emphasizing the role of entrepreneurship, institutional quality, trade openness, financial development, and government expenditure as key determinants of GDP per capita in EU member states. While these factors are generally expected to influence economic performance, their effects are not assumed to be uniform across countries. Instead, the framework explicitly acknowledges the presence of long-run income heterogeneity, suggesting that the magnitude and direction of these relationships may vary depending on countries’ levels of economic development, institutional capacity, and structural characteristics. By incorporating this heterogeneity, the study advances a more nuanced understanding of how structural and macroeconomic factors shape differences in GDP per capita across the European Union and provides a foundation for the subsequent empirical analysis.

3. Data and Methodology

3.1. Data

The dataset employed in this study consists of a balanced panel encompassing 26 European Union (EU) member states, observed annually over the period 2006–2024. The primary sources of data are the World Bank’s World Development Indicators (World Bank, 2026) and the Worldwide Governance Indicators (WGI) project, ensuring comprehensive coverage of both economic and institutional dimensions. The sample includes Austria, Belgium, Bulgaria, Croatia, Cyprus, Czechia, Denmark, Estonia, Finland, France, Germany, Greece, Ireland, Italy, Latvia, Lithuania, Luxembourg, Malta, the Netherlands, Poland, Portugal, Romania, the Slovak Republic, Slovenia, Spain, and Sweden, with Hungary excluded due to gaps in available data. This period captures a sequence of pivotal macroeconomic events, ranging from the pre-crisis expansion of 2006–2007 to the Global Financial Crisis (2008–2009), the European sovereign debt crisis (2010–2012), the subsequent recovery (2013–2019), the COVID-19 pandemic (2020–2021), and the post-pandemic adjustment phase (2022–2024). By encompassing these episodes, the dataset provides a rich and nuanced lens through which to examine the interplay between entrepreneurship, institutional quality, and macroeconomic performance across diverse EU economies.

Variable Description

Table 1 presents a summary of the variables used in this study, including their definitions, measurement approaches, and expected effects on GDP per capita. The dependent variable is the natural logarithm of GDP per capita in constant 2015 US dollars, which captures long-run income levels and provides a standard measure of living standards and economic development across countries. This specification aligns the analysis with questions of persistent income differences and convergence dynamics, rather than short-run economic growth fluctuations. The selection of independent variables is grounded in established growth theory and supported by prior empirical research. In this study, new business registrations are used as a proxy for formal entrepreneurial activity, reflecting the rate at which new firms enter the market. This indicator captures the administrative act of establishing a legally registered business, thereby providing a consistent and widely available measure across EU member states. However, this proxy does not reflect important qualitative dimensions of entrepreneurship, such as firms’ innovation potential, growth ambition, technological intensity, or sectoral composition. Moreover, registration data may be influenced by administrative or regulatory reforms—such as the introduction of digital registration systems or reductions in registration fees—that can generate changes in the number of new firm entries independently of underlying entrepreneurial dynamics. These conceptual limitations are now explicitly acknowledged to ensure clearer interpretation of the empirical results.
Price stability is measured by the GDP deflator-based inflation rate, reflecting macroeconomic stability and its influence on investment decisions. Trade openness, defined as total trade as a share of GDP, captures the degree of integration into the global economy, while foreign direct investment (FDI) net inflows as a percentage of GDP represent the contribution of foreign capital and technology transfer. The size of the public sector is proxied by general government final consumption expenditure as a share of GDP, and domestic credit to the private sector as a share of GDP is used to gauge financial development and the efficiency of capital allocation. With the exception of the institutional quality index, all variables are expressed in natural logarithms, enabling straightforward interpretation of estimated coefficients as elasticities and facilitating comparisons across variables with different scales.
Furthermore, to ensure full transparency and reproducibility of our empirical analysis, Table A1 provides detailed information on all variables used in the study. For each variable, we report the original data source, measurement units, and the transformations applied, including log transformations where relevant. The table also specifies how zero or negative values were handled, the treatment of missing observations to construct a balanced panel, and the adjustments made to address extreme values or outliers. This documentation allows readers to reconstruct every variable exactly from the underlying series, ensuring that all results are fully replicable.

3.2. Construction and Validation of the Institutional Quality Index

To construct a comprehensive measure of institutional quality, this study employs Principal Component Analysis (PCA) using panel data for 26 EU countries over the period 2006–2024. The index is based on the six dimensions of the Worldwide Governance Indicators (WGI): voice and accountability, political stability, government effectiveness, regulatory quality, rule of law, and control of corruption. All variables were standardized prior to estimation to ensure comparability and eliminate scale effects.
Given the panel structure of the data, PCA is applied to the pooled dataset, following standard practice in the literature. This approach allows the extraction of common variation in institutional quality across countries and over time. Before performing PCA, the suitability of the data was assessed using the Kaiser–Meyer–Olkin (KMO) test and Bartlett’s test of sphericity.
The results reported in Table 2 indicate that the dataset satisfies the necessary conditions for PCA. The KMO statistic exceeds the recommended threshold of 0.812, suggesting adequate sampling adequacy. In addition, Bartlett’s test rejects the null hypothesis of an identity correlation matrix at the 1% significance level, confirming that the variables are sufficiently correlated to justify dimensionality reduction.
Following the validation tests, PCA was performed. The results show that the first principal component (PC1) captures the largest proportion of total variance and is therefore used as the composite institutional quality index. As presented in Table 3, PC1 explains a substantial share of the total variance, indicating that it effectively summarizes the common variation across governance indicators.
To further interpret the index, Table 4 reports the factor loadings of each governance indicator on the first principal component. All six indicators exhibit strong and positive loadings, suggesting that PC1 captures a common institutional quality dimension encompassing governance effectiveness, regulatory strength, and accountability.
Overall, the results confirm that all six WGIs are retained in the construction of the institutional quality index. The high explanatory power of the first principal component, combined with strong and consistent factor loadings, supports the robustness and validity of the composite measure. The resulting index provides a parsimonious representation of institutional quality while mitigating potential multicollinearity among governance indicators.

3.3. Econometric Methodology

The empirical strategy of this study follows a systematic, multi-stage approach designed to address the challenges inherent in macro-panel datasets, including cross-sectional dependence, slope heterogeneity, and non-stationarity. The methodology proceeds sequentially through preliminary diagnostics, unit root testing, cointegration analysis, estimation of short- and long-run relationships, and robustness checks. This approach ensures consistent and reliable inference regarding the impact of entrepreneurship, institutional quality, and macroeconomic determinants on GDP per capita across EU member states.

3.3.1. Cross-Sectional Dependence and Slope Homogeneity

Cross-sectional dependence (CD) is common in macro-panels due to shared shocks, spatial spillovers, and unobserved common factors. Ignoring CD may lead to biased and inconsistent estimates. To detect CD, we use the Pesaran (2004) CD test, based on pairwise correlations of residuals:
C D = 2 N N 1   i = 1 N 1 j = i + 1 N ρ ^ i j
where ρ ^ i j denotes the sample correlation of residuals between units iii and j , N is the number of cross-sectional units, and T the number of time periods. Under the null hypothesis of cross-sectional independence, C D ~ ( 0 , 1 ) .
Slope homogeneity is tested using the Pesaran and Yamagata (2008) Delta test, which examines whether regression coefficients are identical across cross-sectional units. Under the null hypothesis of homogeneity, a pooled estimator is efficient; rejection favors heterogeneous estimators such as the Mean Group (MG), Augmented Mean Group (AMG), or Common Correlated Effects Mean Group (CCEMG) estimator. The adjusted Delta statistic accounts for small-sample bias.
In this paper, slope homogeneity is tested using the Pesaran and Yamagata (2008) Delta test:
= 1 N i = 1 N ( β ^ i β ¯ ) 2
where β ^ i is the slope coefficient for unit iii, and β ¯ is the pooled mean coefficient. Rejection of the null of homogeneity suggests heterogeneous estimators such as MG, AMG, or CCEMG are appropriate.

3.3.2. Second-Generation Unit Root Tests

Given the presence of cross-sectional dependence, we employ the Cross-Sectionally Augmented Im–Pesaran–Shin (CIPS) test proposed by Pesaran (2007). This test augments the standard ADF regression with cross-sectional averages of lagged levels and first differences of the variable, thereby filtering out the effects of unobserved common factors. The CIPS statistic is the simple average of individual Cross-Sectionally Augmented Dickey–Fuller (CADF) statistics. Critical values are tabulated in Pesaran (2007). The test is applied at both levels and first differences to determine the integration order of each variable. A mixture of I(0) and I(1) variables justifies the use of the ARDL bounds testing approach. To the CADF regression for unit i is:
y i , t = α i + β i y i , t 1 + γ i y ¯ i , t 1 + δ i y ¯ t + p = 1 P φ i , p y i , t p + ε i , t
where y ¯ t is the cross-sectional average of y i , t . The CIPS statistic is the average of the CADF t-statistics across N units:
C I P S = 1 N i = 1 N t β ^ i C A D F
Testing is conducted at levels and first differences to determine integration orders, justifying the use of the ARDL bounds approach.

3.3.3. Cointegration Testing

The Westerlund (2007) error-correction-based panel cointegration test is employed.
y i , t = α i + δ i y i , t 1 + x i , t 1 + p = 1 P φ i , p y i , t p + q = 0 Q θ i , q x i , t q + ε i , t
where δ i is the error correction term. Four test statistics are computed: group-mean Gt and Ga, and panel Pt and Pa. Bootstrap p-values are used if CD is detected.
This test has superior power relative to residual-based tests because it does not impose the common-factor restriction. Four test statistics are computed: Gt and Ga are group-mean statistics that allow for heterogeneous error correction across units, while Pt and Pa are panel statistics that pool information across the entire panel. When cross-sectional dependence is present, bootstrap p-values are employed to ensure valid inference, as the asymptotic distributions are distorted by CD.

3.3.4. CS-ARDL Estimation

The Cross-Sectionally Augmented ARDL (CS-ARDL) model, developed by Chudik and Pesaran (2015), extends the traditional ARDL framework by augmenting the regression with cross-sectional averages of the dependent and independent variables.
y i , t = α i + p = 1 P φ i , p y i , t p + q = 0 Q θ i , q y i , t q + γ i y ¯ t + δ i x ¯ t + ε i , t
where y ¯ t and x ¯ t are cross-sectional averages. Short-run and long-run coefficients are obtained through the error correction representation:
y i , t = α i + φ i y i , t 1 + x i , t 1 + p = 1 P ω i , p y i , t p + q = 0 Q θ i , q x i , t q + ε i , t
A negative and significant φ i confirms long-run cointegration. This augmentation controls for unobserved common factors and cross-sectional dependence. The CS-ARDL model simultaneously estimates short-run dynamics and long-run equilibrium relationships through an error correction mechanism. The error correction term (ECT) captures the speed of adjustment toward long-run equilibrium: a negative and statistically significant ECT confirms the existence of cointegration and indicates convergence.

3.3.5. Robustness: AMG and CCEMG

The Augmented Mean Group (AMG) estimator of Eberhardt and Bond (2009) proceeds in two stages: first, a pooled first-differenced regression with year dummies extracts a common dynamic process; second, individual country regressions augmented with this process yield heterogeneous coefficients that are averaged across units. The Common Correlated Effects Mean Group (CCEMG) estimator of Pesaran (2006) augments individual country regressions with cross-sectional averages of the dependent and independent variables. Both estimators are consistent under cross-sectional dependence, slope heterogeneity, and non-stationary common factors, and serve as robustness checks for the CS-ARDL long-run estimates.

3.3.6. MMQR: Distributional Heterogeneity

The Method of Moments Quantile Regression (MMQR) of Machado and Santos Silva (2019) extends standard quantile regression to panel data with fixed effects.
The Method of Moments Quantile Regression (MMQR) allows assessment of covariate effects across conditional quantiles τ of y:
Q y i , t τ X i , t = X i , t β τ + α i ( τ )
β τ represents quantile-specific coefficients and α i ( τ ) captures unit-specific effects. MMQR decomposes the conditional quantile function into a location component (estimated via OLS) and a scale component, enabling analysis of how determinants operate differently for lower-income versus higher-income EU economies.
Unlike the conditional mean estimators above, MMQR estimates the impact of covariates at different quantiles of the conditional distribution of the dependent variable (Q10, Q25, Q50, Q75, Q90). This allows us to assess whether the determinants of economic performance operate differently for lower-income versus higher-income EU economies—a critical question for EU convergence policy. The MMQR decomposes the conditional quantile function into a location component (estimated via OLS) and a scale component, with quantile-specific coefficients obtained as linear combinations.

4. Empirical Results

4.1. Descriptive Statistics

Table 5 reports the descriptive statistics for all variables. All variables were carefully transformed and cleaned to ensure comparability and robustness. Winsorization was applied using variable-specific thresholds derived from the pooled sample distribution, while missing values were handled using within-country linear interpolation (see Table A1, Appendix A). The resulting distributions exhibit reasonable statistical properties, with no evidence of excessive skewness or kurtosis that would compromise the reliability of the estimations.
GDP per capita exhibits a mean value of 10.171 with a standard deviation of 0.641, indicating notable income disparities across EU member states. The institutional quality index is standardized with a mean of zero and a standard deviation of 2.258, ranging from −4.625 to 3.895, reflecting substantial heterogeneity in governance structures. Entrepreneurial activity has an average value of 9.958 and a standard deviation of 1.044, suggesting moderate variation across countries. The distribution of inflation remains slightly skewed, likely reflecting the impact of macroeconomic shocks, which is typical in panel macroeconomic data. Despite the application of winsorization, FDI continues to exhibit considerable variability due to its inherently volatile nature across EU economies. Trade openness, government expenditure, and financial development display moderate levels of dispersion, consistent with the structural diversity of EU member states.

4.2. Correlation Analysis

Table 6 presents the pairwise correlation matrix for all variables. Institutional quality exhibits the strongest positive correlation with GDP per capita, supporting the institution growth hypothesis. Financial development and trade openness are also positively and significantly associated with GDP per capita. Entrepreneurial activity displays a weak and statistically insignificant bivariate correlation with GDP per capita, indicating that its growth effects may operate through mechanisms that are conditional on other factors. Inflation shows a negative correlation with GDP per capita, consistent with the well-documented link between price stability and economic growth.

4.3. Cross-Sectional Dependence Test

Table 7 reports the results of the Pesaran (2004) CD test. The null hypothesis of cross-sectional independence is decisively rejected for all eight variables at the 1% significance level. The CD statistics range from 20.368 to 251.526, confirming pervasive cross-sectional dependence in the panel. This result is expected given the high degree of economic, financial, and institutional integration within the EU: common monetary policy, coordinated fiscal rules, single market regulations, and shared macroeconomic shocks (for instance, the Global Financial Crisis, the COVID-19 pandemic) all generate strong cross-country correlations. The confirmation of cross-sectional dependence necessitates the use of second-generation panel methods throughout the subsequent analysis.

4.4. Slope Homogeneity Test

Table 8 reports the results of the Pesaran and Yamagata (2008) slope homogeneity test. Both the standard Delta statistic and the bias-adjusted variant strongly reject the null hypothesis of homogeneous slopes, indicating that the relationships between the dependent variable and the explanatory covariates differ significantly across EU member states. This heterogeneity reflects the economic, structural, and institutional diversity within the European Union. The finding has important methodological implications: pooled estimators that impose common slopes would yield inconsistent estimates, underscoring the necessity of using heterogeneous estimators. Accordingly, the CS-ARDL, AMG, and CCEMG estimators applied in this study explicitly account for slope heterogeneity, ensuring robust inference across countries.

4.5. Panel Unit Root Tests

Table 9 presents the results of the CIPS panel unit root tests conducted at both levels and first differences. At levels, inflation and foreign direct investment are stationary at the 1% significance level, indicating I(0) processes. The remaining variables—GDP per capita, the institutional quality index, new business registrations, trade openness, and government expenditure—fail to reject the null hypothesis of a unit root at levels but become stationary after first differencing, confirming their I(1) character. Domestic credit to the private sector exhibits borderline behavior, with the first-differenced CIPS statistic slightly above the 10% critical value; however, supplementary CADF individual statistics suggest stationarity at first differences for the majority of cross-sectional units. The coexistence of I(0) and I(1) variables in the dataset satisfies the key requirement for the ARDL bounds testing framework and, by extension, the CS-ARDL methodology, which remains consistent and valid provided no variable is integrated of order two or higher.

4.6. Westerlund Cointegration Test

Table 10 reports the results of the Westerlund (2007) error-correction-based panel cointegration tests. All four test statistics—Gt, Ga, Pt, and Pa—reject the null hypothesis of no cointegration at the 1% significance level, both using asymptotic and bootstrap p-values. The group-mean statistic Gt accounts for heterogeneous adjustment across countries, while the panel statistic Pt pools information across the panel to enhance test power. Bootstrap p-values based on 1000 replications are employed to correct for cross-sectional dependence, further confirming the robustness of the cointegration findings. These results provide strong evidence of a stable long-run equilibrium relationship among GDP per capita, institutional quality, entrepreneurial activity, and the macroeconomic control variables, thereby justifying the estimation of long-run coefficients in subsequent models.

4.7. CS-ARDL Estimation Results

Table 11 reports the Cross-Sectionally Augmented ARDL (CS-ARDL) estimation results for 26 European Union countries over the period 2006–2024, capturing both long-run equilibrium relationships and short-run dynamics, while controlling for cross-sectional dependence. In this study, economic performance is proxied by GDP per capita, which serves as the dependent variable and reflects differences in income levels across countries.
The error correction term (ECT) is estimated at −0.150 and is statistically significant at the 1 percent level, confirming the existence of a stable long-run equilibrium relationship among the variables in the model. The magnitude of this coefficient implies that approximately 15 percent of any deviation from the long-run equilibrium is corrected within one year, indicating a moderate speed of adjustment. This relatively gradual adjustment process reflects the structural and institutional features of European Union economies, where regulatory rigidities, labor market structures, and policy coordination mechanisms tend to slow convergence dynamics. Furthermore, prolonged macroeconomic disturbances associated with events such as the Global Financial Crisis and the COVID-19 pandemic likely contributed to the persistence of short-term disequilibria. Institutional quality exhibits a positive and statistically significant long-run coefficient of 0.648, indicating that improvements in governance effectiveness, regulatory quality, and rule of law significantly enhance economic performance across EU countries over time. This finding reinforces the central role of institutions in fostering long-term economic performance by reducing uncertainty, strengthening property rights, and improving the efficiency of resource allocation. However, the short-run coefficient is positive but statistically insignificant, suggesting that institutional reforms do not produce immediate effects on GDP per capita. This is consistent with the notion that institutional improvements operate through gradual transmission channels, requiring time to influence investment behavior, productivity, and economic outcomes. Entrepreneurial activity, proxied by business registrations, demonstrates a positive and statistically significant long-run coefficient of 1.238, alongside a positive and highly significant short-run coefficient. These results indicate that entrepreneurship plays a crucial role in promoting both short-term economic dynamism and long-term improvements in GDP per capita. In the short run, increased business formation stimulates employment, innovation, and aggregate demand, thereby contributing to GDP per capita. In the long run, the positive and significant coefficient suggests that entrepreneurial activity contributes to structural transformation, productivity improvements, and sustained increases in GDP per capita. This finding is consistent with the theoretical framework of Joseph Schumpeter, which emphasizes the role of entrepreneurial innovation and firm creation as key drivers of economic development and long-term economic performance. Inflation, measured by the consumer price index, displays a positive long-run coefficient of 0.413, which is statistically significant at the 10 percent level, suggesting that moderate inflation may be associated with higher levels of GDP per capita in the EU context. This relationship may reflect demand-driven periods in which controlled inflation accompanies increases in GDP per capita. However, the short-run coefficient is negative and statistically insignificant, indicating that short-term fluctuations in inflation do not exert a significant or consistent influence on GDP per capita. This suggests that while inflation may capture broader macroeconomic conditions in the long run, its immediate effects on GDP per capita remain limited. Trade openness is characterized by a positive and statistically significant coefficient in both the long run (0.108) and the short run (0.107), highlighting its consistent contribution to GDP per capita. These findings suggest that integration into international markets enhances economic performance through increased access to foreign markets, technology transfer, and improved competitive pressures. The significance of trade openness across both time horizons indicates that its benefits are both immediate and sustained, reinforcing its importance as a key determinant of GDP per capita in highly integrated economies such as those of the European Union. FDI exhibits a negative but statistically insignificant long-run coefficient, along with an insignificant short-run effect, indicating that its contribution to GDP per capita is not robust within this empirical framework. This outcome may reflect the changing composition of FDI in developed economies, where inflows are increasingly directed toward mergers and acquisitions rather than greenfield investments that directly expand productive capacity. Consequently, the effects of FDI on GDP per capita may be limited or dependent on sectoral allocation and the extent of technological spillovers. Government expenditure presents a positive and statistically significant long-run coefficient of 0.235, suggesting that public spending contributes to GDP per capita over time through investments in infrastructure, education, and public services. In contrast, the short-run coefficient is negative and highly significant, indicating that increases in government expenditure may exert contractionary effects in the short term. This finding is consistent with the crowding-out hypothesis, whereby higher public spending may temporarily displace private investment or reduce efficiency in resource allocation. The divergence between short-run and long-run effects highlights the importance of distinguishing between immediate fiscal impacts and their longer-term contributions to GDP per capita. Financial development, measured by domestic credit to the private sector, exhibits negative and statistically significant coefficients in both the long run (−0.372) and the short run (−0.176). This finding suggests that excessive financial deepening may hinder GDP per capita in the EU context. It supports the “too much finance” hypothesis proposed by Arcand et al. (2015), which posits that beyond a certain threshold, financial sector expansion can lead to inefficiencies, increased risk-taking, and misallocation of resources. In advanced economies, where financial systems are already highly developed, additional credit expansion may contribute more to speculative activities than to productive investment, thereby negatively affecting economic performance.

4.8. Robustness: AMG and CCEMG Estimates

Table 12 presents robustness checks based on the Augmented Mean Group (AMG) and Common Correlated Effects Mean Group (CCEMG) estimators, which are employed to validate the stability of the long-run relationships identified in the baseline CS-ARDL model. The results from both estimators exhibit a high degree of consistency in terms of coefficient signs and statistical significance, thereby reinforcing the stability of the baseline findings. Institutional quality shows a positive and statistically significant effect under both AMG and CCEMG, confirming the critical role of governance, regulatory quality, and institutional effectiveness in promoting GDP per capita. Similarly, entrepreneurial activity demonstrates a strong positive and highly significant impact across both estimators, indicating that firm creation and business dynamism are robust drivers of long-term economic performance. Inflation exhibits a positive coefficient under both estimators, although its statistical significance is relatively weak, suggesting that moderate inflation may be associated with macroeconomic conditions that support GDP per capita, albeit with limited robustness. Trade openness remains positive and statistically significant in both models, highlighting the importance of international integration, market access, and technology diffusion in enhancing economic performance across EU countries. In contrast, foreign direct investment displays a negative but statistically insignificant coefficient in both AMG and CCEMG estimations, indicating that it does not exert a robust or direct influence on GDP per capita within this empirical framework. Government expenditure, however, is positive and statistically significant under both estimators, suggesting that public spending contributes positively to GDP per capita, potentially through investments in infrastructure, human capital, and public services. Finally, financial development exhibits a negative and statistically significant effect across both models, supporting the argument that excessive credit expansion may lead to inefficiencies and hinder GDP per capita.

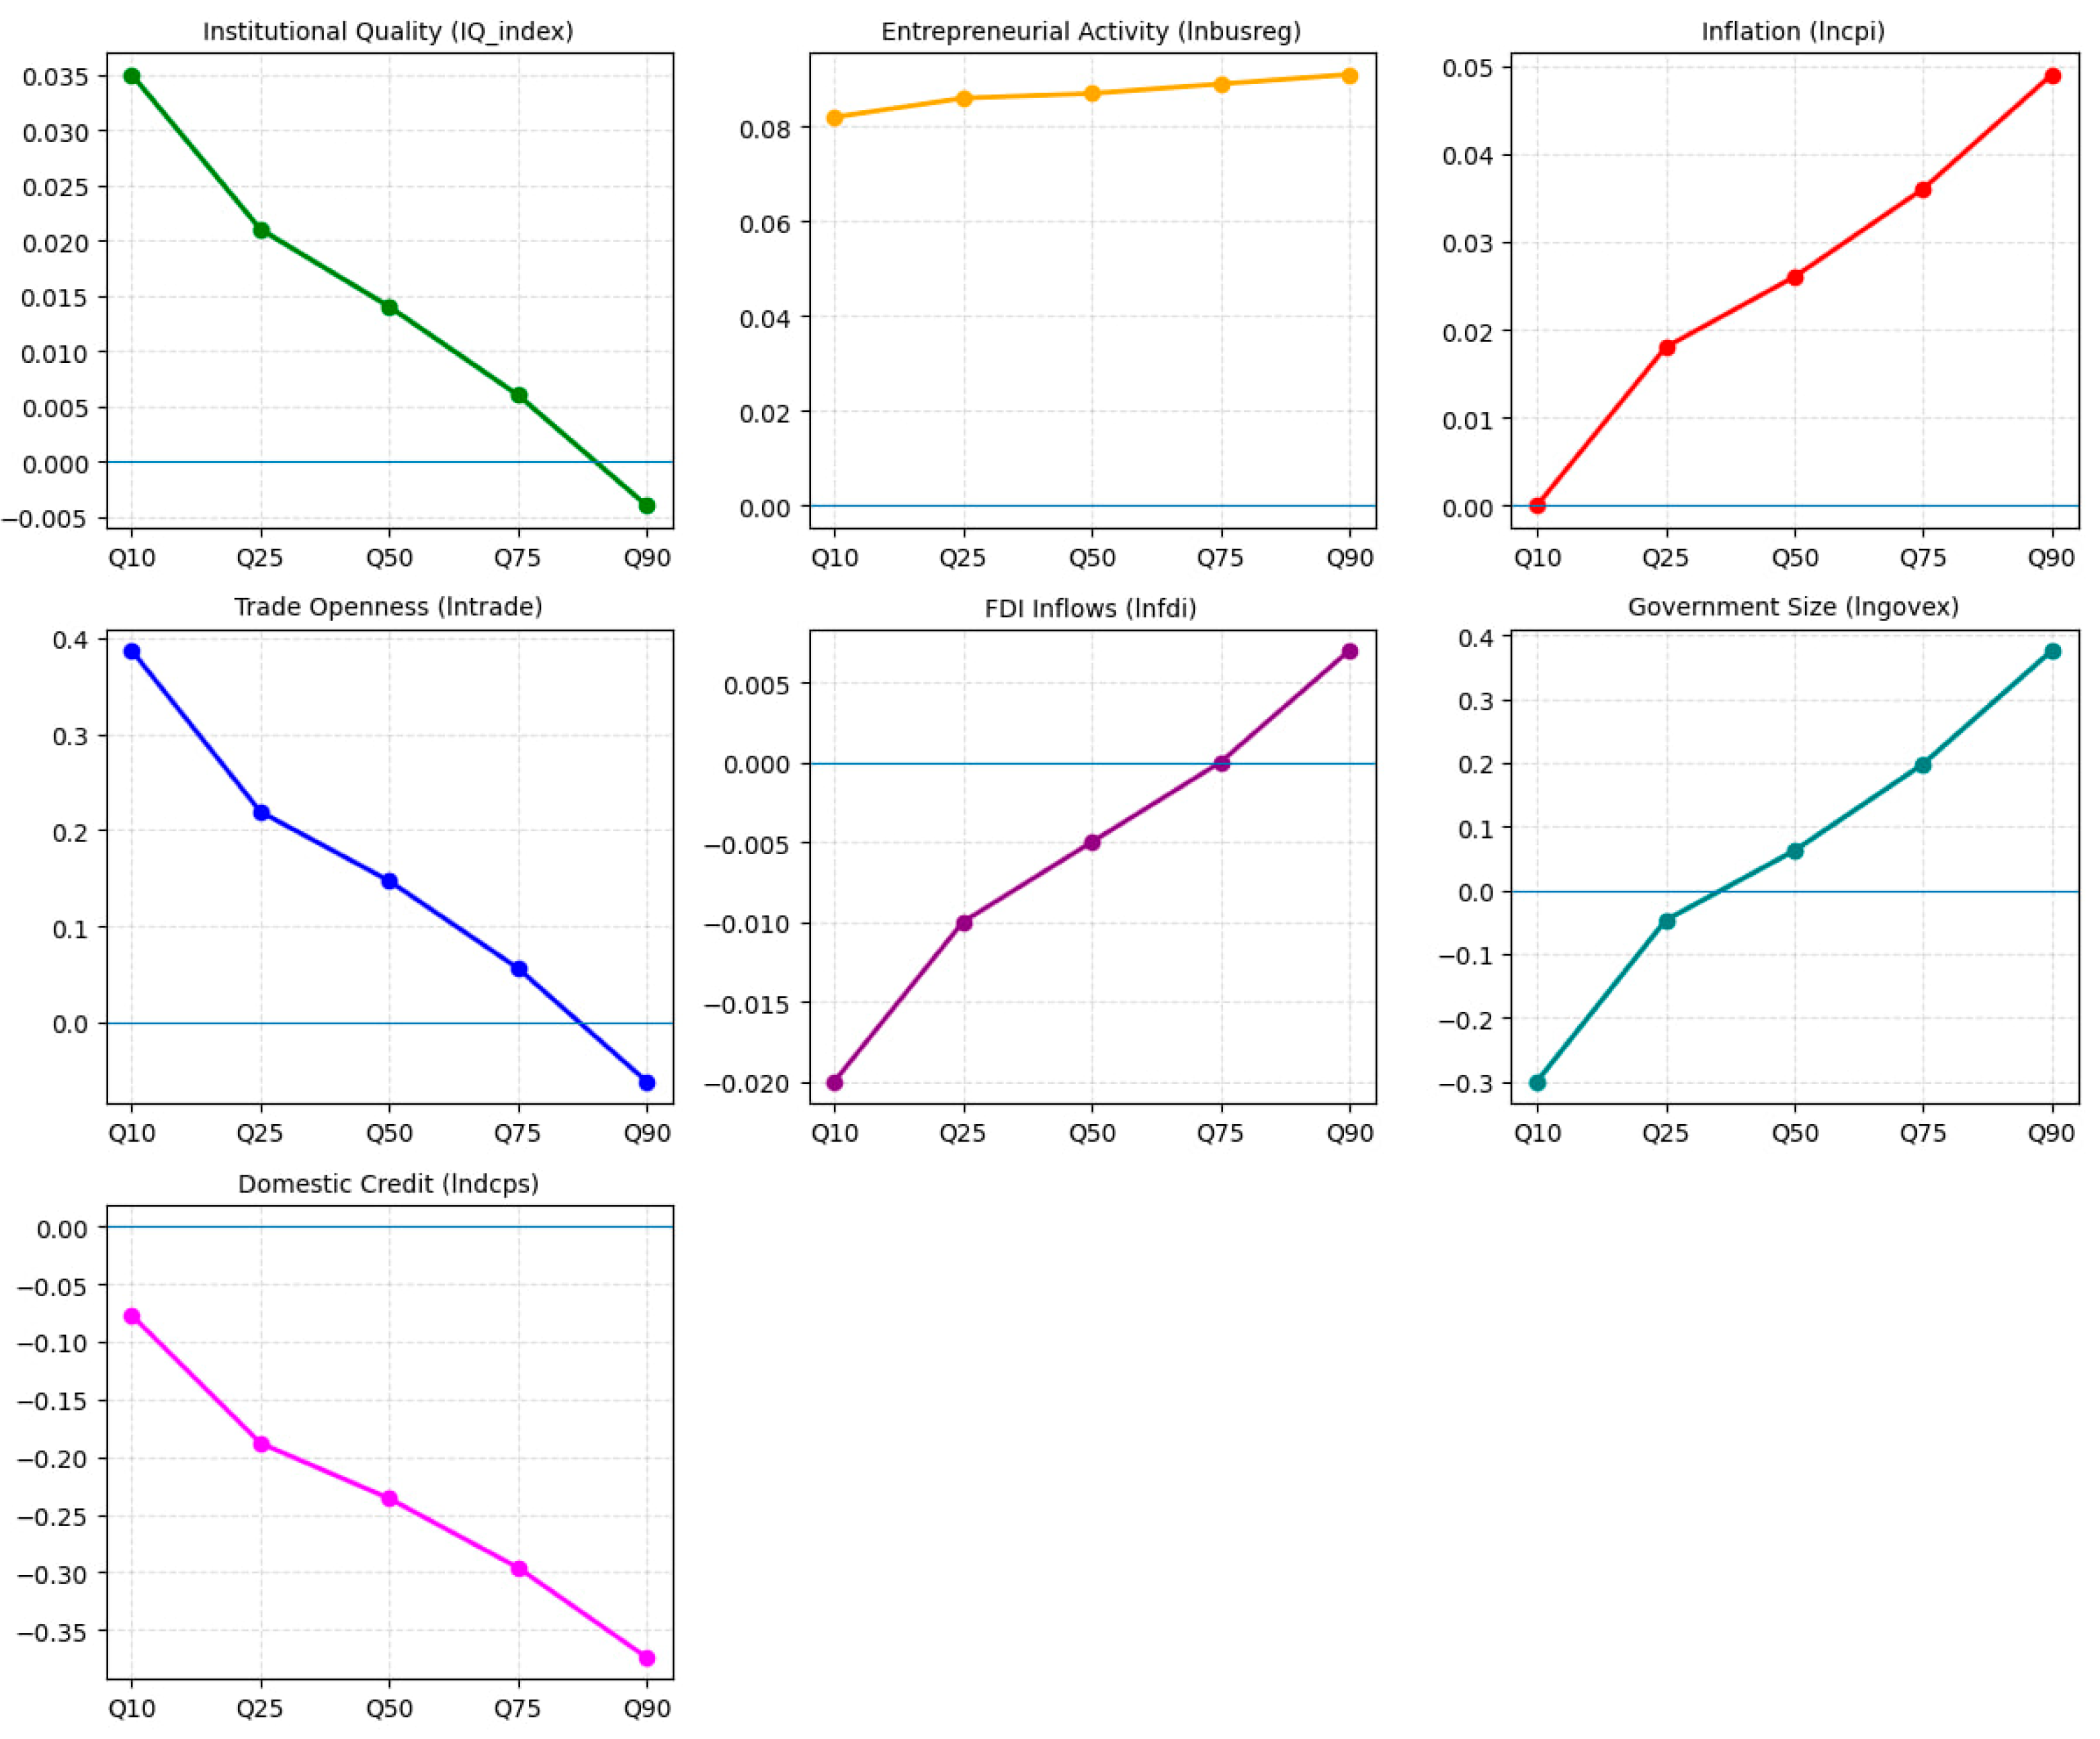
4.9. MMQR Results: Distributional Heterogeneity

Table 13 reports the MMQR estimates across five quantiles (Q10, Q25, Q50, Q75, Q90) of the conditional distribution of GDP per capita. The quantile regression results for the EU-26 countries reveal substantial heterogeneity in the determinants of GDP per capita across different points of the distribution. Institutional quality exerts its strongest positive influence in the lower quantiles, suggesting that governance improvements and institutional strengthening are particularly vital for lagging EU economies, while the effect diminishes and becomes slightly negative among higher-income members. Entrepreneurial activity maintains a consistently positive and stable impact across all quantiles, highlighting its central role as a uniform driver of GDP per capita throughout the Union. Inflation shows a steadily increasing effect, indicating that price stability becomes progressively more important for higher-income EU countries, potentially reflecting stronger macroeconomic discipline and monetary credibility. Trade openness exhibits a declining profile—strongly enhancing GDP per capita in lower quantiles but weakening and turning negative in the highest quantile—implying that while market integration benefits lower-income EU economies, highly developed members may experience competitive pressures or diminishing marginal gains from further openness. FDI inflows shift from slightly negative to positive as quantiles rise, suggesting that only the more advanced EU economies possess the absorptive capacity required to translate foreign capital into productivity-enhancing investment. Government size shows a clear transition from negative effects in lower-income countries to strongly positive outcomes in higher-income contexts, reflecting differences in fiscal efficiency and public-sector capacity across the EU. Finally, domestic credit exerts increasingly negative effects toward the upper quantiles, pointing to financial saturation, misallocation, or credit inefficiencies in more developed EU financial systems. Overall, these findings demonstrate that the determinants of GDP per capita in the EU-26 are far from uniform, emphasizing the need for differentiated policy strategies tailored to the income positions of member states.
The graphical distribution can be seen in Figure 1, which illustrates how the estimated coefficients evolve across the Q10, Q25, Q50, Q75, and Q90 quantiles. Each panel depicts the heterogeneous response of GDP per capita to a specific determinant among the EU-26 countries, highlighting the extent to which the magnitude, direction, and significance of these relationships vary along the conditional distribution of GDP per capita. The visual patterns clearly demonstrate that certain variables—such as institutional quality, trade openness, and domestic credit—exhibit strong non-linearities across quantiles, while others, such as entrepreneurial activity and inflation, show more stable and monotonic trends. This graphical presentation reinforces the importance of adopting a distributional approach rather than relying solely on mean regression estimates.

5. Discussion

The empirical findings offer a comprehensive perspective on the determinants of GDP per capita across European Union member states, emphasizing the joint influence of institutional quality, entrepreneurial dynamics, and macroeconomic conditions within a framework that accounts for cross-sectional dependence and heterogeneity (Holobiuc, 2021; Yeboah, 2025; Ignatov, 2019). In the context of the EU26, these relationships are further shaped by the high degree of economic integration, policy coordination under EU frameworks, and exposure to common external shocks. Rather than indicating the absence of structural effects, the results suggest that patterns in GDP per capita in the EU are driven by a complex interaction between long-term structural forces and short-run adjustment mechanisms, where country-specific characteristics coexist with region-wide dynamics such as monetary integration, fiscal rules, and synchronized business cycles (Holobiuc, 2021; Yeboah, 2025; Batóg & Batóg, 2019). The CS-ARDL results reveal that several key structural variables exhibit meaningful long-run relationships with GDP per capita, although the strength and statistical significance of these effects vary across specifications (Mir et al., 2023; Yeboah, 2025; Salinas et al., 2023). Institutional quality demonstrates a positive and significant long-run association, indicating that improvements in governance, regulatory frameworks, and legal systems contribute to sustained economic performance. In the EU26 context, this reflects the role of supranational institutional standards, such as those embedded in EU regulatory harmonization and governance benchmarks, which enhance policy credibility and economic stability (Vyrostková & Kádárová, 2023; Salinas et al., 2023; Jinru et al., 2022). Entrepreneurial activity also shows a positive and significant long-run effect, suggesting that firm creation and business dynamism are essential components of long-term improvements in GDP per capita. This is particularly relevant in the EU, where innovation-driven entrepreneurship, supported by digitalization initiatives and single market integration, contributes to productivity gains and structural transformation (Gomes & Ferreira, 2022; Bruns et al., 2017; Almodóvar-González et al., 2020). Trade openness and government expenditure similarly exert positive and statistically significant long-run influences, reflecting the importance of market integration and coordinated public investment in supporting economic development (Yeboah et al., 2025; Caporale et al., 2022; Yeboah, 2025; Batóg & Batóg, 2019). In the EU26, the benefits of trade openness are amplified by the single market, which reduces transaction costs and facilitates the free movement of goods, services, and capital. Government expenditure, when directed toward infrastructure, education, and innovation, aligns with EU structural and cohesion policies aimed at reducing regional disparities and promoting convergence. In contrast, financial development displays a negative long-run effect, indicating that excessive credit expansion may reduce efficiency in GDP per capita. This finding is particularly relevant for EU economies that experienced periods of financial overextension, especially during the pre- and post-2008 financial cycles. Meanwhile, foreign direct investment remains statistically insignificant, suggesting that its contribution to GDP per capita depends on its composition, sectoral allocation, and the absorptive capacity of host economies (Yeboah et al., 2025; Holobiuc, 2021; Carvelli, 2023; W. Mehmood et al., 2022). In the short run, the CS-ARDL estimates highlight the responsiveness of GDP per capita to changes in key structural variables. Entrepreneurial activity and trade openness exhibit positive and statistically significant short-run effects, indicating that increases in firm entry and external integration contribute to GDP per capita through employment generation, demand effects, and improved market efficiency (Yeboah et al., 2025; Gomes & Ferreira, 2022; Vetsikas & Stamboulis, 2022). Within the EU26, this reflects the responsiveness of economies to policy initiatives promoting startups, digital markets, and cross-border trade. Conversely, government expenditure and domestic credit show negative and significant short-run impacts, suggesting that fiscal expansion and rapid credit growth may exert temporary contractionary pressures, potentially due to crowding-out effects and inefficiencies in resource allocation (Yeboah et al., 2025; Yeboah, 2025; Carvelli, 2023). These dynamics are particularly relevant in the EU context, where fiscal constraints and financial sector adjustments often shape short-term macroeconomic outcomes. Overall, these findings underscore the distinction between short-term cyclical responses and long-term structural effects on GDP per capita (Holobiuc, 2021; Yeboah, 2025; Batóg & Batóg, 2019). The AMG and CCEMG estimators provide further insights into the robustness of these relationships. The AMG results largely confirm the positive long-run contributions of institutional quality, entrepreneurship, trade openness, and government expenditure, while also reinforcing the negative role of financial development (Mir et al., 2023; Yeboah, 2025; W. Mehmood et al., 2022). This consistency suggests that the key determinants of GDP per capita identified in the CS-ARDL model reflect underlying structural mechanisms prevalent across EU economies, rather than being model-specific artifacts (Holobiuc, 2021; Yeboah, 2025; Ignatov, 2019). However, the CCEMG results, which more rigorously control for unobserved common factors, show some attenuation in statistical significance, particularly for institutional quality and entrepreneurship. This indicates that part of their observed effects may be influenced by EU-wide shocks, such as monetary policy changes, energy price fluctuations, or global economic conditions, rather than purely domestic factors (Holobiuc, 2021; Yeboah, 2025; Bruns et al., 2017). Despite these differences, the overall consistency in coefficient signs across estimators confirms the stability of the underlying economic relationships. The persistent positive effects of trade openness and government expenditure, alongside the negative impact of financial development, highlight the importance of policy design and structural conditions in shaping economic outcomes (Yeboah et al., 2025; Caporale et al., 2022; Yeboah, 2025; Carvelli, 2023). The insignificance of foreign direct investment further suggests that its effectiveness depends on institutional quality, sectoral specialization, and the ability of economies to absorb technological spillovers (Yeboah et al., 2025; Rusu & Roman, 2017; Skica et al., 2025; Almodóvar-González et al., 2020). The role of entrepreneurship remains particularly prominent. Its positive short-run and long-run effects indicate that entrepreneurial activity contributes both to immediate increases in GDP per capita and to longer-term structural transformation, especially when supported by favorable institutional environments and innovation systems (Gomes & Ferreira, 2022; Bruns et al., 2017; Almodóvar-González et al., 2020). Similarly, institutional quality continues to play a foundational role, reinforcing the importance of governance reforms and regulatory efficiency in sustaining economic performance (Vyrostková & Kádárová, 2023; Salinas et al., 2023; Jinru et al., 2022). The findings related to macroeconomic variables further illustrate the complexity of economic performance within the EU. Trade openness consistently promotes economic performance, reflecting the benefits of deep economic integration and access to global markets (Yeboah et al., 2025; Caporale et al., 2022; Yeboah, 2025; Vetsikas & Stamboulis, 2022). Government expenditure shows positive long-run contributions but mixed short-run effects, indicating that its impact depends on efficiency, allocation, and institutional context (Yeboah, 2025; Carvelli, 2023; Batóg & Batóg, 2019). Financial development, on the other hand, consistently exhibits a negative association with GDP per capita, supporting the argument that beyond a certain threshold, financial deepening may generate inefficiencies and reduce productive investment (Yeboah et al., 2025; Carvelli, 2023; U. Mehmood et al., 2022). Finally, the significant and negative error correction term confirms the presence of a stable long-run equilibrium relationship among the variables, with a moderate speed of adjustment indicating that deviations from equilibrium are gradually corrected over time (Mir et al., 2023; Yeboah, 2025; Salinas et al., 2023). In the EU26 context, this reflects the persistence of structural rigidities, institutional inertia, and the influence of common shocks, where adjustment processes are shaped by both national policies and supranational economic governance (Holobiuc, 2021; Yeboah, 2025; Ignatov, 2019). Overall, the results emphasize that GDP per capita in the European Union is driven by a combination of structural and cyclical factors, with institutional quality, entrepreneurship, and trade integration playing central roles (Gomes & Ferreira, 2022; Vyrostková & Kádárová, 2023; Holobiuc, 2021; Yeboah, 2025; Batóg & Batóg, 2019). At the same time, the variation in statistical significance across estimators highlights the importance of accounting for cross-sectional dependence and heterogeneity in empirical analysis (Holobiuc, 2021; Mir et al., 2023; Yeboah, 2025; Salinas et al., 2023). These findings suggest that policy interventions in the EU26 should be carefully tailored to country-specific institutional capacities, levels of development, and structural characteristics, rather than relying on uniform policy prescriptions (Holobiuc, 2021; Yeboah, 2025; Ignatov, 2019).
Overall, the empirical findings provide substantial support for the proposed hypotheses, although with important qualifications. Entrepreneurship (H1) is strongly supported, as it exhibits positive and statistically significant effects on GDP per capita in both the short and long run across all estimation techniques. Institutional quality (H2) is supported in the long run but not in the short run, indicating that its effects operate through gradual transmission mechanisms and vary across income levels. Trade openness (H3) is generally confirmed, although its impact is heterogeneous across the income distribution, with stronger effects observed in lower-income countries. The hypothesis on financial development (H4) is also supported, as the results consistently indicate a negative effect on GDP per capita, in line with the “too much finance” argument. Finally, the effect of government expenditure (H5) is only partially confirmed, as it exhibits positive long-run effects but negative short-run impacts, suggesting that its influence depends on fiscal efficiency and composition. Taken together, these findings highlight the importance of accounting for heterogeneity and nonlinearities when assessing the determinants of GDP per capita across EU member states.

6. Conclusions

This study investigates the determinants of GDP per capita in 26 EU member states over the period 2006–2024, employing advanced econometric techniques designed to address cross-sectional dependence and slope heterogeneity in macro-panel data. The empirical framework integrates second-generation unit root and cointegration tests, including CIPS and Westerlund procedures, to establish the existence of a stable long-run relationship among the variables. The analysis utilizes the Cross-Sectionally Augmented ARDL (CS-ARDL) model to estimate both long-run relationships and short-run dynamics, complemented by robustness checks through the Augmented Mean Group (AMG) and Common Correlated Effects Mean Group (CCEMG) estimators. In addition, the Method of Moments Quantile Regression (MMQR) is applied to capture distributional heterogeneity across different income levels, thereby explicitly accounting for long-run income differences among EU member states.
The empirical findings indicate that GDP per capita in EU countries is driven by a combination of structural and macroeconomic factors, with consistent evidence across estimation techniques. Institutional quality emerges as a positive and significant determinant of GDP per capita in the long run, highlighting the importance of governance effectiveness, regulatory quality, and rule of law in sustaining economic performance. Entrepreneurial activity also demonstrates a robust positive contribution in both the short and long run, underscoring its role in fostering innovation, employment generation, and structural transformation that supports GDP per capita. Trade openness consistently supports GDP per capita across models, reflecting the benefits of international integration, market expansion, and technology diffusion.
At the same time, the results reveal that financial development exerts a negative influence on GDP per capita, suggesting that excessive credit expansion may reduce efficiency and lead to suboptimal allocation of resources in advanced economies. Government expenditure shows a positive long-run effect, indicating that public spending can contribute to GDP per capita when directed toward productive investments such as infrastructure and human capital, although its impact depends on fiscal efficiency and composition. In contrast, foreign direct investment does not exhibit a statistically robust effect, implying that its contribution to GDP per capita is conditional on factors such as sectoral allocation and absorptive capacity. Inflation displays a weak but positive association with GDP per capita, suggesting that moderate and stable inflation may be consistent with expansionary economic conditions. The robustness analysis using AMG and CCEMG estimators confirms the stability of the main findings, as the direction of the coefficients remains largely consistent across models, despite some variation in statistical significance due to differences in the treatment of cross-sectional dependence and unobserved common factors. These results reinforce the credibility of the baseline estimates and highlight the importance of accounting for heterogeneity and global shocks in panel data analysis.
Importantly, the MMQR results provide strong evidence that the effects of key determinants of GDP per capita are not uniform across EU member states but vary significantly depending on long-run income levels. Institutional quality and trade openness tend to exert stronger positive effects in lower-income quantiles, reflecting convergence dynamics and greater marginal gains from structural reforms and integration. In contrast, the adverse effects of excessive financial development are more pronounced in higher-income economies, where financial systems are more mature and susceptible to overexpansion. These findings underscore that long-run income differences play a critical role in shaping the effectiveness of economic policies and highlight the need to move beyond one-size-fits-all approaches. From a regional policy perspective, the results carry important implications for the European Union’s cohesion and economic performance strategies. The presence of income heterogeneity across EU member states suggests that uniform policy frameworks may not yield optimal outcomes. Instead, EU-wide policies should be complemented by differentiated national strategies that reflect countries’ levels of economic development, institutional capacity, and structural characteristics. From a regional policy perspective, the results carry important implications for the European Union’s cohesion and economic performance strategies. The evidence from MMQR highlights that the effects of key determinants of GDP per capita differ across the income distribution, reflecting long-run income heterogeneity among EU member states. In particular, for lower-income member states—captured by lower quantiles—policies should prioritize strengthening institutional frameworks, promoting entrepreneurship, and enhancing integration into international markets to accelerate convergence in GDP per capita. In contrast, for higher-income economies—represented by upper quantiles—the focus should shift toward improving financial sector efficiency, preventing excessive credit expansion, and fostering innovation-driven improvements in GDP per capita. At the EU level, coordinated efforts through structural funds, innovation programs, and regulatory harmonization can play a crucial role in addressing these distributional differences, reducing disparities, and supporting balanced economic performance across the region.
This study is not without limitations. The use of new business registrations as a proxy for entrepreneurial activity captures the quantity of firm entry but may not fully reflect entrepreneurial quality, innovation, or contributions to GDP per capita. Alternative measures, such as early-stage entrepreneurial activity or indicators of high-growth firms, could provide additional insights; however, consistent data for these measures are not available across all EU countries and the full study period. Future research could address this limitation by incorporating richer datasets as they become available and by exploring nonlinear or threshold effects, particularly in the relationship between financial development and GDP per capita.
In conclusion, GDP per capita in the European Union is shaped by the interaction of institutional quality, entrepreneurial activity, trade integration, and financial sector dynamics. However, the effectiveness of these factors is strongly conditioned by long-run income differences across member states. The findings highlight the importance of adopting differentiated and context-specific policy approaches that account for income heterogeneity, institutional capacity, and structural diversity within the EU. Such an approach is essential for promoting sustainable, inclusive, and balanced improvements in GDP per capita across the region.

Author Contributions

Conceptualization, Y.S. and N.S.; methodology, S.K.; software, Y.S.; validation, D.K., N.N. and S.M.; formal analysis, J.K.; investigation, D.K.; resources, S.M.; data curation, N.S.; writing-original draft preparation, J.K.; writing-review and editing, N.S.; visualization, N.N.; supervision, Y.S.; project administration, N.S.; funding acquisition, Y.S. All authors have read and agreed to the published version of the manuscript.

Funding

This research received no external funding.

Data Availability Statement

The data supporting the findings of this study are publicly available from the World Bank’s World Development Indicators (WDI) database. Additional processed datasets used in the analysis are available from the authors upon reasonable request.

Conflicts of Interest

The authors declare no conflicts of interest.

Appendix A

Table A1. Data Sources, Transformations, and Handling Procedures.
VariableSymbolOriginal Series & UnitsTransformation/
Logarithm
Treatment of Zeros/
Negative Values
Missing Values HandlingOutlier Treatment
Real GDP per capitalngdpGDP per capita (constant 2015 US$)Natural logNot applicable (strictly positive)Not applicableWinsorized at the 1st and 99th percentiles of the pooled sample: values below p1 set to 8.774116 and values above p99 set to 11.5861.
New business registrationslnbusregNumber of new business registrations (count)Natural logConstant of 1 added to handle zero valuesLinear interpolation within countries (1 observation)Winsorized at the 1st and 99th percentiles of the pooled sample: values below p1 set to 7.887208 and values above p99 set to 12.25623.
Inflation ratelncpiGDP deflator-based annual inflation (%)log(1 + inflation/100)Constant of 0.01 added to ensure positivityLinear interpolation within countries (35 observations)Winsorized at the 1st and 99th percentiles of the pooled sample: values below p1 set to −2.244683 and values above p99 set to 2.767479.
Trade opennesslntradeTotal trade (exports + imports) as % of GDPNatural logNot applicable (strictly positive)Missing Values: No missing observations; interpolation not requiredWinsorized at the 1st and 99th percentiles of the pooled sample: values below p1 set to 3.933877 and values above p99 set to 5.928475.
Foreign direct investment inflowslnfdiNet FDI inflows (% of GDP)ln(FDI + 1.01)Constant of 1.01 added to handle zero and negative valuesLinear interpolation within countries (46 observations); remaining missing observations excludedWinsorized at the 1st and 99th percentiles of the pooled sample: values below p1 set to −1.731751 and values above p99 set to 5.915942.
Government consumptionlngovexGeneral government final consumption (% of GDP)Natural logNot applicable (strictly positive)Missing Values: No missing observations; interpolation not requiredWinsorized at the 1st and 99th percentiles of the pooled sample: values below p1 set to 2.470334 and values above p99 set to 3.277157.
Domestic credit to private sectorlndcpsDomestic credit to private sector (% of GDP)Natural logNot applicable (strictly positive)Missing Values: No missing observations; interpolation not requiredWinsorized at the 1st and 99th percentiles of the pooled sample: values below p1 set to 3.227718 and values above p99 set to 5.491171.
Institutional quality indexIQ_indexPCA composite of six Worldwide Governance IndicatorsStandardized PCA scoreNot applicable (index may take negative values)Missing indicators replaced with EU cross-sectional averages (report exact count)Values capped at ±3 standard deviations from the sample mean

References

  1. Acemoglu, D., Johnson, S., & Robinson, J. (2004). Institutions as the fundamental cause of long-run growth. National Bureau of Economic Research. [Google Scholar] [CrossRef]
  2. Acs, Z. J., & Audretsch, D. B. (2010). Introduction to the 2nd edition of the handbook of entrepreneurship research. In Handbook of entrepreneurship research (pp. 1–19). Springer Science + Business Media, LLC. [Google Scholar] [CrossRef]
  3. Akhmetgareeva, A., Gekhaeva, P., & Durnovtsov, P. (2025). The role of small and medium enterprises in the economic development of developing countries. Ekonomika I Upravlenie: Problemy Resheniya, 1/6(154), 28–37. [Google Scholar] [CrossRef]
  4. Akwe, O., Umar, A., & Usman, K. (2025). Impact of institutional quality on economic growth in Nigeria. International Journal of Advanced Studies of Economics and Public Sector Management, 13(1), 6. [Google Scholar] [CrossRef]
  5. Almodóvar-González, M., Fernández-Portillo, A., & Díaz-Casero, J. (2020). Entrepreneurial activity and economic growth. A multi-country analysis. European Research on Management and Business Economics, 26, 9–17. [Google Scholar] [CrossRef]
  6. Arcand, J. L., Berkes, E., & Panizza, U. (2015). Too much finance? Journal of Economic Growth, 20(2), 105–148. [Google Scholar] [CrossRef]
  7. Atanasova, C., Li, M., Mugerman, Y., & Rastan, M. (2019). Government guarantees and the risk-taking of financial institutions: Evidence from a regulatory experiment. Journal of Asset Management, 20(6), 476–492. [Google Scholar] [CrossRef]
  8. Audretsch, D. B., Keilbach, M. C., & Lehmann, E. E. (2006). Endogenous entrepreneurship. In Entrepreneurship and economic growth (pp. 79–97). Oxford Academic. [Google Scholar] [CrossRef]
  9. Barro, R. (1995). Inflation and economic growth. National Bureau of Economic Research. [Google Scholar] [CrossRef]
  10. Batóg, J., & Batóg, B. (2019). Macroeconomic factors of economic growth in the European Union in 2000–2016: A multidimensional analysis. Econometrics, 23, 1–14. [Google Scholar] [CrossRef]
  11. Bjørnskov, C., & Foss, N. (2016). Institutions, entrepreneurship, and economic growth: What do we know? and what do we still need to know? IO: Productivity. [Google Scholar] [CrossRef]
  12. Bruns, K., Bosma, N., Sanders, M., & Schramm, M. (2017). Searching for the existence of entrepreneurial ecosystems: A regional cross-section growth regression approach. Small Business Economics, 49, 31–54. [Google Scholar] [CrossRef]
  13. Caporale, G., Sova, A., & Sova, R. (2022). The short-run and long-run effects of trade openness on financial development: Some panel evidence for Europe. SSRN Electronic Journal. [Google Scholar] [CrossRef]
  14. Carvelli, G. (2023). The long-run effects of government expenditure on private investments: A panel CS-ARDL approach. Journal of Economics and Finance, 47(3), 1–26. [Google Scholar] [CrossRef]
  15. Chudik, A., & Pesaran, M. H. (2015). Common correlated effects estimation of heterogeneous dynamic panel data models with weakly exogenous regressors. Journal of Econometrics, 188(2), 393–420. [Google Scholar] [CrossRef]
  16. Daraojimba, C., Abioye, K., Bakare, A., Mhlongo, N., Onunka, O., & Daraojimba, D. (2023). Technology and innovation to growth of entrepreneurship and financial boost: A decade in review (2013–2023). International Journal of Management & Entrepreneurship Research, 5(10), 769–792. [Google Scholar] [CrossRef]
  17. Degbedji, D., Akpa, A., Chabossou, A., & Osabohien, R. (2023). Institutional quality and green economic growth in West African economic and monetary union. Innovation and Green Development, 3(1), 100108. [Google Scholar] [CrossRef]
  18. Ebabu, E., Yu, H., Zou, W., & Gong, H. (2025). Economic and social impacts of sustainable entrepreneurship: Systematic review and bibliometric study of global evidence. Sustainable Development, 33(4), 5890–5903. [Google Scholar] [CrossRef]
  19. Eberhardt, M., & Bond, S. (2009). Cross-section dependence in nonstationary panel models: A novel estimator. University Library of Munich, Germany. [Google Scholar]
  20. Elhakim, L., & Ali, H. (2023). The influence of fiscal policy, monetary policy and international trade on economic growth in Indonesia (literature reviews). Dinasti International Journal of Economics, Finance & Accounting, 4(3), 425–433. [Google Scholar] [CrossRef]
  21. Enaifoghe, A. (2024). Enhancing small and medium enterprises (SMEs) in a globalized and innovative economy: Challenges and opportunities. International Journal of Business, Economics, and Social Development, 5(2), 130–138. [Google Scholar] [CrossRef]
  22. Enaifoghe, A., & Ramsuraj, T. (2023). Examining the function and contribution of entrepreneurship through small and medium enterprises as drivers of local economic growth in South Africa. African Journal of Inter/Multidisciplinary Studies, 5(1), 1–11. [Google Scholar] [CrossRef]
  23. Fadare, S., & Oladipo, O. (2025). Effects of institutional quality and public expenditure on economic growth nexus in a small open economy. Asian Economic and Financial Review, 15(5), 683–709. [Google Scholar] [CrossRef]
  24. Fajarika, D., Trapsilawati, F., & Sopha, B. (2024). Influential factors of small and medium-sized enterprises growth across developed and developing countries: A systematic literature review. International Journal of Engineering Business Management, 16, 1–21. [Google Scholar] [CrossRef]
  25. Fischer, S. (1993). The role of macroeconomic factors in growth. Journal of Monetary Economics, 32(3), 485–512. [Google Scholar] [CrossRef]
  26. Gafsi, N., & Bakari, S. (2025). Macroeconomic determinants of economic growth: Empirical validation on the case of African countries. International Journal of Innovative Research and Scientific Studies, 8(3), 643–666. [Google Scholar] [CrossRef]
  27. Garcia-Martinez, L., Kraus, S., Breier, M., & Kallmuenzer, A. (2023). Untangling the relationship between small and medium-sized enterprises and growth: A review of extant literature. International Entrepreneurship and Management Journal, 19, 455–479. [Google Scholar] [CrossRef]
  28. Ghosh, S., & Saha, S. (2025). Impact of foreign direct investment on economic growth in developing countries: The role of institutional quality. Sustainable Economies, 3(1), 389–389. [Google Scholar] [CrossRef]
  29. Gomes, S., Ferreira, J., Lopes, J., & Farinha, L. (2022). The impacts of the entrepreneurial conditions on economic growth: Evidence from OECD countries. Economies, 10(7), 163. [Google Scholar] [CrossRef]
  30. Gomes, S., & Ferreira, P. (2022). Entrepreneurial activity and economic growth: A dynamic data panel analysis of European countries. Entrepreneurial Business and Economics Review, 10(2), 7–20. [Google Scholar] [CrossRef]
  31. Gu, W., & Wang, J. (2022). Research on index construction of sustainable entrepreneurship and its impact on economic growth. Journal of Business Research, 142, 266–276. [Google Scholar] [CrossRef]
  32. Hakimah, Y. (2025). An empirical analysis of policy instruments influencing economic growth and price stability in low-income nations. Jurnal Ilmiah Manajemen Kesatuan, 13(5), 3507–3516. [Google Scholar] [CrossRef]
  33. Hernández-Barahona, J., Gil-López, Á., & Román, E. (2025). Entrepreneurship capital in Spain and its impact on modern economic growth (1886–2000). Revista de Historia Económica/Journal of Iberian and Latin American Economic History, 44(1), 149–174. [Google Scholar] [CrossRef]
  34. Holobiuc, A. (2021). Determinants of economic growth in the European Union. An empirical analysis of conditional convergence. SocioEconomic Challenges, 5(2), 26–34. [Google Scholar] [CrossRef]
  35. Huy, N., Dong, N., & Dinh, L. (2025). Examining the roles of monetary and fiscal policies in Vietnam’s economic growth amid global challenges: A Bayesian VAR and wavelet coherence approach. International Journal of Innovative Research and Scientific Studies, 8(2), 2758–2769. [Google Scholar] [CrossRef]
  36. Ignatov, A. (2019). Analyzing the determinants of the European Union’s regional economic development. Global Economy Journal, 19(01), 1950002. [Google Scholar] [CrossRef]
  37. Ivanović-Đukić, M., Krstić, B., & Rađenović, T. (2022). Entrepreneurship and economic growth in emerging markets: An empirical analysis. Acta Oeconomica, 72(1), 65–84. [Google Scholar] [CrossRef]
  38. Jinru, L., Qamruzzaman, M., Wu, H., & Kler, R. (2022). Do environmental quality, financial inclusion, and good governance ensure the FDI sustainably in belt and road countries? Evidence from an application of CS-ARDL and NARDL. Frontiers in Environmental Science, 10, 936216. [Google Scholar] [CrossRef]
  39. John, S., Kato, M., & Makorere, R. (2025). The influence of innovation on the growth of small and medium enterprises (SMEs): A case of wood and steel furniture manufacturing in Dodoma City, Tanzania. Lapai Journal of Economics, 8(2), 290–302. [Google Scholar] [CrossRef]
  40. Jomi, J., & Baye, F. (2025). Implications of institutional quality for macroeconomic productivity in sub-Saharan Africa. Discover Global Society, 3(1), 1–26. [Google Scholar] [CrossRef]
  41. Khan, S., Ponce, P., Yu, Z., & Ponce, K. (2022). Investigating economic growth and natural resource dependence: An asymmetric approach in developed and developing economies. Resources Policy, 77, 102672. [Google Scholar] [CrossRef]
  42. Krugman, P. (1980). Scale economies, product differentiation, and the pattern of trade. American Economic Review, 70(5), 950–959. [Google Scholar] [CrossRef]
  43. Lavrova, D. (2025). Role of innovative small and medium-sized enterprises in the development of regional economic systems. Vestnik Universiteta. [Google Scholar] [CrossRef]
  44. Law, S. H., & Singh, N. (2014). Does too much finance harm economic growth? Journal of Banking & Finance, 41, 36–44. [Google Scholar] [CrossRef]
  45. Lucas, R. E. (1988). On the mechanics of economic development. Journal of Monetary Economics, 22(1), 3–42. [Google Scholar] [CrossRef]
  46. Machado, J. A. F., & Santos Silva, J. M. C. (2019). Quantiles via moments. Journal of Econometrics, 213(1), 145–173. [Google Scholar] [CrossRef]
  47. Martínez-Baltodano, O., & Fonseca-Mairena, M. (2025). Balancing infrastructure and human capital: Optimal fiscal composition for sustainable growth. Economia, 48(95), 34–68. [Google Scholar] [CrossRef]
  48. Mehmood, U., Tariq, S., Haq, Z., Agyekum, E., Uhunamure, S., Shale, K., Nawaz, H., Ali, S., & Hameed, A. (2022). Financial institutional and market deepening, and environmental quality nexus: A case study in G-11 economies using CS-ARDL. International Journal of Environmental Research and Public Health, 19(19), 11984. [Google Scholar] [CrossRef] [PubMed]
  49. Mehmood, W., Din, S., Aman-Ullah, A., Khan, A., & Fareed, M. (2022). Institutional quality and economic growth: Evidence from South-Asian countries. Journal of Public Affairs, 23(1), 2824. [Google Scholar] [CrossRef]
  50. Mir, T., Gopinathan, R., & Joshi, D. (2023). Revisiting long-run dynamics between financial inclusion and economic growth in developing nations: Evidence from CS-ARDL approach. Journal of Financial Economic Policy, 16(2), 176–193. [Google Scholar] [CrossRef]
  51. Mtar, K., & Belazreg, W. (2021). On the nexus of innovation, trade openness, financial development and economic growth in European countries: New perspective from a GMM panel VAR approach. International Journal of Finance & Economics, 28(1), 766–791. [Google Scholar] [CrossRef]
  52. Munyo, I., & Veiga, L. (2022). Entrepreneurship and economic growth. Journal of the Knowledge Economy, 15, 319–336. [Google Scholar] [CrossRef]
  53. Negi, R. (2022). The role of entrepreneurship in economic development. International Journal of Early Childhood Special Education, 14, 3018–3021. [Google Scholar] [CrossRef]
  54. Neumann, T. (2020). The impact of entrepreneurship on economic, social and environmental welfare and its determinants: A systematic review. Management Review Quarterly, 71, 553–584. [Google Scholar] [CrossRef]
  55. Ngo, A. (2025). Entrepreneurship and innovation in business economics: A global bibliometric analysis from 2015 to 2024. CTU Journal of Innovation and Sustainable Development, 17(2), 136–147. [Google Scholar] [CrossRef]
  56. North, D. C. (1990). Institutions, institutional change and economic performance. Cambridge University Press. [Google Scholar]
  57. Ordeñana, X., Vera-Gilces, P., Zambrano-Vera, J., & Jimenez, A. (2024). The effect of high-growth and innovative entrepreneurship on economic growth. Journal of Business Research, 171, 114243. [Google Scholar] [CrossRef]
  58. Pastpipatkul, P., & Ko, H. (2025). Institutional quality, macroeconomic policy, and sustainable growth in Thailand. Sustainability, 17(16), 7524. [Google Scholar] [CrossRef]
  59. Pesaran, M. H. (2004). General diagnostic tests for cross section dependence in panels. SSRN Electronic Journal. [Google Scholar] [CrossRef]
  60. Pesaran, M. H. (2006). Estimation and inference in large heterogeneous panels with a multifactor error structure. Econometrica, 74(4), 967–1012. [Google Scholar] [CrossRef]
  61. Pesaran, M. H. (2007). A simple panel unit root test in the presence of cross-section dependence. Journal of Applied Econometrics, 22(2), 265–312. [Google Scholar] [CrossRef]
  62. Pesaran, M. H., & Yamagata, T. (2008). Testing slope homogeneity in large panels. Journal of Econometrics, 142(1), 50–93. [Google Scholar] [CrossRef]
  63. Pinjaman, S., Thani, M., Hadi, S., & Bakar, M. (2025). The nexus between governance quality and economic growth of Malaysia: Short- and long-run analyses. International Journal of Research and Innovation in Social Science, IX(XV), 115–129. [Google Scholar] [CrossRef]
  64. Rahmawati, D. (2025). The critical role of entrepreneurship and innovation in enhancing community economic development and growth. International Journal of Economics, Management and Accounting (IJEMA), 2(12), 977–986. [Google Scholar] [CrossRef]
  65. Ramadhani, M. A., Basri, & Atkiyan, F. H. (2025). The role of domestic investment and human capital in economic performance: Does the monetary and fiscal policy mix matter? Jurnal Ilmu Ekonomi Terapan, 10(1), 57–76. [Google Scholar] [CrossRef]
  66. Re, N., Iadevaia, P., Lahmi, B., Ghezzi, A., & Rangone, A. (2025). Exploring the microfoundations of open innovation: Insights from the Italian SME-startup collaborative landscape. European Conference on Innovation and Entrepreneurship, 20(1), 592–600. [Google Scholar] [CrossRef]
  67. Romer, P. M. (1986). Increasing returns and long-run growth. Journal of Political Economy, 94(5), 1002–1037. [Google Scholar] [CrossRef]
  68. Rusu, V., & Roman, A. (2017). Entrepreneurial activity in the EU: An empirical evaluation of its determinants. Sustainability, 9, 1679. [Google Scholar] [CrossRef]
  69. Salinas, A., Ortiz, C., Changoluisa, J., & Muffatto, M. (2023). Testing three views about the determinants of informal economy: New evidence at global level and by country groups using the CS-ARDL approach. Economic Analysis and Policy, 78, 438–455. [Google Scholar] [CrossRef]
  70. Shabbir, M. (2023). Exploring the relationship between sustainable entrepreneurship and the United Nations sustainable development goals: A comprehensive literature review. Sustainable Development, 31(4), 3070–3085. [Google Scholar] [CrossRef]
  71. Shamsi, S., Ali, M., Haider, S., & Javed, I. (2025). Microfinance and its role in promoting entrepreneurship and economic growth: A systematic literature review. Journal of Business and Management Research, 4(2), 481–514. [Google Scholar] [CrossRef]
  72. Silaban, D. (2025). Factors determining economic growth: Analysis and implications for the global economy. International Journal of Engineering Business and Social Science, 3(4), 1–10. [Google Scholar] [CrossRef]
  73. Singh, B. P., & Pradhan, K. C. (2020). Institutional quality and economic performance in South Asia. Journal of Public Affairs, 22(1), e2401. [Google Scholar] [CrossRef]
  74. Skica, T., Piątkowski, M., Abdić, A., & Lazović-Pita, L. (2025). What shapes entrepreneurial activity in the European Union? Journal of Entrepreneurship, Management and Innovation, 21(3), 77–100. [Google Scholar] [CrossRef]
  75. Sobirov, Y., Artikov, B., Khodjaniyozov, E., Marty, P., & Saidmamatov, O. (2025). Economic growth, FDI, tourism, and agricultural productivity as drivers of environmental degradation: Testing the EKC hypothesis in ASEAN countries. Sustainability, 17(18), 8394. [Google Scholar] [CrossRef]
  76. Solow, R. M. (1956). A contribution to the theory of economic growth. The Quarterly Journal of Economics, 70(1), 65. [Google Scholar] [CrossRef]
  77. Stoica, O., Roman, A., & Rusu, V. (2020). The nexus between entrepreneurship and economic growth: A comparative analysis on groups of countries. Sustainability, 12, 1186. [Google Scholar] [CrossRef]
  78. Sun, X. (2024). A literature review of the macroeconomic implications of entrepreneurship: A research perspective of the future. Journal of Enterprise and Business Intelligence, 4(2), 95–104. [Google Scholar] [CrossRef]
  79. Tahir, M., & Burki, U. (2023). Entrepreneurship and economic growth: Evidence from the emerging BRICS economies. Journal of Open Innovation: Technology, Market, and Complexity, 9(2), 100088. [Google Scholar] [CrossRef]
  80. Tanjung, M., & Shimada, Y. (2025). Modelling the impact of governance and economic growth: Insights from ASEAN and Developed countries. Journal of Public Affairs, 25(2), 70048. [Google Scholar] [CrossRef]
  81. Tashtamirov, M. (2023). The role of institutions in economic development and their impact on economic growth in different countries. SHS Web of Conferences, 172, 02005. [Google Scholar] [CrossRef]
  82. Terán-Yépez, E., Marín-Carrillo, G., Casado-Belmonte, M., & Capobianco-Uriarte, M. (2020). Sustainable entrepreneurship: Review of its evolution and new trends. Journal of Cleaner Production, 252, 119742. [Google Scholar] [CrossRef]
  83. Turna, Y. (2025). Causality effects of capital accumulation and employment on Turkey’s economic growth: Findings from the Toda-Yamamoto approach. Bulletin of Economic Theory and Analysis, 10(1), 155–167. [Google Scholar] [CrossRef]
  84. Urbano, D., Aparicio, S., & Audretsch, D. (2019). Twenty-five years of research on institutions, entrepreneurship, and economic growth: What has been learned? Small Business Economics, 53, 21–49. [Google Scholar] [CrossRef]
  85. Vetsikas, A., & Stamboulis, Y. (2022). Does innovation activity affect trade openness? An ARDL bounds testing approach for 10 European countries. The Journal of International Trade & Economic Development, 32, 163–188. [Google Scholar] [CrossRef]
  86. Vyrostková, L., & Kádárová, J. (2023). Entrepreneurship dynamics: Assessing the role of macroeconomic variables on new business density in Euro area. International Journal of Financial Studies, 11(4), 139. [Google Scholar] [CrossRef]
  87. Westerlund, J. (2007). Testing for error correction in panel data. Oxford Bulletin of Economics and Statistics, 69(6), 709–748. [Google Scholar] [CrossRef]
  88. World Bank. (2026). World development indicators. Available online: https://databank.worldbank.org/source/world-development-indicators (accessed on 20 February 2026).
  89. Xu, F., & Wubishet, A. (2024). Analysis of the impacts of financial development on economic growth in East Africa: How do the institutional qualities matter? Economic Analysis and Policy, 82, 1177–1189. [Google Scholar] [CrossRef]
  90. Yeboah, E. (2025). Economic growth in 26 European Union economies: Evidence from conditional convergence. Future Business Journal, 11, 250. [Google Scholar] [CrossRef]
  91. Yeboah, E., Baffour, A., Chibalamula, H., & Atiso, F. (2025). The significance of foreign direct investment (FDI) and trade openness: Evidence from nine European economies. SN Business & Economics, 5(3), 1–21. [Google Scholar] [CrossRef]
  92. Ziane, A., Bouziani, A., & Moumni, S. (2025). Entrepreneurship and innovation: Driving economic growth. SocioEconomic Challenges, 9(1), 219–232. [Google Scholar] [CrossRef]
Figure 1. MMQR graphical distribution.
Economies 14 00150 g001
Table 1. Variable description.
VariableSymbolDefinition/MeasurementData Source
Real GDP per capita (natural log)lngdpNatural logarithm of GDP per capita in constant 2015 US dollars; measures real economic output per person(World Bank, 2026)
New business registrations (natural log)lnbusregLogarithm of annual number of new business registrations; proxy for entrepreneurial dynamism(World Bank, 2026)
Inflation rate (natural log)lncpiLogarithm of GDP deflator-based annual inflation; captures price stability(World Bank, 2026)
Trade openness (natural log)lntradeLogarithm of total trade (exports + imports) as a percentage of GDP; measures integration into global markets(World Bank, 2026)
Foreign direct investment inflows (natural log)lnfdiLogarithm of net FDI inflows as a share of GDP; proxy for foreign capital participation(World Bank, 2026)
Government consumption (natural log)lngovexLogarithm of general government final consumption expenditure as a share of GDP; captures public sector size(World Bank, 2026)
Domestic credit to private sector (natural log)lndcpsLogarithm of domestic credit extended to the private sector as a share of GDP; proxy for financial development(World Bank, 2026)
Institutional quality indexIQ_indexComposite index constructed via PCA of six Worldwide Governance Indicators (voice & accountability, political stability, government effectiveness, regulatory quality, rule of law, corruption control)(World Bank, 2026)
Table 2. KMO and Bartlett’s Test Results.
TestValueInterpretation
Kaiser–Meyer–Olkin (KMO) Statistic0.812Good sampling adequacy
Bartlett’s Test of Sphericity (Chi-square)1245.67
p-value0.000Significant at 1% level
Table 3. Total Variance Explained by Principal Components.
ComponentEigenvalueVariance Explained (%)Cumulative Variance (%)
PC14.2170.1570.15
PC20.8313.8483.99
PC30.416.8290.81
PC40.284.6795.48
PC50.172.8398.31
PC60.101.69100.00
Table 4. PCA Factor Loadings (First Principal Component).
IndicatorLoading (PC1)
Voice and Accountability0.79
Political Stability0.81
Government Effectiveness0.88
Regulatory Quality0.86
Rule of Law0.91
Control of Corruption0.89
Table 5. Descriptive Statistics.
VariableMeanStd. Dev.MinMaxSkew.Kurt.
lngdp10.1710.6418.63611.6300.032−0.458
IQ_index0.0002.258−4.6253.895−0.100−0.932
lnbusreg9.9581.0447.56012.5370.128−0.636
lncpi0.7670.947−4.2362.973−0.8452.502
lntrade4.7260.4443.8106.0210.375−0.145
lnfdi1.4831.475−6.3996.1140.5092.953
lngovex2.9790.1592.4043.326−0.3500.639
lndcps4.3320.4903.1245.540−0.098−0.322
Table 6. Pairwise Correlation Matrix.
lngdpIQ_indexlnbusreglncpilntradelnfdilngovexlndcps
lngdp1.000
IQ_index0.837 ***1.000
lnbusreg0.028−0.107 **1.000
lncpi−0.137 ***−0.140 ***−0.093 *1.000
lntrade0.251 ***0.266 ***−0.579 ***0.199 ***1.000
lnfdi0.141 ***0.197 ***−0.353 ***0.112 **0.534 ***1.000
lngovex0.247 ***0.356 ***0.132 ***−0.221 ***−0.350 ***−0.266 ***1.000
lndcps0.478 ***0.480 ***0.059−0.291 ***−0.201 ***0.129 ***0.427 ***1.000
Note: *, **, *** denote significance at 10%, 5%, and 1% levels, respectively.
Table 7. Pesaran (2004) Cross-Sectional Dependence Test.
VariableCD Statisticp-Value
lngdp232.3750.000 ***
IQ_index20.3680.000 ***
lnbusreg64.0220.004 ***
lncpi160.5180.000 ***
lntrade251.5260.001 ***
lnfdi42.0170.000 ***
lngovex114.1620.000 ***
lndcps75.3400.000 ***
Note: H0: Cross-sectional independence. *** denotes rejection at 1% level.
Table 8. Pesaran and Yamagata (2008) Slope Homogeneity Test.
TestStatisticp-Value
Δ̃−8.2540.000 ***
Δ̃adj−5.9990.000 ***
Note: H0: Homogeneous slopes. *** denotes rejection at 1% level.
Table 9. CIPS Panel Unit Root Test Results.
VariableLevelFirst Difference
lngdp−1.698 ***−3.113 ***
IQ_index−1.975−3.982 ***
lnbusreg−2.017−2.377 **
lncpi−3.544 ***−6.070 ***
lntrade−1.100−2.972 ***
lnfdi−3.121 ***−5.676 ***
lngovex−1.434−3.907 ***
lndcps−0.952−3.193 ***
Note: Critical values (Pesaran, 2007): 1% = −2.57, 5% = −2.33, 10% = −2.21. **, *** indicate rejection at 5%, 1%.
Table 10. Westerlund (2007) ECM Cointegration Test.
StatisticValueZ-Valuep-ValueBootstrap p-Value
Gt−2.179−4.0600.0000.000 ***
Ga−15.076−4.9780.0000.000 ***
Pt−11.111−11.1110.0000.000 ***
Pa−15.076−15.0760.0000.000 ***
Note: H0: No cointegration. Bootstrap p-values (1000 replications). *** denotes rejection at 1%.
Table 11. CS-ARDL Estimation Results.
VariableLong-Run Coef.t-Statp-ValueShort-Run Coef.p-Value
ECT(−1)−0.150 ***−3.380.000--
IQ_index0.648 ***2.800.0050.0080.250
lnbusreg1.238 ***3.100.0020.085 ***0.000
lncpi0.413 *1.700.091−0.0070.120
lntrade0.108 ***2.650.0080.107 ***0.000
lnfdi−0.265−1.440.1520.0020.186
lngovex0.235 ***2.850.005−0.286 ***0.000
lndcps−0.372 ***−2.620.009−0.176 ***0.000
Note: *, *** denote significance at 10%, 1%. CS-ARDL(1,1) with cross-sectional averages.
Table 12. AMG and CCEMG Long-Run Estimates.
VariableAMG Coef.t-Statp-ValueCCEMG Coef.t-Statp-Value
IQ_index0.612 **2.670.0080.575 **2.210.027
lnbusreg1.105 ***2.940.0030.982 ***2.580.010
lncpi0.368 *1.660.0970.341 *1.710.087
lntrade0.126 **2.480.0130.118 **2.360.018
lnfdi−0.231−1.390.164−0.248−1.510.131
lngovex0.208 **2.540.0110.194 **2.310.021
lndcps−0.344 **−2.470.014−0.318 **−2.290.022
Note: *, **, *** denote significance at 10%, 5%, and 1% levels, respectively.
Table 13. Method of Moments Quantile Regression (MMQR) Results.
VariableQ10Q25Q50Q75Q90
IQ_index0.035 *0.0210.0140.006−0.004
lnbusreg0.082 **0.086 ***0.087 ***0.089 ***0.091 ***
lncpi0.0000.018 ***0.026 ***0.036 ***0.049 ***
lntrade0.387 ***0.219 ***0.147 **0.056−0.062
lnfdi−0.020 ***−0.010 **−0.0050.0000.007
lngovex−0.300 ***−0.0470.0620.198 ***0.376 ***
lndcps−0.077−0.188 ***−0.236 ***−0.296 ***−0.374 ***
Note: *, **, *** denote significance at 10%, 5%, and 1% levels, respectively. Bootstrap standard errors (200 replications).
Disclaimer/Publisher’s Note: The statements, opinions and data contained in all publications are solely those of the individual author(s) and contributor(s) and not of MDPI and/or the editor(s). MDPI and/or the editor(s) disclaim responsibility for any injury to people or property resulting from any ideas, methods, instructions or products referred to in the content.