


Abstract
Demographic ageing, a topic that is intensively addressed in the scientific literature, significantly influences the functioning of economic systems. Demographic ageing directly impacts the labour supply, productivity, savings, investments and the sustainability of public finances through pressure on pension and health systems. However, the efforts of ageing societies to transform and adapt to this demographic challenge through economic restructuring and innovation are recognized. Starting from the growing interest shown in the link between the demographic transformation of a society and the economic impact, the study carries out a bibliometric analysis on a dataset of 934 documents included in the OpenAlex platform, selected by filtering scientific publications according to a set of predefined criteria. The analysis of thematic clusters, co-authorship and bibliographic coupling reveals an increase in interdisciplinary research and a shift in emphasis from classical macroeconomic effects on the labour market and the financial system towards multidimensional transformations of the economic and social system, in which demographic transformation is no longer just a constraint but also a challenge towards progress through the integration of digitalization, automation and transition to AI-based economic systems to support economic development.
1. Introduction
Demographic and economic developments are two phenomena that condition each other. On the one hand, the population of a country represents the main source from which the labour market of that country is sustained. Demographic variables such as birth and fertility rates, mortality, life expectancy and migration determine the change in the number and structure of the population by age groups, which is then transmitted to the size and composition of the labour force.
Demographic ageing is the process of increasing the share of the elderly population within the total population of a country. This process influences economic growth through several channels.
The most important channel is the reduction in the active labour force, which can reduce the potential for GDP growth and negatively influence labour productivity. However, there are different opinions regarding the effect of demographic ageing on productivity, with some economists arguing that countries affected by demographic ageing are encouraged to replace human labour with capital and automation and to transform this disadvantage into a path to progress.
Another effect of demographic ageing is transmitted through the negative change in the attitude of an ageing society towards saving, having as a potential effect a decrease in investment, affecting capital formation and the possibilities of long-term economic growth.
A society with a low ratio of active population to elderly faces difficulties in managing the pension system, while medical and care expenses are growing sharply. The pressure on the public budget can lead to a large budget deficit, an increase in public debt and the use of budgetary resources for social spending to the detriment of productive investments that would have generated economic growth.
The economy of a country affected by the phenomenon of demographic ageing is subject to sectoral restructuring, as a result of changes in the structure of aggregate demand: consumption needs change, the demand for medical, social, assistance and care services increases, and the demand for certain types of services and durable goods decreases.
On the other hand, the level of economic development has an impact on fertility rates, but is negatively correlated, as the phenomenon known as the demographic–economic paradox reflects the tendency of more economically developed regions to face lower birth rates, population decline and ageing.
In characterizing a country’s level of development, economic growth is a key indicator, which is reflected by the standard of living of households through the level of income obtained, the level of education, the incidence of unemployment, employment opportunities, consumption and saving decisions.
Thus, demographic changes recorded by a country’s population have a boomerang effect, influencing the level of economic development and being, in turn, influenced by it. A schematic representation of these effects (Figure 1) could be presented as follows:
Figure 1.
The interdependence of demographic change–economic growth. Source: own processing.
The scientific literature highlights that the relationship between demographic ageing and economic growth is bidirectional and dynamic, often being analysed through the lens of cumulative self-reinforcing mechanisms, which can generate either vicious cycles of stagnation or virtuous cycles of adaptation and sustained growth.
Demographic ageing changes the age structure of the population, increasing the share of elderly people and reducing the proportion of the active population. This change directly affects labour force participation, the saving rate, the consumption structure and the pressure on public systems (pensions, health), as shown by the analysis of demographic channels on economic growth carried out by Bloom et al. (2010) and by Lee and Shin (2021). To the extent that an older population reduces the labour force and growth potential, the economy may enter a cumulative process: slower economic growth reduces investment in physical and human capital, which reduces productivity, limiting the resources available for demographic adjustment (Maestas et al., 2023). This is the core of a possible vicious cycle.
However, the same demographic change can also trigger a virtuous cycle, depending on institutional and technological responses. The reduction in labour supply can stimulate investments in automation and technological capital, increasing productivity per worker—a mechanism explicitly analysed by Acemoglu and Restrepo (2017), who show that ageing can accelerate the adoption of automation technologies and neutralize the potential negative effects of demographic shift on economic growth. Demographic changes can contribute positively to economic growth through endogenous mechanisms. Thus, population ageing puts pressure on innovation and efficiency, stimulating productivity growth, with an impact on revenue growth and implicitly increasing fiscal resources, which determines macroeconomic stability, creating a positive feedback loop.
The interdependence manifests itself in a dynamic form: demography influences fundamental economic variables (labour, capital, productivity, public finances), and economic performance in turn influences demographic behaviours and institutional adaptive capacity.
In essence, ageing does not automatically produce decline or prosperity; it creates a structural shock that can activate cumulative mechanisms. The “self-reinforcing” nature of these mechanisms explains why some ageing economies experience persistent stagnation, while others manage to transform demographic constraint into a stimulus for innovation and growth.
The present study is a response to the formulation of four research questions that are addressed throughout the paper:
- RQ1. What are the implications of the link between demographic ageing and economic growth on other research areas, derived from the specialized literature?
- RQ2. What are the core research themes explored, what are the emerging themes, and what have their evolution dynamics been over time?
- RQ3. Who are the most influential authors in the field according to the number of citations, and what has their research been oriented towards?
- RQ4. What future research directions can be deduced based on the bibliometric analysis conducted?
In order to obtain answers to the research questions, the research was conducted as follows: in the first stage, an investigation of the specialized literature was carried out, addressing the connection between the demographic transformation of a society and the economic impact, in order to record the various opinions related to the transmission channels of the two phenomena; the Methodology section presents the method of selecting the set of documents on the basis of which the bibliometric analysis will be carried out; the Results section describes the characteristics of the selected scientific output; subsequently, the Bibliometric Mapping section offers the visualization of similarity maps and the interpretation of co-occurrence, co-authorship and bibliographic coupling that outlines the characteristics, links, structure and evolution over time of the analysed field; finally, the Conclusions section summarizes the main findings obtained during the study, regarding the interaction mechanism of the studied phenomena, the interdisciplinary nature of the approach, the benefits for the scientific community and for policymakers, limitations of the study and future research directions.
2. Literature Review
The study of the scientific literature that links economic developments to population dynamics has returned a generous number of publications, covering different themes and research directions. After studying and filtering the ideas contained, several perspectives on the link between demographic ageing and its impact on economic dynamics could be derived.
In the case of developing countries, the indicator of population ageing, measured by the old-age demographic ratio, was identified as having a negative impact on economic growth (Saeed et al., 2023).
From another perspective, demographic dividend is the situation in which a change in the age structure of a country’s population, determined by the decrease in fertility and mortality rates, leads to economic growth (Liu & McKibbin, 2020), but this process is not automatic, relying on appropriate policies of the government (Han, 2019; Rallapalli & Khandelwal, 2025).
Declining fertility and international migration are two of the main channels influencing the demographic transition process. For the destination country, migration can be a solution to address labour market deficits and stimulate economic growth (Morozov et al., 2024; Litră, 2025).
Some of the literature focuses on the financial effects of an ageing population on the economy. Government spending on healthcare increases in the context of an ageing population (OECD, 2023). The increasing incidence of chronic diseases and disabilities that characterize the third age puts pressure on public resources (Mos & Reckers-Droog, 2024). In the specialized literature, a component of health economics is dedicated to the application to geriatrics, and new pressures are added to the challenges of population ageing, such as the way in which future generations tend to have much higher expectations for choice and responsiveness in the provisions of health and aged care services comparative to previous generations (Ratcliffe et al., 2012).
Another aspect of the impact of demographic ageing addressed in the specialized literature refers to the consequences of the increase in the share of elderly people in the electorate, exerting influence not only on the structure of public spending but also on macroeconomic priorities. Vlandas (2017) shows that societies with a higher proportion of elderly voters tend to adopt policies more oriented towards price stability. They motivate this attitude through material interest: elderly people are, on average, less exposed to the risk of unemployment (being already withdrawn from the labour market) and more dependent on fixed incomes—public pensions or private savings—whose real value is eroded by inflation. As older people manifest a greater aversion to inflation and are more politically powerful, they can generate electoral pressures to maintain lower inflation.
In the same direction, Barilari et al. (2025) highlight that population ageing changes the content of political agenda, increasing the importance of issues associated with retirement policies. Due to demographic change, the elderly population represents the majority within the voter population, to which increasing participation in voting among older age groups is added. Thus, the demographic shift determines the prioritization of social and economic policies dedicated to seniors, who represent the majority of voters.
Following the same reasoning, Vallée-Dubois (2023) shows that preferences for public spending and budgetary priorities vary systematically over the life cycle. The results suggest that older people are more inclined to support policies that protect the status quo and less willing to support government spending when this involves inflationary risks. Overall, these findings converge towards the idea that demographic ageing generates a reconfiguration of macroeconomic priorities, favouring more conservative governments or policies, for which combating inflation becomes a priority objective in relation to reducing unemployment.
As the population structure changes, the generations containing fewer younger people entering the labour market will have to support a larger older population, so, in turn, the elderly dependency ratio will increase. The shrinking working-age population has effects on revenue collection, by reducing the taxpayer base, generating pressure on the state budget and the pension system (Milijić et al., 2025; Litra, 2014).
Furthermore, these amounts, which are used as expenses, reduce state funds that could have been directed towards productive investments, so the impact is not only short-term, but it may also reflect on the future productive potential (Jäger & Schmidt, 2016) if policy measures only adjust tax rates and the composition of state spending but do not adjust the retirement age (Gonzalez-Eiras & Niepelt, 2012).
The impact on the financial market in the case of an ageing population is significant. Financial market characteristics will change as older people become more conservative and prefer safer investments. The decline of the savings rate as the population is ageing has been noticed in advanced economies (Takefumi, 2025; Pascual-Saez et al., 2020). In the short term, population ageing may increase the saving rates, but in the long term, the effect of increasing the proportion of the elderly population is expected to reduce the saving rate (Kim et al., 2024), affecting the future volume of investment (Horioka, 2010), because aggregate saving follows the path highlighted by Modigliani and Brumberg (1954)—individuals tend to save during the active period and spend their savings in retirement.
In terms of production, the effects of population ageing determine changes in the number and structure of the population by age group. These changes are transmitted to the labour force size and composition, with effects on labour market dynamics, human capital accumulation, innovation and productivity (Ibey et al., 2025). An ageing population affects the labour market by diminishing labour supply, rising labour costs and decreasing labour efficiency (Chen & Wang, 2025). The phenomenon of population ageing is positively correlated with the velocity of corporate capital structure adjustments (H. Wang & Chen, 2024). Population ageing leads to labour scarcity, but labour market rigidity does not automatically imply the suppression of firm innovation. On the contrary, in response to demographic change, firms are motivated to adapt their strategies to foster innovation (Tan et al., 2022). Demographic ageing is considered to significantly hinder industrial structure upgrading (Ma et al., 2023; Hu et al., 2024), but it accelerates the shift to high-value-added sectors, to the detriment of intensive sectors (Zhou, 2025).
Studies analysing the economic impact of ageing argue that wage growth would have been higher if the labour market had not been confronted with an ageing workforce. Although wages generally increase with age, this occurs at a decreasing rate and stays roughly flat above age 55, mainly because the elderly invest much less in continued education and are less inclined to switch to better-paying jobs (Economic Outlook, 2018).
The production of goods and services will also undergo changes as a result of the change in the consumption structure and, therefore, the change in the demand for goods and services, given that consumption preferences change with age (Šantic, 2024; Li & Zheng, 2025; Zbuchea et al., 2021). The aggregate consumption is expected to decline in an ageing society, as the income of the older age groups is usually lower than that of the middle-aged, and there is also a redistribution of the assigned consumption basket amounts observed (Stoever, 2012; Y. Wang et al., 2022).
Innovation can slow down in ageing societies, because the age structure influences entrepreneurial dynamism. Thus, when economic growth is driven by the discovery of new ideas and human resources are important in generating idea production, population decline will determine a stagnation in the standard of living (Strulik, 2024).
Population ageing also leads to changes in the degree of urbanization through the depopulation of some areas and consequently the modification of economic activity in those areas (Kroll & Haase, 2010). Higher urbanization is found to mitigate the adverse effect of ageing on productivity (Sha et al., 2025). Regional disparities characterize most European countries, being, among other things, a result of regional population ageing and depopulation, and one of the key development challenges is to strategically articulate regional policy measures to adjust the functioning of these regions to adverse demographic changes and to improve regional development potential (Heffner et al., 2019).
The change in population structure is not only accompanied by negative effects, but it can also lead to positive ones. In an ageing society, firms will try to compensate for the shortage of workers by adopting automation and innovation to a greater extent, with effects on the growth of capital productivity (Basso & Jimeno, 2021). Thus, the pace of productivity growth becomes an opportunity for ageing societies, as economies with high productivity can face the negative effects of an ageing workforce. Moreover, technology-based economies prove to be more resilient to ageing than those dependent on manual labour (Park et al., 2022; Yang et al., 2025).
Although an older workforce is generally associated with lower productivity and rising labour costs, it holds a capital in knowledge, skills, and experience that can prove to be a driver for productivity (Allen, 2023), if there is commitment to using it, and adequate support.
However, the generalized phenomenon of demographic ageing that characterizes both developed and developing countries in recent decades can be mitigated with the help of coherent support measures and policies in the most affected areas (Nagarajan & Sixsmith, 2021).
Continuous training and maintaining of the elderly workforce in an active form can counteract the decrease in the efficiency of using this resource (Ranasinghe et al., 2024; Wong & Tetrick, 2017; Kotschy & Bloom, 2023). Economies with higher participation of the elderly in the labour market (through policies to stimulate active life) experience the effect of demographic ageing less.
The transition to economic models based on AI and automation represents a response strategy of ageing societies, with the aim of enhancing elderly care and addressing workforce shifts (Sawik et al., 2023; Wirtz et al., 2025; Cortellessa et al., 2021).
One way to fill the labour shortage comes from international migration, but the effects are controversial, depending on the degree of integration of migrants (De Coninck & Solano, 2023; Marois et al., 2019).
At the state level, the mix of public policies adopted can make the difference between recording negative effects or transforming this reality into a source of economic growth (Oliver, 2015). Economists talk about the concept of “silver economy” in terms of development opportunities that would support the transformation of a society’s actions in supporting the active, professional involvement of elderly people, meeting seniors’ needs, and using innovation and progress to increase their quality of life (Heffner et al., 2019; Couceiro & Dias, 2017). Among the top priorities of the EU policy agenda regarding active and healthy ageing are: better health and independent living for elderly citizens, sustainable health systems and a competitive market of innovative products responding to elderly needs (Dimitrova, 2013).
As in the case of transformations of any kind, demographic ageing also brings risks and uncertainties, which require the economic system to demonstrate its ability to withstand, adapt to, and recover by minimizing losses and providing long-term sustainability. The concept of economic resilience refers to the set of measures and policies through which a society develops its capacity to anticipate, absorb and adapt to demographic change through strategic planning and human capital investment (Gailey et al., 2025). Ensuring economic resilience in the context of population ageing includes actively developing human resources for the elderly, strengthening the supporting role of digital inclusive finance, and optimizing the regulatory direction of the development strategy (Cai et al., 2025).
In the very long term, some studies support the idea of economic stabilization even in the presence of demographic ageing, as a result of achieving a technological and demographic balance (Prettner, 2012; Tangpatthamachart & Amornkitvikai, 2025).
3. Methodology
In order to collect the specialized literature to be analysed on the proposed topic, a multi-stage sorting in the OpenAlex platform was performed, which returned a satisfactory number of publications, with good connectivity to the research topic.
OpenAlex is a bibliographic catalogue of scientific papers, authors and institutions accessible in open access mode, operated since January 2022 by OurResearch, as a successor to the terminated Microsoft Academic Graph. At the time of extracting the list of publications, the database held a total of 271.2 million publications, covering a publication period between 1832 and 2025, of which 28.8% were publications accessible in open access mode.
The following filters were applied to sort the relevant publications: the research topic was first filtered through the keywords: “demographic”, “ageing”, “economic”, and “growth” in the work title and abstract, which reduced the number of results generated to 1104, of which 45.3% were open-access. In this paper, the form “ageing” is consistently used, corresponding to the British spelling. This methodological option reflects the alignment with European academic standards and the terminology devoted to the specialized literature on demographic ageing, where concepts such as “population ageing”, “active ageing” and “healthy ageing” are predominantly used, including in documents and reports of relevant international organizations in the field, such as the European Commission, the World Health Organization and the United Nations.
Subsequently, the publication type filter was applied, keeping only the publications of the type: “article”, “book-chapter”, “preprint” and “book”, with a total of 981 publications, eliminating those of the type “dissertation”, “editorial”, “review”, etc. In a final step, the publication year filter was applied, choosing the period of 2000–2025, for two reasons. One of the reasons is that of identifying the interval with consistent publication production (in the years prior to this period, the annual number of publications on the searched topic was only a few units), and the second reason was the fact that prior to the year 2000, there were also some years with no publications on the analysed topic, which generated errors in the subsequent processing of the data. Finally, the sorting returned a total of 934 scientific publications.
4. Results
4.1. Description of the Analysed Scientific Literature Dataset
4.1.1. Document Types and Structure of the Analysed Dataset
As stated before, searching and filtering in the OpenAlex database of publications by the type article/book/book chapter/preprint, written in English and published in the interval 2000–2025, using the keywords “demographic”, “ageing”, “economic”, and “growth”, generated a final number of 934 publications (of which 503 were open access publications, i.e., 53.9%), their structure (Figure 2) being detailed below:
Figure 2.
Structure of publications by type: article/book-chapter/preprint/book. Source: own processing using OpenAlex stats.
4.1.2. Annual Evolution of the Analysed Dataset
The evolution of the number of publications in the analysed interval (Figure 3) is relevant to the intensification of concerns in the area of interdependence between demographic ageing and economic growth. The average annual number of publications multiplies 4–6 times towards the end of the interval, compared to its beginning, and the value of 29 publications for the year 2025 only partially reflects the production of the year, as this data was collected a few months before the end of 2025. However, the partial production of the year 2025 was important to be included in the analysis, reflecting the latest concerns of researchers in this field.
Figure 3.
Annual evolution of the number of publications, 2000–2025. * 2025—partial data. Source: own processing using OpenAlex stats.
4.1.3. Topic Distribution Within the Analysed Dataset
Studying the most frequent primary topics highlighted in OpenAlex stats provided by the platform after creating the publication list reveals interesting information.
In relation to the primary topic of the paper, the 934 papers were allocated into 200 categories. A polarization of publications towards a smaller number of topics is observed, which reflects more intense concerns about the incidence of the phenomena studied in these areas (Figure 4). A total of 16 topics recorded an output of over 10 papers each. A total of 123 papers belong to the field of Global Healthcare Issues, and 63 are part of the Economic Growth and Productivity topic. With high values, but below the threshold of 50 papers, the sections Insurance, Mortality, Demography, Risk Management (47), Regional Development and Policy (43), Migration and Labour Dynamics (40), Retirement, Disability and Employment (30) are also highlighted.
Figure 4.
Publication count depending on the primary topic. Source: own processing using OpenAlex stats.
For a total of 184 topics, the frequency of appearance of the papers was low, below 10 papers/topic, but the information provided by them is valuable. Starting from the initial phenomena that formed the basis of the study, demographic ageing and economic growth, many of the addressed topics crossed the socio-economic boundary of the topic, proving interest in areas weakly or not at all connected to it, such as: Technological Innovation; Coastal and Marine Management; Urban and Rural Development Challenges; Smart Cities and Technologies; Climate Change and Health Impacts; Disaster Management and Resilience; Work–Family Balance Challenges; Transportation Planning and Optimization; Youth Education and Societal Dynamics; Technology Use by Older Adults; Migration, Refugees, and Integration; Mining and Resource Management; Energy, Environment, and Transportation Policies; etc.
4.2. Citation Metrics Analysis Using Publish or Perish
For a detailed citation metrics report of the selection of publications included in the research, Harzing’s Publish or Perish program (Windows GUI Edition, version 8.18.5252.9447) was used (Harzing, 2007). For compliance, the search for the sample of articles was done from the program using the OpenAlex search option, with the same filters applied to keywords and year of publication. However, since the Publish or Perish program does not also offer the method of filtering by publication type, it returned a production of 1000 publications (this being the maximum processing for this platform), which contained both the publications resulting from the query of the OpenAlex database, as well as other publications of other types. In order to retain only the 934 publications out of the 1000, a manual sorting was performed by the author, with the additional ones being identified and then eliminated.
According to Harzing’s Publish or Perish report (Table 1), for the 934 papers included in the analysis, which covers a period of 25 years (2000–2025), the total, cumulative number of citations recorded up to the date of the report generation (15 November 2025) was 12,033 citations, with an average of 12.88 citations per paper and an average of 481.32 citations per year.
Table 1.
Citation metrics generated by Harzing’s Publish or Perish report by processing the sample of 934 documents collected from the OpenAlex platform.
The average citation indicator for each author was calculated—7600.88 cites/author (calculated in the first stage as the normalized per-author citation for each paper, by dividing the citation count of the paper to the number of authors of that paper; in the second stage, the normalized citation counts are then summed across all papers to give the number of citations per author for the entire batch of papers analysed). Similarly, the papers/author indicator, 606.61, was obtained as a sum of the normalized author counts across all papers, after the normalized author count for each paper was calculated as 1/author count).
The average number of authors per paper (calculated as the sum of the number of authors across all papers, divided by the total number of papers) is 2.15.
The h-index (the Hirsch index) is 49, meaning that 49 of the papers included in the analysis had 49 or more citations, the rest of up to 934 having a citation number lower than 49. Egghe’s g-index (Egghe, 2006) (calculated as the largest number of articles, ranked in decreasing order of the number of received citations that the top g articles received together at least g2 citations) is 95.
The normalized individual h-index (hI, norm), having a value of 36, is calculated as the h-index of the normalized citation counts—the number of citations for each paper divided by the number of authors of that paper.
The individual average annual increase in the h-index (hI, annual) (Harzing et al., 2014; Harzing’s Publish or Perish, n.d.) is 1.44.
The hA-index (Fassin, 2020) divides the citation number of each paper by the age of the paper before ranking them and calculates the hA-index as the largest number of papers in the dataset that have recorded at least hA citations per year on average. Its value across the set of 934 analysed publications is 14.
The last indicator calculates the annual citation count as the ratio between the number of citations and years since publication. Thus, in the sample of 934 papers, eight of them registered an annual average of citations greater than or equal to 20, and 22 of them registered an annual average of citations greater than or equal to 10 (of which eight had an annual average of citations greater than or equal to 20, and the remaining 14 had an annual average of citations between 10 and 19). A total of 234 papers had an average annual number of at least one citation per year, without reaching the threshold of two average annual citations.
4.3. Top 10 Most Influential Documents by Citation Count
After sorting the publications by the number of citations recorded, the 10 most cited books (Table 2) and the 10 most cited articles (Table 3) were selected and presented in the tables below. Most of the publications with a high number of citations were published in the first years of the analysed interval, recent publications being disadvantaged from this point of view, which may prove very good citation potential in the following years. However, publications with the maximum number of citations can be considered as reference points, as long as the accumulation of a number of several hundred citations can be an attribute that only a publication that has generated strong interest can possess.
Table 2.
Top 10 books by number of citations.
Table 3.
TOP 10 articles by number of citations.
The topics addressed by the 10 most cited articles (Table 3) cover a diverse range from the demographic domain (low fertility issues, demographic transition, replacement migration), the medical domain (management of diseases associated with ageing, global health, global burden of disease), the economic domain (productivity, earnings, fiscal system, pension system, development) or the political domain (democracy, public sector, political decisions).
Lutz et al. (2008) describe a three-component self-reinforcing mechanism that would determine a downward spiral in fertility rate in the future in countries that already experience low fertility and which could strengthen the motivation of governments to take action in order to counter the negative effects of low fertility. The three components that enact and maintain the fertility decline can be summarized as: the demographic component that is manifested by negative population growth in the present, which determines fewer births in the future; the sociological component that comes from the tendency of future cohorts to perpetuate the ideal family size observed in previous cohorts; and the economic component that is explained by higher aspirations of young people, on the background of lower expected income.
Boix (2001) introduces a model that describes the mechanisms by which economic modernization leads to the growth of the public sector, one of these mechanisms being determined by the degree of demographic ageing that attracts higher demands for transfers in the form of unemployment benefits, health insurance and pensions.
An analysis of the challenges and threats in the case of countries with various levels of economic development and different patterns of population trends is carried out by Ezeh et al. (2012), identifying adverse social, economic, and environmental pressures in the case of the countries with rapid economic growth; on the opposite side, states with low or negative growth face rapid population ageing and unsustainable burdens on public pensions and healthcare systems.
A long-term comprehensive analysis of the challenges that Australia will face in the next decades, against the background of an ageing and growing population, is carried out by Swan (2010), referring to long-term demographic and economic projections; budget projections; ageing pressures and spending in health, aged care, pensions, education and training; climate change and the environment; and wellbeing and sustainability.
Reher (2004) analyses the similarities and disparities in the demographic transition process throughout the world, noting the quasi-general causality between fertility decline and mortality decline, but with the specific characteristic of the recent transitions to develop a more rapid demographic ageing dynamic, which calls into question the capacity of affected societies to economically and socially respond and adapt to this challenge.
A medical approach to the issue of demographic ageing is provided by Eastell (2017), who highlights osteoporosis as a condition whose incidence is increasing as a result of global demographic changes. Prevention and management strategies have not only a medical role, reducing individual fracture risks, but also limiting the associated socio-economic impact, as a consequence of the financial pressure on health systems and the increasing needs for assistance for the elderly as a result of their loss of functional independence.
A mapping of global health problems over a period of a quarter of a century and their projection to the year 2030 is carried out by Reddy (2016). The increase in the incidence of diseases and disabilities associated with demographic changes is highlighted, with implications for resource allocation, social policies, and the need for preventive and support measures to manage the socio-economic implications derived from them.
Analysing how demographic change influences economic sustainability in the particular case of Austria, Mahlberg et al. (2013) take into account the productivity indicator in relation to the age structure of the employees and the wages. The results obtained reject the negative relationship between firm productivity and share of older employees, instead determining that the share of young employees is negatively related to labour productivity.
Even though Coleman (2002) supports the idea that international young migration can fill the labour shortage of the destination country and can protect society from the economic effects of an ageing population, he still remains one of the voices who believes that migration does not reverse this demographic trend but can only prevent population ageing at unprecedented, unsustainable and increasing levels.
Cremer and Pestieau (2000) analyse the crisis of pension systems and address the role of demographic, economic or political factors in their sustainability. Even though population ageing and pay-as-you-go financing are most often cited as being at the root of the problems of pension systems, the authors argue that in reality, political decisions (through the type of reforms applied, the level of taxation or spending) play a more important role than demographic factors in managing the crisis.
5. Bibliometric Mapping and Interpretation Using VOSviewer
The VOS (visualization of similarities) method was implemented in 2007, with the aim of providing a low-dimensional visualization in which objects’ locations and the distance between any pair of objects provide information on their similarity (Van Eck & Waltman, 2007). The authors of this method then developed the VOSviewer program, a software tool used in constructing and visualizing bibliometric networks, in the form of maps that reflect the similarities between authors, papers, sources and keywords.
The output generated by the VOSviewer software is embodied in network and density maps that allow the graphical representation of relationships that would otherwise be difficult to interpret by just structuring the data in tables alone; the visualization of these maps facilitates the understanding of the connections and interactions between items. In the present study, the software was used to generate maps with the aim of identifying co-authorship between authors, organizations, and countries, with the aim of identifying bibliographic coupling (documents/sources/authors/countries) as an indicator of the similarity between two documents (or sources/authors/countries) from the perspective of the number of references that they both share, especially the co-occurrence of concepts map, which allows the identification of domains that are related to each other by visualizing the frequency of appearance of the key concepts.
5.1. Co-Occurrence of the Keywords in the Analysis of Scientific Output
The most eloquent representation of the relationships between the keywords used in the list of scientific papers is the co-occurrence of concepts map. Starting from the initial keywords, a sample of 934 publications was created whose themes fall under the common core of demographic ageing and the impact on economic growth. The processing of this sample with the VOSviewer software (version 1.6.20) generated a map of words extracted from titles, abstracts or keywords whose visualization allows the identification of areas of interest, the frequency of use and the links between them.
A threshold of five was used for the minimum number of occurrences of a keyword, in order for the analysis to return the most significant results. Thus, out of the 1190 keywords identified, 295 corresponded to this criterion. The map obtained (Figure 5) groups the keywords into 10 clusters, which will be detailed below. In total, 14,144 links between clusters were recorded, with a TLS indicator of 96,243.
Figure 5.
Co-occurrence of the concepts map—network visualization. Source: own processing using VOSviewer software.
Each circle on the map is detailed by a term that was associated with the keywords on the basis of which the publication sorting algorithm was developed to obtain the publication sample, as detailed at the beginning of this study. The terms that correspond to large circles, which are also written in large font, are those that appear most often: economics, sociology, geography, medicine, environmental health, gerontology, politics, population growth, labour economics, fertility, human capital, socio-economics, economic policies, public finance, projections of population growth, etc. The representation of all these terms builds the complex image of the multiple fields for which the relationship between demographic ageing and economic growth has represented a topic of interest.
In addition to the size of the circles, the lines connecting the terms reflect, by their thickness, the frequency of simultaneous occurrence of the terms in the same articles. The VOSviewer software algorithm (VOS mapping) allocates the nodes on the map in a closer position when the links are stronger, or distributes them peripherally when the connections are weaker. Closer terms are more strongly connected, and more distant terms appear less often together in the studies analysed. In the centre of the map, more general and interdisciplinary terms appear, connecting adjacent fields and, towards the outside, the terms characterize more specific research directions.
Relevant for the diversity, thematic dispersion, and also the frequency of occurrence of specific concepts in these fields alongside the keywords of the study, the cluster analysis offers the possibility of investigating the fields that address, against the background of the field-specific research theme, the issues of demographic ageing and economic growth. Although the following table (Table 4) summarizes only some of the terms, it helps to outline a picture of the various fields in which the change in the population structure by age groups and economic developments have represented, in the context of specialized research themes from different fields, a centre of interest.
Table 4.
The main clusters, frequent keywords and occurrences.
Using a threshold of five occurrences of a keyword implies that keywords with at least five occurrences will be visible in the generated map, while keywords with a number of occurrences below the threshold will be ignored. A higher threshold returns an airier map, with a stronger highlighting of frequently used terms and the links between them. In contrast, the advantage of a lower threshold is to display less frequently used terms, reflecting more distant domains, poorly connected to those studied, but which have proven research interest in the analysed issue. This is the case of peripherally located terms, symbolized by small nodes, but which highlight an interesting thematic diversity, scientifically approached in relation to the studied domain: biochemistry, neuroscience, optics, ophthalmology, geology, agriculture, urban planning, human settlement, diversity, mental health, public policy, active ageing, etc.
In overlay visualization (Figure 6), the colours are no longer assigned according to the thematic cluster, as in the case of network visualization. The colour is a numerical attribute that is assigned in relation to the Average Publication Year indicator. The terms in cold colours (blue) are the terms that appeared earlier, at the beginning of the analysed interval; the terms in green are in the middle of the interval, and those in yellow are new in the literature. The colour transition reflects the conceptual evolution of the field. The map obtained reflects the degree of novelty or, conversely, oldness in the approach of a theme. But behind these colour tones, the most profound explanation lies in the way in which concerns related to demographic ageing and its economic impact are taken up in diverse themes, reflecting the incidence of these socio-economic phenomena on multiple levels.
Figure 6.
Co-occurrence of the concepts map—overlay visualization. Source: own processing using VOSviewer software.
The association between the analysed terms (demographic ageing; economic growth) and terms from the following fields appears with the greatest degree of novelty: medical terms (public health, pathology, disease, disease burden, infectious disease, coronavirus disease 2019, etc.); terms from the field of sociology (socio-economic status, diversity, psychological resilience, demographic profile, prosperity, dividend, inequality, quality); engineering terms (urban planning, environmental planning, urbanization); economic terms (inflation, macroeconomics, capitalism, financial system, economic stagnation, working life, diversification/marketing strategy).
5.2. Co-Authorship Maps—Visualization and Interpretation
By processing the database of scientific publications to generate the map that analyses co-authorship, the VOSviewer software identified 1760 authors, selecting a maximum of 1000, but in the end, the largest set of connected items was established at 24 authors.
As can be seen in Figure 7, three main clusters of authors were identified, the clustering taking into account the degree of collaboration between authors. The centrally located and denser cluster, coloured in red, brings together the most productive and connective authors, who collaborated the most. Collaboration was more intense for authors located closer, and each line connecting two authors represents at least one collaboration between them. The blue and green clusters include authors who did not collaborate significantly with each other, but collaborated with authors in the red cluster, and most likely carried out interdisciplinary research. For the weights of the nodes, the option of viewing the number of citations was used, so that the authors in the clusters located at the extreme were also the most cited (with a value of 120–130 citations for each author in the green cluster, respectively 100–111 for those in the blue cluster).
Figure 7.
Co-authorship map. Source: own processing using VOSviewer software.
The map of international collaboration between authors (Figure 8) reveals how the scientific output of the research topic is a result of the collaboration between researchers from different countries. Fifty-four countries with significant connections were identified, grouped into 12 clusters. The allocation of countries into clusters reflects the group of countries that have collaborated intensively in a specific scientific research area.
Figure 8.
Co-authorship between countries map. Source: own processing using VOSviewer software.
The number of documents option was chosen for visualization, so that the size of each node is relevant to the size of the scientific output. The thickness and number of lines reflect the intensity of international collaboration, and the central arrangement is relevant for better connectivity. For visualization at an acceptable scale, the map has been enlarged, so that it does not include, in the current format, two more distant clusters, connected to the United States: a cluster that includes the countries Romania, Croatia, Hungary and Bosnia–Herzegovina, and another cluster that includes the countries South Africa, Ecuador and Lebanon.
Cluster 1 (red): India, Poland and Russia (with the same number of documents, the highest one among the countries from this cluster: 25); Czechia; Estonia; Finland; Iran; Slovakia; Ukraine; Vietnam.
Cluster 2 (green): Austria (with the highest number of documents: 18); Argentina; Denmark; the Netherlands; Slovenia; Sweden; Switzerland.
Cluster 3 (blue): Australia (with the highest number of documents: 55); Japan; Malaysia; Oman; Taiwan; Thailand.
Cluster 4 (yellow): United States (with the highest number of documents: 55); Ecuador; Kenya; Lebanon; South Africa.
Cluster 5 (purple): Pakistan (with the highest number of documents: 4); Brazil; Nigeria; Rwanda.
Cluster 6 (light blue): Germany (with the highest number of documents: 31); Ghana; New Zealand; Norway.
Cluster 7 (orange): Romania (with the highest number of documents: 14); Bosnia and Herzegovina; Croatia; Hungary.
Cluster 8 (brown): United Kingdom (with the highest number of documents: 41); Lithuania; Portugal; Spain.
Cluster 9 (pink): Belgium (with the highest number of documents: 19); Hong Kong; Serbia.
Cluster 10 (beige): France (with the highest number of documents: 18); Indonesia; Singapore.
Cluster 11 (light green): Italy (with the highest number of documents: 15); Uruguay.
Cluster 12 (grey): China (with the highest number of documents: 22); Canada.
The analysis of co-authorship clusters suggests that the network structure is not random but reflects the intersection of geopolitical, institutional and funding factors. First, a significant part of the collaborations is explained by geographical proximity and regional integration. Predominantly European clusters can be correlated with joint participation in European Union funding programs (FP7, Horizon 2020, Horizon Europe). These mechanisms explicitly encourage transnational consortia, which leads to the consolidation of stable regional research networks in the field of demography and economics.
The structure of the clusters may reflect national strategies for the internationalization of research. States with high scientific production tend to seek partnerships with countries in demographic transition or in development, in order to comparatively test econometric models or to access different databases. Thus, collaboration is not only the result of proximity but also of methodological complementarity and interest in cross-country comparisons.
Some clusters are organized around global scientific poles, such as the United States, Australia, China, the United Kingdom or Germany. These countries have high research funding capacity, solid academic infrastructure and universities with international visibility, which allow them to act as “hubs” in the network. Collaborations with countries in Africa, Southeast Asia or Latin America can reflect both consolidated academic relations and cooperation policies for the development or transfer of expertise in the field of demographic or economic policies.
Another relevant factor is the similarity of demographic and economic challenges. Countries such as Japan, Italy or Germany are facing advanced levels of population ageing, which stimulates cooperation in research on the impact on productivity, the labour market or fiscal sustainability. In contrast, countries such as Pakistan, Ghana or Uruguay can approach the topic from the perspective of demographic transition and demographic dividend, which explains the emerging clusters with a lower volume of publications.
Historical, linguistic or cultural links can also be identified. Collaborations between France and Southeast Asian countries, between the United Kingdom and Eastern European or Commonwealth countries, or between Belgium and European partners can be partly explained by academic networks formed over time, doctoral mobilities and recurring institutional projects. Similarly, connections between China and Canada may reflect flows of researchers, academic mobility and bilateral agreements in the field of higher education.
Overall, the clusters identified appear to be the result of a combination of factors: (1) regional integration and joint funding programs, (2) the existence of dominant academic hubs, (3) the convergence of demographic challenges, and (4) pre-existing historical and institutional relationships. The co-authorship network thus reflects not only the scientific dynamics but also the geopolitical and economic architecture of international cooperation.
5.3. Bibliographic Coupling Analysis
The map of bibliographic coupling of the documents (Figure 9) associates the publications that share common bibliographic sources. The stronger the connection between them, the greater the number of common references.
Figure 9.
Bibliographic coupling—documents map, network visualization. Source: own processing using VOSviewer software.
Documents symbolized by large nodes, centrally located, and connected with thick lines, are those that share the most common references. A total of 335 most connected items grouped in 20 clusters were identified. The grouping into differently coloured clusters is done based on the criterion of the number of common references, delimiting groups of documents that either fall into the same sub-theme within the field, that are using the same theoretical framework, or that are affiliated to the same scientific community. The most pronounced nodes are the documents that have constituted major bibliographical landmarks for subsequent publications.
In the overlay visualization (Figure 10), using the average year of publication option, the evolution of subtopics over time can be observed, from the blue areas published around 2005 that represent reference scientific production, capitalized at the beginning of the analysed period, to the yellow points, of recent date, which have not yet had time to be capitalized very much. The yellow areas signal new lines of research, indicating emerging directions in the field. The large size of the nodes is relevant to the importance of the documents in the represented field, and the distances between them reflect the degree of bibliographic similarity and therefore align them with the same scientific approach.
Figure 10.
Bibliographic coupling—documents map, overlay visualization. Source: own processing using VOSviewer software.
The bibliographic coupling—sources map (Figure 11) indicates the connections between journals based on shared bibliographic references. Journals arranged next to each other are more closely connected in terms of the number of shared references, so that the journals represented by the largest nodes, and at the same time centrally arranged, are the basic journals of the analysed field. Journals with an interconnecting role appear between the clusters, which are interdisciplinary journals. Sources that host niche articles in the studied field or possibly relatively limited research directions addressed are positioned in the marginal areas. Some of these niche journals were excluded from the visualization when the central core was enlarged enough for an optimal visualization; however, a total of 168 connected sources were identified, out of the 494 sources that met the minimum selection conditions (a threshold of at least one document for a source and at least one citation of that source).
Figure 11.
Bibliographic coupling—sources map. Source: own processing using VOSviewer software.
Clustering (colours), node size, link thickness and distances between sources are relevant indicators of the degree to which scientific journals are closer or more differentiated thematically, with the identification of centres of influence, the groups of journals that deal with common topics, or the journals with peripheral positioning in the scientific publishing community.
The interconnections between countries in terms of bibliographic references (Figure 12) are a measure of the degree to which publications by authors from these countries cite the same works. Even if two countries have not published together, they can be strongly connected when referring to common bibliographic sources, this coupling being not a measure of international collaboration but one of similarity in the conceptual approach to the research topic.
Figure 12.
Bibliographic coupling—countries map. Source: own processing using VOSviewer software.
Since the document count option was used for visualization, the size of the node corresponding to each country is a reflection of the number of documents belonging to that country, and the connections between countries in the form of thicker or thinner lines correspond proportionally to the degree of overlap of references from the two countries. In other words, the scientific literature base corresponds more or less to both countries.
The grouping of the 32 interconnected countries into the six clusters is the result of the similarity in the specialized literature mentioned in the references, which refers to common scientific directions between the clusters, collaborations with tradition or simply belonging to a geographical area, as is the case of European countries, visibly interconnected. It is interesting to note the case of Romania, which, although in a distant position, has connections in the analysed field with 24 countries, forming a separate cluster with Croatia and Hungary.
Cluster 1 (red): 11 countries: United Kingdom, Germany, Poland, Spain, Czechia, Ukraine, Slovakia, New Zealand, Portugal, Serbia, Slovenia.
Cluster 2 (green): seven countries: Belgium, Austria, Italy, Netherlands, Switzerland, Sweden, Denmark.
Cluster 3 (blue): five countries: Australia, United States, Canada, Malaysia, Japan.
Cluster 4 (yellow): four countries: United Kingdom, Russia, China, South Africa.
Cluster 5 (purple): three countries: Romania, Croatia, Hungary.
Cluster 6 (light blue): two countries: India, France.
6. Conclusions
The study provides a comprehensive perspective on how the relationship between demographic ageing and economic growth has been addressed in the literature. With the acceleration of the ageing process globally, academic interest in the impact of this phenomenon has increased not only in intensity but also in a multidimensional approach to the aspects deriving from the demographic transformation of society.
In the first stage, the research interest focused on understanding the mechanism that explains how the functioning of modern economies is influenced by the demographic component. The increase in the share of the elderly population has effects on the labour supply, labour productivity, savings, investments, and the sustainability of public finances through the pressure exerted on the pension and health systems. Additionally, the analysis of the thematic dispersion of the scientific literature in this area reflects a progressive shift of interest from the traditional macroeconomic effects previously stated towards interdisciplinary approaches that prove the impact of social transformation on strongly delimited areas.
As the main findings of the study, the analysis identifies two important characteristics: first, the concentration of the research topics in certain conceptual clusters (economics, macroeconomics, finance, demography, sociology, development economics, geography, medicine, migration, quality of life), highlighting the areas of interest of the scientific community, which can guide future research. Secondly, the emergence of concerns related to demographic transformation and economic impact in research areas strongly dispersed compared to those analysed was identified, and their monitoring can trigger awareness of the implications that the demographic transition generates on different domains.
The interdisciplinary nature of the approach to the demographic transformation–economic development link, resulting from the diversity of topics associated with the scientific papers included in the present study, projects the incidence of the studied phenomenon beyond its demo-economic character, reflecting the increased interest in the diversity of the areas of interest. The study identified the connection between demographic ageing and economic impact in emerging topics such as: regional economic development and innovation; urban and rural development challenges; smart cities and technologies; urbanization and city planning; transportation planning and optimization; technological innovation; climate change and health impacts; disaster management and resilience; global socio-economic and cultural dynamics; work–family balance challenges; youth education and societal dynamics; gender, labour and family dynamics; intergenerational family dynamics and caregiving; technology use by older adults; ageing and gerontology research; health and wellbeing studies; migration, refugees, and integration; mining and resource management; energy, environment and transportation policies; agricultural risk and resilience; housing market and economics; global trade and economics; etc.
The bibliometric analysis carried out with the help of the VOSviewer software provides a detailed and in-depth perspective on the connection between the studied phenomena. The maps of the co-occurrence of keywords, co-authorship and bibliographic coupling highlight the main topics of interest, the connections between them and their dynamics over time. Observing the spatial distribution of publications, as well as the international collaboration of researchers, allows the identification of specific concerns, the implications manifested in other fields, and the proposed solutions. The research results can provide policymakers with a basis for awareness and understanding of the societal transformation from the perspective of the analysed phenomena, the basis on which intervention policies can be developed to prevent, correct or mitigate the effects over time.
By visualizing thematic clusters, the study contributes to the research domain by identifying strongly defined conceptual cores, delimiting emerging themes that trace recent trends of research interest and potential future development directions. The structure of the configured networks reflects the level of maturity of the domain and the intensity of interconnection between subdomains, providing information about the interdisciplinarity of the themes addressed and the transfer of information. For the scientific community, the presentation of the conceptual structure of the link between demographic transition and economic evolution, its temporal evolution, and the propagation of effects on more distant domains presents the advantage of positioning the research in relation to the existing scientific literature, highlighting connections between concepts that can lead to future interdisciplinary approaches. For policymakers, the structured analysis of scientific output in this area allows for targeted access to the synthesized information of the researched field, the construction of strategic priorities according to the dominant or emerging themes identified, and the alignment of public policies with current scientific trends.
The co-authorship maps reflect the potential for collaboration between researchers dedicated to the same field, being able to identify possible scientific research partnerships, interdisciplinary collaboration, or common interests in formulating scientific inclusion and cohesion policies. The bibliographic coupling analysis allows the visualization of research similarity based on the references used, even if the authors do not cite each other directly, identifying articles considered as a benchmark according to the number of citations, and aligning research to certain schools or currents of thought. For the scientific community, the advantage lies in facilitating collaboration between authors working on convergent issues, even if they are not yet connected. For decision-makers, it facilitates the identification of active research frontiers, useful for directing and prioritizing funding. Fundamental or emerging research groups are highlighted, and reference areas for researchers can be delimited or, conversely, insufficiently explored subtopics can be outlined.
Beyond the particular aspects of the maps, their common characteristic, compared to descriptive analysis, comes from the conversion of a large volume of data into an intuitive form, which allows for easy and fast visualization, interpretation and extraction of information, forming a bridge for dialogue between researchers and decision-makers. Thus, bibliometric analysis can prove to be both a barometer of research in the studied field and a decision-making support tool.
However, the present study also presents certain limitations. The bibliometric analysis is a result of the database used (OpenAlex platform), the criterion of the language used (English) and the chosen time period, which may lead to the exclusion from the analysed sample of the works not indexed in this platform, written in another language, or published before the chosen interval. Also, the selection of keywords adopted, the inclusion thresholds and the normalization parameters influence the composition of the generated networks. Furthermore, the study does not intend to assess the findings addressed in the analysed publications in depth but only the bibliometric relationships between them.
Future research directions can include extending the analysis by integrating multiple databases for a broader coverage of the research domain, adding keywords that can more rigorously filter the analysed literature, or complementing the quantitative analysis with qualitative methods, such as content analysis. Investigating the temporal evolution of the thematic clusters could prove relevant for understanding how research priorities are aligned over time. Comparative analyses could be conducted between different countries or development zones, in order to differentiate the way in which demographic transition and economic development are addressed in the scientific literature, the particularities of manifestation, and the possible recommendable solutions. Another research direction can consist of exploring the emerging themes identified in order to substantiate new conceptual frameworks.
In conclusion, the bidirectional connection between demographic ageing and economic transformation is certain and complex, being widely documented scientifically, but the way in which their effects propagate in society is ambivalent, numerous scientific opinions identified claiming that the change in the age structure of a society drives the adaptation of the economic system to this challenge through economic restructuring, innovation, automation and digitalization. Understanding the mechanisms by which demographic change shapes long-term economic dynamics and transforms the entire economic and social system creates the framework for substantiating public policies aimed at counteracting and mitigating risks, as well as capitalizing on the potential opportunities associated with the demographic transition.
Funding
The APC was funded by Transilvania University of Brasov.
Institutional Review Board Statement
Not applicable.
Informed Consent Statement
Not applicable.
Data Availability Statement
Available data on request.
Conflicts of Interest
The author declares no conflicts of interest.
References
- Acemoglu, D., & Restrepo, P. (2017). Secular stagnation? The effect of aging on economic growth in the age of automation. American Economic Review, 107(5), 174–179. [Google Scholar] [CrossRef] [Scilit]
- Allen, S. G. (2023). Demand for older workers: What do we know? What do we need to learn? The Journal of the Economics of Ageing, 24, 100414. [Google Scholar] [CrossRef] [Scilit]
- Barilari, F., Mastrorocco, N., & Paradisi, M. (2025). Population aging, voting, and political agendas. European Journal of Political Economy, 90, 102748. [Google Scholar] [CrossRef] [Scilit]
- Basso, H. S., & Jimeno, J. F. (2021). From secular stagnation to robocalypse? Implications of demographic and technological changes. Journal of Monetary Economics, 117, 833–847. [Google Scholar] [CrossRef] [Scilit]
- Bloom, D. E., Canning, D., & Fink, G. (2010). Implications of population ageing for economic growth. Oxford Review of Economic Policy, 26(4), 583–612. [Google Scholar] [CrossRef] [Scilit]
- Boix, C. (2001). Democracy, development, and the public sector. American Journal of Political Science, 45(1), 1. [Google Scholar] [CrossRef] [Scilit]
- Cai, D., Long, L., Cai, W., & Wang, X. (2025). Population aging, digital financial inclusion, development strategies and economic resilience. International Review of Economics & Finance, 103, 104318. [Google Scholar] [CrossRef] [Scilit]
- Chen, Y., & Wang, H. (2025). Firm perceptions of population aging and cross-regional investment decisions: Evidence from China. Finance Research Letters, 85, 107911. [Google Scholar] [CrossRef] [Scilit]
- Coleman, D. A. (2002). Replacement migration, or why everyone is going to have to live in Korea: A fable for our times from the United Nations. Philosophical Transactions of the Royal Society of London. Series B: Biological Sciences, 357(1420), 583–598. [Google Scholar] [CrossRef] [Scilit]
- Cortellessa, G., De Benedictis, R., Fracasso, F., Orlandini, A., Umbrico, A., & Cesta, A. (2021). AI and robotics to help older adults: Revisiting projects in search of lessons learned. Paladyn, Journal of Behavioral Robotics, 12(1), 356–378. [Google Scholar] [CrossRef] [Scilit]
- Couceiro, M. S., & Dias, G. N. F. (2017). Technology for the active senior. In Active ageing and physical activity (pp. 105–118). Springer. [Google Scholar] [CrossRef] [Scilit]
- Cremer, H., & Pestieau, P. (2000). Reforming our pension system: Is it a demographic, financial or political problem? European Economic Review, 44(4–6), 974–983. [Google Scholar] [CrossRef] [Scilit]
- De Coninck, D., & Solano, G. (2023). Integration policies and migrants’ labour market outcomes: A local perspective based on different regional configurations in the EU. Comparative Migration Studies, 11(1), 23. [Google Scholar] [CrossRef] [Scilit]
- Dimitrova, R. (2013). Growth in the intersection of eHealth and active and healthy ageing. Technology and Health Care, 21(2), 169–172. [Google Scholar] [CrossRef] [Scilit]
- Eastell, R. (2017). Prevention and management of osteoporosis. Medicine, 45(9), 565–569. [Google Scholar] [CrossRef] [Scilit]
- Economic Outlook. (2018). Blame the baby boomers for depressed wage growth. Economic Outlook, 42(3), 45–49. [Google Scholar] [CrossRef] [Scilit]
- Egghe, L. (2006). Theory and practice of the g-index. Scientometrics, 69(1), 131–152. [Google Scholar] [CrossRef] [Scilit]
- Ezeh, A. C., Bongaarts, J., & Mberu, B. (2012). Global population trends and policy options. The Lancet, 380(9837), 142–148. [Google Scholar] [CrossRef] [Scilit]
- Fassin, Y. (2020). The average citation ha-index. ISSI Newsletter, 16(4), 64–67. [Google Scholar]
- Gailey, N., Gagauz, O., & Pahomii, I. (2025). Demographic change and the future of resilience planning in Moldova. Economy and Sociology, 1, 5–18. [Google Scholar] [CrossRef] [Scilit]
- Gonzalez-Eiras, M., & Niepelt, D. (2012). Ageing, government budgets, retirement, and growth. Paper No. 44218. Munich Personal RePEc Archive (MPRA). Available online: https://mpra.ub.uni-muenchen.de/44218/ (accessed on 11 December 2025).
- Han, Q. (2019). Research on demographic dividend, Lewis turning point, saving and economic growth. International Journal of Business and Social Science, 10(6), 20–34. [Google Scholar] [CrossRef] [Scilit]
- Harzing, A. W. (2007). Publish or perish. Available online: https://harzing.com/resources/publish-or-perish (accessed on 15 November 2025).
- Harzing, A. W., Alakangas, S., & Adams, D. (2014). hIa: An individual annual h-index to accommodate disciplinary and career length differences. Scientometrics, 99(3), 811–821. [Google Scholar] [CrossRef] [Scilit]
- Harzing’s Publish or Perish. (n.d.). Available online: https://harzing.com/resources/publish-or-perish/manual/using/query-results/metrics?source=pop_8.18.5252.9447#hiindex (accessed on 15 November 2025).
- Heffner, K., Klemens, B., & Solga, B. (2019). Challenges of regional development in the context of population ageing. Analysis based on the example of Opolskie voivodeship. Sustainability, 11(19), 5207. [Google Scholar] [CrossRef] [Scilit]
- Horioka, C. Y. (2010). Aging and saving in Asia. Pacific Economic Review, 15(1), 46–55. [Google Scholar] [CrossRef] [Scilit]
- Hu, M., Xiao, L., & Qiu, H. (2024). The effects of population aging on industrial structure upgrading: Empirical analysis of provincial and threshold characteristics in China. Chinese Journal of Population, Resources and Environment, 22(3), 356–366. [Google Scholar] [CrossRef] [Scilit]
- Ibey, A. M. Y., Mohamed, A. A., & Abdulle, A. S. (2025). The impact demographic factors on economic growth in Somalia. Cogent Economics & Finance, 13(1), 2559047. [Google Scholar] [CrossRef] [Scilit]
- Jäger, P., & Schmidt, T. (2016). The political economy of public investment when population is aging: A panel cointegration analysis. European Journal of Political Economy, 43, 145–158. [Google Scholar] [CrossRef] [Scilit]
- Kim, D., Liu, P., & Lin, S. (2024). Population aging and saving: Evidence from China. Review of Development Economics, 28(4), 1494–1521. [Google Scholar] [CrossRef] [Scilit]
- Kotschy, R., & Bloom, D. (2023). Population aging and economic growth: From demographic dividend to demographic drag? National Bureau of Economic Research. [Google Scholar] [CrossRef] [Scilit]
- Kroll, F., & Haase, D. (2010). Does demographic change affect land use patterns? Land Use Policy, 27(3), 726–737. [Google Scholar] [CrossRef] [Scilit]
- Lee, H.-H., & Shin, K. (2021). Decomposing effects of population aging on economic growth in OECD countries. Asian Economic Papers, 20(3), 138–159. [Google Scholar] [CrossRef] [Scilit]
- Li, X., & Zheng, H. (2025). Life-cycle dynamics of consumption preferences. Economies, 13(9), 267. [Google Scholar] [CrossRef] [Scilit]
- Litra, A. V. (2014). Economic effects of demographic ageing. Bulletin of the Transilvania University of Brasov. Series V: Economic Sciences, 7(56), 2. Available online: https://webbut.unitbv.ro/index.php/Series_V/article/view/5005/3881 (accessed on 20 December 2025).
- Litră, A. V. (2025). Migration and demographic ageing nexus: A bibliometric approach. Studia Universitatis Babeș-Bolyai Negotia, 4, 47–72. [Google Scholar] [CrossRef] [Scilit]
- Liu, W., & McKibbin, W. J. (2020, March 5). Global macroeconomic impacts of demographic change. CAMA Working Paper No. 21/2020. Available online: https://crawford.anu.edu.au/sites/default/files/2025-01/21_2020_liu_mckibbin.pdf (accessed on 21 December 2025).
- Lutz, W., Skirbekk, V., & Rita, M. (2008). The low fertility trap hypothesis. Forces that may lead to further postponement and fewer births in Europe. Vienna Yearbook of Population Research, 2006, 167–192. [Google Scholar] [CrossRef] [Scilit]
- Ma, D., Zhou, K., Xu, J., & Qian, Y. (2023). Industrial structure upgrading, population aging and migration: An empirical study based on Chinese provincial panel data. PLoS ONE, 18(10), e0291718. [Google Scholar] [CrossRef] [Scilit]
- Maestas, N., Mullen, K. J., & Powell, D. (2023). The effect of population aging on economic growth, the labor force, and productivity. American Economic Journal: Macroeconomics, 15(2), 306–332. [Google Scholar] [CrossRef] [Scilit]
- Mahlberg, B., Freund, I., Crespo Cuaresma, J., & Prskawetz, A. (2013). Ageing, productivity and wages in Austria. Labour Economics, 22, 5–15. [Google Scholar] [CrossRef] [Scilit]
- Marois, G., Sabourin, P., & Bélanger, A. (2019). Implementing dynamics of immigration integration in labor force participation projection in EU28. Population Research and Policy Review, 39(2), 339–363. [Google Scholar] [CrossRef] [Scilit]
- Milijić, A., Manasijević, A., Đorđević, D., Marjanović, V., & Stanojević, M. (2025). Demographic trends and regional disparities in the EU. Social Sciences, 14(9), 556. [Google Scholar] [CrossRef] [Scilit]
- Modigliani, F., & Brumberg, R. H. (1954). Utility analysis and the consumption function: An interpretation of cross-section data. In K. K. Kurihara (Ed.), Post-Keynesian economics (pp. 388–436). Rutgers University Press. [Google Scholar]
- Morozov, V., Fedotova, T., Milonushkin, K., Bilska, O., & Kobelia, Z. (2024). Economic challenges of labour mobility within the EU. International Journal of Economics and Financial Issues, 14(5), 26–36. [Google Scholar] [CrossRef] [Scilit]
- Mos, P., & Reckers-Droog, V. (2024). Examining the underpinnings of decisions to allocate public resources to social care: A systematic review. Social Science & Medicine, 355, 117093. [Google Scholar] [CrossRef] [Scilit]
- Nagarajan, N. R., & Sixsmith, A. (2021). Policy initiatives to address the challenges of an older population in the workforce. Ageing International, 48(1), 41–77. [Google Scholar] [CrossRef] [Scilit]
- OECD. (2023). Exploring Norway’s fertility, work, and family policy trends. OECD Publishing. [Google Scholar] [CrossRef] [Scilit]
- Oliver, M. (2015). Population ageing and economic growth in Japan. International Journal of Sociology and Social Policy, 35(11/12), 841–863. [Google Scholar] [CrossRef] [Scilit]
- Park, C.-Y., Shin, K., & Kikkawa, A. (2022). Demographic change, technological advance, and growth: A cross-country analysis. Economic Modelling, 108, 105742. [Google Scholar] [CrossRef] [Scilit]
- Pascual-Saez, M., Cantarero-Prieto, D., & Pires Manso, J. R. (2020). Does population ageing affect savings in Europe? Journal of Policy Modeling, 42(2), 291–306. [Google Scholar] [CrossRef] [Scilit]
- Prettner, K. (2012). Population aging and endogenous economic growth. Journal of Population Economics, 26(2), 811–834. [Google Scholar] [CrossRef] [Scilit]
- Rallapalli, J., & Khandelwal, P. (2025). Comparative analysis of demographic dividend in Australia and New Zealand. International Journal For Multidisciplinary Research, 7(4), 1–20. [Google Scholar] [CrossRef]
- Ranasinghe, T., Grosse, E. H., Glock, C. H., & Jaber, M. Y. (2024). Never too late to learn: Unlocking the potential of aging workforce in manufacturing and service industries. International Journal of Production Economics, 270, 109193. [Google Scholar] [CrossRef] [Scilit]
- Ratcliffe, J., Laver, K., Couzner, L., & Crotty, M. (2012). Health economics and geriatrics: Challenges and opportunities. In Geriatrics. IntechOpen Limited. [Google Scholar] [CrossRef] [Scilit]
- Reddy, K. S. (2016). Global burden of disease study 2015 provides GPS for global health 2030. The Lancet, 388(10053), 1448–1449. [Google Scholar] [CrossRef] [Scilit]
- Reher, D. S. (2004). The demographic transition revisited as a global process. Population, Space and Place, 10(1), 19–41. [Google Scholar] [CrossRef] [Scilit]
- Saeed, M. I., Ali, F., & Ali, F. (2023). Nexus between old age demographic ratio and economic growth: An Empirical analysis of selected developing countries. Global Economics Review, VIII(II), 22–31. [Google Scholar] [CrossRef] [Scilit]
- Sawik, B., Tobis, S., Baum, E., Suwalska, A., Kropińska, S., Stachnik, K., Pérez-Bernabeu, E., Cildoz, M., Agustin, A., & Wieczorowska-Tobis, K. (2023). Robots for elderly care: Review, multi-criteria optimization model and qualitative case study. Healthcare, 11(9), 1286. [Google Scholar] [CrossRef] [Scilit] [PubMed]
- Sha, X., Li, B., Zhao, Z., Yin, X., Dong, J., Yang, Y., & Xu, Z. (2025). How does population aging affect new quality productivity in economic sustainability? An empirical study based on mediating mechanisms and moderating effects. Sustainability, 17(18), 8249. [Google Scholar] [CrossRef] [Scilit]
- Stoever, B. (2012). The influence of age on consumption. EcoMod2012, 3808. Available online: https://ecomod.net/system/files/Discussion%20Paper_Britta%20Stoever.pdf (accessed on 22 December 2025).
- Strulik, H. (2024). Long-run economic growth despite population decline. Journal of Economic Dynamics and Control, 168, 104943. [Google Scholar] [CrossRef] [Scilit]
- Swan, W. (2010). Australia to 2050: Future challenges. Intergenerational Report 2010. Australian Government. Available online: https://treasury.gov.au/sites/default/files/2019-03/IGR_2010.pdf (accessed on 20 December 2025).
- Šantic, D. (2024). Is demography a real problem for sustainability? In Book of abstracts and contributed papers: Building bridges between climate science and society through a transdisciplinary network (pp. 87–88). Astronomical Observatory. [Google Scholar] [CrossRef] [Scilit]
- Takefumi, H. (2025). Aging and its macroeconomic consequences: An inverted U-shaped endogenous economic growth. MPRA Paper No. 124598. Munich Personal RePEc Archive (MPRA). Available online: https://mpra.ub.uni-muenchen.de/124598/ (accessed on 22 December 2025).
- Tan, Y., Liu, X., Sun, H., & Zeng, C. (2022). Population ageing, labour market rigidity and corporate innovation: Evidence from China. Research Policy, 51(2), 104428. [Google Scholar] [CrossRef] [Scilit]
- Tangpatthamachart, S., & Amornkitvikai, Y. (2025). Demographic shifts and economic growth: A global analysis across ageing and non-ageing economies. Research in Globalization, 11, 100321. [Google Scholar] [CrossRef] [Scilit]
- Vallée-Dubois, F. (2023). Government spending preferences over the life cycle. Journal of Public Policy, 43(3), 468–489. [Google Scholar] [CrossRef] [Scilit]
- Van Eck, N. J., & Waltman, L. (2007). VOS: A new method for visualizing similarities between objects. In Advances in data analysis: Proceedings of the 30th annual conference of the gesellschaft für klassifikation ev, Freie Universität Berlin (pp. 299–306). Springer. [Google Scholar]
- Vlandas, T. (2017). Grey power and the economy: Aging and inflation across advanced economies. Comparative Political Studies, 51(4), 514–552. [Google Scholar] [CrossRef] [Scilit]
- Wang, H., & Chen, Y. (2024). The impact of population aging on capital structure decisions and capital market efficiency: Evidence from China. International Review of Financial Analysis, 95, 103408. [Google Scholar] [CrossRef] [Scilit]
- Wang, Y., Zhao, W., & Meng, W. (2022). Bilateral effect of aging population on consumption structure: Evidence from China. Frontiers in Public Health, 10, 941485. [Google Scholar] [CrossRef] [Scilit]
- Wirtz, J., Bateson, J. E. G., Čaić, M., Frank, D.-A., & Veflen, N. (2025). The healthy aging and service firms: The promise of smart technologies. Journal of Service Management. [Google Scholar] [CrossRef] [Scilit]
- Wong, C. M., & Tetrick, L. E. (2017). Job crafting: Older workers’ mechanism for maintaining person-job fit. Frontiers in Psychology, 8, 1548. [Google Scholar] [CrossRef] [Scilit]
- Yang, Z., Li, Y., & Wu, C. (2025). Population aging, fintech, and agricultural economic resilience. International Review of Economics & Finance, 97, 103756. [Google Scholar] [CrossRef] [Scilit]
- Zbuchea, A., Ivan, L., & Mocanu, R. (2021). Ageing and responsible consumption. Management Dynamics in the Knowledge Economy, 9(4), 499–512. [Google Scholar] [CrossRef] [Scilit]
- Zhou, D. (2025). Does it help or hinder? The impact of population aging on industrial structure upgrading in transition economic systems. Review of Development Economics, 29(3), 2021–2035. [Google Scholar] [CrossRef] [Scilit]
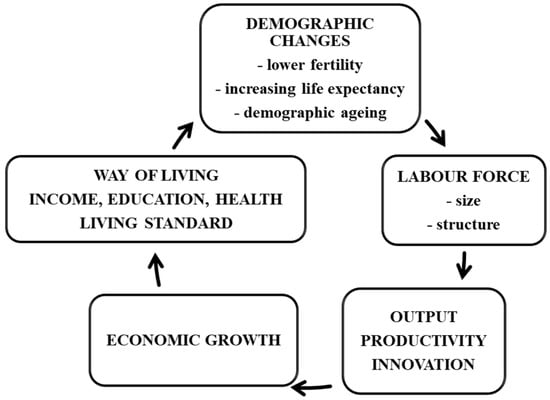
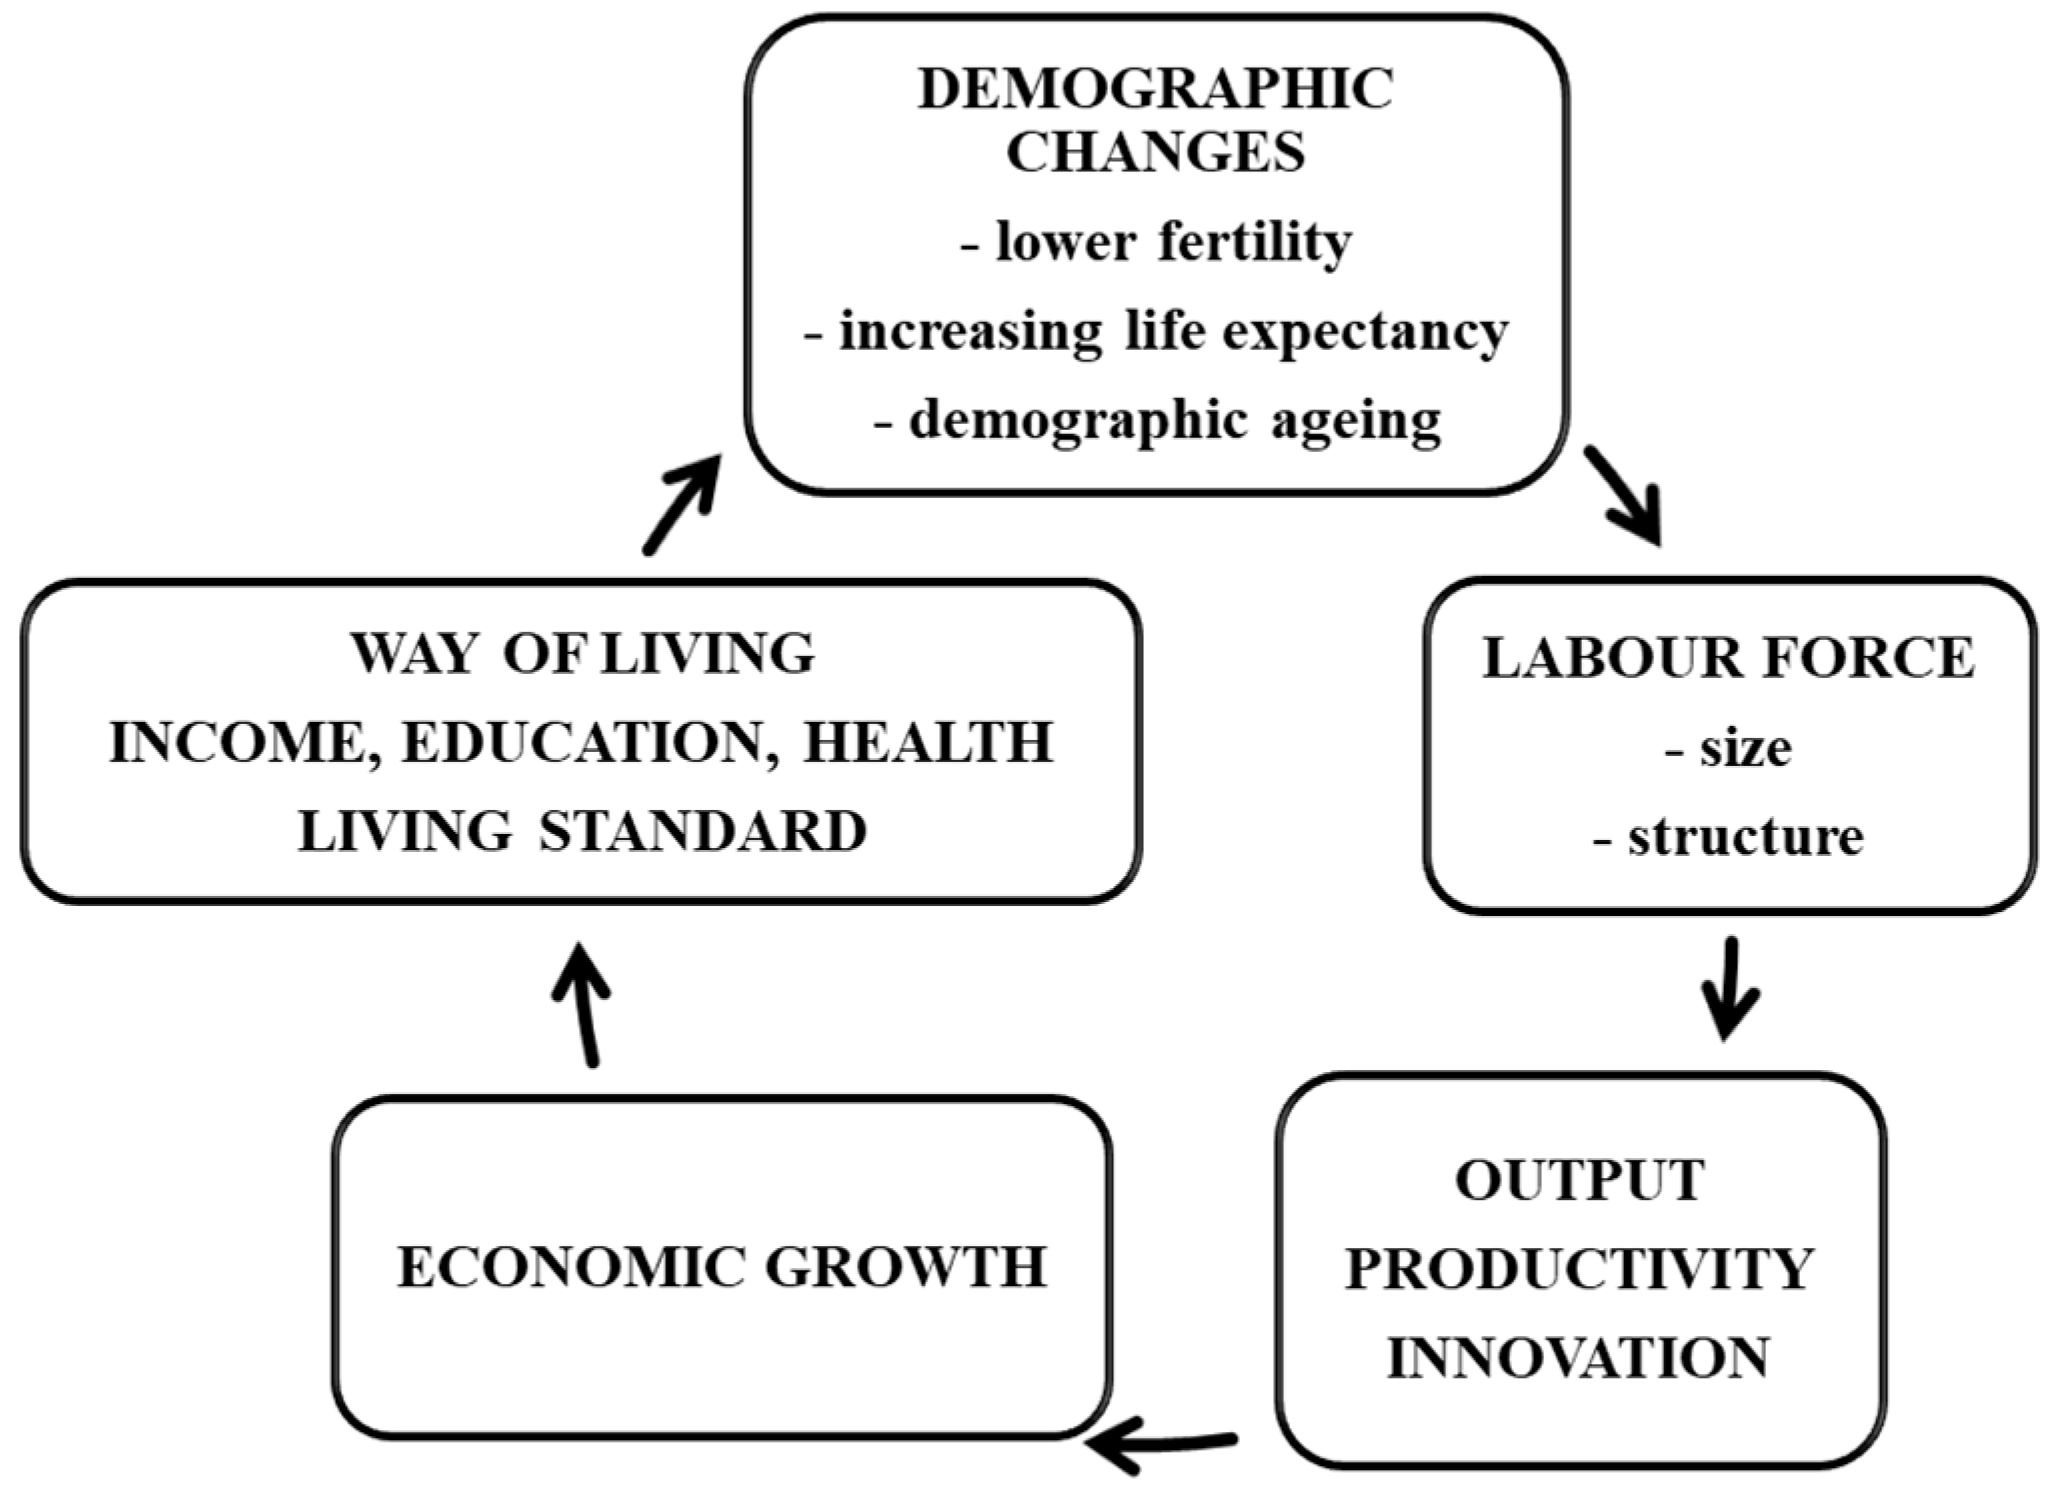
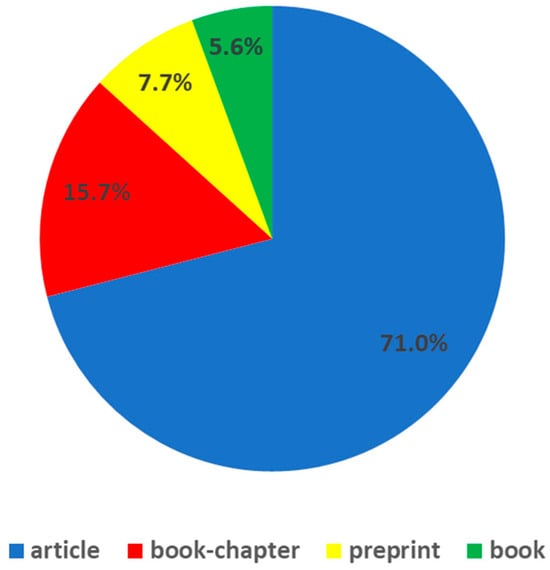
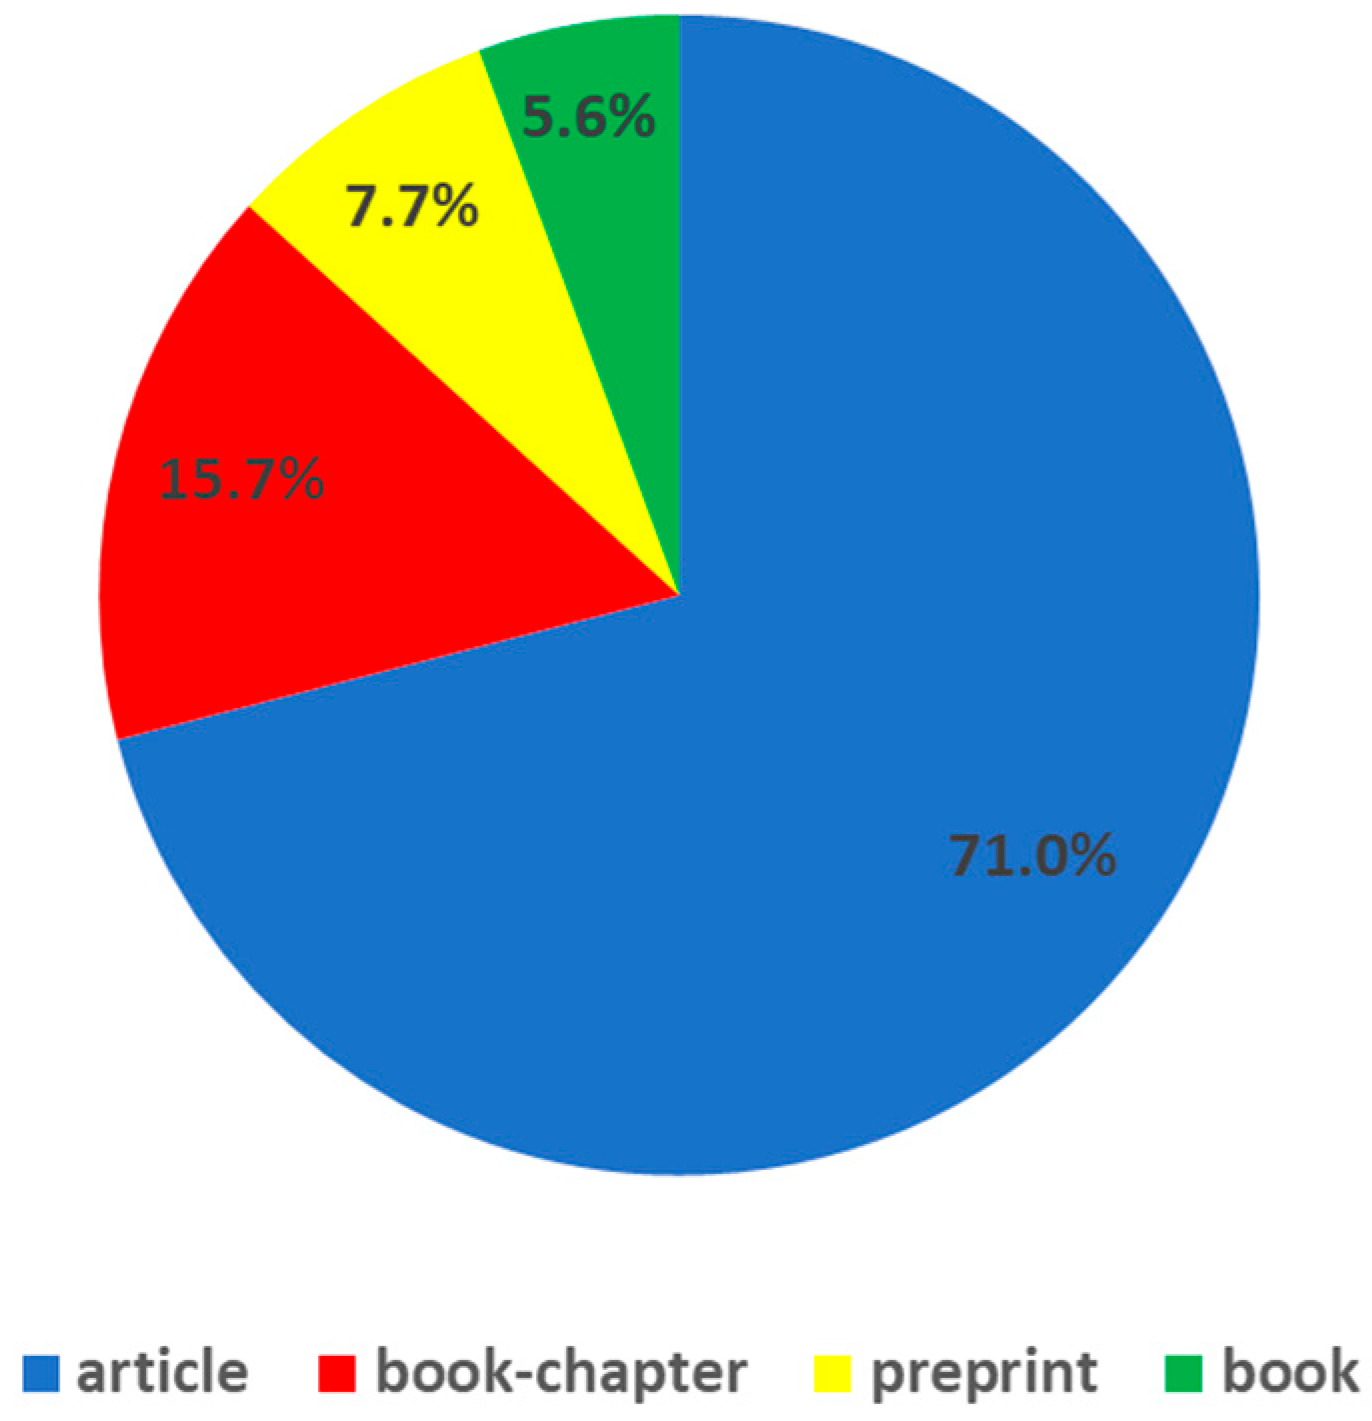
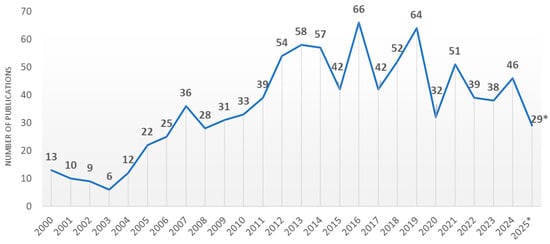
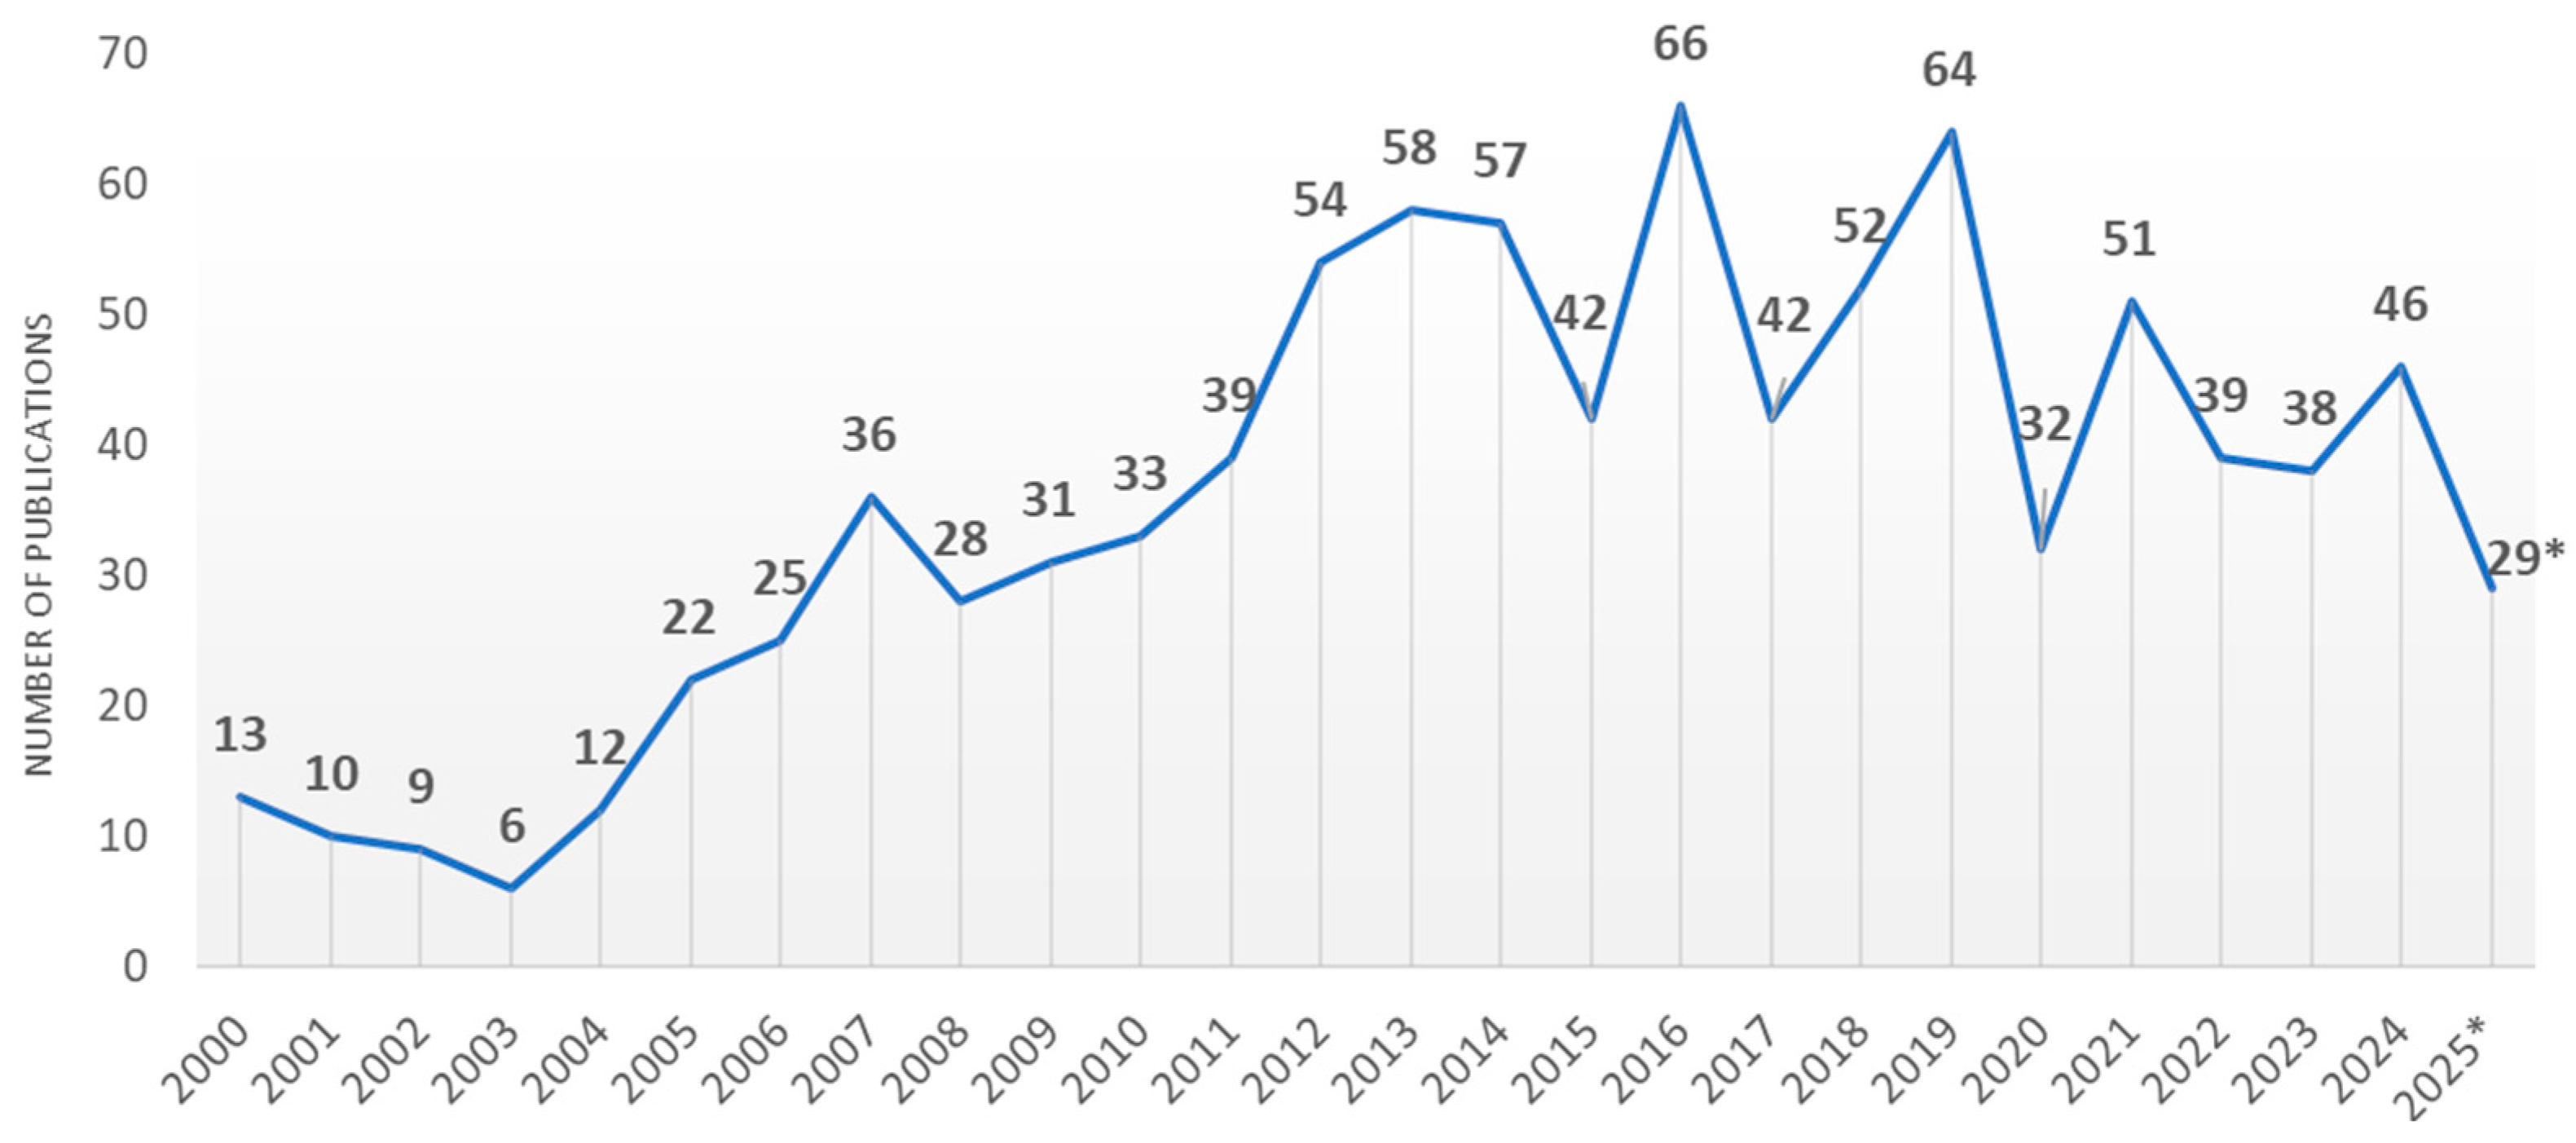
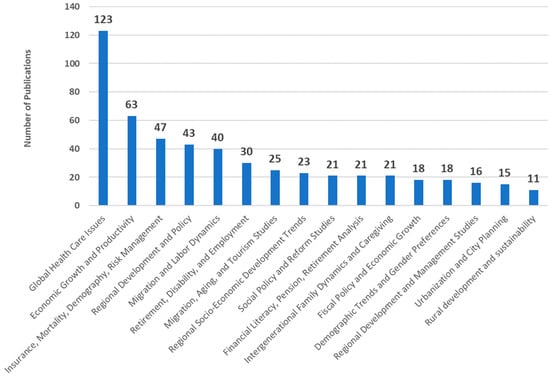
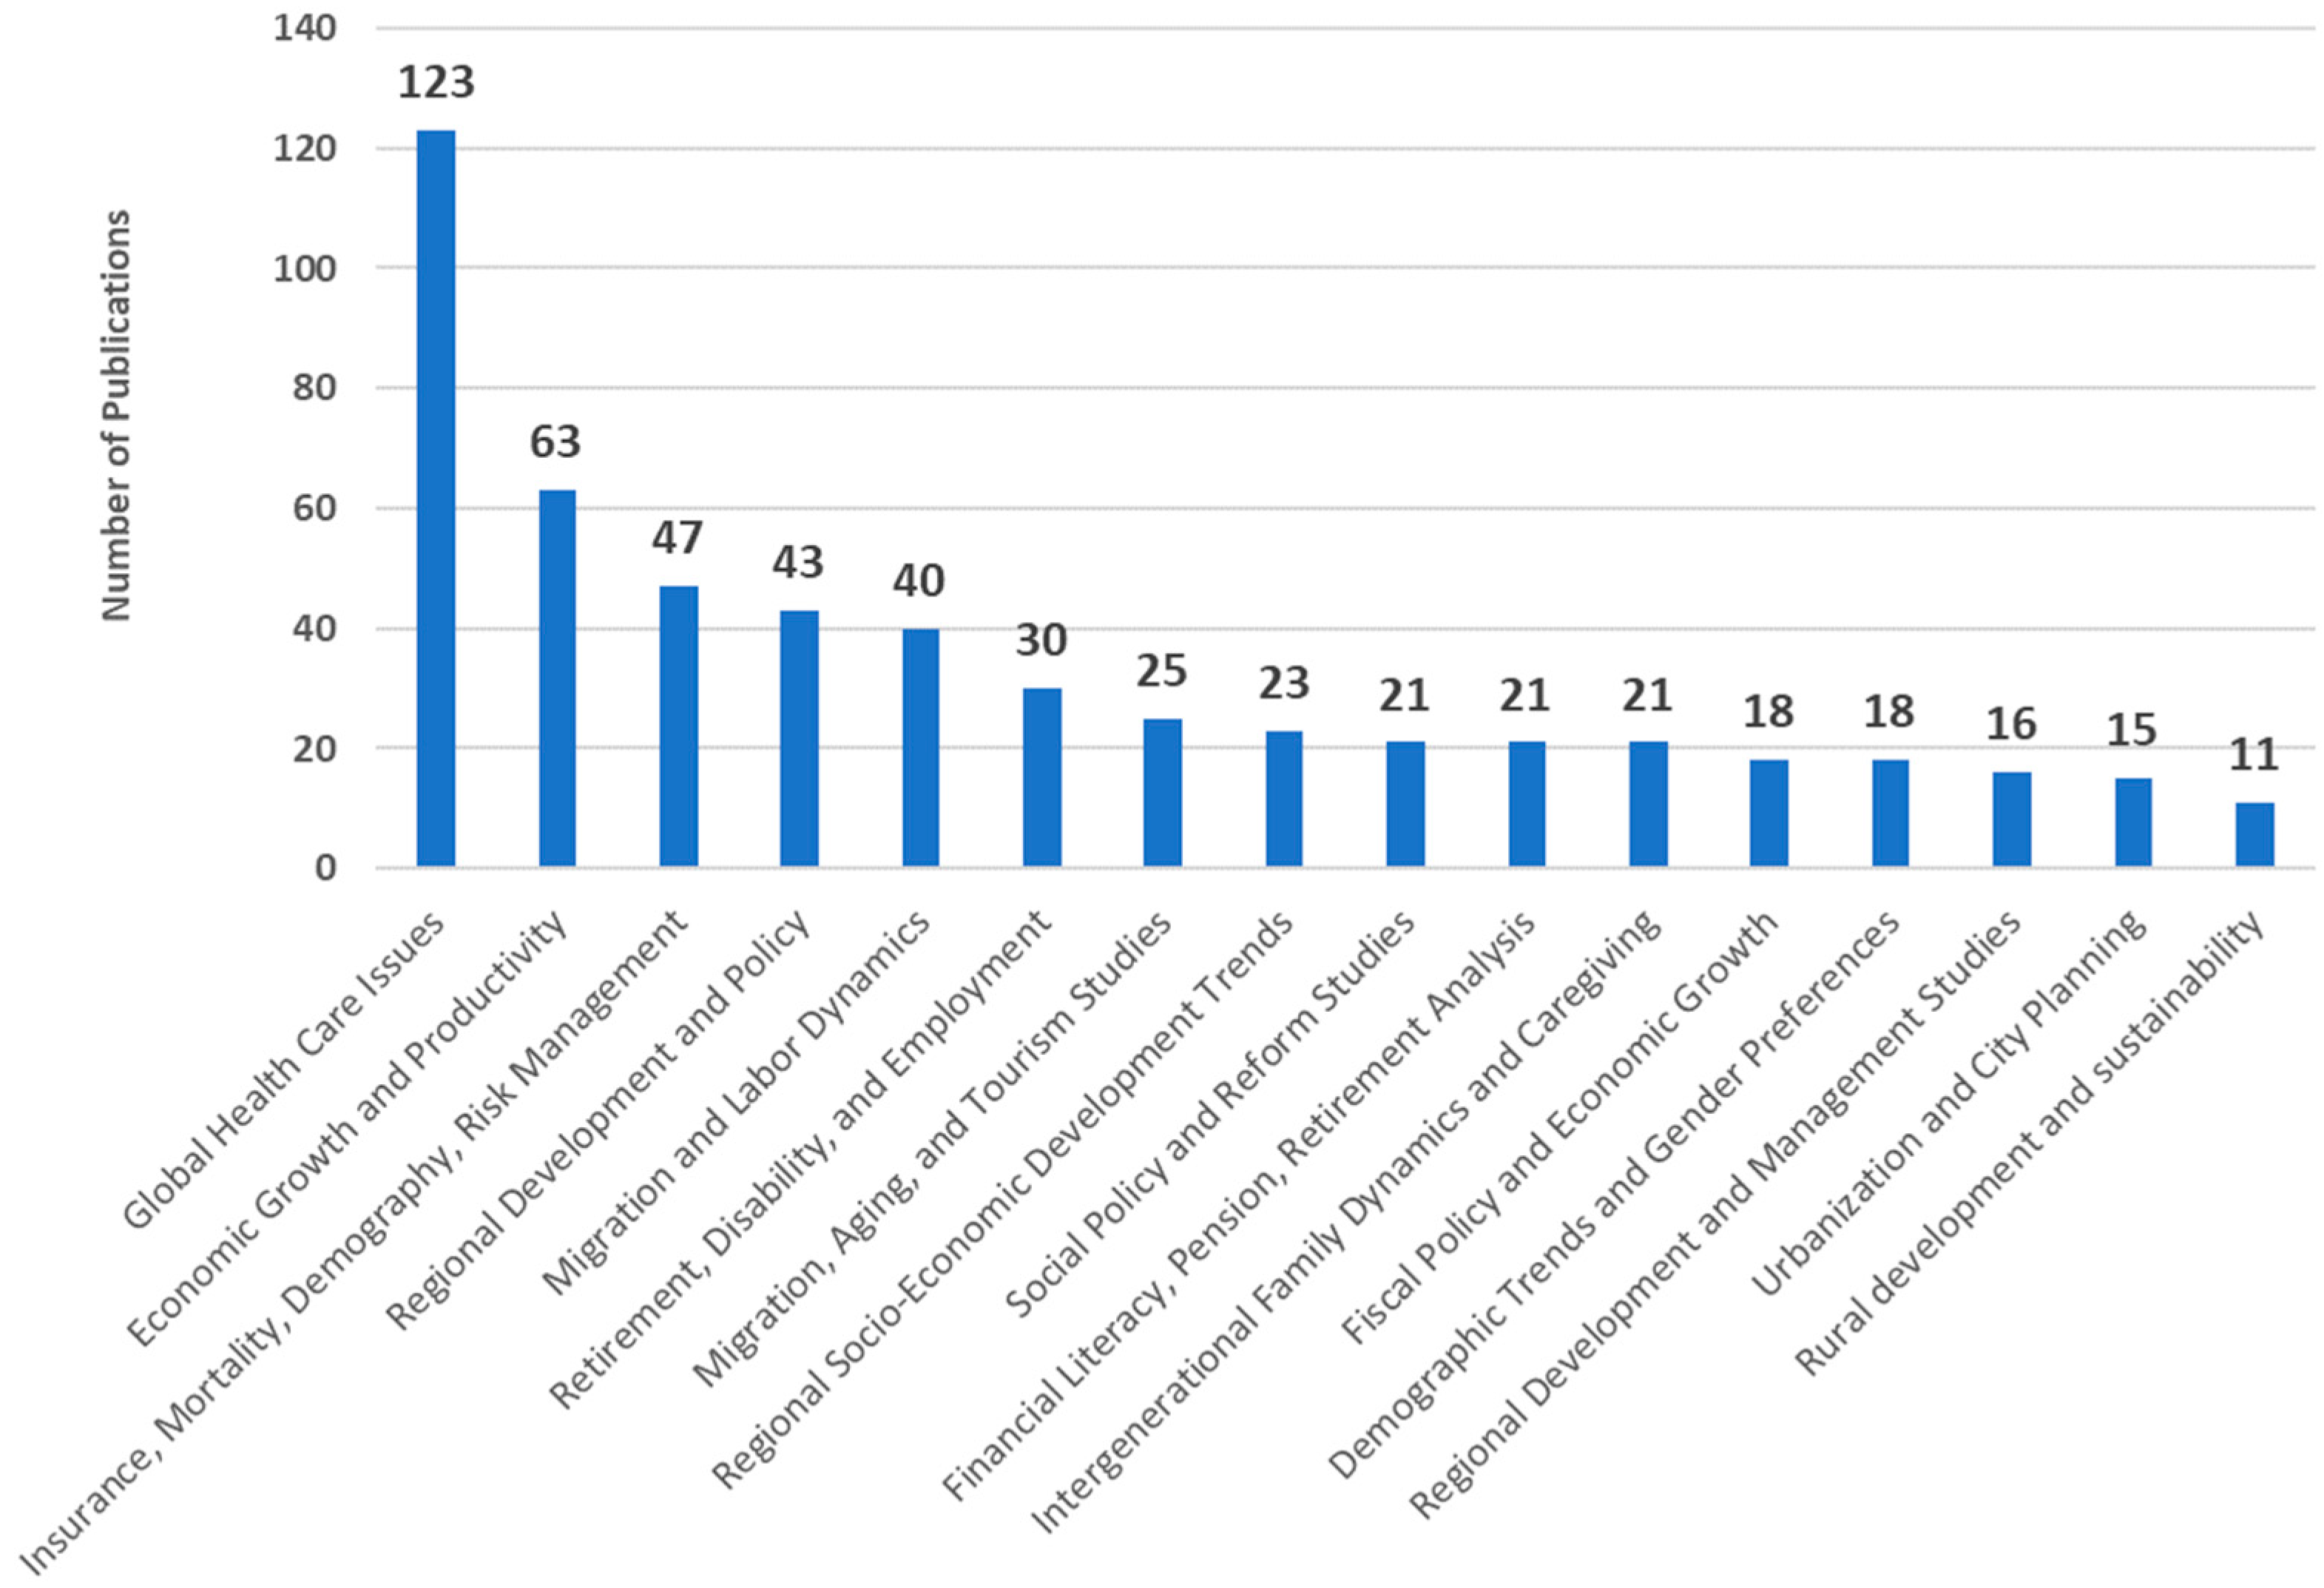
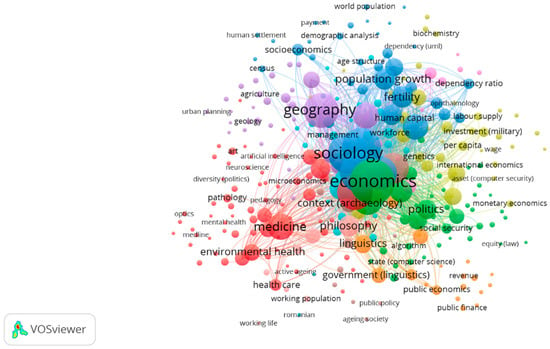
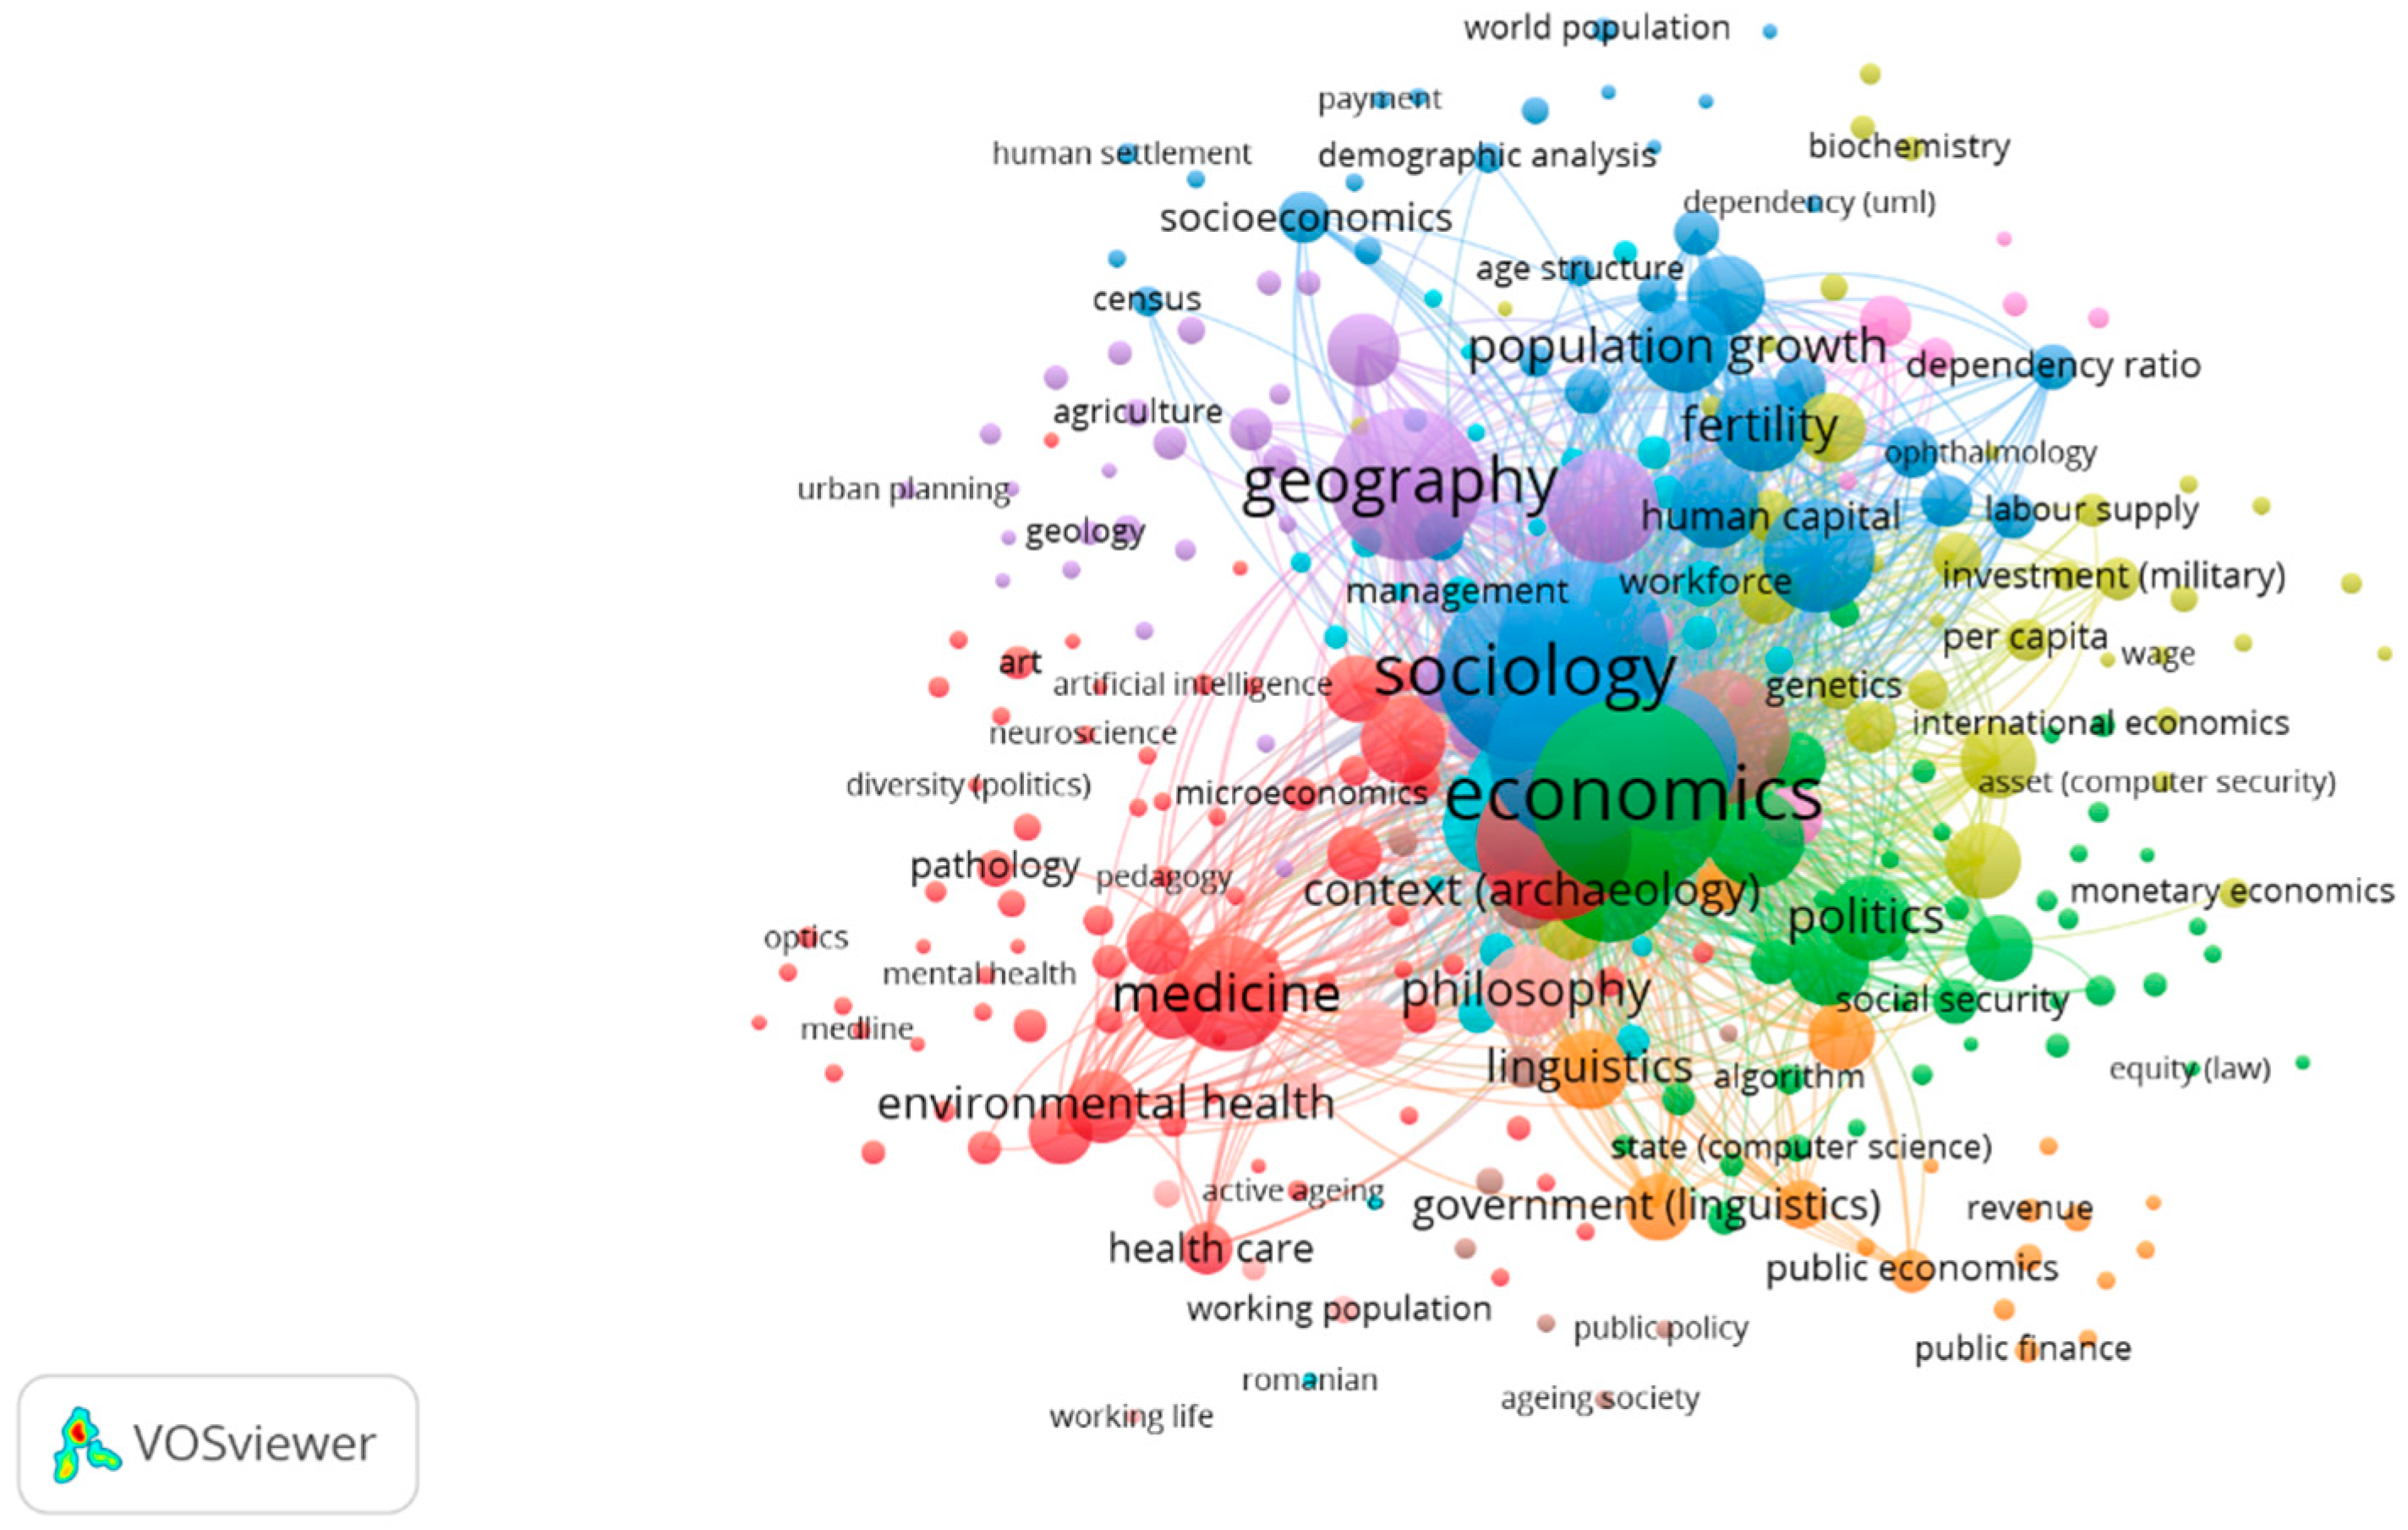
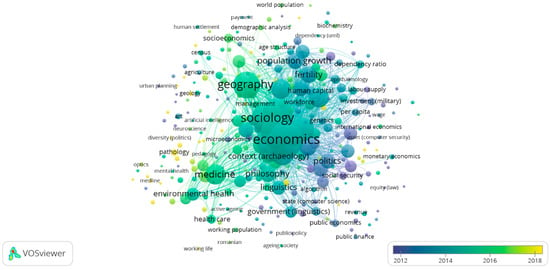
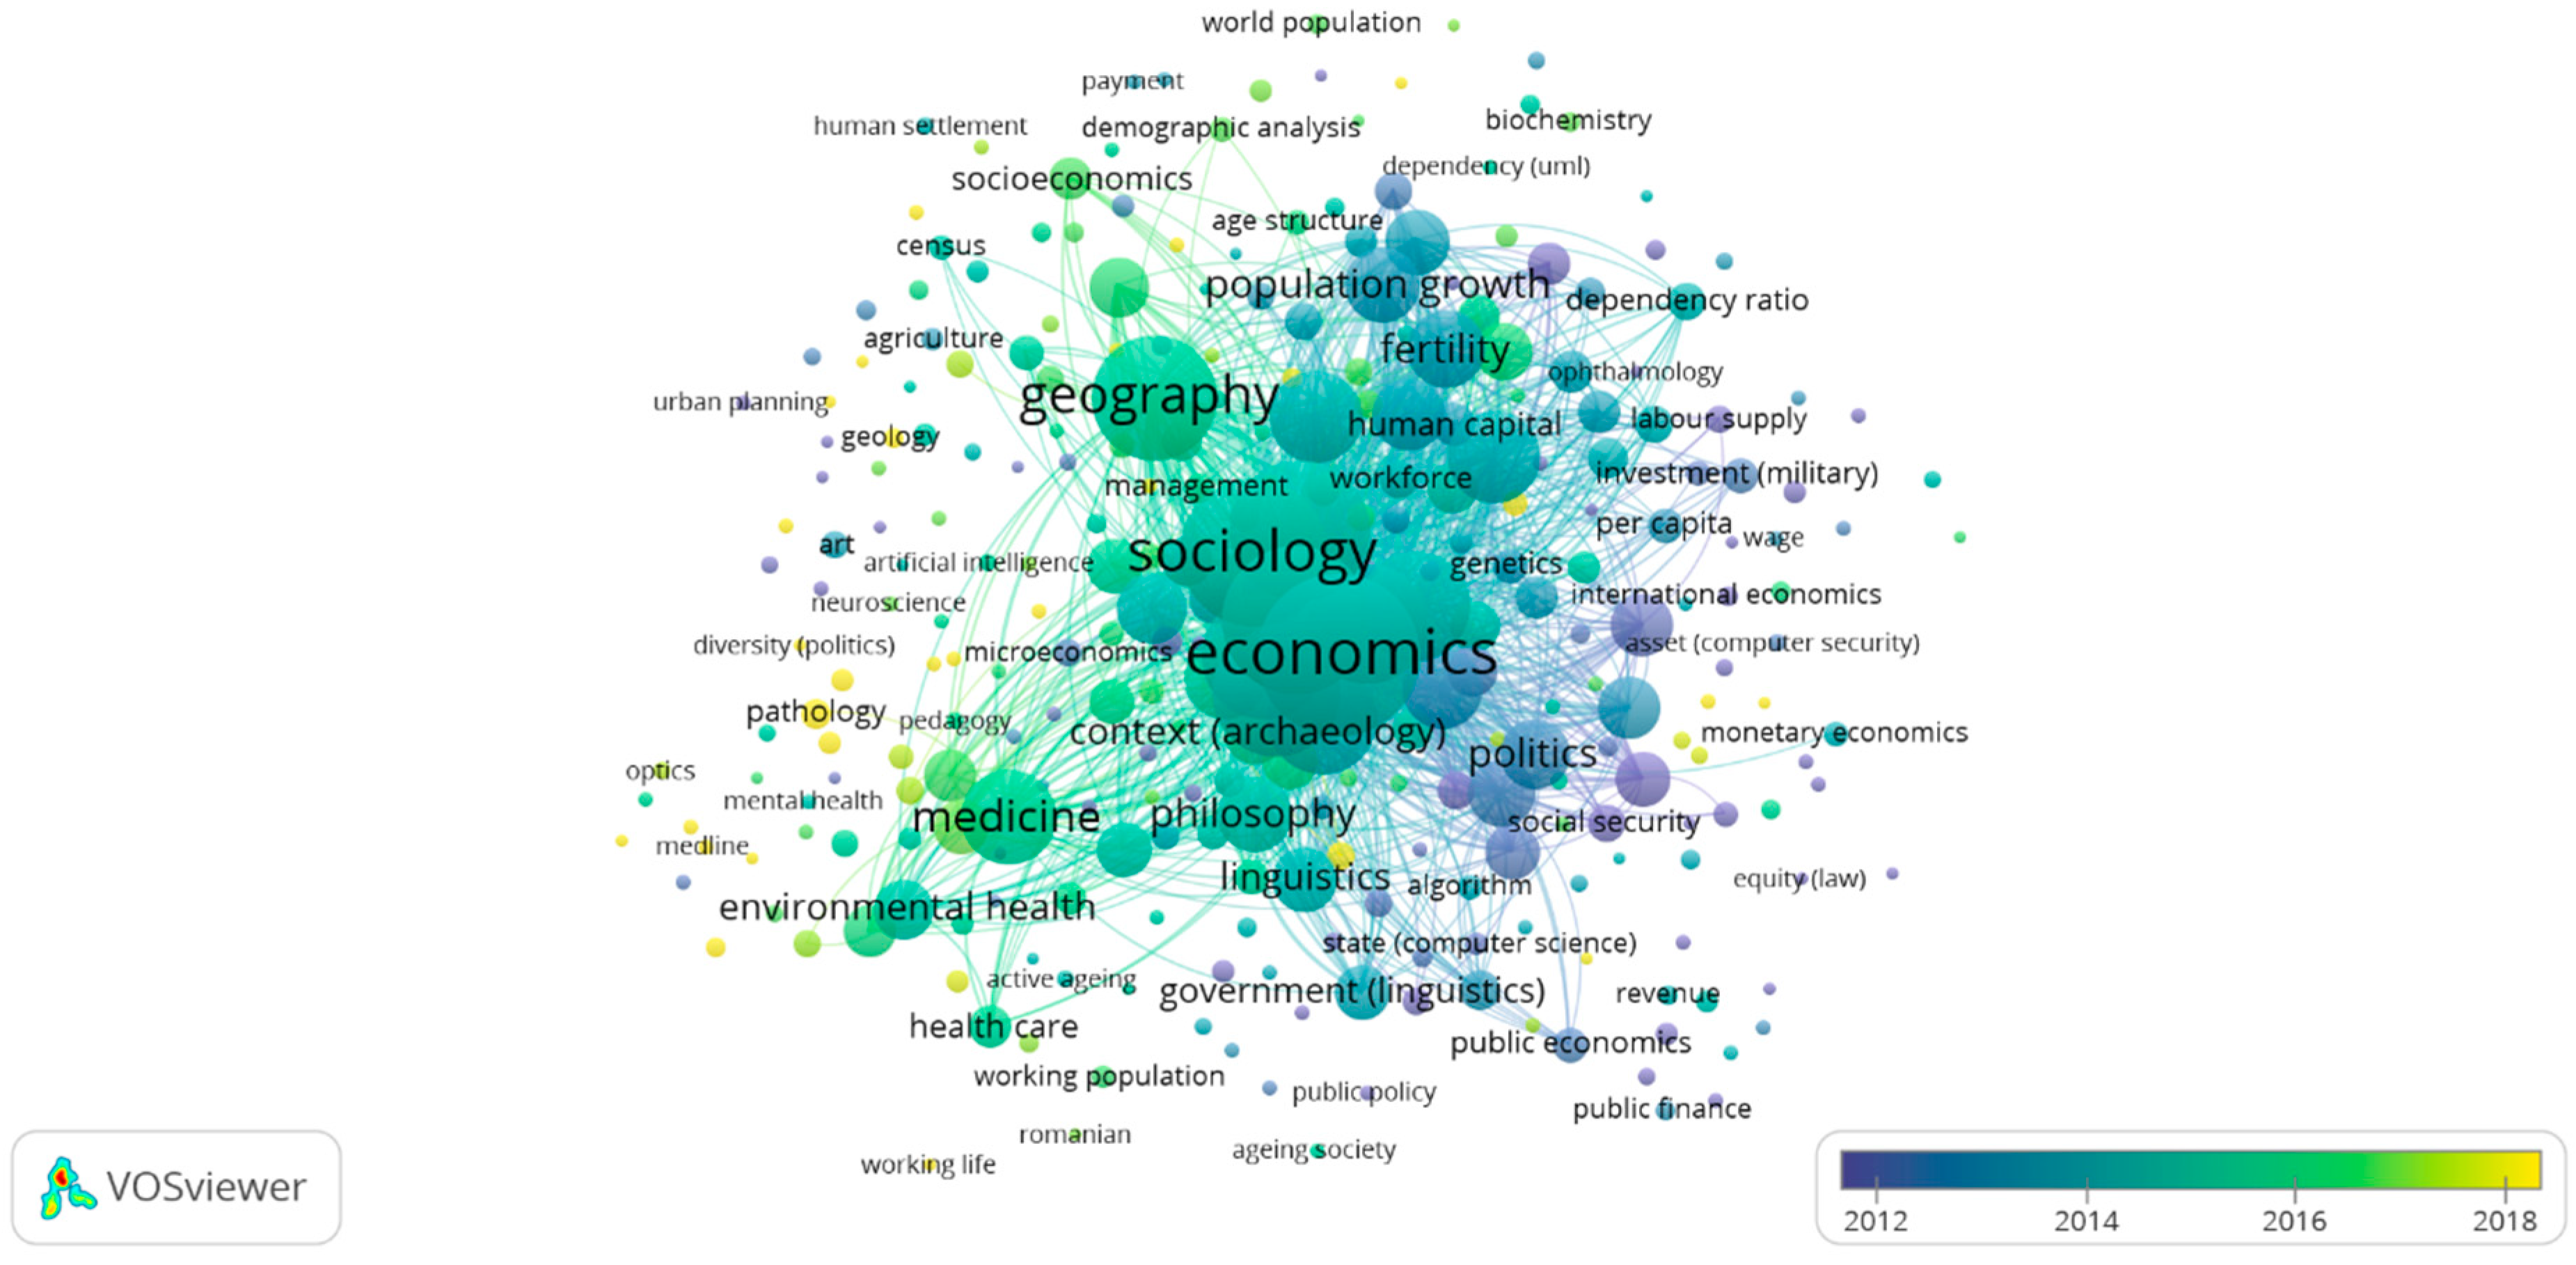
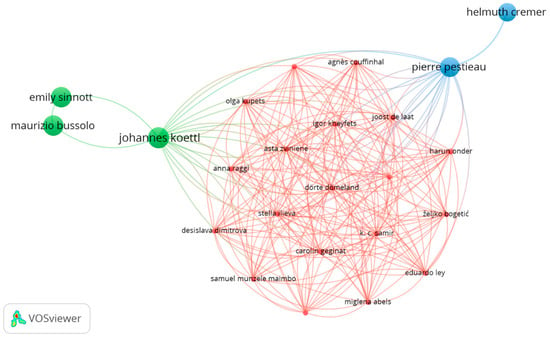
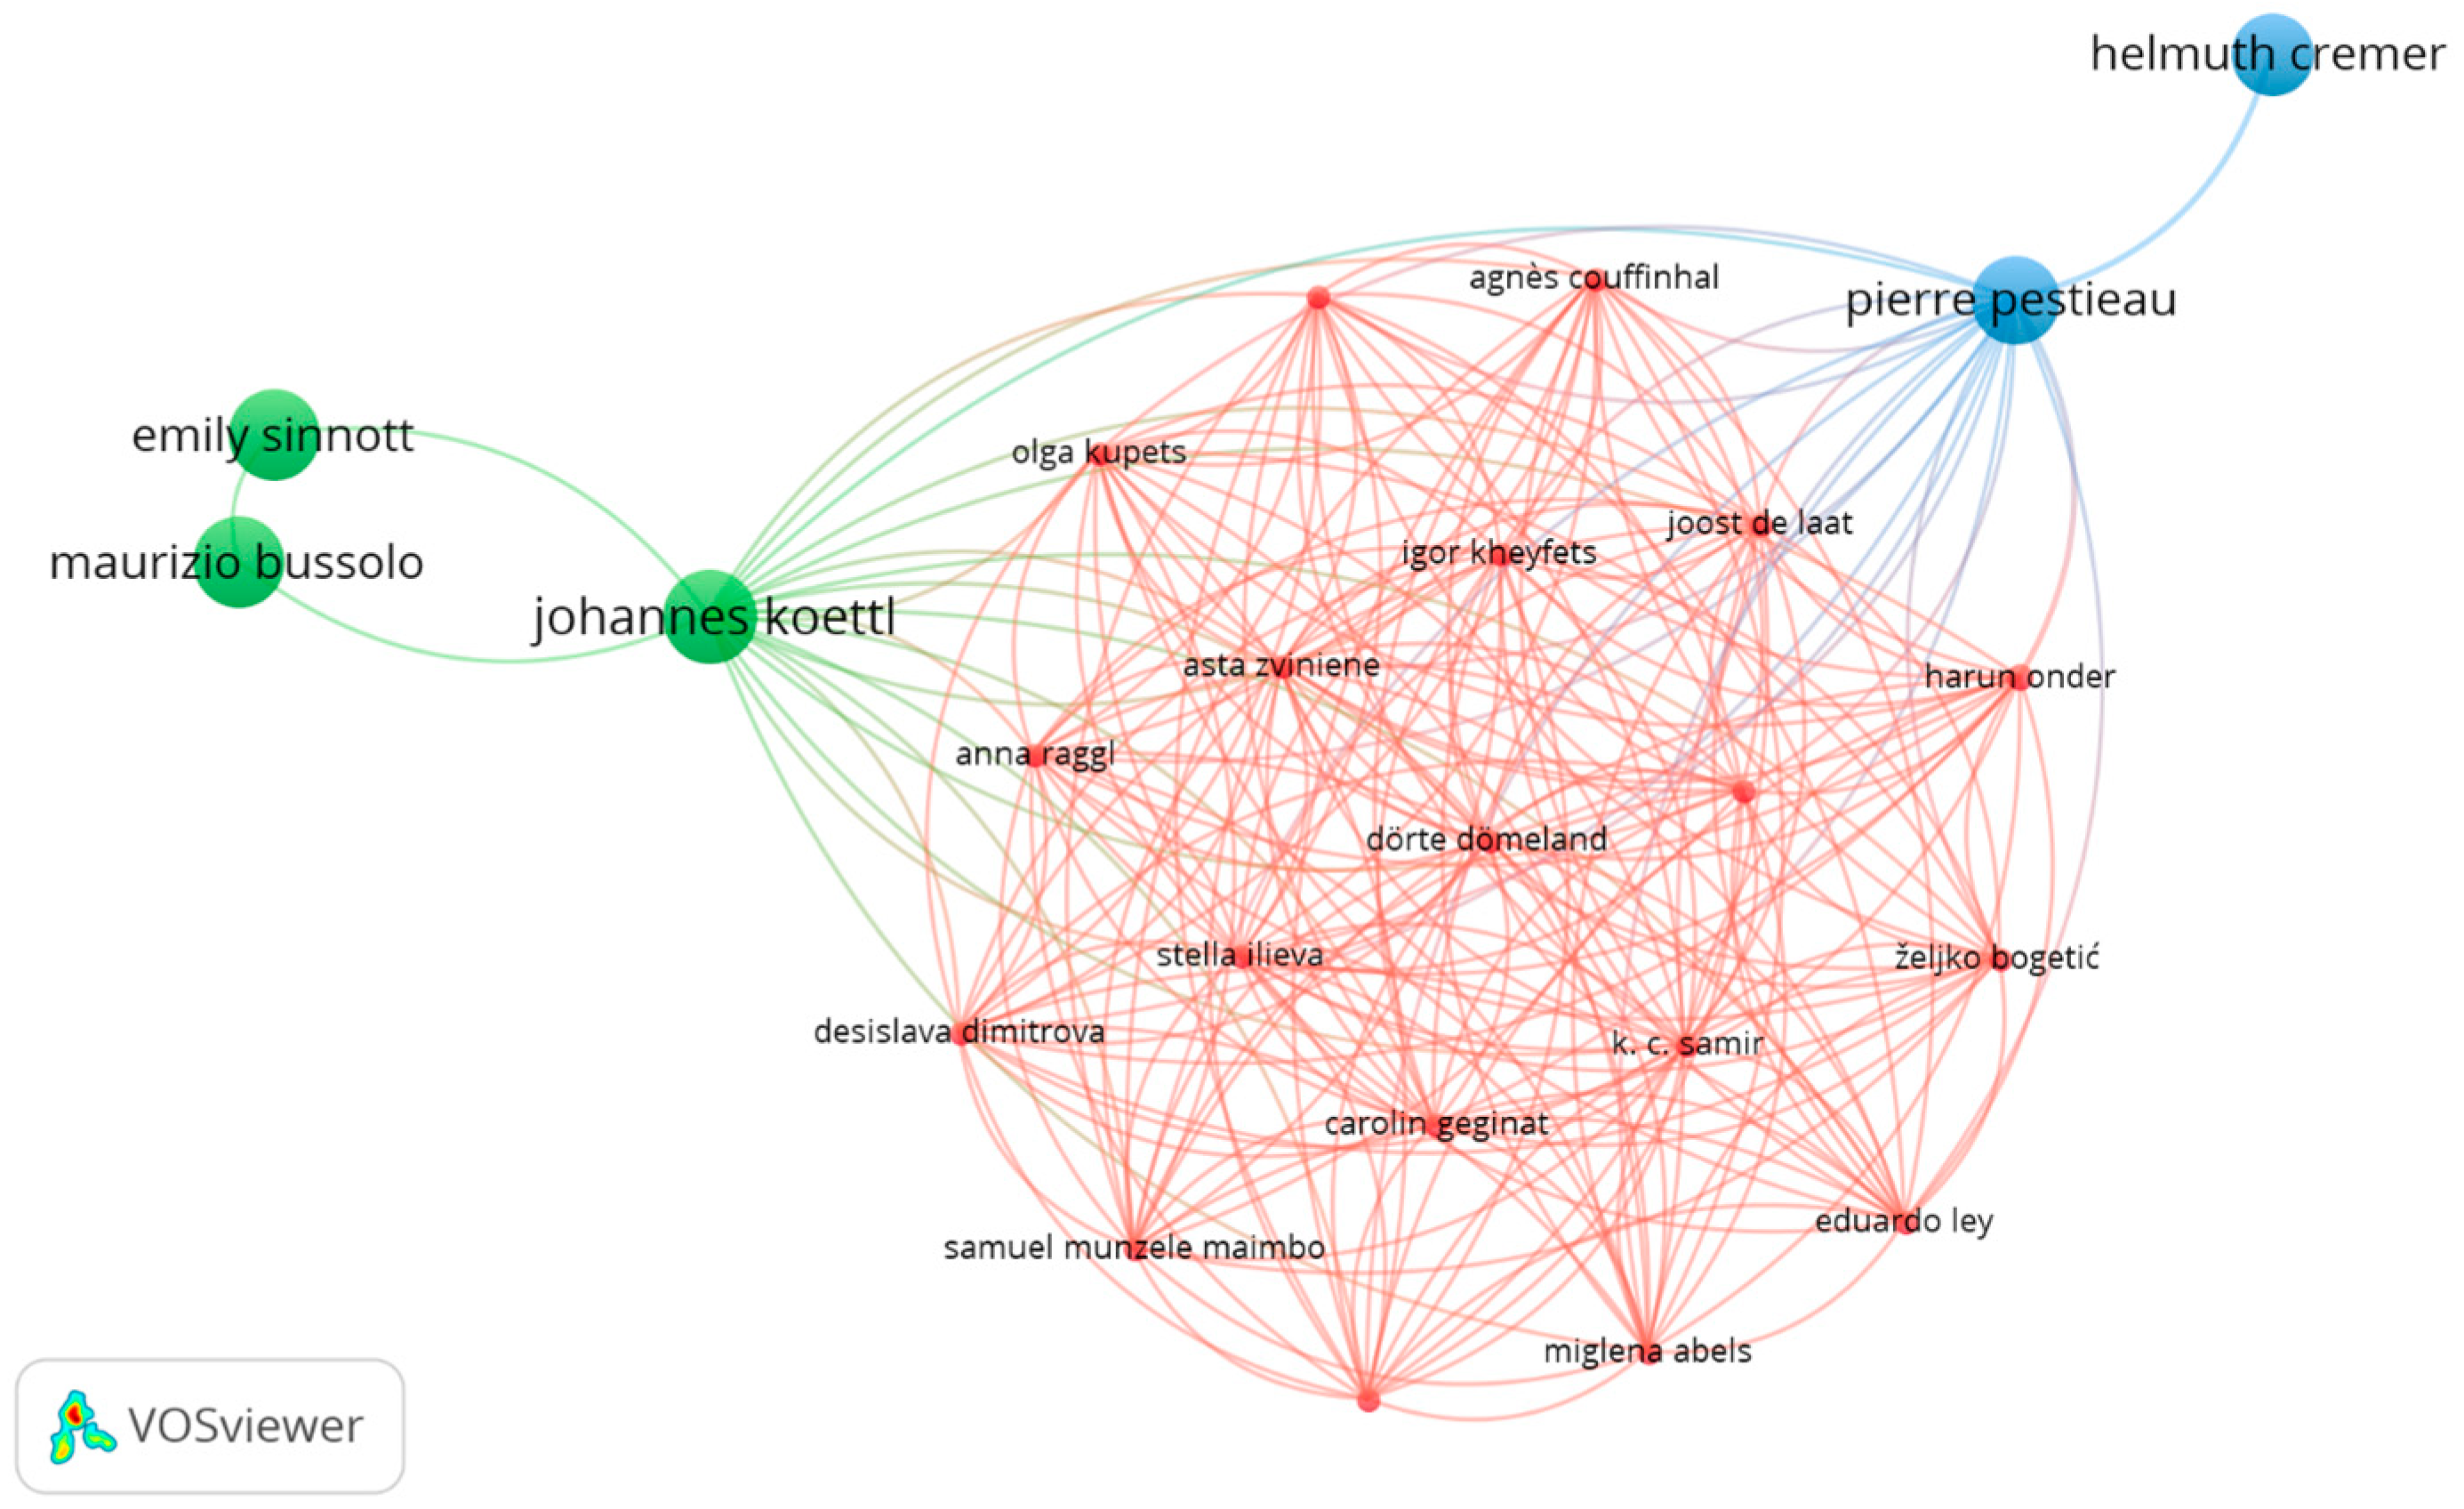
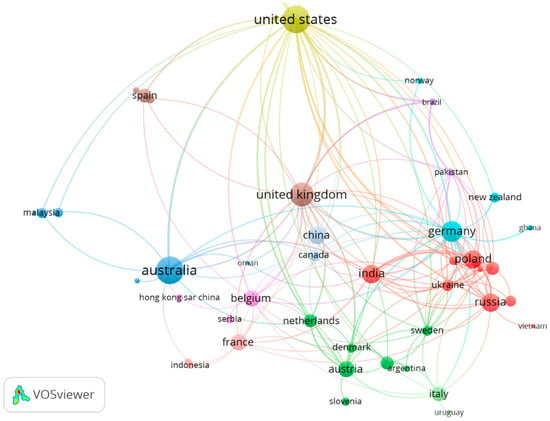
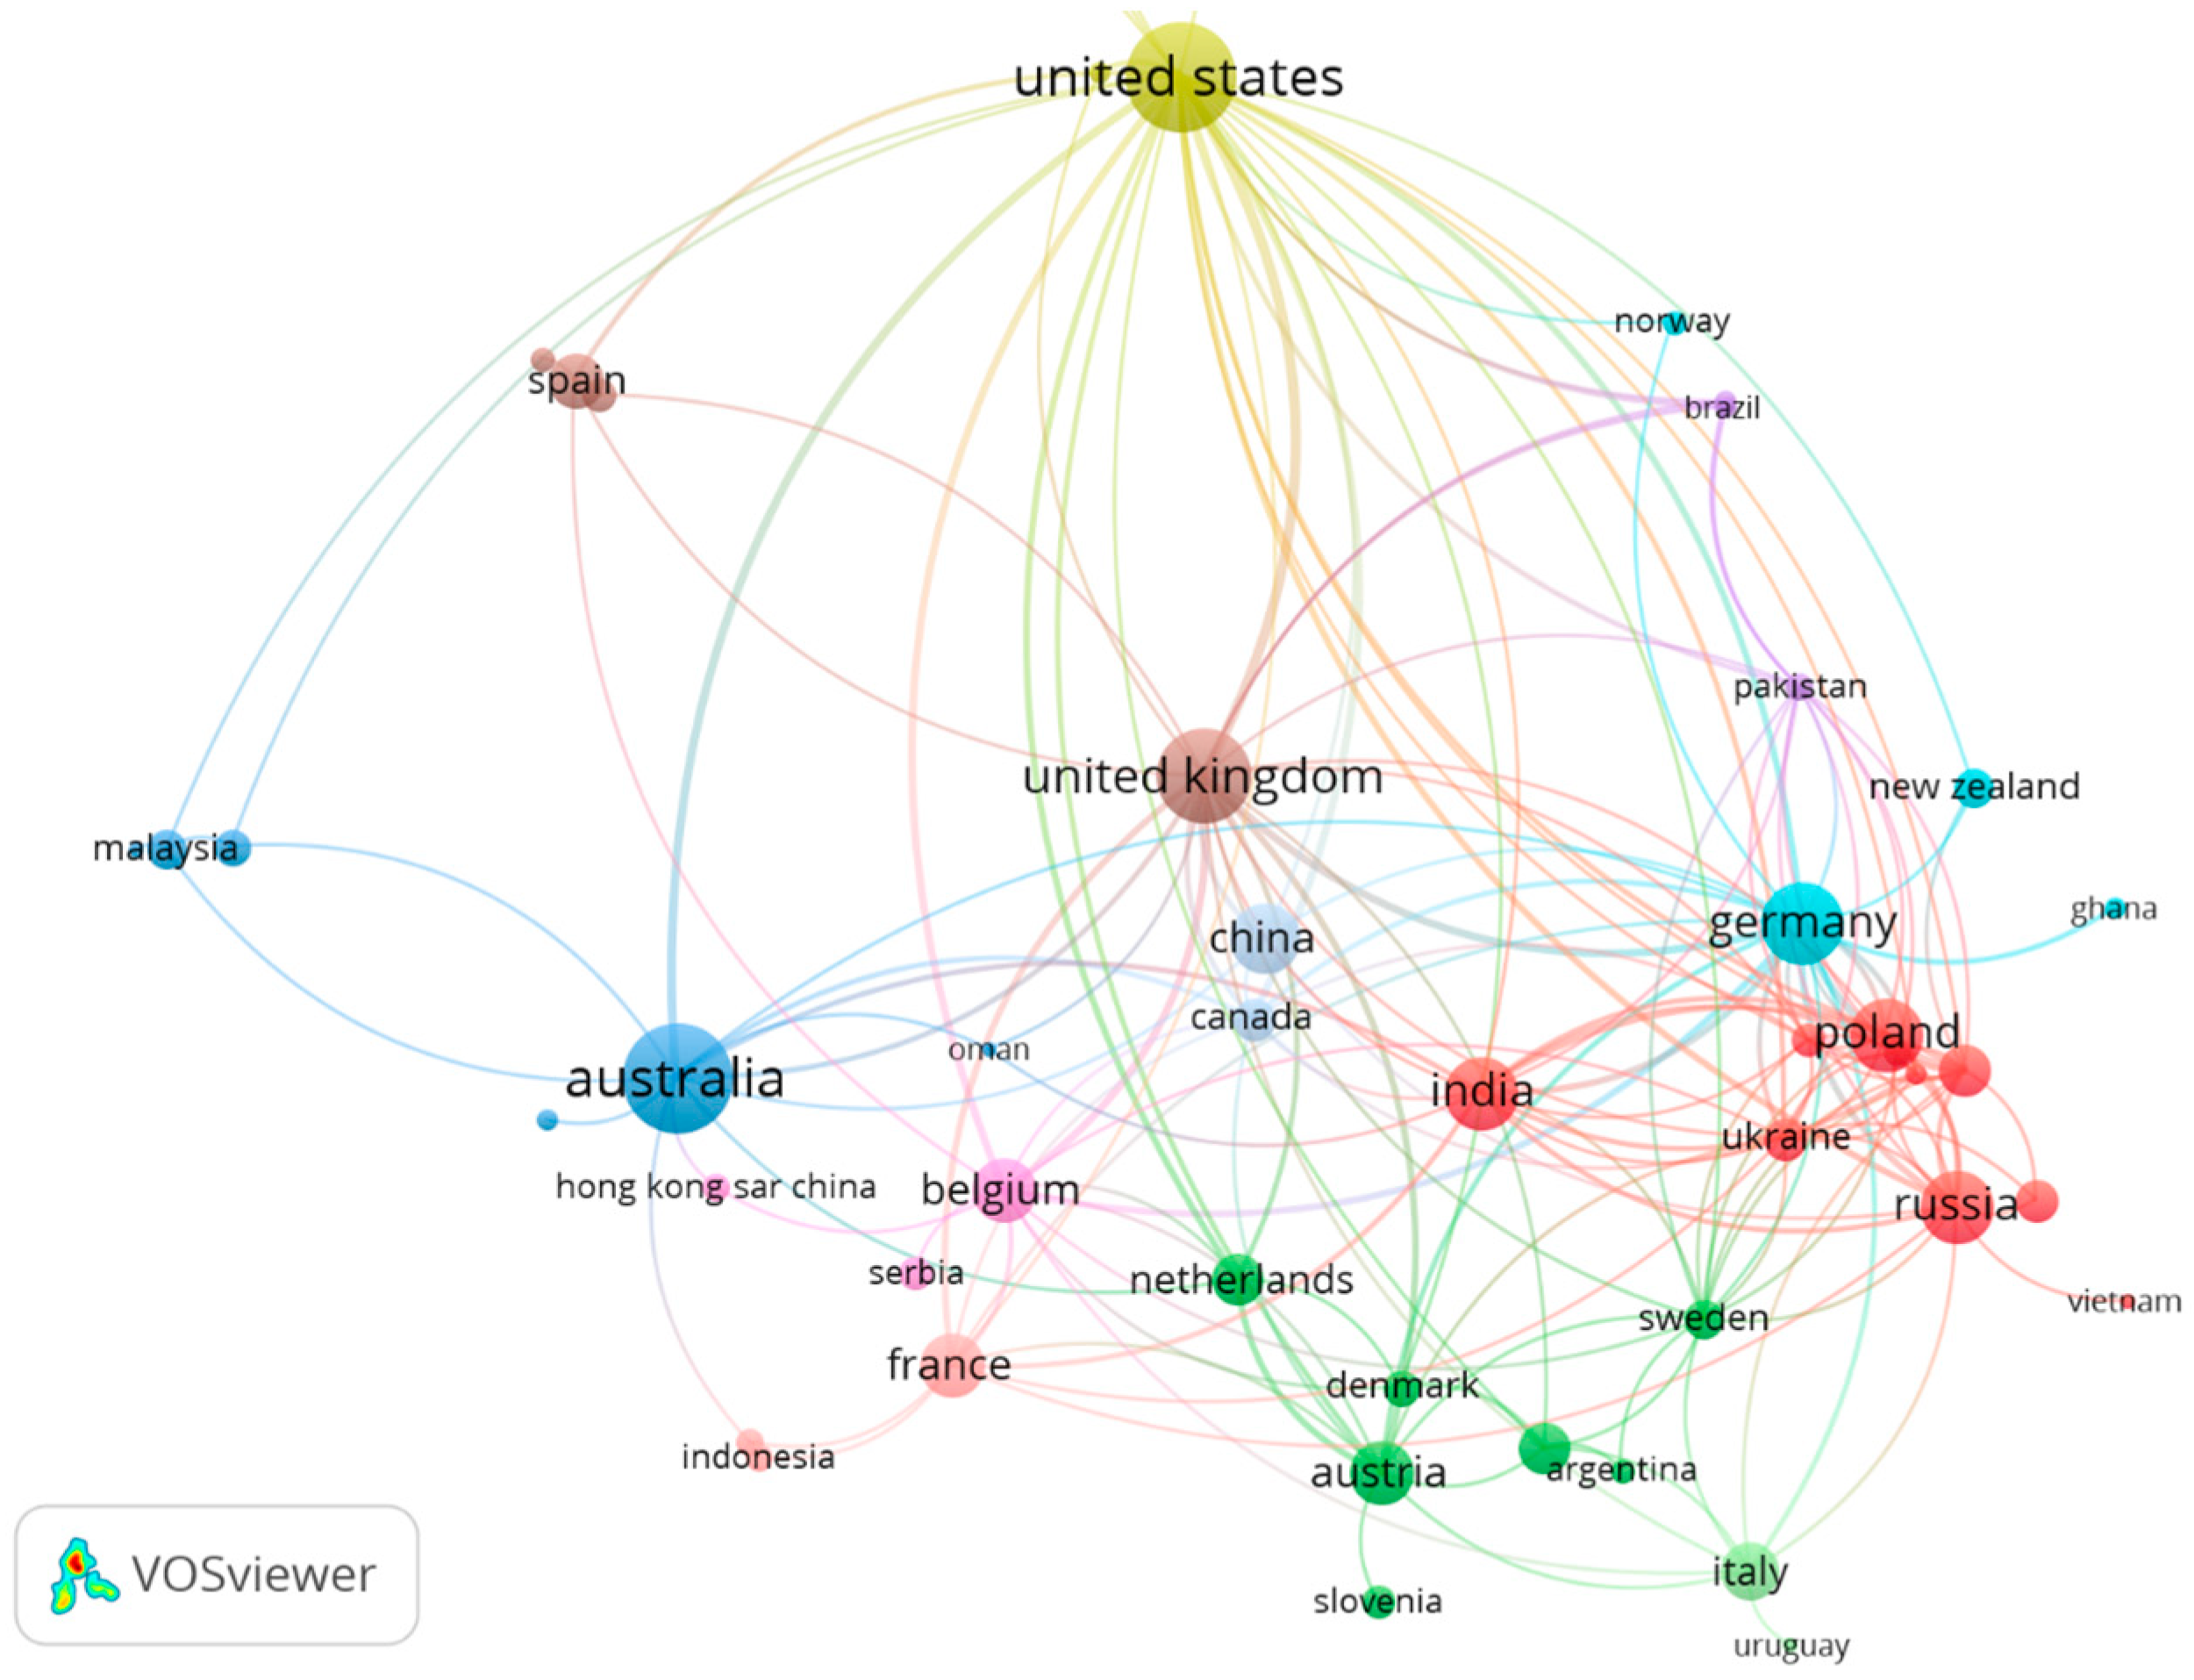
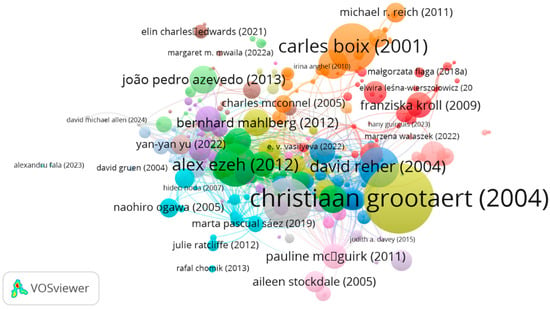
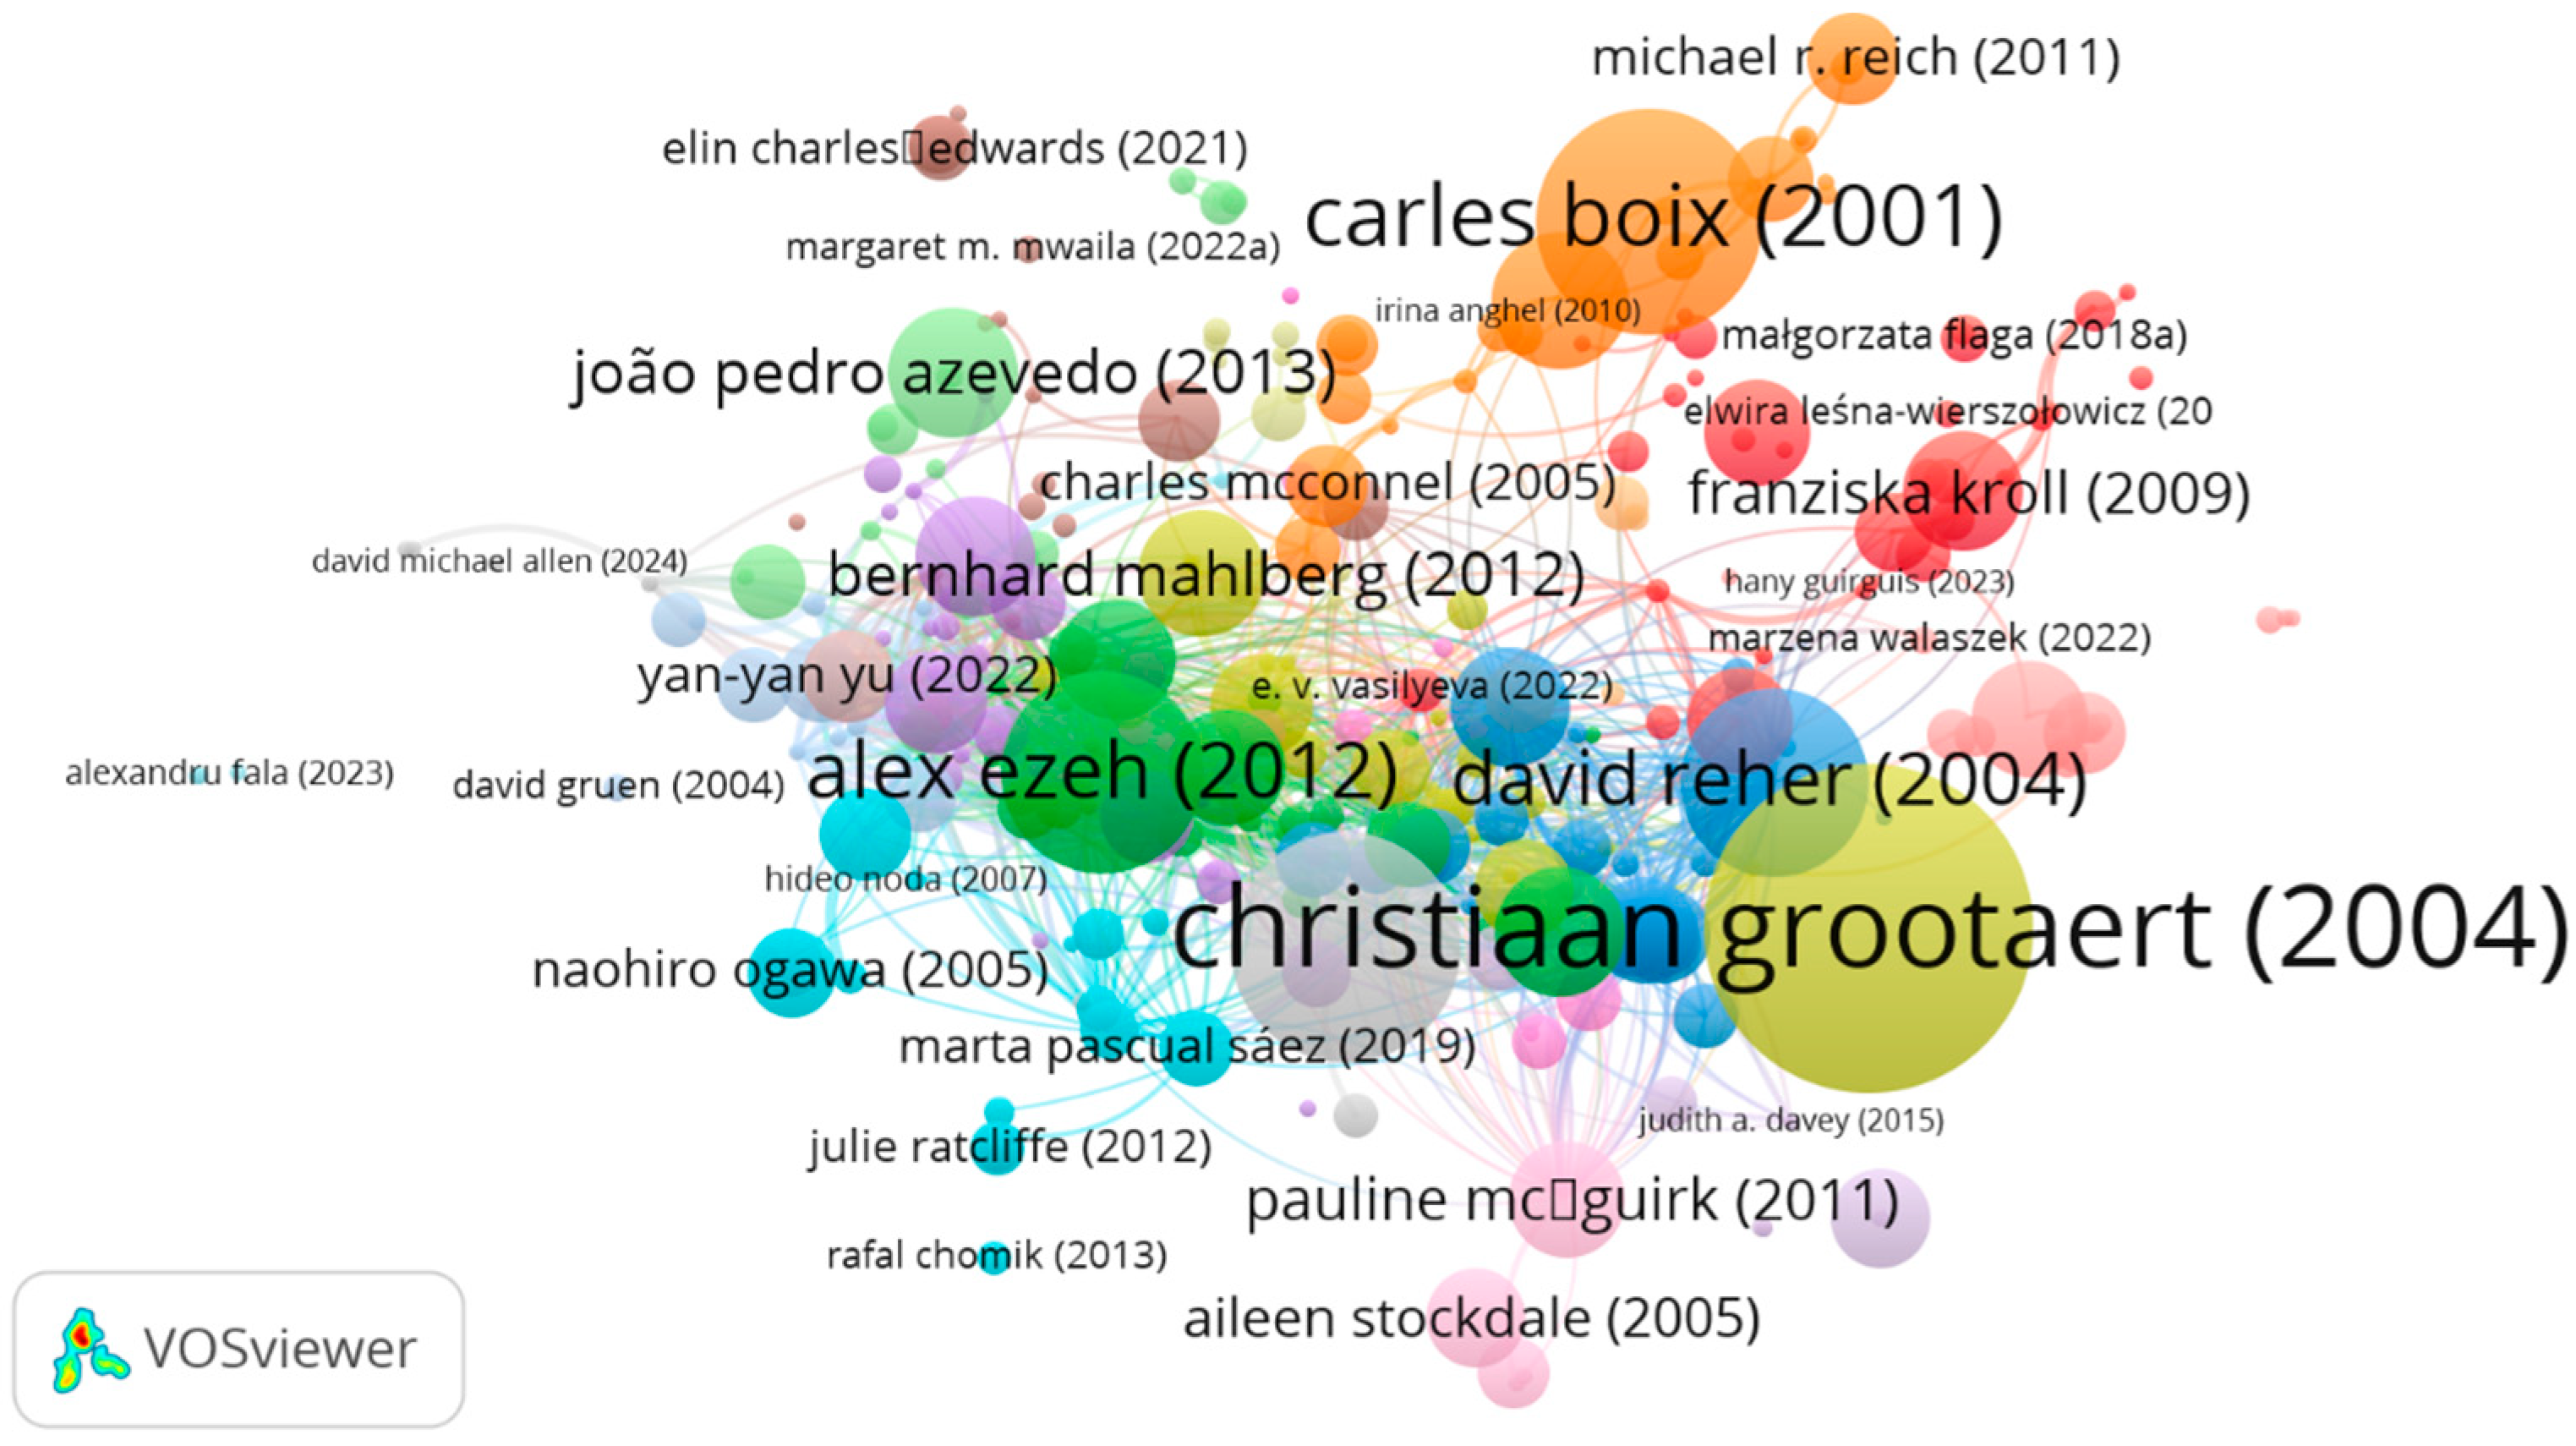
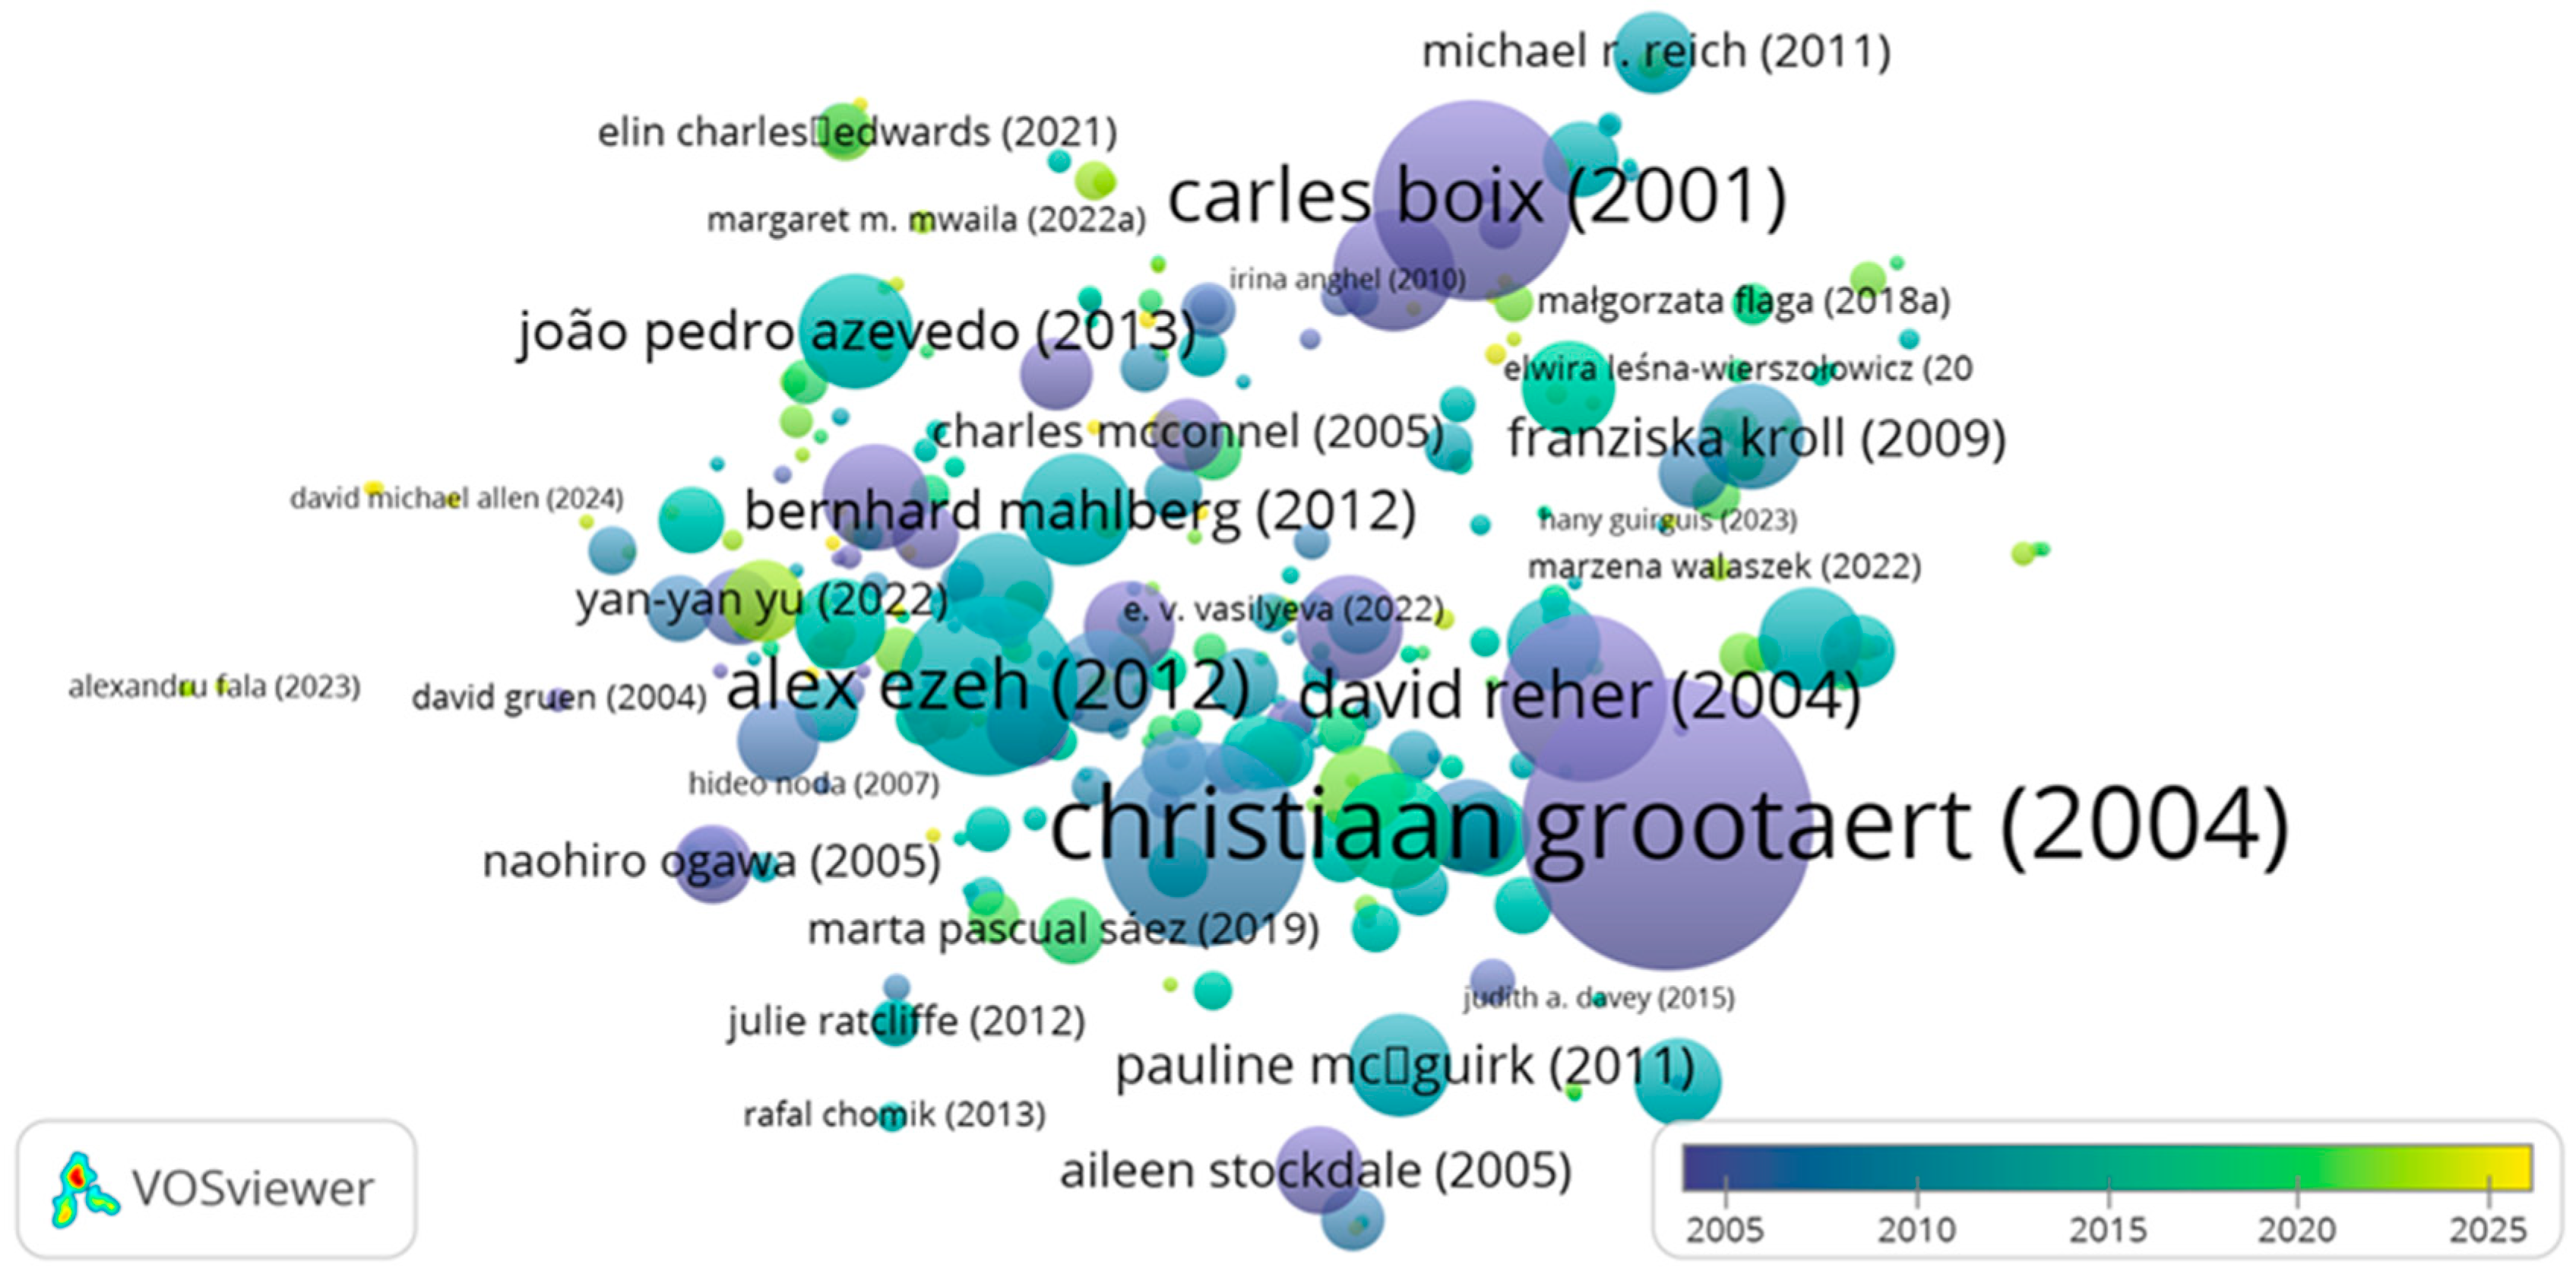
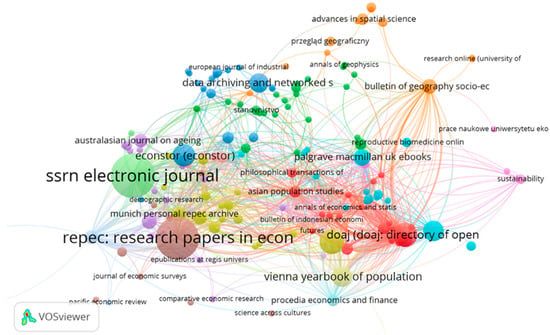
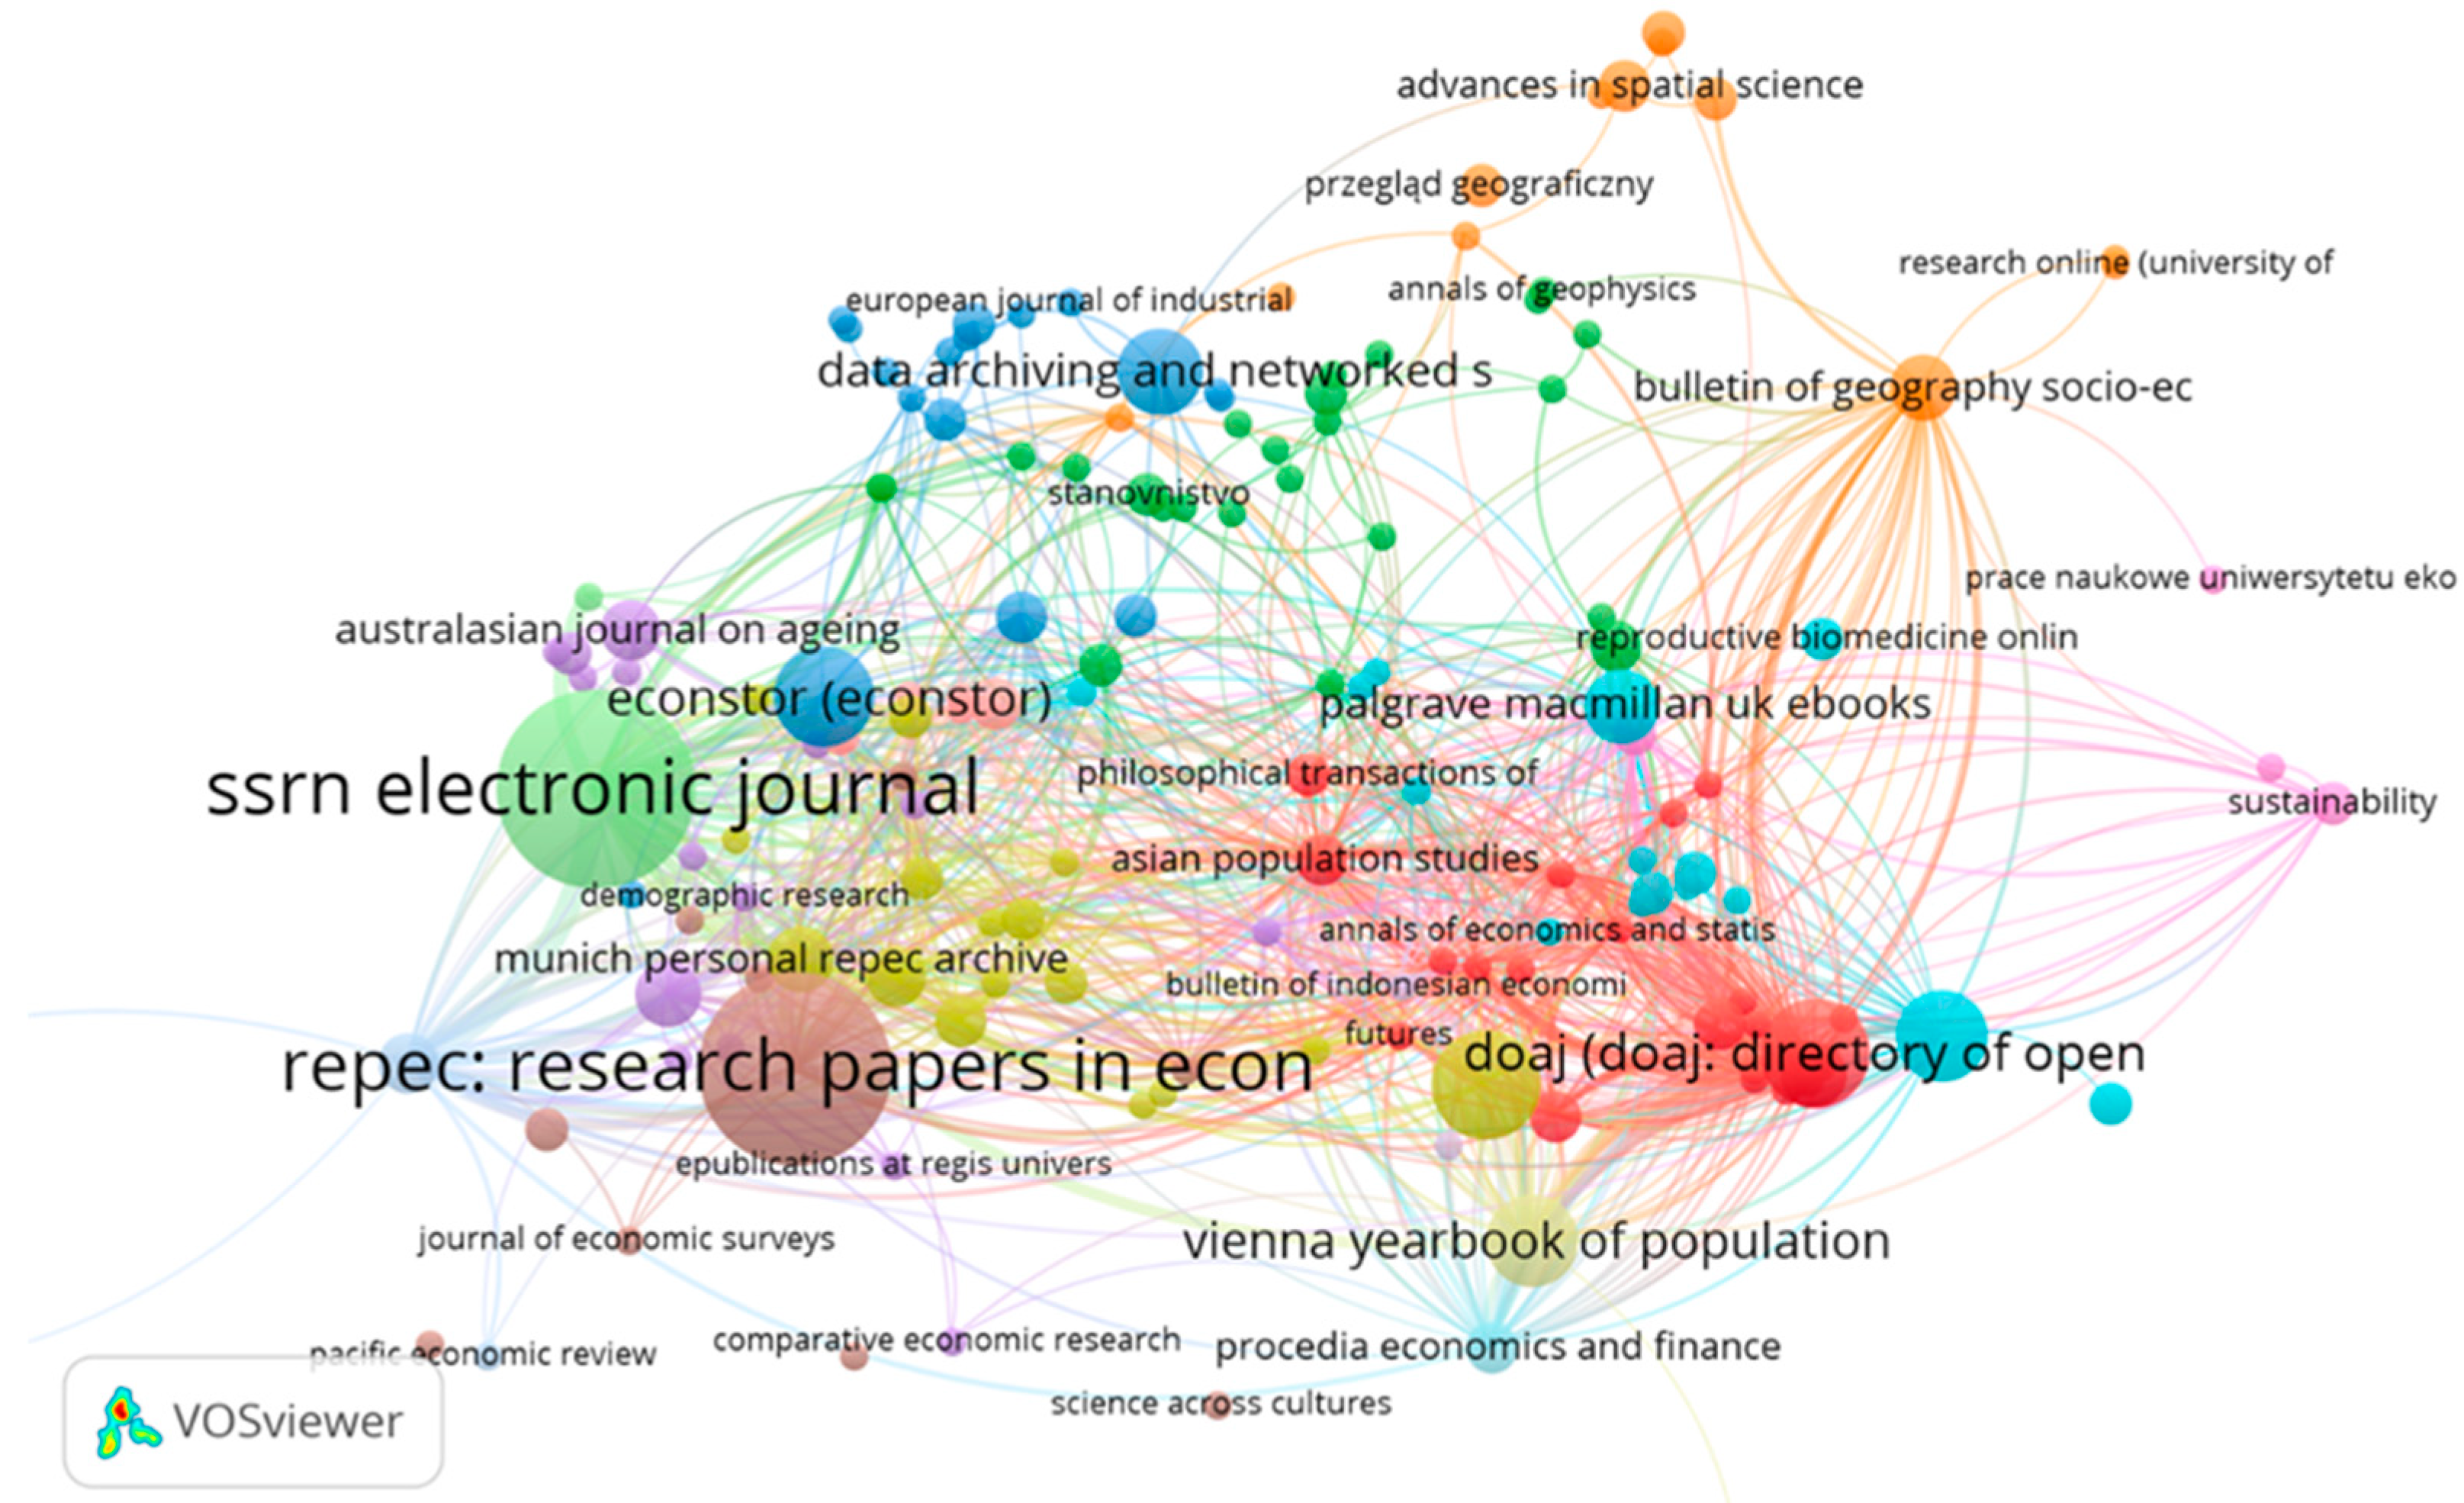
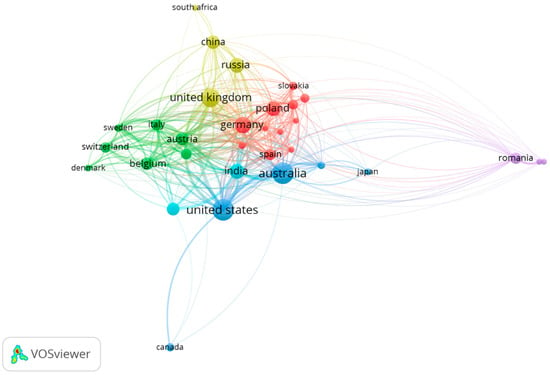
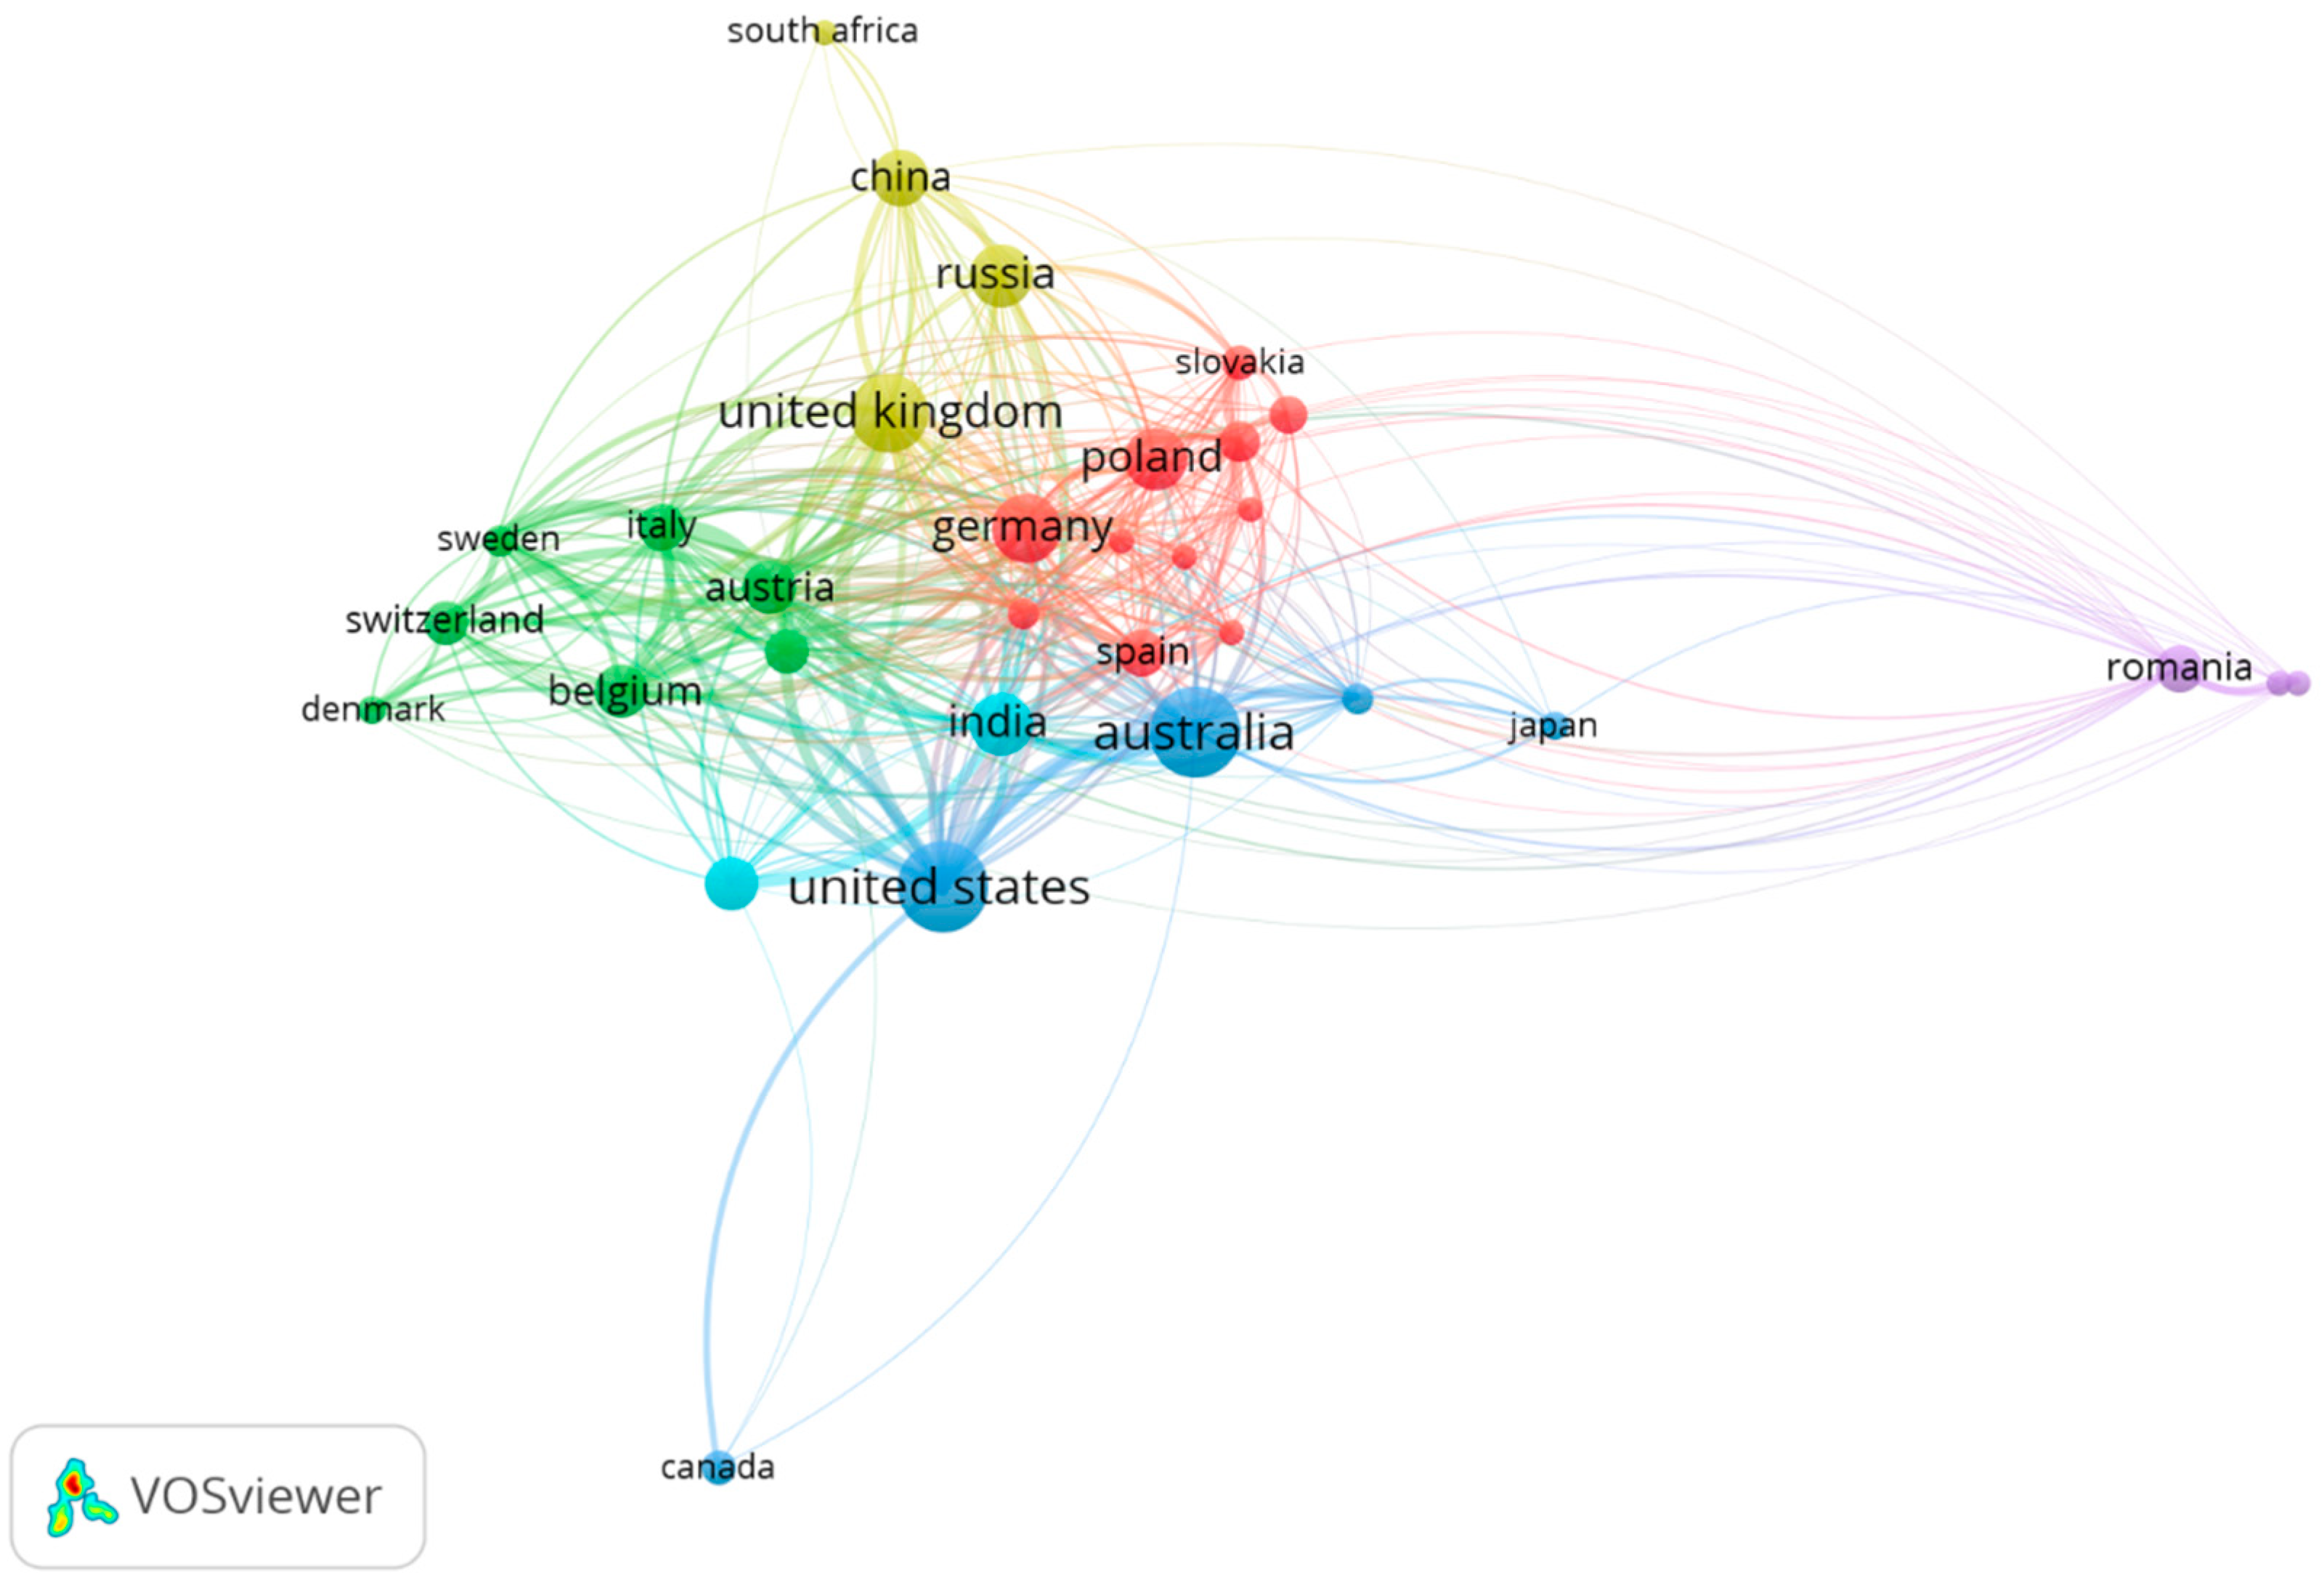

Disclaimer/Publisher’s Note: The statements, opinions and data contained in all publications are solely those of the individual author(s) and contributor(s) and not of MDPI and/or the editor(s). MDPI and/or the editor(s) disclaim responsibility for any injury to people or property resulting from any ideas, methods, instructions or products referred to in the content. |
© 2026 by the author. Licensee MDPI, Basel, Switzerland. This article is an open access article distributed under the terms and conditions of the Creative Commons Attribution (CC BY) license.