


Abstract
Export complexity is usually measured for whole countries, although the capabilities behind complex exports are unevenly distributed within them. This study measures the export-weighted product complexity of Lithuania’s ten counties annually over 2005–2024, combining Statistics Lithuania’s county statistics on exports of goods of Lithuanian origin (1201 four-digit products) with fixed Product Complexity Index values from the Atlas of Economic Complexity. Vilnius county ranks first and Telšiai county last in 2024 under every specification tested, including alternative complexity windows, a harmonised product universe and an Economic Fitness ranking. Vilnius moved from fifth place in 2005 to a lead of 0.36 index points over the second county in 2024; ten products, led by diagnostic reagents, account for three quarters of its 2005–2024 gain, and its 2021 peak reflects nucleic acid and reagent exports rather than commodity prices. The other nine counties became more alike, so overall dispersion changed little while the leading county pulled away. On the breadth-based fitness measure, Vilnius and Kaunas are almost level. Export value and complexity differ sharply: Telšiai, the largest exporter over the period, has the least complex and most concentrated basket.
1. Introduction
Since Hausmann et al. (2007), it has been hard to argue that the composition of a country’s exports is irrelevant to its growth. Economies that export goods usually made by richer producers go on to grow faster. Hidalgo and Hausmann (2009) then reframed the whole question: an export basket is a window onto the productive capabilities an economy has accumulated. Export sophistication became a standard lens for judging development prospects.
Almost all of that evidence treats countries as single productive units. But skilled labour, specialised suppliers and research infrastructure do not spread evenly across a national territory. They cluster. In a country with one dominant metropolitan area the problem is acute, because that area can hold most of the sophisticated production while the rest of the country stays in simpler activities. The national average then describes an economy that none of its regions actually resembles.
Subnational research on the question has advanced along three lines. The first transfers national methods to regions, either by estimating complexity from a matrix of regions and activities (Chávez et al., 2017; Reynolds et al., 2018; Török et al., 2022) or by placing regions inside the world matrix of countries and products (Operti et al., 2018; Çınar et al., 2022). The second asks whether such transfer is valid. Cicerone et al. (2020) argue that the method cannot be applied unchanged to regions of developed economies; Davies and Maré (2021) find that complexity predicts employment growth in large New Zealand cities but not in small ones; and Du and Zaccaria (2026) report that product complexity estimated within a national set of regions is barely correlated with complexity estimated on world trade, which favours exogenous product scores at the subnational scale. Çınar et al. (2022), in contrast, find little difference between endogenous and exogenous fitness for Turkey’s regions. The third line concerns data: most regional studies rely on employment, patent or registered-seat trade records, because product-level trade by region of production is rarely published (Balland & Rigby, 2017; Umiński, 2025). What this literature has rarely combined is product-level trade data assigned by origin, a NUTS-3 territorial unit and an annual panel long enough to separate levels from trajectories. Studies also seldom report whether their spatial conclusions hold when the complexity measure changes, although endogenous and exogenous approaches can disagree, or which products drive regional change, a distinction needed to tell broad upgrading from the rise of a handful of goods.
Lithuania is a useful place to look. It is one of the most open economies in the European Union, it changed structurally at speed after accession, and the gap between the Vilnius–Kaunas axis and the periphery is well documented. Its export sophistication has been assessed at the national level, most authoritatively by the Bank of Lithuania (2013, 2019), which concluded that exports remain concentrated in low- and medium-complexity products and that movement towards more complex manufacturing is “rather slow-paced.” That evidence, however, stops in 2017 and treats the country as a single unit. More recent work has extended the national picture in other directions: Petrylė (2023) on the evolution of Lithuania’s export network and Mandziukaitė (2026) on the quality elasticity of manufacturing exports. None of this work measures complexity at the county scale.
This study measures export complexity at the county scale, using Statistics Lithuania’s statistics on exports of goods of Lithuanian origin by four-digit product, county, partner country and month. The extraction covers January 2005 to December 2025 (7.1 million monthly records); the analytical panel covers the complete years 2005–2024. Combining these data with fixed product complexity scores from the Atlas of Economic Complexity, we compute revealed symmetric comparative advantage and an export-weighted product complexity index for each county and year, and we test the results against alternative complexity windows, a harmonised product universe and an Economic Fitness ranking.
The paper makes three contributions. First, it documents how a county-level complexity panel can be built from origin-based trade statistics, including the treatment of territorial aggregates, classification changes and matching to world complexity scores, and it shows which results depend on those choices. Second, it shows that the county ranking is stable at both ends: Vilnius ranks first and Telšiai last in 2024 under all specifications, but the size of the leading-county gap depends on the measure. On value-weighted complexity Vilnius pulls away from the rest after 2010; on breadth-based fitness Vilnius and Kaunas are almost level. Third, it decomposes county change into product contributions. The rise of Vilnius from fifth place in 2005 rests on a small number of biotechnology and optical products, while the declines in Alytus, Panevėžys, Šiauliai and Tauragė each reflect the exit of one product line. The remaining counties became more similar to one another over the period.
We should be clear about what this paper does not do. It measures, maps and describes. It does not estimate the effect of complexity on regional income, and it does not derive diversification strategies for individual counties. Section 7 sets these out as specific research questions.
Section 2 reviews the literature. Section 3 describes the data and the attribution problem, which is the main obstacle to work of this kind. Section 4 sets out how the indices are built and defines the concepts, Section 5 reports the results and their robustness, and Section 6 reads them against the existing Lithuanian evidence. Section 7 concludes.
2. Literature Review
This study assumes that a region’s exports tell us something about its capabilities and its likely future performance. This assumption draws on three separate bodies of literature.
The first is about measurement: how export sophistication and economic complexity are defined and computed. The second takes those measures below the national level, where most of the interesting variation occurs. The third is the evidence concerning Lithuania and its Baltic neighbours specifically. We take each in turn and then discuss the problem that has limited this kind of work: the difficulty in obtaining trade data that can be assigned to specific regions.
2.1. Export Sophistication, Economic Complexity and Growth
Classical trade theory treated the gains from specialisation as broadly independent of what a country specialised in. The “what you export matters” literature challenged this view, arguing that the composition of exports conditions long-run growth. Lall et al. (2006) constructed sophistication indices from the technological and factor content of products and showed that the share of technologically advanced exports helps explain growth divergence among developing economies. Hausmann et al. (2007) formalised the argument through two indices that remain central to the present paper. PRODY measures the income level “implied” by a product as the revealed comparative-advantage-weighted average of the per capita incomes of the countries that export it; EXPY is the export-weighted average of the PRODY values in a country’s basket. Their central finding, that economies whose EXPY exceeds their current income level subsequently grow faster, implies that productive capabilities are accumulated before higher incomes are realised.
Hidalgo and Hausmann (2009) recast sophistication in endogenous terms through the Economic Complexity Index (ECI), inferred from the bipartite country–product network by the Method of Reflections, which iterates the diversity of a country’s exports and the ubiquity of its products rather than anchoring complexity to external income. Felipe et al. (2012) linked the accumulation of capabilities to the middle-income trap. The measurement literature, however, remains unsettled. Cristelli et al. (2013) showed that the linear Method of Reflections can behave unstably on unbalanced networks and advocated non-linear alternatives; Sciarra et al. (2020) proposed a unifying framework reconciling the linear (ECI) and non-linear (fitness) approaches; and Koch (2021) demonstrated that, under global value chains, gross-export complexity embeds foreign value added, so value-added measures can reorder rankings and strengthen the growth relationship. This caveat applies to open economies with a large re-export trade, such as Lithuania. Measuring exports of Lithuanian origin removes goods that leave the country without substantial transformation, but it does not separate domestic from foreign value added in goods processed in Lithuania; our index therefore describes the complexity of what a county exports, not of the value added there.
2.2. Measuring Specialisation and Complexity
Empirical work in this tradition rests on measures of revealed comparative advantage. The RCA index of Balassa (1965) comparescompares a unit’s export share in a product with that product’s share in a reference economy. Because the RCA is bounded on the unit interval for the absence of specialisation but unbounded above for its presence, it is asymmetric and generates heteroskedastic errors; Vollrath (1991) and Laursen (2015) therefore recommend the revealed symmetric comparative advantage index, RSCA = (RCA − 1)/(RCA + 1), bounded on [−1, 1] with positive values indicating advantage, which this paper adopts.
A deeper choice concerns exogenous versus endogenous complexity. Exogenous metrics PRODY and EXPY tie sophistication to external income and are transparent and readily interpreted but face a circularity critique: products may appear complex merely because high-income countries export them. Tacchella et al. (2012) took a different route. Rather than averaging across exporters, their fitness framework lets the least capable exporter cap what a product can score, which removes the circularity that troubles income-weighted measures. Two later papers built on this concept: Servedio et al. (2018) with a stable estimator and Operti et al. (2018) with evidence that the non-linear measure forecasts growth better than linear reflections. We use exogenous product scores for the main index, for the reasons set out in Section 4.2, and report a fitness ranking as a robustness check (Section 5.6). Unit values per kilogram can reveal quality differences within a product code; they are not used here because the dataflow did not return quantities for all cells.
The final gap concerns time. Subnational applications are typically static, and a single cross-section conceals the direction of travel: a county holding steady at a middling value may have arrived there by improving or by declining. Umiński (2025) addresses this for Poland by classifying regions according to how their export structure shifted across two decades rather than its composition at the end of that period. Our series runs annually from 2005, which lets us report levels and trajectories together, and Section 5.3 shows why that matters in the Lithuanian case: the county ranking changed substantially between 2005 and 2024 (Spearman ρ = 0.38).
2.3. The Subnational Turn
A single number for a whole country averages values for places that have very little in common. Lithuania scores respectably on complexity rankings, but that score is produced by ten counties whose export baskets range from diagnostic reagents to refined crude. Measuring below the national level is the only way to see this.
The studies listed in Table 1 differ in method and in period, but they keep arriving at the same shape. Complex activity develops in metropolitan cores, and peripheries are left with the simpler activities that many other places can also perform (Minondo, 2010; Cicerone et al., 2020; Çınar et al., 2022; Török et al., 2022). They differ markedly, however, in their data. Where subnational trade data exist, authors use them (Minondo, 2010; Jarreau & Poncet, 2012; Umiński, 2025); where they do not, they substitute employment or patent records: Chávez et al. (2017) and Török et al. (2022) rely on employment and company data, and Balland and Rigby (2017) on patents. This distinction is consequential here: the closest precedent, the Romanian county-level analysis of Török et al. (2022), was obliged to use employment data precisely because county-level trade data were unavailable. Lithuania’s origin-based regional trade statistics relax that constraint, enabling a genuinely trade-based subnational analysis. Methodologically, the Polish study of Umiński (2025) is closest, introducing dynamic clustering of regional export change, although it does not compute complexity indices.
Table 1.
Selected subnational applications of export-sophistication and economic-complexity measures.
2.4. Regional Trade Data and the Attribution Problem
When comparing countries, you need not ask where inside a country an export came from. Working with regions, you do, and the answer is often unsatisfying.
Customs and tax systems generally record a transaction against the address at which the exporting firm is registered, which is usually its head office, not the factory floor. This is the Rotterdam effect turned inwards. A large or foreign-owned firm registers in the capital and manufactures two hundred kilometres away; the capital gets credited with the export, and the county that actually built the item does not.
European Union practice makes this harder rather than easier. Intrastat is a survey, and surveys handle multi-plant firms poorly. Confidentiality rules then suppress exactly the cells in which a single firm dominates a small county, and such counties are usually peripheral.
Other regional studies un into the same problem and acknowledge it. Umiński (2025) is explicit that Polish figures follow the registered seat. Çınar et al. (2022) show a related distortion from the other direction, where preferential border-trade regimes inflate recorded exports in provinces that produced none of the goods.
2.5. The Lithuanian and Baltic Evidence and the Research Gap
For Lithuania, export sophistication has been assessed most authoritatively at the national level by the Bank of Lithuania (2013, 2019), which documented an upgrading towards capital-intensive goods but a broadly static, medium-complexity structure by 2017. National assessments by international organisations, together with sectoral studies of niche successes such as the laser industry, reinforce this aggregate picture. Regional heterogeneity within Lithuania and its Baltic neighbours has been examined in its own right through socio-economic disparities across NUTS-3 regions, GDP convergence and cohesion, subnational human-development indices, and characterisations of a “tale of two economies” and a recent dataset assembles trade, foreign investment and migration for the Baltic NUTS-3 regions. None of this work, however, measures export sophistication or complexity at the subnational scale.
Taken together, the Baltic evidence is therefore national or sectoral in scope. Recent country-level work confirms the importance of structural upgrading in the region: Gabrielczak and Serwach (2020) find that monetary integration raised the complexity of Estonian exports, and Hu et al. (2022) report that trade facilitation improved export technological sophistication in the Baltic States more than in other European transition economies. Valentinaitė et al. (2026) show that Lithuania has narrowed the productivity gap with Nordic economies across a broad range of sectors, and Kalendienė (2024) notes that its manufacturing base is diversified yet still ranks modestly on economic complexity. These studies treat each Baltic economy as a single spatial unit, so internal differences remain outside their scope. The present study is conducted at the county (NUTS-3) scale, using origin-based regional trade data to compute revealed specialisation and export-weighted product complexity during 2005–2024 for the ten Lithuanian counties.
3. Data
We use one main dataset and two supporting sources. Because these data have not, to our knowledge, been used for complexity measurement, we document in detail their construction and limits.
3.1. The Primary Source: Exports of Lithuanian Origin by County
The core data come from Statistics Lithuania (2026), published through its Official Statistics Portal. The portal reports exports of goods of Lithuanian origin, categorized four ways: by Combined Nomenclature four-digit product code, by county, by partner country, and by month. The series starts in 2005.
The extraction uses the Official Statistics Portal SDMX service, dataflow S6R011_M6050121 (exports of goods of Lithuanian origin by Combined Nomenclature four-digit heading, county, partner country and month), retrieved on 26 June 2026. Values are in thousand euro at current prices. The extraction comprises 7,140,564 monthly records covering 1203 CN headings and 223 partner countries from January 2005 to December 2025. The dataflow reports the Republic of Lithuania (code 00), the two NUTS-2 regions (LT01, LT02), and the ten counties (01–10) side by side; only the ten county rows are retained, so no territorial aggregate enters any sum. The partner dimension contains individual countries only, without world or EU totals; the residual codes for countries not specified (QV, QW) account for less than 0.01 per cent of value and are retained. Headings without a numeric CN code are excluded. The service returns only non-empty observations: cells that are missing or suppressed for confidentiality are not transmitted and are therefore absent from the panel. Summed over counties, exports differ from the national total of the same dataflow by at most 0.1 per cent in any year, so confidential suppression and unallocated exports have a negligible effect on county totals. Monthly values are summed to calendar years and the partner dimension is collapsed, giving a county × product × year panel of 88,379 non-zero cells for 2005–2024. The year 2025 is excluded from the analytical period so that it matches the coverage of the complexity source, which ends in 2024.
Two features make these data unusually well suited to our goal. The first is the origin criterion. Goods that arrive in Lithuania and leave again without being substantially transformed are excluded, so what remains is close to what the country actually makes rather than what passes through it. This is closer to domestic production than gross exports, although it still includes foreign value added in goods processed in Lithuania (Section 2.1), and it is the criterion adopted by the Bank of Lithuania (2019) in its national complexity analysis; the present study extends that measurement concept from the national to the county scale. Second, such granularity (product by county by partner by month) is rarely available at the subnational level, and its absence has obliged comparable studies to substitute employment or company data (Török et al., 2022).
3.2. Regional Attribution
The central methodological question for any subnational trade analysis is how exports are assigned to a territorial unit. Where attribution follows the exporting entity’s registered address rather than the production site, capital regions are inflated and industrial hinterlands under-counted. The “of Lithuanian origin” criterion removes re-export contamination but does not by itself resolve intra-national attribution.
Two observations are consistent with attribution to production sites rather than head offices, although neither establishes the rule. First, cumulative exports over 2005–2024 place Telšiai county (EUR 75.7 billion) and Kaunas county (EUR 60.9 billion) above Vilnius county (EUR 53.5 billion), which would be unlikely if exports were credited to the capital, where most large firms are registered. Second, the specialisation profiles in Section 5.1 match the location of selected large production sites: petroleum products in Telšiai, where the Mažeikiai refinery is located, and port-related goods in Klaipėda. These are plausibility checks. They cannot show how exports of enterprises with plants in several counties, or of trading intermediaries, are assigned, and a ranking of county totals cannot rule out partial head-office attribution. We asked Statistics Lithuania for the allocation rule and had not received a reply at the time of revision. Until it is confirmed, we treat regional attribution as an unresolved measurement limitation (Section 6.5) and describe the county profiles as consistent with, not validated against, production locations.
3.3. Auxiliary Data
Product complexity values come from the Growth Lab at Harvard University’s International Trade Data (HS92) release (Growth Lab at Harvard University, 2026), distributed through Harvard Dataverse (doi:10.7910/DVN/T4CHWJ; file hs92_country_product_year_4.csv, downloaded on 10 September 2026). The file reports country–product–year trade flows for 1995–2024 with an annual Product Complexity Index (PCI) for 1243 HS1992 four-digit products.
We chose this over obtaining the figures from Comtrade ourselves. The freely available Comtrade interface returns truncated records with no reporter identifiers, and complexity is computed from the full country–product network, so an incomplete set of reporters would have distorted the index for every product rather than just the missing ones.
4. Methodology
We build the index in three passes. First, we identify the specialisations of each county. We next attach a complexity value to every product. Finally, we combine the two, weighting each county’s products by how much of its export basket they account for. Each step involves choices, which are described explicitly below.
4.1. Revealed Symmetric Comparative Advantage
For each county i, product p and year t, the Balassa (1965) index of revealed comparative advantage is computed as the share of product p in county i’s exports relative to the share of product p in total Lithuanian exports:
RCAipt = (xipt/Σp xipt) ÷ (Σi xipt/ΣiΣp xipt)
Because this index is asymmetric, it is transformed following Vollrath (1991) and Laursen (2015) into the revealed symmetric comparative advantage, RSCA = (RCA − 1)/(RCA + 1), which is bounded on [−1, 1] with positive values indicating specialisation. The national reference is Lithuania as a whole, so RSCA identifies specialisation of a county relative to the national economy rather than to world trade.
Two filters are applied when reporting specialisation profiles. Because a county that is the sole national exporter of a marginal product mechanically attains an RSCA close to its upper bound, profiles are restricted to products with at least EUR 20 million in national exports and at least EUR 2 million in county exports in the year concerned. This retains products of material economic weight and prevents the specialisation ranking from being dominated by statistical artefacts of very small product categories. The unfiltered index is retained for the diversity counts reported in Section 5.5, where the extensive margin is of interest. Two properties of these choices matter for interpretation. Because the thresholds are nominal, export growth alone can lift products above them; we therefore also report counts with thresholds scaled to national export growth, and without thresholds (Section 5.5). And because the reference economy is Lithuania itself, a county that is the only national exporter of a product attains RCA = 1/s, where s is its share of national exports, so the maximum attainable RSCA is (1 − s)/(1 + s). In 2024 this ceiling is 0.66 for Vilnius and Telšiai but above 0.95 for Alytus, Utena and Tauragė. RSCA levels are therefore not comparable across counties, and the measures identify relative export specialisation rather than an inventory of regional capabilities.
4.2. Product Complexity
Each product is assigned a complexity value from the Product Complexity Index of the Atlas of Economic Complexity, which is derived from the global country–product network, following Hidalgo and Hausmann (2009). Complexity is thus computed exogenously, from world trade, rather than from Lithuanian data alone. This choice follows Operti et al. (2018) and Çınar et al. (2022): product complexity should not vary from one economy to another, and deriving it from a single small economy would inject local bias, so that products which happen to be rare within Lithuania would be misclassified as complex. The choice also follows from recent evidence on the subnational scale. Du and Zaccaria (2026) compare complexity estimated within national sets of regions with complexity estimated on world trade and find that the two are barely correlated below the national level, while estimates based on world trade agree with one another. With ten counties, an endogenous product score would be estimated from very few exporters per product. We therefore use world-based scores for the main index and report an Economic Fitness ranking, which places the counties inside the world country–product matrix, as a robustness check.
Annual PCI values move with year-to-year changes in world trade. Each product is therefore assigned the mean of its annual PCI over 2005–2024, the analytical period itself, so that no sub-period is privileged and changes in a county’s index reflect changes in the composition of its exports. Fixed scores make compositional comparisons possible, but they do not establish that a product’s capability requirements stayed constant over two decades. We therefore report the results with 2010–2016 and 2017–2024 means, with 2005 values only, and with time-varying annual PCI (Table A1). Product categories without a numeric code in the source data (residual and unclassified categories) are excluded.
The dataflow records each year under the Combined Nomenclature in force in that year: headings introduced by later HS revisions, such as 3826 (biodiesel) or 8549 and 8806, appear only from the year of their introduction. CN four-digit headings coincide with HS four-digit headings, so headings unchanged since 1992 are matched to the complexity source by identity. Of the 1201 headings with exports in 2005–2024, 21 do not exist in HS1992 and two (3824, 3825) are absent from the complexity source. Each of the 21 is mapped to its HS1992 parent heading, and where a heading corresponds to several HS1992 headings it receives their world-export-weighted mean PCI. Identity matching alone covers 99.3 per cent of export value; coverage is at least 98.2 per cent in every county–year except Klaipėda, where it falls to 94.9 per cent in 2009, and the concordance raises pooled coverage to 99.4 per cent. The remainder consists of headings 3824–3827, for which the source reports no PCI. Because numeric matching does not guarantee that a heading’s content is unchanged, we re-estimate the principal results on the harmonised universe and on the 665 headings whose content is unchanged in every HS revision, which carry 90.5 per cent of export value (Table A1). Index weights are renormalised over matched products, so unmatched exports are not assigned zero complexity.
4.3. County Export Complexity
County complexity is measured as the export-weighted mean complexity of the county’s basket. The aggregation follows the EXPY index of Hausmann et al. (2007), but the product scores are PCI values rather than income levels, and the index is not a county Economic Complexity Index estimated from county data. To keep this distinction visible we call it export-weighted product complexity (EWPC):
where xipt denotes exports of product p from county i in year t and PCIp is the fixed complexity of product p, and M is the set of matched products. The index is computed annually for each of the ten counties over 2005–2024. PCI is standardised to mean zero across products, not across trade flows, so the export-weighted world average of the fixed scores is not zero: it lies between −0.34 and −0.08 over 2005–2024 and is −0.175 in 2024, because low-complexity commodities carry large weights in world trade. We report this world benchmark alongside the county values and use it, not zero, when describing a county as above or below the world average.
EWPCit = Σp∈M (xipt/Σp∈M xipt) × PCIp
The index says what kind of products a county exports, but not how many of them there are or how evenly the value is spread. Two additional figures fill those gaps. The first counts the products in which a county records a positive RSCA, computed both with the size thresholds applied and without them. The second takes the top five products by value and expresses their combined share of county exports. Neither figure contains information on technology, which is the pointnarrowness and complexity are separate properties, and Section 5.4 shows they move together in Lithuania in a way worth noticing.
4.4. Concepts and Measures
The literature uses three related terms, and we keep them apart. Capability refers to the productive know-how of a regional economy; it is not observed directly. Product complexity is a property of a product, measured here by world-based PCI. Export complexity is a property of a county’s export basket, measured by EWPC. We use export sophistication only when referring to the income-based PRODY and EXPY measures. Table 2 sets out how each measure is read.
Table 2.
Concepts, measures and interpretation.
5. Results
This section presents the county-level results. It proceeds in six steps: the specialisation profiles that underpin the indices; the cross-sectional complexity map for 2024; the evolution of county complexity over 2005–2024; the concentration of export baskets; the diversity of specialisation; and the robustness of the results to the complexity measure.
5.1. County Specialisation Profiles
Before aggregating to a single index, it is instructive to examine what each county actually exports with revealed comparative advantage. Table 3 reports the leading specialisations for each county in 2024. The profiles are economically coherent and correspond closely to Lithuania’s known industrial geography, which is consistent with the attribution discussed in Section 3.2.
Table 3.
Leading county specialisations, 2024 (products above the size thresholds defined in Section 4.1).
Several profiles match the location of known production sites: petroleum products in Telšiai, home of the Mažeikiai refinery; ships, scrap and port-related goods in Klaipėda; and reagents, enzymes and optical instruments in Vilnius, where biotechnology and laser producers are concentrated. This correspondence supports the plausibility of the county attribution but does not establish the allocation rule (Section 3.2).
5.2. The County Complexity Map
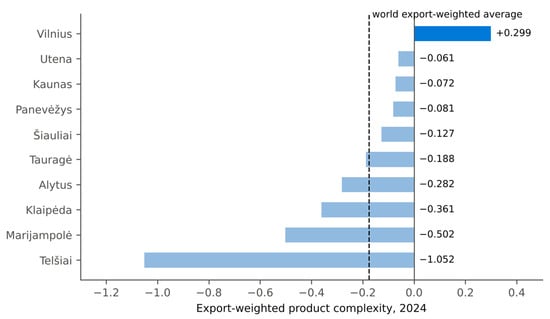
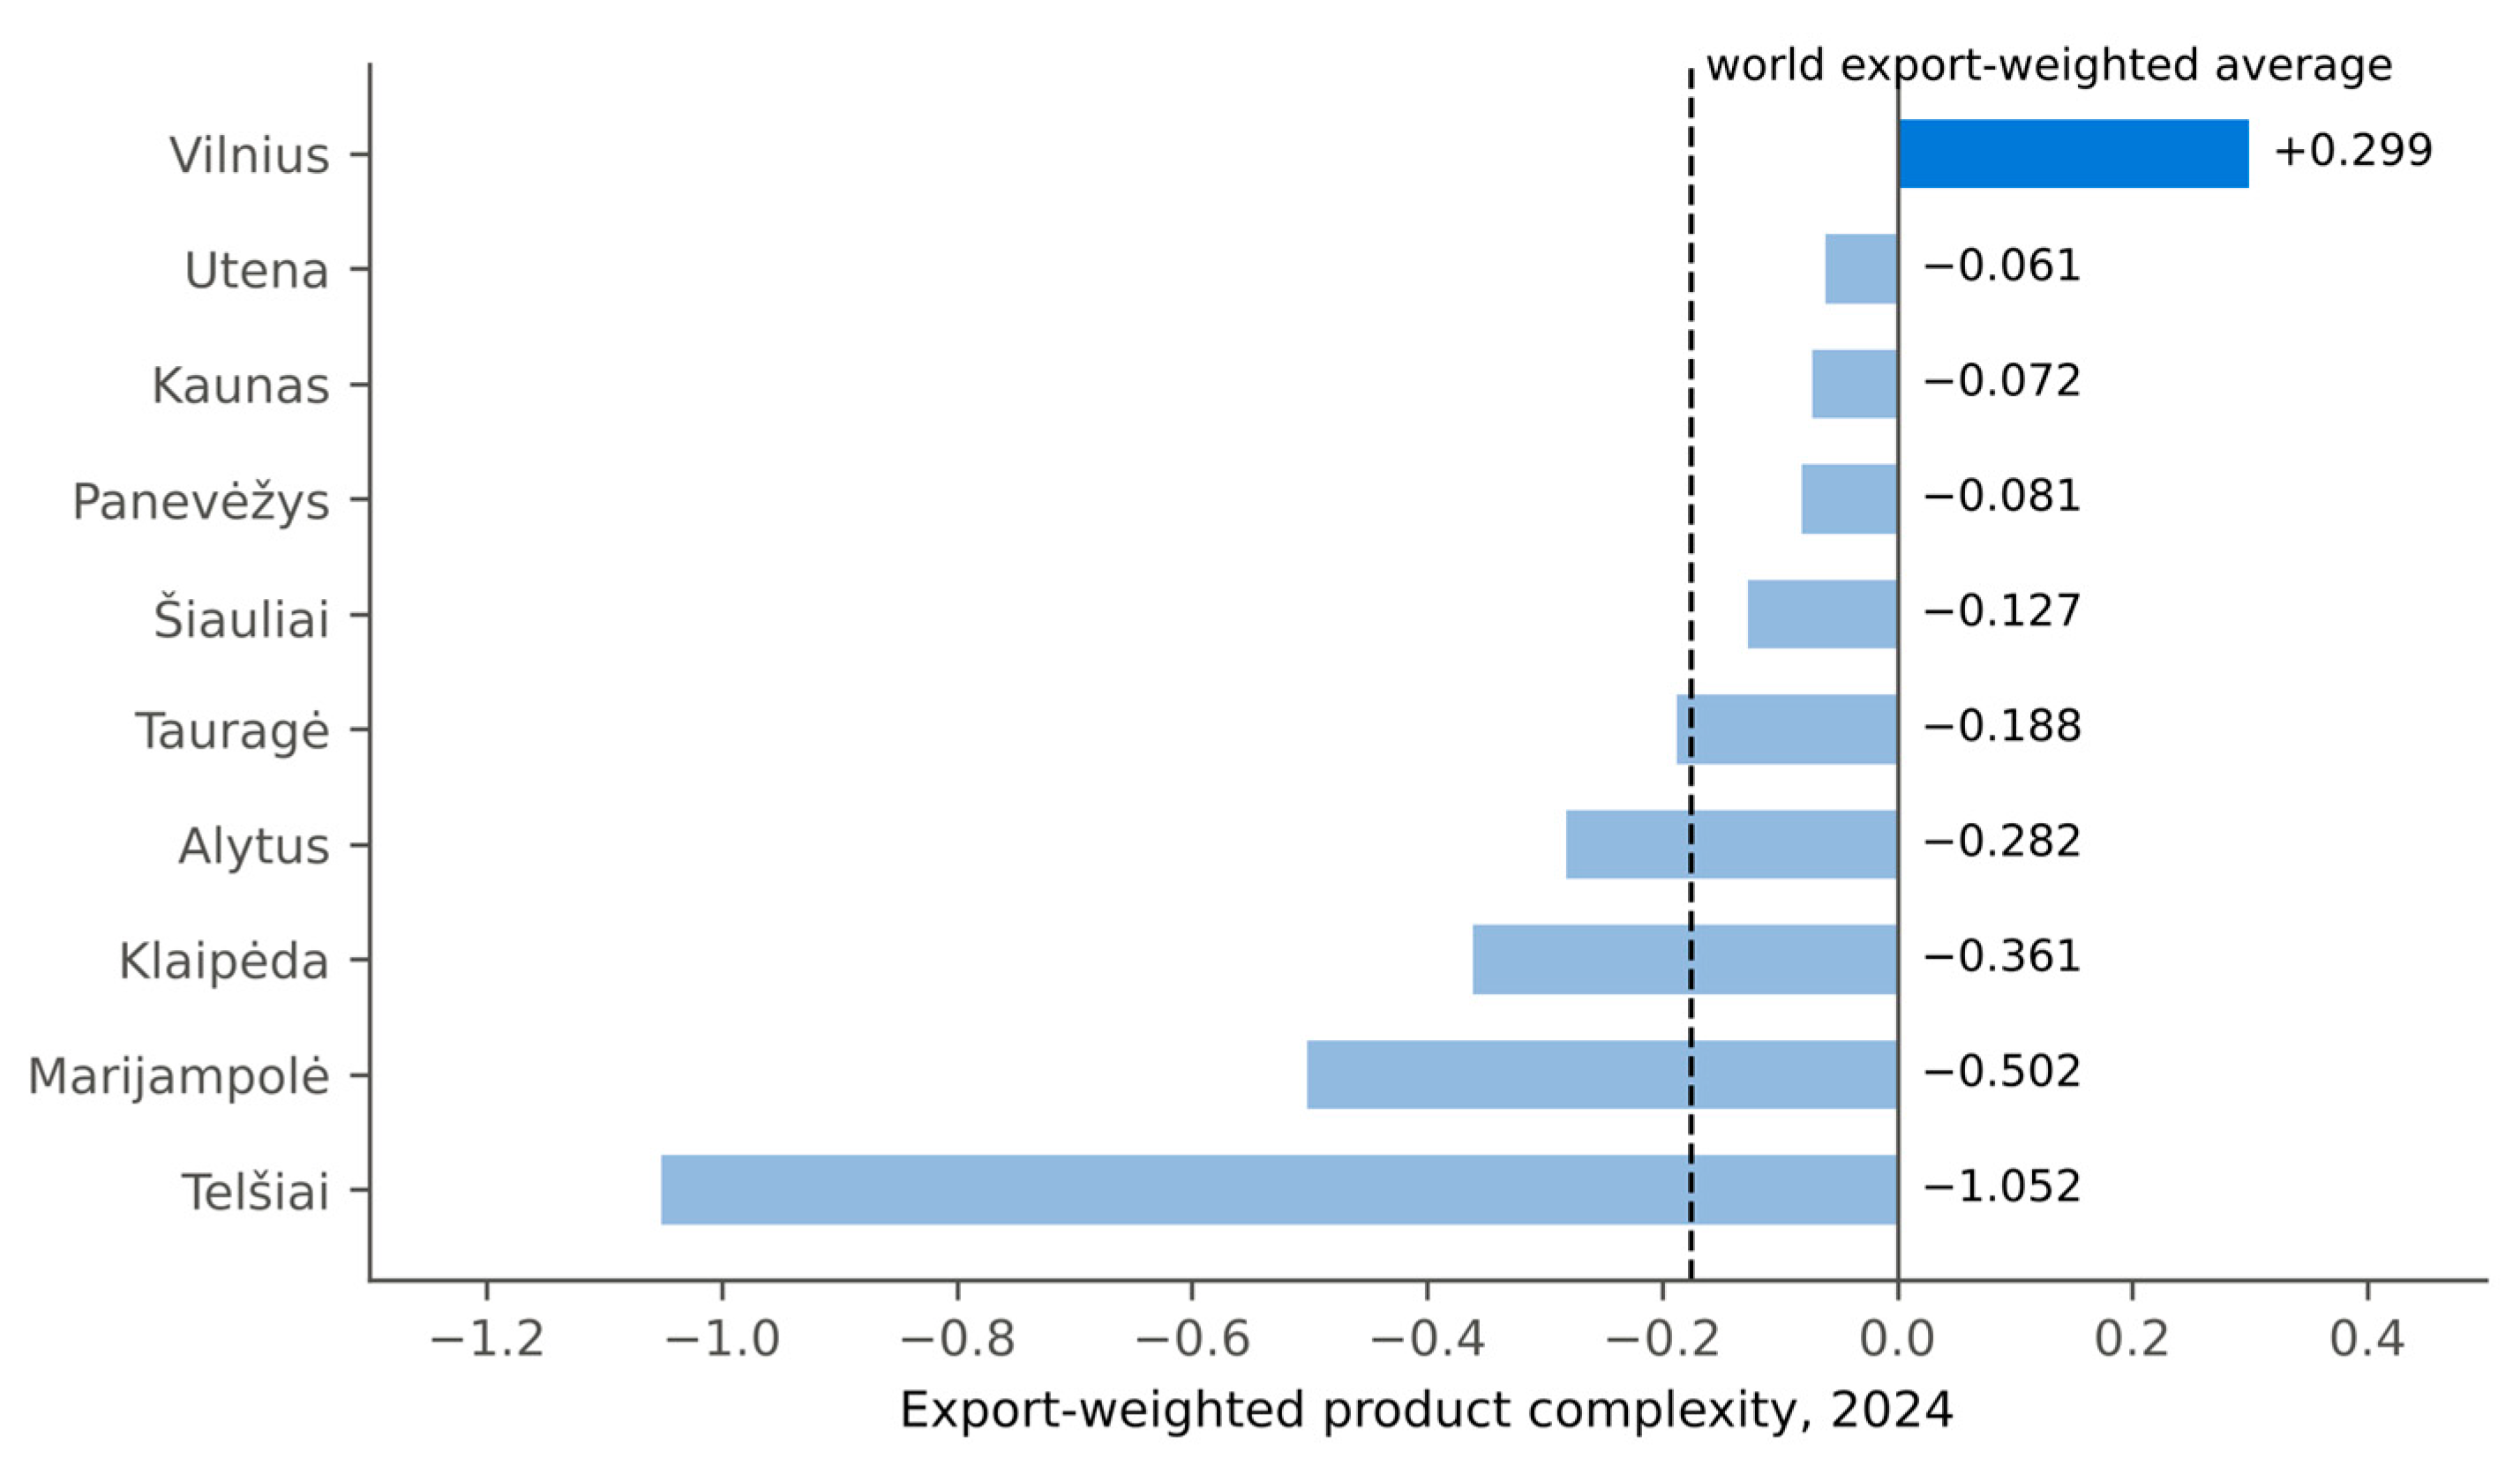
Figure 1 reports EWPC for the ten counties in 2024. Vilnius county records +0.299, 0.36 points above the second-ranked county, Utena (−0.061), followed closely by Kaunas (−0.072) and Panevėžys (−0.081). Telšiai is last at −1.052. Five counties lie above the export-weighted world average of −0.175 (dashed line in Figure 1) and five below it.
Figure 1.
Export-weighted product complexity of Lithuania’s counties, 2024. The dashed line marks the export-weighted world average of the same fixed PCI values (−0.175).
Negative values need care. PCI has mean zero across products, so a negative EWPC means that a county’s basket is weighted towards products below the average product, not that it lies below the world’s export-weighted average, which is itself negative. Measured against that benchmark, the national index for Lithuania rose from 0.52 points below it in 2005 to 0.09 points below it in 2024 (Table 4), consistent with the Bank of Lithuania’s finding that low- and medium-complexity goods dominate the national basket. The county figures show where the national position comes from: one county well above the benchmark, four slightly above it and five below it.
Table 4.
Export-weighted product complexity by county, 2005 and 2024.
The distribution in 2024 has a pronounced leading-county gap. Vilnius sits 0.36 points above the second-ranked county, while the next eight counties lie within 0.45 points of one another. We do not test for a spatial core–periphery gradient, which would require a spatial analysis beyond the scope of this paper; the evidence here concerns the ranking, not distance from the centre.
The complexity ranking also differs from the ranking by export value. Over 2005–2024 as a whole, Telšiai is the largest exporting county, on the strength of refined petroleum, yet it ranks last on complexity in every year. In 2024, the three largest exporters, Kaunas (EUR 5141 million), Vilnius (EUR 5026 million) and Telšiai (EUR 5021 million), rank third, first and tenth on EWPC.
5.3. Trajectories, 2005–2024
Six of the ten counties improved between 2005 and 2024 and four declined; the national index, computed from national product totals, rose by 0.40 points (Table 4), onsistent with the national picture reported by the Bank of Lithuania (2013, 2019). Figure 2 and Table 5 show the county trajectories and the dispersion across counties.
Figure 2.
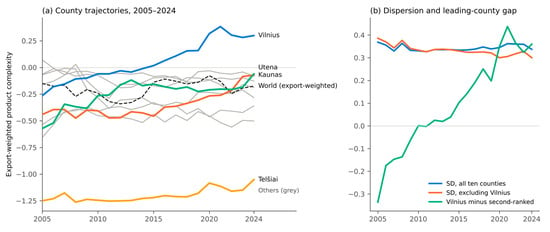
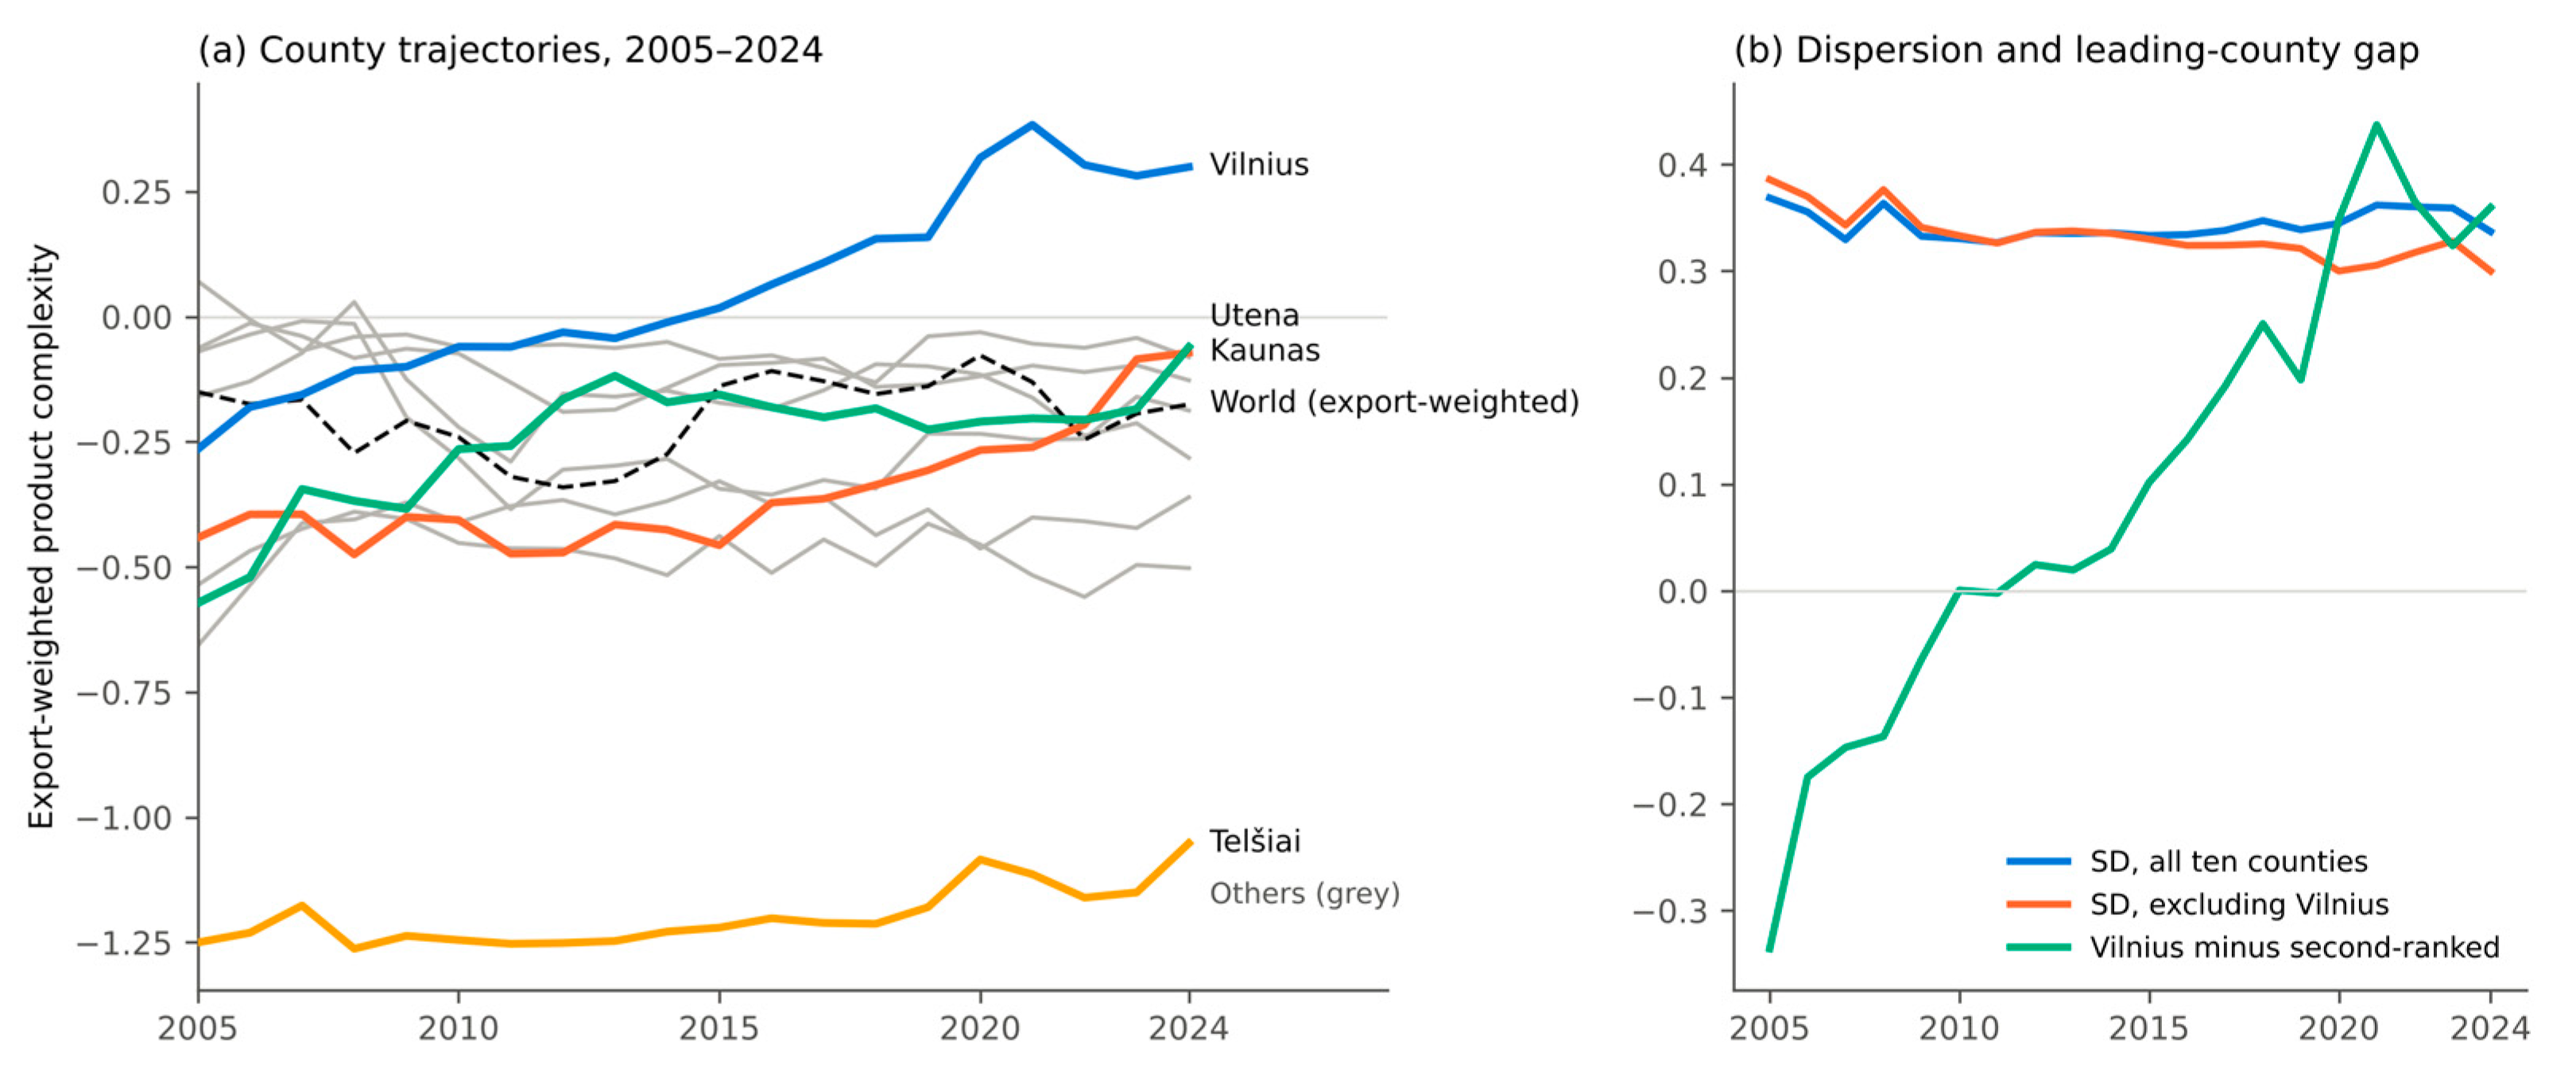
(a) Export-weighted product complexity of Lithuania’s counties, 2005–2024; Vilnius, Kaunas, Utena and Telšiai highlighted, other counties in grey; the dashed line shows the export-weighted world average. (b) Standard deviation across the ten counties and across the nine counties other than Vilnius, and the difference between Vilnius and the second-ranked county.
Table 5.
Dispersion of county complexity and the leading-county gap, selected years.
Vilnius moved within the same band as the other counties until about 2009, ranked first in every year from 2012, and rose most steeply between 2018 and 2021, from +0.155 to a peak of +0.383. The gap that dominates the 2024 cross-section is therefore recent. Table 6 shows what drove it. Diagnostic and laboratory reagents (CN 3822) rose from 0.4 to 10.8 per cent of Vilnius exports between 2005 and 2024 and alone account for 0.14 of the county’s 0.56-point gain; ten products account for three quarters of it. Part of the gain came from the exit of low-complexity clothing and sawn wood, which raised the average without new production. The rise of Vilnius is therefore concentrated in a few high-value products rather than spread across its basket.
Table 6.
Products contributing most to change in selected counties.
The 2021 peak and the partial retreat to +0.299 by 2024 are specific to Vilnius: of the other counties, only Šiauliai shows a comparable rise between 2019 and 2021 followed by a fall, and its movements are small (+0.038 and −0.029). Three checks show that the Vilnius movement does not arise from energy or commodity prices. First, the 2018–2021 rise is explained by nucleic acids (CN 2934; from 0.8 to 4.6 per cent of county exports), diagnostic reagents (3822; from 9.3 to 15.2 per cent) and enzymes (3507; from 0.8 to 6.5 per cent), and the 2021–2024 retreat by the reversal of the first two (Table 6). Second, excluding mineral fuels (HS 27), or all commodity chapters, leaves the Vilnius peak in 2021 and its size essentially unchanged (Table A1). Third, in a placebo test that randomly reassigns PCI values across products 2000 times while keeping each county’s export shares, a rise in Vilnius as large as the observed 0.228 occurs in 0.35 per cent of draws. The pattern is consistent with pandemic-related demand for diagnostic and laboratory inputs, which a descriptive design cannot confirm.
The other counties moved closer together. The standard deviation across the nine counties other than Vilnius fell from 0.386 in 2005 to 0.300 in 2024, and excluding Telšiai as well, from 0.261 to 0.149 (Table 5). Telšiai improved from −1.250 to −1.052, mostly after 2019, but remained last in every year.
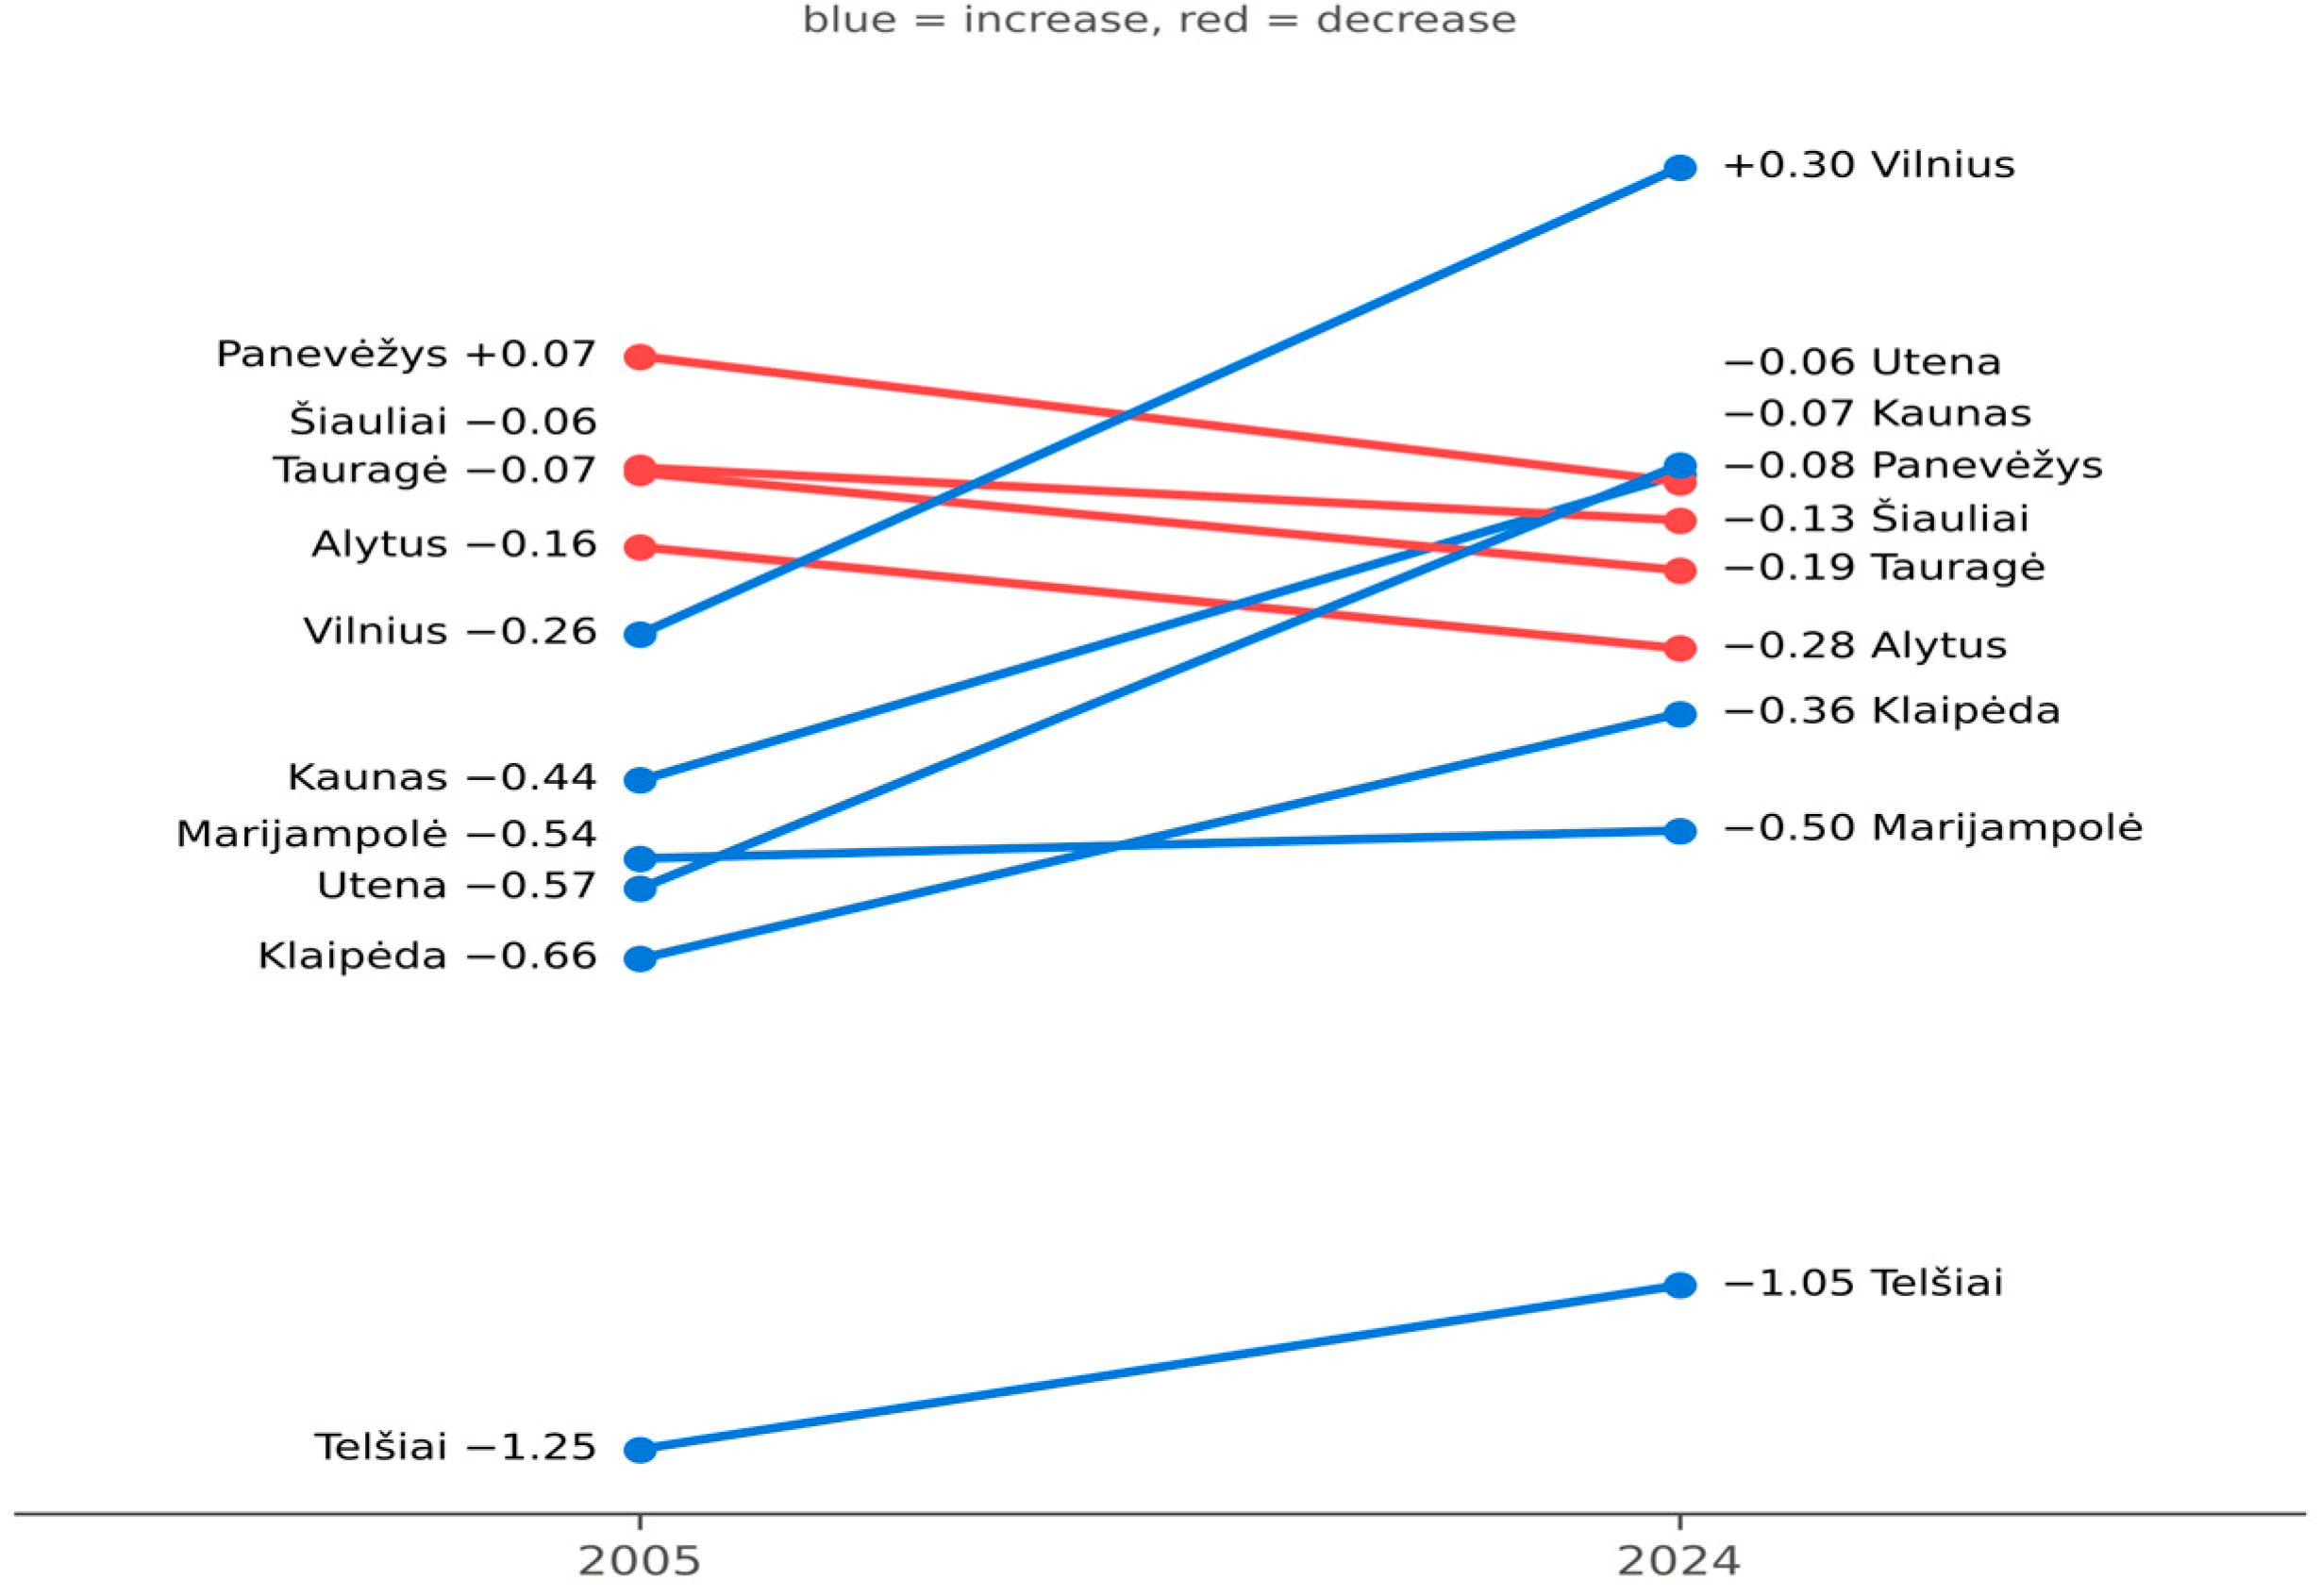
Vilnius gained most (+0.564), followed by Utena (+0.511) and Kaunas (+0.370); Utena’s rise is driven by telephone apparatus (CN 8517) and Kaunas’s by electrical boards and radar equipment together with a falling share of fertilisers. Four counties declined: Panevėžys (−0.152), Alytus (−0.123), Tauragė (−0.117) and Šiauliai (−0.064). Each decline is dominated by the exit of a single high-complexity product line: refrigerators in Alytus (from 31.8 to 1.8 per cent of county exports), cathode tubes in Panevėžys, monitors in Šiauliai and electrical apparatus parts in Tauragė (Table 6). Table 4 sets out the levels.
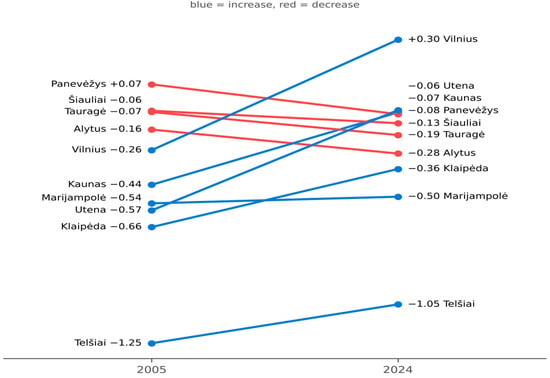
Figure 3 shows the same change as a slope chart. The ranking changed substantially between 2005 and 2024 (Spearman ρ = 0.38). Panevėžys, Šiauliai and Tauragė, the three highest-ranked counties in 2005, fell to fourth, fifth and sixth; Kaunas and Utena rose from sixth and eighth to third and second; and Vilnius rose from fifth to first. Telšiai is last at both dates.
Figure 3.
Export-weighted product complexity by county, 2005 and 2024. Blue: increase; red: decrease. Values are shown at both ends.
Whether overall dispersion widened depends on the complexity scores used. With the main specification the standard deviation across all ten counties fell slightly, from 0.369 to 0.337; with the older Atlas release used in the submitted version it rose from 0.273 to 0.308 (Table A1). What holds in every specification is the combination of a leading county that pulled away, from 0.34 points below the best county in 2005 to 0.36 points above the second in 2024, and nine counties that became more alike. National averages cannot show either movement.
5.4. Concentration of Export Baskets
Complexity measures the technological character of what a county exports; it says nothing about how narrowly that export base is distributed. Because concentration is often discussed in relation to exposure to product-specific shocks, Table 7 reports the share of each county’s exports accounted for by its five largest products in 2024, together with the Herfindahl index.
Table 7.
Concentration of county export baskets, 2024.
In Telšiai county five products account for 84.8 per cent of exports in 2024 and refined petroleum alone for 69.9 per cent. Vilnius has the least concentrated basket (27.8 per cent). Across counties, concentration and complexity are negatively associated from 2010 onward: the Spearman correlation between the top-five share and EWPC is −0.82 in 2010, −0.75 in 2015, −0.78 in 2020 and −0.66 in 2024, and remains between −0.53 and −0.75 when Telšiai is excluded. In 2005 there is no association (−0.12). With ten counties these correlations describe the pattern; they do not establish that diversification and upgrading move together within a county.
5.5. Diversity of Specialisation
Counting matters as well as weighting. A county’s export basket can be complex because one major product is complex or because many products are, and the index alone does not reveal which. Table 8 therefore reports how many products each county holds an advantage in, under nominal thresholds, thresholds scaled to national export growth, and no threshold.
Table 8.
Products with positive RSCA under three thresholds, 2005 and 2024.
With fixed nominal thresholds every county gains specialisations, but most of that gain reflects nominal export growth: national exports were 3.3 times larger in 2024 than in 2005. With thresholds scaled to that growth, Telšiai (+6), Šiauliai (+6) and Alytus (+4) gain, Kaunas and Vilnius change little (+2 and +1), Tauragė is unchanged, and three counties lose (Panevėžys, Klaipėda and Marijampolė). Without thresholds, Vilnius falls from 511 to 444 positive-RSCA products while Kaunas rises from 369 to 405. On these measures Vilnius narrowed its range of specialisations while the value of its complex products grew; Kaunas broadened. The counts measure relative export specialisation within Lithuania and should not be read as an inventory of capabilities.
5.6. Robustness to the Complexity Measure
We test the results in two ways. First, we recompute EWPC with the older Atlas release used in the submitted version, with fixed PCI averaged over 2010–2016 and 2017–2024, with 2005 values only, with annual time-varying PCI, on a harmonised product universe, on the subset of headings stable over the period, and excluding fuels or all commodity chapters (Table A1). Vilnius ranks first in 2024 and its gain is the largest in every case, and its peak falls in 2021 in every case except the content-stable subset (H); Telšiai ranks last in 2024 in every case; Alytus and Tauragė decline in every case; and the standard deviation across the nine counties other than Vilnius falls in every case. The 2024 ranking correlates with the main one at Spearman ρ between 0.86 and 1.00. Whether dispersion across all ten counties widened depends on the specification.
Second, we compute Economic Fitness (Tacchella et al., 2012) by adding the ten counties to the world country–product matrix in each year, following Operti et al. (2018), with Lithuania itself removed to avoid double counting (Table A2). Fitness rewards the number of products in which a unit is competitive, weighted by their complexity, and so measures the breadth of export capability rather than the composition of export value. Vilnius ranks first and Telšiai last in both 2005 and 2024, and the ranking correlates with EWPC at ρ = 0.71 in 2024. The leading-county gap, however, is much smaller: Vilnius’s fitness is 1.03 times that of Kaunas in 2024, down from 1.48 in 2005, and the dispersion of log fitness fell from 0.70 to 0.50. The single-leader pattern therefore describes where complex export value is concentrated; on breadth of capability, Lithuania has two leading counties.
6. Discussion
6.1. Comparison with the National Evidence
The Bank of Lithuania has assessed national export complexity twice, and the present county-level results can be read directly against those assessments. The 2013 analysis, covering 2000–2011, classified exports by factor intensity, educational intensity and technological intensity, and found a clear reorientation away from labour-intensive products, above all clothing and textiles, towards capital-intensive goods, especially road vehicles. It also found that the share of high-technology products declined slightly, mainly through falling electronics exports, and that the Baltic States exported markedly less complex goods than the European Union average: roughly three-quarters of EU exports were capital-intensive or research-oriented, against a little over 40 per cent for Lithuania. The 2019 analysis, comparing 2008 and 2017 using revealed comparative advantage combined with product complexity on exports of Lithuanian origin, concluded that low- and medium-complexity goods predominate, that the share of the most complex goods had remained broadly unchanged, that the largest export groups (food, wood and furniture, chemicals) had not changed, and therefore that progress towards more complex manufacturing was “rather slow-paced,” with growth strongest in medium- rather than high-complexity products. Diversification, however, was found to be increasing.
Table 9 summarises where the two sets of results agree and where they differ.
Table 9.
National evidence and county-level findings compared.
6.2. What the National Picture Conceals
Our results differ from the national ones not in substance but in resolution. During 2008–2017, the period covered by Bank of Lithuania (2019), our national index rose by 0.21 points, and by a further 0.16 points to 2024. Within the aggregate, several counties changed substantially. The capital’s basket reorganised itself around diagnostic reagents, enzymes, nucleic acids and optical instruments, and its index rose by 0.564 over two decades, while Panevėžys, Alytus, Tauragė and Šiauliai fell.
These movements are large and partly offsetting. The national index, computed directly from national product totals, rose by 0.40 points over 2005–2024 (Table 4), but this average combines a large gain concentrated in a few Vilnius products with declines in four counties. A gradual national trend and rapid change in individual counties are therefore compatible.
Diversification behaves the same way under closer inspection. The national trend is upward, and nominal filtered counts rise in every county. But the count depends entirely on where the threshold sits. Drop it and Vilnius has fewer specialisations in 2024 than in 2005, while its EWPC rose; Kaunas gained on both counts. A single national diversification figure absorbs both and distinguishes neither.
The last point concerns the distance between export value and export complexity. Telšiai is first in cumulative export value over 2005–2024, last in complexity in every year, and narrower than any other county, with five products covering 84.8 per cent of its exports in 2024 and refined petroleum alone 69.9 per cent.
In 2013 the Bank excluded mineral fuels from its calculations because price volatility distorts structural indices. For a national series that is reasonable—for a county series it would remove most of Telšiai’s exports. Refining dominates the county’s export basket, which is why Telšiai leads on cumulative export value and ranks last on export complexity. A low EWPC describes the products the county exports; it does not measure the engineering competence of the refinery or the county’s productivity.
6.3. Comparison with Subnational Evidence from Other European Economies
Placing the Lithuanian results alongside the three most closely comparable European studies clarifies what is general and what is specific to a small Baltic economy. Table 10 summarises the comparison.
Table 10.
Lithuania in comparative perspective: subnational export studies in Central and Eastern Europe and Turkey.
Three of these comparisons merit attention.
The Romanian findings differ from ours. Török et al. (2022) find the largest changes among the least developed counties; in Lithuania the largest gain is in the leading county, while the other nine converge. The comparison is limited by measurement: the Romanian study estimates complexity endogenously from employment data across 42 counties, whereas we use world-based product scores applied to trade data for ten. Part of the difference may therefore reflect the measures. One hypothesis, which this design cannot test, concerns urban structure: a country with several large cities offers complex activity more than one location, whereas Lithuania has one dominant metropolitan labour market.
Our finding that export value and export complexity come apart has a Turkish counterpart. Çınar et al. (2022) examine provinces on Turkey’s borders where trade preferences pushed export figures up without the productive base or the incomes moving with them. The goods were made in other provinces and simply passed out of the country through firms registered at the frontier.
Telšiai gets to the same destination differently. Nothing is passing through it; the refinery genuinely processes crude and the value it adds is real. But refining is a low-complexity activity however much revenue it generates, so Telšiai can top the country on cumulative export value and sit last on export complexity without any contradiction. In Turkey the wedge between the two is administrative, in Lithuania it is industrial, and in both cases a national or provincial total large enough to look impressive is not informative about the complexity of its exports.
The Polish study is the closest methodological neighbour and yields the most useful contrast in structure. Umiński (2025) finds strong regional idiosyncrasy across sixteen voivodeships, with several regions forming clusters of their own and no simple gradient organising the country; export trajectories are heterogeneous, shaped by foreign ownership, sectoral inheritance and border location. Lithuania, by contrast, has a pronounced leading county. This difference may reflect economic size, a hypothesis we do not test: Poland’s regions are large enough to sustain distinct industrial identities, whereas in Lithuania complex production concentrates where the thin national supply of specialised skills is deepest. Umiński also documents that Polish regional trade data are attributed to the exporter’s registered seat, which need not be the place of dispatch. This is the same limitation that motivates our attribution discussion in Section 3.2, and its severity in the Lithuanian data remains to be confirmed.
Taken together, these comparisons suggest that complex activity tends to concentrate in metropolitan regions, as Chávez et al. (2017) find for Mexico and Minondo (2010) for Spain, and that the degree of concentration may depend on how many large urban centres an economy has; because the studies use different data and measures, this remains a hypothesis. In Lithuania, a large share of the complex export value is concentrated in one county, although on breadth of capability Kaunas is close to Vilnius.
6.4. Relation to Recent Baltic National Evidence
Three recent contributions on the Baltic economies can be read alongside these county results, and each gains a spatial dimension from them. Valentinaitė et al. (2026) find that Lithuania has narrowed the productivity gap with Nordic economies across an unusually broad range of sectors, including machinery, electronics and food manufacturing. Our county indices suggest where that convergence is located: the activities driving it (optical instruments, diagnostic and enzyme production, and measuring equipment) are concentrated in Vilniusand, to a lesser extent, Kaunas, while several peripheral counties remain specialised in construction materials, basic food processing and refining. Sectoral catch-up at the national level and spatial concentration of capability are therefore compatible, and the second qualifies the first. The connection is closer than a general complementarity. Valentinaitė et al. attribute Lithuania’s gains in electronics and machinery to clusters around Kaunas, Vilnius and Šiauliai, but a sectoral trade model cannot confirm where the activity physically occurs. County data can locate it more precisely, subject to the attribution caveat in Section 3.2, and our specialisation profiles are consistent with that location.
Hu et al. (2022) report that trade facilitation raised export technological sophistication in the Baltic States more than in other European transition economies, and Gabrielczak and Serwach (2020) find that euro adoption increased the complexity of Estonian exports. Both of these operate nationally. Trade facilitation and euro adoption lowered costs and removed currency risk for every Lithuanian exporter, wherever it happened to be. These changes should, in principle, have levelled the playing field. The county trajectories nevertheless moved apart at the top over these years. One possible interpretation, which our descriptive design cannot test,, is that the benefits of national reforms accrued mainly to counties already able to use them.
Kalendienė (2024) makes a related point from another direction, treating export diversification and the agility of Lithuanian firms as competitive strengths while noting the country’s modest standing on complexity rankings. Both observations survive at county level, but neither survives intact.
On the IMD measure, Lithuania ranks first in the world for export concentration by product. Our county figures qualify that ranking: national diversification arises not because Lithuanian regions are individually diversified but because they are concentrated in different products. Telšiai takes 69.9 per cent of its exports from one refined product (2024). A balanced national portfolio does not protect a region whose exports rest on a single good.
6.5. Limitations
Six limitations qualify these results. First, the rule by which Statistics Lithuania assigns exports to counties has not been confirmed; the county profiles are consistent with production locations, but exports of multi-plant enterprises and intermediaries may be partly assigned to registered offices. Second, exports of Lithuanian origin exclude simple re-exports but still contain foreign value added, so EWPC describes the complexity of exported goods, not of value added in the county. Third, product scores are held fixed; this allows compositional comparison but cannot capture changes in a product’s capability requirements, and whether overall dispersion widened depends on the scores used (Table A1). Fourth, product classifications changed four times over the period; we map the 21 new headings to HS1992 and re-estimate on the 665 headings whose content is unchanged in every revision, but the UN correspondence tables do not show partial transfers of content between headings, so such transfers cannot be fully excluded. Fifth, with ten counties, results for the smallest counties (Tauragė, Utena, Alytus) can be moved by single products, and all correlations are descriptive. Sixth, RSCA is measured against the national economy, so its levels are bounded differently for counties of different size, and specialisation counts depend on the threshold chosen.
7. Conclusions and Research Agenda
This study measured export complexity across Lithuania’s ten counties using origin-based regional trade data for 2005–2024.
Complex export value in Lithuania is concentrated in one county. Vilnius records an EWPC of +0.299 in 2024, 0.36 points above the second-ranked county, and ranks first under every specification tested. On the breadth-based fitness measure, however, Kaunas is close behind, so the concentration concerns the value of complex exports more than the range of capabilities.
The leading county pulled away while the others converged. Vilnius rose from fifth place in 2005, mainly through a few biotechnology and optical products, with a peak in 2021 driven by nucleic acids and diagnostic reagents. The other nine counties became more alike, and four of them declined, each through the exit of a single product line. National statistics average these movements into a slow aggregate improvement.
Export value and export complexity are different measures. Telšiai, the largest exporting county over the period, has the least complex and most concentrated basket in every year. Policy that ranks regions by export value alone would therefore give a different picture from one that considers the composition of exports.
These findings establish a foundation rather than a conclusion. The panel built here, with its documented extraction, concordance and complexity matching, supports several questions that this paper leaves open.
Four questions follow directly. (1) Exposure and resilience: did counties with a larger share of exports to Russia and Belarus in 2021 experience larger falls in export value and EWPC in 2022–2024, and did they recover through new partners for existing products or through new products? Pre-shock exposure can be measured from the partner dimension of the same data, and the comparison can be made at the county–product level with an exposure-based difference-in-differences design. (2) Diversification: Which products that a county did not export competitively in year t does it begin exporting competitively by year t + 3? Does the relatedness of those products to the county’s existing export basket predict these entries better than the product’s presence in other parts of Lithuania? The twenty-year panel allows models to be estimated on 2005–2018 and tested on entries observed in 2019–2024. (3) Neighbourhood effects: Is a county more likely to enter a product in which an adjacent county is already specialised, holding relatedness constant? (4) Dependence on few products: How much of the change in the national index over 2005–2024 is accounted for by the five largest Vilnius contributors, and how sensitive is the national index to their exit?
A fifth question links measurement to outcomes: Is EWPC or fitness in year t associated with growth in county GDP per capita or labour productivity over the following five years, after controlling for initial income and sector mix? With ten counties, such associations can only be descriptive, and they are best examined in a panel that adds comparable regions from other countries.
Finally, the results carry an implication for regional policy that is worth stating even on descriptive evidence. Across Lithuanian counties, the least complex baskets are also the most concentrated. This association does not show that diversification causes upgrading or the reverse, but it suggests that regional strategies addressing either objective should monitor both.
Author Contributions
Conceptualization, C.Ç. and B.P.; methodology, C.Ç.; software, C.Ç.; validation, C.Ç. and B.P.; formal analysis, C.Ç.; investigation, C.Ç.; resources, C.Ç. and B.P.; data curation, C.Ç.; writing—original draft preparation, C.Ç.; writing—review and editing, C.Ç. and B.P.; visualization, C.Ç.; supervision, B.P.; project administration, C.Ç.;. All authors have read and agreed to the published version of the manuscript.
Funding
This research received no external funding.
Data Availability Statement
The compiled dataset is available from the corresponding author upon reasonable request.
Conflicts of Interest
The authors declare no conflict of interest.
Appendix A
Table A1.
Robustness of the principal findings to the complexity source, window, product universe and basket.
Table A2.
County Economic Fitness, 2005 and 2024 (counties embedded in the world country–product matrix).
References
- Balassa, B. (1965). Trade liberalisation and “revealed” comparative advantage. The Manchester School, 33(2), 99–123. [Google Scholar] [CrossRef] [Scilit]
- Balland, P.-A., & Rigby, D. L. (2017). The geography of complex knowledge. Economic Geography, 93(1), 1–23. [Google Scholar] [CrossRef] [Scilit]
- Bank of Lithuania. (2013). Manufacturing complexity of exported products. In Lithuanian economic review (pp. 21–23). Bank of Lithuania. [Google Scholar]
- Bank of Lithuania. (2019). Complexity of Lithuanian goods exports. In Lithuanian economic review (pp. 29–30). Bank of Lithuania. [Google Scholar]
- Chávez, J. C., Mosqueda, M. T., & Gómez-Zaldívar, M. (2017). Economic complexity and regional growth performance: Evidence from the Mexican economy. Review of Regional Studies, 47(2), 201–219. [Google Scholar] [CrossRef] [Scilit]
- Cicerone, G., McCann, P., & Venhorst, V. A. (2020). Promoting regional growth and innovation: Relatedness, revealed comparative advantage and the product space. Journal of Economic Geography, 20(1), 293–316. [Google Scholar] [CrossRef] [Scilit]
- Cristelli, M., Gabrielli, A., Tacchella, A., Caldarelli, G., & Pietronero, L. (2013). Measuring the intangibles: A metrics for the economic complexity of countries and products. PLoS ONE, 8(8), e70726. [Google Scholar] [CrossRef] [Scilit]
- Çınar, İ. T., Korkmaz, İ., & Baycan, T. (2022). Regions’ economic fitness and sectoral labor productivity: Evidence from Turkey. Regional Science Policy & Practice, 14(3), 575–598. [Google Scholar] [CrossRef] [Scilit]
- Davies, B., & Maré, D. C. (2021). Relatedness, complexity and local growth. Regional Studies, 55(3), 479–494. [Google Scholar] [CrossRef] [Scilit]
- Du, W., & Zaccaria, A. (2026). Economic complexity at subnational level: A consistency analysis. arXiv, arXiv:2606.26966. [Google Scholar] [CrossRef] [Scilit]
- Felipe, J., Kumar, U., Abdon, A., & Bacate, M. (2012). Product complexity and economic development. Structural Change and Economic Dynamics, 23(1), 36–68. [Google Scholar] [CrossRef] [Scilit]
- Gabrielczak, P., & Serwach, T. (2020). Does the euro increase the complexity of exported goods? The case of Estonia. Journal of Baltic Studies, 51(1), 105–124. [Google Scholar] [CrossRef] [Scilit]
- Growth Lab at Harvard University. (2026). International trade data (HS92). Harvard Dataverse. [Google Scholar] [CrossRef] [Scilit]
- Hausmann, R., Hwang, J., & Rodrik, D. (2007). What you export matters. Journal of Economic Growth, 12(1), 1–25. [Google Scholar] [CrossRef] [Scilit]
- Hidalgo, C. A., & Hausmann, R. (2009). The building blocks of economic complexity. Proceedings of the National Academy of Sciences of the United States of America, 106(26), 10570–10575. [Google Scholar] [CrossRef] [Scilit]
- Hu, Y., Jiang, M., Sun, S., & Dai, Y. (2022). Does trade facilitation promote export technological sophistication? Evidence from the European transition countries. SAGE Open. [Google Scholar] [CrossRef] [Scilit]
- Jarreau, J., & Poncet, S. (2012). Export sophistication and economic growth: Evidence from China. Journal of Development Economics, 97(2), 281–292. [Google Scholar] [CrossRef] [Scilit]
- Kalendienė, J. (2024). Assessing the competitiveness of the Lithuanian economy based on the IMD competitiveness index. In M. Gołębiowska (Ed.), Competitiveness of central European economies: Benchmarking and best practices (IEŚ Policy Papers No. 7/2024, pp. 37–54). Instytut Europy Środkowej. [Google Scholar]
- Koch, P. (2021). Economic complexity and growth: Can value-added exports better explain the link? Economics Letters, 198, 109682. [Google Scholar] [CrossRef] [Scilit]
- Lall, S., Weiss, J., & Zhang, J. (2006). The “sophistication” of exports: A new trade measure. World Development, 34(2), 222–237. [Google Scholar] [CrossRef] [Scilit]
- Laursen, K. (2015). Revealed comparative advantage and the alternatives as measures of international specialization. Eurasian Business Review, 5(1), 99–115. [Google Scholar] [CrossRef] [Scilit]
- Mandziukaitė, J. (2026). Lietuvos apdirbamosios pramonės eksporto struktūros kokybės gerinimo galimybių vertinimas [Assessment of opportunities to improve the export structure of Lithuania’s manufacturing industry from a quality perspective] [Master’s thesis, Kaunas University of Technology]. Available online: https://epubl.ktu.edu/object/elaba:297039601/index.html (accessed on 4 September 2026).
- Minondo, A. (2010). Exports’ productivity and growth across Spanish regions. Regional Studies, 44(5), 569–577. [Google Scholar] [CrossRef] [Scilit]
- Operti, F. G., Pugliese, E., Andrade, J. S., Jr., Pietronero, L., & Gabrielli, A. (2018). Dynamics in the fitness–income plane: Brazilian states vs. world countries. PLoS ONE, 13(6), e0197616. [Google Scholar] [CrossRef] [Scilit]
- Petrylė, V. (2023). Export approach to country’s competitiveness: Evidence from Lithuania [Doctoral dissertation, Vilnius University]. [Google Scholar] [CrossRef] [Scilit]
- Reynolds, C., Agrawal, M., Lee, I., Zhan, C., Li, J., Taylor, P., Mares, T., Morison, J., Angelakis, N., & Roos, G. (2018). A sub-national economic complexity analysis of Australia’s states and territories. Regional Studies, 52(5), 715–726. [Google Scholar] [CrossRef] [Scilit]
- Sciarra, C., Chiarotti, G., Ridolfi, L., & Laio, F. (2020). Reconciling contrasting views on economic complexity. Nature Communications, 11, 3352. [Google Scholar] [CrossRef] [Scilit]
- Servedio, V. D. P., Buttà, P., Mazzilli, D., Pietronero, L., & Tacchella, A. (2018). A new and stable estimation method of country economic fitness and product complexity. Entropy, 20(10), 783. [Google Scholar] [CrossRef] [Scilit]
- Statistics Lithuania. (2026). Exports of goods of Lithuanian origin by county, CN four-digit heading and partner country (dataflow S6R011_M6050121). Official Statistics Portal. Available online: https://osp.stat.gov.lt/ (accessed on 26 June 2026).
- Tacchella, A., Cristelli, M., Caldarelli, G., Gabrielli, A., & Pietronero, L. (2012). A new metrics for countries’ fitness and products’ complexity. Scientific Reports, 2, 723. [Google Scholar] [CrossRef] [Scilit]
- Török, I., Benedek, J., & Gómez-Zaldívar, M. (2022). Quantifying subnational economic complexity: Evidence from Romania. Sustainability, 14(17), 10586. [Google Scholar] [CrossRef] [Scilit]
- Umiński, S. (2025). Export performance cluster analysis of Poland’s regions in the first 20 years of EU membership. Quaestiones Geographicae, 44(4), 31–41. [Google Scholar] [CrossRef] [Scilit]
- Valentinaitė, M., Shepherd, B., & Valužis, M. (2026). Sectorial competitiveness in the Baltic countries: A revealed productivity approach (European Economy Discussion Paper No. 252). Publications Office of the European Union. Available online: https://economy-finance.ec.europa.eu/publications/sectorial-competitiveness-baltic-countries-revealed-productivity-approach_en (accessed on 4 July 2026).
- Vollrath, T. L. (1991). A theoretical evaluation of alternative trade intensity measures of revealed comparative advantage. Weltwirtschaftliches Archiv, 127(2), 265–280. [Google Scholar] [CrossRef] [Scilit]

Disclaimer/Publisher’s Note: The statements, opinions and data contained in all publications are solely those of the individual author(s) and contributor(s) and not of MDPI and/or the editor(s). MDPI and/or the editor(s) disclaim responsibility for any injury to people or property resulting from any ideas, methods, instructions or products referred to in the content. |
© 2026 by the authors. Licensee MDPI, Basel, Switzerland. This article is an open access article distributed under the terms and conditions of the Creative Commons Attribution (CC BY) license.