


Abstract
Growth in registered membership is often taken as evidence that microfinance expands financial inclusion, but it does not show whether members use financing or whether that financing keeps its value when prices rise. This study examines the Rural Development Scheme and Urban Poor Development Scheme (RDS-UPDS) of Islami Bank Bangladesh PLC over 2018–2025. It is a descriptive, single-program study based on eight annual observations from the bank’s annual reports. Financing and savings are adjusted for inflation using the national consumer price index, and real portfolio change is split into membership, activation, and depth components with an exact accounting identity. Licensed non-governmental microfinance institutions provide context only, not a causal comparison. Membership rose by 60%, from 1.11 to 1.78 million, but the share of members with active financing fell from 56.4% to 48.2%. Of the 33.9 log-point rise in real outstanding financing, membership growth accounted for 47.1 points and falling activation for −15.8 points; real financing per active client added only 2.6 points and declined after 2023, when repayment indicators also weakened. The program’s reach grew much faster than its active use. Managing activation, monitoring inflation-adjusted indicators, and reporting by scheme should be priorities.
Keywords:
Islamic microfinance; financial inclusion; active use; financial depth; outreach; portfolio quality; rural development; Bangladesh JEL Classification:
G21; G23; O16; O18; O53
1. Introduction
Microfinance programs usually report their progress through the number of registered members and the nominal value of their loan portfolios. These figures show how far a program reaches, but they do not show whether members actually use financing or whether the financing they receive keeps its purchasing power when prices rise. The financial-inclusion literature draws the same line between having access to a financial service and using it (Allen et al., 2016; Klapper et al., 2025). This distinction has not yet been applied to bank-led Islamic microfinance in Bangladesh. Studies of the Rural Development Scheme (RDS) of Islami Bank Bangladesh PLC (IBBPLC) have examined poverty reduction, women’s empowerment, and household well-being, mostly through borrower surveys (Rahman et al., 2008; Parvej et al., 2020; Islam, 2021; Ahamad et al., 2026) or program descriptions (United Nations Development Programme, 2012; Nahar, 2022). None of them tracks, with recent institutional data, how many registered members actually hold financing and how much inflation-adjusted financing they receive. This study addresses that gap.
The gap matters for development policy. Microfinance was designed to overcome the collateral, information, and transaction-cost barriers that keep poor households and microenterprises out of formal finance (Morduch, 1999; Armendáriz & Morduch, 2010). Its performance, however, has several dimensions: reach, depth, and financial sustainability do not always move together (Schreiner, 2002; Cull et al., 2007; Hermes et al., 2011). Bangladesh’s National Financial Inclusion Strategy 2021–2026 accordingly stresses the effective use of quality services, not only access (Finance Division, Government of Bangladesh, 2021). The distinction became more important after 2022: consumer prices in Bangladesh rose by 9–10% a year between fiscal years 2022–2023 and 2024–2025 (Bangladesh Bureau of Statistics, 2026). In such periods, nominal loan balances can grow quickly even when their real value is flat or falling.
Evidence on the welfare effects of microfinance gives a further reason for care. Household panel studies in Bangladesh linked microcredit with higher consumption and lower poverty (Pitt & Khandker, 1998; Khandker, 2005), but a later reanalysis questioned some of these results (Roodman & Morduch, 2014), and randomized evaluations in other countries found modest effects that vary across settings (Banerjee et al., 2015; Meager, 2019). This evidence separates two questions that are often confused: whether a program is growing and working well as an institution, and whether taking part changes household welfare. Institutional data can address only the first of these questions, which is the one this study asks; with eight annual observations for one program, its analysis is descriptive.
Islamic microfinance adds a further dimension. Contracts that avoid interest may make formal finance acceptable to households that would otherwise stay out, and Islamic programs can combine financing with savings, group organization, and charitable instruments (Abdul Rahman, 2010; Mohieldin et al., 2011). Shariah compliance does not, however, remove the usual problems of microfinance: delivery costs, client screening, loan size, and repayment risk remain central (Karim et al., 2008). Bank-led Islamic microfinance is a particularly interesting case. A commercial bank can provide funding, infrastructure, and a path from small loans to larger enterprise finance, but the same integration can make performance harder to measure, because program components, delivery channels, and financing tiers are often reported together.
IBBPLC launched the RDS in 1995 as a group-based Islamic microfinance program that combines savings, Shariah-compliant investment (financing), field supervision, and welfare activities (United Nations Development Programme, 2012). The bank later added the Urban Poor Development Scheme (UPDS) and microenterprise financing. Its recent annual reports publish one consolidated “RDS & UPDS Performance” table, and the financing portfolio in that table also includes microenterprise financing. The published data therefore describe a consolidated RDS-UPDS program, not the RDS alone, and treating the headline figures as RDS-only would overstate their precision. This study keeps the bank’s definitions, records revisions between report editions, and states what the consolidated figures can and cannot show.
The study asks one main question: between 2018 and 2025, did the growth of the RDS-UPDS program deepen members’ active use of financing, or did registered reach grow faster than active use? Five research questions (RQs) guide the analysis: (RQ1) how membership, active financing, and delivery capacity changed; (RQ2) whether active use and inflation-adjusted depth kept pace with reach; (RQ3) how much of the change in the real portfolio passed through membership, activation, and real depth; (RQ4) how productivity and portfolio quality changed, especially after 2023; and (RQ5) what licensed non-governmental organization (NGO) microfinance institutions and the bank’s own success stories add as context.
The study makes three contributions. First, it builds an annual institutional time series for 2018–2025 from successive annual reports, records revisions instead of correcting them silently, and measures deepening with inflation-adjusted indicators: the share of members with active financing, real financing per active client, and real savings per member. Second, it splits the change in the real portfolio into membership, activation, and depth components with an exact accounting identity, and places the results beside the licensed NGO microfinance sector as a descriptive reference point. Third, it codes 11 success stories supplied by the bank to suggest possible enterprise-level mechanisms and hypotheses for future research.
The results show that the program’s reach grew much faster than its active use. Between 2018 and 2025, membership rose by 60%, but the share of members with active financing fell from 56.4% to 48.2%. After adjustment for inflation, financing per active client in 2025 was only 2.7% above its 2018 level and had fallen since 2023, while real savings per member fell by 19%. In accounting terms, membership growth was the only margin that added substantially to the real portfolio; after 2023, falling activation and falling real depth reduced the real portfolio even though membership kept growing, and portfolio quality weakened. These patterns do not show that the program has failed or changed its mission. They show that registered reach and nominal balances are incomplete measures of its performance.
The rest of the paper is organized as follows. Section 2 reviews the literature on financial inclusion, microfinance outreach, Islamic microfinance, and earlier studies of the RDS, and sets out the analytical framework. Section 3 describes the data, the inflation adjustment, the indicators, the decomposition, the benchmark, and the coding of the success stories. Section 4 presents the results. Section 5 discusses them and sets out the limitations, and Section 6 concludes. Appendix A reports the annual RDS-UPDS data series, and Appendix B presents illustrative arithmetic scenarios for 2030.
2. Literature Review and Analytical Framework
2.1. Financial Inclusion: Access, Use, and Development
Financial systems mobilize savings, allocate capital, ease payments, and help households manage risk. Financial development can therefore affect both growth and how its benefits are shared, because it shapes who can obtain external finance and on what terms (Beck et al., 2007). Recent panel studies that include Bangladesh continue to find that financial inclusion is positively associated with economic growth, with larger effects in developing economies (Hussain et al., 2024; Khan et al., 2024). At the household level, the key question is whether people who were excluded can obtain and use services that suit their needs. Allen et al. (2016) show that owning an account and using it have different determinants, and the Global Findex now reports saving, borrowing, payments, and financial resilience alongside account ownership (Klapper et al., 2025). Bangladesh’s inclusion strategy likewise defines inclusion as access to and use of quality services (Finance Division, Government of Bangladesh, 2021).
For a microfinance program, registered membership is therefore a measure of reach, not of active financial participation. The distinction also matters for rural and local development. A delivery network can reduce geographic and information barriers, but its development value depends on whether clients can repeatedly obtain financing of a useful size, keep their savings in real terms, and move to larger financing as their enterprises grow. At the same time, low use is not always a sign of failure: members may join mainly to save, may value the option to borrow when they need to, or may use other services. The activation rate must therefore be read together with depth, savings, portfolio quality, and institutional capacity, not as a stand-alone measure of welfare.
2.2. Outreach, Active Use, and Financial Depth
Microfinance research treats outreach as having several dimensions. Schreiner (2002) distinguishes the breadth, depth, length, scope, worth, and cost of outreach. In applied work, breadth is usually measured by the number of clients, and depth by loan size relative to income or by the poverty of the clients served. Because the bank does not report client income, this study uses a narrower set of operational measures. Breadth is registered membership. Active use, or activation, is the share of members with outstanding financing. Real financing depth is inflation-adjusted outstanding financing per active financing client, and real savings depth is inflation-adjusted member savings per registered member. In this paper, “financial depth” therefore means the real amount of financing held by each active client. It does not measure how poor the clients are or whether the program reaches poorer borrowers, which institutional totals cannot show.
Measuring depth is itself difficult. The most common proxy in cross-country studies, average loan size relative to income per capita, mixes the poverty of clients with loan terms, product mix, and the price level (Cull et al., 2007; Hermes et al., 2011). A rising average loan may signal a shift toward better-off clients, but it may also reflect the graduation of long-standing clients or simply inflation. Real financing per active client, the measure used here, removes the price effect but not the others. It is therefore read together with activation and portfolio quality rather than on its own.
The double-bottom-line literature adds financial sustainability to outreach. Cross-country studies find that profitability, lending method, average loan size, and client mix interact differently across types of institution (Cull et al., 2007, 2009). Mersland and Strøm (2010) find no general evidence of mission drift, while Hermes et al. (2011) find that serving poorer clients is associated with lower efficiency. Recent evidence points in both directions. Using data on 2902 microfinance institutions (MFIs) in 122 countries, Jia and Sun (2023) find that institutions improved both profitability and depth of outreach over time, and a survey of European MFIs finds that those meeting their social objectives are also more financially sustainable, except when they make very small loans to the poorest clients (Dalla Pellegrina et al., 2024). In contrast, most of the 95 African MFIs studied by Zineelabidine et al. (2024) put profitability ahead of outreach. Institutional form and funding also matter: nonprofit MFIs show broader and deeper outreach than for-profit ones (Mia et al., 2026), and self-sustainability improves with retained earnings and equity funding, especially where external governance is strong (Ahamad et al., 2024). A single ratio therefore cannot diagnose an institution’s mission. A larger average balance, for example, may reflect enterprise graduation, the exclusion of smaller borrowers, inflation, or a change in product mix. This is why the present study examines reach, activation, and depth together.
2.3. Microcredit Impact and the Limits of Institutional Data
Bangladesh has a central place in the debate on the impact of microcredit. Household panel studies linked participation in group-based credit with higher consumption and lower poverty (Pitt & Khandker, 1998; Khandker, 2005; Imai & Azam, 2012), but a reanalysis questioned the robustness of some of these results (Roodman & Morduch, 2014). Randomized evaluations in other countries found modest average effects that vary across outcomes and settings (Banerjee et al., 2015), and a Bayesian synthesis of seven experiments confirmed this heterogeneity (Meager, 2019). Recent evidence from Bangladesh is more encouraging for continued access: using a difference-in-differences design, Arman et al. (2026) find that microfinance borrowers who received new loans after the COVID-19 lockdown had higher business earnings and better food security, with the gains coming mainly from business-focused loans. This body of evidence does not mean that microfinance lacks development value; it shows that effects depend on product design, borrower characteristics, and local markets. It also defines what institutional data can and cannot show. Aggregate program data can show whether a program is growing and whether its members use it, but not whether participation changes household welfare. Success stories can reveal plausible pathways, but not how common those pathways are.
2.4. Islamic Microfinance and Bank-Led Delivery
Islamic microfinance combines the inclusion goals of microfinance with contracts that avoid interest. Part of its appeal is on the demand side: households that avoid interest-based loans may be more willing to use formal finance when contracts match their religious preferences (Abdul Rahman, 2010; Mohieldin et al., 2011). It can also combine financing with savings and charitable instruments. The sector nevertheless remained small: a survey by the Consultative Group to Assist the Poor (CGAP) estimated that Islamic microfinance reached only about 380,000 clients in 2007, around 0.5% of global microfinance outreach, concentrated in Indonesia, Bangladesh, and Afghanistan (Karim et al., 2008). A later global comparison found that Islamic MFIs reach more clients, and poorer clients, than conventional MFIs, while evidence that they perform worse financially is not robust (Ahmad et al., 2020). Evidence on repayment is mixed. Islamic MFIs that make more group loans and serve more women and rural borrowers have lower credit risk (Mohamed & Elgammal, 2023), but loan-level data from Afghanistan show more frequent default on Islamic than on conventional loans (Disli & Jalaly, 2024). Among Islamic banks in the Gulf, the relationship between financial inclusion and stability is inverted U-shaped (Khémiri et al., 2024), a reminder that expanding inclusion can eventually strain an institution.
Islamic microfinance uses several types of contract. Sale-based contracts, such as murabaha (a cost-plus sale) and bai-muajjal (a sale with deferred payment), dominate because they are simple to administer, whereas partnership contracts that share profit and loss, such as musharakah and mudarabah, are less common because they are harder to monitor (Abdul Rahman, 2010; Karim et al., 2008). In a sale-based contract, the amount to be repaid is fixed when the asset is bought. The real value of financing and repayments therefore depends on prices in the same way as for a conventional loan, so inflation-adjusted measures are as relevant for Islamic microfinance as for conventional microfinance.
Shariah compliance does not remove the operating problems of microfinance. Small transactions, field supervision, dispersed clients, and information asymmetry keep costs high, and arrears reduce an institution’s capacity to lend again. In Bangladesh, the sustainability of microfinance providers is positively associated with loan size, the number of borrowers, and the share of women borrowers, and negatively with cost per borrower (Maeenuddin et al., 2023). Portfolio quality is therefore part of inclusion, not a separate financial goal. Bank-led models may ease some of these constraints, because a commercial bank can provide funding, payment and risk systems, staff, and branch and agent networks that a stand-alone MFI may lack. The evidence on banks and MFIs is mixed, however. Across 60 countries, microfinance banks have more liquidity and wholesale funding than commercial banks but lower efficiency and asset quality (Abrar et al., 2023). In rural Bangladesh, enterprises find MFIs closer but short of funds, and banks better funded but more distant and less welcoming (Mahmud & Tulla, 2024). Bank-based microfinance has also been linked to lower poverty at the provincial level in Indonesia (Ismail et al., 2024). Integration with a bank can, however, make performance harder to measure when rural, urban, microenterprise, and channel activities are reported together.
2.5. Previous Studies of the RDS: What They Show and What They Miss
The RDS grew from a pilot in four villages in 1995 to more than 600,000 beneficiaries by 2012, and a UNDP case study attributes its growth to a supportive culture and policy, institutional capacity, and committed management (United Nations Development Programme, 2012). Four empirical studies assess its effects on clients. Rahman et al. (2008), who were affiliated with the bank’s training academy, interviewed 1020 randomly selected clients in 2006–2007 and found that household income and spending had risen since joining; they also found that about 15% of clients borrowed from interest-based NGOs as well. Parvej et al. (2020) surveyed 328 purposively selected borrowers in two northern districts and found that 72% reported higher income after joining. Islam (2021) surveyed 389 women clients in three zones in 2019 and found improvements in income, savings, and economic and socio-cultural empowerment. Most recently, Ahamad et al. (2026) surveyed 192 RDS and Muslim Aid Bangladesh borrowers in Chattogram and found that larger loans were associated with higher self-reported household well-being, especially among more religious borrowers. Nahar (2022) uses the bank’s reports up to June 2020 to describe the scheme’s outreach, sector allocation, and recovery and argues that it is a viable tool for poverty reduction.
Compared with the present study, this literature differs in three ways. First, it mainly asks whether clients benefit, not whether the program’s operational base is deepening. Second, the survey studies are cross-sectional and mostly rely on recalled “before” and “after” comparisons without a comparison group, so they can neither attribute changes to the program nor show how membership, active use, and portfolio quality changed over time. Third, the studies based on institutional data end in 2020, before the high inflation of 2022–2025, and none of the studies decomposes portfolio growth into membership, activation, and inflation-adjusted depth. To our knowledge, no peer-reviewed study has examined the UPDS itself, and none has used the program’s institutional data for the period after 2020.
The present findings therefore qualify, rather than contradict, the earlier evidence. Positive outcomes for surveyed borrowers can coexist with a falling share of members who hold financing and with a fall in the real value of that financing; the two types of evidence answer different questions. The earlier finding that some clients also borrow from NGOs (Rahman et al., 2008) also suggests one reason why activation may fall even when demand for finance does not. More broadly, research on Islamic microfinance has grown quickly (Hassan et al., 2021), and bibliometric reviews identify Islamic microfinance and Islamic financial inclusion as distinct research clusters (Lwesya & Mwakalobo, 2023; Pattnaik & Hassan, 2025) while pointing to the underexplored link between microfinance and digital technology (Daudi & Dalvadi, 2025). The present study adds an eight-year institutional view of reach, active use, real depth, and risk in a large bank-led program.
2.6. Analytical Framework
Table 1 links each research question to its construct, its indicators, and the limits of what can be inferred. The framework separates three margins: reach (registered members and the delivery network), activation (the share of members with active financing), and real depth (inflation-adjusted financing per active client and savings per member). These margins can move in different directions. A program can add members while activation falls, increase nominal financing while real depth stays flat, or open new branches and outlets while the financing caseload per employee declines.
Table 1.
Research questions, constructs, indicators, and limits of inference.
The framework leads to three simple diagnostic propositions. If members grow faster than active financing clients, activation falls. If nominal financing grows faster than prices but real financing per client does not, the program expands without deepening. If recovery weakens while overdue and classified ratios rise, further increases in depth become harder to sustain. These relationships can be checked directly with institutional data, and together they show whether growth in scale has been matched by growth in use, value, and portfolio soundness.
Let Mt denote registered members in year t, Ct active financing clients, Rt real outstanding financing in constant 2018 Bangladeshi taka (BDT), At the activation rate, and Dt real financing depth. By definition,
Taking logarithms of Equation (3) between a start year 0 and an end year T gives an exact additive decomposition:
Multiplying each term by 100 expresses it in log points (log-percentage points). Because Equation (4) is an identity, the three components add up exactly to the change in the real portfolio. They are accounting contributions: they show through which margin the change passed, not why it happened. Real financing depth is measured per active financing client, whereas real savings depth is measured per registered member (Section 3.4).
3. Materials and Methods
3.1. Study Design and Unit of Analysis
This is a descriptive study of a single program. The unit of analysis is the program-year of IBBPLC’s consolidated RDS-UPDS program, observed at the level of the whole institution. The data form a short annual institutional time series of eight calendar years (2018–2025), not a panel: one unit is observed over time. Annual data are the most detailed data that the bank publishes consistently. The period starts in 2018 because all core indicators—members, active financing clients, outstanding financing, member savings, overdue and classified financing, recovery, operational units, and employees—are available from that year without interpolation.
With eight observations, regressions, structural-break tests, forecasting models, and causal models would be unreliable. The analysis therefore uses descriptive statistics, compound annual growth rates (CAGRs), inflation-adjusted levels, ratios, an exact accounting decomposition, and comparisons between periods. The design favors transparent measurement over model complexity. The annual reports call enrolled participants “members” and members with outstanding financing “clients”; this paper calls the latter active financing clients to make the difference explicit. Because the headline table is titled “RDS & UPDS Performance” and includes microenterprise financing, all estimates refer to the consolidated program (Islami Bank Bangladesh PLC, 2024, 2025).
3.2. Data Sources and Reconciliation
The study combines four sources (Table 2): IBBPLC annual reports; the national consumer price index (CPI) published by the BBS; annual statistics for licensed NGO microfinance institutions (NGO-MFIs) published by the Microcredit Regulatory Authority (MRA); and 11 success stories supplied by IBBPLC.
Table 2.
Data sources, timing, variables, and use.
The bank indicators were transcribed from selected report editions: the 2020 annual report supplies the 2018–2020 observations, the 2022 report supplies 2021–2022, the 2024 report supplies 2023–2024, and the 2025 report supplies 2025 (Islami Bank Bangladesh PLC, 2020, 2022, 2024, 2025). Each report gives current-year values and comparison values for earlier years, which allows cross-checks. Reconciliation followed four steps: (i) each value was transcribed as published in each report edition; (ii) values were compared across the available report editions where the same year was shown; (iii) the values from the selected source editions were retained, including the 2024 membership figure from the 2024 report rather than its restatement in the 2025 report; and (iv) no value was interpolated, averaged, or overwritten. For example, 2024 membership is 1,735,448 in the 2024 report and 1,735,279 in the 2025 report; the difference changes the 2024 activation rate by less than 0.01 percentage points. The audit also replaced an earlier draft value of 495 operational units for 2023 with the official figure of 497. The program performance table appears on printed page 99 of the 2020 report, page 97 of the 2022 report, and page 59 of the 2024 and 2025 reports. The MRA series is taken from Table 1.3 of the MRA’s annual statistics and the CPI series from Table 1.6 of the BBS bulletin. Appendix A reports the annual RDS-UPDS series used in the analysis.
The analysis applies the following definitions and comparability rules. The headline series is treated as the consolidated RDS-UPDS program, including the microenterprise financing embedded in it; no scheme-level values are derived by subtraction; the three portfolio-quality measures are calculated separately; the MRA series is used only as a contextual benchmark; fiscal-year CPI and MRA data are matched to the bank’s calendar years by ending year; and missing values are not interpolated. Recovery is a reported percentage, whereas overdue and classified financing are reported amounts that are divided by outstanding financing. Because these three measures follow different definitions, they are not added together or treated as complements.
3.3. Inflation Adjustment
Financing and savings were converted to constant 2018 prices with the BBS national fiscal-year average CPI (Bangladesh Bureau of Statistics, 2026). The official series changed its base from 2005–2006 = 100 to 2021–2022 = 100. To create one continuous series, values on the new base were multiplied by 3.0618, which is the 2021–2022 value of the old-base index (306.18) divided by 100. This standard splicing method assumes that the old and new indexes move in proportion at the link year; the new series equals 100 in its base year, fiscal year (FY) 2021–2022, so multiplying it by 3.0618 matches the old-series value of 306.18 in that year. The deflator for year t is the linked CPI for year t divided by the linked CPI for 2018. For a nominal amount Xt, the value in constant 2018 prices is
where Pt is the linked CPI. Table 3 reports the annual CPI values and deflators. Prices rose by 64.3% between FY2017–2018 and FY2024–2025, and by 9–10% a year in the last three fiscal years.
Table 3.
National consumer price index (CPI) and deflators, 2018–2025.
Only money values—outstanding financing and member savings—are deflated; counts of members and clients are never adjusted. Deflating before calculating per-client and per-member measures retains the precision of the analysis inputs and prevents price increases from being read as financial deepening. The timing is approximate. IBBPLC reports stocks at 31 December, while the CPI measures average prices over the July–June fiscal year. Each fiscal-year average is matched to the calendar year in which that fiscal year ends; for example, the July 2024–June 2025 average deflates December 2025 bank balances. This is a mismatch between a period-average price measure and a year-end stock, distinct from the six-month gap between June-end MRA and December-end bank observations. The bulletin does not provide a continuous rural CPI series for the full 2018–2025 study period, so the national CPI is used. The national index covers rural and urban prices, but not the specific mix of inputs purchased by client enterprises. Real values should therefore be read as national purchasing-power measures.
3.4. Indicators
Table 4 defines all variables and indicators. The activation rate is the number of active financing clients divided by the number of registered members (Equation (1)). Real financing depth is real outstanding financing divided by the number of active financing clients (Equation (2)). Only the numerator is deflated; the number of clients is a count and is not adjusted for inflation. Nominal financing depth, which uses the same denominator without deflation, is reported alongside real depth to show how much of the change in average balances reflects prices. Real savings depth is real member savings divided by the number of registered members. The two depth measures use different denominators on purpose: the bank reports savings for all members but financing only for active clients.
Table 4.
Variable definitions and formulas.
Productivity is measured by active clients per employee, members per operational unit, and real outstanding financing per employee. Active clients per employee shows the financing caseload supported by the reported staff; members per unit shows the average registered population served by each unit; and real financing per employee shows the real portfolio supported by each employee. These are partial measures, not cost-efficiency measures, because the reports do not give scheme-level operating costs, transaction numbers, staff time, or workloads by channel. Portfolio quality is measured by the recovery rate and by overdue and classified financing as shares of outstanding financing. The three measures are read together as signals of portfolio stress, but no accounting relationship is imposed between them, because changes in classification rules, restructuring, write-offs, or product mix can affect each of them differently.
Growth over the seven intervals between 2018 and 2025 is summarized by the compound annual growth rate.
where n is the number of years between the start year 0 and the end year T. Indexes with 2018 = 100 are used in the figures. Rates, such as activation, are compared in percentage points; other variables are compared in percentage changes. Besides the full period, the analysis compares 2018–2023 with 2023–2025, because active clients and the real portfolio peaked in 2023 and several indicators weakened in the following two years. These periods are chosen descriptively and are not statistically estimated breakpoints.
3.5. Decomposition Method of Real Portfolio Change
Equation (4) is applied to the full period 2018–2025 and to four sub-periods: 2018–2019, 2019–2021, 2021–2023, and 2023–2025. Log points are used because they add up exactly, whereas a decomposition of ordinary percentage changes leaves an unexplained residual. For example, the membership component for 2018–2025 is 100 × ln(1,775,341/1,108,283) = 47.12 log points. For small changes, log points are close to ordinary percentage changes; for large changes, they are smaller. For example, the 40.35% increase in the real portfolio over 2018–2025 equals 33.90 log points.
A positive membership component means that, in the identity, a larger member base added to the real portfolio with activation and depth held at their starting values. A negative activation component means that a smaller share of members held financing than membership growth alone would imply. The depth component records the change in real financing per active client, whether positive or negative. These components are accounting contributions, not behavioral or causal effects.
3.6. Contextual Benchmark
The MRA’s annual statistics for licensed NGO-MFIs provide a sector-wide benchmark (Microcredit Regulatory Authority, 2026). The series covers licensed NGO-MFIs in each reporting year, with 693 licensed institutions as of June 2025; it excludes Grameen Bank, government programs, and the microfinance windows of banks such as RDS-UPDS. MRA defines members as active member accounts and borrowers as active loan accounts. These account totals are compared with the bank’s reported registered members and financing clients; the differing definitions provide an additional reason to treat the comparison as contextual. Where the data allow, the same indicators are constructed for both series: activation, nominal and real financing per borrower, real savings per member, borrowers per employee, and an index of real outstanding financing. The same CPI is used to express the benchmark in 2018 prices.
The two series differ in four ways. Institutionally, the MRA series aggregates hundreds of NGOs of different sizes and business models, whereas RDS-UPDS is one program inside a commercial bank. On regulation, NGO-MFIs are licensed and supervised by the MRA, whereas IBBPLC is a scheduled Islamic bank supervised by Bangladesh Bank. Products differ: most NGO-MFIs lend on conventional, interest-based terms, while RDS-UPDS uses Shariah-based investment modes. Reporting dates also differ: the MRA data end in June and the bank data in December. The benchmark is therefore neither a control group nor a basis for ranking the performance of RDS-UPDS against NGO-MFIs; it shows only whether broad trends moved in the same direction and by similar amounts.
3.7. Coding of Success Stories
The qualitative material consists of 11 enterprise profiles supplied by IBBPLC (Islami Bank Bangladesh PLC, 2023). The cases cover timber and furniture, livestock and fish, boutique and embroidery work, firewood, vegetable cultivation, pets, a plant nursery, aquaculture, spice processing, and poultry. The bank selected the stories to show success and for promotional purposes, so they have no sampling frame and no comparison cases, and they cannot be generalized to the program’s membership.
Themes were coded from explicit narrative content. The framework contains seven binary themes, female client, employment or production network, range of products and activities, household or family co-production, financing aspirations for enterprise expansion, center leadership, and sales beyond the locality plus a flag for inconsistent dates or amounts. Product range requires at least two named saleable product groups or income-generating lines, including related lines within one sector; ordinary production stages, design variations and sales channels for the same output do not independently qualify. Financing aspirations require an explicit link between intended expansion or higher operating scale and additional financing, higher limits, or support beyond the current RDS arrangement. A current balance, past financing-led growth or a general ambition without that future financing link does not qualify. Descriptive fields (sector, location, start year, first financing amount, current financing limit, reported workers, and savings) were also recorded. One author performed the initial coding. During revision, all 11 classifications were reviewed against the original narratives using the clarified rules (presented in Section 4.8).
3.8. Presentation of Data and Calculations
The annual RDS-UPDS observations and derived indicators are presented in Table A1 and Table A2. Table 3 reports the CPI values and deflators, and Table 4 gives the variable definitions and formulas. The accounting identity in Section 2.6 and the methods in Section 3.3, Section 3.4 and Section 3.5 explain the inflation adjustment, indicator construction and decomposition. Section 4.8 presents the qualitative coding rules and aggregate theme counts, while Appendix B sets out the assumptions and calculations for the illustrative scenarios.
3.9. Use of Generative Artificial Intelligence
Generative artificial intelligence (GenAI) was used. OpenAI ChatGPT (GPT-5.6 Sol, accessed 28 August 2026) assisted with manuscript organization, summarization of the cited literature and formatting, and Anthropic Claude Opus 5.5 assisted with language editing. During the final revision, AI-assisted review checked numerical statements, tables and figures against the study data and specified calculations, and reviewed qualitative classifications against the source narratives. The authors reviewed and edited the output and take full responsibility for the data, calculations, coding, citations, interpretations and final content.
4. Results
4.1. Reach and Delivery Capacity
The program expanded substantially between 2018 and 2025, but its indicators did not grow at the same pace (Table 5). Registered members rose from 1,108,283 to 1,775,341 (+60.19%; CAGR 6.96%). Active financing clients rose more slowly, from 625,532 to 855,222 (+36.72%; CAGR 4.57%). Villages covered increased from 21,992 to 35,352 (+60.75%), operational units from 272 to 520 (+91.18%; CAGR 9.70%), and employees from 2479 to 3200 (+29.08%; CAGR 3.71%). The delivery network therefore grew fastest, membership and village coverage grew at similar rates, and active clients and staff grew most slowly. Because employees grew more slowly than active clients, each employee served more financing clients at the end of the period than at the start (Section 4.5). The number of members per village stayed close to 50 throughout (50.4 in 2018 and 50.2 in 2025). This stability is consistent with membership growth being linked to the extension of coverage to new villages, but village-level counts cannot show where new members actually enrolled, so this is one possible interpretation rather than an established finding.
Table 5.
Selected RDS-UPDS indicators, 2018, 2023, and 2025.
The pattern changed after 2023. Between 2018 and 2023, members grew by 53.47% and active clients by 43.76%. Between 2023 and 2025, members still grew by 4.38%, but active clients fell by 4.90%, while operational units and villages continued to increase. Registered and physical reach therefore kept growing after 2023, while the number of clients using financing fell. Table 5 summarizes these indicators for 2018, 2023, and 2025, and shows that the largest differences between the two periods concern activation, real depth, savings, and portfolio quality rather than scale.
4.2. Active Use
Figure 1 indexes members and active financing clients to 2018 = 100. By 2025, the member index had reached 160.2 and the active-client index 136.7. The gap widened over the whole period, and most sharply after 2023, when the number of active clients fell while membership kept rising.
Figure 1.
Members and active financing clients, 2018–2025 (index, 2018 = 100). Source: Authors’ calculations from IBBPLC annual reports.
The activation rate fell from 56.44% in 2018 to 48.17% in 2025, a decline of 8.27 percentage points. By 2025, fewer than half of registered members held financing. The decline was not steady. Activation fell to 54.82% in 2019 and 53.45% in 2020, recovered slightly to 54.34% in 2021 and 54.41% in 2022, and then fell in each of the last three years, to 52.87% in 2023, 49.29% in 2024, and 48.17% in 2025. About 57% of the full-period decline occurred after 2023. In absolute numbers, members without active financing rose from 482,751 in 2018 to 920,119 in 2025, an increase of 90.6%; between 2023 and 2025 alone, their number grew by 14.8%.
The size of the change can be illustrated with simple arithmetic. Had the 2018 activation rate applied to the 2025 membership, the program would have had about 1.00 million active clients instead of 855,222. This is not an estimate of unmet demand, and it does not imply that all inactive members should borrow; it only shows how far the share of members with financing moved from its 2018 level.
4.3. Real Depth of Financing and Savings
Adjusting for inflation changes the picture. Nominal outstanding financing rose from BDT 29.44 billion in 2018 to BDT 67.89 billion in 2025 (+130.65%; CAGR 12.68%). In constant 2018 prices, it rose from BDT 29.44 billion to BDT 41.31 billion (+40.35%; CAGR 4.96%). The real portfolio peaked at BDT 47.56 billion in 2023 and then fell by 13.13% by 2025: between 2023 and 2025, nominal financing grew by only 4.88%, while prices rose by 20.73%.
The same holds per client. Nominal financing per active client rose from BDT 47,058 in 2018 to BDT 71,986 in 2023 and BDT 79,388 in 2025. In 2018 prices, it rose to BDT 52,884 in 2023 and then fell to BDT 48,307 in 2025, only 2.65% above its 2018 level. Between 2023 and 2025, nominal financing per client grew by 10.28%, about half the rate of inflation. Almost all of the rise in average nominal financing over the full period therefore reflects higher prices rather than more real purchasing power.
Savings show an even larger gap between nominal and real values. Nominal member savings rose from BDT 10.46 billion to BDT 22.28 billion (CAGR 11.40%), but real member savings grew by only 3.77% a year, less than membership (6.96%). Real savings per member therefore fell from BDT 9442 to BDT 7636 (−19.13%). About 90% of this fall had occurred by 2023, when the figure was BDT 7819: real savings per member fell in every year from 2019 to 2022, rose slightly in 2023, and fell again in 2024 and 2025. Between 2023 and 2025, nominal savings grew by 23.05%, slightly faster than prices, but membership also grew, so real savings per member fell by a further 2.35%.
Figure 2 compares nominal and real values per active client (panel a) and per member (panel b). In both panels, the nominal line rises steeply while the inflation-adjusted line is flat or falling, which is the central measurement result of this study.
Figure 2.
Nominal and real (2018 prices) financing per active client and savings per member, 2018–2025 (thousand BDT). Source: Authors’ calculations from IBBPLC annual reports and Bangladesh Bureau of Statistics (2026).
Figure 3 shows activation and real financing depth together. Real depth fell in 2019 and then rose in every year from 2020 to 2023, while activation was already declining. After 2023, both fell: activation from 52.87% to 48.17%, and real depth by 8.65%, from BDT 52,884 to BDT 48,307. In the last two years, the program therefore had both fewer financing clients relative to its members and less real financing per client.
Figure 3.
Activation rate (left axis) and real financing per active client (right axis, thousand BDT at 2018 prices), 2018–2025. Source: Authors’ calculations from IBBPLC annual reports and Bangladesh Bureau of Statistics (2026).
4.4. Decomposition Result of Real Portfolio Change
Table 6 and Figure 4 show how the change in the real portfolio passed through the three margins. Over 2018–2025, the real portfolio rose by 40.35%, or 33.90 log points. Membership growth contributed +47.12 log points and the fall in activation contributed −15.84 points. Real financing depth contributed +2.62 points: real depth was slightly higher in 2025 than in 2018, even though it fell after 2023. These are accounting contributions, not causal effects. Membership growth was the largest positive component, and lower activation offset about one-third of it. Without the fall in activation, the real portfolio would have grown by about 50 log points instead of 34. The same identity can be read in ordinary percentages. Membership rose by 60.19%, the activation rate fell by 14.65% of its initial value (from 56.44% to 48.17%), and real depth rose by 2.65%; multiplying these changes (1.6019 × 0.8535 × 1.0265 = 1.4035) gives the 40.35% increase in the real portfolio.
Table 6.
Exact log decomposition of real outstanding financing (log points).
Figure 4.
Accounting contributions to the change in real outstanding financing, 2018–2025 (log points). Source: Authors’ calculations.
The sub-periods differ. In 2018–2019, lower activation and lower real depth offset most of the membership gain, leaving real growth of 5.25 log points. In 2019–2021 and 2021–2023, real depth added 7.77 and 8.06 log points, as nominal financing per client grew faster than prices, and the real portfolio grew by 22.77 and 19.95 log points. In 2023–2025, membership still contributed +4.28 points, but lower activation (−9.31) and lower real depth (−9.05) outweighed it, and the real portfolio fell by 14.08 log points (−13.13%). The post-2023 fall did not come from a smaller member base, which kept growing; it came through the activation and depth margins. Appendix B uses the same identity to show, with simple arithmetic scenarios for 2030, how activation and depth affect the future real size of the program.
4.5. Productivity
Productivity ratios moved in different directions as delivery capacity expanded. Active clients per employee fell slightly from 252.3 in 2018 to 245.9 in 2019, rose to a peak of 293.9 in 2023 (+16.47% over 2018), and then fell to 267.3 in 2025 (−9.06% after 2023), ending 5.91% above the 2018 level. Real outstanding financing per employee rose from BDT 11.87 million in 2018 to BDT 15.54 million in 2023 and fell to BDT 12.91 million in 2025: +8.73% over the full period, but −16.93% after 2023.
Members per operational unit fell from 4075 in 2018 to 3414 in 2025 (−16.21%), because operational units grew faster than membership. Staff per unit fell even more, from 9.1 employees in 2018 to 6.2 in 2025 (−32.5%), almost entirely before 2023. The decline in members per unit was concentrated in 2021 and 2022, when the number of units rose from 306 to 462; between 2023 and 2025, members and units grew at similar rates, and members per unit changed by only −0.24%. These ratios cannot show whether the expansion was efficient. More units can mean better access and shorter travel for clients, but they can also mean higher fixed costs with low use. Without scheme-level cost and transaction data, the results show lower delivery density and lower financing productivity after 2023, not efficiency or inefficiency.
4.6. Portfolio Quality
Portfolio quality was stable until 2023 and weakened in 2024–2025 (Table 7). The recovery rate fell from 99.43% in 2018 to 98.81% in 2020, returned to 99.07% in 2023, and then fell to 98.49% in 2024 and 97.50% in 2025. The 2025 level is still high, but the fall of 1.57 percentage points after 2023 is the largest two-year decline in the period. Overdue financing rose from 0.57% of outstanding financing in 2018 to 1.19% in 2020, eased to 0.93% in 2023, and then rose to 1.51% in 2024 and 2.52% in 2025. Classified financing rose more sharply, from 0.52% in 2023 to 1.70% in 2024 and 3.43% in 2025. In money terms, overdue financing nearly tripled between 2023 and 2025, from BDT 599 million to BDT 1711 million, and classified financing rose almost sevenfold, from BDT 335 million to BDT 2328 million, while outstanding financing grew by less than 5%.
Table 7.
Portfolio-quality indicators, 2018–2025.
Portfolio stress therefore increased at the same time as activation, real depth, clients per employee, and the real portfolio fell. The annual data show that these changes occurred together, but not which of them, if any, caused the others. Because the three measures follow different definitions, they are reported separately and are read together as signals of stress rather than as parts of one accounting relationship.
4.7. Contextual Benchmark: Licensed NGO-MFIs
The licensed NGO-MFI sector also grew over the same period (Table 8). MRA members rose from 31.20 million in FY2017–2018 to 43.98 million in FY2024–2025 (+40.96%), and borrowers from 25.39 million to 33.68 million (+32.65%). Sector activation therefore fell from 81.38% to 76.58% (−4.80 percentage points), compared with −8.27 points for RDS-UPDS. The gap between the two activation rates was stable, at between 23.3 and 25.1 percentage points, from 2018 to 2023, and then widened to 28.1 points in 2024 and 28.4 points in 2025.
Table 8.
Contextual benchmark: RDS-UPDS and licensed NGO-MFIs, 2018 and 2025.
Both real portfolios slowed or fell after 2023 (Figure 5). By 2025, the real outstanding index (2018 = 100) was 157.6 for the NGO-MFI sector and 140.3 for RDS-UPDS. Between 2023 and 2025, the sector’s real portfolio fell by 3.70% and its activation by 0.59 percentage points, compared with 13.13% and 4.70 points for RDS-UPDS. Not all sector indicators moved in the same direction: over 2018–2025, real financing per borrower rose by 18.84% and real savings per member by 31.18%, but borrowers per employee fell by 12.89% because employment grew faster than the number of borrowers. As explained in Section 3.6, these differences may reflect products, clients, regulation, staff roles, and reporting conventions. The comparison describes context; it does not rank RDS-UPDS against NGO-MFIs.
Figure 5.
Real outstanding financing of RDS-UPDS and licensed NGO-MFIs, 2018–2025 (index, 2018 = 100). The two series cover different institutions and reporting dates (December for RDS-UPDS; June for NGO-MFIs) and are shown for context only. Source: Authors’ calculations from IBBPLC annual reports, Microcredit Regulatory Authority (2026), and Bangladesh Bureau of Statistics (2026).
The indexed real portfolios followed different paths within the period (Figure 5). Relative to their respective 2018 levels, the NGO-MFI sector’s index was above the RDS-UPDS index in 2019 and 2020; the RDS-UPDS index was higher in 2021 and 2022, reaching 152.0 in 2022 compared with 147.3 for the sector. The sector’s index was higher again in 2023, at 163.7 compared with 161.6. Both indexes then declined, with the larger decline occurring in RDS-UPDS. Because the MRA data end in June and the bank data in December, turning points in the two series should not be compared year by year too closely.
4.8. Themes in the Success Stories
Table 9 gives the coding rule for each theme and the number of stories in which it appears. Ten profiles describe multiple product groups or enterprise activities; nine feature a woman client, and nine report hired workers or a production network. Three describe sales beyond the locality. The narratives also discuss repeat financing, reinvestment of profits, supplier and veterinary links, and savings alongside financing. Four explicitly link intended expansion to additional financing, higher ceilings, or support beyond the current RDS arrangement. These aspirations concern a larger factory and showroom, a larger livestock operation, wider market reach and employment, and expansion while keeping pace with prices. Because the bank selected the stories to show success, the patterns generate hypotheses about enterprise growth, financing needs, women’s participation, employment and family co-production; they do not estimate prevalence among program members or explain the post-2023 decline in real financing depth.
Table 9.
Coding framework and coded themes in the 11 success stories supplied by IBBPLC.
5. Discussion
Table 10 summarizes the answers to the five research questions. The rest of this section discusses the four main findings—on outreach, active use, real depth, and portfolio quality—relates them to earlier evidence on the RDS, and sets out their implications and the study’s limitations.
Table 10.
Summary of findings by research question.
5.1. Outreach: Wider Reach, Lower Delivery Density
The first finding is that the program’s reach grew substantially. Between 2018 and 2025, the consolidated RDS-UPDS program increased its members by 60%, the villages it covers by 61%, and its operational units by 91%, and it more than doubled its nominal savings and financing. A bank-led Islamic microfinance program can therefore keep enrolling members at scale, which is consistent with earlier descriptions of the RDS as a large, scalable model (United Nations Development Programme, 2012). For rural development, the extension of coverage to more than 35,000 villages is valuable in itself, because it brings formal, Shariah-compliant finance within reach of households that might otherwise depend on informal sources.
Reach, however, grew faster than the use of financing, and the delivery network grew faster than staff or active clients. A denser network can lower travel costs and bring services closer to underserved rural communities; rural enterprises in Bangladesh value the proximity of MFIs and see banks as more distant (Mahmud & Tulla, 2024). A larger network can also raise fixed costs if the number of clients and transactions does not rise with it. The ratios in Section 4.5 cannot separate these two readings. Efficiency studies of MFIs rely on cost and output data, for example in data envelopment analysis (Zineelabidine et al., 2024); such data, together with transaction and channel data, are not published for RDS-UPDS. Registered reach is therefore only the first stage of inclusion (Allen et al., 2016; Klapper et al., 2025).
This measurement problem is growing as bank-led inclusion combines branches, sub-branches, agent banking, and digital channels. A member recorded at one unit may transact at another or through a mobile channel, and staff may serve several product lines. Future performance reporting should therefore pair counts of operational units with data on active use and transactions by channel. This would turn a simple footprint statistic into a more informative measure of access and delivery productivity, and it would show whether new units attract new financing clients or mainly register members. Most of the network expansion took place in 2021 and 2022, when operational units rose from 306 to 462. Members per unit fell sharply in those two years and then stabilized, which is consistent with new units taking time to reach the membership of established ones; unit-level data would show whether they also take longer to reach the same share of active financing clients.
5.2. Active Use: Why Did Activation Fall?
The second finding is that the share of members with active financing fell from 56% to 48%. This does not mean that every member should borrow. Access to financing when it is needed does matter, however, as the Bangladesh evidence on new loans during the COVID-19 period shows (Arman et al., 2026). Several explanations for the fall are possible, and the aggregate data cannot rank them.
First, inactivity may be voluntary. Members may join mainly to save, may have repaid one financing cycle and not yet started another, may finance their businesses from their own earnings, or may prefer to avoid debt. Such members still use the program, even though they do not borrow. Second, demand for financing may have fallen. Inflation of 9–10% a year in 2023–2025 (Table 3) raised input costs and may have squeezed the cash flow of small enterprises, making new or repeat financing less attractive. Third, supply may have tightened. As overdue and classified financing rose, field staff may have screened applicants more strictly or delayed repeat financing, and the bank’s overall funding and liquidity position, which the scheme-level data do not show, may also have mattered. Cross-country evidence that borrower turnover in MFIs rises with write-offs and staff turnover (Mia et al., 2022) is consistent with this reading.
Fourth, the composition of membership may have changed. Operational units grew by 91%, and new units usually enroll members before they finance them, so rapid enrollment can lower the activation rate for a time. Fifth, some clients may have moved to other products or providers—for example, to the bank’s larger enterprise financing, which may be recorded outside the program’s client count, or to NGO-MFIs. Borrowing from several lenders is not new: about 15% of RDS clients surveyed in 2006–2007 also borrowed from interest-based NGOs (Rahman et al., 2008). Finally, reporting practices, such as how long inactive members remain on the register, may have changed.
The decomposition shows why these possibilities matter for the portfolio: without the fall in activation, the real portfolio would have grown by about 50 log points rather than 34. The benchmark adds some context. Activation also fell among NGO-MFIs, so part of the decline may reflect conditions across the sector. However, the gap between the two activation rates was stable until 2023 and widened only in 2024–2025, which suggests that sector-wide conditions are unlikely to be the whole story, although differences in institutions and reporting dates limit this comparison. A falling activation rate is not, by itself, evidence of mission drift either. The mission-drift literature asks whether an institution shifts toward better-off clients, often using average loan size and the share of women borrowers as indicators (Mersland & Strøm, 2010; Serrano-Cinca et al., 2023); such client-level data are not available here.
What the evidence does support is the need for flow-based internal diagnostics. Year-end stocks should be complemented by data on new registrations, first financing, repeat financing, graduation, temporary dormancy, reactivation, exit, write-offs, and movement to other IBBPLC products. Broken down by scheme (rural or urban), sex, district, sector, financing tier, delivery channel, and year of enrollment, such data would show whether falling activation is concentrated among new members, mature borrowers, particular sectors, or particular places, and whether portfolio stress came before or after the fall in financing activity.
A simple and inexpensive first step would be to ask members directly. Short surveys of non-borrowers and of clients who leave, conducted at center meetings, could record why members do not take up financing: no current need, fear of debt, an unsuitable product or limit, a rejected application, or borrowing elsewhere. Such information would allow the bank to separate voluntary from involuntary inactivity, to adjust products where the reasons lie on the supply side, and to address the main limitation of the present analysis.
5.3. Real Depth: Inflation and the Value of Financing and Savings
The third finding is that adjusting for inflation changes how growth should be read. Nominal outstanding financing more than doubled, which on its own might suggest rapid deepening. In real terms, the portfolio grew by 40% and has fallen since 2023, and real financing per active client in 2025 was only 2.65% above its 2018 level. What matters for a microenterprise is what its financing can buy at current prices (stock, equipment, livestock, or feed), so a larger nominal amount does not help if limits and balances rise more slowly than prices. The 8.65% fall in real financing per active client after 2023 is therefore more informative about the scale of financed activity than the continued rise in nominal balances. A similar erosion appears at the macro level: in Bangladesh, the growth effect of foreign aid weakens as inflation rises and turns negative above an inflation rate of about 9.9% (Ehigiamusoe et al., 2025), close to the rates of 2023–2025. Although that study concerns aid rather than microfinance, it points to the same problem: high inflation reduces what a given amount of finance can achieve.
The benchmark sharpens this point. Real financing per borrower in the NGO-MFI sector rose by 18.84% over the same period, whereas real financing per active RDS-UPDS client rose by only 2.65%. The flat real depth of RDS-UPDS therefore cannot be explained by inflation alone, because the same inflation applied to both series. Differences in products, loan terms, client mix, and reporting dates may account for part of the gap, so the comparison remains descriptive.
Savings point in the same direction. Nominal member savings more than doubled, but real savings per member fell by 19%. Savings help households absorb shocks and reduce the need for costly emergency borrowing, and a field experiment in Kenya found that access to a savings account raised business investment among women market vendors (Dupas & Robinson, 2013). The aggregate data do not separate voluntary from compulsory savings, so the welfare implications are uncertain. If the fall reflects withdrawals in difficult years, savings may simply have done their job of smoothing consumption. Members may also save through other channels: in Bangladesh, households that receive remittances are more likely to hold electronic bank accounts and use mobile banking (Abdul Mannan & Farhana, 2023). Still, growth in nominal deposits should not be read as stronger real household buffers.
The appropriate response depends on the composition of savings, which is not visible in the public totals. If the fall reflects weak deposit growth because contribution schedules do not match seasonal incomes, product redesign may help; if a large share of savings is compulsory or linked to financing, the welfare reading is different again. For rural households, timing also matters: agricultural and informal-enterprise incomes are often seasonal and uneven, so rigid deposit or repayment schedules can cause unnecessary strain. Schedules aligned with harvests or business cycles could be tested without weakening affordability checks. Reporting voluntary, compulsory, and term savings separately, and in real terms, would make these choices easier to assess.
5.4. Portfolio Quality and Risk-Based Graduation
The fourth finding is that portfolio quality weakened after 2023, at the same time as activation and real depth fell. Between 2023 and 2025, the recovery rate fell from 99.07% to 97.50%, and classified financing rose from 0.52% to 3.43% of the portfolio. The levels remain moderate, but the direction matters. Studies elsewhere find that portfolio risk in MFIs is sensitive to institutional factors and the economic cycle (Abusharbeh, 2023) and rises with economic policy uncertainty, although group lending softens this effect (Xie, 2025). The RDS works through groups and mainly with women (United Nations Development Programme, 2012; Nahar, 2022), and these features are associated with lower credit risk in Islamic MFIs (Mohamed & Elgammal, 2023). The post-2023 deterioration may therefore reflect wider economic and institutional conditions, a change in client composition, or both. The aggregate data cannot separate these explanations, and features that are associated with lower credit risk elsewhere cannot be assumed to have kept the client mix unchanged here. The annual data also cannot show whether weaker repayment led to tighter lending, whether lower real financing weakened enterprises, or whether both reflect the same shocks. Because the sustainability of Bangladeshi MFIs is associated with loan size and the number of borrowers (Maeenuddin et al., 2023), the simultaneous fall in active clients and real depth may also affect the program’s own financial sustainability.
This pattern also motivates questions about product design. Four of the eleven success stories explicitly link intended enterprise expansion to additional financing, higher limits, or support beyond the current RDS arrangement. The narratives suggest examining whether growing enterprises need larger or differently structured products as they add product lines and reach wider markets, including progression to other bank products. These stated aspirations do not establish binding credit constraints. Rising overdue and classified financing, however, argues against a general increase in financing limits, which would raise exposure precisely when risk is rising.
A better approach is a transparent, risk-based graduation ladder. Larger limits would go to clients with a record of cash flow, repayment, savings, and business documentation, after an assessment of sector risk and of how earlier financing was used. They could be combined with closer monitoring, business-development support, supplier or market links, insurance or risk-sharing arrangements where feasible, and periodic reassessment of repayment capacity. Such a ladder addresses two risks at once: too little financing for capable enterprises, whose limits may not keep pace with their growth or with inflation, and too much exposure for vulnerable clients. The aim should be suitable financing, not maximum credit.
Because most of the success stories feature women, it is also relevant that a qualitative study of women borrowers in Bangladesh found gains in household decision-making but not in economic or political empowerment (Pervin et al., 2023). Success narratives about women’s enterprises should be read with this in mind, and future graduation products should be assessed for their effects on women’s control over enterprise income, not only on loan size.
5.5. Relation to Earlier Evidence on the RDS
The findings add a new dimension to the earlier evidence on the RDS rather than overturning it. Survey-based studies found that clients’ incomes and spending had risen since they joined (Rahman et al., 2008; Parvej et al., 2020) and that women clients gained in income, savings, and economic and socio-cultural empowerment (Islam, 2021). These studies mainly surveyed clients who held financing, a group that has become a smaller share of the membership: fewer than half of members held financing in 2025, and the number without financing had almost doubled since 2018. Aggregate activation rates do not show how welfare gains are distributed between financing clients and other members.
The inflation-adjusted results are also relevant to the most recent survey evidence. Ahamad et al. (2026) find that larger loans are associated with higher self-reported household well-being. If that association holds more widely, the fact that real financing per active client barely grew over 2018–2025, and fell after 2023, may have limited the gains that borrowers could obtain from their financing. This link could be tested directly with client-level data that record loan sizes in real terms.
The earlier literature also points to features of the program that may help to explain its recent path. The UNDP case study credits the growth of the RDS to institutional capacity and committed management (United Nations Development Programme, 2012), and Rahman et al. (2008) recommended stronger monitoring as the program grew. The recent expansion of the delivery network, with operational units growing much faster than staff—staff per unit fell by about one-third between 2018 and 2023—suggests that keeping the same intensity of supervision at a much larger scale is a practical challenge. The multiple borrowing documented by Rahman et al. (2008) also shows that RDS members have long had alternatives, which is relevant to understanding why some members do not take up financing.
5.6. Implications for Reporting and Evaluation
The source definitions and revisions described in Section 3.2 show that data governance is central, not peripheral. The headline series combines RDS and UPDS, includes microenterprise financing, and is occasionally revised. None of these features makes the data unusable, but together they limit what can be said about each scheme. A program of this size would benefit from publishing a data dictionary and a revision policy; reporting RDS, UPDS, and microenterprise series separately; defining members, active clients, overdue and classified financing, recovery, and employees explicitly; reporting annual flows as well as year-end stocks; flagging changes in definitions; and adding inflation-adjusted indicators to management reports, even if statutory reporting remains nominal.
Inflation-adjusted indicators also have a direct operational use. Financing limits could be reviewed regularly against the CPI, so that they keep their real value when prices rise quickly, as they did in 2023–2025. Any such adjustment would need to be balanced against repayment capacity, which depends on whether clients’ incomes keep pace with prices, and would therefore fit naturally within the risk-based graduation approach described in Section 5.4.
Such data are also needed for impact evaluation. Institutional totals can track reach, use, and risk, but not changes in income, profit, consumption, resilience, poverty status, or women’s agency. A representative longitudinal sample of clients—recording baseline characteristics, financing terms and purposes, savings, enterprise outcomes, shocks, and exits—would be needed, together with a credible comparison design such as phased rollout, matched comparison groups, or eligibility thresholds. The design should follow the way the program is actually rolled out and should be chosen before outcomes are observed.
A stronger comparative design would also improve benchmarking. Harmonizing definitions across major providers, aligning reporting dates, and accounting for product and client composition would make it possible to test whether bank-led, NGO-led, conventional, and Islamic microfinance models differ in activation, real depth, cost, and resilience to macroeconomic shocks. The present benchmark is a first descriptive step toward that question.
More broadly, the results suggest that inclusion should be assessed in stages (availability, membership, active use, real depth, and welfare), because success at one stage does not guarantee success at the next. For bank-led Islamic microfinance, this staged view is especially useful. The bank-led model can link excluded clients to a wider regulated financial system, and its development potential lies not only in making Shariah-compliant finance available but also in supporting lasting transitions from membership to suitable use, from small financing to viable enterprises, and from local to wider markets where appropriate. Reporting these margins openly makes the case for the program more credible, not less.
5.7. Limitations
The study has six main limitations. First, the bank’s headline series combines RDS, UPDS, and microenterprise financing, so trends for each scheme cannot be recovered. The recovery, overdue, and classified indicators also depend on accounting and regulatory definitions that may change, and the reports do not allow every reclassification, restructuring, write-off, or recovery calculation to be traced. The study deals with this by naming the consolidated program consistently, by avoiding RDS-only claims, and by reading the joint deterioration of the three quality measures as a stress signal rather than imposing a relationship between them.
Second, eight annual observations are too few for causal time-series analysis, structural-break tests, or forecasting. The comparison of 2018–2023 with 2023–2025 is descriptive, not a statistically estimated break. The period also includes the COVID-19 pandemic and a phase of high inflation, so some patterns may reflect these unusual conditions.
Third, the aggregate data cannot distinguish members who are voluntarily inactive—because they only save, have completed a financing cycle, or finance themselves—from members who are excluded from financing by supply-side constraints, such as stricter screening or unmet demand. Activation should therefore be read as a diagnostic signal, not as a measure of exclusion. Client-level data on the reasons for inactivity would be needed to settle this question.
Fourth, no client-level data on income, consumption, poverty, profits, employment, resilience, or empowerment are available in the annual reports, so the study cannot estimate welfare effects or say whether inactive members are better or worse off. Fifth, real values rely on fiscal-year average national CPI matched by ending year to December bank stocks, and local or enterprise-specific prices—for food, agricultural inputs, or livestock—may differ; the real-depth estimates are national purchasing-power measures, not exact input-cost indices. The NGO-MFI benchmark covers different institutions, products, regulation, and reporting dates and supports context only.
Sixth, the 11 success stories are promotional cases selected by the bank, with no sampling frame, comparison group, standard outcome measures, or consistent chronology, and two contain inconsistencies; they can show which mechanisms are mentioned but not how common they are or whether financing caused the reported outcomes. In addition, the productivity ratios exclude costs, staff mix, digital transactions, and service quality, so a fall in members per unit may reflect either costly under-use or valuable expansion of access. Finally, annual reports are prepared for corporate rather than research purposes. Undocumented changes in definitions remain a risk when interpreting trends across report editions; the source definitions, report vintages and comparability limits described in Section 3.2 should therefore be considered alongside the results.
6. Conclusions and Policy Implications
This study examined the growth of IBBPLC’s consolidated RDS-UPDS program between 2018 and 2025, separating reach, active use, and real depth. The program grew from 1.11 million to 1.78 million members, reached 35,352 villages through 520 operational units, and more than doubled its nominal financing. However, active financing clients grew much more slowly, the activation rate fell from 56.44% to 48.17%, real financing per active client ended only 2.65% above its 2018 level, and real savings per member fell by 19.13%.
The decomposition identifies three accounting contributions to real portfolio growth: +47.12 log points from membership growth, −15.84 from falling activation, and a small +2.62 from real financing depth, which rose slightly over the full period but fell after 2023. After 2023, lower activation and lower real depth reduced real outstanding financing by 13.13% even though membership continued to grow, and portfolio quality weakened. Licensed NGO-MFIs showed smaller declines in activation and in the real portfolio over the same two years, although this comparison is contextual only.
These findings do not deny the inclusion value of RDS-UPDS, show mission drift, or establish harm to borrowers. They show that registered reach and nominal balances are not sufficient measures of program performance. The next stage of performance measurement should ask how many suitable members become and stay active, whether financing and savings keep their purchasing power, whether viable enterprises can graduate without weakening risk discipline, and whether the delivery network supports meaningful use rather than registration alone.
The recommendations below are ordered by how directly the evidence supports them. (1) Report activation—the share of members with active financing—as a core indicator, together with flows into first financing, repeat financing, dormancy, reactivation, graduation, and exit, broken down by cohort, sex, location, sector, financing tier, and channel. (2) Monitor real financing per client and real savings per member alongside nominal totals, so that inflation does not hide falling purchasing power. (3) Publish separate RDS, UPDS, and microenterprise series with stable definitions and a revision log. (4) Link portfolio-quality monitoring to decisions on activation and depth, and use risk-based graduation rather than across-the-board increases in financing limits, so that growth in inclusion does not become detached from sustainability. (5) Build representative longitudinal client data and a credible comparison design before attributing changes in poverty, income, empowerment, or resilience to the program. The first three recommendations follow directly from the descriptive evidence and could be implemented with data the bank already collects; the fourth responds to the combination of rising portfolio stress and the financing aspirations for enterprise expansion in the success stories; and the fifth is a longer-term investment.
Future research could extend this analysis in three directions. Scheme- and branch-level data would separate RDS, UPDS, and microenterprise trends and relate activation to local conditions. Client-level panel data would distinguish voluntary from involuntary inactivity and test whether the real size of financing affects household well-being. Harmonized data for several institutions would allow bank-led and NGO-led, and Islamic and conventional, microfinance models to be compared on activation, real depth, cost, and resilience to shocks.
The lesson extends beyond IBBPLC and Bangladesh. Financial inclusion programs contribute to economic development through a sequence from availability to participation, real financial depth, and, potentially, welfare gains. Growth at the first stages is valuable, but it should not be presented as evidence of the later stages without appropriate data. A measurement system that tracks each stage makes this distinction visible and gives a sounder basis for policy and for future impact evaluation.
Author Contributions
A.K.M.A.S.: Data curation, Data collection, Formal analysis, Methodology, Investigation, and Writing—original draft; J.M.A.: Conceptualization, Methodology, Writing—review & editing, Supervision, and Project administration; N.J.T.: Literature review, Investigation, Data collection, Writing—original draft, and Writing—review & editing. All authors have read and agreed to the published version of the manuscript.
Funding
This research received no external funding.
Institutional Review Board Statement
Not applicable.
Informed Consent Statement
Not applicable. No new data were collected from human participants. The success stories analyzed were published by IBBPLC, and this article does not identify the individuals described in them.
Data Availability Statement
The IBBPLC annual reports (Annual Report|Islami Bank Bangladesh PLC (https://www.islamibankbd.com/annual-report, accessed on 14 July 2026)), the BBS consumer price bulletin, and the MRA annual statistics analyzed in this study are publicly available from the issuing institutions. The annual RDS-UPDS observations and derived indicators are presented in Table A1 and Table A2, the CPI values and deflators in Table 3, the contextual benchmark endpoints in Table 8, and the qualitative coding rules and aggregate theme counts in Table 9.
Acknowledgments
During the preparation of this manuscript, the authors used OpenAI ChatGPT (GPT-5.6 Sol, accessed 28 August 2026) to review the text and language, and, during revision, Anthropic Claude (Claude Opus 5.5, accessed September 2026) for language editing. During the final revision, AI-assisted review checked numerical consistency and qualitative coding against the study data, calculations, figures and source narratives. The authors have manually reviewed and executed the codes, reviewed the output results and take full responsibility for the content of this publication.
Conflicts of Interest
Author A. K. M. Abu Siddiqui was employed by the company Islami Bank Bangladesh PLC. The remaining authors declare that the research was conducted in the absence of any commercial or financial relationships that could be construed as a potential conflict of interest.
Abbreviations
The following abbreviations are used in this manuscript:
| BBS | Bangladesh Bureau of Statistics |
| BDT | Bangladeshi taka |
| CAGR | Compound annual growth rate |
| CGAP | Consultative Group to Assist the Poor |
| CPI | Consumer price index |
| FY | Fiscal year (July–June) |
| GenAI | Generative artificial intelligence |
| IBBPLC | Islami Bank Bangladesh PLC |
| MFI | Microfinance institution |
| MRA | Microcredit Regulatory Authority |
| NGO | Non-governmental organization |
| NGO-MFI | Non-governmental microfinance institution |
| RDS | Rural Development Scheme |
| RQ | Research question |
| UNDP | United Nations Development Programme |
| UPDS | Urban Poor Development Scheme |
Appendix A. Annual Data, 2018–2025
Table A1 and Table A2 report the annual RDS-UPDS observations and derived indicators used in the analysis. Table A1 gives the observations from the selected annual-report editions described in Section 3.2, with monetary amounts rounded to the nearest BDT million for presentation; calculations retain the precision supplied by each source. Table A2 gives the derived indicators. Real values are in constant 2018 prices, deflated with the linked national CPI (Table 3).
Table A1.
RDS-UPDS indicators as published, 2018–2025.
Table A2.
Derived RDS-UPDS indicators, 2018–2025.
Appendix B. Arithmetic Scenarios for 2030
Three arithmetic scenarios show how membership growth, activation, and real depth together determine the size of the real portfolio. They are not forecasts. In each scenario, 2030 membership is projected from its 2025 level (1,775,341) at an assumed annual growth rate. Active clients equal projected members multiplied by an assumed activation rate; it is the activation rate, not the number of active clients, that is held constant. Real outstanding financing equals active clients multiplied by an assumed real financing depth in 2018 prices (Table A3).
The recent-growth scenario applies the 2023–2025 membership growth rate (2.16% a year) and uses the rounded 2025 activation rate (48.17%) and real depth (BDT 48,307). Membership reaches about 1.98 million, active clients about 0.95 million, and real outstanding financing about BDT 45.98 billion. The long-run expansion scenario applies the faster 2018–2025 membership growth rate (6.96% a year) with the same 2025 activation rate and real depth. Membership reaches about 2.49 million, active clients about 1.20 million, and real outstanding financing about BDT 57.84 billion. The activation-and-depth restoration scenario keeps recent membership growth (about 1.98 million members) but restores activation to its rounded 2018 level (56.44%) and real depth to its rounded 2023 level (BDT 52,884). It yields about 1.12 million active clients and BDT 58.98 billion in real outstanding financing.
The restoration scenario therefore reaches slightly more real financing than the long-run expansion scenario, with about half a million fewer members. This does not imply that activation can be raised at no cost or that more members should borrow. It shows only that the future real scale of the program depends on how many suitable members use financing, and on the real value of that financing, not only on enrollment.
Table A3.
Arithmetic scenarios for 2030 (not forecasts).
References
- Abdul Mannan, K., & Farhana, K. M. (2023). Digital financial inclusion and remittances: An empirical study on Bangladeshi migrant households. FinTech, 2(4), 680–697. [Google Scholar] [CrossRef] [Scilit]
- Abdul Rahman, A. R. (2010). Islamic microfinance: An ethical alternative to poverty alleviation. Humanomics, 26(4), 284–295. [Google Scholar] [CrossRef] [Scilit]
- Abrar, A., Hasan, I., & Kabir, R. (2023). What makes the difference? Microfinance versus commercial banks. Borsa Istanbul Review, 23(4), 759–778. [Google Scholar] [CrossRef] [Scilit]
- Abusharbeh, M. T. (2023). Modeling the factors of portfolio at risk for microfinance institutions in Palestine. Cogent Economics & Finance, 11(1), 2186042. [Google Scholar] [CrossRef] [Scilit]
- Ahamad, S., Islam, M. A., Yusof, M. F., Al-Jaifi, H. A., & Ehigiamusoe, K. U. (2024). Relationship between microfinance institutions’ self-sustainability and financing sources: Moderating role of external governance. Annals of Public and Cooperative Economics, 95(4), 971–1001. [Google Scholar] [CrossRef] [Scilit]
- Ahamad, S., Reaz, M. T., Nadzri, F. A. B. A., Abdulbaten, A. M., & Zeesan, E. A. (2026). Microfinance and rural household progress in Bangladesh: Insights from moral drivers. In M. Al Mubarak (Ed.), Enhancing business efficiency through technology (Studies in Systems, Decision and Control) (Vol. 659, pp. 225–234). Springer. [Google Scholar] [CrossRef] [Scilit]
- Ahmad, S., Lensink, R., & Mueller, A. (2020). The double bottom line of microfinance: A global comparison between conventional and Islamic microfinance. World Development, 136, 105130. [Google Scholar] [CrossRef] [Scilit]
- Allen, F., Demirgüç-Kunt, A., Klapper, L., & Martinez Peria, M. S. (2016). The foundations of financial inclusion: Understanding ownership and use of formal accounts. Journal of Financial Intermediation, 27, 1–30. [Google Scholar] [CrossRef] [Scilit]
- Arman, M. R., Das, N., Mahmood, S., Rahman, S., & Rahman, K. W. (2026). The impact of microcredit on household welfare: Evidence from Bangladesh during the COVID-19 pandemic. The Journal of Development Studies, 62(2), 286–307. [Google Scholar] [CrossRef] [Scilit]
- Armendáriz, B., & Morduch, J. (2010). The economics of microfinance (2nd ed.). MIT Press. [Google Scholar]
- Banerjee, A., Karlan, D., & Zinman, J. (2015). Six randomized evaluations of microcredit: Introduction and further steps. American Economic Journal: Applied Economics, 7(1), 1–21. [Google Scholar] [CrossRef] [Scilit]
- Bangladesh Bureau of Statistics. (2026). Consumer price index (CPI), inflation rate and wage rate index (WRI) in Bangladesh: April 2026. Bangladesh Bureau of Statistics. [Google Scholar]
- Beck, T., Demirgüç-Kunt, A., & Levine, R. (2007). Finance, inequality and the poor. Journal of Economic Growth, 12(1), 27–49. [Google Scholar] [CrossRef] [Scilit]
- Cull, R., Demirgüç-Kunt, A., & Morduch, J. (2007). Financial performance and outreach: A global analysis of leading microbanks. The Economic Journal, 117(517), F107–F133. [Google Scholar] [CrossRef] [Scilit]
- Cull, R., Demirgüç-Kunt, A., & Morduch, J. (2009). Microfinance meets the market. Journal of Economic Perspectives, 23(1), 167–192. [Google Scholar] [CrossRef] [Scilit]
- Dalla Pellegrina, L., Diriker, D., Landoni, P., Moro, D., & Wijesiri, M. (2024). Financial and social sustainability in the European microfinance sector. Small Business Economics, 63(3), 1249–1292. [Google Scholar] [CrossRef] [Scilit]
- Daudi, K. W., & Dalvadi, Y. M. (2025). Mapping the research landscape of microfinance: A bibliometric analysis (2016–2024). SAGE Open, 15(4), 21582440251389326. [Google Scholar] [CrossRef] [Scilit]
- Disli, M., & Jalaly, S. (2024). The performance of Islamic and conventional microfinance loans in Afghanistan: The Taliban and beyond. Emerging Markets Review, 59, 101104. [Google Scholar] [CrossRef] [Scilit]
- Dupas, P., & Robinson, J. (2013). Savings constraints and microenterprise development: Evidence from a field experiment in Kenya. American Economic Journal: Applied Economics, 5(1), 163–192. [Google Scholar] [CrossRef] [Scilit]
- Ehigiamusoe, K. U., Abdul Latiff, A. R., Ramakrishnan, S., & Uddin, M. H. (2025). The roles of inflation and financial development in the effectiveness of foreign aid: Evidence from Bangladesh. The Journal of International Trade & Economic Development, 34(3), 450–474. [Google Scholar] [CrossRef] [Scilit]
- Finance Division, Government of Bangladesh. (2021). National financial inclusion strategy (NFIS) of Bangladesh 2021–2026. Government of the People’s Republic of Bangladesh. [Google Scholar]
- Hassan, M. K., Alshater, M. M., Hasan, R., & Bhuiyan, A. B. (2021). Islamic microfinance: A bibliometric review. Global Finance Journal, 49, 100651. [Google Scholar] [CrossRef] [Scilit]
- Hermes, N., Lensink, R., & Meesters, A. (2011). Outreach and efficiency of microfinance institutions. World Development, 39(6), 938–948. [Google Scholar] [CrossRef] [Scilit]
- Hussain, S., Rehman, A. U., Ullah, S., Waheed, A., & Hassan, S. (2024). Financial inclusion and economic growth: Comparative panel evidence from developed and developing Asian countries. SAGE Open, 14(1), 21582440241232585. [Google Scholar] [CrossRef] [Scilit]
- Imai, K. S., & Azam, M. S. (2012). Does microfinance reduce poverty in Bangladesh? New evidence from household panel data. The Journal of Development Studies, 48(5), 633–653. [Google Scholar] [CrossRef] [Scilit]
- Islam, M. S. (2021). Role of Islamic microfinance in women’s empowerment: Evidence from Rural Development Scheme of Islami Bank Bangladesh Limited. ISRA International Journal of Islamic Finance, 13(1), 26–45. [Google Scholar] [CrossRef] [Scilit]
- Islami Bank Bangladesh PLC. (2020). Annual report 2020. Islami Bank Bangladesh PLC. [Google Scholar]
- Islami Bank Bangladesh PLC. (2022). Annual report 2022. Islami Bank Bangladesh PLC. [Google Scholar]
- Islami Bank Bangladesh PLC. (2023). Annual report 2023 (pp. 205–216). Islami Bank Bangladesh PLC. Available online: https://www.islamibankbd.com/public/assets/annual-report/1715580291_Annual%20Report%202023.pdf (accessed on 7 August 2026).
- Islami Bank Bangladesh PLC. (2024). Annual report 2024. Islami Bank Bangladesh PLC. [Google Scholar]
- Islami Bank Bangladesh PLC. (2025). Annual report 2025. Islami Bank Bangladesh PLC. [Google Scholar]
- Ismail, M., Santoso, D. B., & Satria, D. (2024). Microfinance and poverty in Indonesia: The macro impact of people’s credit bank. Journal of Business Economics and Management, 25(4), 647–664. [Google Scholar] [CrossRef] [Scilit]
- Jia, P., & Sun, S. L. (2023). Mission drift or mission fulfillment? Examining microfinance’s financial and social performance with growth curve modeling and variance decomposition. Cross Cultural & Strategic Management, 30(3), 467–487. [Google Scholar] [CrossRef] [Scilit]
- Karim, N., Tarazi, M., & Reille, X. (2008). Islamic microfinance: An emerging market niche (Focus Note No. 49). CGAP. Available online: https://www.cgap.org/research/publication/islamic-microfinance-emerging-market-niche (accessed on 28 July 2026).
- Khan, N., Hassan, M. S., Yusof, M. F., Islam, M. A., & Rahim, M. M. (2024). Financial inclusion as a catalyst for economic growth: Evidence from selected developing countries. Cogent Social Sciences, 10(1), 2387907. [Google Scholar] [CrossRef] [Scilit]
- Khandker, S. R. (2005). Microfinance and poverty: Evidence using panel data from Bangladesh. The World Bank Economic Review, 19(2), 263–286. [Google Scholar] [CrossRef] [Scilit]
- Khémiri, W., Chafai, A., Attia, E. F., Tobar, R., & Farid Fouad, H. (2024). Trade-off between financial inclusion and Islamic bank stability in five GCC countries: The moderating effect of CSR. Cogent Business & Management, 11(1), 2300524. [Google Scholar] [CrossRef] [Scilit]
- Klapper, L., Singer, D., Starita, L., & Norris, A. (2025). The Global Findex Database 2025: Connectivity and financial inclusion in the digital economy. World Bank. [Google Scholar] [CrossRef] [Scilit]
- Lwesya, F., & Mwakalobo, A. B. S. (2023). Frontiers in microfinance research for small and medium enterprises (SMEs) and microfinance institutions (MFIs): A bibliometric analysis. Future Business Journal, 9(1), 17. [Google Scholar] [CrossRef] [Scilit]
- Maeenuddin, Hamid, S. A., Fahlevi, M., Nassir, A. M., & Hashim, P. M. (2023). Predictors of microfinance sustainability: Empirical evidence from Bangladesh. Cogent Economics & Finance, 11(1), 2202964. [Google Scholar] [CrossRef] [Scilit]
- Mahmud, A. U., & Tulla, A. F. (2024). Rural financial landscape in Bangladesh: Who is more convenient for rural enterprises—Banks or microfinance institutions? Asia-Pacific Journal of Rural Development, 34(2), 190–208. [Google Scholar] [CrossRef] [Scilit]
- Meager, R. (2019). Understanding the average impact of microcredit expansions: A Bayesian hierarchical analysis of seven randomized experiments. American Economic Journal: Applied Economics, 11(1), 57–91. [Google Scholar] [CrossRef] [Scilit]
- Mersland, R., & Strøm, R. Ø. (2010). Microfinance mission drift? World Development, 38(1), 28–36. [Google Scholar] [CrossRef] [Scilit]
- Mia, M. A., Abdu, M., Sangwan, S., Jibir, A., Ahmad, N. H., Handoyo, R. D., & Alam, A. S. A. F. (2026). Nonprofit and for-profit microfinance institutions: Governance, outreach and sustainability. Nonprofit Management and Leadership, 36(3), 321–350. [Google Scholar] [CrossRef] [Scilit]
- Mia, M. A., Banna, H., Noman, A. H. M., Alam, M. R., & Rana, M. S. (2022). Factors affecting borrowers’ turnover in microfinance institutions: A panel evidence. Annals of Public and Cooperative Economics, 93(1), 55–84. [Google Scholar] [CrossRef] [Scilit]
- Microcredit Regulatory Authority. (2026). Microfinance in Bangladesh: Annual statistics, June 2025. Microcredit Regulatory Authority. [Google Scholar]
- Mohamed, T. S., & Elgammal, M. M. (2023). Credit risk in Islamic microfinance institutions: The role of women, groups, and rural borrowers. Emerging Markets Review, 54, 100994. [Google Scholar] [CrossRef] [Scilit]
- Mohieldin, M., Iqbal, Z., Rostom, A., & Fu, X. (2011). The role of Islamic finance in enhancing financial inclusion in Organization of Islamic Cooperation countries (Policy Research Working Paper No. 5920). World Bank. [Google Scholar] [CrossRef] [Scilit]
- Morduch, J. (1999). The microfinance promise. Journal of Economic Literature, 37(4), 1569–1614. [Google Scholar] [CrossRef] [Scilit]
- Nahar, L. (2022). Islamic microfinance as a poverty reduction tool in terms of Islamic finance: An analysis of the Islami Bank microfinance scheme in Bangladesh. CenRaPS Journal of Social Sciences, 4(1), 119–142. [Google Scholar] [CrossRef] [Scilit]
- Parvej, M. M., Chowdhury, M. A. I., Azam, M. K. G., Hossain, M. M., & Mamun, A. M. A. (2020). Role of Islamic microfinance in alleviating poverty in Bangladesh: A study on RDS of IBBL. International Journal of Financial Research, 11(4), 111–129. [Google Scholar] [CrossRef] [Scilit]
- Pattnaik, D., & Hassan, M. K. (2025). Mapping microfinance research to sustainable development goals: Insights from scientometrics and BERTopic analysis. Journal of Economic Surveys, 39(4), 1630–1676. [Google Scholar] [CrossRef] [Scilit]
- Pervin, S., Ismail, M. N., & Md Noman, A. H. (2023). Does microfinance singlehandedly empower women? A case study of Bangladesh. SAGE Open, 13(2), 21582440221096114. [Google Scholar] [CrossRef] [Scilit]
- Pitt, M. M., & Khandker, S. R. (1998). The impact of group-based credit programs on poor households in Bangladesh: Does the gender of participants matter? Journal of Political Economy, 106(5), 958–996. [Google Scholar] [CrossRef] [Scilit]
- Rahman, M. M., Jafrullah, M., & Islam, A. N. M. T. (2008). Rural Development Scheme of Islami Bank Bangladesh Limited (IBBL): Assessment and challenges. IIUM Journal of Economics and Management, 16(2), 139–163. Available online: https://journals.iium.edu.my/enmjournal/index.php/enmj/article/view/148 (accessed on 27 July 2026).
- Roodman, D., & Morduch, J. (2014). The impact of microcredit on the poor in Bangladesh: Revisiting the evidence. The Journal of Development Studies, 50(4), 583–604. [Google Scholar] [CrossRef] [Scilit]
- Schreiner, M. (2002). Aspects of outreach: A framework for discussion of the social benefits of microfinance. Journal of International Development, 14(5), 591–603. [Google Scholar] [CrossRef] [Scilit]
- Serrano-Cinca, C., Fuertes-Callén, Y., & Cuéllar-Fernández, B. (2023). The relationship between microfinance mission drift and financial returns to stakeholders. Nonprofit and Voluntary Sector Quarterly, 52(6), 1609–1632. [Google Scholar] [CrossRef] [Scilit]
- United Nations Development Programme. (2012). Scaling up Islamic microfinance in Bangladesh through the private sector: Experience of Islami Bank Bangladesh Limited (IBBL). UNDP. Available online: https://www.undp.org/publications/scaling-islamic-microfinance-bangladesh-through-private-sector-experience-islami-bank-bangladesh-limited-ibbl (accessed on 9 August 2026).
- Xie, M. (2025). Economic policy uncertainty and credit risk in microfinance: A cross-country analysis. International Journal of Finance & Economics, 30(2), 1969–1985. [Google Scholar] [CrossRef] [Scilit]
- Zineelabidine, M., Nafssi, F., & Ayass, H. (2024). The determinants of the efficiency of microfinance institutions in Africa. Journal of Risk and Financial Management, 17(8), 318. [Google Scholar] [CrossRef] [Scilit]
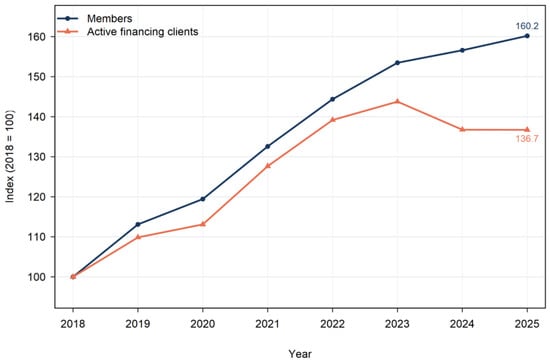
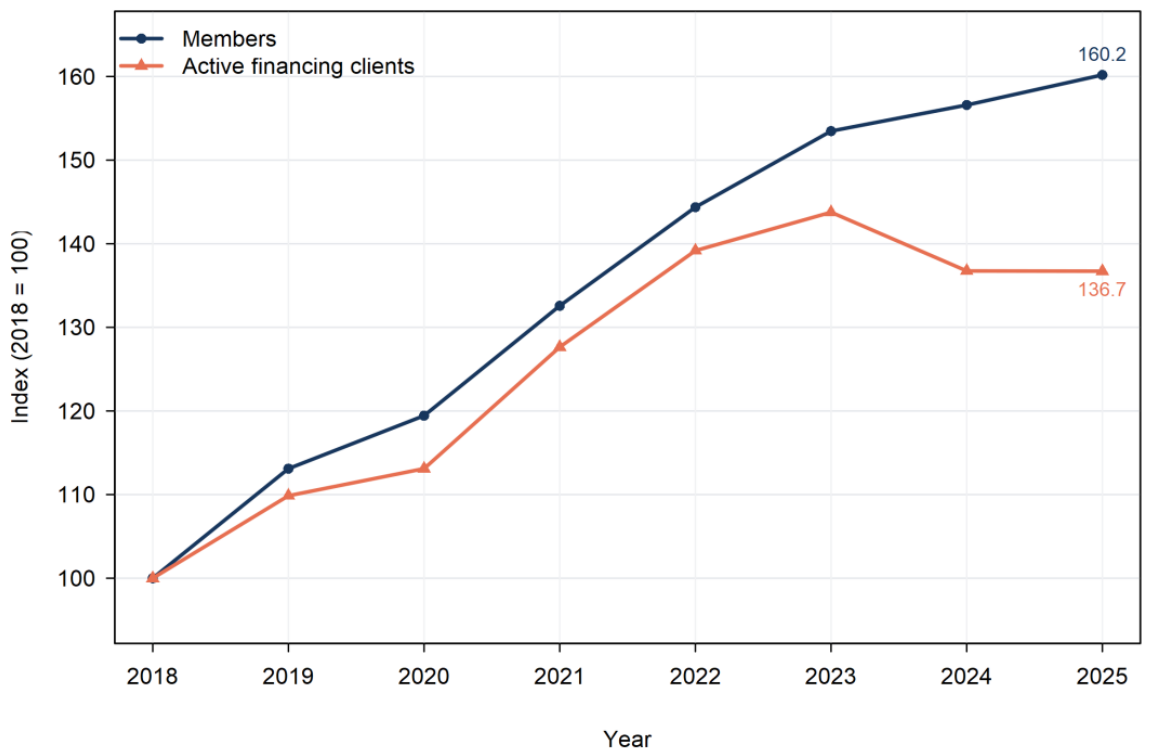
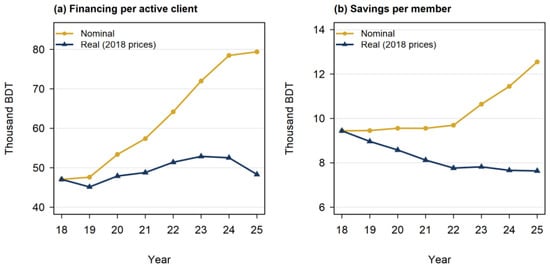
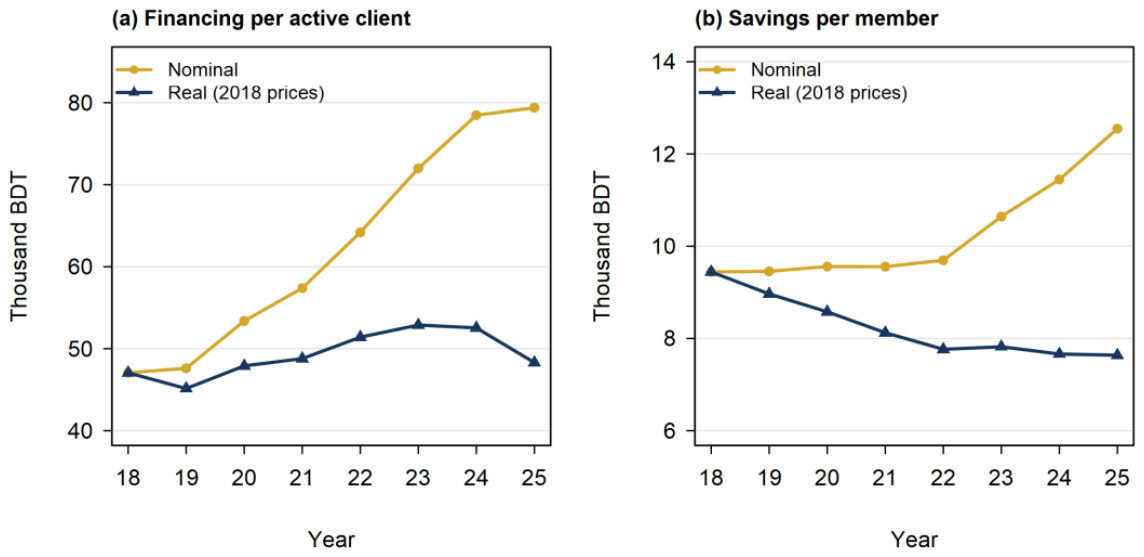
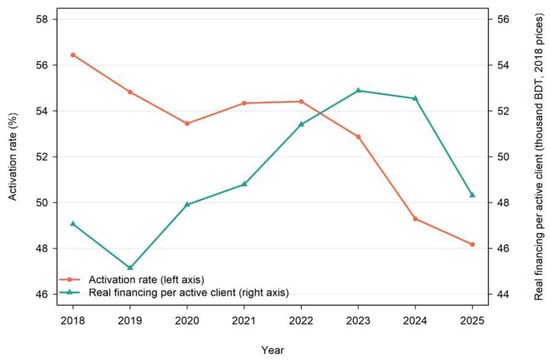
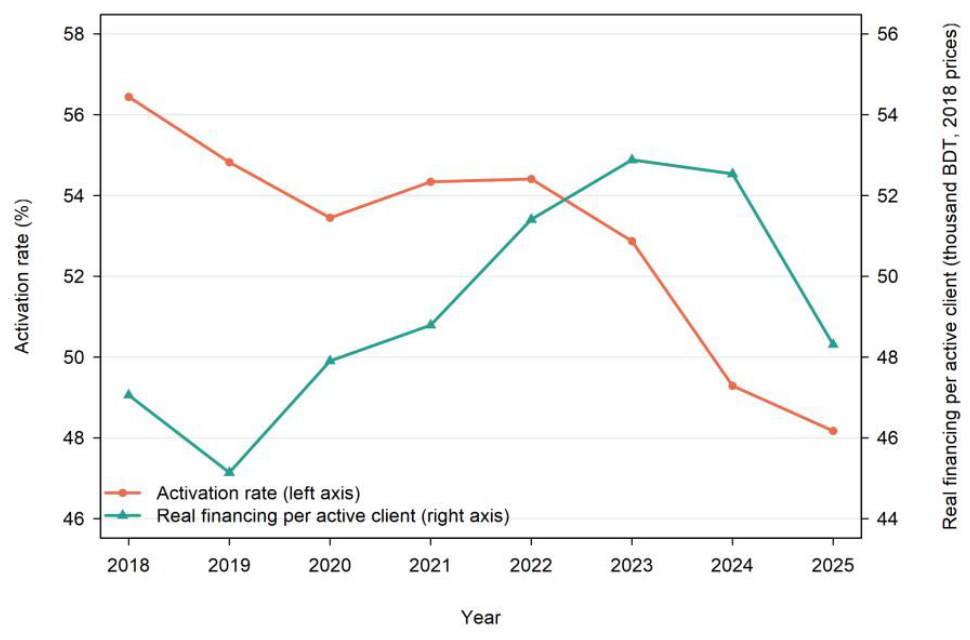
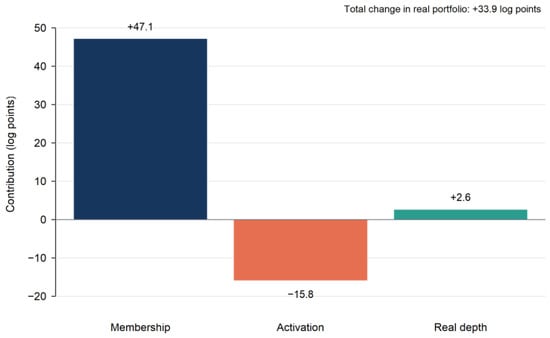
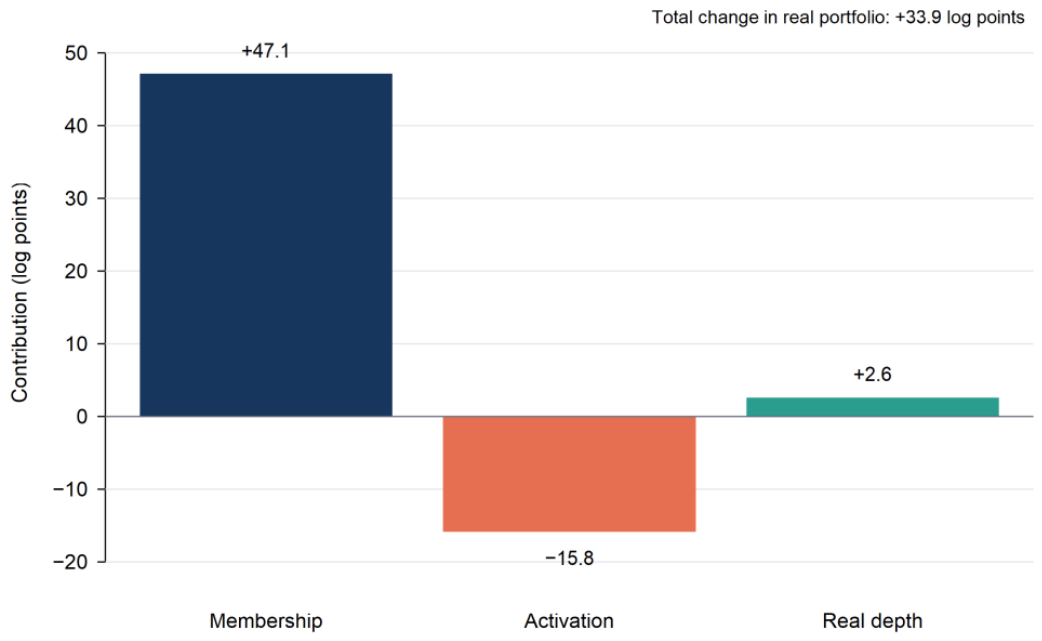
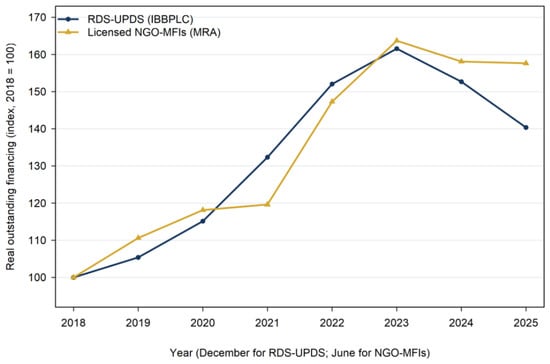

Disclaimer/Publisher’s Note: The statements, opinions and data contained in all publications are solely those of the individual author(s) and contributor(s) and not of MDPI and/or the editor(s). MDPI and/or the editor(s) disclaim responsibility for any injury to people or property resulting from any ideas, methods, instructions or products referred to in the content. |
© 2026 by the authors. Licensee MDPI, Basel, Switzerland. This article is an open access article distributed under the terms and conditions of the Creative Commons Attribution (CC BY) license.