


Abstract
Digital financial inclusion (DFI) may enhance economic participation, but its association with income depends on financial usage, institutional conditions, and cross-country heterogeneity. This study examines log GDP per capita in 37 Organisation of Islamic Cooperation (OIC) economies over 2017–2023 (259 country–years). DFI is measured by a six-indicator index using principal component analysis; a spatial–Mundlak panel model combines within–between covariates, economic-similarity weights, year fixed effects, and a country random intercept, estimated by Gaussian maximum likelihood. The within-country DFI coefficient is 0.000845 (model-based ), and the spatial-lag coefficient is (). Country-average governance exhibits a positive conditional coefficient (, ), whereas neither exploratory DFI–governance interaction is statistically significant (joint ). DFI estimates remain imprecise under alternative spatial weights, a pre-2024 index reference period, and conditional trajectory-bootstrap inference. The findings distinguish persistent institutional and income differences from annual DFI variation, without establishing a causal DFI effect or verified cross-border financial transmission. Serial dependence and incomplete measurement provenance limit the strength of statistical inference.
Keywords:
digital financial inclusion; institutional governance; GDP per capita; OIC countries; spatial panel models; Mundlak decomposition; economic development JEL Classification:
C23; O16; O33
1. Introduction
Digital financial inclusion (DFI) encompasses access to and effective use of financial services delivered through digital channels. Digital payments, mobile-money accounts, and related infrastructure may reduce transaction costs, extend financial services to underserved households and firms, and enable more efficient commercial exchange. Yet access does not automatically generate productive use: service reliability, digital skills, consumer safeguards, and institutional incentives also influence economic outcomes (Ozili, 2018). These distinctions are salient among Organisation of Islamic Cooperation (OIC) economies, which differ substantially in economic structure, financial development, and governance.
Cross-country measurement requires distinguishing the availability of financial infrastructure from the intensity of financial-service use. The IMF Financial Access Survey describes administrative access and usage indicators, whereas the World Bank Global Findex provides survey-based evidence on adults’ financial behavior (International Monetary Fund, 2025; World Bank, 2025). The Worldwide Governance Indicators characterize institutional conditions along six dimensions (World Bank, 2026d). Together, these measurement frameworks motivate treating DFI, governance, and national income as related but conceptually distinct constructs.
Cross-country research indicates that digital technology can complement financial inclusion, although the relationship varies with measurement and development conditions (Daud & Ahmad, 2023; Mohd Daud et al., 2024). OIC-focused studies similarly report positive relationships involving digitalization and Islamic financial inclusion (Ali et al., 2024; Ameziane, 2024). These concepts overlap with DFI but are not interchangeable with it. Their findings provide a foundation for examining digital financial development without establishing the domestic and network relationships investigated here.
Two analytical distinctions motivate this study. First, changes within a country need not have the same association with GDP per capita as persistent differences between countries. The Mundlak (1978) approach separates these sources of variation while retaining time-invariant characteristics. Second, economically similar countries may exhibit contemporaneous interdependence that geographical proximity alone does not represent. Spatial econometrics provides a framework for examining such relationships, although a weights matrix does not itself identify a transmission mechanism. Combining a spatial Durbin specification with a Mundlak decomposition follows an established methodological approach (Debarsy, 2012).
We investigate whether annual deviations in DFI and governance, persistent cross-country institutional differences, and network-weighted DFI are associated with GDP per capita in 37 OIC economies during 2017–2023. The model combines Mundlak’s within–between decomposition with a simultaneous spatial-lag specification and year fixed effects. Economic similarity is defined from trade openness and historical income categories, rather than geographical proximity or observed payment flows. The contribution lies in jointly examining within-country variation, persistent institutional heterogeneity, and model-implied network associations within an OIC sample; the empirical design is exploratory and does not identify causal effects.
2. Literature Review
2.1. Theoretical Background
Institutional economics and network-based reasoning provide the study’s theoretical foundation. Institutions shape the incentives and constraints governing economic activity (North, 1990). Applied to digital finance, this perspective suggests that technological access may have limited economic value when weak institutional conditions undermine confidence, service quality, or productive financial participation. Ozili (2018) discusses both the potential benefits of digital finance and the practical risks that can prevent their realization. Governance is therefore considered alongside DFI rather than treating technological adoption as a self-sufficient development mechanism.
Network-based reasoning recognizes that financial developments in one economy may be associated with outcomes elsewhere. Spatial econometrics represents these relationships through a specified weights matrix (Anselin, 1988; Elhorst, 2014). In this study, similarity in trade openness and income classification defines the network. These characteristics describe comparable economic environments, not observed bilateral financial transactions. The framework consequently motivates examination of domestic institutions, network-weighted DFI, and persistent cross-country differences without presupposing beneficial cross-border financial transmission.
2.2. Digital Financial Inclusion and Macroeconomic Outcomes
The international literature emphasizes the conditions under which digital technology complements financial inclusion. Using dynamic panel analysis for 84 countries, Daud and Ahmad (2023) report evidence of complementarity between digital technology and financial inclusion. Mohd Daud et al. (2024), examining 84 countries over 2011–2017, further connect this relationship to financial-service usage and the financial inclusion gender gap. Their overlapping coverage limits their interpretation as wholly independent replications. Together, they underscore the importance of distinguishing financial access, actual usage, and broader technological development when defining DFI.
Evidence of nonlinearity also cautions against assuming that a single relationship applies uniformly across economies. Liu et al. (2021), using Chinese provincial data for 2011–2019, associate the economic benefits of DFI with internet development and identify entrepreneurship and consumption as relevant channels. Basnayake et al. (2024) examine 30 Asia-Pacific countries using observations for 2014, 2017, and 2021 and report positive relationships alongside threshold effects. These findings suggest that infrastructure and initial inclusion conditions can shape observed outcomes. They do not establish the existence or location of a threshold in the present OIC sample.
Distributional outcomes require separate consideration. Using data for 140 countries and Global Findex survey waves, Demir et al. (2022) identify financial inclusion as a channel linking fintech to lower income inequality. This evidence concerns the distribution of income rather than GDP per capita. It supports examining the broader economic relevance of financial participation, while highlighting that an aggregate income regression cannot determine which population groups benefit.
2.3. Measurement of Digital Financial Inclusion and Governance
A multidimensional DFI measure can capture complementary aspects of digital connectivity, financial access, and actual transaction use. However, indicator choice, denominator definitions, standardization, and weighting influence the resulting index and its interpretation. The IMF Financial Access Survey distinguishes administrative measures of access from usage, whereas Global Findex reports household financial behavior at survey-wave intervals rather than as a harmonized annual country panel (International Monetary Fund, 2025; World Bank, 2025). Accordingly, a composite index should be interpreted as a relative summary of its specified indicators, not as a direct measure of financial welfare or productive credit allocation. The institutional-governance index captures another dimension of the economic environment; its construction warrants separate scrutiny.
2.4. OIC Evidence and Institutional Conditions
OIC-focused research establishes a relevant empirical foundation. Ali et al. (2024) apply system generalized method of moments (GMM) estimation to 57 OIC countries over 2000–2020 and report a positive relationship between digitalization and economic performance. Ameziane (2024) examines Islamic financial inclusion in 25 OIC countries over 2015–2020 using fixed-effects quantile regression and finds positive relationships across GDP-per-capita segments. The present study builds on this literature by jointly examining within–between variation and an economic-similarity network, while retaining the distinction between DFI, broader digitalization, and Islamic financial inclusion.
Institutional conditions feature prominently in related regional evidence. Using system GMM for Southern African Development Community countries over 2010–2023, Meniago (2025) reports that institutional quality moderates the DFI–growth relationship. This finding motivates considering governance in the OIC analysis. This study therefore adds explicitly labelled exploratory interactions between within-country DFI and (a) within-country governance and (b) country-average governance. The interaction estimates are presented as sensitivity tests, not a preregistered hypothesis or evidence of causal effect modification.
2.5. Spatial Dependence and Contrasting Empirical Evidence
Spatial evidence does not imply uniformly positive neighboring-region associations. Xi and Wang (2023) use Chinese provincial data and a spatial Durbin specification to identify positive neighboring-region effects on a multidimensional measure of economic growth quality. By contrast, Fan et al. (2023), examining 281 Chinese cities over 2011–2020, find a positive relationship between fintech and inclusive growth but no significant neighboring-region association. Song et al. (2026), studying 275 Chinese cities over 2011–2021, report positive local associations with common prosperity and negative neighboring-region associations.
These contrasting findings justify examining the direction and strength of network relationships rather than assuming beneficial technological diffusion. Their applicability to an international OIC panel nevertheless depends on differences in institutional settings, network definitions, and outcome measurement. Chinese subnational evidence motivates alternative empirical expectations; it does not directly establish cross-country DFI transmission or GDP-per-capita relationships within the OIC.
2.6. Panel Heterogeneity and the Spatial–Mundlak Approach
Separating within-country variation from between-country differences clarifies whether changing financial conditions accompany income variation or whether the association primarily reflects persistent cross-country differences. Mundlak (1978) provides the foundational approach, which Debarsy (2012) extends to spatial Durbin panel models. Country-average regressors represent between-country variation over their averaging periods, not automatically historical initial conditions or long-run equilibrium effects.
Spatial models are not the only approaches to cross-sectional dependence. Pesaran (2006) develops common correlated effects methods for panels with unobserved common factors. This work provides an alternative methodological perspective, although that estimator is not applied here. Within spatial models, regression coefficients must also be distinguished from direct and indirect impacts because feedback through the spatially lagged outcome contributes to the latter (LeSage, 2014).
2.7. Research Gap and Contribution
The literature leaves two related questions insufficiently resolved in the OIC context. First, does within-country variation in a multidimensional DFI index accompany variation in GDP per capita once persistent national characteristics and common year shocks are considered? Second, do DFI conditions among economically similar economies and institutional governance add explanatory information to those domestic associations? The present study examines these questions using a restricted spatial–Mundlak panel framework and complementary governance-interaction tests.
By differentiating within- from between-country covariates and reporting model-implied spatial impacts, the analysis highlights why positive cross-country digital-finance associations need not translate into comparably precise within-country estimates. Its contribution is a structured comparison of conditional associations under explicit measurement and network assumptions, rather than a claim of estimator novelty or causal identification.
3. Research Framework and Hypotheses
Institutional economics and network-based reasoning motivate the following expectations. The terminology refers to associations with log GDP per capita, not to identified causal effects.
- H1: Within-country deviations in digital financial inclusion are positively associated with log GDP per capita, conditional on the included regressors.
- H2: Network-weighted within-country DFI deviations in economically similar countries are positively associated with domestic log GDP per capita.
- H3: Within-country deviations in institutional governance are positively associated with log GDP per capita, conditional on the included regressors.
- H4: Higher country-average governance and membership in the historical modal high-income or upper-middle-income group are positively associated with log GDP per capita.
H4 summarizes two separate, descriptive between-country expectations; it is not a joint test or a ranking of explanatory importance. All hypothesis assessments remain conditional on the estimation and inference limitations described below.
4. Data and Methodology
4.1. Sample and Data Sources
The study covers a balanced panel of 37 OIC economies observed annually from 2017 to 2023, yielding 259 country–year observations. The DFI reference sample spans 40 economies over 2015–2024, whereas the income regression is restricted to 37 countries and seven years. Afghanistan, Libya, and Sudan are not included in the estimation sample. The selection is not based on a documented probability-sampling procedure or missing regression values; consequently, inference pertains to the countries listed in Table 1, rather than to the full OIC membership.
Table 1.
OIC country sample ().
GDP per capita is expressed at purchasing-power parity in constant 2021 international dollars and is consistent with the World Bank’s World Development Indicators (WDI) series NY. GDP. PCAP. PP. KD (World Bank, 2026a). Trade openness follows WDI indicator NE.TRD.GNFS.ZS (World Bank, 2026c). The income-group classification follows historical World Bank group definitions (World Bank, 2026b). DFI combines digital-connectivity and financial-access/usage indicators, while institutional governance is represented by a six-dimension composite aligned conceptually with the Worldwide Governance Indicators. The precise historical release vintages and original transformations of some component series are not fully documented; the corresponding measurement uncertainty is considered in Section 6.4.
4.2. Variable Definitions and Index Construction
Digital financial inclusion is represented by a composite of six standardized access, connectivity, and usage indicators. Principal component analysis (PCA) determines the relative indicator weights, followed by min–max scaling to a 0–100 index. The following equations specify the index construction and the reference sample used to determine its scaling parameters. Table 2 summarizes the variables and their analytical roles. The dependent variable, ln_GDPpc, is the natural logarithm of PPP-adjusted GDP per capita in constant 2021 international dollars, consistent with the WDI income measure NY.GDP.PCAP.PP.KD (World Bank, 2026a). It is an income level, not a GDP-per-capita growth rate.
Table 2.
Variable definitions and measurements.
- Digital financial inclusion.
The DFI index consists of mobile-money agents per 100,000, automated teller machines (ATMs) per 100,000, internet penetration, mobile-money accounts per 1000, mobile transactions per 1000, and mobile-transaction values relative to GDP. Internet penetration, ATMs, and agent density proxy enabling infrastructure and access; account ownership, transaction frequency, and transaction value capture aspects of usage. These metrics capture different dimensions of digital financial development rather than a single homogeneous service. Detailed release identifiers and the preprocessing rules underlying some annual component values are not fully documented, which constrains external validation of the constructed measure.
The PCA reference sample contains 400 country–year observations spanning 40 economies over 2015–2024. For each indicator j, the pooled mean and population standard deviation define the standardized observation :
PCA of the resulting standardized indicator matrix retains principal components with eigenvalues above one (Kaiser criterion; Kaiser, 1960). The first two eigenvalues are 3.1585 and 1.3602, accounting jointly for 75.123% of total standardized-indicator variance. Let denote the loading of indicator j on retained component k and its eigenvalue. Nonnegative indicator weights are constructed by combining squared normalized loadings with the components’ relative explained variance:
The weights aggregate the indicators; they are not country-level component scores. The final calculation uses weights rounded to four decimal places Table 3, whose reported sum is 0.9999 rather than exactly one. The underlying unrounded PCA weights sum to unity.
Table 3.
Digital financial inclusion: PCA-derived indicator weights used in the final index.
The weighted sum of standardized indicators yields a raw DFI score. Min–max rescaling over the 2015–2024 reference sample then produces an index between 0 and 100 (OECD et al., 2008):
The composite’s sampling adequacy is supported by a Kaiser–Meyer–Olkin statistic of 0.7308 and Bartlett’s sphericity test (). These values support common-factor extraction within the selected indicators, but do not alone establish that the index measures productive financial inclusion or economic welfare. Because the PCA reference period extends to 2024 while the regression ends in 2023, the primary DFI index has a look-ahead scaling feature: its normalization parameters use later observations and may alter earlier country–year scores.
Definitions of financial-service access and usage are informed by the distinctions employed in the IMF Financial Access Survey and the World Bank Global Findex (International Monetary Fund, 2025; World Bank, 2025). These databases provide measurement benchmarks; the composite is defined by the six indicators and formulas above, and its provider-specific provenance is not assumed to be identical to either database for every series.
- Institutional governance.
The institutional-governance score (Gov) summarizes the dimensions Voice and Accountability, Political Stability, Government Effectiveness, Regulatory Quality, Rule of Law, and Control of Corruption, corresponding conceptually to the Worldwide Governance Indicators (World Bank, 2026d). Higher values represent stronger institutional quality within the adopted composite. In the estimation panel, the score ranges from to . Because the original release vintage, dimension-level standardization and aggregation weights are not fully documented, it is treated as a study-specific composite rather than as an officially standardized WGI aggregate.
- Historical modal income classification.
The time-invariant income indicator (Income_Level) equals one for countries whose most frequent World Bank income category during 2015–2023 was high or upper-middle income, and zero for those predominantly classified as lower-middle or low income. Eleven countries fall into the former category and 26 into the latter. This measure reflects persistent economic stratification rather than a contemporaneous income-growth shock. Because the World Bank’s country income categories use GNI per capita (World Bank, 2026b), its relationship with log GDP per capita is partly definitional and should not be interpreted causally.
- Trade openness.
Trade openness is exports plus imports of goods and services, expressed as a percentage of GDP (World Bank WDI code NE.TRD.GNFS.ZS; World Bank, 2026c):
Trade openness is retained in percentage units and enters the network construction through country-specific averages. During 2017–2023, trade data are available for 243 of the 259 country–year observations; 16 observations in 2022–2023 are unavailable. For the primary network, each country is characterized by the mean of its available annual trade observations during 2015–2023 (at least seven observed years per country); missing years are not imputed. Inflation is not included among the regressors, so heterogeneous price shocks beyond the common year effects remain a possible source of omitted-variable bias.
4.3. Panel Structure and Within–Between Decomposition
The panel combines cross-country differences with within-country variation over seven years. For each time-varying covariate , the country mean and deviation are
where denotes the averaging period. DFI and governance means use the seven estimation years (2017–2023). In the primary network, trade-openness means use available observations from 2015–2023; alternative networks use available 2017–2023 values or the common complete-data period 2017–2021. Country means capture persistent between-country differences, whereas deviations capture annual variation relative to each country’s mean. Neither interpretation by itself identifies a long-run equilibrium or an exogenous within-country shock.
The within–between decomposition is applied to DFI and governance in the regression, while average trade openness contributes to the spatial weights. Network-weighted covariates combine observations across countries at a common year. The distinction between the multi-year PCA reference sample and the seven-year regression period is preserved when interpreting variation in the DFI index.
4.4. Spatial Specification, Weights, and Estimation
The regression combines Mundlak-style within–between regressors with a restricted spatial Durbin specification (Debarsy, 2012; Mundlak, 1978). Spatially lagged explanatory variables are limited to the within-country DFI component. The resulting network represents economic similarity, not observed bilateral trade, financial flows, or geographical proximity.
- Economic-similarity weights.
Each country has two unstandardized coordinates: country-average trade openness, , and fixed income classification, . Trade openness is expressed in percentage units and income classification is binary. Pairwise Euclidean distances are
Preliminary inverse-distance weights are defined as
The constant prevents division by zero for identical coordinates, and the zero diagonal excludes self-links. Row-standardization gives
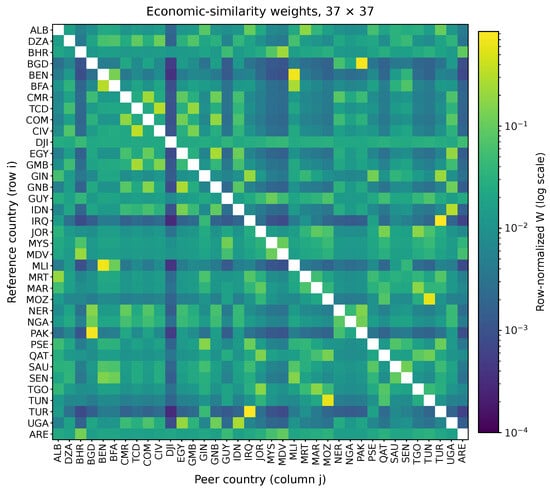
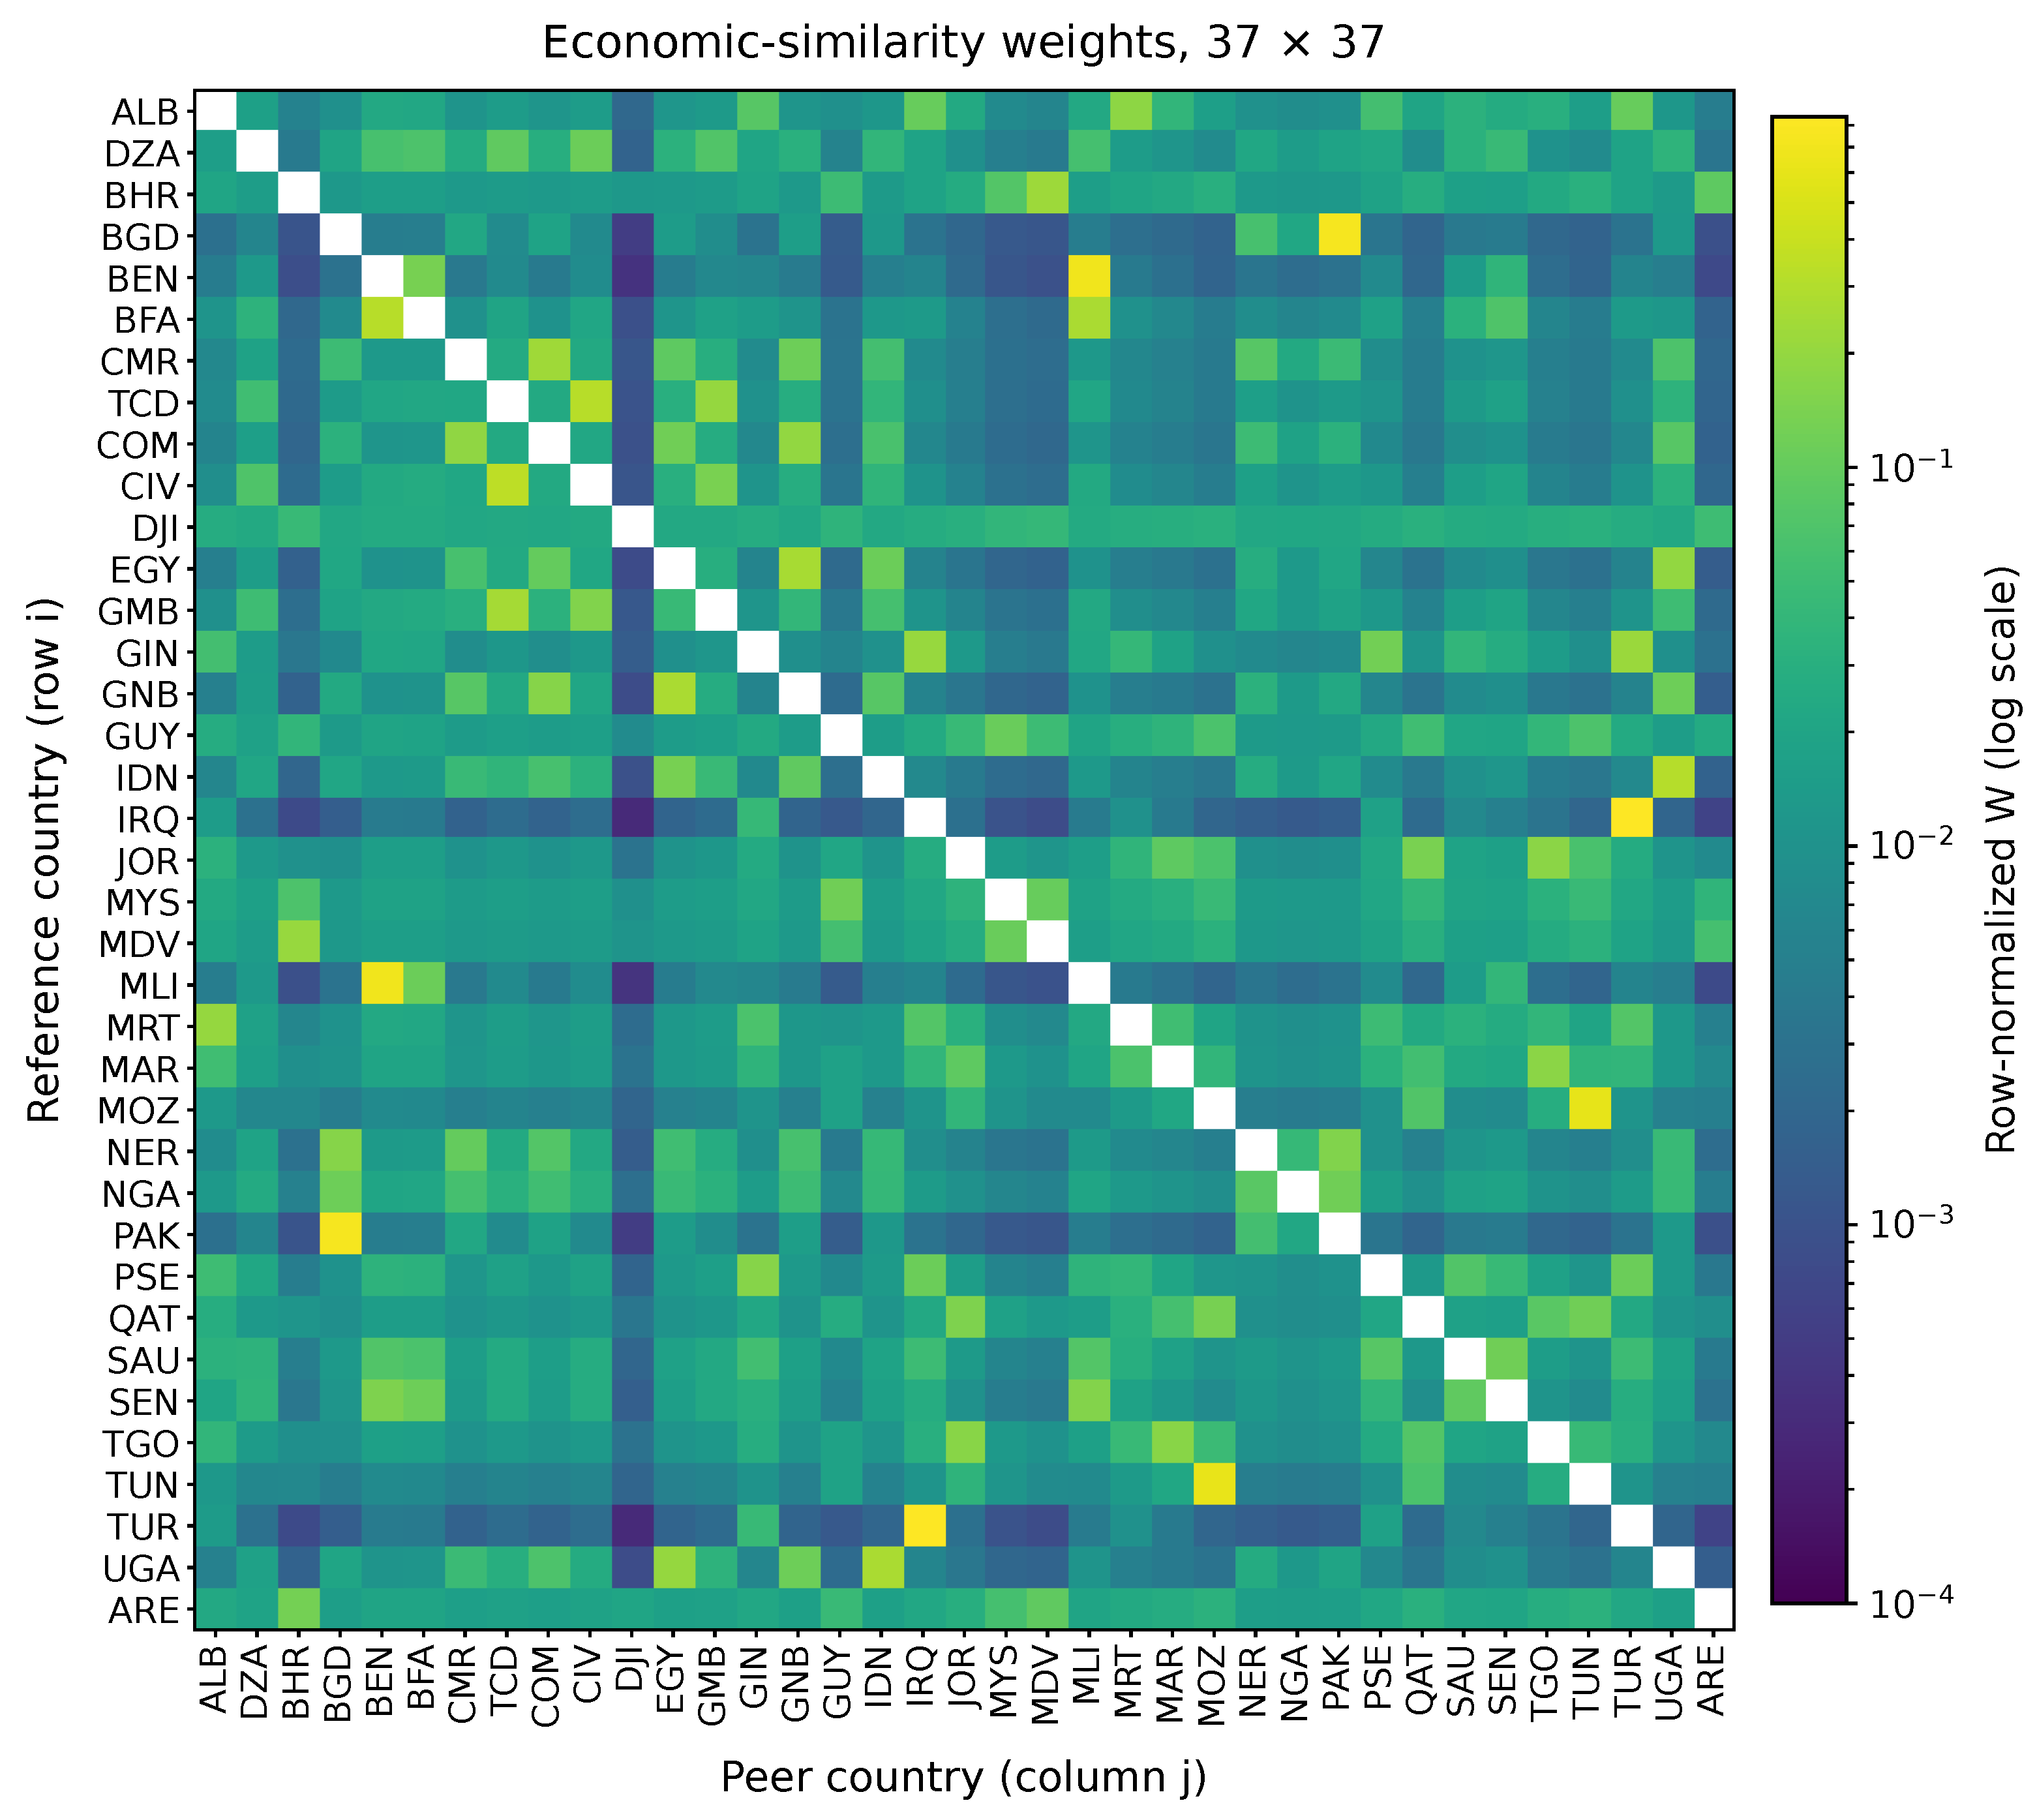
The primary matrix remains fixed over 2017–2023 and is row-standardized; its largest bilateral entry is 0.842, reflecting a relatively concentrated similarity link. Because trade openness is measured in percentage points and income group is binary, the unstandardized distance metric places substantially more numerical weight on variation in trade openness. Row standardization does not eliminate this dependence on coordinate scaling. Sensitivity analyses therefore consider alternative averaging windows and standardized coordinates.The resulting row-standardized economic-similarity weights matrix (W) is illustrated in Figure 1.
Figure 1.
Primary economic-similarity matrix W (37 countries; 2015–2023 available-year trade averages and modal income group). Rows are reference countries and columns are peers. The logarithmic color scale makes small positive links visible; diagonal cells are zero. These are constructed weights, not observed cross-border payments. Axis labels use three-letter ISO country codes; full country names appear in Table 1.
- Regression specification.
With , the spatial–Mundlak specification with year fixed effects is
Here, is the intercept; is the coefficient on the network-weighted contemporaneous outcome; and denote within-country DFI and governance coefficients; and denote the corresponding between-country coefficients; is the coefficient on network-weighted within-country DFI; and is the income-group coefficient. The disturbance is modeled as the sum of a country random intercept, , and a country-year idiosyncratic innovation, . The simple primary likelihood assumes and independent across countries and years, conditional on the included Mundlak terms. This assumption is examined critically in the results.
The country averages accommodate correlation between time-invariant heterogeneity and the included regressors in a Mundlak-style specification while retaining the income-group indicator. Indicators for 2018–2023 capture common annual disturbances relative to the reference year 2017. The contemporaneous spatially lagged outcome is jointly determined, requiring a spatial likelihood rather than ordinary least squares. Spatial lags of governance and country-average covariates are excluded, so the specification is a restricted spatial Durbin form. The income-group variable also enters the distance metric; its coefficient and the economic-similarity network cannot be interpreted as externally assigned treatments.
- Estimation and inferential scope.
Estimation uses a Gaussian spatial autoregressive (SAR) correlated-random-intercept panel likelihood with Mundlak regressors and year indicators. The parameters are estimated jointly with the country-intercept and idiosyncratic disturbance variances; reported primary-model standard errors are based on the observed likelihood Hessian. The random-intercept structure accommodates a stable component of within-country error dependence but does not represent general dynamic or serially correlated disturbances. These assumptions are evaluated using residual diagnostics and sensitivity models (Anselin, 1988; Elhorst, 2014).
A supplementary country-trajectory residual bootstrap uses 399 replications (seed 20261009). Each replication resamples seven-year country residual paths, regenerates the dependent variable through the simultaneous spatial multiplier, and re-estimates the likelihood while holding regressors and W fixed. This procedure preserves within-trajectory patterns, but its interval interpretation assumes independent, exchangeable structural-error paths across countries and the specified spatial covariance structure. It does not account for measurement error or uncertainty in the network coordinates.
Numerical optimization, model diagnostics, and bootstrap calculations are performed in Python using NumPy, SciPy and statsmodels. Regression coefficients and spatial marginal associations differ because changes may propagate through the simultaneous multiplier ; model-implied direct, indirect and total associations are therefore calculated separately (LeSage, 2014).
4.5. Model Selection and Diagnostic Considerations
Six annual indicators for 2018–2023 control for common temporal disturbances, including economy-wide shocks during the pandemic period. The primary model uses the 2015–2023 country-average trade network. Three alternative spatial-weight definitions test sensitivity to trade averaging and coordinate standardization, while a 2015–2023 PCA reference period tests sensitivity to the 2024 observations used in index scaling. A conditional likelihood-ratio comparison is used to assess the joint inclusion of year effects.
Residual analysis indicates substantial within-country persistence beyond the random intercept: mean-demeaned adjacent-year residual correlation is approximately 0.726. A spatial AR(1) error sensitivity reaches the imposed persistence boundary (), preventing reliable interpretation of that alternative model’s asymptotic inference. Consequently, primary-model z tests and likelihood-ratio tests should be read as conditional on restrictive covariance assumptions. Two exploratory DFI–governance interactions are assessed in Section 5.5; neither specification establishes causal effect modification.
The specification does not estimate dynamic adjustment, nonlinear thresholds, or country-specific inflation effects. These omissions are relevant because log income is highly persistent and the observed DFI–income relationship may reflect delayed responses or unobserved macroeconomic conditions.
5. Empirical Results
5.1. Descriptive Statistics
Table 4 documents pronounced dispersion in economic and digital-financial conditions across the 37 economies. Log PPP GDP per capita ranges from 7.284 to 11.668, while DFI spans 0.745–87.331 (mean 22.703; standard deviation 13.257). Governance scores range from to (mean ). The substantial variation in DFI reflects differences in financial infrastructure and use as combined by the PCA measure; it cannot be interpreted directly as a uniform difference in individual financial welfare. The governance score is interpreted relative to its adopted composite scale rather than as an absolute institutional benchmark.
Table 4.
Summary statistics of the variables used in the empirical analysis across 37 economies.
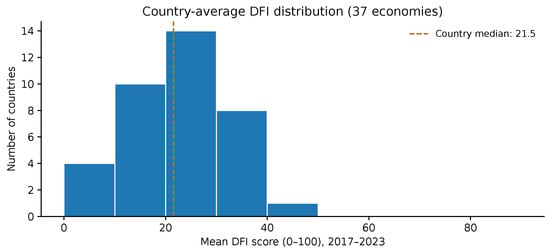
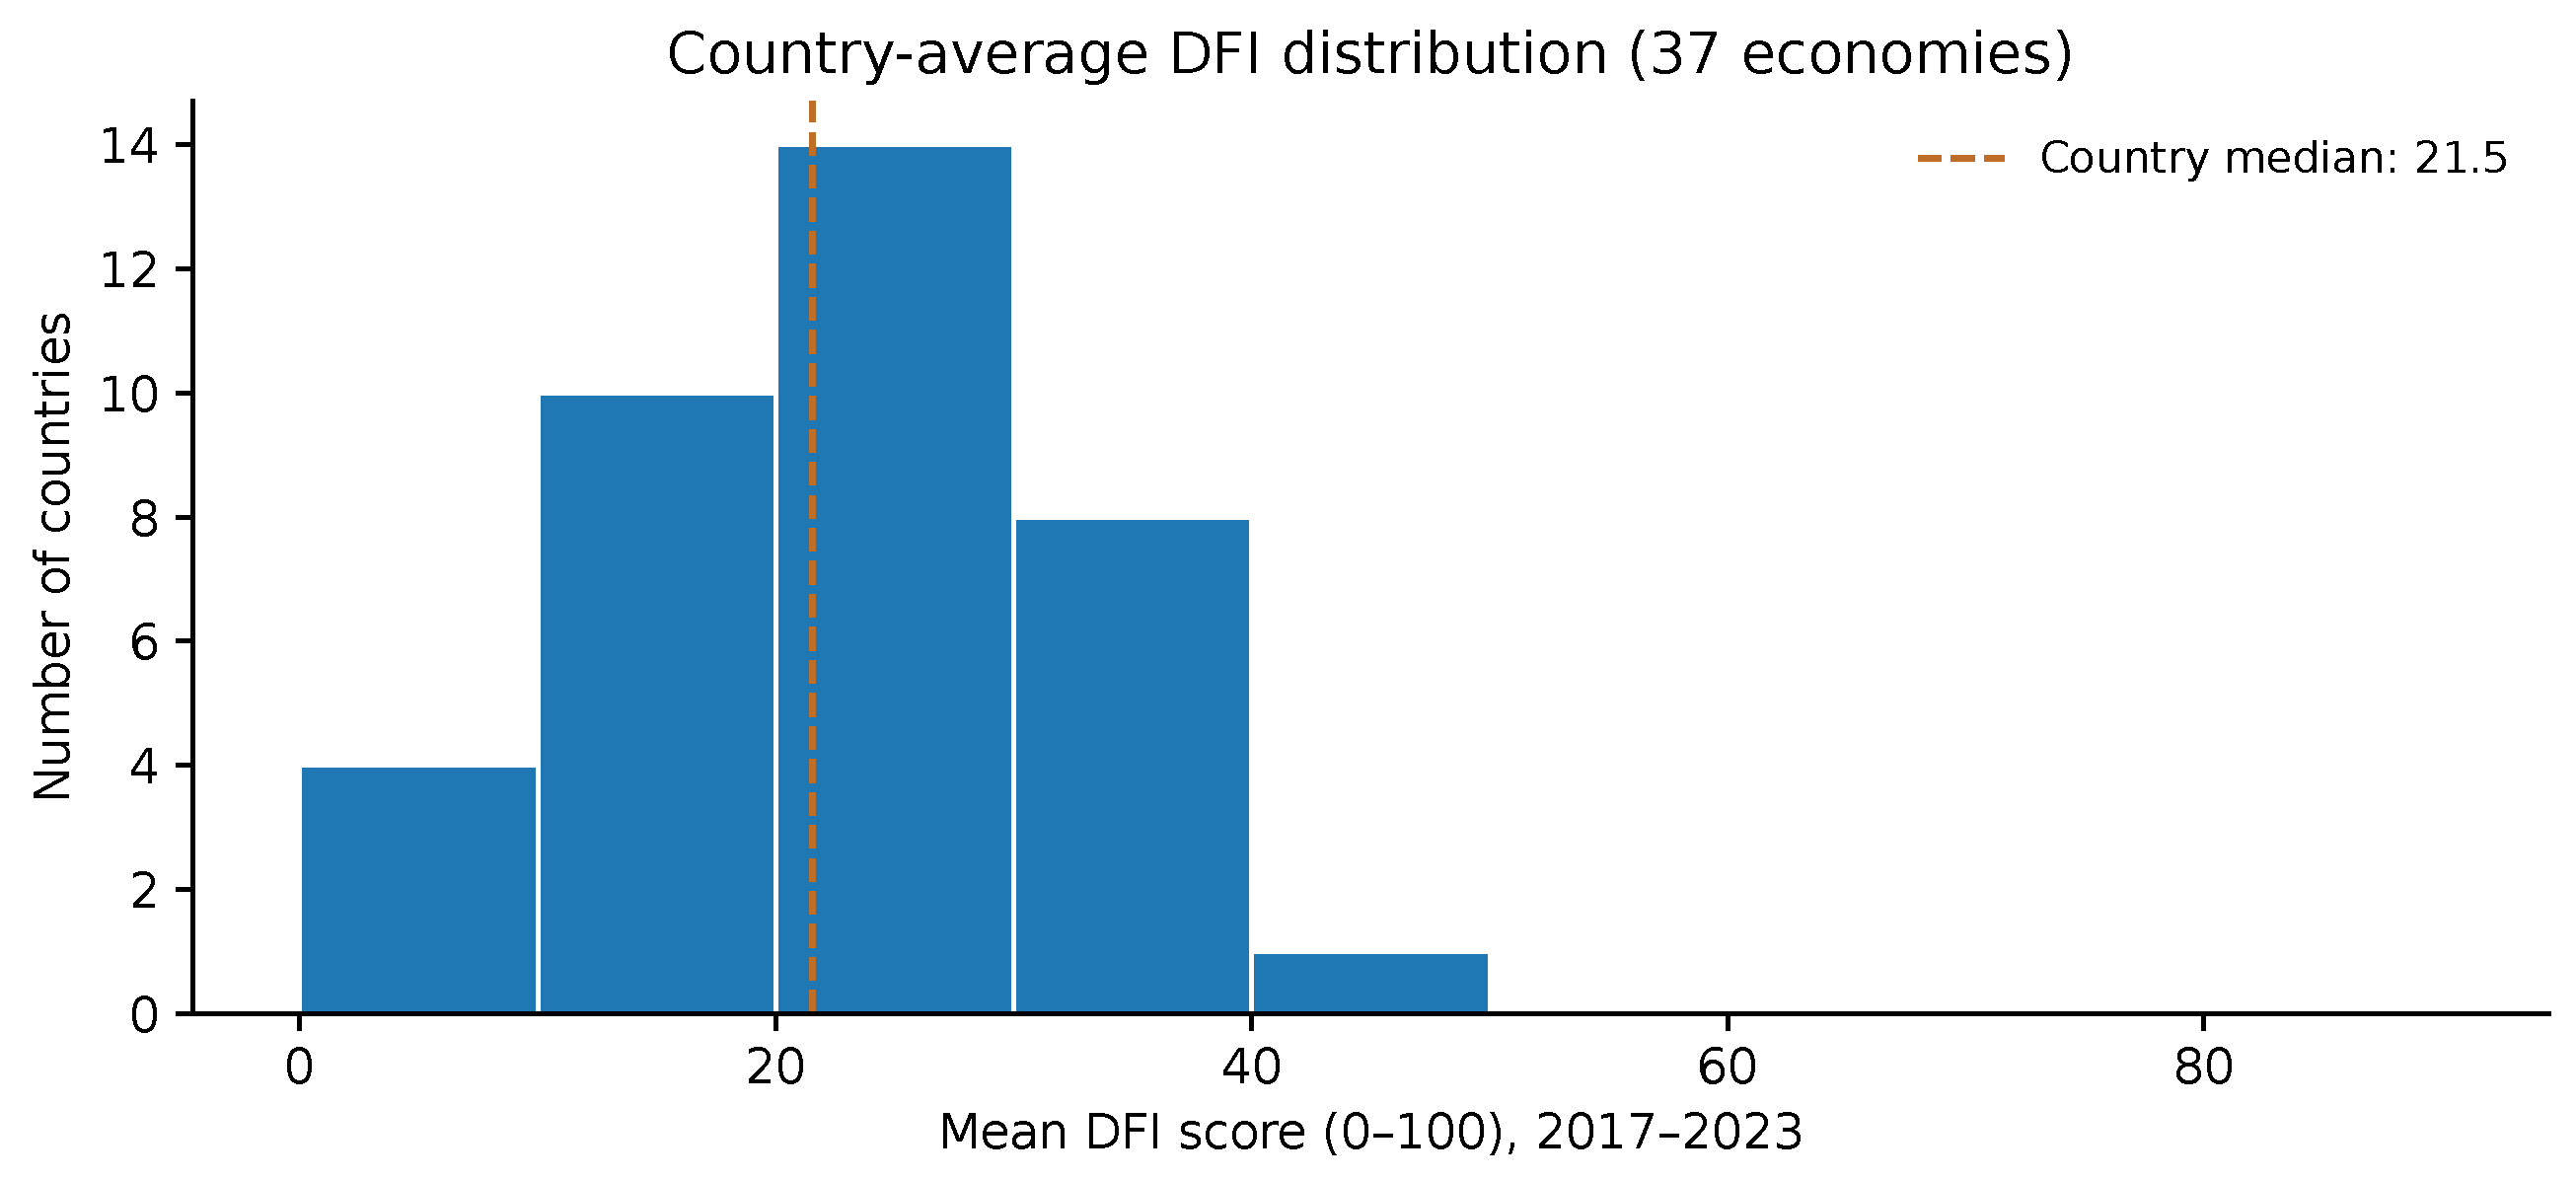
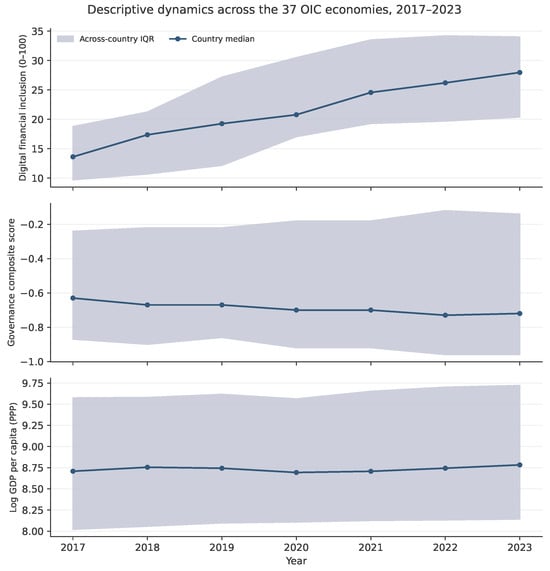
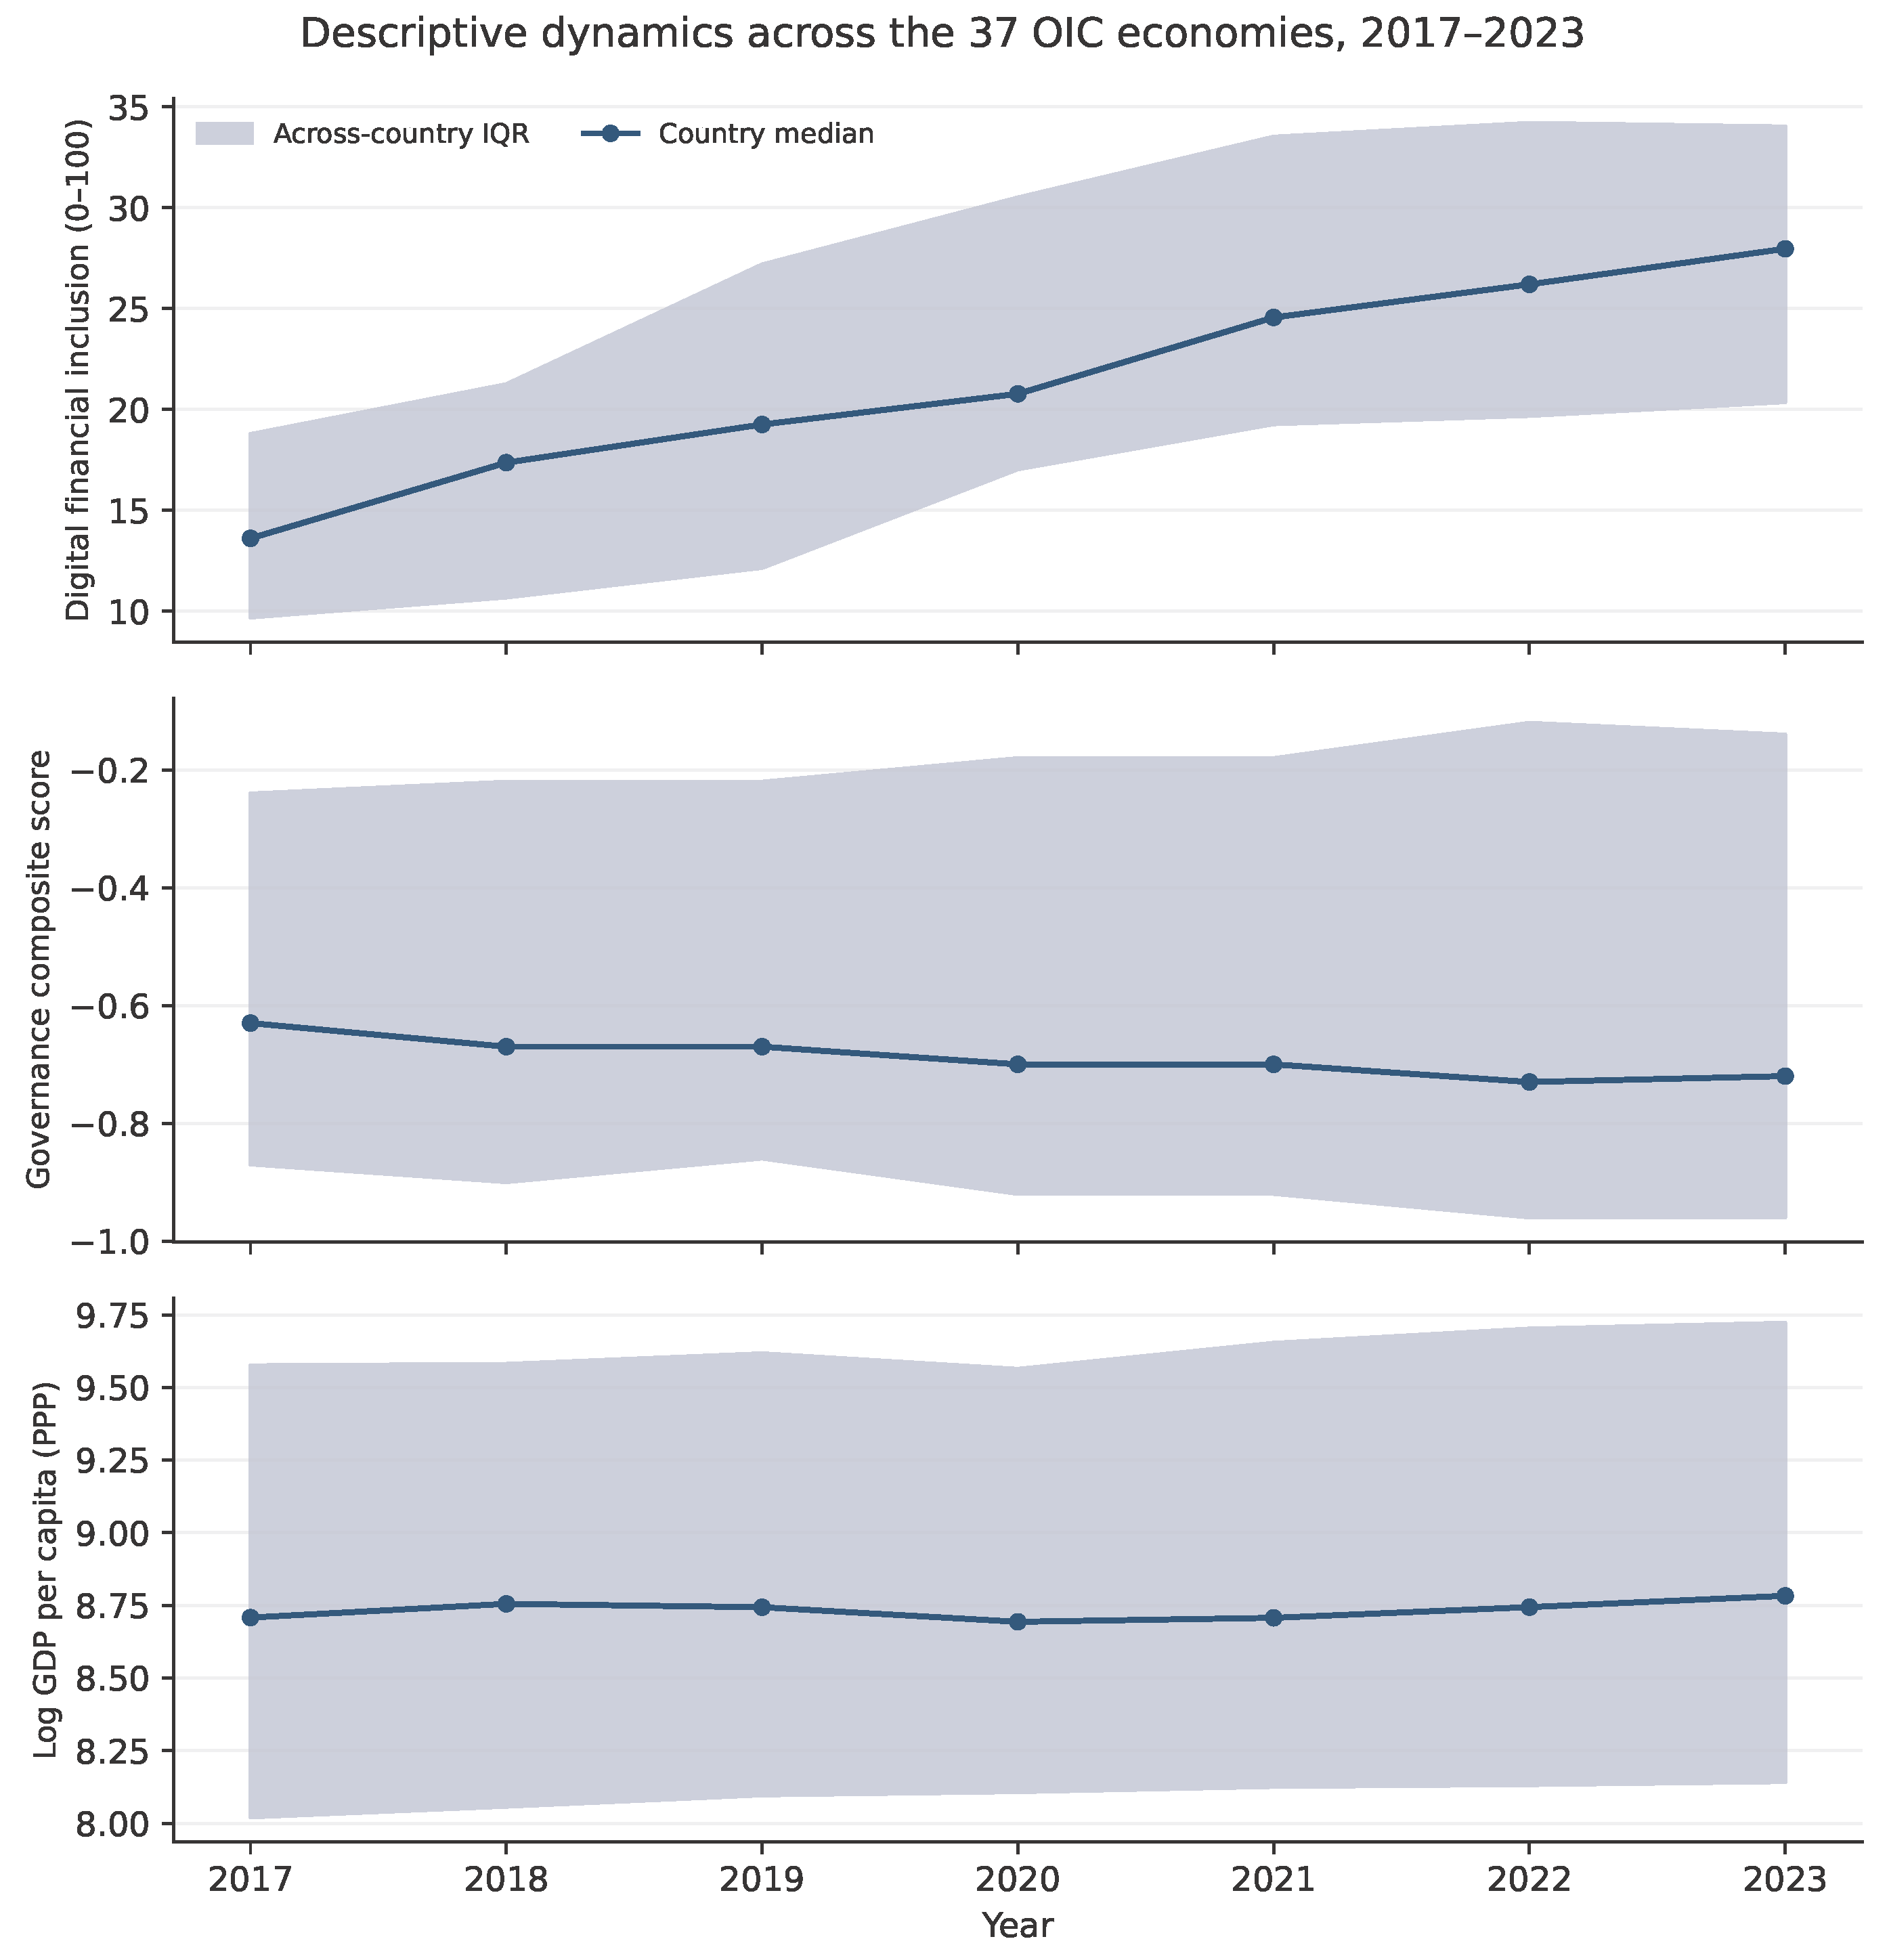
The distribution of country-average DFI (Figure 2) is concentrated in the lower half of the index’s possible range, with a median country mean of 21.5. Figure 3 indicates an upward movement in median DFI across 2017–2023, while the median log-income series changes comparatively little and the governance median remains negative on the composite scale. This descriptive divergence is consistent with the possibility that improvements in digital access and usage need not translate immediately into measured income gains; it is not a test of that mechanism.
Figure 2.
Distribution of the 2017–2023 country-mean DFI Index for 37 OIC economies; one mean per country (not 259 independent countries). The dashed line marks the median country-mean value.
Figure 3.
Country medians and cross-country interquartile ranges by year, 2017–2023 (37 countries per year). GDP per capita is log PPP-adjusted. These descriptive trajectories do not identify trends net of time-varying confounding.
5.2. Correlation Analysis
Bivariate correlations show that log GDP per capita is significantly associated with historical income group (), governance (), and DFI (). The strongest association is with an income-group indicator partly defined from national income, so this correlation is unsurprising and does not reveal a structural mechanism. The smaller DFI correlation is compatible with substantial heterogeneity in access, usage and economic conditions. These raw relationships do not separate within-country changes from persistent differences or common time effects, motivating the multivariate panel specifications. Although no screening correlation exceeds 0.80 in absolute magnitude, this does not establish the absence of collinearity in the full Mundlak–spatial design.
5.3. Spatial Correlated-Random-Effects Maximum Likelihood with Year Effects
Table 5 reports the primary Gaussian spatial autoregressive correlated-random-intercept model. The simultaneous outcome lag, within–between DFI and governance components, historical modal income group, and six annual indicators are included in the likelihood. The weights matrix links economies with similar trade openness and income categories; the reported coefficients therefore describe associations conditional on an economic-similarity structure, not realized bilateral financial flows.
Table 5.
Spatial random-intercept panel maximum-likelihood estimates with year fixed effects.
The estimated spatial outcome-lag coefficient is negative (), although its model-based p-value of 0.0721 exceeds the conventional 5% threshold. For DFI, the within-country coefficient is (), the network-weighted within-country coefficient is (), and the country-average coefficient is (). Accordingly, the primary specification does not provide precise evidence of a positive contemporaneous DFI–income association at either the within-country or between-country level. Within-country governance is also imprecisely estimated (, ), whereas country-average governance is positively associated with log income (, ). The positive modal income-group coefficient (, ) mainly reflects persistent income stratification rather than an independently identified development mechanism. Together, these estimates distinguish stable differences across economies from shorter-run deviations within them.
The country-trajectory bootstrap reinforces the limited precision of the DFI and spatial-lag estimates: the 95% percentile intervals are for within-country DFI, for network-weighted DFI, and for Table 6. The interval for country-average governance remains positive, whereas that for within-country governance includes zero. Because the bootstrap holds the regressors and network fixed and assumes exchangeability of country error trajectories, its intervals are a conditional precision check rather than a resolution of the remaining covariance or endogeneity concerns.
Table 6.
Country-trajectory bootstrap sensitivity of primary spatial estimates.
Spatial-multiplier calculations Table 7 yield a direct within-country DFI association of 0.0009, an indirect association of , and a total association of ; none is conventionally significant. The corresponding direct and indirect governance associations are 0.1014 and , respectively. The distinction matters economically: a negative or weakly estimated network term does not imply that a domestic increase in digital finance reduces neighboring incomes, because the weights encode similarity rather than observed transactional linkages. These figures are model-implied conditional associations, not evidence of causal financial transmission.
Table 7.
Model-implied direct, indirect, and total associations (spatial random-intercept ML).
Network-construction sensitivity Table 8 shows that the within-country DFI coefficient remains positive but imprecise, ranging from approximately 0.0008 to 0.0014 across the four spatial matrices. The spatial-lag estimate varies from approximately to and is not significant at 5% in any specification. Some alternative networks change the inference for the network-weighted DFI term, indicating that conclusions about indirect associations depend on the definition of economic proximity. A likelihood-ratio test supports including year indicators in the primary model (model-based ), consistent with the importance of common temporal shifts during 2017–2023. Residual correlation beyond the random intercept remains substantial, so the results are interpreted primarily through their patterns and sensitivity rather than through sharp significance classifications.
Table 8.
Sensitivity of spatial random-intercept estimates to network construction.
The pre-2024 sensitivity analysis in Table 9 re-estimates the index using only 2015–2023 observations. The within-country DFI coefficient remains small and statistically imprecise ( versus in the primary specification), so the main qualitative DFI inference is unchanged under this alternative scaling. Restricting the PCA reference period to 2015–2023 changes index scores by 1.73 points on average and by up to 12.67 points in the regression sample. Nevertheless, the within-country DFI estimate remains imprecise (, model-based ), compared with () under the 2015–2024 index. The spatial-lag estimate changes only modestly. The similarity of these regression results suggests that the principal DFI inference is not driven solely by the inclusion of 2024 in the PCA reference sample, although individual country-year DFI rankings and magnitudes remain measurement-sensitive.
Table 9.
DFI PCA reference-window sensitivity: Full spatial re-estimation.
5.4. Supplementary Non-Spatial Checks with Year Effects
Two non-spatial models provide a comparison with the main spatial specification: a Mundlak regression with year indicators and a two-way country/year fixed-effects regression. Both use country-clustered standard errors. The country/year model absorbs time-invariant income classification, whereas the Mundlak model retains it. Because neither benchmark includes a contemporaneous network-weighted outcome, the coefficients are not directly interchangeable with the spatial estimates;as shown in Table 10.
Table 10.
Non-spatial benchmarks with year fixed effects (country-clustered inference).
The within-country DFI coefficient is 0.00067 in both non-spatial regressions, with for the Mundlak model and for the two-way fixed-effects model. Within-country governance also remains imprecise. Thus the absence of a precisely estimated short-run DFI–income association is not unique to inclusion of the economic-similarity network; the benchmarks do not, however, address the spatial model’s dependence assumptions.
5.5. Exploratory DFI–Governance Moderation
To evaluate the proposed institutional-moderation mechanism, we estimated a nested extension of Equation (9). It adds and , where is the grand country-year mean. The first interaction tests concurrent within-country co-movement; the second tests whether the DFI within-country slope differs across countries with different average governance. The interaction columns are mean-centered (absorbed by the intercept), and the same W, year indicators, and Gaussian country random-intercept likelihood are retained. Their coefficients describe conditional slopes; full spatial marginal effects also incorporate .
Neither interaction is statistically significant in the joint spatial extension: the within–within coefficient is 0.00831 (), and the interaction between within-country DFI and country-average governance is 0.00233 () as shown in Table 11. The two-degree-of-freedom likelihood-ratio test likewise yields . The fitted within-country DFI slope remains small (, ). These findings provide no clear evidence that the DFI association systematically varies with the governance measures in this panel; the design does not establish that institutional complementarities are absent.
Table 11.
DFI–governance interactions: Exploratory spatial random-intercept ML extension.
5.6. Economic Interpretation
In the primary specification, a 10-point within-country increase in the 0–100 DFI index corresponds to approximately 0.00845 log points of GDP per capita (about 0.85%) in the regression’s linear component, holding other covariates constant and before spatial feedback. This magnitude is illustrative rather than a precisely estimated response: the associated uncertainty interval includes both positive and negative values. For country-average governance, a 0.1-unit higher value of the study-specific composite corresponds to log points, equivalent to approximately higher GDP per capita in the linear predictor, holding other covariates fixed and before spatial feedback. This is a conditional comparison between economies rather than an estimated effect of institutional reform or a complete spatial total effect. The large income-group coefficient should not be interpreted as an intervention effect because the categories themselves are based on national income.
5.7. Hypothesis Assessment
Table 12 relates the study hypotheses to the estimates in the spatial random-intercept specification. H1–H3 do not receive affirmative statistical support at the conventional 5% level. H4 describes positive conditional relationships for persistent governance and income-group differences, but neither association establishes a causal channel.
Table 12.
Hypothesis assessment under spatial random-intercept likelihood.
6. Discussion
The principal empirical finding is a distinction between persistent cross-country differences and annual changes in measured digital financial inclusion. Although the sample shows a marked increase in the median DFI index over 2017–2023 (Figure 3), median log GDP per capita varies comparatively little over the same years. After accounting for year effects, a country random intercept, governance, and the economic-similarity network, the within-country DFI slope remains small and imprecise. A 10-point DFI change corresponds to approximately 0.85% of GDP per capita in the fitted model’s linear component, but the bootstrap interval encompasses both positive and negative associations. The data therefore do not establish a contemporaneous income return of this magnitude.
The finding also illustrates why country-level digital-finance adoption and national income can move differently. New payment accounts, transaction channels, and connectivity may initially change the composition of transactions rather than measured output. Payment digitization can displace cash or existing bank transfers, and transaction volumes may expand without a proportional change in productive investment. Effects on firm productivity could depend on complementary changes in merchant acceptance, business formalization, access to working capital, or trust in digital transactions. These possibilities are consistent with the access-versus-usage distinction emphasized in digital finance research (Daud & Ahmad, 2023; Ozili, 2018), but none of these channels is observed directly in the aggregate panel.
The results differ from the positive relationships reported in two relevant OIC studies, without providing a direct empirical contradiction. Ali et al. (2024) study broad digitalization and economic performance in 57 OIC countries during 2000–2020 using system GMM, whereas Ameziane (2024) examine an Islamic financial-inclusion index and economic growth across GDP-per-capita quantiles in 25 OIC countries during 2015–2020. Broad digitalization, Islamic financial inclusion, and a PCA index focused on digital financial access and use do not measure identical phenomena. Their sample compositions, time horizons, dependent-variable specifications, and estimators also differ from the present spatial–Mundlak model. Consequently, coefficients cannot be compared numerically as if they estimated the same elasticity. The evidence is more plausibly viewed as highlighting the importance of construct definition and panel heterogeneity when studying digital-finance–development relationships.
The spatial estimates provide a similarly qualified result. The estimated simultaneous income-lag parameter is negative in the primary economic-similarity model but not conventionally significant, and its magnitude depends on the spatial-weight definition. The model-implied indirect DFI association is also imprecise. These results do not demonstrate adverse cross-border financial transmission: the network links economies with similar trade openness and income classification rather than tracing capital flows, remittances, or digital-payment connections. Even a precisely estimated spatial parameter would require an independently justified network to support an interpretation about actual channels of international transmission.
6.1. Theoretical Implications
For institutional economics, the positive association between average governance and income levels is consistent with the broad proposition that institutional environments accompany differences in economic performance (North, 1990). The contrast with the imprecise within-country governance coefficient, however, suggests that enduring differences in institutions and economic structure should not be conflated with short-term governance changes. Unobserved historical and structural characteristics may contribute to the between-country association. Furthermore, the income-classification coefficient is partly mechanical because the categories depend on GNI per capita. Neither coefficient identifies the productivity effects of institutional reform.
The governance-moderation estimates add a second distinction. Institutional complementarities are plausible because financial innovation may be more productive when contract enforcement, consumer protection, and the quality of supervision facilitate adoption. Meniago (2025) documents a moderating institutional relationship in a different regional and econometric setting. In the present OIC panel, however, interactions between within-country DFI and both annual governance deviations and country-average governance are imprecisely estimated. Thus the analysis supports treating governance as a theoretically relevant context but does not establish whether it amplifies or attenuates the DFI–income association.
6.2. Business and Managerial Implications
For banks, fintech firms, mobile-money operators, and payment-service providers, the heterogeneity in DFI levels suggests that a uniform regional expansion strategy may be inefficient. Markets with similar national income can differ in internet connectivity, account penetration, agent networks, and transaction intensity. Managers can therefore evaluate digital-finance opportunities along separate dimensions of reach (infrastructure and account availability) and effective use (regular transactions and merchant adoption). The aggregate results do not rank countries by expected profitability, but they highlight why relying on national income or a single connectivity indicator could obscure operating conditions.
Commercial strategies may also depend on complementary organizational investments. Merchant acceptance networks, secure payment infrastructure, customer support, transparent pricing, and digital literacy can influence whether greater account access becomes sustained financial activity. For small and medium-sized enterprises, the potentially relevant mechanisms include lower collection costs, improved transaction records, and access to transaction-based finance; these mechanisms are proposed by theory and industry practice rather than identified by the present regression. Managers should assess them using firm-level outcomes, service-quality metrics, and market-specific evidence instead of interpreting the reported DFI coefficient as a forecast of returns.
6.3. Policy Implications for OIC Countries
The cross-country distribution of DFI suggests that policies aimed at financial access and policies aimed at productive usage should be evaluated separately. Improvements in connectivity, account availability and agent density can expand the feasible reach of digital services, while adoption, interoperability, consumer protection and transaction security may determine the value realized by households and enterprises. These are plausible institutional complements, consistent with the broader digital-finance literature (International Monetary Fund, 2025; Ozili, 2018), but the present estimates do not quantify the national-income payoff from any particular intervention.
For OIC policymakers, comparable measures of digital access and service use could improve diagnosis of country-specific constraints. Indicators that distinguish new registrations from active transactions would be especially relevant when monitoring whether financial innovations facilitate enterprise activity rather than merely substituting among payment channels. A more informative policy evaluation would link reforms to observed household or enterprise outcomes and use longer panels or credible quasi-experimental designs where feasible. The spatial exercise further cautions against inferring regional policy transmission from similarity in economic indicators without independent information on actual cross-border links.
6.4. Limitations and Future Research
Several limitations qualify interpretation. First, mean-demeaned adjacent-year residual correlation remains approximately 0.726 after allowing for a country random intercept, and the spatial AR(1) alternative reaches its imposed persistence boundary (). Model-based Wald and likelihood-ratio inference is therefore sensitive to disturbance assumptions. Second, the economic-similarity matrix uses historical income categories and trade openness, not measured bilateral financial transactions; its construction can be related to the economic outcome and its estimated impacts depend on the chosen distance metric. Third, the restricted 37-country sample and the short 2017–2023 panel constrain external validity and the identification of delayed economic adjustment.
Measurement limitations are also material. Source-series release identifiers and preprocessing rules for some DFI components, along with the historical aggregation of the governance composite, are not fully documented. The primary DFI index is normalized over 2015–2024, extending beyond the income regression window, although a pre-2024 PCA refit produces similar within-country DFI estimates. The modal income indicator is partly defined by an income outcome, and inflation and other country-specific macroeconomic changes are not separately modeled. Future research should reconstruct fully documented indicator histories, examine alternative network measures based on observed financial links, and integrate business- or household-level usage and productivity outcomes with designs better able to distinguish dynamic adjustment, common shocks, and endogenous adoption.
7. Conclusions
This study examines DFI, institutional governance, and log PPP GDP per capita across 37 OIC economies during 2017–2023 using a spatial–Mundlak panel design with year effects. The analysis distinguishes annual within-country variation from persistent between-country conditions and incorporates economic-similarity links derived from trade openness and historical income groups. In the Gaussian spatial random-intercept model, neither within-country nor network-weighted DFI shows a precisely estimated conditional association with log income. Country-average governance is positively associated with income across countries, while exploratory DFI–governance interactions are inconclusive.
These findings underline the distinction between the spread of digital financial services and their potential contribution to economic development. They neither demonstrate an absence of economic benefits from DFI nor identify a causal income effect. Interpretation remains conditioned by persistent serial dependence, the constructed network definition, sample coverage, and limitations in component-indicator provenance. More complete longitudinal and microeconomic evidence is needed to establish when improvements in digital financial access and usage translate into productivity, enterprise development, and sustained economic gains across OIC economies. Longer panels and appropriately specified dynamic spatial models are also needed to model persistent serial dependence and assess the reliability of the statistical inference.
Author Contributions
Conceptualization, N.A.H.; methodology, N.A.H.; software, N.A.H. and A.L.S.A.-K.; validation, N.A.H. and A.L.S.A.-K.; formal analysis, N.A.H.; investigation, N.A.H.; data curation, N.A.H.; writing—original draft preparation, N.A.H.; writing—review and editing, N.A.H., A.L.S.A.-K., M.M.M.A. and E.U.; visualization, N.A.H. and A.L.S.A.-K.; supervision, E.U.; All authors have read and agreed to the published version of the manuscript.
Funding
This research received no external funding.
Institutional Review Board Statement
Not applicable. This study did not involve human participants, animals, or identifiable personal data; therefore, institutional ethical approval was not required.
Informed Consent Statement
Not applicable. This study analyzed aggregate country-level secondary indicators and did not involve direct interaction with human participants; therefore, informed consent was not required.
Data Availability Statement
The cleaned and imputed panel dataset, derived diagnostic outputs, spatial-weights matrices, and computational Python code supporting the conclusions of this article are openly available in a public GitHub repository at: https://github.com/Ellbanker/OIC-Economies-Spatial-DFI (accessed on 13 October 2026). Raw variables were compiled from internationally available financial inclusion and financial access data sources, including the IMF Financial Access Survey and World Bank data sources. Access to these underlying raw indicator series remains subject to the respective data providers’ terms.
Acknowledgments
The authors acknowledge Istanbul Aydın University for institutional support. During the preparation of this manuscript, ChatGPT (GPT-6 Sol) was used exclusively to improve the English language, grammar, and readability of the manuscript. All authors carefully reviewed and approved the final text and take full responsibility for its content. Python 3.13.5 and the latest available versions of its associated libraries, including pandas, NumPy, scikit-learn, and Matplotlib, were utilized for data processing, statistical analysis, diagnostic evaluation, and figure generation.
Conflicts of Interest
The author Ahmed Lateef Salih Al-Karawi was employed by the company Defne Telekomünikasyon A.Ş. The author Mohamed Mustafa Mohamed Abofanas was employed by the company Alamanah Company for Import Mother and Baby Needs. The remaining authors declare that the research was conducted in the absence of any commercial or financial relationships that could be construed as a potential conflict of interest.
References
- Ali, M., Anwar, U., Khattak, M. A., & Islam, M. U. (2024). Digitalization and economies of OIC countries. Bulletin of Monetary Economics and Banking, 27, 155–170. [Google Scholar] [CrossRef] [Scilit]
- Ameziane, M. (2024). Islamic financial inclusion and economic growth in OIC countries: Panel quantile regression analysis. Journal of Islamic Monetary Economics and Finance, 10(3), 609–630. [Google Scholar] [CrossRef] [Scilit]
- Anselin, L. (1988). Spatial econometrics: Methods and models. Kluwer Academic Publishers. [Google Scholar] [CrossRef] [Scilit]
- Basnayake, D., Naranpanawa, A., Selvanathan, S., & Bandara, J. S. (2024). Financial inclusion through digitalization and economic growth in Asia-Pacific countries. International Review of Financial Analysis, 96, 103596. [Google Scholar] [CrossRef] [Scilit]
- Cameron, A. C., & Miller, D. L. (2015). A practitioner’s guide to cluster-robust inference. Journal of Human Resources, 50(2), 317–372. [Google Scholar] [CrossRef] [Scilit]
- Daud, S. N. M., & Ahmad, A. H. (2023). Financial inclusion, economic growth and the role of digital technology. Finance Research Letters, 53, 103602. [Google Scholar] [CrossRef] [Scilit]
- Debarsy, N. (2012). The Mundlak approach in the spatial Durbin panel data model. Spatial Economic Analysis, 7(1), 109–131. [Google Scholar] [CrossRef] [Scilit]
- Demir, A., Pesqué-Cela, V., Altunbas, Y., & Murinde, V. (2022). Fintech, financial inclusion and income inequality: A quantile regression approach. The European Journal of Finance, 28(1), 86–107. [Google Scholar] [CrossRef] [Scilit]
- Elhorst, J. P. (2014). Spatial econometrics: From cross-sectional data to spatial panels. Springer. [Google Scholar] [CrossRef] [Scilit]
- Fan, S., Wei, Y., Niu, X., Balezentis, T., & Agnusdei, L. (2023). Can FinTech development pave the way for a transition towards inclusive growth: Evidence from an emerging economy. Structural Change and Economic Dynamics, 67, 439–458. [Google Scholar] [CrossRef] [Scilit]
- International Monetary Fund. (2025). Financial access survey (FAS): Data and metadata [Definitions of financial-service access and usage indicators]. IMF Data. Available online: https://data.imf.org/Datasets/FAS (accessed on 9 October 2026).
- Kaiser, H. F. (1960). The application of electronic computers to factor analysis. Educational and Psychological Measurement, 20(1), 141–151. [Google Scholar] [CrossRef] [Scilit]
- LeSage, J. P. (2014). What regional scientists need to know about spatial econometrics. Review of Regional Studies, 44(1), 13–32. [Google Scholar] [CrossRef] [Scilit]
- Liu, Y., Luan, L., Wu, W., Zhang, Z., & Hsu, Y. (2021). Can digital financial inclusion promote China’s economic growth? International Review of Financial Analysis, 78, 101889. [Google Scholar] [CrossRef] [Scilit]
- Meniago, C. (2025). Digital financial inclusion and economic growth: The moderating role of institutions in SADC countries. International Journal of Financial Studies, 13(1), 4. [Google Scholar] [CrossRef] [Scilit]
- Mohd Daud, S. N., Ahmad, A. H., & Trinugroho, I. (2024). Financial inclusion, digital technology, and economic growth: Further evidence. Research in International Business and Finance, 70, 102361. [Google Scholar] [CrossRef] [Scilit]
- Mundlak, Y. (1978). On the pooling of time series and cross section data. Econometrica, 46(1), 69–85. [Google Scholar] [CrossRef] [Scilit]
- North, D. C. (1990). Institutions, institutional change and economic performance. Cambridge University Press. [Google Scholar]
- OECD, European Union & European Commission, Joint Research Centre. (2008). Handbook on constructing composite indicators: Methodology and user guide. OECD Publishing. [Google Scholar] [CrossRef] [Scilit]
- Ozili, P. K. (2018). Impact of digital finance on financial inclusion and stability. Borsa Istanbul Review, 18(4), 329–340. [Google Scholar] [CrossRef] [Scilit]
- Pesaran, M. H. (2006). Estimation and inference in large heterogeneous panels with a multifactor error structure. Econometrica, 74(4), 967–1012. [Google Scholar] [CrossRef] [Scilit]
- Song, Q., Yan, M., Tang, S., Han, Z., & Fang, F. (2026). Digital financial inclusion and common prosperity in China: Spatial spillovers and regional divergence. Finance Research Letters, 94, 109624. [Google Scholar] [CrossRef] [Scilit]
- World Bank. (2025). The global findex database 2025: Methodology and indicator documentation. World Bank Global Findex. Available online: https://www.worldbank.org/en/publication/globalfindex/methodology (accessed on 15 July 2026).
- World Bank. (2026a). GDP per capita, PPP (constant 2021 international dollars): World Development Indicators, series NY.GDP.PCAP.PP.KD [Indicator definition and WDI series metadata]. World Bank Open Data. Available online: https://data.worldbank.org/indicator/NY.GDP.PCAP.PP.KD (accessed on 11 August 2026).
- World Bank. (2026b). Historical country income classifications [Historical income-group classification methodology]. World Bank Data Help Desk. Available online: https://datahelpdesk.worldbank.org/knowledgebase/articles/906519-world-bank-country-and-lending-groups (accessed on 3 August 2026).
- World Bank. (2026c). Trade (% of GDP): World development indicators, series NE.TRD.GNFS.ZS [WDI trade indicator definition]. World Bank Open Data. Available online: https://data.worldbank.org/indicator/NE.TRD.GNFS.ZS (accessed on 11 August 2026).
- World Bank. (2026d). Worldwide governance indicators: Documentation and six dimensions [Definitions of the six governance dimensions]. World Bank. Available online: https://www.worldbank.org/en/publication/worldwide-governance-indicators/documentation (accessed on 13 August 2026).
- Xi, W., & Wang, Y. (2023). Digital financial inclusion and quality of economic growth. Heliyon, 9(9), e19731. [Google Scholar] [CrossRef] [Scilit] [PubMed]

Disclaimer/Publisher’s Note: The statements, opinions and data contained in all publications are solely those of the individual author(s) and contributor(s) and not of MDPI and/or the editor(s). MDPI and/or the editor(s) disclaim responsibility for any injury to people or property resulting from any ideas, methods, instructions or products referred to in the content. |
© 2026 by the authors. Licensee MDPI, Basel, Switzerland. This article is an open access article distributed under the terms and conditions of the Creative Commons Attribution (CC BY) license.