


Abstract
An anthropomorphic patient-derived 3D-printed breast phantom (4.8 cm compressed thickness, 12.2% volumetric breast density) was evaluated for image-quality assessment in contrast-enhanced mammography (CEM). It comprises four 1.2 cm plates printed via fused filament fabrication (PLA/ABS). Five replicates of one of the plates (target) containing a glandular-tissue surrogate and four cavities for iodinated disks with same iodine area density per plate (0.2–0.5–0.75–1.0–1.5 mg/cm2) were fabricated. As a reference, a homogeneous PET-G phantom was printed. CEM images (low-energy (LE), high-energy (HE), and DES) were acquired in three different systems. Iodine signal linearity (mean pixel value, signal difference, signal-difference-to-noise ratio (SdNR)) and background cancellation (residual signals, texture cancellation coefficient (TCC), parameter β from noise power spectrum (1D-NPS)) were estimated. Evaluation across the three systems demonstrated the phantom provides appropriate measurements of iodine signal linearity (R2 > 0.986, based on mean values across the four inserts) and background cancellation (TCC:0.04–0.11). Fitting 1D-NPS = αf−β within 0.25–1.0 mm−1 yielded β values ≈ 3.1–4.0, compatible with the literature, for patient LE and HE images, whereas DES reduced β to ≈1.1. In the homogeneous phantom, β remained invariant between LE and DES images (β ≈ 0.6). The local glandular ratio at each position of the iodinated disks enabled evaluating the impact of background on iodine signal.
1. Introduction
Contrast-enhanced mammography (CEM) has emerged as a dual-energy breast imaging modality that combines the spatial resolution of full-field digital mammography with functional maps of tumor-induced neovasculature through iodinated contrast uptake [1,2]. This dual capability markedly enhances lesion conspicuity and diagnostic sensitivity, particularly within radiographically dense breasts, where structural overlap frequently masks underlying malignancies in conventional screening [1,2]. CEM relies on acquiring a low-energy (LE) projection below the iodine K-edge at 33.2 keV by applying 20 to 30 kVp, followed immediately by a high-energy (HE) projection using 45 to 49 kVp. Subsequent vendor-specific dual-energy subtraction (DES) algorithms combine these images to suppress anatomical background signals and highlight regions of iodine accumulation [3,4,5,6,7,8,9,10,11].
As clinical adoption of CEM expands globally, rigorous image quality evaluation and quantitative benchmarks of DES algorithms across different commercial manufacturers have become essential. Prior evaluations demonstrate that commercial systems vary substantially in iodine signal response, parenchyma texture subtraction performance [3,4,6,7,8], and average glandular dose (MGD) [5,6,7,8]. However, most existing technical comparisons rely on phantoms composed of uniform tissue-equivalent slabs, such as the CIRS phantom (Model 022, Sun Nuclear, Melbourne, FL, USA) with inserts doped with iodine [4,6,7,8,9] or polymethyl methacrylate (PMMA) uniform plates [7,10,11] to determine the MGD. While useful for basic calibration, homogeneous media completely lack anatomical structures, leading to a severe underestimation of the effects of structural noise and its degrading impact on detail visibility [11,12,13] Currently, there exist structured-background phantoms—such as the CIRS Model 020 BR3D [3,4], featuring swirled glandular and adipose patterns, and the L1 phantom, with PMMA spheres emersed in water [14]. However, it should be noted that these structured-background phantoms were not originally designed or optimized to evaluate the performance of contrast-enhanced mammography (CEM).
To bridge this methodological gap, digital anthropomorphic breast phantoms derived from dedicated breast computed tomography (bCT) datasets have been introduced, providing realistic three-dimensional distributions of glandular, adipose, and skin tissues [15,16,17,18,19]. Finite-element mechanical models have been applied to simulate the compression of the breast during mammographic exams [20]. Multi-material 3D printing enables a practical pathway for fabricating these anthropomorphic breast phantoms [21,22]. Fused Filament Fabrication (FFF) is one of the most widely used printing technologies, primarily due to its low cost and the broad availability of printing materials [23,24]. In addition, this technology allows the printing of different materials in the same print. Its main disadvantage relies on the appearance of image artifacts caused by the linear deposition of the material, which is highly dependent on the infill pattern selection [25].
To be representative of the breast, the phantom printing materials must exhibit X-ray attenuation properties that closely approximate those of breast tissues for clinical spectra used in CEM acquisitions [26,27,28]. In addition, these phantoms must include iodinated inserts to determine the iodine signal on DES images. The most suitable technology to produce these inserts is Stereolithography (SLA), in which a resin doped with iodine is used, following a validated methodology [29].
DES images depict iodine signal with an intensity expected to be proportional to iodine concentration, regardless of the surrounding tissue composition. Assessing DES performance in complex anthropomorphic backgrounds is essential to determine how realistic anatomical noise influences the iodine signal. This evaluation should verify: (a) the iodine signal response across different local glandular ratios for clinically relevant iodine area densities (0.2–1.5 mg/cm2) using the Mean Pixel Value (MPV), Signal Difference (S), and Signal-Difference-to-Noise Ratio (SdNR); and (b) the effectiveness of background cancellation, ensuring that non-iodinated tissue structures within the complex background do not generate subtraction artifacts or spurious enhancement [3,6]. Furthermore, anatomical texture suppression can be rigorously parameterized through one-dimensional Noise Power Spectrum (1D-NPS) formalisms. Whereas conventional breast X-ray images are dominated by structurally correlated parenchymal noise (β ≈ 3–4) [30,31,32,33], DES algorithms suppresses tissue architecture, driving β down (β → 0) toward a residual noise baseline. Correlated anatomical patterns are removed, and spectral power is governed primarily by quantum noise and low-frequency system-level scatter or shading artifacts [11,33].
The aim of this work is the design, fabrication and evaluation of a 3D-printed patient-derived anthropomorphic breast phantom employed for the assessment of the performance of dual-energy subtraction algorithms. Resin-based inserts doped with iodine area density ranging from 0.2 to 1.5 mg/cm2 and non-iodinated inserts mimicking glandular tissue (gland-like) are included into the anthropomorphic breast phantom. The suitability of the phantom for quantitative image quality assessment is evaluated based on the results achieved across three different vendor CEM systems. To this end, iodine signal response and texture background cancellation efficiency (Texture Cancelation Coefficient (TCC) and 1D-NPS) were compared against commercial reference phantoms and the published literature data.
2. Materials and Methods
2.1. Anthropomorphic Breast Phantom Design
A digital uncompressed breast phantom derived from a patient-based breast-CT volume was selected from a library of computational models [15]. This phantom has the realistic shape of a breast and an inner distribution of glandular and adipose tissues that reproduces a structured breast background. This computational model had a total volume of 463.4 cm3, with bounding box dimensions of 12.2 cm × 7.0 cm × 12.3 cm, where the latter corresponds to the uncompressed breast thickness. Voxels were isotropic, with a side length of 0.273 mm, and classified as glandular tissue, adipose tissue or skin. The volumetric breast density, defined as the quotient of glandular tissue voxels to the total number of voxels, was calculated, yielding a value of 12.1%.
Following the assignment of tissue-specific elastic properties to the voxels, breast compression in the craniocaudal direction was simulated using a validated finite-element mechanical algorithm according to the framework established by Pacheco et al. [20]. This compression algorithm accurately reproduced the physical positioning of the breast between the support table and the compression paddle, yielding a compressed breast thickness of 4.8 cm, as shown in Figure 1a. The maximum projected area on the breast support table (xy-plane in Figure 1a) was 16.7 cm × 8.9 cm.
Figure 1.
(a) Volumetric rendering and (b) map of the local glandular ratio in the craniocaudal projection, defined as the quotient of the number of glandular tissue voxels to the total number of voxels along the z-axis at each (x, y) location; (c) four-plate configuration of the compressed computational breast model; (d) binary layout (grey: adipose tissue, white: glandular and skin voxels) of the top surface of the target plate. Blue circular regions correspond to the blind cavities (radius = 8.0 mm, depth = 0.8 mm) for incorporating the iodinated inserts at positions (I1–I4), and the red circular region indicates the single gland-like insert (G) location.
The volumetric breast density was recalculated after the compression, and a value of 12.2% was obtained, which indicates that the overall proportion of glandular tissue was strictly maintained during the volumetric deformation. Additionally, the local glandular ratio map was generated by calculating the fraction of glandular voxels relative to the total number of voxels along the z-axis at each (x, y) position (Figure 1b).
To facilitate the 3D-printing workflow, skin voxels were reclassified as glandular voxels, thereby yielding a simplified two-component digital phantom. Furthermore, the computational volume was sectioned into four individual plates, each with a thickness of 1.2 cm (Figure 1c). Two rectangular blocks, with four alignment guide holes each, were integrated into the model’s chest wall to attach the phantom plates with screws, ensuring their alignment. Finally, each plate’s glandular and adipose sub volumes were converted into boundary surface meshes and STL files using a 3D Slicer v5.10.0 [34], as input for the 3D printing software (Bambu Studio v2.7.1.62). The plate #2 (Figure 1c), named as the target plate, was designed to incorporate four cylindrical blind cavities (denoted as I1–I4), each featuring a depth of 0.8 mm and a radius of 8.0 mm (see Figure 1d). Complementary cylindrical inserts with matching dimensions were designed to fit precisely into these cavities. The gland-like insert (denoted as G) was printed as an integral part of the plate, rather than as a separate insert, to prevent boundary artifacts on the images. The local glandular ratio map was employed to strategically select the positions of the iodinated inserts (blue regions of interest (ROIs)) in Figure 1d) exhibiting local glandular ratios of 8.0%, 13.3%, 33.8%, and 44.9% for positions I1, I2, I3, and I4, respectively.
Finally, a homogeneous breast phantom was digitally modeled to be used as a reference, with identical external boundary dimensions and four-plate modular configuration as the anthropomorphic phantom. Plate #2 was similarly modified as a target plate to accommodate the four iodinated inserts and the one gland-like insert in the same spatial coordinates described above.
2.2. 3D-Printing and Phantom Production
The computational designs were physically fabricated utilizing a combination of two distinct 3D-printing modalities: fused filament fabrication (FFF) and stereolithography (SLA). This section outlines the specific material formulations, printing parameters, and chemical doping protocols implemented to produce the modular anthropomorphic and homogeneous phantoms, alongside their corresponding iodinated and gland-like inserts.
2.2.1. Production of the Anthropomorphic Phantom
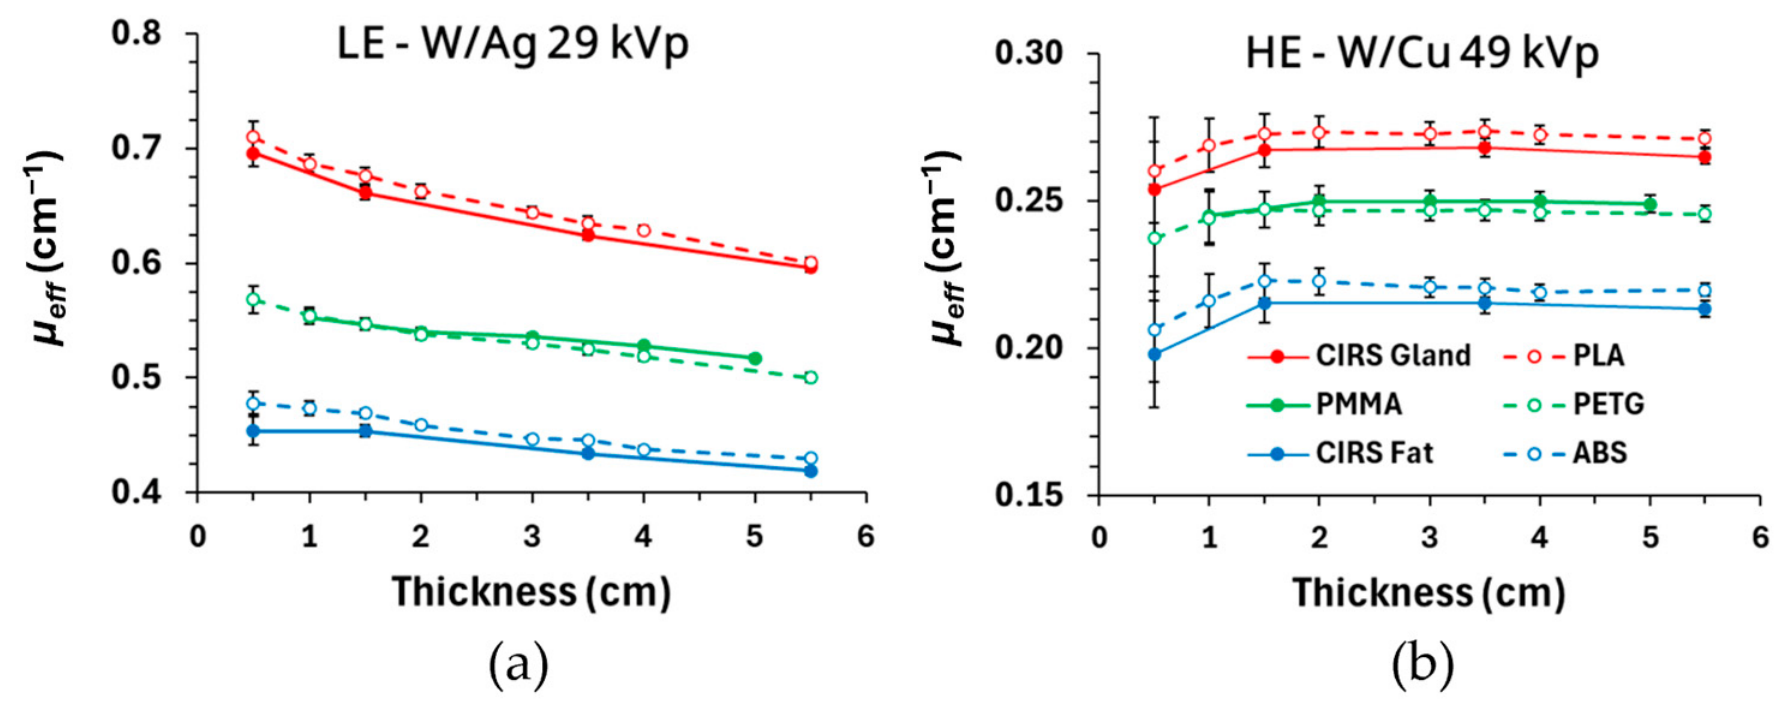
Fused filament fabrication (FFF) was utilized due to its capability for multimaterial deposition within a single print cycle. Based on a previous work [27], a navy blue polylactic acid (PLA) and a white acrylonitrile butadiene styrene (ABS), both procured from Bambu Lab (Shenzhen Tuozhu Technology Co., Ltd., Shenzhen, China), were selected as surrogates for the glandular/skin and adipose tissue, respectively. The selection was based on their effective X-ray attenuation coefficients (µeff), which exhibited relative differences less than 5% [26] compared to the µeff values of glandular (BR 100/0) and adipose (BR 0/100) CIRS reference materials (Sun Nuclear, Mirion Medical Co., Melbourne, FL, USA). The relative differences were for thicknesses ranging from 0.5 cm to 5.5 cm and for clinical spectra used in digital mammography (DM) and digital breast tomosynthesis (DBT). The µeff of these materials was obtained in this work for the spectra used in LE and HE acquisitions following the same validated methodology [26,27]. In this case, the relative differences were below 3% and 5% for PLA–CIRS glandular and ABS–CIRS adipose tissue, respectively (see Appendix A, Figure A1a and Figure A1b, for the LE and HE spectra, respectively).
Printing was performed on a Bambu Lab H2D printer equipped with an independent dual extruder system. The optimized printing parameters are summarized in Table 1. More detailed specifications regarding the 3D-printing process, material compatibility workarounds, thermal management, and infill pathing strategies are provided in Appendix B. Following the printing process, all external phantom plate surfaces were polished to eliminate minor superficial artifacts. Each phantom plate was 3D-printed three times, except for the target plate, which was printed five times to accommodate each of the iodinated inserts with each of the five iodine area densities employed in this study. The reproducibility of the phantom fabrication was evaluated by printing three phantom copies and by acquiring three DM “for processing” images with AEC activated [25]. Inter-copy mAs differences selected by the AEC remained below 2.0%, which is lower than the intra-copy variation observed between different exposures of a single copy (up to 3.0%). Furthermore, the inter-copy Structural Similarity Index Measure (SSIM) (mean 0.973, range 0.966–0.979) differed by less than 1.7% from the intra-copy SSIM values (≈0.99). These results demonstrate high reproducibility in AEC response and structural fidelity.
Table 1.
Printing parameters selected in Bambu Studio to print the phantom plates.
2.2.2. Production of the Homogenous Phantom
The homogeneous reference phantom was designed with the same external geometry as the anthropomorphic phantom. It also consisted of four plates, with the target plate located at the same position as in the anthropomorphic phantom. The selected printing material was Polyethylene Terephthalate Glycol in translucent blue (PET-G, eSun, Shenzhen, China). For DM and DBT spectra, X-ray effective attenuation coefficients of PET-G translucent blue match those of Polymethyl Methacrylate (PMMA) [26,27], which is the standard material widely utilized for quality control phantoms in breast X-ray imaging. The μeff values of PET-G were determined in this work for both LE and HE spectra, showing relative differences, with respect to PMMA, lower than 2% (see Appendix A, Figure A1a and Figure A1b, respectively).
The printing parameters were identical to those collected in Table 1 for PLA, except for the nozzle temperature (set to 255 °C) and the enclosure conditions. The printer’s top cover and front printing chamber doors were kept completely open.
2.2.3. Preparation of the Gland-like and Iodinated Inserts
To avoid boundary artifacts in the dual-energy-subtracted (DES) images, the gland-like insert was printed with PLA at the same time and integrated in the target plate. The iodinated inserts were fabricated to match the four cylindrical blind cavities of the target plate (Figure 1d). These inserts were produced using a consumer-grade masked stereolithography (MSLA) printer (Elegoo Mars 4 Ultra, Elegoo Inc., Shenzhen, China). Iodinated contrast agent (Iomeron 400, Bracco Imaging S.p.A., Milan, Italy) was introduced into the photopolymer resin [29] to obtain nominal iodine area densities of 0.2, 0.5, 0.75, 1.0, and 1.5 mg/cm2, following reference values reported in the literature [35]. After printing, the inserts were washed in isopropanol, UV-cured, and polished to a final thickness of 0.800 ± 0.003 mm. Prior to insertion into the corresponding cavities, a small amount of uncured resin was deposited to eliminate air micro-gaps at the insert-cavity interface, thereby preventing boundary artifacts in the images. At each target plate, the four inserts had the same iodine area density.
To evaluate the reproducibility of the preparation and 3D-printing of the iodinated inserts, five independent replicas were produced for each nominal iodine area density (0.2–1.5 mg/cm2). Three CEM acquisitions were performed for the replicas arranged in a matrix layout and positioned on top of a 4.5 cm PMMA stack, using the same exposure parameters as those employed for the phantom. The three DES images were averaged, and mean pixel values (MPVs) were measured using 7.0 mm diameter circular ROIs centered on each replica. The coefficient of variation was calculated as the average and standard deviation of MPVs across the five replicas. For 0.2 mg/cm2, it was 0.9%, while it ranged from 0.4% to 0.6% for the rest of the iodine area densities, indicating a good reproducibility of the iodine concentrations. The average MPV was plotted against the nominal iodine area density, and linear regression was performed to evaluate the linearity of the iodine signal with the iodine area density, yielding a coefficient of determination (R2) of 0.992.
2.3. Image Acquisition
Three different clinical mammography systems capable of performing CEM were used: Hologic 3Dimensions (Hologic, Bedford, MA, USA), Siemens Mammomat B.brilliant (Siemens Healthineers, Forchheim, Germany) and GE Senographe Pristina (GE Healthcare, Chicago, IL, USA). Their technical specifications are summarized in Table 2.
Table 2.
Technical specifications of the systems used in this work. W: tungsten, Mo: molybdenum, Rh: rhodium, a-Se: amorphous selenium, CsI: cesium iodide, Ag: silver, Al: aluminum, Ti: titanium, Cu: copper, AEC: Automatic Exposure Control, AOP-STD: Automatic Optimization of Parameters—Standard, LE: low energy, HE: high energy.
The phantom was positioned on the breast support table in the same way as a patient breast. The phantom plates were assembled and secured with four screws to prevent misalignment or relative motion between plates. The compressor plate was in contact with the top surface of the phantom, applying a compression force of 75 N, yielding a readout thickness of 5.0 cm (compared to the 4.8 cm thickness of the phantom). Given the stiffness of the phantom material, this 0.2 cm variation is entirely attributed to the slight tilting of the compression paddle that typically occurs under standard applied compression force in clinical practice. Image acquisitions were performed using each vendor’s default, the proprietary Automatic Exposure Control (AEC) mode, to simulate realistic operating conditions, rather than under matched-dose constraints. Three consecutive CEM acquisitions were performed with the AEC activated. Four images were stored per exposure: LE “for processing” and “for presentation”, HE (only HE “for processing” was generated), and dual-energy subtraction (DES). For each CEM acquisition, technical parameters such as anode/filter combination, kVp, mAs, and MGD were extracted from the DICOM headers of LE and HE images.
2.4. Image Analysis and ROI Selection
Three different features were evaluated on the DES images: (i) linearity of the iodine signal with iodine area density, (ii) elimination of the gland-like signal and (iii) cancellation of the structured background. As illustrated in Figure 2, a set of twenty-six compound ROIs (circular ROI with a 7.0 mm diameter and concentric annular ROI with an inner radius of 10.5 mm and outer radius of 11.6 mm, both with identical area) was employed. Four ROIs were placed at the iodinated inserts (blue ROIs in Figure 2), one ROI at the gland-like insert (red ROI in Figure 2), and twenty-one at different locations across the structured background (yellow ROIs in Figure 2). The mean pixel value (MPV) of the circular ROIs and both the MPV and standard deviation of the annular ROIs were measured.
Figure 2.
Set of circular and concentric annular ROIs with identical area, positioned at the iodinated (blue) and gland-like (red) inserts and at different positions across the structured breast background (yellow).
Next, three metrics were considered: the MPV of the circular ROIs, the signal difference (S), defined as the difference between the MPVs of circular and annular ROIs, and the signal-difference-to-noise-ratio (SdNR), defined as the ratio of S to standard deviation of the annular ROI.
2.5. Linearity of Iodine Signal with Iodine Area Density and Elimination of Gland-like Signal
The average values for MVP, S and SdNR for each insert were obtained based on the three consecutive DES images. Their uncertainties were determined as half the absolute range between the maximum and minimum values across the three images. Since the four iodinated inserts (I1, I2, I3 and I4) had the same iodine area densities for each target plate, their measured metrics values were averaged per plate. The uncertainties of those means were obtained for each plate as the square root of the sum of squared uncertainties of the four inserts divided by the number of inserts.
Weighted linear regression analyses were performed to evaluate the linearity of MPV, S, and SdNR as a function of the iodine area density using the previously calculated uncertainties as weight factors. Slopes and intercepts as well as their associated standard errors, representing 1σ uncertainties and coefficients of determination (R2), were reported. For the gland-like insert, an iodine area density of 0 mg/cm2 was assumed. For S and SdNR, the linear regression models were constrained to pass through the origin (zero intercept).
Finally, to analyze the relationship between SdNR values and the local glandular ratio, a weighted linear regression analysis was applied, considering the SdNR values obtained for each target plate at each position (I1, I2, I3, I4) and their corresponding uncertainties. A two-way Analysis of Variance (ANOVA) was performed independently for each system (Hologic, Siemens, GE) and metric (MPV, S, and SdNR) to evaluate the effect and interaction of two factors: iodine area density and local glandular ratio. Analyses were performed separately for two iodine area density ranges: low-to-intermediate densities (Subset 1: 0.2, 0.5, and 0.75 mg/cm2) and intermediate-to-high densities (Subset 2: 0.75, 1.0, and 1.5 mg/cm2), utilizing 36 data points per subset, system, and metric (3 iodine area densities × 4 local glandular ratios × 3 repetitions). The threshold for statistical significance was set to ɑ = 0.05. The proportion of total variance explained by each factor was quantified using ηp2.
To evaluate inter-system performance, Tukey’s Honest Significant Difference (HSD) post hoc test was applied for pairwise comparisons among systems (GE vs. Siemens, GE vs. Hologic, and Siemens vs. Hologic) for each metric.
2.6. Structured Background Cancellation
The efficiency of the algorithms to suppress the structured background was evaluated through both subjective and objective analyses. Subjectively, a visual qualitative assessment of the presence of artifacts in the DES images was performed by comparing with the LE “for presentation” images. Objectively, breast texture cancellation was quantified through the MPV, S, and SdNR values of the twenty-one ROIs located at the structured background for all phantom configurations and systems. In addition, the texture cancellation coefficient (TCC) was computed, defined as the ratio of S values of the gland-like insert and of the iodinated insert with an iodine area density of 0.5 mg/cm2 [3]. TCC values were obtained for the four iodinated inserts of the phantom and for all systems.
To further quantify background texture suppression, the noise power spectra (NPS) [30,31,32,33] were determined across LE “for processing” and “for presentation”, HE, and DES images of both the anthropomorphic and homogenous phantom. The target plate was used. A total of 1000 square ROIs of 256-pixel side lengths were positioned at randomized locations of the phantom image, all included in a central region to avoid the phantom edges. Each ROI was subtracted by its mean pixel value and subsequently multiplied by a two-dimensional Tukey window to minimize edge artifacts. A two-dimensional Fast Fourier Transform was applied to obtain the two-dimensional NPS (2D-NPS) of each ROI. The 2D-NPS for the 1000 ROIs were averaged, and a radial averaging was applied to obtain the 1D-NPS as a function of the spatial frequency f. The 1D-NPS profiles were compared across all image types and systems to assess their spatial frequency distributions.
The 1D-NPS was linearly fitted on a log-log scale using the power-law relation log(1D-NPS) = log(α) − β log(f), to derive the anatomical structure parameter β and the noise amplitude parameter α for each image type and system. The linear regression fit was strictly constrained within the spatial frequency band between 0.25 mm−1 and 0.80 mm−1, corresponding to the anatomically dominated spatial frequency range for which the 1D-NPS of the LE “for processing” images exhibited the maximum linearity according to the literature [33].
To isolate system-level contributions—such as low-frequency X-ray scatter shading and gain-field non-uniformities— to the 1D-NPS profiles, the parameters β and log(α) were additionally computed for the homogeneous breast phantom (for the Hologic system). Within this analytical framework, the β values obtained from the homogeneous phantom serve as the baseline system benchmark against which the anthropomorphic phantom is compared, to quantitatively evaluate background texture suppression.
3. Results
3.1. The Printed Anthropomorphic Phantom
The distribution of the PLA and ABS materials is evident in the 3D-printed plates shown in Figure 3a. The target plate (#2 plate) with the iodinated inserts located at I1–I4 positions and the gland-like insert is displayed in Figure 3b. The 3D printing of each plate required an average time of 18 h, with no observable delamination or boundary gaps between the tissue-surrogate materials.
Figure 3.
(a) The 3D-printed plates of the anthropomorphic phantom, including the #2 plate with inserts (target plate); (b) target plate with iodinated (I1–I4) and gland-like insert (G).
3.2. Exposure Parameters and Mean Glandular Dose
Table 3 summarizes the exposure factors selected by the AEC of each system, the mean glandular dose for the LE (MGDLE) and HE (MGDHE) images, the total dose obtained by summing LE and HE doses (MGDCEM) and the ratio of MGDLE/MGDCEM across the five phantom configurations (five target plates).
Table 3.
Exposure factors selected by the automatic exposure control (AEC) for low-energy (LE) and high-energy (HE) images across all the systems, for all the targets plates of the anthropomorphic breast phantom. For the acquisition with Siemens, the AEC mode was at 100% dose level (default). The mAs and MGD ranges are from the different target plate exposures.
As expected, for each system, the same target/filter combination and kVp were selected independently of the target plate included in the phantom. However, a variability is observed for the mAs value, which is the lowest one for both LE and HE images from GE system. The mAs variation could be attributed to the different attenuation of the inserts (different iodine area density) included in the target plates. The highest MGDCEM from DICOM headers was for the Siemens system, whereas equal values are provided by Hologic and GE. As expected, the LE component represented the primary contribution to the MGDCEM for all evaluated systems, with the MGDLE/MGDCEM ratio reaching its minimum on the GE system and its maximum on the Hologic system.
3.3. Visual Assessment of Low-Energy and Recombined Images
Figure 4 shows LE “for presentation” and DES images of the anthropomorphic breast phantom acquired with the three systems. The inserts in the target plate correspond to the maximum iodine area density of 1.5 mg/cm2. LE images (first row in Figure 4) clearly showed the structured breast background and some of the iodinated inserts, while in DES images (second row in Figure 4), the parenchyma structure was substantially removed. Furthermore, the residual signal of the gland-like insert (indicated by white arrows in Figure 4d–f) was barely visible, and only the signal corresponding to the iodinated inserts was enhanced (see Figure 4g–i). Air artifacts at the edges of the iodinated inserts due to the 3D-printing process were scarcely visible in the images (see Figure 4g–i). Parallel artifacts around the skin edge were observed due to the stacking of the individual phantom plates; these were less visible in the case of GE. For Hologic, a reduction in intensity around the iodinated inserts was clearly seen in the DES image (Figure 4d).
Figure 4.
Low-energy “for presentation” images (a–c) and dual-energy subtracted (DES) images (d–f) of the anthropomorphic phantom with the target plate containing the inserts with the highest iodine area density (1.5 mg/cm2) for the Hologic (a,d), Siemens (b,e), and GE (c,f) systems. All the images are presented with the LUT defined at each system. White arrows indicate the position of the gland-like insert. The zoomed-in region of DES images corresponds to the upper-left insert (red square in DES images) for the Hologic (g), Siemens (h) and GE (i) systems.
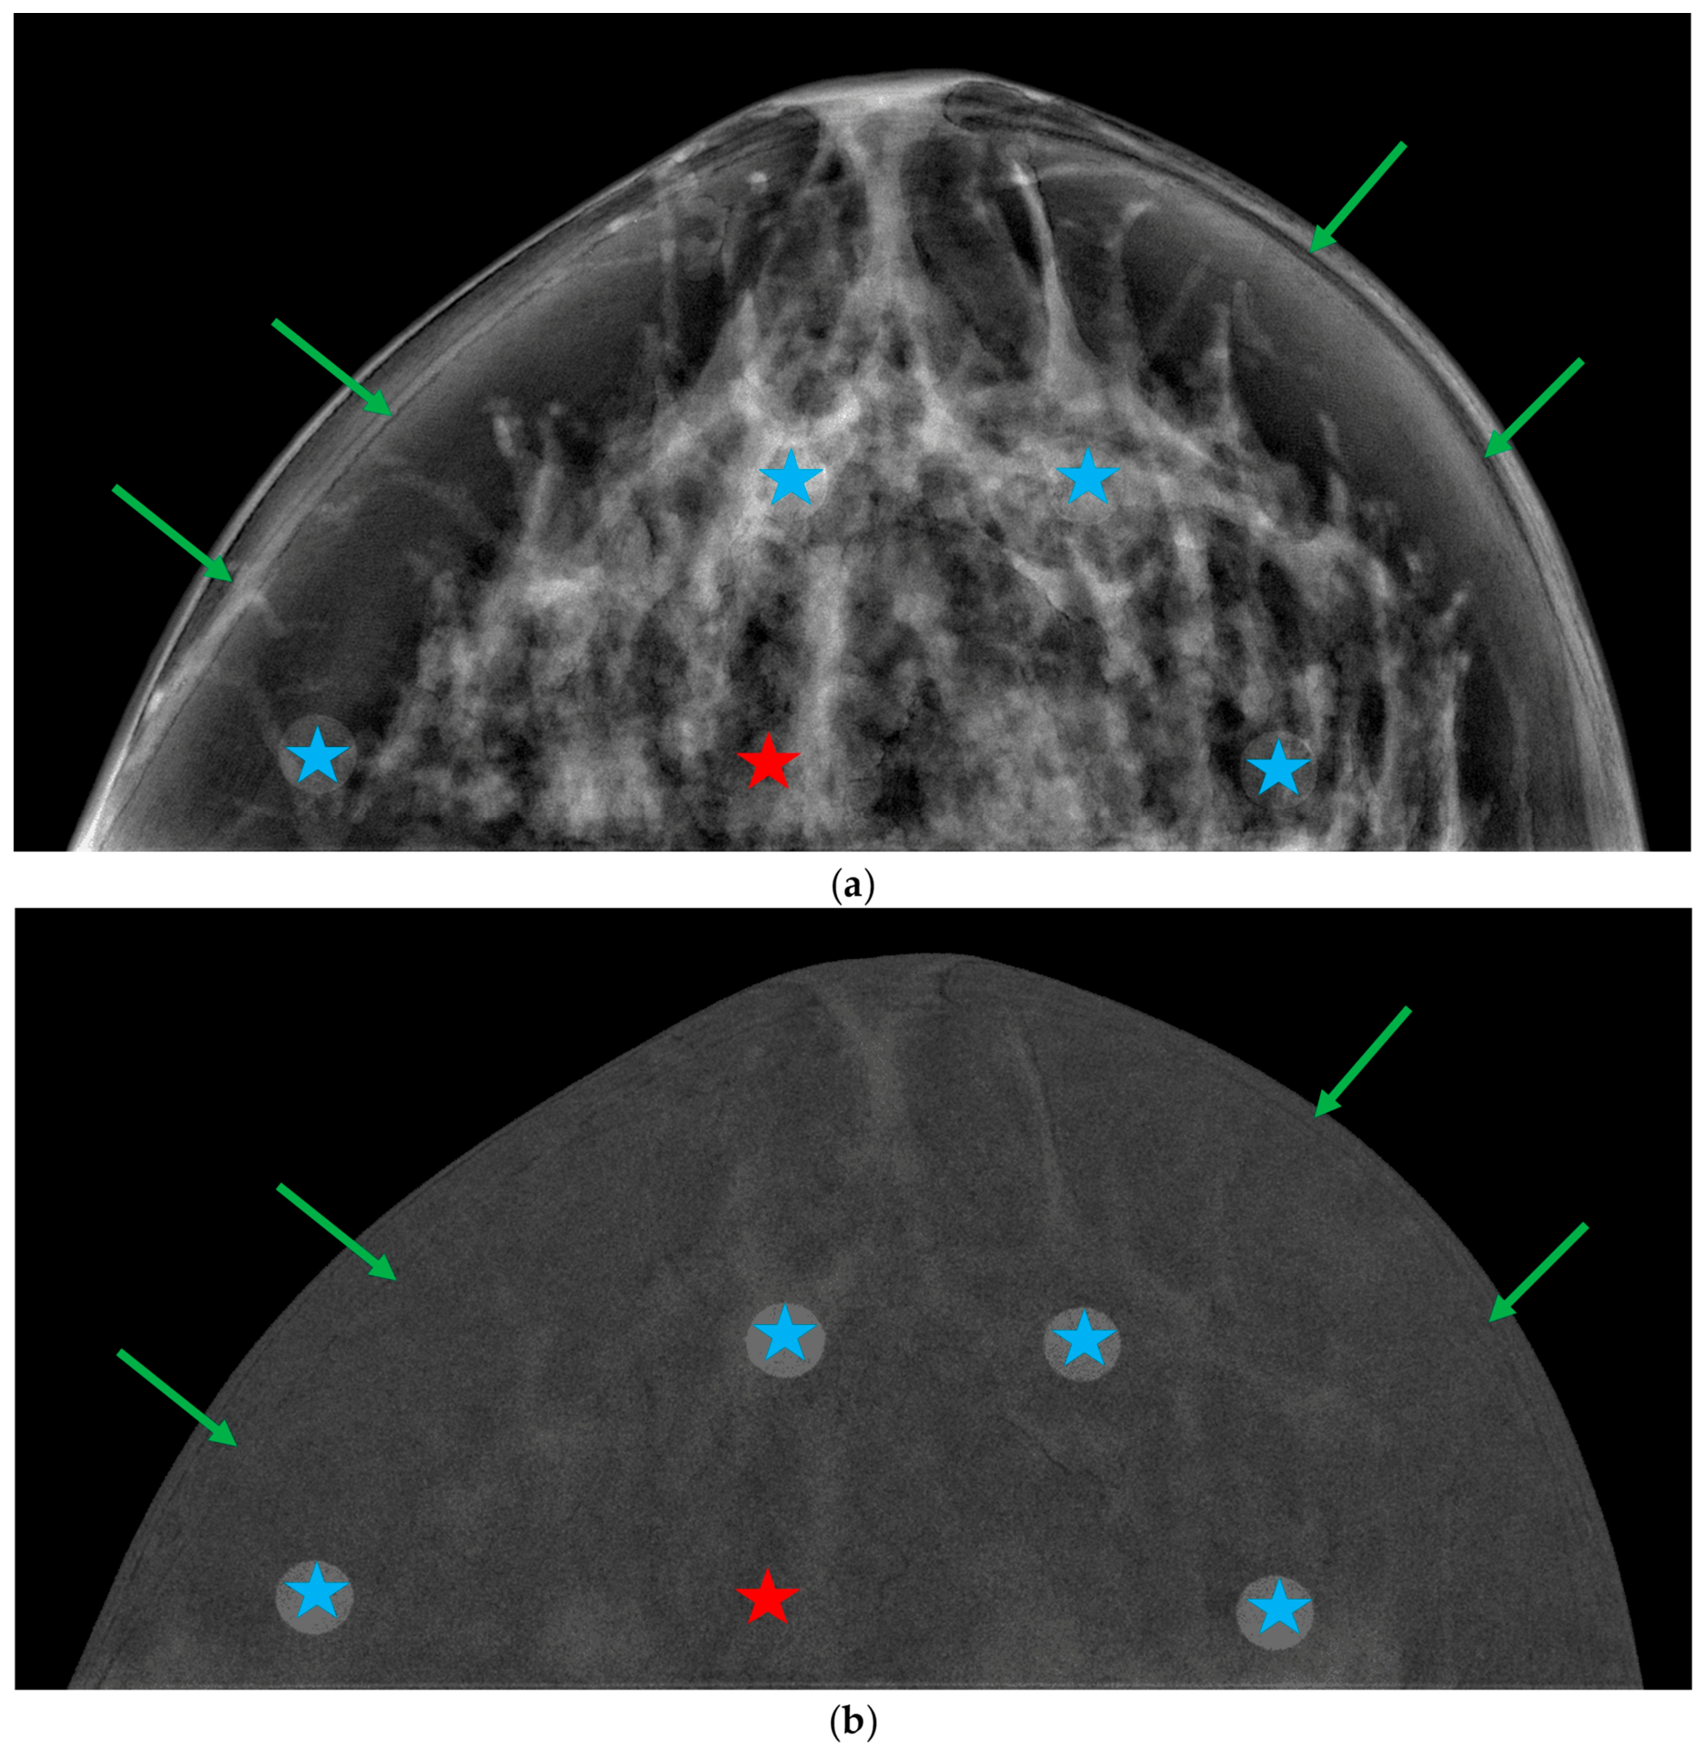
DES images revealed clear differences in noise texture between the systems. Hologic and Siemens DES images exhibited noise with a larger “graininess” (Figure 4d,e) than the GE images (Figure 4f), with Hologic showing the most granular and blurred appearance. Furthermore, the “breast-in-breast” or “rim” artifact manifested as a curvilinear “halo” parallel to the breast periphery in the DES images of Hologic and Siemens, but not for those of GE. Finally, a slight gradient between the central region of the breast and the curved breast edge was observed in the DES images of Siemens (see Figure 4e). The exact positions of the iodinated and glandular-like inserts, along with the vendor-specific artifacts, can be examined at a larger scale and in greater detail in Appendix C (Figure A2, Figure A3 and Figure A4).
3.4. Linearity of the Iodine Signal with Iodine Area Density
For each system, Figure 5 shows the plots of the average values of the three metrics (MPV, S, and SdNR) measured in the DES images for each target plate (blue ROIs in Figure 2) versus the iodine area density. Across all systems and metrics, the dependence on iodine area density was well described by a linear regression model (R2 > 0.986).
Figure 5.
Mean pixel value (MPV), signal difference (S) and signal-difference-to-noise ratio (SdNR) versus iodine area density for the three systems (columns). Markers represent the average of the metric values across the four ROIs at each target plate and of the gland-like insert. Dashed lines show the linear fits of metric values and nominal iodine area density. Grey markers correspond to the average values across the twenty-one background ROIs. Error bars represent ±1σ uncertainties. The shaded bands indicate the spread of metric values across the target plates; the upper and lower boundaries of each band are constructed by connecting the maximum and minimum values, respectively, for each iodine area density.
The slope and intercept of the fits (dashed lines) are included at each graph, together with the respective uncertainties from the fits and R2 values. Linear fits for S and SdNR were constrained to be zero at the origin. The shaded bands of Figure 5 (blue, green, red) are bound by the minimum and maximum values across the four positions of the inserts with each iodine area density. The largest error bar was at 1.5 mg/cm2 for Hologic, whereas for Siemens and GE the highest error bars were for intermediate concentrations (0.5–0.75 mg/cm2).
The slopes of the MPV- and S-versus-iodine area density were higher for Siemens than for Hologic and GE, indicating a steeper increase in iodine signal and signal difference relative to the background. Conversely, the slope of SdNR for Hologic was approximately 60% higher than for Siemens and GE, reflecting a greater SdNR growth with increasing iodine area density values.
To evaluate the dependence of SdNR on the local glandular ratio, SdNR values were plotted against iodine area density across insert positions (I1–I4), each characterized by a distinct local glandular ratio (Figure 6a,b). A linear regression model with zero intercept yielded R2 values greater than 0.93 across all positions and systems. The results reproduce those obtained from average values, with Hologic demonstrating both the highest SdNR values and slopes across all four positions. Conversely, Siemens and GE exhibited similar SdNR values and slopes, with a maximum relative difference in slopes of 10% at position I3. Hologic yielded its maximum slope and SdNR values at position I2, whereas Siemens and GE exhibited their minimum values.
Figure 6.
(a) Printed target plate with the iodinated inserts positions (I1, I2, I3, I4) corresponding to different glandular ratios; (b) SdNR vs. iodine area density plots for each iodinated insert position and system. The dashed lines correspond to the linear regression models forced through the origin, and the slopes and uncertainties are displayed for each position and system; (c) SdNR vs. glandular ratio across systems and iodine area densities. The shaded bands span the range of SdNR values obtained across the three independent DES image acquisitions. The horizontal error bars correspond to the standard deviation of the glandular ratio measured on the digital phantom.
In Figure 6c, the SdNR values are plotted versus the local glandular ratio across iodine area densities and systems. The graphs show a weak dependence of the SdNR on the local glandular ratio compared to the dominant effect of iodine area density. When excluding the values obtained for position I2 (13.3% glandular ratio), system-dependent trends emerged: Hologic displayed an increasing trend in SdNR with increasing glandular ratio across most iodine densities, whereas Siemens and GE exhibited a slightly decreasing or nearly constant trend. The SdNR values measured at position I2 do not exhibit a consistent trend across the evaluated systems. For the Hologic system, this position yields the highest SDNR value, whereas Siemens and GE show a reduction in SdNR at the same location. In Figure 6c, the shaded horizontal bands represent the full range of SdNR values obtained across image repetitions for each concentration and system. A clear vertical separation between bands was observed for the higher iodine area densities (≥1.00 mg/cm2), while lower densities (≤0.75 mg/cm2) exhibited band overlapping across all systems.
The two-way ANOVA revealed that the relative influence of iodine area density and local glandular ratio on the metric parameters depended strongly on the iodine area density range under investigation. In the low-to-intermediate iodine area density range (Subset 1), iodine area density was the primary factor explaining the variability in both S (59–74%, across systems) and SdNR (47–75%, across systems). In contrast, the influence of the local glandular ratio became more pronounced for MPV, accounting for 65% of the total variance in the GE system and 45% in the Hologic system. Furthermore, in the Siemens system, SdNR exhibited a nearly balanced sensitivity to both factors, with the local glandular ratio explaining 49% of the variance and iodine area density explaining 47%. Conversely, in the intermediate-to-high iodine area density range (Subset 2), iodine area density became the overwhelmingly dominant factor across all systems (p < 0.001), accounting for 68% to 81% of the variance in MPV, 90% to 92% in S, and 79% to 84% in SdNR. In this higher range, the local glandular ratio exerted a minor influence, accounting for only 4% to 6.0% of the variance in S, 6% to 17% in SdNR, and 16% to 27% in MPV.
Across both subsets, interaction terms (iodine area density × glandular ratio) reached statistical significance (p < 0.05), likely owing to the high statistical power resulting from the low residual experimental noise. However, the interaction accounted for only a small proportion of the total variance (ηp2 < 5% in most cases), reaching a maximum of 13.2% for SdNR in the Hologic system. These findings indicate that the effect of iodine area density remains largely consistent across different background compositions. Inter-system pairwise comparisons using Tukey’s HSD test demonstrated that MPV values exhibited significant pairwise differences among all three commercial systems (p < 0.001). However, specific cross-system equivalences were identified for the remaining metrics. Specifically, no statistically significant differences were observed for S between GE and Hologic (p = 0.996 in Subset 1; p = 0.859 in Subset 2), nor for SdNR between GE and Siemens (p = 0.988 in Subset 1; p = 0.933 in Subset 2).
3.5. Comparison of SdNR Values Between Anthropomorphic and Homogenous Phantoms
To investigate whether the local glandular ratio was the primary factor driving these position-dependent SdNR trends, and to elucidate the source of the anomalous behavior at position I2, a comparative evaluation was conducted using the homogeneous phantom, with target plates containing inserts of 0.5 mg/cm2 and 1.5 mg/cm2. Figure 7a shows the SdNR values obtained for two iodine area densities for both the anthropomorphic and homogeneous phantoms, plotted as a function of the local glandular ratio. For the 1.50 mg/cm2 iodinated inserts, the two phantoms yielded comparable SdNR values, with relative differences of less than 9%. For the 0.50 mg/cm2 inserts, however, the homogeneous phantom exhibited a progressive increase in SdNR from 1.56 ± 0.10 at position I1 to 3.02 ± 0.22 at position I4, whereas the anthropomorphic phantom showed a flatter behavior, with SdNR values from 1.74 to 2.12.
Figure 7.
(a) SdNR values as a function of local glandular ratio for the anthropomorphic (solid lines) and homogeneous (dashed lines) phantoms at iodine area densities of 0.50 mg/cm2 (blue circles) and 1.50 mg/cm2 (red circles); DES images of the (b) anthropomorphic and (c) homogenous phantoms for the target plate with an iodine area density of 1.50 mg/cm2, acquired with Hologic. Red arrows indicate the “breast-in-breast” artifact. Labels I1–I4 and G indicate the position of the iodinated and gland-like inserts, respectively.
For 1.5 mg/cm2, a pronounced SdNR peak exhibited at position I2 was also observed in Figure 7a for both the anthropomorphic (SdNR = 8.72 ± 0.30) and homogeneous (SdNR = 8.69 ± 0.49) phantoms. Figure 7b,c shows the DES images for both phantoms. Visual inspection of the images reveals a localized reduction in background intensity surrounding the iodinated inserts, together with a “breast-in-breast” halo artifact (red arrows in Figure 7b,c) in the periphery of both phantoms (see Section 3.3). For the position I1, the local drop in pixel intensity around the insert and the proximity to the “breast-in-breast” artifact both degrade background signal uniformity, producing a reduction in the SdNR. In contrast, position I2 is situated away from this artifact, resulting in an artificially elevated SdNR value relative to I1.
3.6. Assessment of the Structured Background Cancellation
3.6.1. Gland-like and Structured Background Signal Suppression
The MPV, S and SdNR values for the structured background (averaged across the twenty-one yellow ROIs in Figure 2) are plotted along the iodine area density values across phantom configurations and systems (Figure 5). As expected, the plots exhibit a flat behaviour for all systems. The width of bands representing the MPV, S and SdNR ranges remained constant across phantom configurations and systems; the bands of MPV and S values were narrower for GE and Hologic than for Siemens. This is consistent with a more pronounced intensity gradient in the residual background signal, which is visible in the Siemens DES images (see Figure 4e). For the iodinated inserts of 0.2 mg/cm2, the values for the different metrics were comparable to those of the background, as demonstrated by the pronounced overlaps of the bands in Figure 5 in Siemens and GE and a slightly reduced overlap in the Hologic system.
Table 4 summarizes the average values determined for these metrics for all the phantom configurations (different target plates). Across all systems, differences < 1% were found between the average MPV of the gland-like and background regions, while S and SdNR values were approximately twice as high in background regions compared to the gland-like regions. The minimum SdNR values for both gland-like and background regions were observed for GE, followed by Hologic and Siemens, which showed similar values. Furthermore, for all systems, the SdNR ranges were approximately six times wider for background regions than for gland-like regions.
Table 4.
Average MPV, S, and SdNR values correspond to the gland-like and structured background regions obtained from DES images across systems. For each system, values represent the average across the five phantom configurations. Results are expressed as average ± standard deviation (minimum–maximum).
3.6.2. Texture Cancellation Coefficient (TCC)
Average TCC values were computed from the four 0.5 mg/cm2 iodinated inserts across systems (see Table 5). TCC values for Siemens were approximately double those of GE and Hologic. Notably, the latter system displayed the most uniform spatial response across the four insert positions in the target plate (ranging from 0.03 to 0.06), whereas Siemens presented the highest variability (0.07 to 0.19), with its minimum TCC value exceeding the maximum observed for Hologic.
Table 5.
Average values of the texture cancellation coefficients (TCCs). Values are expressed as average ± standard deviation (minimum–maximum).
3.6.3. One-Dimensional Noise Power Spectrum (1D-NPS)
The 1D-NPS plots in Figure 8 show, for all systems, a monotonical decrease with increasing spatial frequency for the LE “for processing”, LE “for presentation”, and HE images (blue, green, and orange curves, respectively), with well-defined spectral peaks observed at high spatial frequencies. For all systems, the observed peaks at f~4.25 mm−1 and f~2.15 mm−1 correspond to the 0.23 mm nominal infill spacing of the 3D-printed phantom (f~4.35 mm−1) and the 0.46 mm back-and-forth nozzle pass step size (f~2.17 mm−1), respectively. An additional peak at f~3.05 mm−1 appeared exclusively in the Siemens system.
Figure 8.
One-dimensional noise power spectra (1D-NPS) across all evaluated systems and image types. Points represent the average 1D-NPS calculated across the 1000 ROIs, while the shaded bands indicate the full range encompassing the 1D-NPS of all ROIs. The top row (a–c) shows the 1D-NPS for (a) Hologic, (b) Siemens, and (c) GE, where the gray shaded area indicates the interval from 0.25 to 1.0 mm−1, which is shown in detail in the bottom row plots (d–f), with dashed lines representing the corresponding power-law regression modeled as (1D-NPS = αf−β).
For the DES images (red line in Figure 8), the 1D-NPS exhibited a system-dependent behavior at spatial frequencies greater than 1 mm−1. Marked drops at approximately 1.5 mm−1 and 2.0 mm−1 were observed for the Hologic and Siemens systems, respectively, while the GE showed a smoother monotonic decrease.
For all systems and images, the anatomical noise was quantified by performing a linear fit of the 1D-NPS in a log-log scale as a function of frequency in the range of 0.25–1.0 mm−1. This range is highlighted by the gray shaded region in Figure 8a–c and shown in greater detail in Figure 8d–f. The values for the slope (β) and independent term (log(α)) resulting from the fits are collected in Table 6. The fits (dashed lines in Figure 8d–f) demonstrated high robustness, yielding R2 values ranging from 0.922 to 0.997.
Table 6.
Parameters β and log(α) obtained from the fit log(1D-NPS (f) = log(α) − β log(f)) within the frequency range (0.25–1.0 mm−1) for each system and for low-energy (LE “for processing” and “for presentation”), high-energy (HE); and dual-energy subtracted (DES) images. Uncertainties correspond to 1σ.
The results in Table 6 demonstrate a systematic reduction of β in the order: β (LE “for processing”) > β (LE “for presentation”) > β (HE) >> β (DES) for all the systems. β values for DES images were approximately 1.1 for all systems. These results were contrasted with the β values obtained from the images of the homogeneous phantom (only available for the Hologic system). As expected, due to the lack of anatomical noise, substantially lower β values were observed across all imaging modes: 1.4 ± 0.3 for LE “for processing”, 1.0 ± 0.2 for HE, 0.58 ± 0.09 for LE “for presentation”, and 0.65 ± 0.07 for DES. Notably, in the absence of an anatomical background, the drastic reduction in β for DES images—which is characteristic of the anthropomorphic phantom—does not occur. Instead, the β value for DES remains comparable to that of LE “for presentation”.
In contrast, log(α) revealed divergent behaviors across both image types and imaging systems. With respect to imaging modalities, a substantial increase in log(α) was consistently observed when transitioning from LE “for processing” to both HE and LE “for presentation” across all manufacturers. When analyzing the values for DES images, the systems managed noise scaling differently. While Hologic and GE exhibited log(α) values of 0.61 ± 0.01 and 0.34 ± 0.03, respectively, the Siemens system showed a value of 1.98 ± 0.02. Consequently, the absolute noise amplitude for the recombined DES images of Siemens was found to be approximately three times larger than that of Hologic and nearly six times larger than that of GE.
4. Discussion
This study presents the design, fabrication, and evaluation of a patient-specific anthropomorphic breast phantom developed to assess the performance of dual-energy subtraction (DES) in contrast-enhanced mammography (CEM). To the best of our knowledge, this represents the first anthropomorphic breast phantom specifically developed for CEM image quality evaluation.
The results highlight the potential of the proposed phantom as a robust and clinically relevant tool for CEM performance assessment. Unlike conventional homogeneous phantoms, the anthropomorphic design incorporates realistic anatomical structures that reproduce the complexity of the breast background, enabling the investigation of how anatomical noise influences iodine signal detectability. As a result, the phantom provides a more realistic framework for evaluating DES image quality under conditions that closely mimic clinical practice. Such capability may contribute to a more comprehensive characterization of system performance and support the optimization of CEM acquisition and image-processing protocols.
Simulation studies conducted by Houbrechts et al. [12] demonstrated that the measured iodine signal in DES images is intrinsically dependent on both the local glandular ratio and spatial position within the breast, owing to variations in compressed breast thickness, scattered radiation, and DES algorithms. These observations provide a strong methodological basis for the characterization approach employed in this work. Accordingly, the iodine signal was evaluated using inserts with identical iodine area densities positioned at different locations (I1–I4) within the phantom that present distinct local glandular ratios. Furthermore, background texture cancellation can be evaluated with the phantom across regions with varying complexity and fat/glandular distribution. Thus, an evaluation of the DES algorithm performance-suppressing anatomical background structures can be performed closer to the clinical setting with patients.
Across all evaluated systems, considering all iodinated inserts, iodine-related metrics (MPV, S, and SdNR) exhibited strict linear dependence on nominal iodine area density (R2 > 0.986; see Figure 5), confirming that DES algorithms preserve signal-to-iodine area density proportionality in realistic anthropomorphic backgrounds [3,4,8,9]. Linear fits of signal difference (S) as a function of iodine area density yielded slopes of 179.4, 43.6, and 39.1 for Siemens, Hologic, and GE, respectively. Notably, the results reproduced the characteristic magnitude ordering (Siemens ≫ Hologic ≈ GE) observed by Cockmartin et al. (slopes of 192, 37 and 38 for each system, respectively) [3] with the homogeneous CIRS 022 phantom. This also aligns with Ghetti’s reported slopes of 35 for Hologic and 32 for GE. This supports the ability of the proposed anthropomorphic phantom to capture system-dependent differences in DES performance. When evaluating the iodine signal linearity via SdNR, our results show a different behavior, with Hologic systematically providing the highest SdNR values, whereas Siemens and GE yielded lower SdNR values. These results agree with the comparative trends reported in the literature [3,4,7]. Furthermore, the corresponding slopes from the SdNR fits were 4.5, 2.9, and 2.8 for Hologic, Siemens and GE, respectively. This indicates that despite Siemens exhibiting the largest values of S, its higher image noise ultimately reduced the resulting SdNR.
The glandular local ratio (four distinct positions (I1–I4)) exerted a secondary effect in iodine signal detectability, as demonstrated in Figure 6b,c. For both GE and Siemens systems, the fitted relationships between SdNR and iodine area density exhibited similar slopes across all positions, indicating that detectability was largely independent of local glandular ratio. In contrast, the Hologic system demonstrated a different behavior, with notably steeper slopes at positions I2 and I4, suggesting a greater dependence on local background characteristics. Differences between vendors became more apparent when SdNR was plotted as a function of local glandular ratio. Excluding the results from position I2, Hologic showed a slight increase in SdNR with increasing local glandular ratio, whereas Siemens and GE exhibited nearly constant or mildly decreasing trends. These observations indicate subtle system-dependent variations in the interaction between local background and image processing algorithms. Overall, iodine signal detectability was predominantly determined by iodine area density, whereas local glandular ratio had a comparatively minor influence that varied according to the vendor-specific DES processing approach.
The ANOVA results indicated distinct patterns in the influence of iodine area density on the metric parameters across the low- and high-iodine area density regimes in the context of an anthropomorphic background. For low iodine area densities (Subset 1: 0.2–0.75 mg/cm2), tissue composition, quantified by the local glandular ratio, significantly influenced MPV and SdNR, explaining up to 65% and 49% of their variance, respectively, across systems. This behavior likely reflects the greater impact of background tissue fluctuations when the iodine signal is weak. Conversely, at higher iodine area densities (Subset 2: 0.75–1.5 mg/cm2), iodine area density overwhelmingly dominates the measured response, explaining 68% to 92% of total variance across metrics, effectively decoupling the iodine signal from the local glandular ratio (which contributed under 16.8% of variance for S and SdNR). As expected, this transition aligns with the physical principles of contrast-enhanced mammography (CEM) subtraction algorithms, which aim to isolate iodine area density independently of the local glandular ratio. When interpreting these observations within an anthropomorphic context, it is important to note that the statistical assessment evaluated the mean local glandular ratio within the regions of interest rather than the structural background inside those local regions. In addition, iodine uptake in clinical lesions typically exhibits diffuse or non-uniform boundaries, unlike the defined inserts analyzed here, which may introduce additional residual variability in clinical settings.
Finally, the inter-system post hoc analysis demonstrated cross-system equivalences for specific metrics, notably between GE and Hologic for S, and between GE and Siemens for SdNR. However, these findings specifically reflect the calibration and performance of the exact commercial systems evaluated in this study and cannot be broadly generalized across all systems or software versions manufactured by these vendors.
Several artifacts were detected by visual inspection of DES images (Figure 4). A “breast-in-breast” artifact appears as a curvilinear “halo” in the phantom periphery as well as a localized drop in background intensity surrounding the iodinated inserts. These findings align directly with the prior literature describing spatial subtraction artifacts across both breast and physical phantoms and simulation models. Marshall et al. [11] reported low-frequency intensity gradients and boundary effects in the CIRS 011 phantom, while Kim et al. [4] observed comparable subtraction non-uniformities and shading artifacts using the CIRS BR3D (Model 020) phantom. The DES images obtained with the homogenous phantom highlighted these artifacts (Figure 7), reinforcing evidence of the impact of artifacts on the SdNR associated with the iodinated inserts at each location. This homogeneous phantom comparison was conducted solely on the Hologic system, as its DES images exhibited pronounced boundary effects that were not evident in DES images from the other evaluated systems. Specifically, the “breast-in-breast” artifact degrades local background signal uniformity near insert I1, depressing its measured SdNR. In contrast, insert I2 is situated away from this artifact, yielding an artificially elevated SdNR value. Conversely, Siemens and GE both exhibited their minimum slopes at this position (2.2 ± 0.2 for both systems), as this artifact is less apparent for both systems, as can be seen in Figure 4. Additionally, a localized drop in background pixel intensity surrounding the high-contrast iodinated inserts further contributes to these local background distortions. Because this feature occurred independently of the phantom architecture, incomplete anatomical background subtraction was definitively ruled out as the primary cause, and geometry-dependent image features acted a secondary cause. Furthermore, the inverse trend observed in Siemens and GE systems at position I2, where minimum slopes were recorded, highlights the influence of vendor-specific image processing and proprietary DES algorithms. These spatial variations reflect the distinct internal processing pipelines and operational baselines of each evaluated system rather than a universal vendor behavior.
For the iodine area density of 0.50 mg/cm2, the homogeneous phantom exhibited a progressive, monotonic increase in SdNR (from 1.56 to 3.02) as the local glandular ratio increased. In contrast, the signal associated with the local anatomical noise in the anthropomorphic phantom flattened this response (yielding SdNR values from 1.74 to 2.12). This discrepancy demonstrates that homogeneous phantoms systematically underestimate lesion detectability in low-glandular regions while overestimating it in dense areas, failing to reflect true clinical diagnostic performance.
Differences in the values of the metrics for the gland-like insert and the background were observed in DES images. While MPV agrees within <1%, S and SdNR values for the background remain systematically higher. Figure 5 and Table 4 show that for the background, S and SdNR at the different regions span in wider ranges than the gland-like region. Consequently, relying solely on a single insert fails to reflect how the residual tissue signal varies across the whole phantom image. For iodinated inserts of 0.2 mg/cm2, the S and SdNR bands of the iodinated inserts overlapped substantially with the background bands, particularly for Siemens and GE (see Figure 5). These findings confirm that adopting 0.5 mg/cm2 as the threshold iodine area density [3,4] for calculating the Texture Cancellation Coefficient (TCC) is fully justified. TCC values were 0.04 ± 0.01 for Hologic, 0.06 ± 0.03 for GE, and 0.11 ± 0.06 for Siemens (see Table 5). These values fall within the low-TCC regime established in the literature by Cockmartin et al. (TCC < 0.10 for Hologic and GE) [3] and Kim et al. (TCC < 0.05 for Hologic, TCC < 0.20 for GE) [4], demonstrating that realistic anatomical texture is effectively suppressed by DES algorithms.
The analysis of one-dimensional noise power spectra (1D-NPS) demonstrated that DES algorithms alter noise power characteristics across spatial frequencies (see Figure 8). At frequencies above 1.0 mm−1, Hologic and Siemens DES spectra exhibited rapid roll-offs beyond 1.5–2.0 mm−1, whereas GE maintained a smooth decay, indicating vendor-specific post-processing filters. Fitting the 1D-NPS to a power-law distribution (1D-NPS = αf−β) in the anatomically dominated band (0.25–1.0 mm−1) yielded exponents of β ≈ 3.1–4.0 for single-energy projections (LE and HE) (see Table 6), reflecting spatial correlations from tissue structures. These values align with those reported in the literature [21,25,31,32,33]. For the DES images, these values reduced to β ≈ 1.06–1.07 across all vendors. This expected reduction reproduces the findings of Hill et al. [33] and confirms that DES reduces the component of the noise associated with a structurally correlated background, approaching non-correlated quasi-stochastic noise (β ≈ 0). In the homogeneous phantom, β values were lower for all image types, showing compatible β values for both LE “for presentation” and DES images (0.58 ± 0.09 and 0.65 ± 0.07, respectively). The fact that β does not reach zero (β = 0, theoretical uncorrelated white noise) in the absence of a structural background is driven by residual low-frequency system non-uniformities, including uncorrected X-ray scatter and DES algorithm features. Furthermore, Siemens displayed a substantially higher noise amplitude (log(α) = 1.98) compared to Hologic (0.61) and GE (0.34), explaining why its elevated signal gain S does not yield superior SdNR (see Figure 5).
Discrete spectral peaks observed across all imaging systems at f ≈ 4.30 mm−1 and f ≈ 2.15 mm−1 reflect periodicities inherent to in the 3D printing process, corresponding to the 0.23 mm infill line spacing (f = 4.35 mm−1) and the 0.46 mm back-and-forth nozzle pass step size (f = 2.17 mm−1), respectively. To understand the manifestation of higher-order spatial harmonics, the spatial sampling frequency (fs = 1/p) and Nyquist limit (fn = fs/2) must be evaluated based on the pixel pitch (p) of each detector: Siemens operates at p = 0.085 mm (fs = 11.76 mm−1, fN = 5.88 mm−1), Hologic at p = 0.070 mm (fs = 14.29 mm−1, fN = 7.14 mm−1), and GE at p = 0.100 mm (fs = 10.00 mm−1, fN = 5.00 mm−1). Because the second harmonic of the infill line frequency (f = 2 × 4.35 mm−1 ≈ 8.70 mm−1) exceeds the Nyquist limit across all three systems, it undergoes spatial aliasing, folding back into the measurable spectrum at |fs − f|.
For Siemens, this aliased harmonic folds to |11.76 − 8.70| = 3.06 mm−1, producing the prominent discrete peak observed at 3.05 mm−1 (see Figure 8b). The high presampling Modulation Transfer Function (MTF) inherent in Siemens’ detector preserves high-frequency spatial harmonics prior to sampling, rendering the system particularly susceptible to aliasing [36,37]. In contrast, Hologic’s smaller pixel pitch shifts the folded harmonic out to 5.59 mm−1 (|14.29 − 8.70|), placing it near its Nyquist boundary (7.14 mm−1) and well beyond the primary spatial frequency range of interest. For the GE system, the aliased harmonic would theoretically fold to 1.30 mm−1; however, no discrete peak is observed. This absence is primarily driven by GE’s indirect-conversion thallium-doped cesium iodide (CsI:Tl) detector, where lateral optical light diffusion within the scintillator layer acts as a physical spatial low-pass filter prior to sampling, severely suppressing the presampling MTF at 8.70 mm−1 [36,37]. However, because all identified manufacturing peaks fall outside the designated 0.25–1.0 mm−1 fitting range, they did not introduce bias into the power-law estimation of the structural exponent β.
Total mean glandular doses (MGDCEM) obtained from DICOM headers across all vendor systems for the 4.8 cm 3D-printed phantom aligned closely with the literature values for phantoms of similar thickness, such as those reported by Ghetti et al. [8] (3.2 mGy for Hologic and 2.3 mGy for GE using the CIRS model 022 phantom) and Marshall et al. [11] (1.84 mGy for Hologic and 2.02 mGy for GE using a 5.0 cm PMMA/polyethylene phantom). It should be noted that these comparisons are for reference purposes only, as MGD values were taken directly from image headers under the assumption that Dance’s methodology was used. Furthermore, as expected, MGDLE > MGDHE [5,10,11], yielding MGDLE/MGDCEM values that closely reproduce those reported in the literature [5,8,10,11].
This study has several limitations. First, the phantom represents a single compressed breast volume with a fixed parenchymal architecture and, therefore, does not encompass the full spectrum of breast thicknesses, densities, and tissue patterns encountered in clinical practice. Consequently, its ability to represent the anatomical variability observed across the broader patient population is limited. Nevertheless, the printed phantom effectively reproduces the imaging characteristics of a heterogeneously dense breast, as demonstrated in a previous evaluation [25] using automated breast density assessment tools. The phantom images were classified as Volpara Density Grade 3 by the Volpara algorithm (Volpara Imaging Software 1.5.11; Mātakina, Wellington, New Zealand) and as BI-RADS Category C (Heterogeneously Dense) by Quantra (Hologic Inc., Bedford, MA, USA). Breasts in this category constitute one of the main target groups of denser breasts for CEM imaging [1,2].
Secondly, the design of the iodine inserts in the target plate represents another important limitation of this study. In clinical practice, breast lesions often exhibit complex morphologies, including irregular margins and, in some cases, radial spiculations. Furthermore, iodine uptake is typically heterogeneous rather than uniformly distributed within a well-defined region. In contrast, the iodine inserts used in this phantom consisted of simplified geometries with homogeneous iodine concentrations. Consequently, they do not fully replicate the morphological and contrast-enhancement characteristics of real breast lesions, which may limit the realism of the phantom and its ability to reproduce clinical imaging conditions.
As a final limitation, the evaluation of image quality metrics was based on a reduced number of repeated measurements (n = 3) and included only one imaging system from each vendor. Consequently, comparisons across vendors should be considered descriptive rather than inferential, as the differences observed may largely reflect the intrinsic variability and stochastic nature of system performance. Furthermore, all imaging systems evaluated in this study are actively used in routine clinical practice and operate under a high patient workload. As a result, their availability for research purposes was limited, restricting both the number of acquisitions that could be performed and the overall extent of the experimental evaluation.
Future work will leverage the presented 3D-printing framework to fabricate a broader family of patient-derived phantoms, covering a wide range of compressed thicknesses and glandular ratios. Specifically, these will focus on dense breast categories (BI-RADS C and D) featuring different parenchymal structures. In terms of lesion insertion, morphologically realistic targets will be added to future phantoms.
5. Conclusions
This study presented the design, fabrication, and evaluation of a patient-derived, 3D-printed modular anthropomorphic breast phantom for the assessment of contrast-enhanced mammography system performance. Across the three most-used systems, the phantom provides appropriate iodine signal linearity characterization. In addition, β values obtained from the three systems are consistently included in the range (3–4) provided in the literature for patient images. Therefore, the background suppression efficiency of CEM algorithms can be characterized by the patient-derived structured background of the phantom.
Furthermore, the different local glandular ratio at the locations of the iodinated inserts provides information about the glandular ratio impact on the iodine signal. This local variability underscores the limitations of conventional homogeneous phantoms, which fail to capture the complex anatomical background texture and system-level subtraction artifacts present in clinical imaging. While in this work, lesions were simulated as iodinated disks with a single diameter, in future research, 3D-printed realistic tumors of different morphology and size will be considered. Realistic iodinated inserts, embedded into the glandular tissue, have the potential to provide a more clinically representative assessment of CEM image quality and lesion detectability.
Author Contributions
Conceptualization, A.B.; methodology, A.B., M.C. and I.H.-G.; software, A.B.; validation, A.B. and M.C.; formal analysis, A.B.; investigation, A.B.; resources, A.B., M.C. and P.H.; data curation, A.B.; writing—original draft preparation, A.B., M.C., I.H.-G., P.H., I.H.-G. and D.G.-P.; writing—review and editing, A.B., M.C. and I.H.-G.; visualization, A.B.; supervision, A.B., M.C. and P.H.; project administration, M.C., I.H.-G. and D.G.-P.; funding acquisition, M.C., I.H.-G. and D.G.-P. All authors have read and agreed to the published version of the manuscript.
Funding
This research was funded by the Spanish Ministry of Science and Innovation, grant number PID 2021-123390OB-C22.
Institutional Review Board Statement
Not applicable.
Informed Consent Statement
Not applicable.
Data Availability Statement
Data, STL files and images supporting the findings of this article are available from the corresponding authors upon reasonable request.
Acknowledgments
The authors acknowledge the Centro de Patología de la Mama (Madrid, Spain) and the Radiologic Protection Department of the Hospital de la Princesa (Madrid, Spain) for their valuable collaboration in image acquisitions, which supported the experimental measurements of this study.
Conflicts of Interest
The authors declare no conflicts of interest.
Abbreviations
The following abbreviations are used in this manuscript:
| CEM | Contrast-Enhanced Mammography |
| LE | Low-Energy |
| HE | High-Energy |
| DES | Dual-Energy Subtracted |
| DM | Digital Mammography |
| DBT | Digital Breast Tomosynthesis |
| breast-CT | Breast Computed Tomography |
| FFF | Fused Filament Fabrication |
| SLA | Stereolithography |
| MSLA | Masked Stereolithography |
| STL | Standard Triangle Language |
| ROI | Region Of Interest |
| MPV | Mean Pixel Value |
| SdNR | Signal-difference-to-Noise Ratio |
| NPS | Noise Power Spectrum |
| MGD | Mean Glandular Dose |
| PLA | Polylactic Acid |
| ABS | Acrylonitrile Butadiene Styrene |
| PETG | Polyethylene Terephthalate Glycol |
| PMMA | Polymethyl Methacrylate |
Appendix A
The effective attenuation coefficients μeff of the 3D-printed and reference materials as a function of step thickness for low-energy (LE) and high-energy (HE) conditions are shown in Fig. A1a and Fig. A1b, respectively. For LE conditions, a monotonic decrease in μeff with increasing thickness was observed as expected. In contrast, in the HE acquisitions, μeff increased with thickness up to approximately 1.5 cm, beyond which a plateau was observed. The apparent trend at small thicknesses should be interpreted with caution, as larger uncertainties in μeff were found in this region. Overall, 3D-printed materials and their corresponding reference materials yielded comparable μeff values, with relative differences at common thicknesses below 3%, 5% and 2% for PLA–CIRS glandular, ABS–CIRS adipose and PETG–PMMA pairs, respectively.
Figure A1.
Effective X-ray attenuation coefficients (µeff) as a function of material thickness for 3D-printed materials (filled markers) and reference materials (open markers) for (a) low-energy (LE) and (b) high-energy (HE) acquisitions. Error bars indicate 1σ uncertainties.
It should be noted that while the phantom was experimentally evaluated across Hologic, Siemens, and GE systems, the material attenuation equivalence was specifically established using the Hologic system and a previous model from Siemens [26,27]. Future work will involve dedicated material characterization tailored to the specific beam qualities of the models from Siemens and GE used in this study.
Appendix B
The dual-nozzle configuration was critical to eliminate cross-material contamination, thus preventing nozzle occlusion from the contrasting thermal and rheological properties of PLA and ABS printed together in the phantom. Although the proprietary filament spools incorporated integrated radio-frequency identification (RFID) tags for automated material recognition and pre-configured thermal profiling, the default printer firmware strictly prohibited the concurrent co-printing of polymers classified as chemically incompatible (such as PLA and ABS). To bypass this firmware restriction and allow simultaneous execution, the physical RFID tags were removed from the spools, and the generic PLA profile was used. The specific extrusion temperatures and optimal velocity profiles for each individual polymer were subsequently overwritten and configured manually within the slicing engine (Bambu Studio).
To prevent thermal delamination and warping during the 3D-printing of the plates, a textured polyetherimide build plate combined with a specialized adhesive layer was utilized (both from Bambu Lab), omitting the use of a raft or brim structure. Environmental thermal management within the printing chamber was optimized by removing the top glass enclosure panel and keeping the front chamber door partially open. A nozzle diameter of 0.2 mm was selected to maximize internal spatial resolution, constraining the printing speed to 100 mm/s to guarantee structural fidelity. To reduce the air trapped between extruded lines, the line width was set to 0.23 mm, i.e., larger than the nozzle size. Furthermore, all external perimeters (wall lines) and solid horizontal boundaries (top and bottom layers) were omitted from the printing path, rendering the entire plate volume as a continuous, uninterrupted internal infill matrix.
This matrix was instantiated using a continuous Zig-Zag pattern featuring alternating layer orientations (45°/135°) subjected to a successive 1° angular shift executed every two layers. This pathing strategy successfully disrupted the periodic vertical alignment of the extruded lines, minimizing potential grid-like infill artifacts on the images [25].
Appendix C
Low-energy and recombined phantom images for the Hologic (Figure A2), Siemens (Figure A3), and GE (Figure A4) systems are displayed in a large-format layout. Annotations in each image mark the precise locations of the iodinated and gland-like inserts, alongside annotations highlighting vendor-specific artifacts.
Figure A2.
Phantom images acquired in a Hologic system: (a) low-energy “for presentation” image and (b) recombined image. Blue stars indicate iodinated inserts with iodine area density of 1.5 mg/cm2, and the red star, the gland-like insert. Green arrows point to edge artifacts resulting from the stacking of individual plates. The orange dashed curve delineates the “breast-in-breast” artifact.
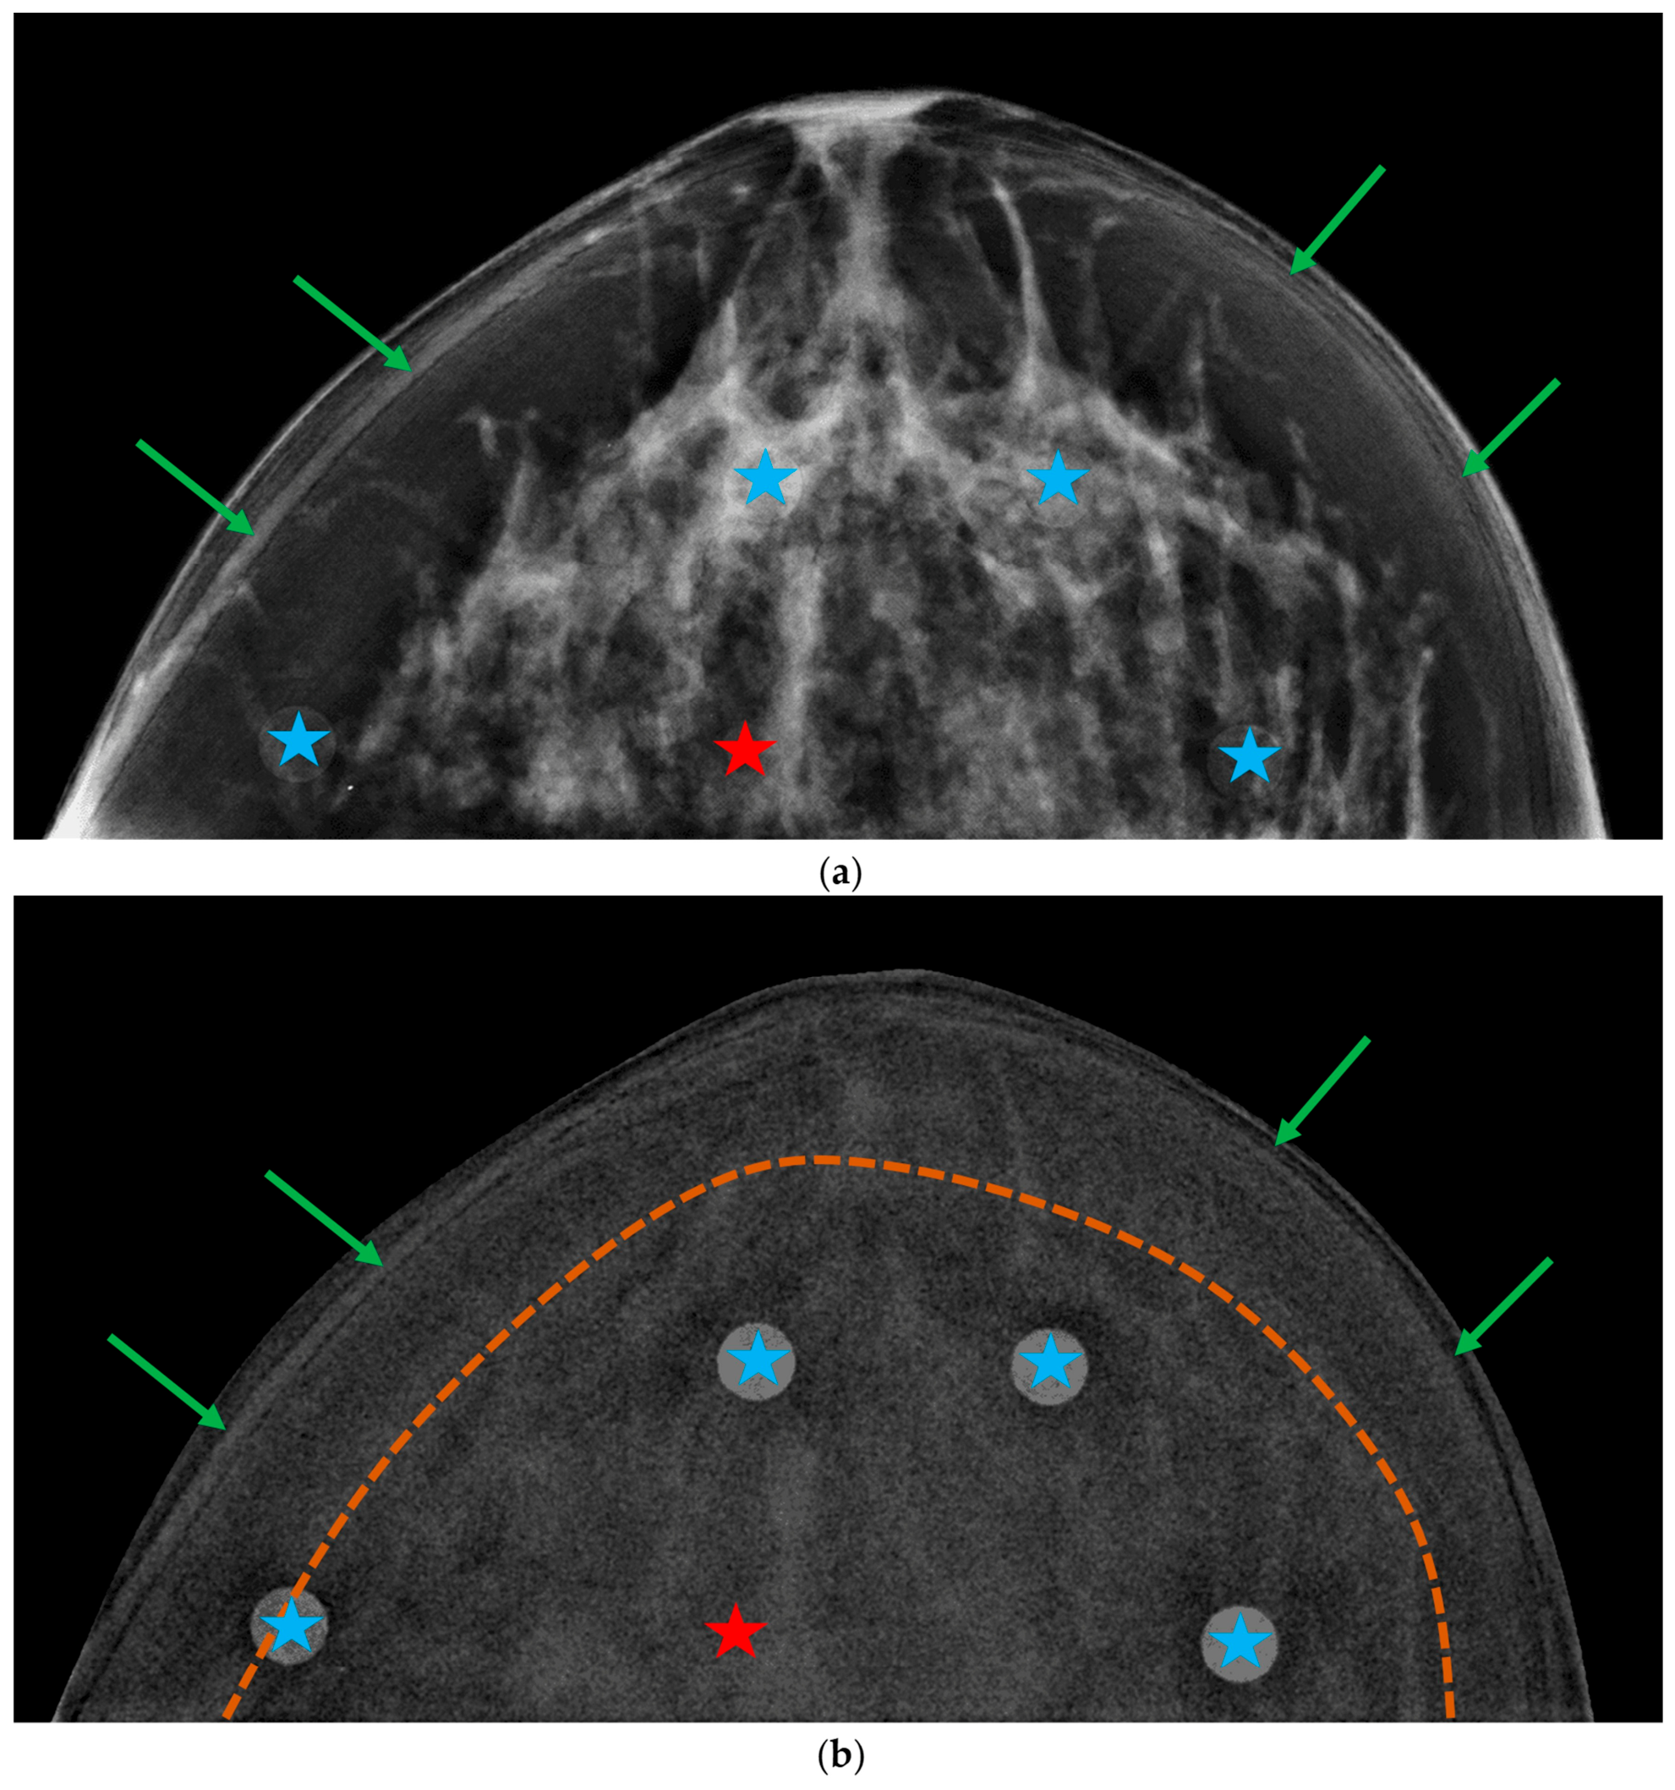
Figure A3.
Phantom images acquired in a Siemens system: (a) low-energy “for presentation” image and (b) recombined image. Blue stars indicate iodinated inserts with iodine area density of 1.5 mg/cm2, and the red star, the gland-like insert. Green arrows point to edge artifacts resulting from the stacking of individual plates. The yellow dashed curve delineates a slight gradient between the central region of the breast and the curved breast edge.
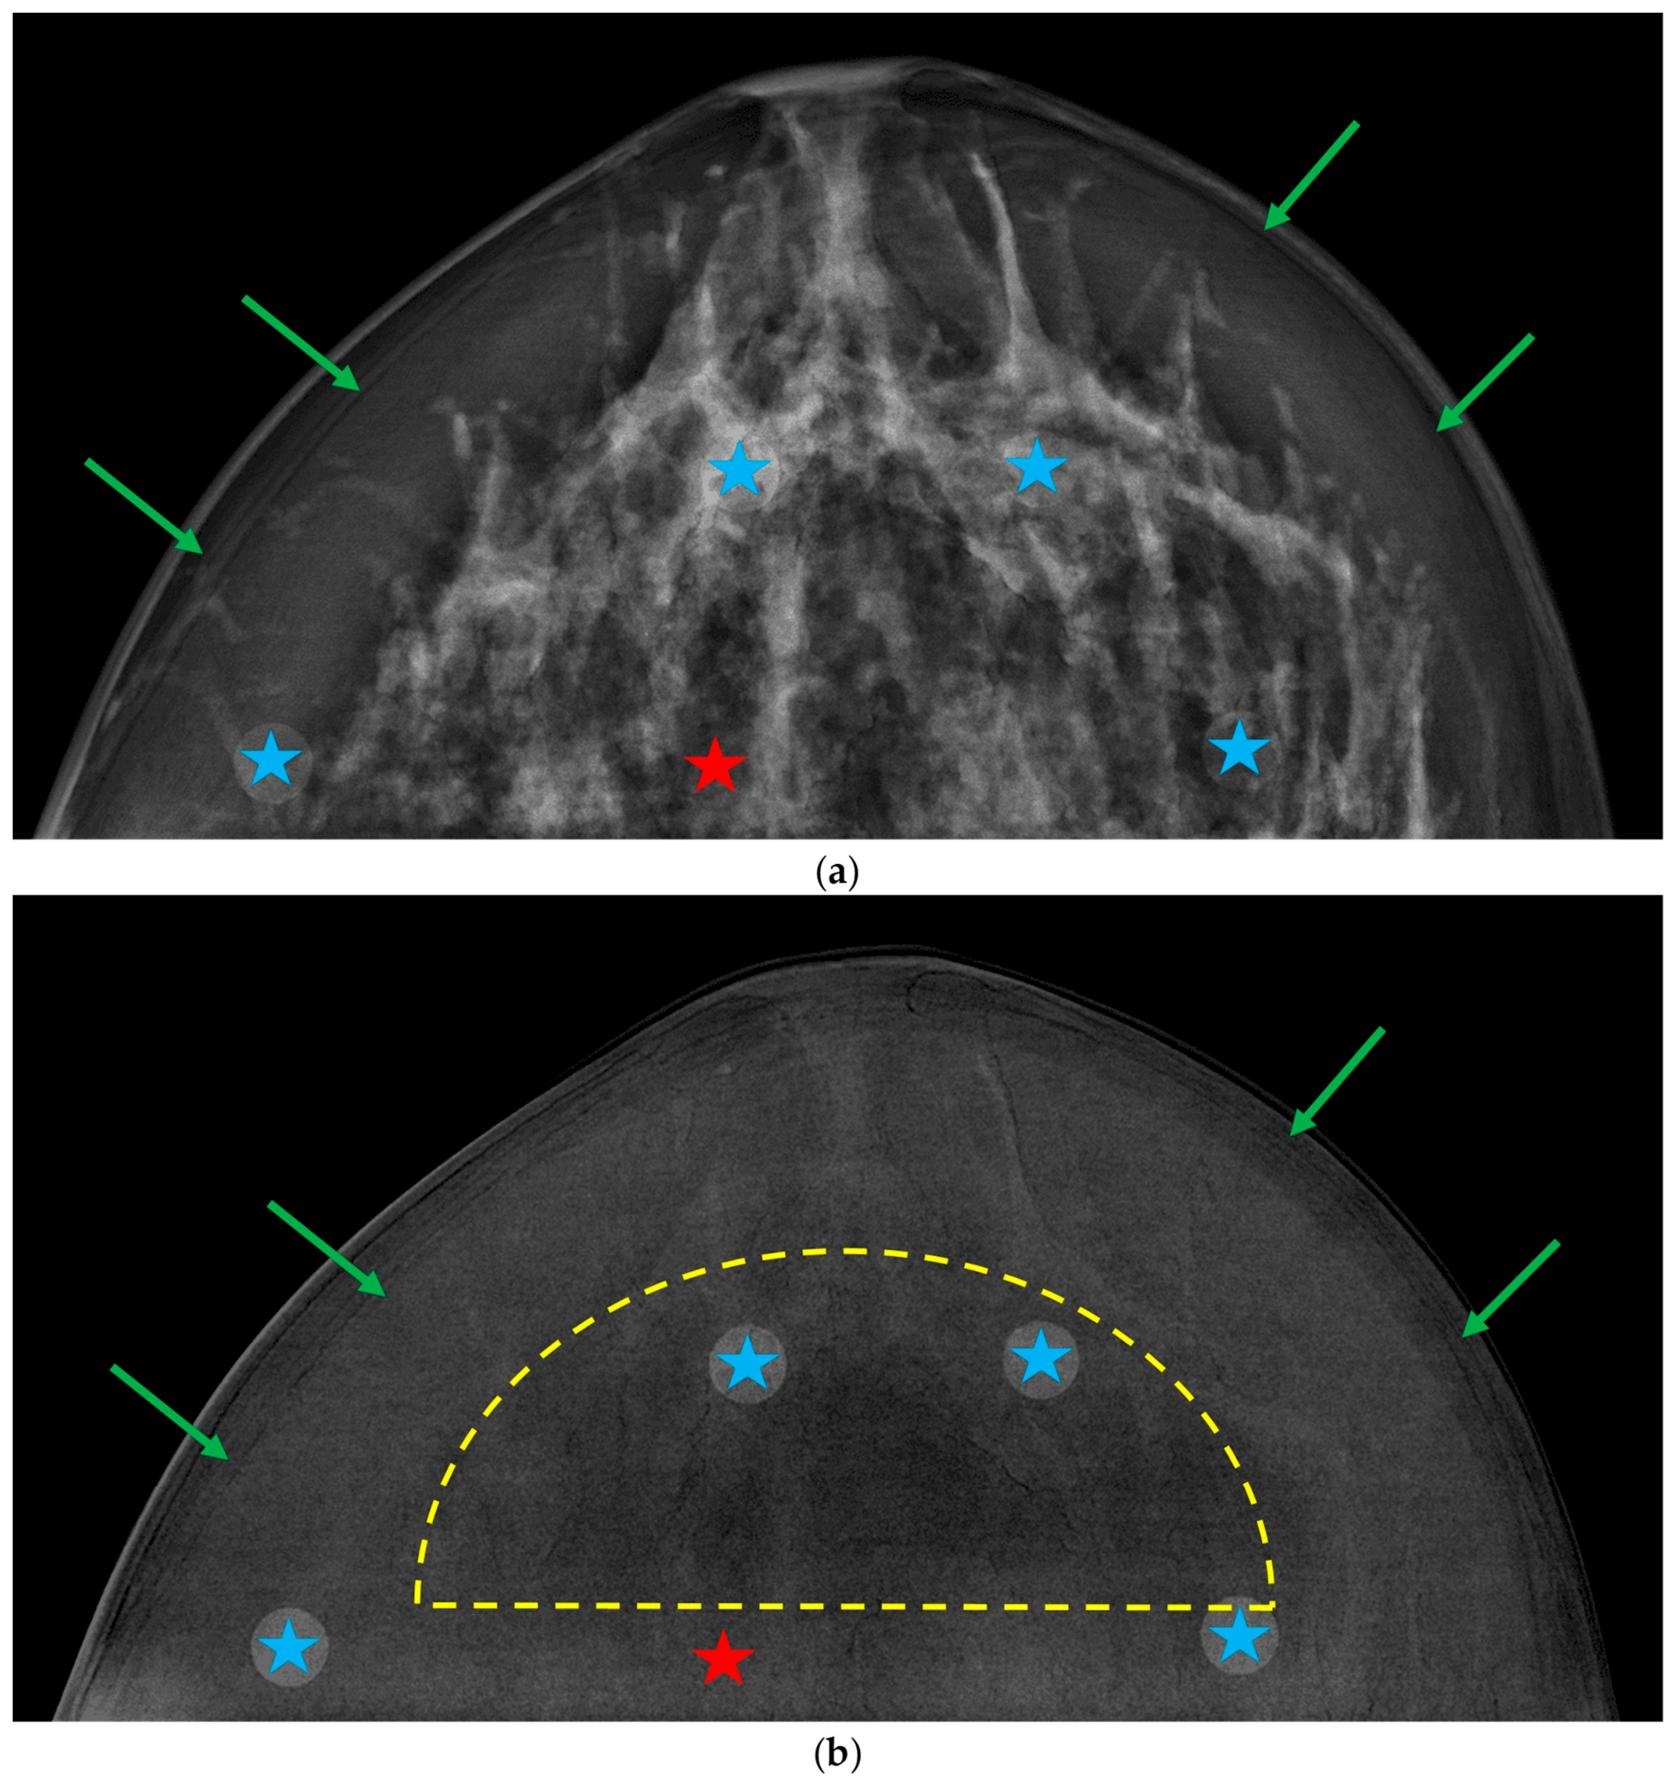
Figure A4.
Phantom images acquired in a GE system: (a) low-energy “for presentation” image and (b) recombined image. Blue stars indicate iodinated inserts with iodine area density of 1.5 mg/cm2, and the red star, the gland-like insert. Green arrows point to edge artifacts resulting from the stacking of individual plates.
References
- Jochelson, M.S.; Lobbes, M.B.I. Contrast-enhanced mammography: State of the art. Radiology 2021, 299, 36–48. [Google Scholar] [CrossRef] [Scilit] [PubMed]
- Chung, W.S.; Tang, Y.C.; Cheung, Y.C. Contrast-Enhanced Mammography: A Literature Review of Clinical Uses for Cancer Diagnosis and Surgical Oncology. Cancers 2024, 16, 4143. [Google Scholar] [CrossRef] [Scilit] [PubMed]
- Cockmartin, L.; Bosmans, H.; Marshall, N.W. Investigation of test methods for QC in dual-energy based contrast-enhanced digital mammography systems: I. Iodine signal testing. Phys. Med. Biol. 2023, 68, 5017. [Google Scholar] [CrossRef] [Scilit] [PubMed]
- Kim, J.H.; Kessell, M.; Taylor, D.; Hill, M.; Burrage, J.W. The verification of the utility of a commercially available phantom combination for quality control in contrast-enhanced mammography. Phys. Eng. Sci. Med. 2024, 47, 1491–1499. [Google Scholar] [CrossRef] [Scilit] [PubMed]
- Gennaro, G.; Cozzi, A.; Schiaffino, S.; Sardanelli, F.; Caumo, F. Radiation Dose of Contrast-Enhanced Mammography: A Two-Center Prospective Comparison. Cancers 2022, 14, 1774. [Google Scholar] [CrossRef] [Scilit] [PubMed]
- Gennaro, G.; Vatteroni, G.; Bernardi, D.; Caumo, F. Performance of dual-energy subtraction in contrast-enhanced mammography for three different manufacturers: A phantom study. Eur. Radiol. Exp. 2024, 8, 113. [Google Scholar] [CrossRef] [Scilit] [PubMed]
- Bruschi, G.; Ricciardi, V.; De Marco, P.; Origgi, D. Phantom-based comparative analysis of contrast-enhanced mammography systems: Image quality and performance evaluation. J. Appl. Clin. Med. Phys. 2025, 26, e70163. [Google Scholar] [CrossRef] [Scilit] [PubMed]
- Ghetti, C.; Ortenzia, O.; Pagan, L.; Golinelli, P.; Nitrosi, A.; Sghedoni, R.; Ravaglia, V.; Verzellesi, L.; Angelini, L.; Venturi, G.; et al. Physical and dosimetric characterisation of different Contrast-Enhanced digital mammographic systems: A multicentric study. Phys. Med. 2024, 120, 103334. [Google Scholar] [CrossRef] [Scilit] [PubMed]
- Klausz, R.; Rouxel, M.; Mancardi, X.; Carton, A.K.; Jeunehomme Patoureaux, F. Introduction of a comprehensive phantom for the quality control of contrast enhanced spectral mammography. In Proceedings of the European Congress of Radiology (ECR), Vienna, Austria, 28 February 2018. [Google Scholar]
- Gennaro, G. Phantom-based analysis of variations in automatic exposure control across three mammography systems: Implications for radiation dose and image quality in mammography, DBT, and CEM. Eur. Radiol. Exp. 2024, 8, 49. [Google Scholar] [CrossRef] [Scilit] [PubMed]
- Marshall, N.W.; Cockmartin, L.; Bosmans, H. Investigation of test methods for QC in dual-energy based contrast-enhanced digital mammography systems: II. Artefacts/uniformity, exposure time and phantom-based dosimetry. Phys. Med. Biol. 2023, 68, 215017. [Google Scholar] [CrossRef] [Scilit] [PubMed]
- Houbrechts, K.; Cockmartin, L.; Vancoillie, L.; Massera, R.T.; Marshall, N.; Bosmans, H. Impact of common artefacts on mass visibility in contrast-enhanced mammography: A virtual imaging trial. Med. Phys. 2026, 53, e70326. [Google Scholar] [CrossRef] [Scilit] [PubMed]
- Santos, J.C.; Almeida, C.D.; Iwahara, A.; Peixoto, J.E. Characterization and applicability of low-density materials for making 3D physical anthropomorphic breast phantoms. Rad. Phys. Chem. 2019, 164, 108361. [Google Scholar] [CrossRef] [Scilit]
- Cockmartin, L.; Marshall, N.W.; Zhang, G.; Lemmens, K.; Shaheen, E.; Van Ongeval, C.; Fredenberg, E.; Dance, D.R.; Salvagnini, E.; Michielsen, K.; et al. Design and application of a structured phantom for detection performance comparison between breast tomosynthesis and digital mammography. Phys. Med. Biol. 2017, 62, 758–780. [Google Scholar] [CrossRef] [Scilit] [PubMed]
- Caballo, M.; Boone, J.M.; Mann, R.; Sechopoulos, I. An unsupervised automatic segmentation algorithm for breast tissue classification of dedicated breast computed tomography images. Med. Phys. 2018, 45, 2542–2559. [Google Scholar] [CrossRef] [Scilit] [PubMed]
- Sarno, A.; Mettivier, G.; di Franco, F.; Varallo, A.; Bliznakova, K.; Hernandez, A.M.; Boone, J.M.; Russo, P. Dataset of patient-derived digital breast phantoms for in silico studies in breast computed tomography, digital breast tomosynthesis, and digital mammography. Med. Phys. 2021, 48, 2682–2693. [Google Scholar] [CrossRef] [Scilit] [PubMed]
- Erickson, D.W.; Wells, J.R.; Sturgeon, G.M.; Samei, E.; Dobbins, J.T., III; Segars, W.P.; Lo, J.Y. Population of 224 realistic human subject-based computational breast phantoms. Med. Phys. 2015, 43, 23–32. [Google Scholar] [CrossRef] [Scilit] [PubMed]
- Caballo, M.; Mann, R.; Sechopoulos, I. Patient-based 4D digital breast phantom for perfusion contrast-enhanced breast CT Imaging. Med. Phys. 2018, 45, 4448–4460. [Google Scholar] [CrossRef] [Scilit] [PubMed]
- Li, C.M.; Segars, W.P.; Tourassi, G.D.; Boone, J.M.; Dobbins, J.T., III. Methodology for generating a 3D computerized breast phantom from empirical data. Med. Phys. 2009, 36, 3131–3222. [Google Scholar] [CrossRef] [Scilit] [PubMed]
- Pacheco, G.; Michielsen, K.; García, E.; Díaz, O.; Sechopoulos, I. Optimization and validation of a mechanical compression model for digital breast phantoms in mammography and tomosynthesis simulations. Med. Phys. 2025, 52, e17980. [Google Scholar] [CrossRef] [Scilit] [PubMed]
- Varallo, A.; Sarno, A.; Castriconi, R.; Mazzilli, A.; Loria, A.; del Vecchio, A.; Scampoli, M.I.; Veronese, I.; Giuseppina, G.; De Monte, F.; et al. Fabrication of 3D printed patient-derived anthropomorphic breast phantoms for mammography and digital breast tomosynthesis: Imaging assessment with clinical X-ray spectra. Phys. Med. 2022, 98, 89–97. [Google Scholar] [CrossRef] [Scilit] [PubMed]
- Dukov, N.; Nastev, V.; Petkova, V.; Buliev, I.; Bliznakov, Z.; Dobreva, V.; Bliznakova, K. A Comprehensive Evaluation of 3D-Printed Breast Phantoms: Impacts of Printing Technology and STL Processing on Multimodal Fidelity. Technologies 2026, 14, 426. [Google Scholar] [CrossRef] [Scilit]
- Sarno, A.; Valero, C.; Tucciariello, R.M.; Dukov, N.; Costa, P.R.; Tomal, A. Physical and digital phantoms for 2D and 3D x-ray breast imaging: Review on the state-of-the-art and future prospect. Rad. Phys. Chem. 2023, 204, 110715. [Google Scholar] [CrossRef] [Scilit]
- Cano-Vicent, A.; Tambuwala, M.; Hassan, S.S.; Barh, D.; Aljabali, A.A.A.; Birkett, M.; Arjunan, A.; Serrano-Aroca, Á. Fused Deposition Modelling: Current Status, Methodology, Applications and Future Prospects. Addit. Manuf. 2021, 47, 102378. [Google Scholar] [CrossRef] [Scilit]
- Belarra, A.; Chevalier, M.; García, E.; Hernández-Girón, I.; Castillo-García, M.; García-Pinto, D.; Martí, R. Impact of 3D-printing infill patterns on anatomical noise in an anthropomorphic breast phantom for DM and DBT. In Proceedings of the 18th International Workshop on Breast Imaging (IWBI), Thessaloniki, Greece, 30 June 2026. [Google Scholar]
- Belarra, A.; Hernández-Girón, I.; Garayoa, J.; Martínez, L.C.; Valverde, J.; Rot, M.J.; Ferrando, A.; Martín, A.; Chevalier, M. Experimental determination of effective X-ray attenuation coefficients of 3D-printed materials under clinical mammography spectra. Front. Bioeng. Biotechnol. 2026, 13, 1719551. [Google Scholar] [CrossRef] [Scilit] [PubMed]
- Belarra, A.; Hernández-Girón, I.; Castillo-García, M.; Homolka, P.; Chevalier, M. Impact of dopants on X-ray attenuation of 3D-printed polymers for mammography and tomosynthesis spectra. J. Appl. Clin. Med. Phys. 2026, 27, e70739. [Google Scholar] [CrossRef] [Scilit] [PubMed]
- Ivanov, D.; Bliznakova, K.; Buliev, I.; Popov, P.; Mettivier, G.; Russo, P.; Di Lillo, F.; Sarno, A.; Vignero, J.; Bosmans, H.; et al. Suitability of low density materials for 3D printing of physical breast phantoms. Phys. Med. Biol. 2018, 63, 175020. [Google Scholar] [CrossRef] [Scilit] [PubMed]
- Homolka, P.; Breyer, L.; Semturs, F. 3D Printing Materials Mimicking Human Tissues after Uptake of Iodinated Contrast Agents for Anthropomorphic Radiology Phantoms. Biomimetics 2024, 9, 606. [Google Scholar] [CrossRef] [Scilit] [PubMed]
- Burgess, A.E. Mammographic structure: Data preparation and spatial statistics analysis. In Proceedings of the SPIE Medical Imaging, San Diego, CA, USA, 21 May 1999. [Google Scholar] [CrossRef] [Scilit]
- Abbey, C.K.; Eckstein, M.P. Classification image analysis of detection and discrimination tasks in breast radiography. Med. Phys. 2002, 29, 869–880. [Google Scholar] [CrossRef] [Scilit] [PubMed]
- Cockmartin, L.; Bosmans, H.; Marshall, N.W. Comparative power law analysis of structured breast phantom and patient images in digital mammography and breast tomosynthesis. Med. Phys. 2013, 40, 081920. [Google Scholar] [CrossRef] [Scilit] [PubMed]
- Hill, M.L.; Mainprize, J.G.; Carton, A.K.; Saab-Puong, S.; Iordache, R.; Müller, S.; Yaffe, M.J.; Mawdsley, G.E. Anatomical noise in contrast-enhanced digital mammography. Part II. Dual-energy imaging. Med. Phys. 2013, 40, 081907. [Google Scholar] [CrossRef] [Scilit] [PubMed]
- Fedorov, A.; Beichel, R.; Kalpathy-Cramer, J.; Finet, J.; Fillion-Robin, J.-C.; Pujol, S.; Bauer, C.; Jennings, D.; Fennessy, F.; Sonka, M.; et al. 3D Slicer as an image computing platform for the Quantitative Imaging Network. Magn. Reson. Imaging 2012, 30, 1323–1341. [Google Scholar] [CrossRef] [Scilit] [PubMed]
- Leithner, R.; Knogler, T.; Homolka, P. Development and production of a prototype iodine contrast phantom for CEDEM. Phys. Med. Biol. 2013, 58, N25–N35. [Google Scholar] [CrossRef] [Scilit] [PubMed]
- Marshall, N.W.; Monnin, P.; Bosmans, H.; Bochud, F.O.; Verdun, F.R. Image quality assessment in digital mammography: Part I. Technical characterization of the systems. Phys. Med. Biol. 2011, 56, 4201–4220. [Google Scholar] [CrossRef] [Scilit] [PubMed]
- Wigati, K.T.; Marshall, N.W.; Lemmens, K.; Binst, J.; Jacobs, A.; Cockmartin, L.; Bosmans, H.; Van Ongeval, C.; Zanca, F.; Vanhoenacker, R. On the relevance of modulation transfer function measurements in digital mammography quality control. J. Med. Imaging 2021, 8, 023505. [Google Scholar] [CrossRef] [Scilit] [PubMed]
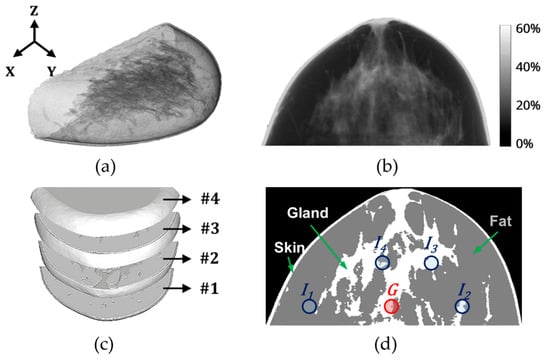
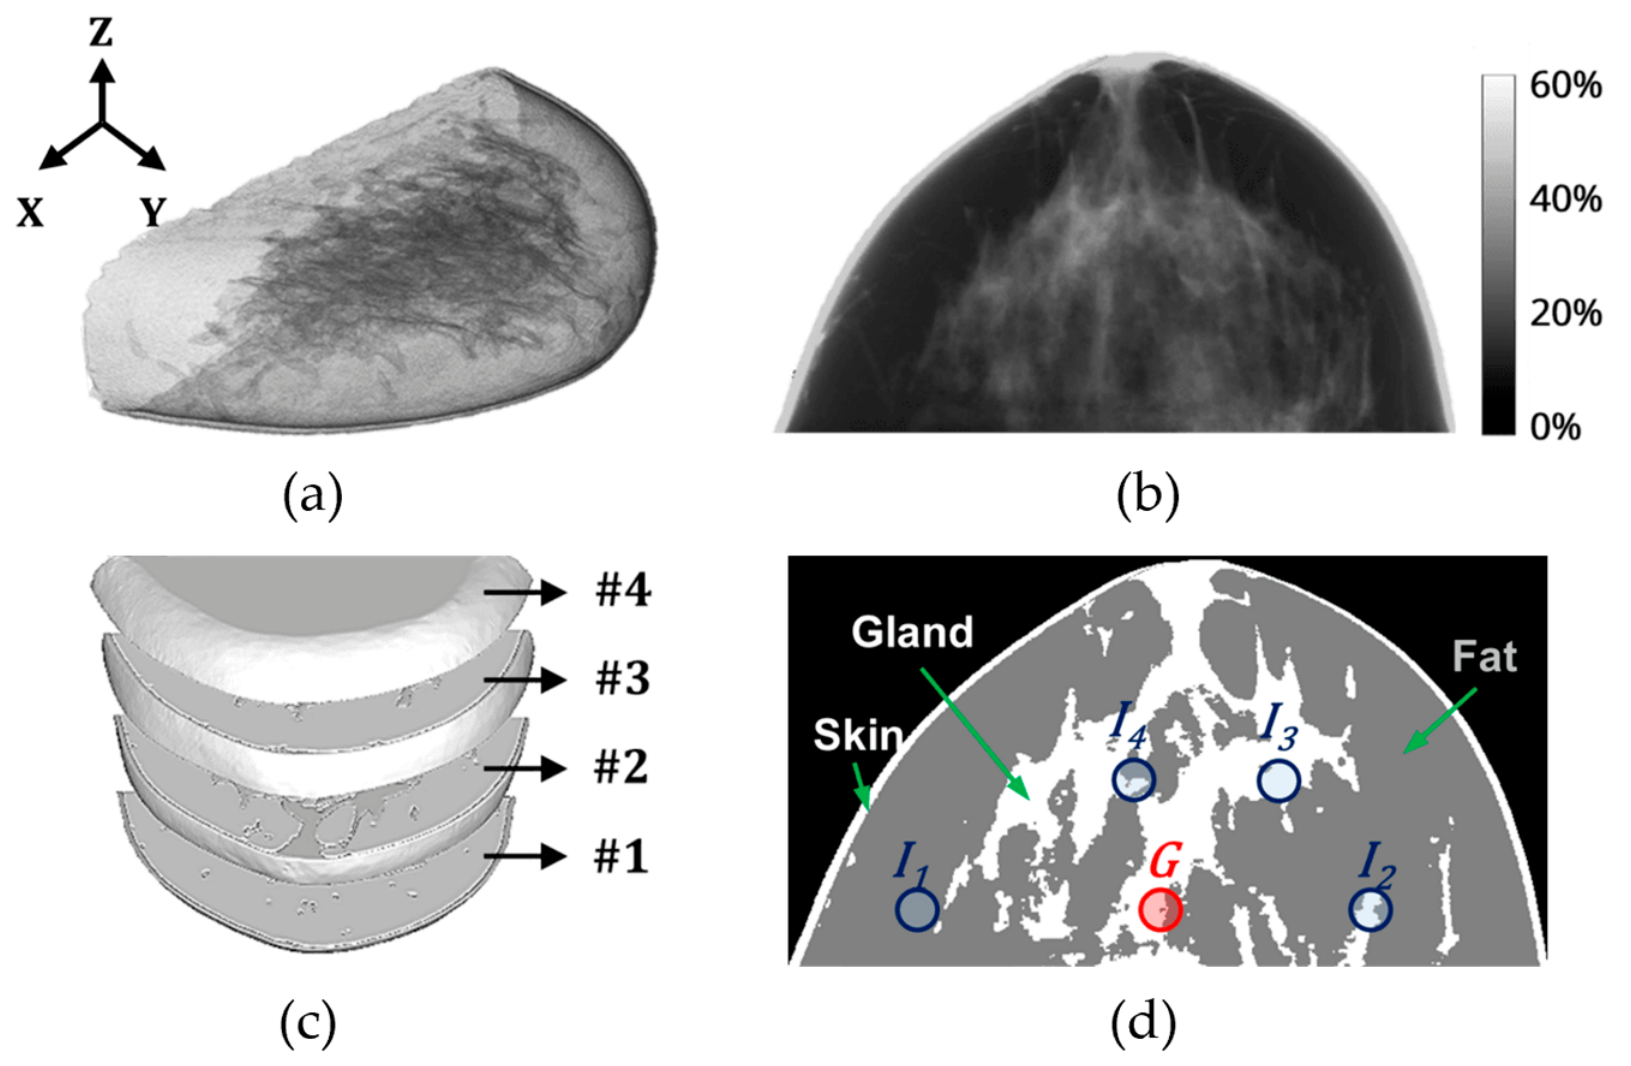
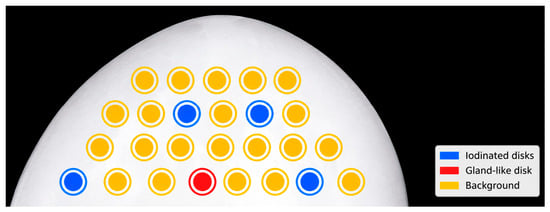
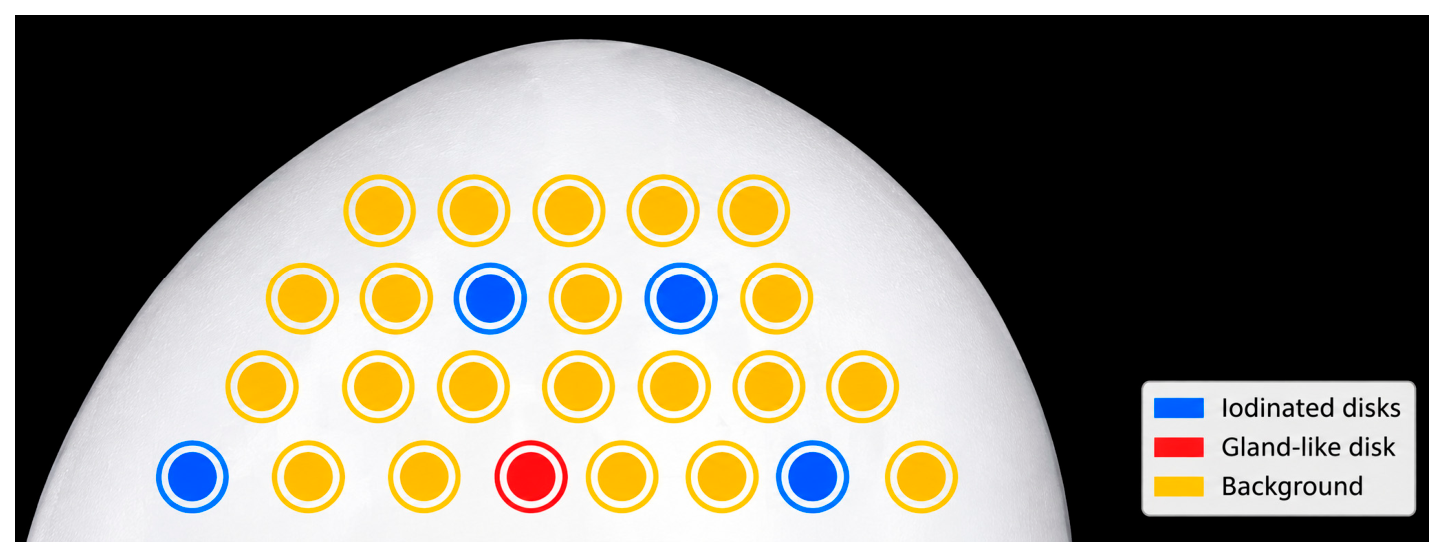
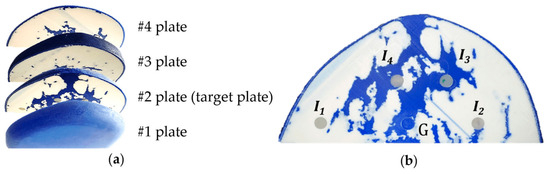
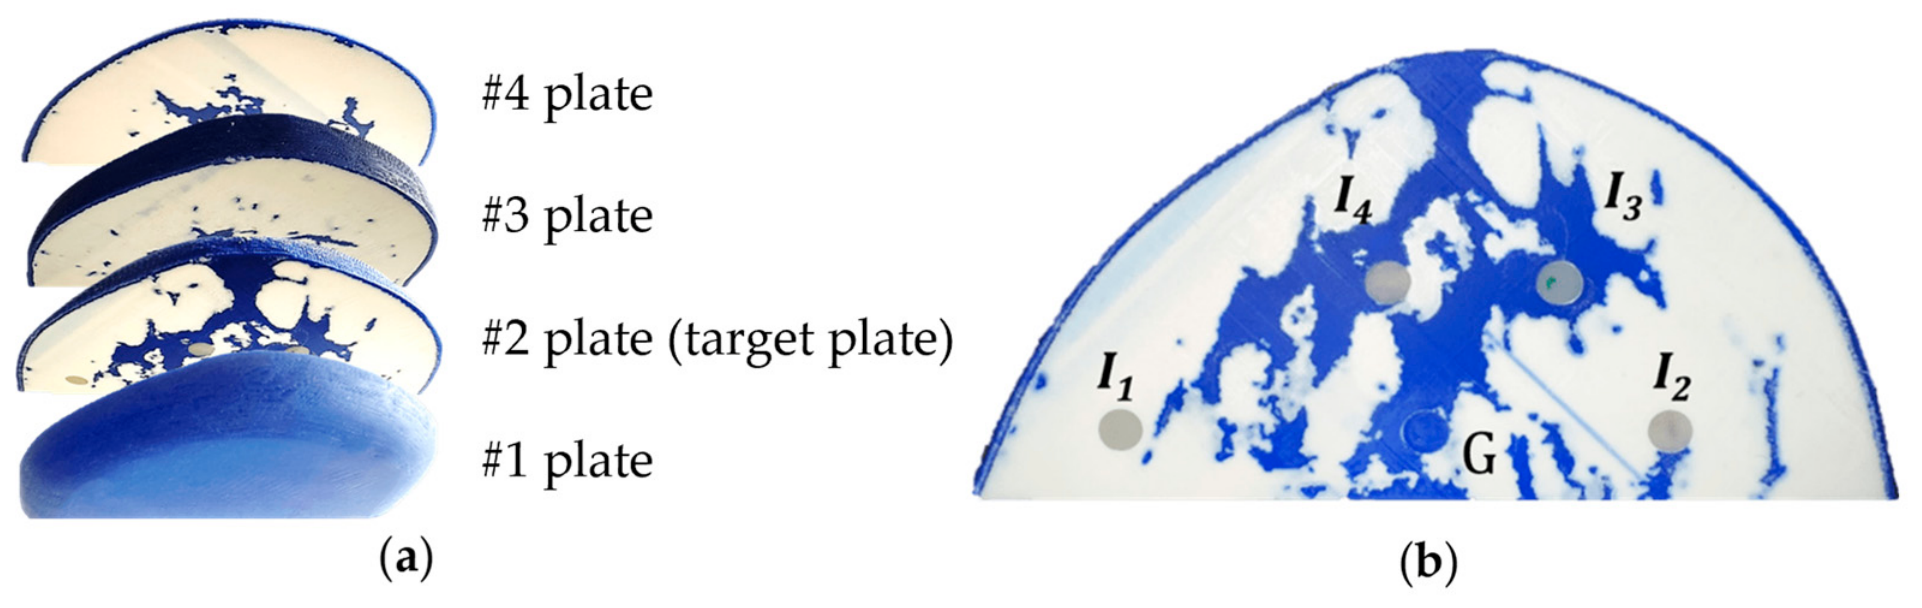
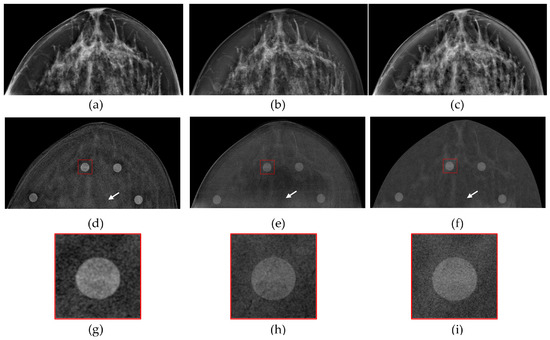
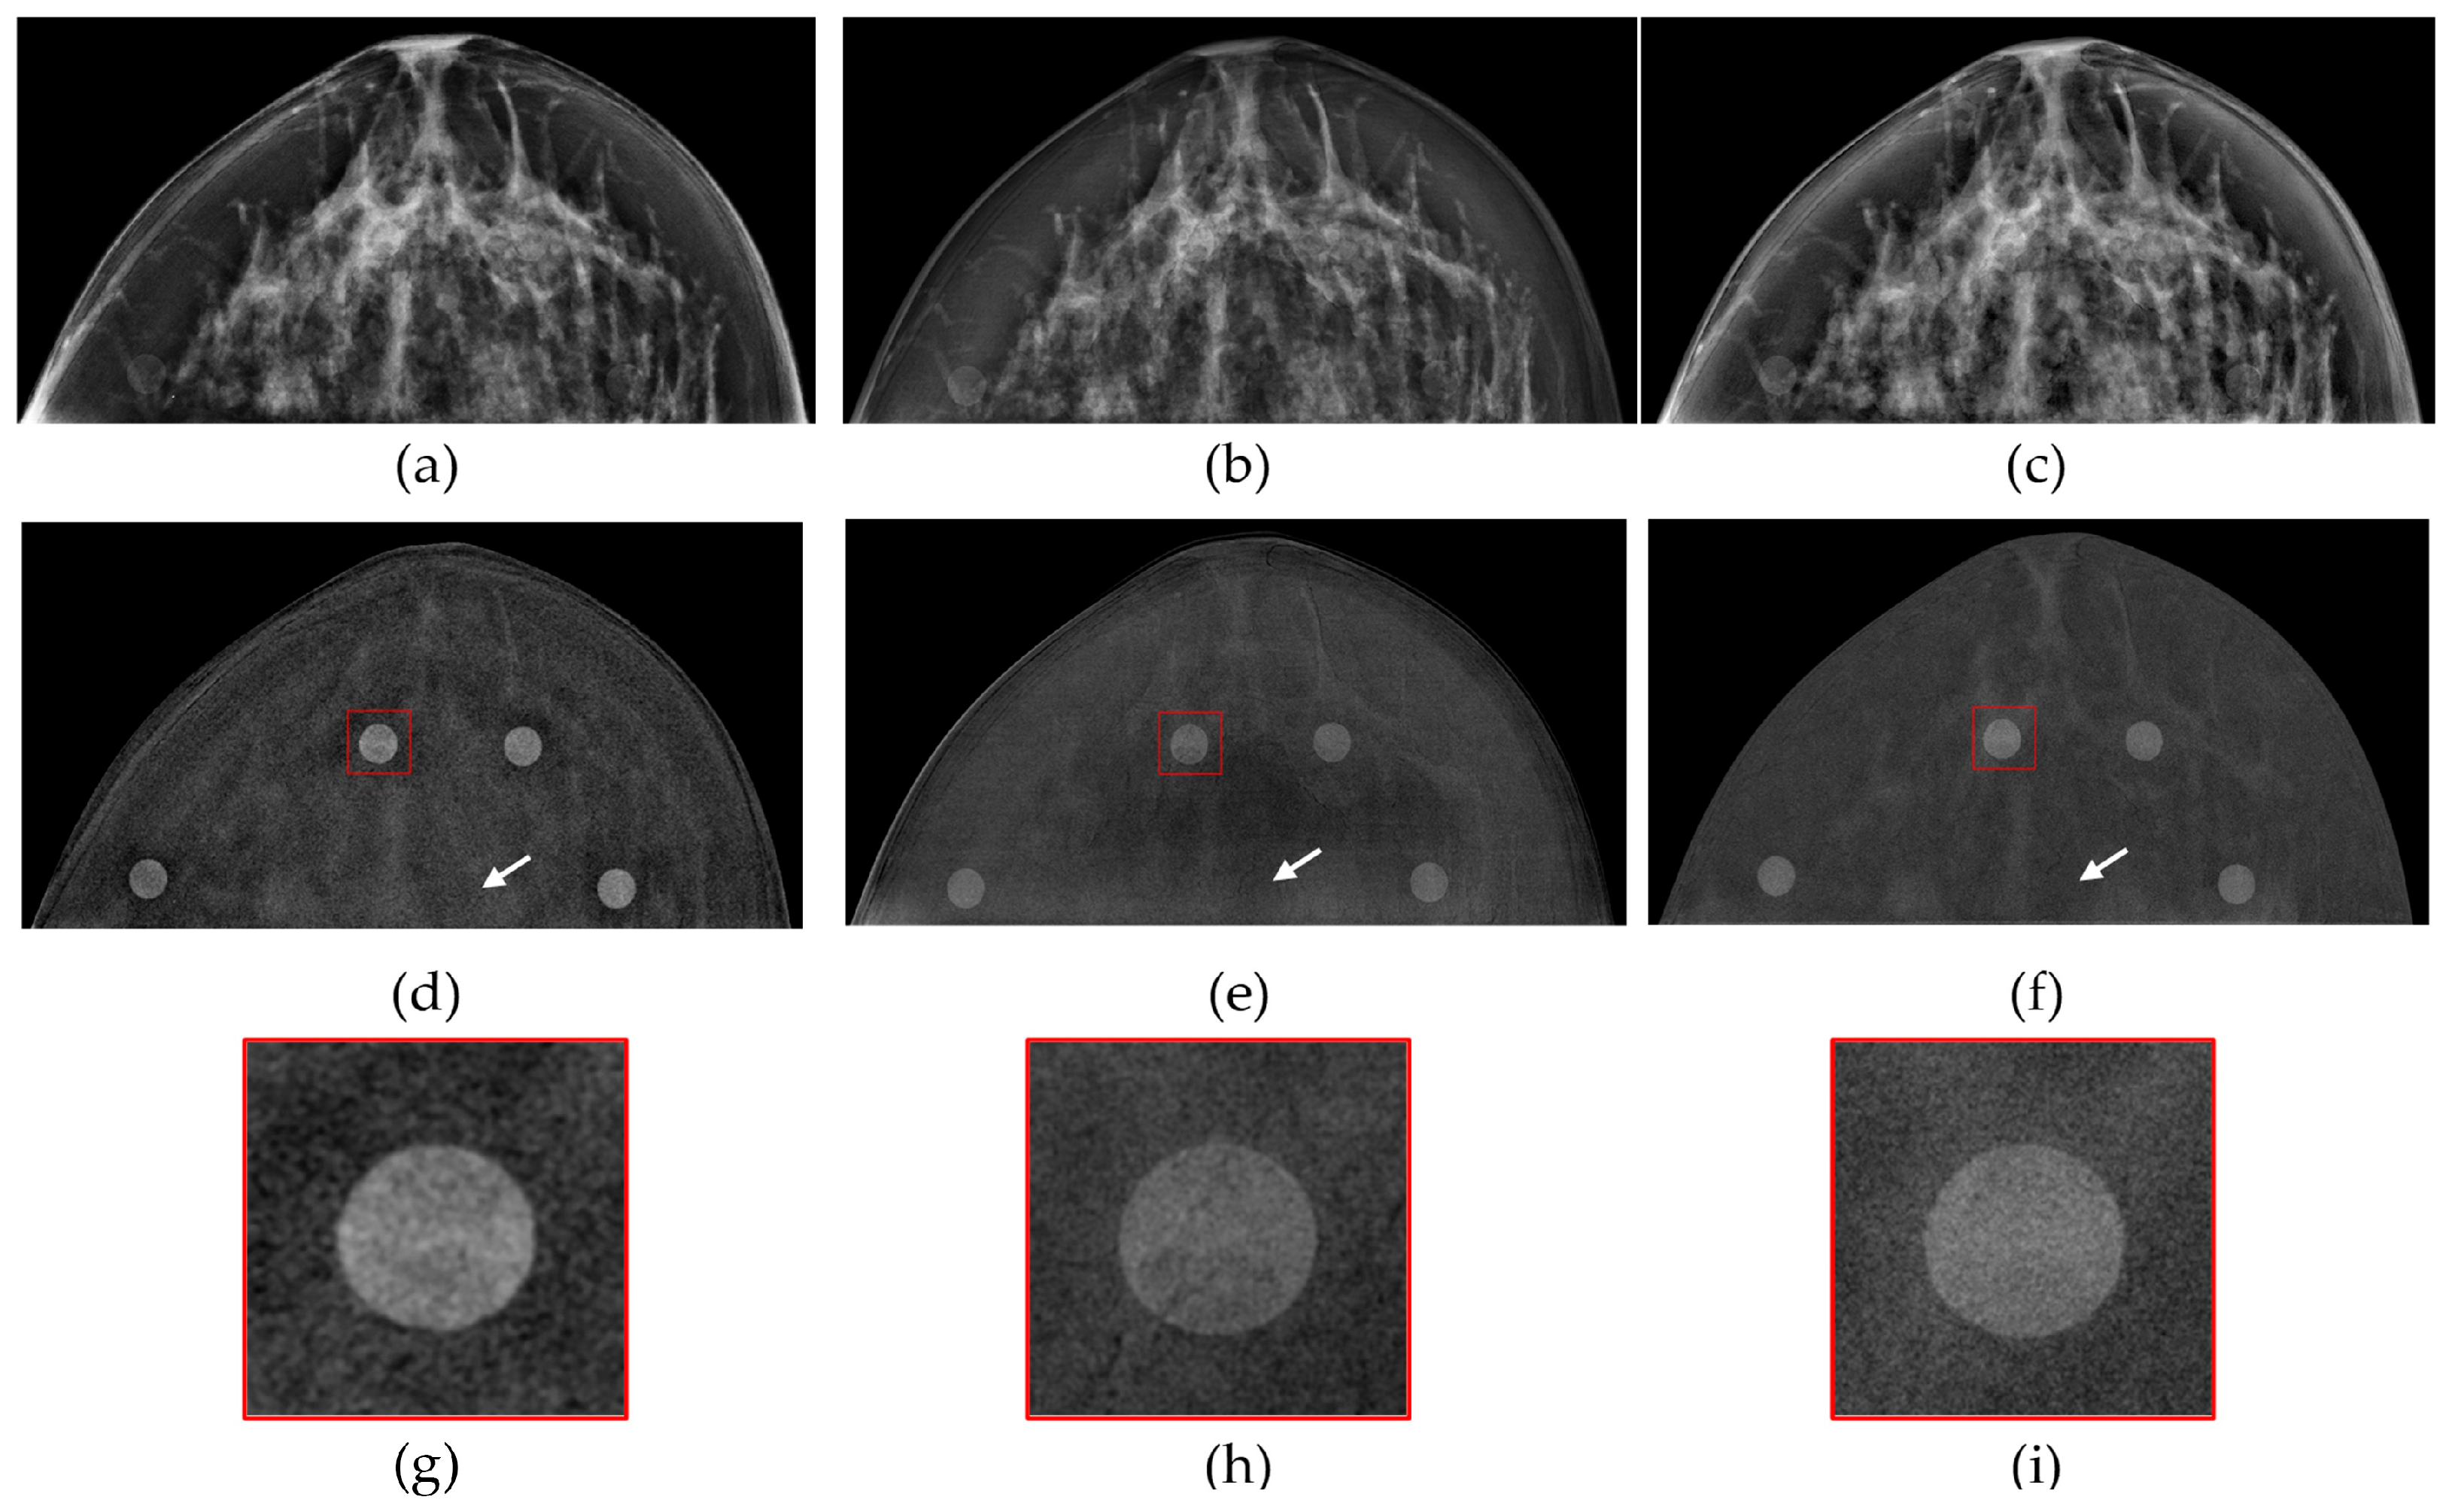
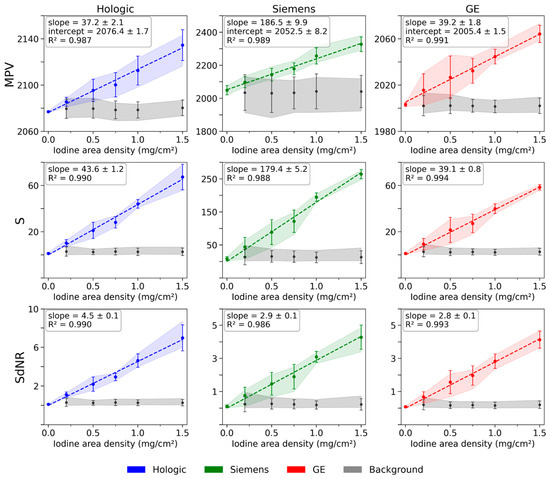
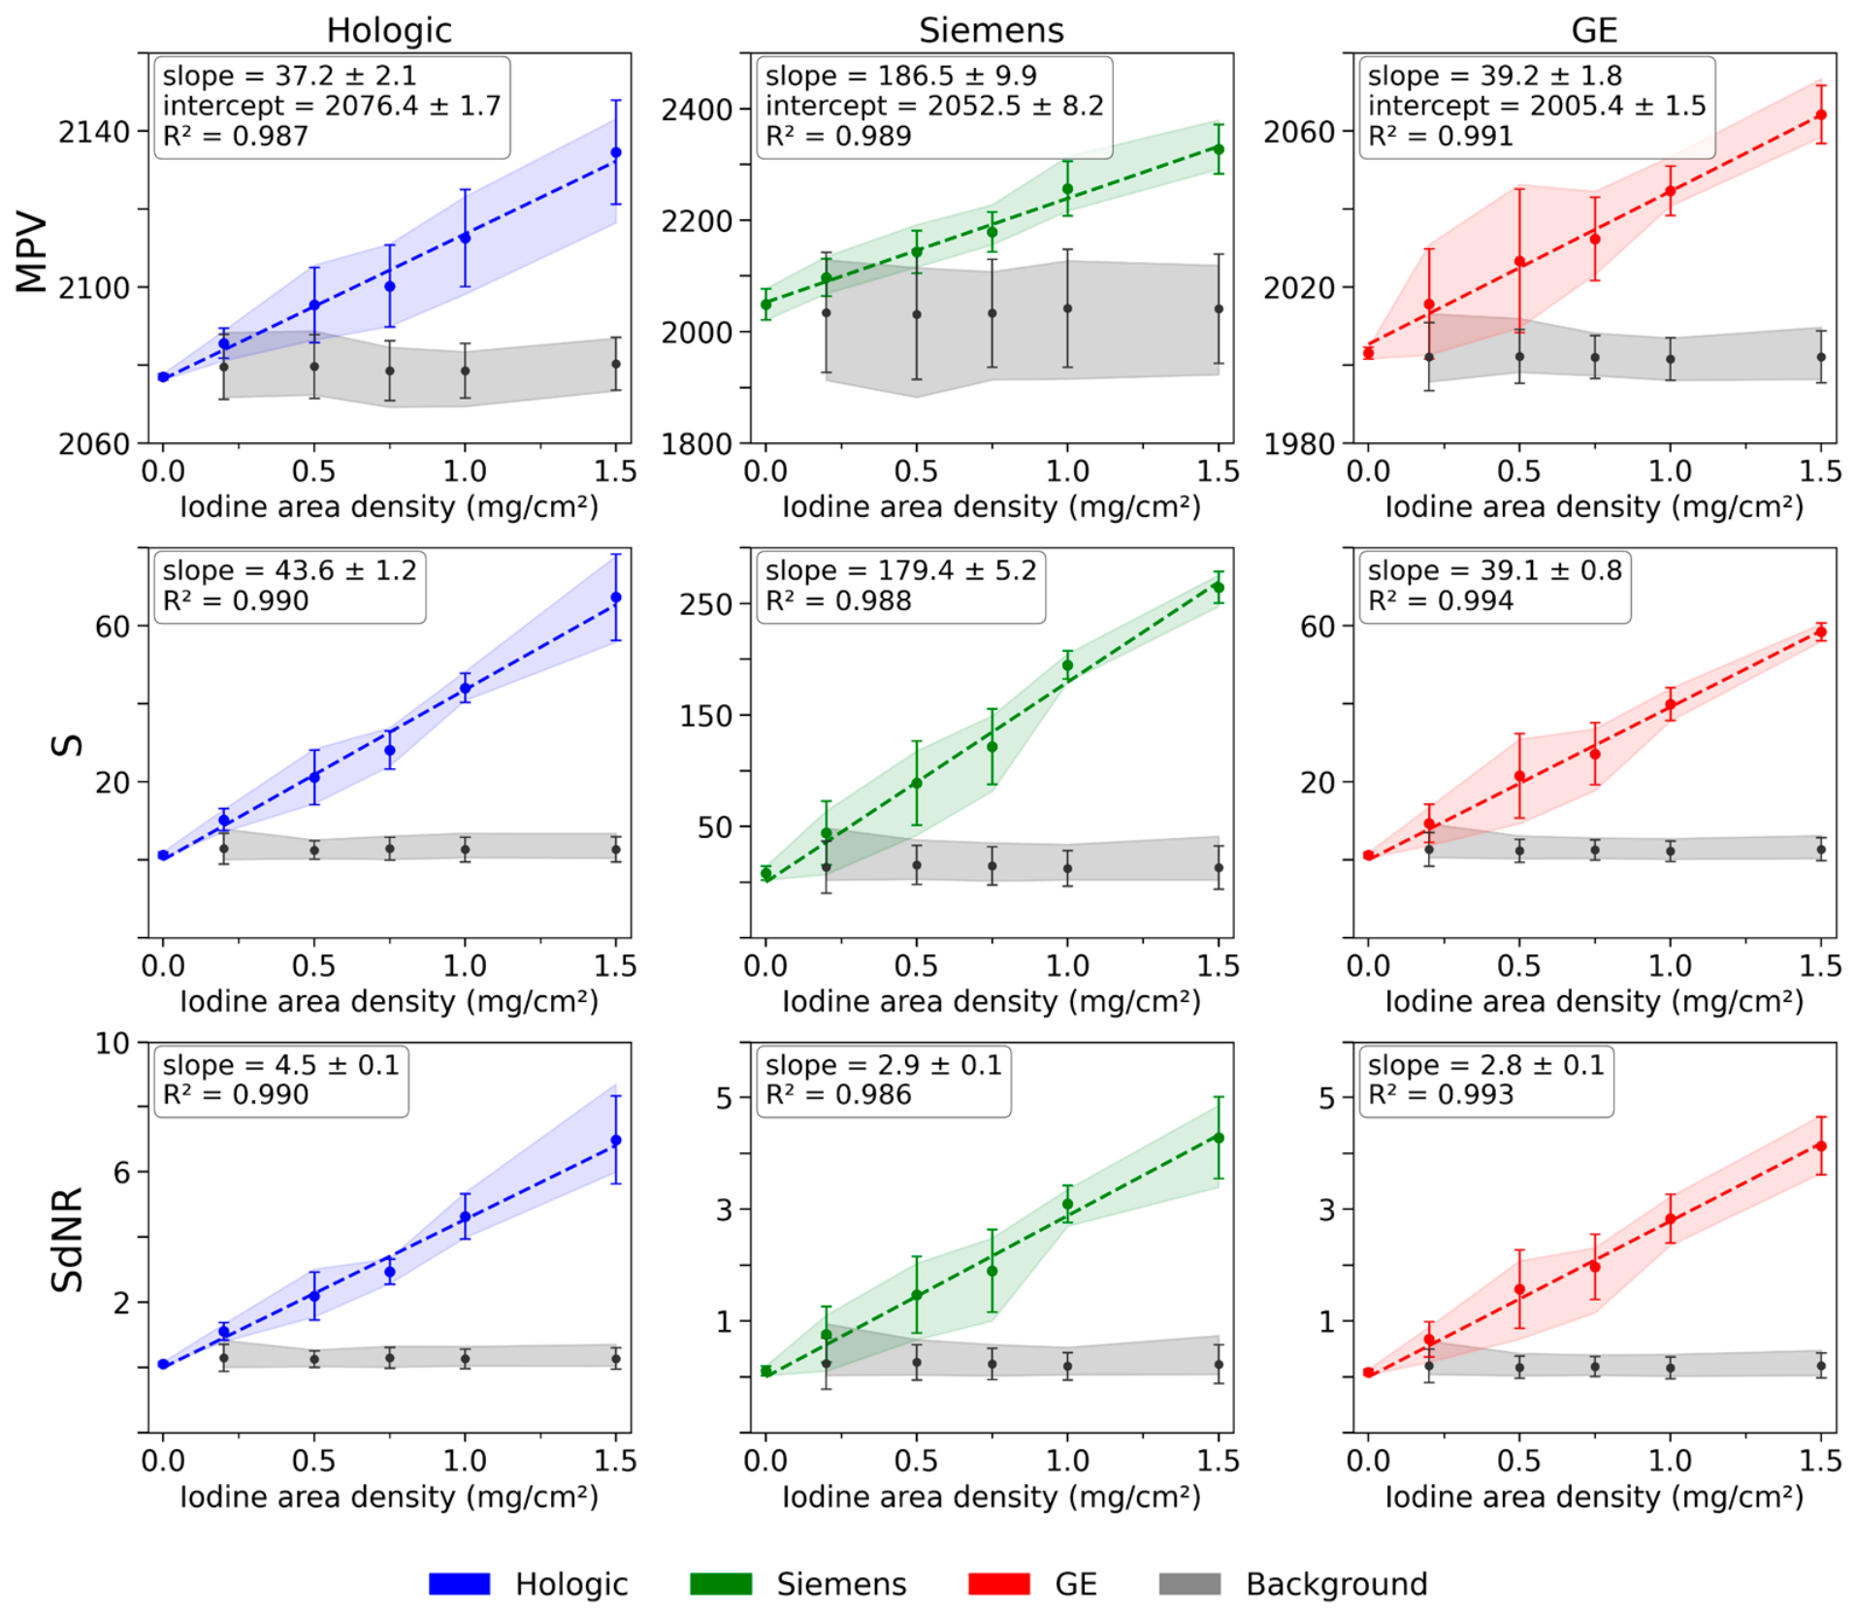
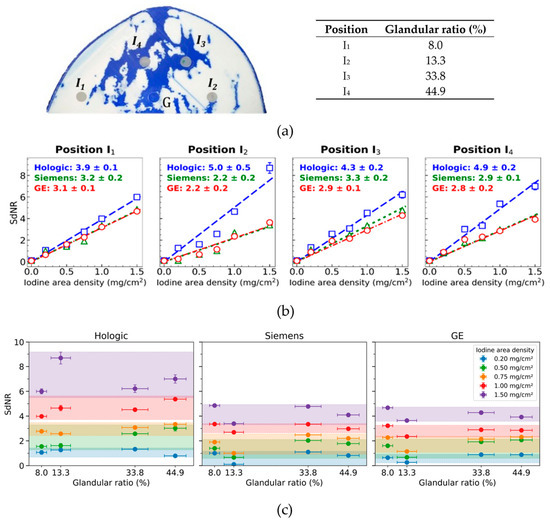
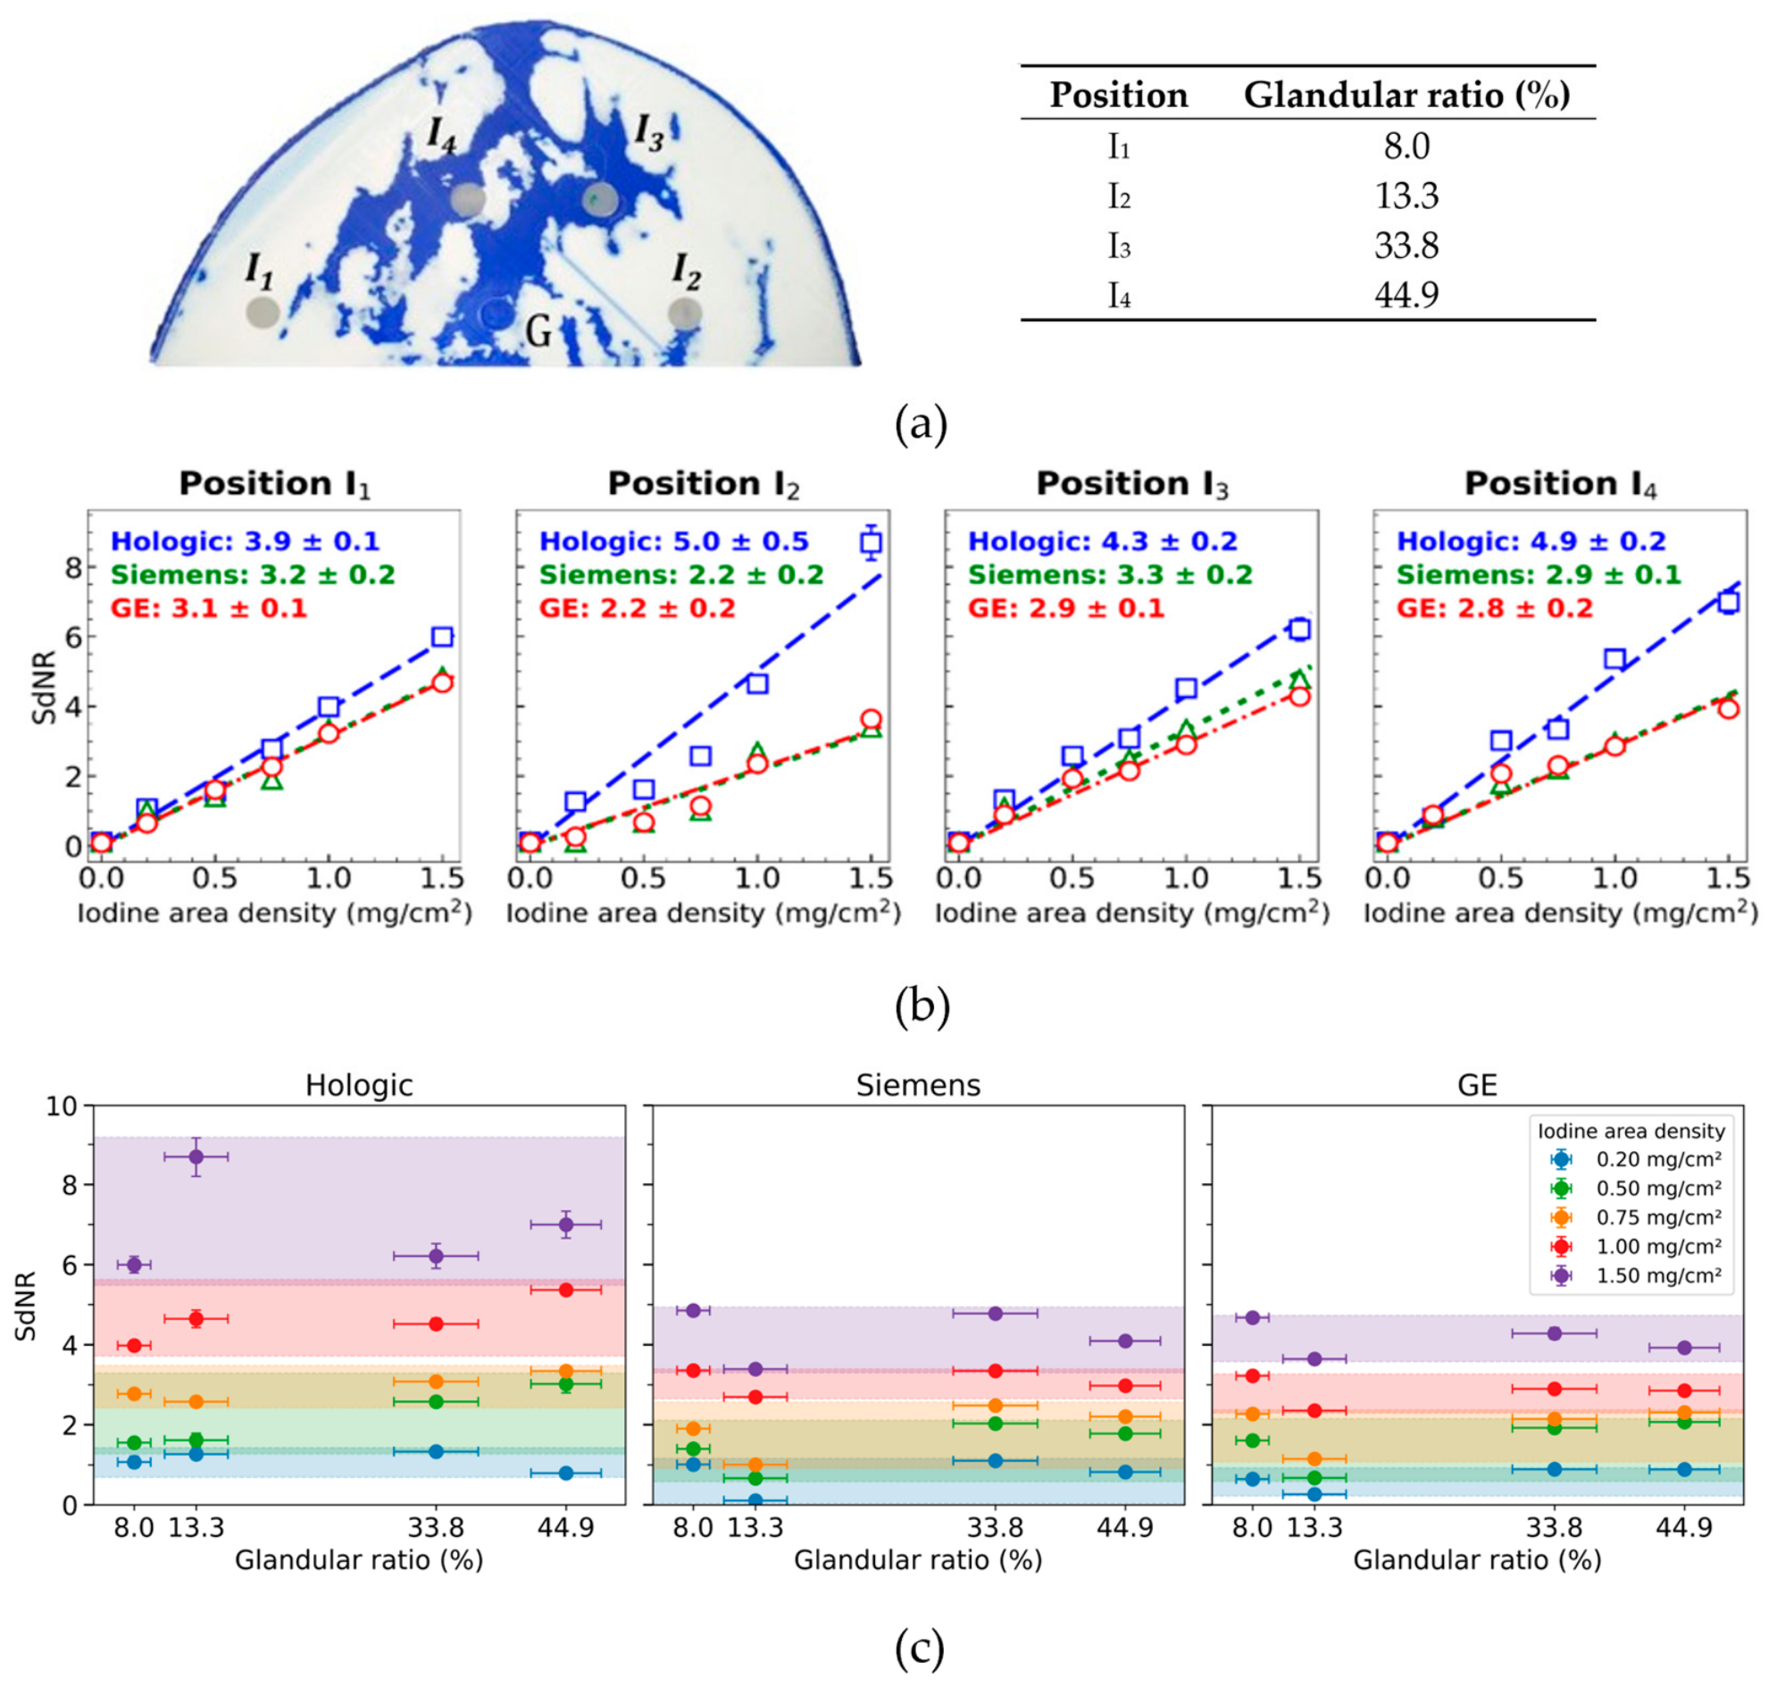
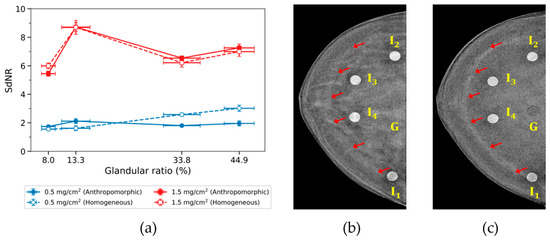
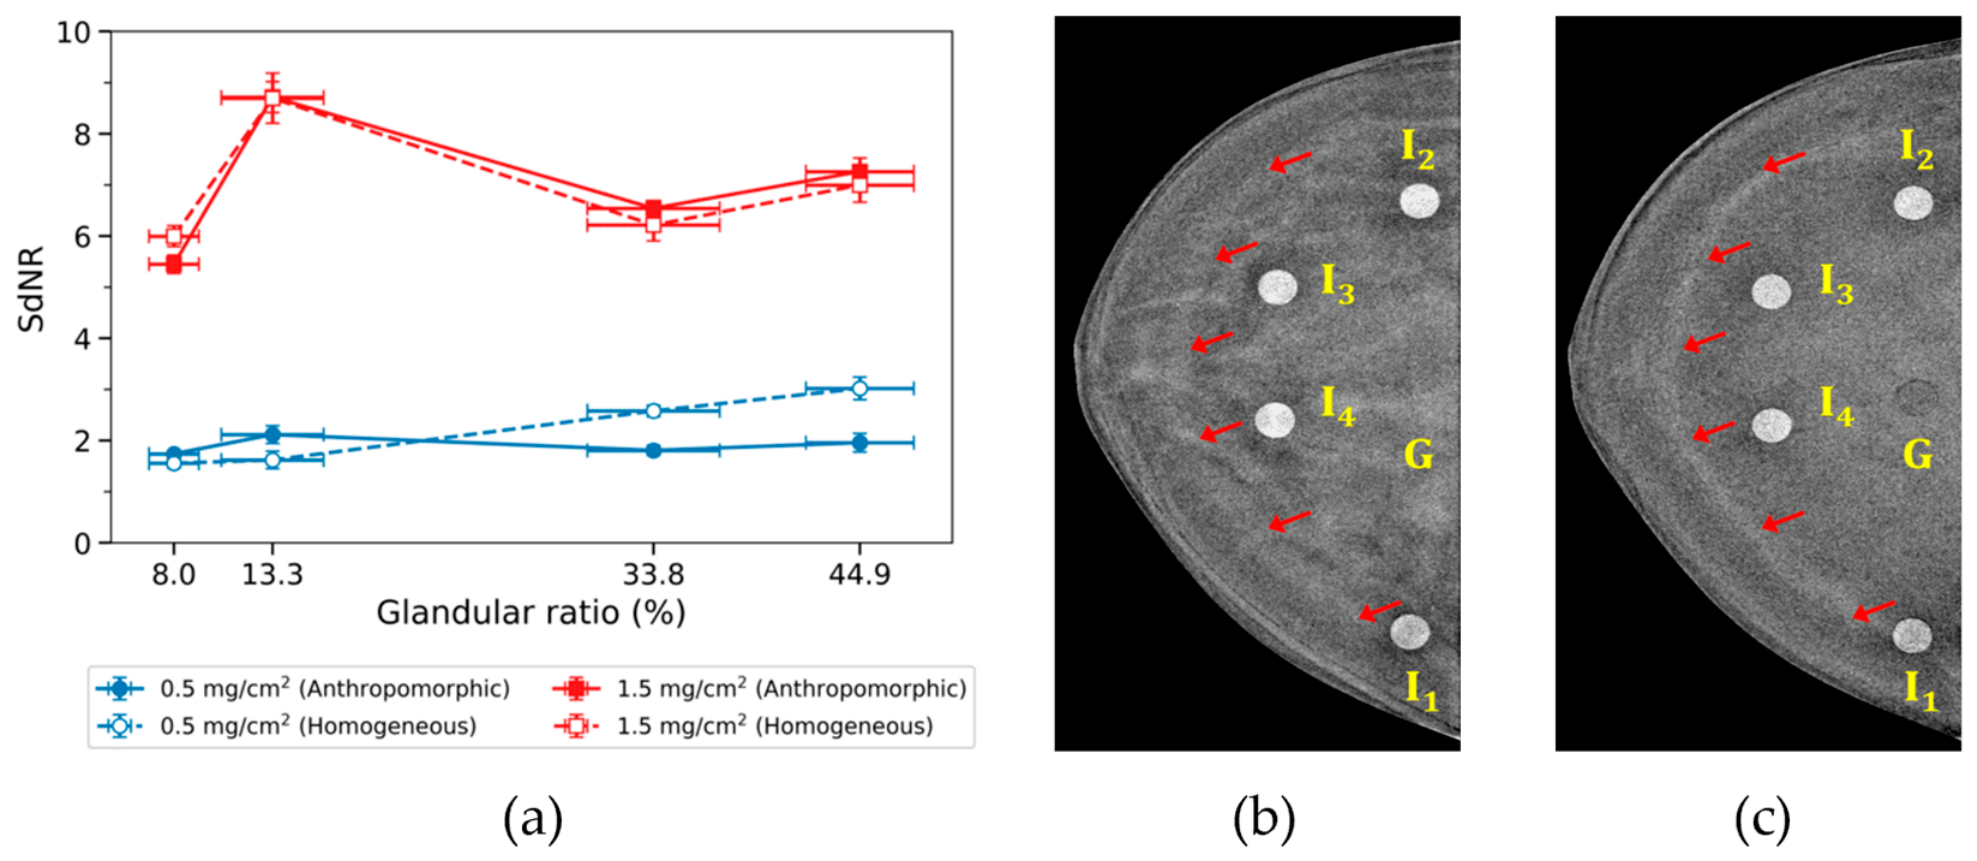
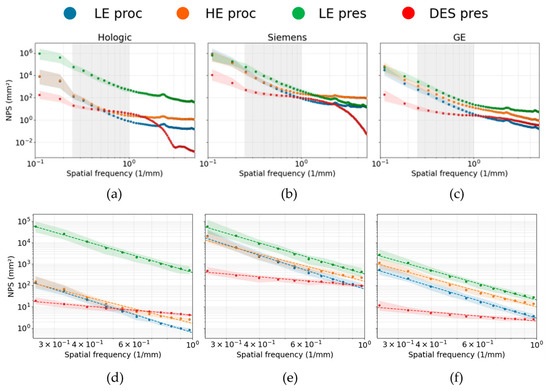
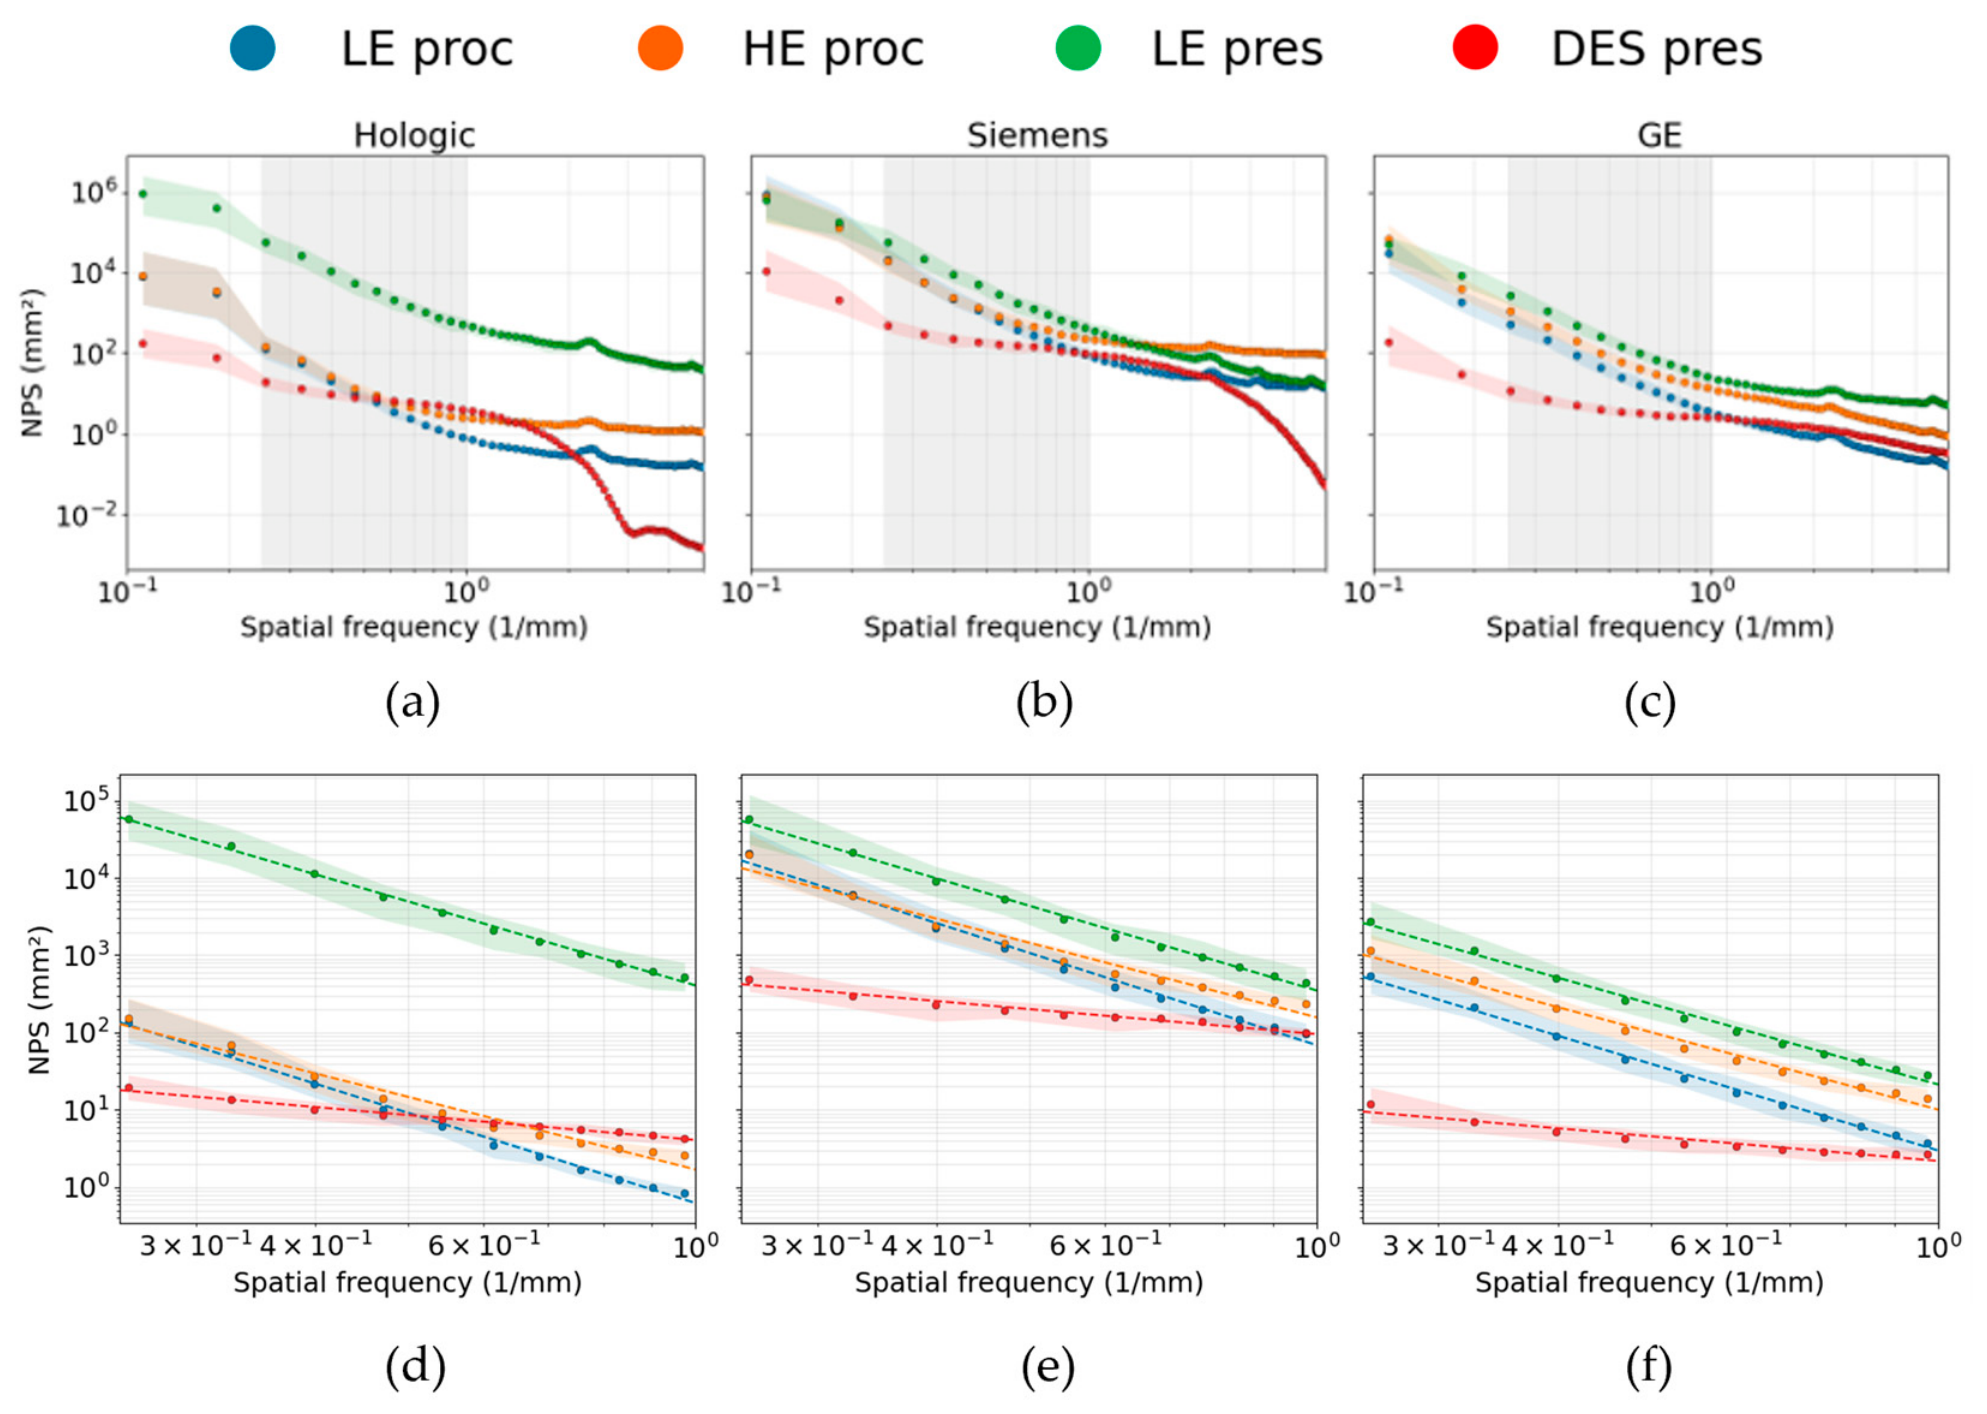

Disclaimer/Publisher’s Note: The statements, opinions and data contained in all publications are solely those of the individual author(s) and contributor(s) and not of MDPI and/or the editor(s). MDPI and/or the editor(s) disclaim responsibility for any injury to people or property resulting from any ideas, methods, instructions or products referred to in the content. |
© 2026 by the authors. Licensee MDPI, Basel, Switzerland. This article is an open access article distributed under the terms and conditions of the Creative Commons Attribution (CC BY) license.