


Abstract
Impulsivity is a common trait and is understood as a symptom of various disorders such as Attention-Deficit/Hyperactivity Disorder (ADHD). We previously proposed ImpulsivityBank protocol, which is a standardized discourse protocol for retrieving speech samples that enables the identification of the speech features related to the impulsivity trait in children and adolescents. ImpulsivityBank protocol presents three elicitation methods (recall task, storyboard, picture description) and quantifies general language abilities using a battery of linguistic assessments. In this paper, we analyze the current data from the Impulsivity corpus, which is a corpus that consists of speech samples collected using our protocol. We performed an automated linguistic-feature analysis of the Impulsivity corpus to examine speech features related to the impulsivity trait in children and adolescents. We present the results of both the classification and prediction systems considering diverse experimental scenarios. Our results indicate that the speech features from the storyboard consistently yielded the best-performing classification and prediction systems among the evaluated elicitation methods. We conclude that ImpulsivityBank protocol facilitates the collection of speech samples from which a range of linguistic features can be extracted and explored in relation to the impulsivity trait in children and adolescents. The consistency observed across the classification and prediction models suggests that multiple speech features jointly contributed to the fitted models’ outputs. Our main contribution lies in speech analysis, particularly in the extraction and study of speech features that may be associated with impulsivity.
1. Introduction
Impulsivity describes the predisposition to rapid, unplanned, and inappropriate reactions regardless of possible undesirable outcomes for oneself or others [1,2,3]. Impulsivity is also a common symptom of various disorders such as Attention-Deficit/Hyperactivity Disorder (ADHD). Remarkably, there is widespread interest in understanding impulsivity to determine whether a person can modulate his or her behavior to adapt to the demands of a given environment [3,4]. This is of particular importance since impulsivity mishandling can result in high-cost events, including learning disabilities, dropping out of school, behavioral maladjustment, aggressive behavior, depression, suicide attempts, anxiety, and substance abuse [5,6,7].
Speech is an indirect path to recognizing thought processes because the correct execution of speech requires a complex integration of cognitive, linguistic, and social skills [8]. Moreover, it is well accepted that discourse productions provide an ecological measure of the ability to plan and organize thoughts in a well-structured manner that is understandable to the listener [9,10,11]. Ref. [12] argue for mapping the linguistic structure of behavioral disorders as language impairment occurs in several mental disorders. Traditionally, mental health professionals develop skills to grasp fine thought processes by listening to the patient discourse during a clinical interview, but it can lead to heterogeneous interpretations [13].
There are virtually no studies on the relationship between impulsivity trait and speech distortions. Nevertheless, clinical observations and empirical evidence suggest that individuals with ADHD, who typically exhibit high levels of impulsivity, present speech impairments and limited narrative language abilities [11,14,15], which are mainly related to higher-order cognitive processes involved in oral speech narrative production [16,17]. ADHD individuals present deficiencies in verbally related real or imaginary situations where it is necessary to plan and organize thoughts in a structure of temporal, spatial, and causal relationships between events, achieving a logical and understandable structure for the interlocutor [15,18,19]. Narrative skills’ shortcomings are evident in the lexical and pragmatic language [14,20,21,22]. In particular, ref. [11] establish that children with ADHD have differences in syntactic complexity, coherence, cohesion, and disruptions during storytelling compared to children without ADHD.
Problems with narrative skills exist in different neurological and psychiatric disorders, which may share certain behavioral traits [15,18,23]. Moreover, there is a presumption that narrative deficit is a cross-cutting problem that goes beyond children with ADHD [14]. Therefore, individuals with impulsivity and those with ADHD may have similar narrative productions, since impulsivity and ADHD children have in common the characteristics of some faulty executive functions.
We hypothesize that the impulsivity trait affects the narrative discourse of children and adolescents. To our knowledge, no studies have examined speech in the context of diagnosing impulsivity as a trait from a fundamental perspective, focusing on processes closer to the physiological level of brain functioning. The most similar investigations contemplate speech features in ADHD, which is widely recognized as a behavioral disorder with a marked impulsivity trait. We examined recent studies on speech analysis in children and adolescents with ADHD.
We identified that studies often use manual coding, semiautomatic analysis, or automatic strategies to analyze speech samples. Manual coding requires highly skilled linguists to manually calculate speech metrics, regarding the syntactic, structural, semantic, and pragmatic analysis of sentences. For instance, ref. [18] report that research assistants marked utterances, complex clauses, and grammatical errors after receiving training in narrative coding. Similarly, ref. [21] assess coherence through manually rating each utterance on a scale of 0–2, where higher scores indicate greater coherence. Evidently, manual coding is time consuming and costly due to the need for expert linguists or error-prone if executed by unqualified personnel [24].
Semiautomatic analysis involves using a system to automatically identify syntactic and structural information, while human experts support the analysis of semantic and pragmatic features. The most commonly used systems are CLAN (Computerized Language ANalysis) and SALT (Systematic Analysis of Language Transcripts), which are both data analysis programs for analyzing transcripts with a specific format. For example, ref. [15] use CLAN to quantify aspects such as syntactic units, lexical diversity, pauses, and repetitions, while human experts establish the references and relationships between utterances to measure cohesion. Likewise, refs. [19,25] employ systems to evaluate production and syntactic complexity features; meanwhile, human experts help measure coherence by classifying sentences into key components (e.g., plot elements, setting elements, initiating events, internal responses) of the story.
The reduction in human labor, processing time, and potential errors is remarkable with semiautomatic analysis, as the system automatically quantifies the measures of production, syntactic complexity, and fluency of the narrative discourse [24,26,27]. Nonetheless, there is a reliance on human experts to quantify categories of coherence, disruptions, cohesion, and internal state language.
Alternatively, automatic strategies seek to support the experts’ labor through speech analysis and natural language processing techniques. Particularly, automatic strategies facilitate the analysis of discourse structure, as well as its semantic and pragmatic features, through sentiment analysis, semantic coherence, and the content analysis of narrative discourse [28]. Automated linguistic-feature analysis aims to automatically extract and quantify linguistic features such as sentence length, dependency clause distribution, and grammatical label distribution [28,29].
Refs. [30,31] are the only ones who use automated linguistic-feature analysis to examine the production, syntactic complexity, and coherence of texts. To our knowledge, the automatic extraction and analysis of a broad range of linguistic features from the speech of children and adolescents remains largely unexplored, particularly in the context of impulsivity.
The dominant presence of manual coding and semiautomatic analysis promotes the emergence and use of different systems for coding information [11,14]. Therefore, there are differences in measuring narrative discourse categories and research findings. To illustrate, researchers encode an utterance using different rules that affect production metrics, such as the number of utterances and the mean length of utterance (MLU). Ref. [19] report utterances as C-units (a main clause with all joined subordinate clauses) and state that there is no statistical difference between the number of utterances produced by ADHD children and typically developing children during a recall task; meanwhile, ref. [32] use information units as utterances without explicitly detailing the syntactic rules for establishing such units, and they declare that ADHD children verbalize more utterances than the typically developing group. Furthermore, ref. [25] uses T-units (a main clause with any dependent subordinate or non-clausal elements) as utterances and finds that typically developing children have a higher MLU than children with ADHD; whereas ref. [21] claim that there are no statistical differences in the MLU metric when utterances are C-units in storyboard.
Likewise, discrepancies in coding systems impact the analysis of semantic and pragmatic features. For instance, the findings diverge regarding the disruptions of storyboard narratives. Ref. [15] report that ADHD children interrupt their narratives more than typically developing children, which is based on the manual quantification of story-irrelevant utterances (e.g., “Where did you buy this book?”). Meanwhile, ref. [21] determine that there is no difference in narrative disruptions between children with ADHD and those without ADHD after manually measuring irrelevant comments, statements about misinterpretations of the story, and sentences in which the child recounted events in the wrong order. Consequently, variability in coding systems obscures cross-study comparison and the generalization of results of syntactic, semantic, and pragmatic speech features [26], as it is uncertain whether such differences arise from participant characteristics, data collection procedures, or methodological approaches [27]. Similarly, doubts arise as to whether coding systems are capable of accounting for the different nuances of the complex constructions of discursive narrative categories [33].
In summary, we found that there are different systems for coding information, as manual coding is the most popular analytical approach. Currently, there is no consensus on measures to evaluate narrative discourse categories. Hence, a lack of agreement hinders cross-study comparisons and limits the generalizability of findings, as it raises questions regarding the underlying causes of discrepancies reported in studies that apply different coding systems [11,14,26].
We proposed ImpulsivityBank protocol [34], which is a standardized discourse protocol for retrieving speech samples that enables the determination of speech features related to the impulsivity trait in children and adolescents. ImpulsivityBank protocol presents three elicitation methods (recall task, storyboard, picture description) and quantifies general language abilities using a battery of linguistic assessments. Furthermore, we introduced the Impulsivity corpus [34], which is a corpus that consists of speech samples collected using our protocol. In this paper, we analyze the current data from the Impulsivity corpus using an automated linguistic-feature analysis to examine speech features and the impulsivity trait. Hence, we expect that the Impulsivity corpus will provide an environment that aids the development, understanding, and consistency of narrative discourse measures. Our main contribution lies in speech analysis, particularly in the extraction and study of speech features that may be associated with impulsivity.
Our findings reveal the need to control verbosity during speech analysis to prevent verbal production from obscuring the findings and masks the speech features of impulsivity regarding an elicitation method. In the unadjusted analyses, several nominal between-group patterns were observed, although none remained statistically significant after Benjamini–Hochberg (BH) adjustment and should therefore be considered exploratory. During the recall task, the group with higher impulsivity scores showed nominally higher values for fillers and non-functional words, which may be relevant to aspects of discourse organization and fluency. In the storyboard, nominal patterns indicated lower lexical diversity and higher content word use in the group with higher impulsivity scores, the latter being compatible with a more event-focused style of description. During picture description, a nominal pattern of lower lexical diversity was also observed in the group with higher impulsivity scores. Overall, our findings indicate that the separate analyses of the three elicitation methods identified different sets of speech features associated with lower and higher total impulsivity scores. Some aspects of our findings are broadly consistent with the patterns reported in studies of individuals with ADHD [25,32,35,36]. However, these similarities should be interpreted only as tentative contextual parallels, since ADHD and the impulsivity trait are distinct.
Likewise, we present the results of both classification and prediction systems considering the speech information of each elicitation method, the manually coded information, the general language abilities, and demographic information. Our results indicate that the speech features from the storyboard consistently yielded the best-performing classification and prediction systems. The consistency between the storyboard classification and prediction systems suggests that multiple speech features jointly contributed to their outputs rather than a single speech feature.
We seek to report an automated linguistic-feature analysis of narrative discourse to examine speech features related to the impulsivity trait using both classification and prediction models. The remainder of this paper is organized as follows. Section 2 describes the data collection, data preprocessing, feature extraction, and experimental setting. Section 3 presents the experimental results and compares them with related work. Finally, Section 4 indicates the conclusions, limitations and future work.
2. Materials and Methods
We analyze the current data in the Impulsivity corpus [34], which contains speech samples from children and adolescents collected using our protocol. We generate experimental scenarios and performance metrics to examine speech features related to the impulsivity trait across the three elicitation methods (recall task, storyboard, picture description) of the ImpulsivityBank protocol. Here, we present an automated linguistic-feature analysis to evaluate the production and syntactic complexity of speech with respect to the impulsivity trait. In this section, we describe the corpus, data preprocessing, feature extraction, and experimental setting.
2.1. Impulsivity Corpus
The Impulsivity corpus currently contains 181 speech samples from two public schools (45 and 136 participants, respectively) in Pereira (a central city in Colombia). All participants had their involvement authorized by their parents and/or legal mentors upon signing the informed consent form. The consent process included authorization for the use of anonymized verbatim quotations in scientific publications. The inclusion criteria were being a native Spanish speaker, having adequate hearing and vision, being between 8 and 17 years of age, and being enrolled in an academic course between elementary and high school. Based on information provided by the schools and the parents/legal guardians during recruitment, no participant had a known diagnosis of neurodevelopmental, sensory, or psychiatric disorders. Likewise, participants were not undergoing any intervention at the time of data collection.
We assessed impulsivity using the Barratt Impulsiveness Scale (BIS-11c), which we adapted for Spanish-speaking children and adolescents [37,38,39]. The scale was administered individually via an online questionnaire in the presence of trained research personnel, including psychologists, child psychologists, neuropsychologists, psychology students, and medical students. Participants completed the questionnaire themselves, while research staff were available only to clarify the meaning of individual words or the questionnaire instructions when requested. All participants completed the entire scale. There were no missing data.
BIS-11c comprises 26 items designed to assess three dimensions of impulsivity: motor, cognitive, and non-planning impulsivity. These dimensions correspond to the three-factor model originally proposed by [40]. A total impulsivity score (TOTAL) is obtained by summing the responses across all items, where higher scores indicate higher impulsivity.
The internal consistency of the BIS-11c total score was estimated using McDonald’s omega from a correlated three-factor confirmatory factor model. The total score showed an internal consistency of (95% bootstrap CI ). Item-level descriptive statistics (means and standard deviations) together with corrected item–total correlations are reported in Table A1 (see Appendix A.1). Although corrected item–total correlations varied across items, no modifications to the original BIS-11c item composition were made.
We have examined the internal consistency of the BIS-11c total score separately by age group. McDonald’s omega was 0.873 (95% bootstrap CI ) in the younger group (8–12 years) and 0.918 (95% bootstrap CI ) in the older group (13–17 years). Measurement invariance across age groups was evaluated using multigroup confirmatory factor analysis. Changes in model fit remained minimal across increasingly constrained models ( ranging from −0.0024 to −0.0002; ranging from −0.0012 to −0.0002). These findings support the measurement invariance of the BIS-11c across the evaluated age range.
Figure 1 shows the distribution of the BIS-11c score, which visually suggested the presence of two concentration regions rather than a single unimodal distribution. We tested this hypothesis using the Excess Mass test, finding evidence against a unimodal distribution () but no evidence against a distribution with at most two modes (). Thus, these results are consistent with a distribution characterized by two modes. Based on this distributional pattern, we defined two score groups for the classification analyses: the lower-score group (Low score) and the higher-score group (High score). The use of participant groups derived from impulsivity scores has also been adopted in previous research [41] to facilitate statistical comparisons aimed at identifying characteristics associated with relatively lower and higher impulsivity scores. Furthermore, ref. [42] stratified participants into impulsivity groups based on BIS-11 scores and subsequently performed classification analyses to identify neurophysiological features associated with these different impulsivity levels.
Figure 1.
Distribution of the BIS-11c score.
To define the groups, we computed the mean impulsivity score across all participants and rounded it down to the nearest integer, which served as the cutoff value. Participants with total impulsivity scores below this threshold were assigned to the lower-score group, whereas those with scores equal to or above the cutoff were assigned to the higher-score group. The mean as cutoff allowed us to retain the complete sample for subsequent analyses; meanwhile, adopting more restrictive thresholds (e.g., extreme quartiles) would have substantially reduced the sample size.
Importantly, the lower-score and higher-score groups are not clinically validated categories. Instead, they represent a methodological strategy to investigate speech features related to different impulsivity levels. Moreover, we acknowledge that any binary partition of a continuous variable necessarily simplifies the underlying continuum. Therefore, we designed both classification systems to discriminate participants across the groups and prediction models to estimate the BIS-11c score. These complementary analytical approaches allow us to investigate speech features and impulsivity without relying exclusively on the grouping strategy.
We obtained permission from each school to collect data during regular school hours. Data collection was scheduled to avoid recess and school events, thereby minimizing environmental distractions. Speech was recorded using a TASCAM DR-40X (TEAC Corporation, Tama, Tokyo, Japan) digital recorder with the built-in stereo microphones. Recordings were stored in WAV format at a sampling rate of 48 kHz and 24-bit resolution. Participants were assessed individually in a quiet setting under their usual school conditions. Each recording session lasted approximately 20–25 min. The analysis included the complete speech produced during the three elicitation methods described below. Although all participants completed the same protocol, no fixed response duration was imposed for any method.
- Recall task: We used a recall task without picture support from the Neuropsychological Assessment of Children-II (in Spanish Evaluación Neuropsicológica Infantil-II, ENI-II) [43]. The interviewer read a story aloud and instructed the participant to listen carefully, as the participant must retell it immediately afterward. We utilized the story Piel de Azabache, which has 1469 characters.
- Storyboard: We used the wordless picture book Frog Goes to Dinner [44], which was previously used by [18] to study the speech of Spanish children with ADHD, Autism Spectrum Disorder, and typically developing peers. The interviewer gives the following instruction: “Now, tell me or make up a story based on the book. You can tell it as a fairy tale, beginning for example with Once upon a time. Pretend I haven’t seen it before”. The interviewer then hands the book to the participant, who can turn the pages while narrating the story.
- Picture description: We used the last version of the “Cookie Theft” picture [45] with the prompt “Describe the image in as much detail as possible. Tell me what is happening and what you see.”.
In addition, we evaluated the general language abilities through tasks involving naming, concept formation, reading comprehension, and verbal fluency. We used tasks from the ENI-II. Each task was manually evaluated by a child psychologist and a psychology intern using the scoring rubric developed and validated for the ENI-II. Raw scores were subsequently transformed into standardized T-scores based on the age-specific normative data reported in the ENI-II manual. T-scores place performance on a common scale (mean = 50, SD = 10), facilitating age-independent comparisons of language abilities. General language abilities were compared between schools using the Wilcoxon rank-sum test. Differences were observed only for the naming task and concept formation, whereas reading comprehension and verbal fluency did not differ between schools.
Table 1 summarizes the demographic, linguistic, and impulsivity information about the participants, considering whether they belong to the lower-score group or the higher-score group. We found no statistically significant differences in sex and age distribution among participants according to their impulsivity classification. Remarkably, there were no significant differences in general language abilities between participants with lower and higher BIS-11c scores.
Table 1.
Participants demographic, linguistic and impulsivity information.
We transcribed speech samples using a pipeline for semiautomatic speech recognition. The automatic speech recognition (ASR) system generates a preliminary transcript that may contain errors, including substitutions, deletions, and insertions. Subsequently, trained human annotators reviewed and corrected the initial transcript, eliminating transcription errors and adding labels formatted according to the Codes for the Human Analysis of Transcripts (CHAT) conventions. Inter-annotator agreement was evaluated separately for transcript correction and CHAT annotation. Word-level agreement, defined as the proportion of words on which the human annotators agreed after aligning their corrected transcripts, was 91.26% for transcript correction. Moreover, agreement for CHAT labels, defined as the proportion of cases in which both annotators assigned the same CHAT label to the same position in the transcript, was 88.08%.
2.2. Data Preprocessing
We generated three sets of texts, each corresponding to a different elicitation method, to examine which speech features differed between the lower-score and higher-score groups within each elicitation task. Consequently, we conducted individual analyses on each set. Importantly, there are 180 transcripts in the recall task set, while there are 181 transcripts in the other sets, as one participant did not complete the recall task.
We modified the transcripts as little as possible, bearing in mind that we wanted to automatically tag morphosyntactic features. Therefore, we did not remove stopwords or normalize to lowercase. Nonetheless, we did take advantage of information from human-assisted transcription correction. We retained the completed words that were partially produced by the participants and marked all disfluencies with a placeholder ([F]). We discarded all speech fragment and simple events labels. We removed punctuation marks after morphological tagging. Furthermore, we performed additional preprocessing (see Section 2.3) to extract some features proposed in similar studies.
2.3. Feature Extraction
We explored features from similar studies to model production, lexical diversity, lexical density, Part-of-Speech (POS) tag distribution, variants of the token-to-type ratio, and dependency relations. We used the Spanish language modeling package from the Stanza library (version 1.11.0) for feature extraction.
Production refers to how much speech the participant produces. We measured the number of words tokenized by white spaces and the number of sentences automatically segmented using a BiLSTM (Bidirectional Long Short-Term Memory) + CRF (Conditional Random Field) model trained on the Google Universal Dependencies Spanish Treebank corpus.
POS tag distribution quantifies the number of words belonging to a category of speech—for example, the number of words that are adverbs (ADV), determiners (DET), nouns (NOUN), pronouns (PRON), subordinating conjunction (SCONJ), and fillers (FILLER). Furthermore, we evaluated the number of words that were nouns, verbs, or adjectives (NVADJ).
Moreover, we quantified the number of functional words (FW) and non-functional words (NFW) following [30]’s proposal. Functional words imply semantic content since they have POS tags such as adjective, verb, noun, pronoun, and proper noun. Non-functional words have the remaining POS tags such as adposition, auxiliary, interjection, etc. We understand that functional words provide an indicator of the use of informative words that help build references. On the other hand, non-functional words yield information about the discourse organization, as they link and clarify the relationships between sentences. Nevertheless, the presence of non-functional words may weaken discourse organization and fluency if they are mainly fillers or interjections that spoil the discourse continuity.
We computed two variants of the token-to-type ratio to provide an estimate of the lexical diversity. Ref. [31] propose quantifying the proportion of tokens that satisfies specific conditions given the vocabulary; thus, high values of the ratio imply low lexical diversity.
The first ratio (TokTR-woSW) arises from texts without stopwords. We removed stopwords using the Spanish stopword list of the NLTK library by matching lowercase word forms against the stopword list. After filtering, we preserved the original surface forms, including capitalization, when computing the TokTR-woSW. Equation (1) defines TokTR-woSW for a text T, where denotes the number of tokens after stopword removal and is the corresponding vocabulary size. Note that stopword removal was performed exclusively for the computation of TokTR-woSW.
The second ratio ratio (TokTR-NVADJ) is computed from the preprocessed texts by considering only tokens tagged as nouns, verbs, or adjectives. Equation (2) defines TokTR-NVADJ for a text T, where denotes the number of noun, verb, and adjective tokens, and is the corresponding vocabulary size.
The dependency relations detail the syntactic structure of a sentence in terms of the grammatical relationships between words. Dependency relations occur between content words that have grammatical relationships such as nominal subject (i.e., it dictates the syntactic subject, the executor, or the protoagent of the clause), direct object (i.e., the main subject that receives the action of the verb), and oblique nominal (i.e., argument that forms a verbal specification, an adjective, or an adverb). Function words are directly dependent on content words. We count the number of content words and function words. Despite their similar nomenclature, functional words and function words represent distinct morphological features and should be analyzed independently.
A comprehensive statistical evaluation was conducted across all extracted features. For the full transcript analyses, feature-level comparisons were organized into three hypothesis families according to elicitation method: recall task, storyboard, and picture description.
We recognized that verbosity could obscure the identification of speech features potentially related to impulsivity within each elicitation method. To control for verbosity, transcripts were analyzed using fixed-length word sliding windows with a one-word step. Importantly, each linguistic feature was computed within every window available for a given participant. The resulting window-level values were averaged to obtain a single participant-level value for subsequent analyses, following the approach proposed by [46,47]. Particularly, three window sizes were evaluated for each elicitation method. For the verbosity-controlled analyses, feature-level comparisons were likewise organized into three additional hypothesis families according to elicitation method with comparisons across the evaluated word-window sizes considered jointly within each family.
Thus, six hypothesis families were evaluated in total. Multiple testing was controlled separately within each family using the Benjamini–Hochberg (BH) procedure to control the false discovery rate (FDR). For each comparison, the effect size was quantified using the rank-biserial correlation (RBC) with unadjusted 95% confidence intervals. Multiple-testing correction was applied to the p-values using the BH procedure; confidence intervals were not adjusted for multiplicity.
2.4. Experimental Setting
As we mentioned earlier (see Section 2.1), we designed both classification systems to discriminate participants across the lower-score and higher-score groups, and we used prediction models to estimate the BIS-11c score.
We used a Monte Carlo cross-validation (MCCV) strategy to obtain stable estimates of predictive performance across multiple random data partitions. Repeating the random partitions reduces the dependence of the evaluation on a single train–validation–test split and provides an assessment of predictive performance. At each MCCV iteration, we randomly split the data into a training set (70%), validation set (20%), and testing set (10%) by sampling without replacement. Thus, within a given iteration, each participant appeared in only one subset, although the same participant could appear in different subsets across iterations. These split ratios remained constant across all MCCV iterations. Importantly, the validation set was used exclusively for hyperparameter optimization and model selection, whereas the testing set was used only for the final performance evaluation of each MCCV iteration.
For the classification systems, the MCCV partitions were generated using stratified random sampling to preserve the proportion of participants in the lower-score and higher-score groups across the training, validation, and testing sets. For the prediction systems, where the target variable was continuous, stratification was achieved by discretizing the target variable into five quantile-based (quintiles) groups. These quintiles were used exclusively to preserve the distribution of the target variable during data partitioning and were not used for model training or performance evaluation in the prediction systems.
We evaluated the impact of the number of iterations on the MCCV strategy using 100 independent Logistic Regression classification models as a baseline. Performance was assessed via the accuracy metric. Specifically, we examined the average standard deviation of accuracy and the average execution time of models for different numbers of iterations (see Figure A1 in Appendix A.2). The results indicated that the standard deviation of accuracy tends to stabilize at 400 iterations, providing a trade-off between statistical convergence and execution time. Consequently, we adopted a configuration of 400 iterations for the MCCV strategy.
Once the data partition was defined, we generated both classification and prediction systems with different inputs. First, we evaluated the performance of the speech features of each elicitation method; second, we evaluated the manually coded information, the general language abilities scores, and the demographic information. In each case, we systematically optimized eight classification models (i.e., Logistic Regression, Support Vector Machine (SVM), Random Forest, Gaussian Naive Bayes, Decision Tree, K-Nearest Neighbors, Extra Trees, XGBoost) and their respective hyperparameters. Furthermore, we evaluated ten regression models (i.e., Linear Regression, Elastic Net, Ridge Regression, Support Vector Regression (SVR), Random Forest Regressor, Gaussian Process Regressor, Decision Tree Regressor, K-Nearest Neighbors Regressor, Extra Trees Regressor (ETR), and XGBoost Regressor) for BIS-11c score prediction.
We utilized the Scikit-learn library (version 1.7.2) and XGBoost library (version 3.1.1) to implement the classification and regression models. Moreover, we used the Optuna library (version 4.6.0) for hyperparameter tuning of the classification and prediction systems, employing the Tree-structured Parzen Estimator sampler for hyperparameter search and the Median Pruner for the early stopping of unpromising trials.
We used different evaluation metrics to select the optimal configuration of the classification and prediction systems. We chose accuracy as our evaluation metric in classification systems since our data are not imbalanced. The data distribution in each iteration of MCCV follows: the training set had a total of 125 samples, including 66 from the higher-score group. The validation set had a total of 37 samples, including 19 from the higher-score group. The testing set had a total of 19 samples, including 10 from the higher-score group. For the prediction systems, we used the mean absolute error (MAE) because it provides a direct and easily interpretable measure of prediction error in the original BIS-11c scale and does not disproportionately penalize large errors compared with squared-error metrics.
Model selection was conducted independently for both the classification and prediction systems. For systems based on speech features, an independent Optuna study was performed for each elicitation method-window size combination, whereas systems based on manually coded information, general language abilities, and demographic information were optimized independently using the same procedure. In each case, we conducted an independent Optuna study to explore different modeling configurations. A modeling configuration consisted of an algorithm, a feature configuration, and the corresponding algorithm-specific hyperparameter values. Each modeling configuration was evaluated over the predefined set of 400 MCCV partitions. Within every MCCV iteration, all data-dependent preprocessing operations were fitted exclusively on the training set. Therefore, the model was fitted on the training set, evaluated on the validation set, and subsequently evaluated on the testing set.
For each modeling configuration, we calculated the mean and standard deviation of the validation and testing performance across the 400 MCCV iterations. The mean validation accuracy was maximized for the classification systems, whereas the mean validation MAE was minimized for the prediction systems. The testing performance was recorded for out-of-sample evaluation but was never used as the optimization objective or as a criterion for selecting the elicitation method, window size (when applicable), algorithm, standardization strategy, feature configuration, or algorithm-specific hyperparameters. After completing the optimization process, the final classification and prediction systems were selected exclusively according to their mean validation performance. As the number of experiments was quite large, we did not include these results.
2.4.1. Speech Features
As detailed in Section 2.3, we extracted features proposed in similar studies to model speech. We generated classification and prediction systems for each elicitation method, bearing in mind that the speech features depend on the size of the sliding window used to control verbosity. Therefore, we proposed a series of experiments for each set of features associated with the window size of the respective elicitation method.
Furthermore, we performed a recursive search for the best feature subset using the Recursive Feature Elimination (RFE) algorithm. Consequently, we identified the speech features for each elicitation method that yielded the highest accuracy during the classification of children and adolescents in the lower-score and higher-score groups as well as the lowest MAE for estimating the BIS-11c score.
2.4.2. Other Features
We designed classification systems using manually coded information, general language abilities scores, and demographic variables. First, we generated four features from the manually coded information: (1) the total count of speech fragments and simple event annotations, (2) the duration in seconds of the elicitation method, (3) the total word count normalized by duration, and (4) the number of distinct words normalized by duration. We calculated these features for each elicitation method, thus constructing twelve features from manually coded information. We then evaluated the general language abilities scores. Finally, we incorporated age, sex, and school as additional features to assess their contribution to predictive performance. Age was treated as a continuous variable, while sex and school were binary encoded.
We developed independent classification and prediction models for each set of features, including manually coded information, general language ability scores, and demographic information. In each case, we used the MCCV strategy with 400 iterations to optimize the corresponding model hyperparameters. Note that we applied the RFE algorithm to the system with the manually encoded information features.
3. Results and Discussion
We present and discuss the results following the structure of Section 2.
3.1. Feature Extraction
Figure 2 shows a comparison of the feature boxplots for the lower-score and higher-score groups across each elicitation method. Although several comparisons show unadjusted p < 0.05, none remain statistically significant after BH adjustment. The corresponding adjusted p-values, rank-biserial effect sizes, and unadjusted 95% confidence intervals are reported in Appendix A.3 (see Table A2).
Figure 2.
Feature boxplots using full transcripts for the lower-score and higher-score groups for each elicitation method: (A) number of words; (B) number of sentences; (C) number of adverbs (ADV); (D) number of determiners (DET); (E) number of nouns (NOUN); (F) number of pronouns (PRON); (G) number of subordinating conjunctions (SCONJ); (H) number of fillers (FILLER); (I) number of functional words (FW); (J) number of non-functional words (NFW); (K) the set of words that are nouns, verbs, or adjectives (NVADJ); (L) token-to-type ratio without stopwords (TokTR-woSW); (M) token-to-type ratio for nouns, verbs, and adjectives (TokTR-NVADJ); (N) number of content words; and (O) number of function words. Dashed lines with * indicate between-group comparisons with an unadjusted p < 0.05 based on the Wilcoxon rank-sum test. Multiple-testing correction was performed separately for each elicitation method using FDR correction with the BH method. None of the displayed comparisons remained statistically significant after adjustment. Lower total impulsivity score (Low score).
Several feature-level comparisons provide nominal evidence of between-group differences before multiple-testing correction. The number of sentences (see Figure 2B) follows this pattern across all elicitation methods with lower-score participants tending to produce more sentences than higher-score participants. In the recall task, adverb use also shows a nominal between-group pattern with higher values in the lower-score group (more ADV, see Figure 2C).
For picture description, several feature-level comparisons show nominal evidence of between-group differences before multiple-testing correction. These unadjusted comparisons involve the distribution of specific POS categories and the token-to-type ratio of nouns, verbs, and adjectives. Particularly, the lower-score group shows higher values for functional words and nouns, verbs, and adjectives (higher FW and NVADJ scores; see Figure 2I,K) but with less lexical diversity regarding nouns, verbs, and adjectives (higher TokTR-NVADJ scores; see Figure 2M).
Notably, the unadjusted patterns shown in Figure 2 may be influenced by differences in verbal production. We observe that the majority of features are strongly correlated with the number of words (see Table A3 in Appendix A.4) for each elicitation method. Therefore, speeches with more words tend to have higher rates of production and lexical diversity as well as a greater use of POS tags and dependency relations.
Hence, we acknowledge the need to control for verbosity that may be obscuring the findings and masking the speech features of the impulsivity trait regarding an elicitation method. Otherwise, we could end up referring to the storyboard as more complex discourse compared to the other methods given that participants tend to use a greater number of words (see Figure 2A).
In order to control verbosity, we analyzed transcripts using a sliding window of fixed word length with a step size of 1 word, following [46,47]’s proposal. We experimented with different sliding-window sizes across elicitation methods, considering the minimum length (number of words) of the speech for each method. For each participant and window size, each feature was computed across all available windows and then averaged, yielding a single participant-level value for that feature. We compare the features using different sliding-window sizes for the recall task (see Figure 3), storyboard (see Figure 4), and picture description (see Figure 5).
Figure 3.
Feature boxplots controlling verbosity for the lower-score and higher-score groups in recall task: (A) number of fillers (FILLER); and (B) number of non-functional words (NFW). Dashed lines with * indicate between-group comparisons with an unadjusted p < 0.05 based on the Wilcoxon rank-sum test. Multiple-testing correction was performed across all feature-level comparisons and evaluated word-window sizes within the recall task using the BH method to control the FDR. None of the displayed comparisons remained statistically significant after adjustment. Adjusted p-values, rank-biserial effect sizes, and unadjusted 95% confidence intervals are reported in Appendix A.5 (see Table A4). We excluded some participants by manipulating the data using sliding windows. Specifically, we lost one participant with WS = 20 and five participants with WS = 30. Lower total impulsivity score (Low score). Higher total impulsivity score (High score). Window size (WS).
Figure 4.
Feature boxplots controlling verbosity for the lower-score and higher-score groups in storyboard: (A) number of adverbs (ADV); (B) number of determiners (DET); (C) number of nouns (NOUN); (D) number of pronouns (PRON); (E) number of subordinating conjunctions (SCONJ); (F) number of fillers (FILLER); (G) number of functional words (FW); (H) number of non-functional words (NFW); (I) the set of words that are nouns, verbs, or adjectives (NVADJ); (J) token-to-type ratio without stopwords (TokTR-woSW); (K) token-to-type ratio for nouns, verbs, and adjectives (TokTR-NVADJ); (L) number of content words; and (M) number of function words. Dashed lines with * indicate between-group comparisons with an unadjusted p < 0.05 based on the Wilcoxon rank-sum test. Multiple-testing correction was performed across all feature-level comparisons and evaluated word-window sizes within storyboard using the BH method to control the FDR. None of the displayed comparisons remained statistically significant after adjustment. Adjusted p-values, rank-biserial effect sizes, and unadjusted 95% confidence intervals are reported in Appendix A.5 (see Table A4). We excluded some participants by manipulating the data using sliding windows. Specifically, we lost one participant with WS = 160 and two participants with WS = 170 and WS = 180. Lower total impulsivity score (Low score). Higher total impulsivity score (High score). Window size (WS).
Figure 5.
Feature boxplots controlling verbosity for the lower-score and higher-score groups in picture description: token-to-type ratio for nouns, verbs, and adjectives (TokTR-NVADJ). Dashed lines with * indicate between-group comparisons with an unadjusted p < 0.05 based on the Wilcoxon rank-sum test. Multiple-testing correction was performed across all feature-level comparisons and evaluated word-window sizes within picture description using the BH method to control the FDR. None of the displayed comparisons remained statistically significant after adjustment. Adjusted p-values, rank-biserial effect sizes, and unadjusted 95% confidence intervals are reported in Appendix A.5 (see Table A4). We excluded some participants by manipulating the data using sliding windows. Specifically, we lost one participant with WS = 20 and WS = 30, and we lost four participants with WS = 40. Lower total impulsivity score (Low score). Higher total impulsivity score (High score). Window size (WS).
Figure 3 shows a nominal between-group pattern in fillers during the recall task (more FILLER, see Figure 3A) with higher values in the higher-score group. The direction of this pattern is broadly consistent with the results of [35], who report greater disfluency in children with ADHD during a recall task. We know that these parallels can be potentially informative; however, they must be approached with caution, since ADHD and impulsivity are distinct.
Within the unadjusted analyses, a nominal between-group difference was observed for non-functional words with higher values in the higher-score group (for more NFWs, see Figure 3B). A similar directional pattern was observed for fillers. Non-functional words contribute to establishing and clarify logical relationships between sentences. Nonetheless, when they primarily occur as disfluencies, they may disrupt discourse continuity. Hence, non-functional words and fillers may influence discourse organization and fluency. Table 2 provides illustrative speech excerpts from participants in the lower-score and higher-score groups during the recall task. In the example from the higher-score participant, frequent fillers and ambiguous references are observable (e.g., they released him; Who released him?, they took him away; Who took it away? see Table 2). Previous studies involving children with ADHD have reported difficulties in transitions, connections, and fluency between ideas during the recall task [32] as well as difficulties in constructing cohesive narratives [36]. Therefore, we consider that these results offer a potentially relevant point of comparison, since ADHD and impulsivity should not be considered directly equivalent; besides, our measures (NFW and filler words) do not allow for a direct assessment of discourse cohesion.
Table 2.
Speech examples from participants in the lower-score and higher-score groups during the recall task.
Figure 4 shows several nominal between-group patterns in the storyboard across the evaluated window sizes. In the unadjusted analyses, the higher-score group generates narratives with a greater presence of disfluencies and content words (more FILLER and ContentWords; see Figure 4F,L) together with low lexical diversity (higher TokTR-woSW; see Figure 4J).
Previous studies have reported mixed findings regarding disfluencies in the narrative speech of children with ADHD. Some authors [18,25] claim no clear differences in word repetitions, false starts, repetitions, or pauses between children with ADHD and their peers. In contrast, ref. [15] report less fluent narratives in children with ADHD. The nominal pattern in this paper is directionally consistent with the latter finding, although we present this comparison with caution, since ADHD and the impulsivity trait are distinct.
Two studies [15,33] examine lexical diversity in the narrative discourse of children with ADHD during storyboard and reported no significant differences relative to typically developing peers. In this paper, the unadjusted analyses showed a nominal between-group pattern in lexical diversity. Variations in how lexical diversity is defined may contribute to differences across studies. For example, ref. [15] calculates lexical diversity as the number of different words divided by the square root of the total number of words. Meanwhile, ref. [33] proposes two indices. One is the ratio between vocabulary size and total words. The second is the ratio between words that are nouns, verbs, or adjectives divided by the rest of the terms. In contrast, we report lexical diversity using token-to-type ratio of nouns, verbs, and adjectives.
We implemented the index proposed by [15,33] but found no statistically significant differences between the lower-score and higher-score groups. In contrast, the token-to-type ratio without stopwords shows a nominal between-group difference (see Figure 4J). Future analyses should apply the token-to-type ratio of nouns, verbs, and adjectives to the data from [15,33] to facilitate more direct cross-study comparisons. To our knowledge, some of these data are not publicly available, thus limiting the scope of our analysis.
We further examined the nominal pattern of greater use of content words in the higher-score group (see Figure 4L). Table 3 provides illustrative speech excerpts from participants in the lower-score and higher-score groups during storyboard. We note that the speech of the higher-score participant is referential because it describes objects, characters, or events using content words. For example, the higher-score participant said, “The frog falls onto a plate of food. A lady goes to eat while the frog is there, unseen.”. (i.e., a literal English translation of the higher-score participant’s Spanish speech presented in Table 3) without providing setting elements for the event. On the other hand, the lower-score participant verbalized “Then the frog jumped. Into a plate. The plate. It was for an old woman, a very [F] millionaire old woman.” (i.e., a literal English translation of the lower-score participant’s Spanish speech presented in Table 3), framing the event in a context with details that provide an elaborate narrative of the conflict (i.e., the frog jumps onto the plate of food) presented in the story.
Table 3.
Speech examples from participants in the lower-score and higher-score groups during storyboard.
The nominal pattern of higher content words values in the higher-score group may be compatible with a more event-focused style of description during the storyboard (see Figure 4L). The illustrative excerpts in Table 3 further motivate examining whether such descriptions differ in the amount of contextual or setting information they incorporate. A potentially relevant parallel has been reported by [25], who found that typically developing children produced more utterances referring to setting elements than children with ADHD during storyboard.
Setting elements form part of Trabasso’s discourse analysis framework [48], which is used to evaluate how people construct coherent narratives. We did not directly measure coherence. Nonetheless, the nominal linguistic patterns, together with the illustrative differences in contextual framing, may provide a basis for future analyses using validated discourse level measures that explicitly assess setting information and narrative coherence. Such analyses could examine whether higher BIS-11c scores are associated with differences in the integration of contextual information during narrative production.
Figure 5 shows a nominal pattern of lower lexical diversity (higher TokTR-NVADJ) in the higher-score group during picture description. To our knowledge, ref. [35] is the only previous study to analyze the speech of children with ADHD during picture description, but lexical diversity was not reported. For broader context, we consider previous studies of lexical diversity in children with ADHD together with the nominal patterns observed in our results for the recall task (Figure 3) and storyboard (Figure 4).
As mentioned above, previous studies [15,33] do not report significant differences in lexical diversity between children with ADHD and their peers during storyboard. On the other hand, ref. [31] claim lower lexical diversity in children with ADHD during a personal narrative task. Ref. [31] automatically measure lexical diversity as the ratio between vocabulary size and total number of words, considering sliding windows of 50 words. The nominal patterns in this paper are directionally consistent with the findings of [31]. Specifically, lower lexical diversity was observed in the higher-score group during the storyboard (see Figure 4) and picture description (see Figure 5), whereas no comparable nominal pattern was in the recall task (see Figure 3).
Taken together, the nominal patterns in the storyboard and picture description may suggest lower lexical diversity in the higher-score group in tasks that provide visual support (i.e., the wordless picture book in storyboard and the image in picture description). One possible interpretation is that the external visual structure provided by these tasks may reduce some of the memory demands involved in generating and organizing discourse and may constrain aspects of the linguistic content to be produced (i.e., characters, order of events, etc.) [33,49]. However, this interpretation should be considered exploratory, as neither working memory capacity nor executive function was directly assessed in this paper, and none of the between-group comparisons remained statistically significant after BH adjustment. Similarly, the present nominal patterns and the findings reported by [31] suggest that controlling for verbosity may facilitate the detection of lexical diversity patterns that could otherwise be obscured by differences in speech length.
In the present subsection (Section 3.1), we show that the standardized ImpulsivityBank protocol enables the collection of speech samples from which a range of linguistic features can be extracted and compared across lower-score and higher-score groups. The unadjusted analyses revealed several nominal between-group patterns across the three elicitation methods. Nonetheless, none remained statistically significant after BH adjustment and should therefore be interpreted as exploratory. For instance, the recall task analyses shows nominal patterns involving fillers and non-functional words in the higher-score group (see Figure 3). These patterns may be relevant to discourse organization and fluency. Similarly, the storyboard analyses shows nominal patterns in fillers, content word use, and lexical diversity (see Figure 4). These patterns may motivate future analyses of narrative organization and coherence, since higher-score participants showed a more event-focused use of content words with less explicit reference to setting elements (see Table 3). Finally, the picture description analyses shows a nominal pattern of lower lexical diversity in the higher-score group (see Figure 5).
Furthermore, ADHD research provides potentially useful contextual parallels, as some of the exploratory nominal patterns in linguistic features in this paper show directional similarities to findings reported across the recall task, storyboard, and picture description [25,32,35,36]. Nevertheless, these parallels should not be interpreted as evidence of a shared narrative profile or underlying mechanism.
Moreover, our findings suggest that the separate analyses of each elicitation method highlighted different sets of speech features when comparing the lower-score and higher-score groups. Our findings are consistent with recent studies indicating that speech features may vary across elicitation methods when comparing participant groups with different disorders or behavioral traits [26,27,49,50,51,52].
3.2. Experimental Setting
Table 4 exposes the performance of the best classification systems using speech features, detailing the size of the sliding window by elicitation method. The classification systems of recall task and picture description use the features associated with the smallest window size for the corresponding elicitation method. Nevertheless, the storyboard classification system exploits the features of the longest window size. Furthermore, we identified that the best classification systems were those in which we used SVM models and a subset of all the features initially proposed. Table A6 (in Appendix A.7) details the classification models and the number of features.
Table 4.
Performance of classification systems using speech features, manually coded information, general language abilities scores and demographic information.
Our current results indicate that the classification system based on the features of the storyboard outperforms the classification using the other elicitation methods, providing the highest accuracy (0.687 on the validation set and 0.691 on the testing set). Furthermore, the storyboard classification system consistently achieves superior average F1-scores (0.693 on the validation set and 0.701 on the testing set) and precision scores (0.700 on the validation set and 0.714 on the testing set) in both validation and testing sets.
We highlight two strengths of the storyboard classification system. First, the classification system demonstrates strong generalization capability, as there are no statistically significant differences between its performance on the validation set and the testing set. For instance, the storyboard classification system achieves an average recall of 0.696 with an error sampling of 0.012 (interval from 0.648 to 0.708) on the validation set; meanwhile, the average recall is 0.701 with an error sampling of 0.015 on the testing set (interval from 0.686 to 0.716). Second, the system offers similar performance in terms of precision (0.700 ± 0.008 on the validation set and 0.714 ± 0.012 on the testing set) and recall (0.696 ± 0.012 on the validation set and 0.701 ± 0.015 on the testing set). Therefore, the storyboard classification system performs similarly when identifying participants in the higher-score group while minimizing the misclassification of participants in the lower-score group.
Moreover, paired comparisons between the speech feature classification systems (see Table A5, Appendix A.6) showed that the storyboard classification system achieved higher precision than the classification systems based on the recall task (paired difference = −0.034, 95% CI [−0.050,−0.018]) and picture description (paired difference = 0.032, 95% CI [0.017, 0.047]) on the testing set. Furthermore, the storyboard system achieved a higher F1-score than the picture description system in both the validation (paired difference = 0.021, 95% CI [0.011, 0.031]) and testing sets (paired difference = 0.017, 95% CI [0.003, 0.031]), whereas both systems showed comparable recall performance in the validation and testing sets.
Table 5 summarizes the performance of the best prediction systems obtained from the speech features. Similar to the classification analysis, the optimal sliding-window size depended on the elicitation method. The recall task achieves its best predictive performance using the shortest window, while the prediction systems of the storyboard and picture description benefit from the longest window size. Table A7 (in Appendix A.8) details the regression models and the number of features.
Table 5.
Performance of prediction systems using speech features, manually coded information, general language abilities scores and demographic information.
The storyboard prediction system achieves the best performance among the three elicitation methods. In particular, the system yields the lowest MAE (9.843 on the validation set and 9.650 on the testing set), the lowest RMSE (11.800 on the validation set and 11.622 on the testing set), and the highest coefficient of determination ( on the validation set and on the testing set). As in the classification experiments, the storyboard prediction system shows comparable performance on the validation and testing sets, suggesting good generalization and limited overfitting. Moreover, the classification and regression analyses independently identified the storyboard as the best-performing elicitation method. Therefore, our findings suggest that the speech features from the storyboard consistently yield better classification and prediction performance than the speech features of the recall task or picture description.
Nonetheless, the estimation of the BIS-11c score remains modest. The best-performing regression model achieved a testing RMSE of 11.622, which is close in magnitude to the standard deviation of the BIS-11c scores in the sample (SD = 12.16; see Figure 1). In addition, the model explained only a small fraction of the variance in BIS-11c scores (testing ).
Since the storyboard consistently produced the best-performing scores in classification and prediction systems, we further examined the speech features that contributed most to their results. We used the SHapley Additive exPlanations (SHAP) framework [53] to quantify the contribution of each speech feature. We trained both the classification and prediction systems using the entire dataset (i.e., 181 participants). SHAP values were then computed for each model to recognize the contribution of each feature to the predictions. For the classification system, SHAP values were calculated considering the higher-score group as the positive class. The SHAP summary plots for the storyboard classification and prediction systems are shown in Figure 6A and Figure 6B, respectively. In each plot of Figure 6, speech features are ranked hierarchically from top to bottom according to their contribution to the fitted model’s predictions. For each speech feature (i.e., each row), each point represents a participant in the dataset. The horizontal axis represents the contribution of each feature via SHAP values. For the classification system (see Figure 6A), positive SHAP values increase the probability of assigning a participant to the higher-score group, whereas negative SHAP values decrease this probability. For the prediction system (see Figure 6B), positive SHAP values increase the predicted BIS-11c score, whereas negative SHAP values decrease it. A wider spread of SHAP values indicates that the feature has a larger impact on the fitted model’s predictions across participants. Furthermore, SHAP values farther from zero indicate a larger contribution of the feature to the fitted model’s prediction. Finally, the color of each point depicts the feature value for a specific participant where the blue color indicates low values and the red color indicates high values.
Figure 6.
SHAP summary plots for the storyboard elicitation method: (A) SHAP summary plot of the classification system; (B) SHAP summary plot of the prediction system. Set of words that are nouns, verbs, or adjectives (NVADJ). The number of functional words (FW). Token-to-type ratio of nouns, verbs, and adjectives (TokTR-NVADJ). Subordinating conjunction (SCONJ). Token-to-type ratio without stopwords (TokTR-woSW). The number of determiners (DET). The number of adverbs (ADV). The number of non-functional words (NFW). The number of fillers (FILLER).
Figure 6 shows partially similar feature contribution patterns across the fitted classification and prediction models. The six speech features in the SHAP summary plot of the prediction system are also present in the SHAP summary plot of the fitted classification system. The relative feature rankings vary between the classification and prediction systems. For example, the number of determiners (DET) ranks higher in the prediction system, whereas the token-to-type ratio of nouns, verbs, and adjectives (TokTR-NVADJ) ranks slightly higher in the classification system. Additionally, the SHAP summary plot of the classification system includes a broader set of speech features.
Notably, content word frequency (ContentWords) received the largest SHAP values in the fitted classification and prediction systems. Within our sample, high frequencies of content words were generally associated with model outputs favoring classification into the higher-score group and increasing the predicted BIS-11c score. Likewise, Figure 6 presents findings consistent with our findings from Section 3.1, where we presented and illustrated nominal differences in narrative discourse between the lower-score and higher-score groups, including differences in the use of content words.
In the previous subsection (see Section 3.1), we observed nominal between-group patterns in several speech features using univariate analyses (see Figure 4). In contrast, Figure 6 provides a description of how the fitted models use the speech features jointly. Moreover, Figure 6 indicates that multiple speech features (e.g., NVADJ, FW, TokTR-NVADJ, SCONJ, etc.) contributed to the fitted models’ outputs. The SHAP analysis suggests that the fitted classifier and regressor did not rely on a single feature (i.e., high frequency of content words) but rather on the joint weighting of several speech features. For example, in both fitted models, the combination of low density (low NVADJ) and lower lexical diversity (high TokTR-NVADJ) was associated with model outputs favoring the higher-score group or higher estimated BIS-11c scores. One hypothesis for future research could be to study a composite index showing the weighted contribution of the speech features. Our hypothesis is consistent with studies that have proposed indices to quantify aspects such as speech disorganization in patients with schizophrenia, bipolar disorder, and first-episode psychosis [54,55].
In contrast to previous studies that classified individuals with ADHD, the storyboard classification system yielded a lower accuracy (0.691 ± 0.011) in the testing set. Refs. [30,31] report an accuracy between 0.85 and 1.00 in the testing set during the classification of ADHD adolescents and the control group using a system trained with two features. The first is the frequency of functional words (FW). The second is the frequency of 3-g characters that are a sequence of three consecutive characters within a word. Even though [30,31] claim to perform hyperparameter tuning under a 10-fold cross-validation scheme with 44 participants, the testing metrics arise from a balanced sample composed of only four participants. Therefore, there are doubts about the representativeness of the accuracy reported by [30,31], as it could be the result of selection bias (i.e., testing set with fixed participants) or overfitting (i.e., there are many more features than participants considering the high dimensionality of features such as 3-g characters). Conversely, our result, although smaller in magnitude, was estimated using MCCV by averaging the testing performance across 400 iterations, each based on a random partition of the same 181 participants, with 10% allocated to the testing set.
On the other hand, our classification system outperformed the results of [18], which report an accuracy of 0.486 in discriminating Spanish-speaking participants with ADHD using a classifier of speech features from a storyboard. Notably, ref. [18] claim to achieve an accuracy of 0.943 when using features that quantify general language abilities. In the following, we detail some experiments that use the manually coded information and the general language abilities scores as features to evaluate their predictive power during the classification of the lower-score and higher-score groups.
Table 4 and Table 5 summarize the performance of the best classification and prediction systems, respectively, using manually coded information, general language abilities scores, and demographic variables. Compared with the speech feature models, all alternative feature sets resulted in lower classification and prediction performance.
Manually encoded information achieved a recall of 0.727 on the validation set and 0.702 on the testing set, while its precision was lower (0.621 on validation set and 0.639 on testing set) (see MCI in Table 4). This indicates that the classifier identified more participants in the higher-score group at the cost of increasing the rate of false positives. Likewise, manually encoded information yielded a negative coefficient of determination ( on validation set and on testing set), whereas the speech feature models achieved positive values across all elicitation methods during the prediction of BIS-11c scores (see Table 5). Hence, the manually encoded information models consistently achieved lower performance than the speech feature models in both the classification and prediction analyses.
The models based on general language ability scores showed the lowest performance across all metrics in both the classification and prediction analyses (see GLA in Table 4 and Table 5). This contrasts with the accuracy of 0.943 reported by [18] for classifying individuals with ADHD using information about general language abilities. However, this comparison should be interpreted cautiously because ADHD is a heterogeneous clinical condition that encompasses cognitive and behavioral characteristics beyond impulsivity. Thus, differences between the two studies should not be interpreted as reflecting differences in impulsivity alone; they may instead arise from differences in the populations studied, the constructs assessed, and the methodological approaches employed. A methodological difference is that [18] used the Children’s Communication Checklist-II to quantify pragmatic language disorder through parent or teacher reports, whereas we assessed participants’ performance during tasks involving naming, concept formation, reading comprehension, and verbal fluency.
The classification model using demographic information alone (age, sex, and school) achieved an accuracy of 0.616 on the testing set and 0.609 on the validation set (see Table 4). Likewise, the corresponding prediction model yielded a negative coefficient of determination ( on the validation set and on the testing set), indicating that demographic information alone showed limited predictive performance for estimating BIS-11c scores (see Table 5). Moreover, the demographic information models consistently achieved lower performance compared to speech feature models in both the classification and prediction analyses.
We conducted an additional set of experiments to evaluate whether demographic information influenced the performance of the best classification and prediction systems using speech features. Specifically, for each elicitation method, we retrained the corresponding best-performing model after augmenting the input feature set with demographic information while keeping the selected algorithm, hyperparameter values, window size, and feature configuration unchanged. Table 4 and Table 5 summarize the results of these additional experiments under the category Speech features + Demographic information. Particularly, incorporating demographic information into the best-performing speech feature models did not improve predictive performance. Across all evaluation metrics, performance was either maintained or reduced relative to the corresponding speech feature models.
To further assess the contribution of demographic information, we repeated the complete optimization pipeline after jointly incorporating speech features and demographic information into the candidate feature set. The optimization pipeline evaluated multiple linear and nonlinear prediction models together with feature configuration and hyperparameter optimization (see Section 2.4). If demographic variables contributed useful linear or nonlinear predictive information beyond the speech features, they could be retained by the optimization procedure. Nevertheless, age, sex, and school were consistently excluded from the final models across all elicitation methods. Hence, age, sex, and school were not retained as part of the best-performing models within the optimization framework.
Finally, the classification and prediction systems using speech features consistently achieved the best predictive performance compared with those based on manually coded information, general language abilities scores, and demographic information (see Table 4 and Table 5). We conducted additional experiments combining speech features from elicitation methods, manually encoded information features, general language abilities scores, and demographic information. Nevertheless, we did not find any statistically significant improvement compared with the reported classification and prediction systems.
4. Conclusions
Impulsivity represents a multifactorial personality-behavioral construct that is an aspect of human behavior and is understood as a symptom of various disorders such as ADHD. We analyze the current data from the Impulsivity corpus [34] using an automated linguistic-feature analysis to examine speech features and the impulsivity trait. Our main contribution lies in speech analysis, particularly in the extraction and study of speech features that may be associated with impulsivity.
Our findings reveal the need to control verbosity during speech analysis (see Figure 2 and Table A3 in Appendix A.4) to prevent verbal production from obscuring the findings and masking the speech features of impulsivity regarding an elicitation method.
In the unadjusted analyses, nominal between-group patterns were observed during the recall task with higher values for fillers and non-functional words in the higher-score group (see Figure 3). These differences did not remain statistically significant after BH correction and should therefore be considered exploratory. The direction of the filler pattern provides a tentative point of comparison with previous reports of greater disfluency in children with ADHD during recall tasks [35]. Likewise, the observed patterns in fillers and non-functional words may be relevant to aspects of discourse organization and fluency.
In the storyboard, the unadjusted analyses showed a nominal between-group pattern with lower lexical diversity in the higher-score group (see Figure 4J). Previous studies of children with ADHD have reported no significant between-group differences in lexical diversity during comparable narrative tasks [15,33]. We presume that the difference in results is due to the index used to measure lexical diversity. Future work could delve deeper into the analysis of these indices in the data of [15,33]. Nevertheless, some of these data are not publicly available, which limits the analysis.
Moreover, we observed a nominal pattern of higher content word use in the higher-score group (see Figure 4L). Together with the illustrative excerpts in Table 3, this pattern may be compatible with a more event-focused style of description with less explicit contextual or setting information in some narratives. Previous reports of reduced reference to setting elements in children with ADHD [21,25,56] provide a potentially relevant point of comparison. Future studies could directly examine whether BIS-11c scores are associated with differences in contextual integration or narrative coherence.
Furthermore, the unadjusted analyses showed a nominal between-group pattern of lower lexical diversity in the higher-score group during picture description (see Figure 5). A similar nominal pattern was observed in the storyboard. To our knowledge, previous work examining speech from picture description in children with ADHD has not reported lexical diversity measures. Thus, the present exploratory observation may motivate further investigation of this topic.
The nominal patterns observed in the storyboard and picture description may be consistent with lower lexical diversity in the higher-score group under conditions that provide visual support. Previous work suggests that external visual support may reduce some of the memory demands involved in discourse generation [33,49]. Future research should therefore test this possibility regarding measures of working memory and executive function.
Our results and analysis enable us to draw conclusions on three important aspects. First, ImpulsivityBank protocol facilitates the collection of speech samples from which a range of linguistic features can be extracted and explored in relation to the impulsivity trait in children and adolescents. Second, some of the exploratory nominal patterns observed in our unadjusted analyses are directionally consistent with findings reported in ADHD populations [25,32,35,36]. Third, the separate analyses of the three elicitation methods identified distinct speech features that differ between the lower-score and higher-score groups.
We present the performance of the classification and prediction systems considering the speech information of each elicitation method, the manually coded information, the general language abilities scores, and the demographic information (see Table 4 and Table 5). Across both classification and prediction analyses, the storyboard consistently yielded the best-performing systems. Nonetheless, while the speech features from the storyboard showed limited performance to estimate the continuous BIS-11c score, they supported discrimination between the lower-score and higher-score groups. To the best of our knowledge, we are the first to present classification and prediction systems considering speech features related to the impulsivity trait. Moreover, the SHAP analyses suggest that several speech features jointly contributed to the outputs of the fitted classification and prediction models in this sample (see Figure 6). Nonetheless, SHAP stability across resamples was not assessed; thus, these patterns should not be interpreted as evidence of a stable population-level speech profile. Future research could examine the stability of these feature contributions across resamples and explore a composite index representing their weighted contribution.
This paper has some limitations worth mentioning. Further studies with larger samples are needed to analyze the discursive profile of neurodevelopmental disorders or behavioral traits. For example, our corpus can potentially could be expanded by incorporating additional elicitation methods for social interactions where the participant needs to flexibly combine information in a changing environment [18]. Ref. [14] relates tasks to measure the youth’s comprehension of nonliteral language (e.g., irony, sarcasm, metaphor) and aspects of the social context. Likewise, conversational tasks are suitable for evaluating the child’s speech during a first-encounter conversation [27]. Furthermore, we can expand the Impulsivity corpus with speech samples obtained using elicitation methods from clinical language banks, thereby generating more experimental scenarios to recognize common discourse markers and deepen our understanding of language in diverse clinical conditions. Our future research efforts will aim to capture new speech samples.
Another limitation is that impulsivity was measured exclusively through self-report. Nevertheless, this population sample is part of a larger study where we took several additional variables assessing aggressiveness, empathy, depression, suicidal thoughts and other general mental health symptoms; these biosignals and biomarkers will be included in future analyses to explore other hypotheses. Those other measurements were considered not relevant for the aim of this paper.
We acknowledge that the BIS-11c scale has limitations due to the difficulty of statistically confirming the three impulsivity factors (i.e., motor impulsivity, cognitive impulsivity, and non-planning impulsivity) [37]. This limitation is particularly evident in samples of children and adolescents, where the factor structure is harder to identify because the dimensions of impulsivity appear less differentiated at early ages [39]. Consequently, we plan to conduct further analyses of impulsivity scores, recognizing that impulsivity is not a stable trait across the lifespan but changes with age and becomes more clearly differentiated as children grow older.
As far as we know, no study has used automatic strategies such as semantic vector representations and speech-based graphs to analyze the discourse of children and adolescents with ADHD or the impulsivity trait despite the benefits of these strategies. The most similar studies [10,22] examine the narrative discourse of adults with ADHD using speech graphs. Nevertheless, these studies lack representative samples (e.g., one has a sample of five individuals) and comparative speech analysis with typically developing participants. We hope to publish more robust experimentation scenarios and comparisons with other databases using our corpus data to model narrative discourse through automatic strategies.
Author Contributions
Conceptualization, M.G.-S.; methodology, M.G.-S., J.D.E.-C. and P.M.H.-G.; software, M.G.-S.; validation, M.G.-S., J.D.E.-C. and P.M.H.-G.; formal analysis, M.G.-S.; investigation, M.G.-S.; resources, J.D.E.-C. and P.M.H.-G.; data curation, M.G.-S.; writing—original draft preparation, M.G.-S.; writing—review and editing, J.D.E.-C. and P.M.H.-G.; visualization, M.G.-S. and J.D.E.-C.; supervision, J.D.E.-C. and P.M.H.-G.; project administration, J.D.E.-C. and P.M.H.-G.; funding acquisition, J.D.E.-C. and P.M.H.-G. All authors have read and agreed to the published version of the manuscript.
Funding
Our research is part of the project titled “Alianza Científica con Enfoque Comunitario para Mitigar Brechas de Atención y Manejo de Trastornos Mentales Relacionados con Impulsividad en Colombia—ACEMATE” (project number 111091991908), which is funded by the Ministerio de Ciencia, Tecnología e Innovación of Colombia.
Institutional Review Board Statement
The study was conducted in accordance with the Declaration of Helsinki and approved by the Institutional Review Board (or Ethics Committee) of Universidad Tecnológica de Pereira (endorsement 28-100522 dated 10 May 2022).
Informed Consent Statement
Informed consent was obtained from all subjects involved in the study. Moreover, written informed consent has been obtained from all subjects to publish this paper.
Data Availability Statement
The data supporting the findings of this study are available on request. The data are not publicly available due to confidentiality agreements.
Acknowledgments
Manuela Gómez-Suta acknowledges the support from the Training and Employment Program for high-level Human Capital in Clinical Research-Universidad Tecnológica de Pereira and the Doctoral Program in Engineering at the Universidad Tecnológica de Pereira, Colombia. During the preparation of this paper, the authors used the free versions of Gemini 3 Flash, Microsoft Copilot (continuously updated web service; Microsoft), and GPT-5.6 in order to assist the writing process in tasks such as translation, spell checking, style editing, stylistic refinement, synthesis and paraphrasing. After using this tool/service, the authors reviewed and edited the content as needed and take full responsibility for the content of the publication.
Conflicts of Interest
The authors declare no conflicts of interest. The funders had no role in the design of the study; in the collection, analyses, or interpretation of data; in the writing of the manuscript; or in the decision to publish the results.
Appendix A
Appendix A.1
Table A1.
Item-level descriptive statistics and corrected item–total correlations for the BIS-11c.
Appendix A.2
Figure A1.
Variation of the average standard deviation of accuracy and the average execution time (microseconds) according to the number of iterations in the Monte Carlo cross-validation strategy. We used 100 independent Logistic Regression models as a baseline to prevent our conclusions from depending on a specific hyperparameter configuration. We present the average standard deviation of accuracy and the average execution time of models varying iteration scales. In each case, the error bar is the sampling error with a 95% confidence level. As expected, accuracy dispersion and the corresponding sampling error decrease as the number of iterations increases. Nevertheless, this means that the execution time increases. We observe that the standard deviation of accuracy tends to stabilize at 400 iterations with a shorter execution time than in scenarios with a higher number of iterations. The experiments were conducted on a machine with an M2 processor and 32 GB of RAM.
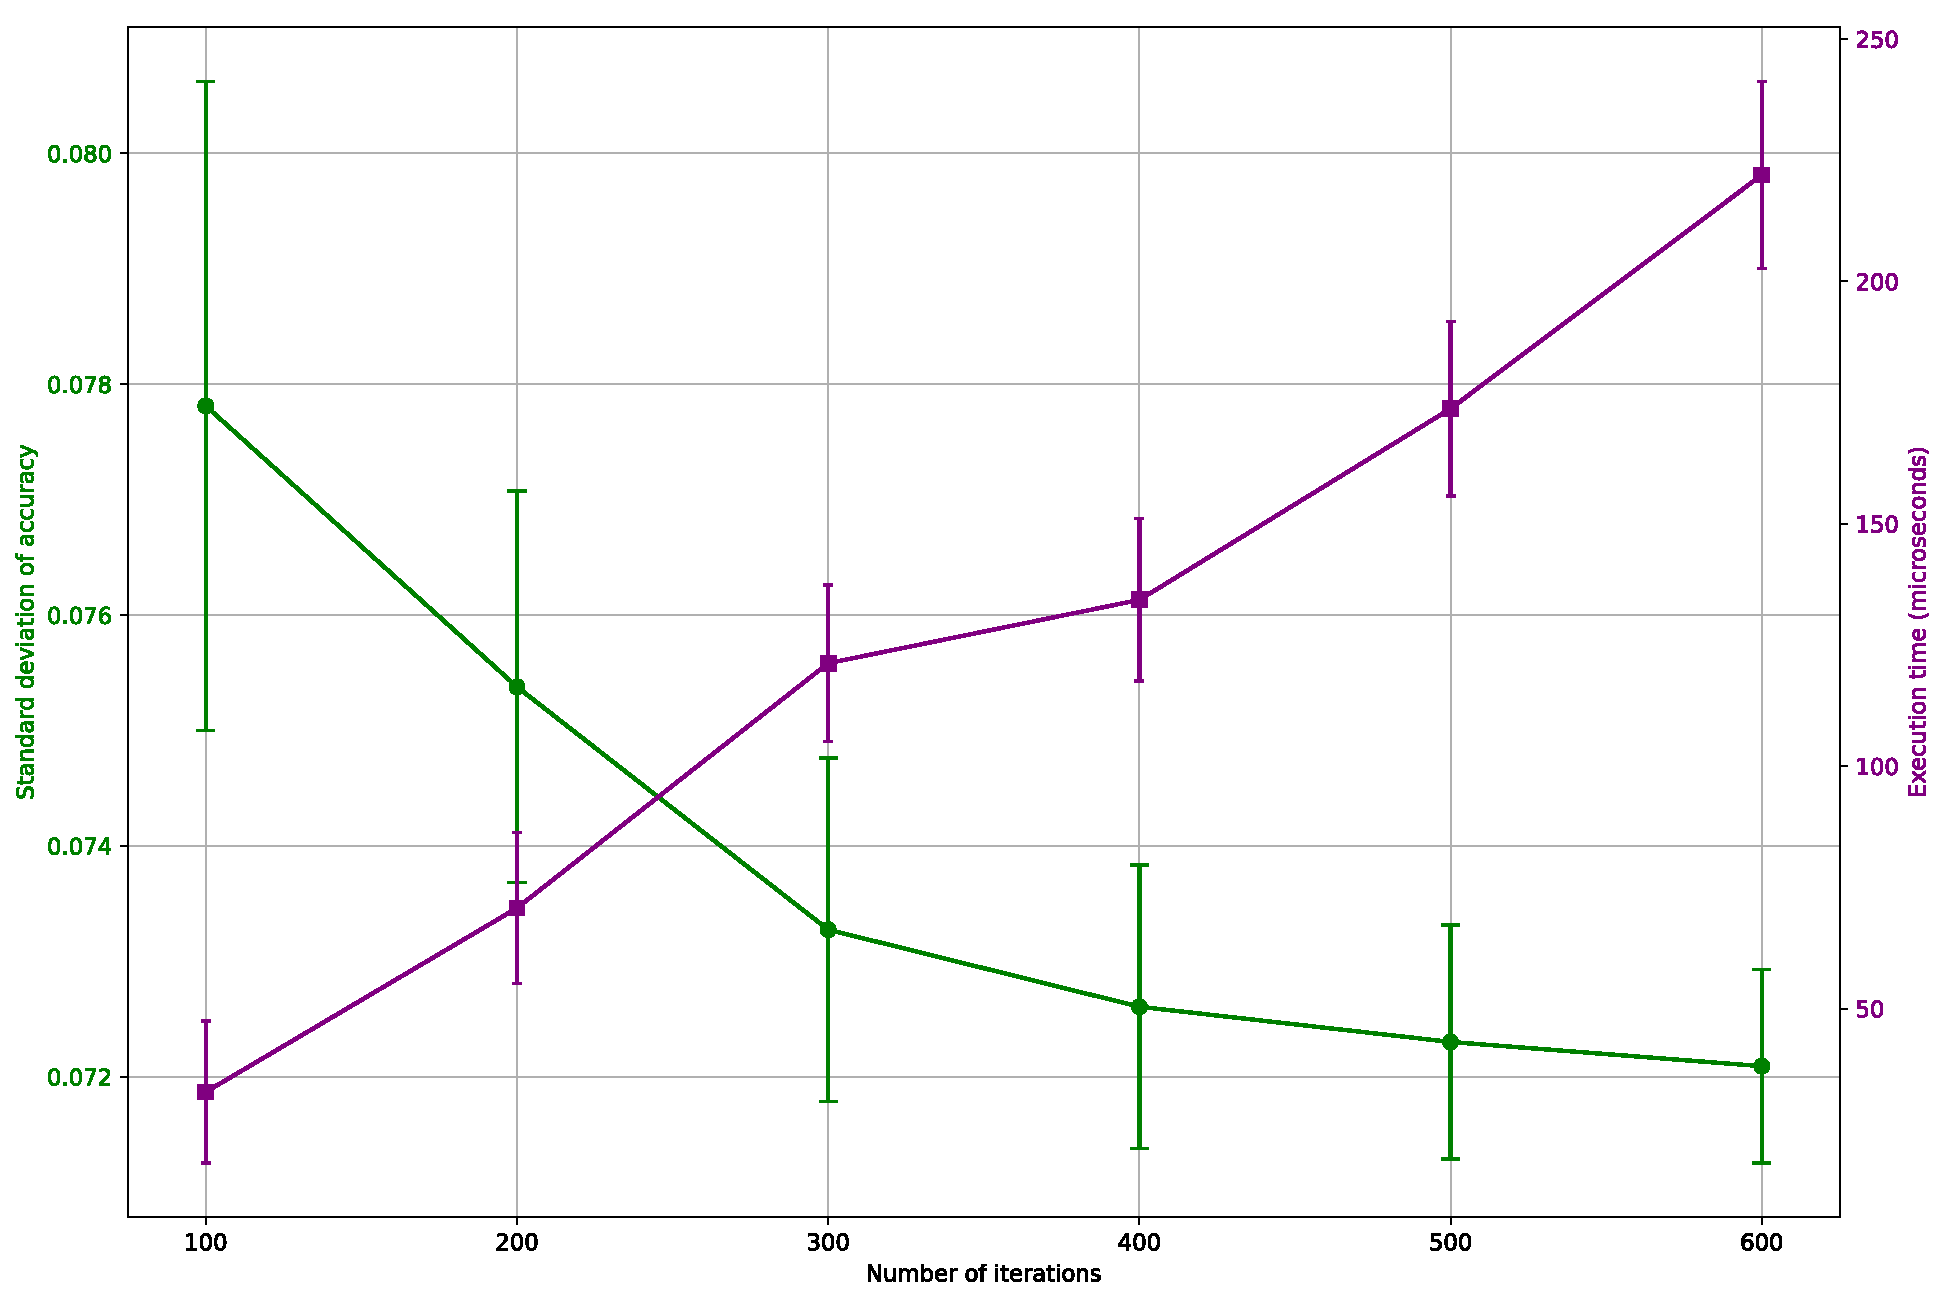
Appendix A.3
Table A2.
Feature-level between-group comparisons for full transcript analyses across elicitation methods.
Appendix A.4
Table A3.
Spearman’s correlation between each feature and the number of words in each elicitation method.
Appendix A.5
Table A4.
Feature-level between-group comparisons for verbosity-controlled analyses across word-window sizes and elicitation methods.
Appendix A.6
Table A5.
Paired performance differences between the speech feature classification systems.
Appendix A.7
Table A6.
Details of the best-performing classification systems.
Appendix A.8
Table A7.
Details of the best-performing prediction systems.
References
- Moeller, F.; Barratt, E.; Dougherty, D.; Schmitz, J.; Swann, A. Psychiatric aspects of impulsivity. Am. J. Psychiatry 2001, 158, 1783–1793. [Google Scholar] [CrossRef] [Scilit] [PubMed]
- Daruna, J.H.; Barnes, P.A. A neurodevelopmental view of impulsivity. In The Impulsive Client: Theory, Research, and Treatment; McCown, W.G., Johnson, J.L., Shure, M.B., Eds.; American Psychological Association: Washington, DC, USA, 1993; pp. 23–37. [Google Scholar] [CrossRef] [Scilit]
- Stanford, M.S.; Mathias, C.W.; Dougherty, D.M.; Lake, S.L.; Anderson, N.E.; Patton, J.H. Fifty years of the Barratt Impulsiveness Scale: An update and review. Personal. Individ. Differ. 2009, 47, 385–395. [Google Scholar] [CrossRef] [Scilit]
- Plichta, M.M.; Scheres, A. Ventral-striatal responsiveness during reward anticipation in ADHD and its relation to trait impulsivity in the healthy population: A meta-analytic review of the fMRI literature. Neurosci. Biobehav. Rev. 2014, 38, 125–134. [Google Scholar] [CrossRef] [Scilit] [PubMed]
- Fariba, K.A.; Gokarakonda, S.B. Impulse Control Disorders; StatPearls Publishing: Saint Petersburg, FL, USA, 2023. [Google Scholar]
- Wang, X.Q.; Albitos, P.J.; Hao, Y.F.; Zhang, H.; Yuan, L.X.; Zang, Y.F. A review of objective assessments for hyperactivity in attention deficit hyperactivity disorder. J. Neurosci. Methods 2022, 370, 109479. [Google Scholar] [CrossRef] [Scilit] [PubMed]
- Lee, E.H.; Sinclair-McBride, K.R.; DeMaso, D.R.; Walter, H.J. Disruptive, Impulse-Control, and Conduct Disorders. In Nelson Textbook of Pediatrics, 22nd ed.; Kliegman, R.M., St. Geme, J.W., III, Eds.; Elsevier: Amsterdam, The Netherlands, 2024; Chapter 42; pp. 277–280.e1. [Google Scholar] [CrossRef]
- Elbourn, E.; MacWhinney, B.; Fromm, D.; Power, E.; Steel, J.; Togher, L. TBIBank: An International Shared Database to Enhance Research, Teaching and Automated Language Analysis for Traumatic Brain Injury Populations. Arch. Phys. Med. Rehabil. 2023, 104, 824–829. [Google Scholar] [CrossRef] [Scilit] [PubMed]
- Mota, N.B.; Weissheimer, J.; Finger, I.; Ribeiro, M.; Malcorra, B.; Hübner, L. Speech as a Graph: Developmental Perspectives on the Organization of Spoken Language. Biol. Psychiatry Cogn. Neurosci. Neuroimaging 2023, 8, 985–993. [Google Scholar] [CrossRef] [Scilit] [PubMed]
- Coelho, R.M.; Drummond, C.; Mota, N.B.; Erthal, P.; Bernardes, G.; Lima, G.; Molina, R.; Sudo, F.K.; Tannock, R.; Mattos, P. Network analysis of narrative discourse and attention-deficit hyperactivity symptoms in adults. PLoS ONE 2021, 16, e0245113. [Google Scholar] [CrossRef] [Scilit] [PubMed]
- Jepsen, I.B.; Hougaard, E.; Matthiesen, S.T.; Lambek, R. A Systematic Review and Meta-analysis of Narrative Language Abilities in Children with Attention-Deficit/Hyperactivity Disorder. Res. Child Adolesc. Psychopathol. 2022, 50, 737–751. [Google Scholar] [CrossRef] [Scilit] [PubMed]
- Hinzen, W.; Palaniyappan, L. The ‘L-factor’: Language as a transdiagnostic dimension in psychopathology. Prog. Neuro-Psychopharmacol. Biol. Psychiatry 2024, 131, 110952. [Google Scholar] [CrossRef] [Scilit] [PubMed]
- Newson, J.J.; Hunter, D.; Thiagarajan, T.C. The Heterogeneity of Mental Health Assessment. Front. Psychiatry 2020, 11, 76. [Google Scholar] [CrossRef] [Scilit] [PubMed]
- Carruthers, S.; Taylor, L.; Sadiq, H.; Tripp, G. The profile of pragmatic language impairments in children with ADHD: A systematic review. Dev. Psychopathol. 2022, 34, 1938–1960. [Google Scholar] [CrossRef] [Scilit]
- Kuijper, S.J.M.; Hartman, C.A.; Bogaerds-Hazenberg, S.T.M.; Hendriks, P. Narrative production in children with autism spectrum disorder (ASD) and children with attention-deficit/hyperactivity disorder (ADHD): Similarities and differences. J. Abnorm. Psychol. 2017, 126, 63–75. [Google Scholar] [CrossRef] [Scilit] [PubMed]
- Westby, C.; Watson, S.M.R. ADHD and Communication Disorders. In The Handbook of Language and Speech Disorders, 2nd ed.; Wiley: Hoboken, NJ, USA, 2021; Chapter 23; pp. 531–570. [Google Scholar] [CrossRef] [Scilit]
- Papaeliou, C.F.; Maniadaki, K.; Kakouros, E. Association Between Story Recall and Other Language Abilities in Schoolchildren with ADHD. J. Atten. Disord. 2015, 19, 53–62. [Google Scholar] [CrossRef] [Scilit] [PubMed]
- Baixauli Fortea, I.; Berenguer Forner, C.; Colomer, C.; Casas, A.M.; Miranda, B.R. Communicative skills in Spanish children with Autism Spectrum Disorder and children with Attention Deficit Hyperactivity Disorder. Analysis through parents’ perceptions and narrative production. Res. Autism Spectr. Disord. 2018, 50, 22–31. [Google Scholar] [CrossRef] [Scilit]
- Bergman, A.; Hallin, A.E. The effect of picture support on narrative retells in Swedish adolescents with ADHD. Clin. Linguist. Phon. 2021, 35, 690–705. [Google Scholar] [CrossRef] [Scilit] [PubMed]
- Vassiliu, C.; Mouzaki, A.; Antoniou, F.; Ralli, A.M.; Diamanti, V.; Papaioannou, S.; Katsos, N. Development of Structural and Pragmatic Language Skills in Children with Attention-Deficit/Hyperactivity Disorder. Commun. Disord. Q. 2023, 44, 207–218. [Google Scholar] [CrossRef] [Scilit]
- Jepsen, I.B.; Brynskov, C.; Thomsen, P.H.; Rask, C.U.; Lambek, R. The association between attention-deficit/hyperactivity disorder and narrative language: What is the role of executive function? JCPP Adv. 2025, 5, e70007. [Google Scholar] [CrossRef] [Scilit] [PubMed]
- Coelho, R.M.; Mattos, P.; Tannock, R. Attention-deficit hyperactivity disorder (ADHD) and narrative discourse in older adults. Dement. Neuropsychol. 2018, 12, 374–379. [Google Scholar] [CrossRef] [Scilit] [PubMed]
- Kuijper, S.J.M.; Hartman, C.A.; Hendriks, P. Who Is He? Children with ASD and ADHD Take the Listener into Account in Their Production of Ambiguous Pronouns. PLoS ONE 2015, 10, e0132408. [Google Scholar] [CrossRef] [Scilit] [PubMed]
- Ratner, N.B.; MacWhinney, B. Fluency Bank: A new resource for fluency research and practice. J. Fluen. Disord. 2018, 56, 69–80. [Google Scholar] [CrossRef] [Scilit] [PubMed]
- Parigge, E. Language and Executive Functioning in Children with ADHD. Ph.D. Thesis, Universiteit van Amsterdam, Amsterdam, The Netherlands, 2012. [Google Scholar]
- Lanzi, A.M.; Saylor, A.K.; Fromm, D.; Liu, H.; Macwhinney, B.; Cohen, M.L. DementiaBank: Theoretical Rationale, Protocol, and Illustrative Analyses. Am. J. Speech-Lang. Pathol. 2023, 32, 426–438. [Google Scholar] [CrossRef] [Scilit] [PubMed]
- Minga, J.; Johnson, M.; Blake, M.L.; Fromm, D.; MacWhinney, B. Making Sense of Right Hemisphere Discourse Using RHDBank. Top. Lang. Disord. 2021, 41, 99–122. [Google Scholar] [CrossRef] [Scilit] [PubMed]
- Zaher, F.; Diallo, M.; Achim, A.M.; Joober, R.; Roy, M.A.; Demers, M.F.; Subramanian, P.; Lavigne, K.M.; Lepage, M.; Gonzalez, D.; et al. Speech markers to predict and prevent recurrent episodes of psychosis: A narrative overview and emerging opportunities. Schizophr. Res. 2024, 266, 205–215. [Google Scholar] [CrossRef] [Scilit] [PubMed]
- Corcoran, C.M.; Cecchi, G.A. Using Language Processing and Speech Analysis for the Identification of Psychosis and Other Disorders. Biol. Psychiatry Cogn. Neurosci. Neuroimaging 2020, 5, 770–779. [Google Scholar] [CrossRef] [Scilit] [PubMed]
- Barrios, J.; Gabay, S.; Cafiero, F.; Debbané, M. Detecting Psychological Disorders with Stylometry: The Case of ADHD in Adolescent Autobiographical Narratives. In Proceedings of the Workshop on Computational Humanities Research, Paris, France, 6–8 December 2023. [Google Scholar]
- Barrios, J.; Poznyak, E.; Lee Samson, J.; Rafi, H.; Gabay, S.; Cafiero, F.; Debbané, M. Detecting ADHD through natural language processing and stylometric analysis of adolescent narratives. Front. Child Adolesc. Psychiatry 2025, 4, 1519753. [Google Scholar] [CrossRef] [Scilit] [PubMed]
- Lorch, E.P.; Milich, R.; Flake, R.A.; Ohlendorf, J.; Little, S. A Developmental Examination of Story Recall and Coherence Among Children with ADHD. J. Abnorm. Child Psychol. 2010, 38, 291–301. [Google Scholar] [CrossRef] [Scilit] [PubMed]
- Bijnens, A.; Pistono, A. Disfluency production in children with attention-deficit/hyperactivity disorder during a narrative task. Speech Commun. 2025, 171, 103244. [Google Scholar] [CrossRef] [Scilit]
- Gómez-Suta, M.; Echeverry-Correa, J.; Herrera Gómez, P. ImpulsivityBank protocol: Standardized discourse protocol for the investigation of speech in relation to impulsivity trait in children and adolescents. Preprints 2026. [Google Scholar] [CrossRef] [Scilit]
- Lee, H.; Sim, H.; Lee, E.; Choi, D. Disfluency characteristics of children with attention-deficit/hyperactivity disorder symptoms. J. Commun. Disord. 2017, 65, 54–64. [Google Scholar] [CrossRef] [Scilit] [PubMed]
- Ygual-Fernández, A.; Roselló-Miranda, B.; Miranda-Casas, A. Funciones ejecutivas, comprensión de historias y coherencia narrativa en niños con trastorno por déficit de atención con hiperactividad. Rev. Logop. Foniatría Audiol. 2010, 30, 151–161. [Google Scholar] [CrossRef] [Scilit]
- Chahín Pinzón, N. Barratt children impulsivity scale (BIS-11c): Colombian considerations and reflections. Psicogente 2015, 18, 389–398. [Google Scholar] [CrossRef] [Scilit]
- Chahín Pinzón, N.; Cosi, S.; Lorenzo-Seva, U.; Vigil-Colet, A. Stability of the factor structure of barrat’s impulsivity scales for children across cultures: A comparison of Spain and Colombia. Psicothema 2010, 22, 983–989. [Google Scholar]
- Chahín Pinzón, N.; Moncada Duarte, C.E.; Acosta Salazar, H.U. Study of the psychometric properties of the Barratt Impulsiveness Scale (BIS-11) in children and adolescents. Ter. Psicológica 2019, 37, 129–140. [Google Scholar] [CrossRef] [Scilit]
- Barratt, E.S. Impulsiveness Subtraits: Arousal and Information Processing. In Motivation, Emotion, and Personality; Spence, J.T., Izard, C.E., Eds.; Elsevier: Amsterdam, The Netherlands, 1985; pp. 137–146. [Google Scholar]
- Wehrli, J.E. Neurobiological and Neuropsychological Deep Endophenotypes of Behavioral Response Inhibition: RDoC Empirical and Mathematical AI Feature Engineering. Dissertation Thesis, Northcentral University, San Diego, CA, USA, 2025. [Google Scholar]
- Hüpen, P.; Kumar, H.; Shymanskaya, A.; Swaminathan, R.; Habel, U. Impulsivity Classification Using EEG Power and Explainable Machine Learning. Int. J. Neural Syst. 2023, 33, 2350006. [Google Scholar] [CrossRef] [Scilit] [PubMed]
- Matute, E.; Rosselli, M.; Ardila, A.; Ostrosky, F. Evaluación Neuropsicológica Infantil (ENI-2); Editorial Manual Moderno: Mexico City, Mexico, 2013. [Google Scholar]
- Mayer, M. Frog Goes to Dinner; Wordless Picture Book; Dial Press: New York, NY, USA, 1974; p. 32. [Google Scholar]
- Berube, S.; Nonnemacher, J.; Demsky, C.; Glenn, S.; Saxena, S.; Wright, A.; Tippett, D.C.; Hillis, A.E. Stealing cookies in the twenty-first century: Measures of spoken narrative in healthy versus speakers with aphasia. Am. J. Speech-Lang. Pathol. 2019, 28, 321–329. [Google Scholar] [CrossRef] [Scilit] [PubMed]
- Mota, N.B.; Furtado, R.; Maia, P.P.; Copelli, M.; Ribeiro, S. Graph analysis of dream reports is especially informative about psychosis. Sci. Rep. 2014, 4, 3691. [Google Scholar] [CrossRef] [Scilit] [PubMed]
- Mota, N.B.; Sigman, M.; Cecchi, G.; Copelli, M.; Ribeiro, S. The maturation of speech structure in psychosis is resistant to formal education. npj Schizophr. 2018, 4, 25. [Google Scholar] [CrossRef] [Scilit] [PubMed]
- Trabasso, T.; Rodkin, P.C. Knowledge of Goal/Plans: A Conceptual Basis for Narrating Frog, Where Are You? In Relating Events in Narrative: A Cross-Linguistic Developmental Study; Berman, R.A., Slobin, D.I., Eds.; Lawrence Erlbaum Associates: Hillsdale, NJ, USA, 1994; pp. 85–106. [Google Scholar]
- Kleiman, M.J.; Galvin, J.E. High frequency post-pause word choices and task-dependent speech behavior characterize connected speech in individuals with mild cognitive impairment. J. Alzheimer’s Dis. 2024, 102, 815–829. [Google Scholar] [CrossRef] [Scilit] [PubMed]
- Chen, Y.; Hartsuiker, R.J.; Pistono, A. A comparison of different connected-speech tasks for detecting mild cognitive impairment using multivariate pattern analysis. Aphasiology 2025, 39, 476–499. [Google Scholar] [CrossRef] [Scilit]
- Clarke, N.; Barrick, T.R.; Garrard, P. A Comparison of Connected Speech Tasks for Detecting Early Alzheimer’s Disease and Mild Cognitive Impairment Using Natural Language Processing and Machine Learning. Front. Comput. Sci. 2021, 3, 634360. [Google Scholar] [CrossRef] [Scilit]
- Yih, T.; Yang, H.; Huang, L.; Yao, Q. Identifying syntactic biomarkers of cognitive impairment in Mandarin-speaking older adults by applying machine learning approaches across multiple speech tasks. Aphasiology 2026, 40, 1509–1538. [Google Scholar] [CrossRef] [Scilit]
- Lundberg, S.M.; Lee, S.I. A Unified Approach to Interpreting Model Predictions. In Proceedings of the Advances in Neural Information Processing Systems 30 (NIPS 2017), Long Beach, CA, USA, 4–9 December 2017; pp. 4765–4774. [Google Scholar]
- Mota, N.B.; Ribeiro, M.; Malcorra, B.L.C.; Atídio, J.P.; Haguiara, B.; Gadelha, A. Happy thoughts: What computational assessment of connectedness and emotional words can inform about early stages of psychosis. Schizophr. Res. 2023, 259, 38–47. [Google Scholar] [CrossRef] [Scilit] [PubMed]
- Mota, N.B.; Copelli, M.; Ribeiro, S. Thought disorder measured as random speech structure classifies negative symptoms and schizophrenia diagnosis 6 months in advance. npj Schizophr. 2017, 3, 18. [Google Scholar] [CrossRef] [Scilit] [PubMed]
- Zenaro, M.P.; Rossi, N.F.; de Souza, A.L.D.M.; Giacheti, C.M. Oral narrative structure and coherence of children with attention deficit hyperactivity disorder. CoDAS 2019, 31, e20180197. [Google Scholar] [CrossRef] [Scilit] [PubMed]
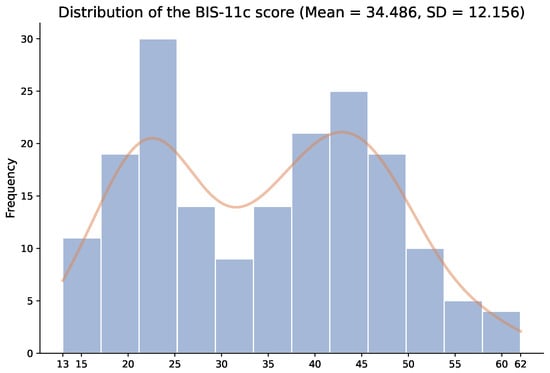
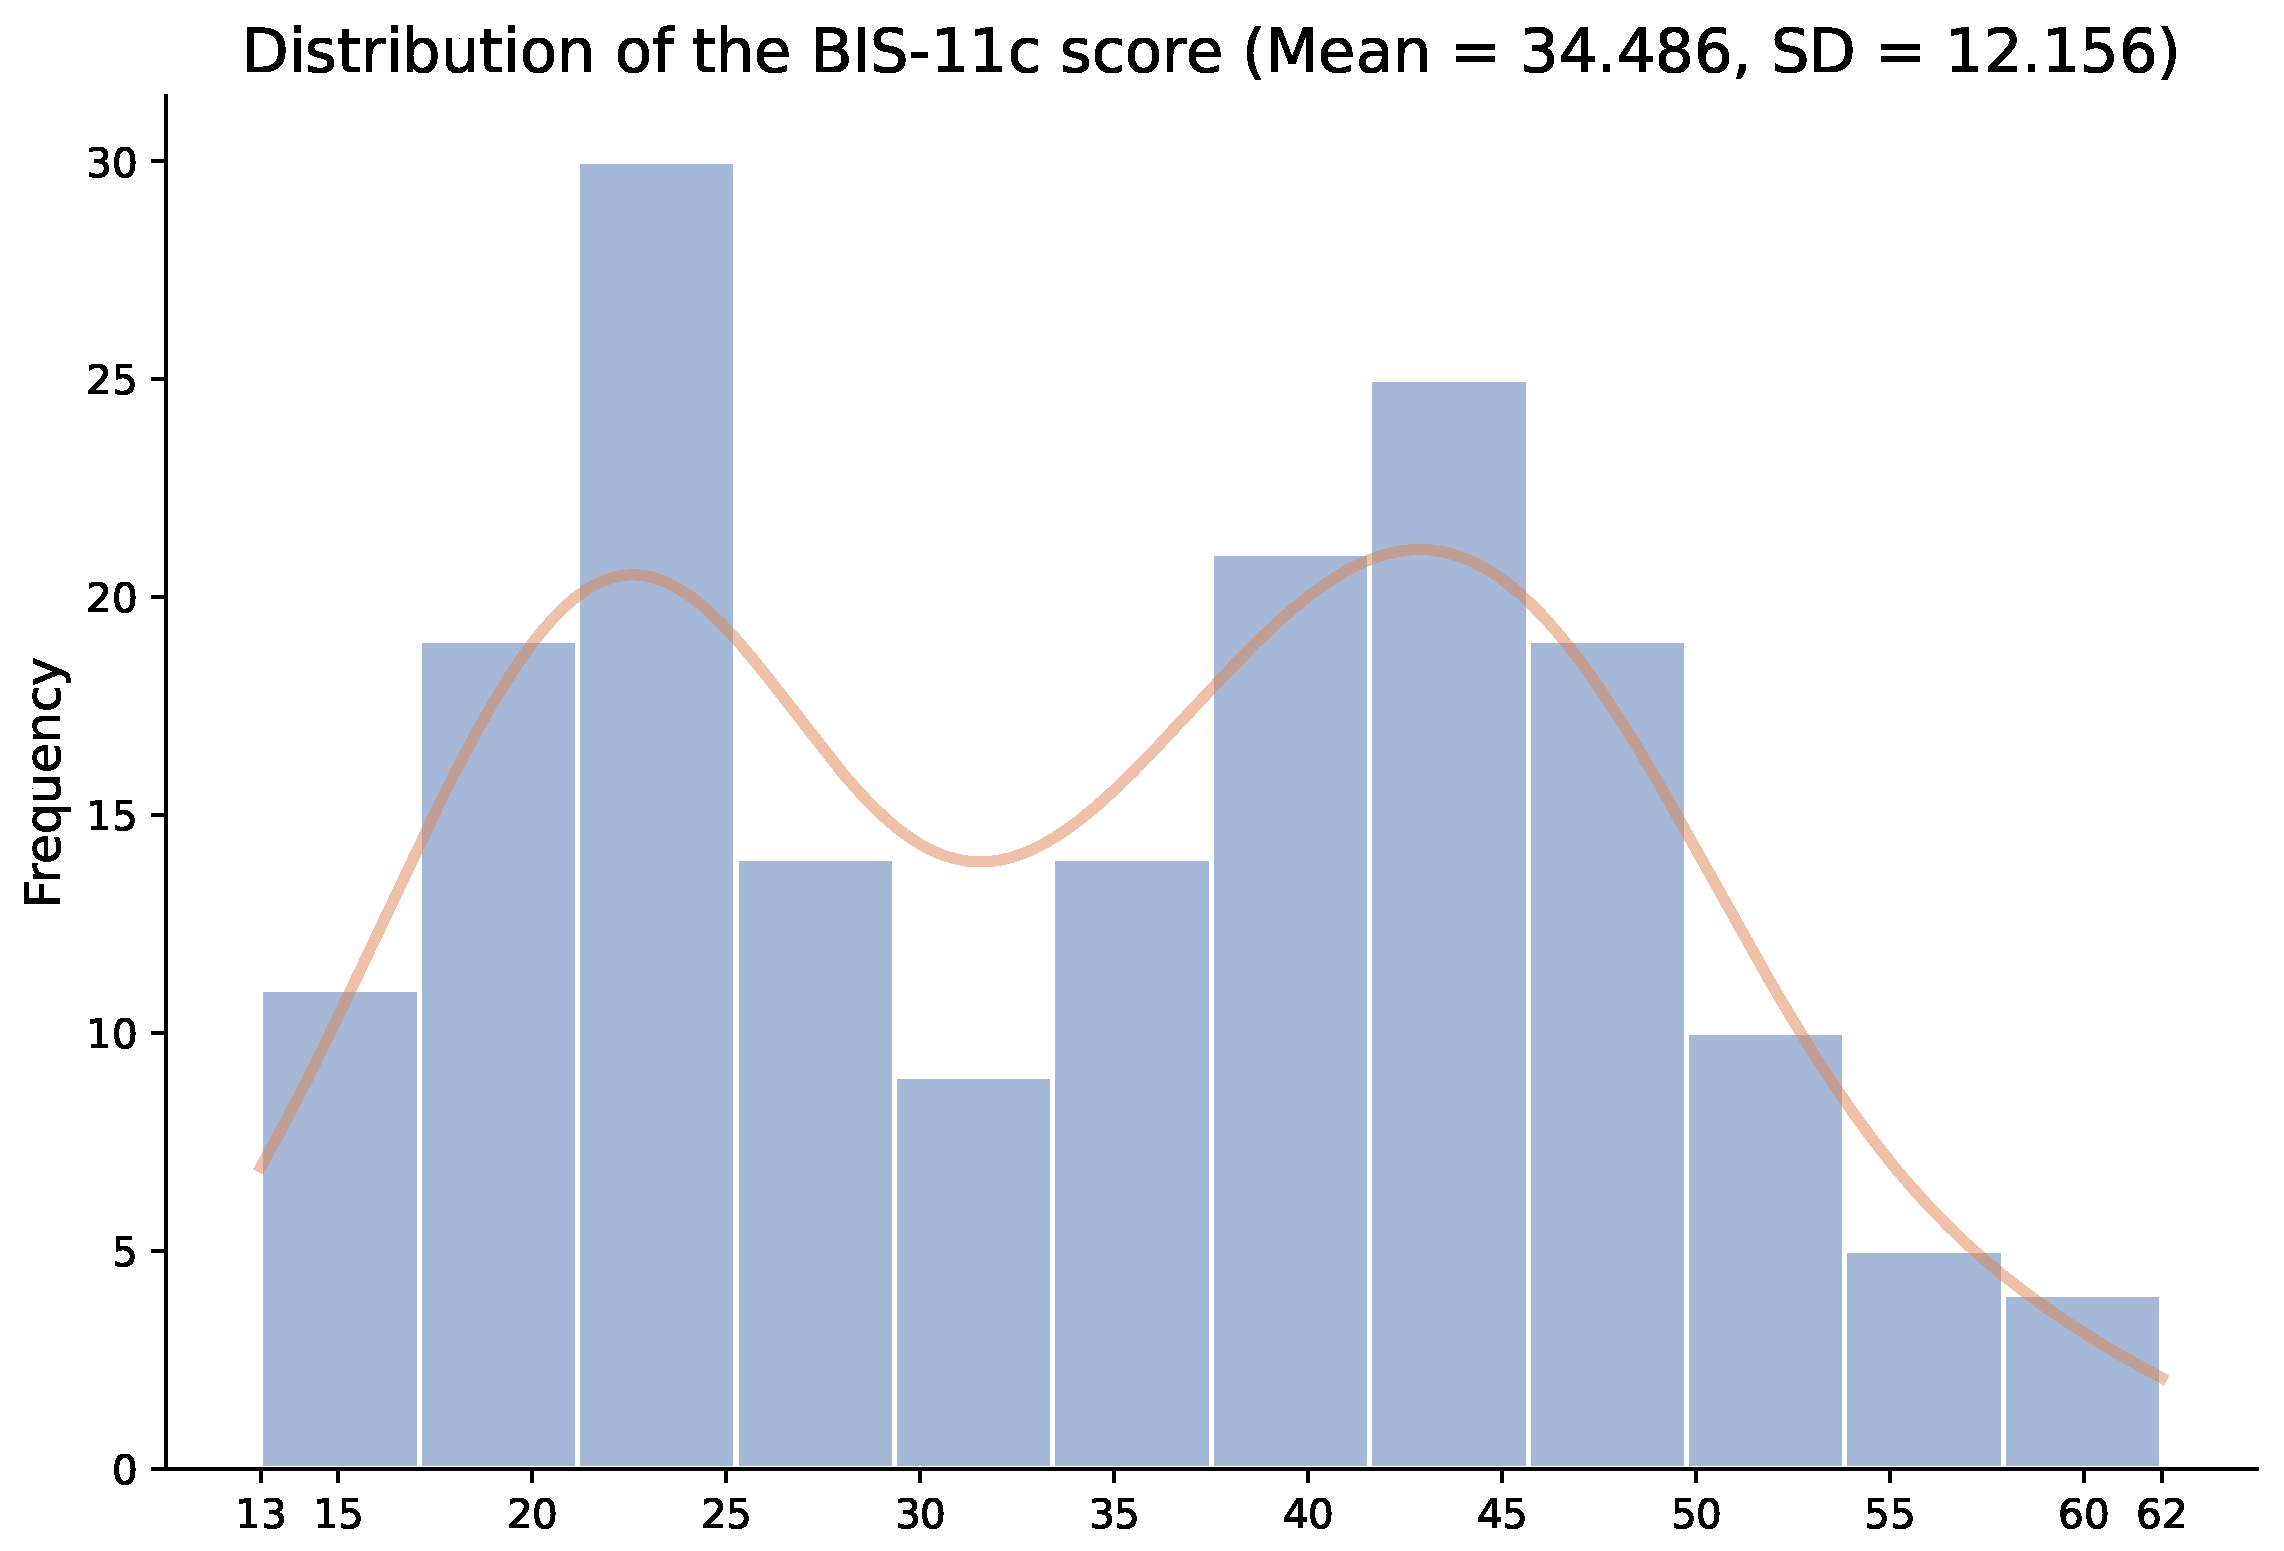
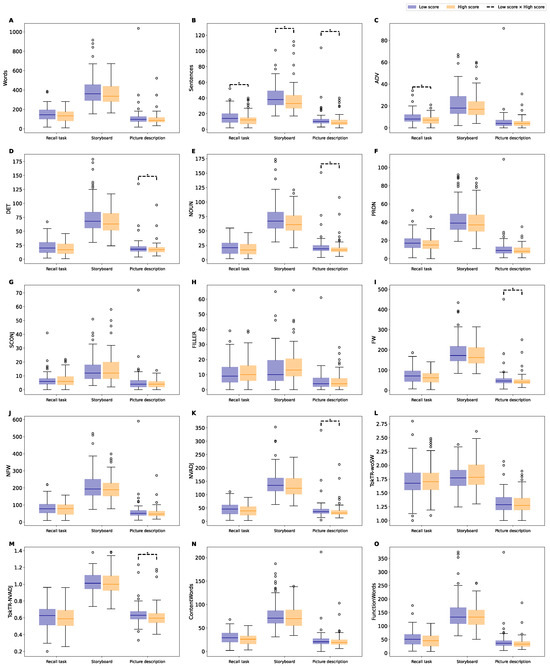
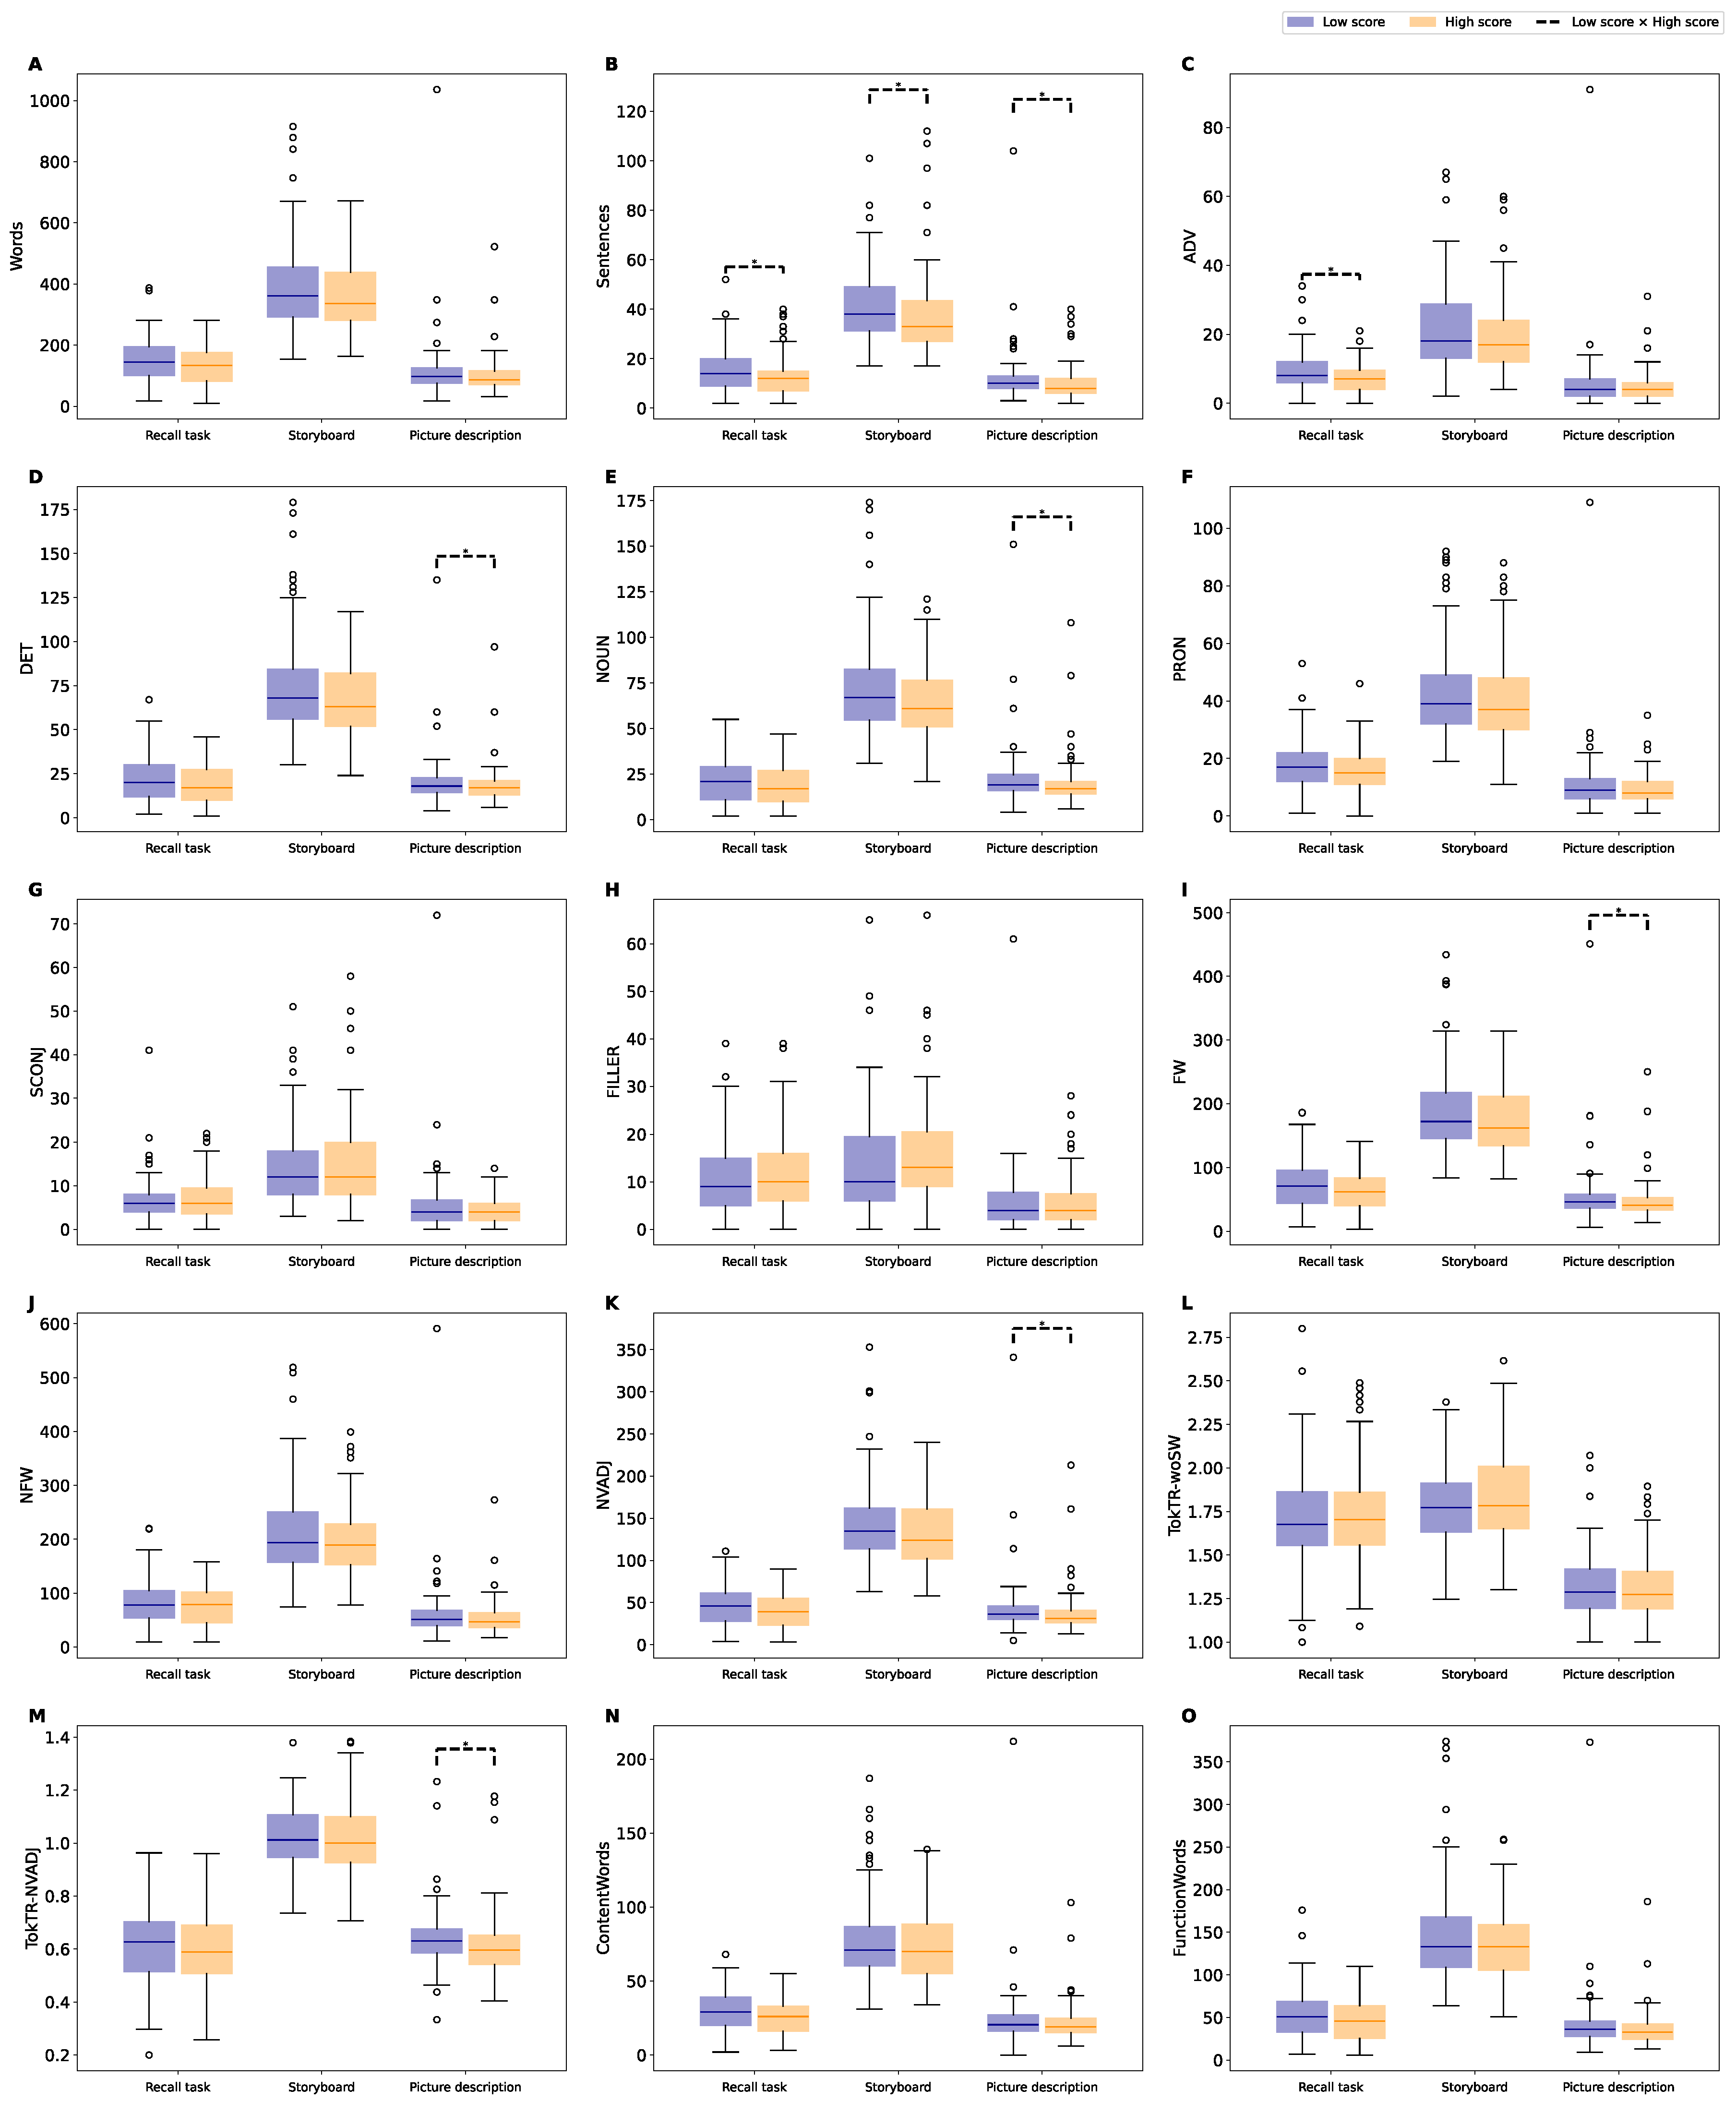
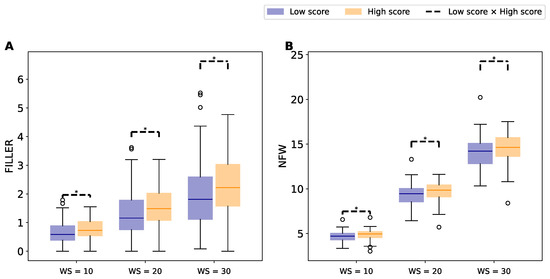
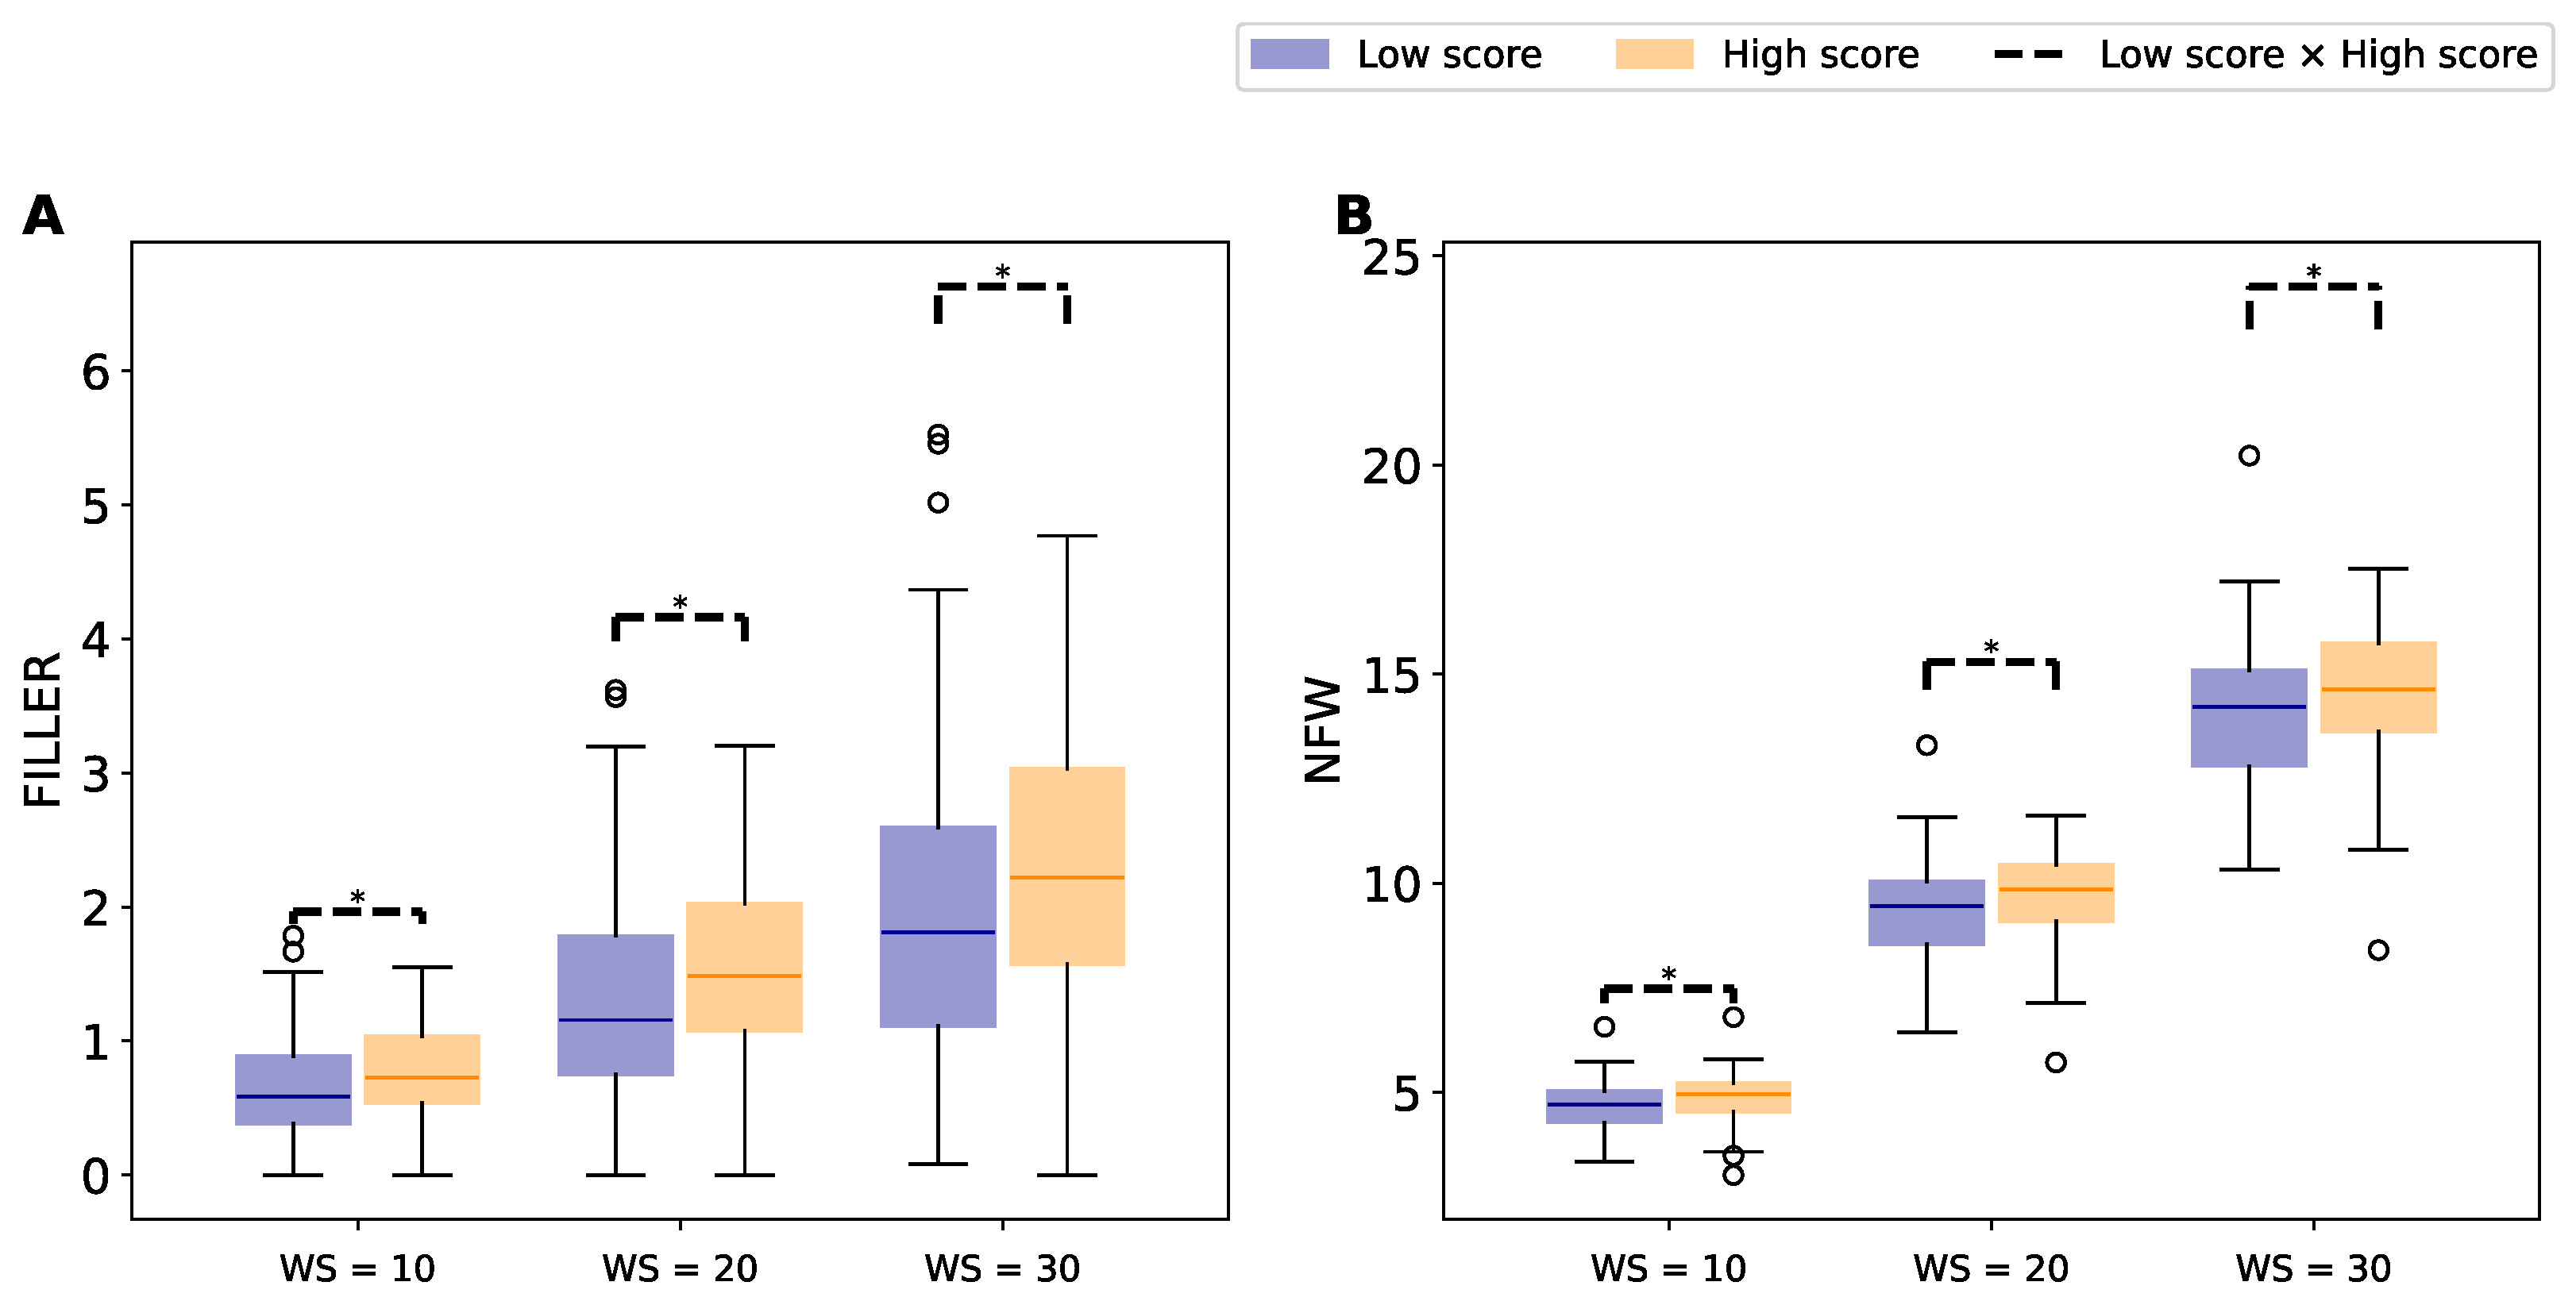
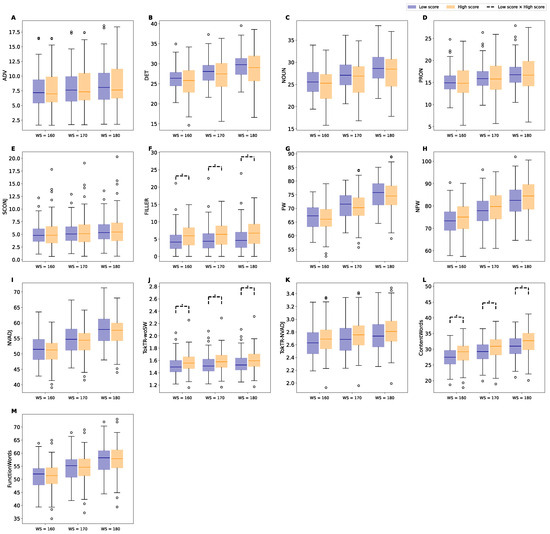
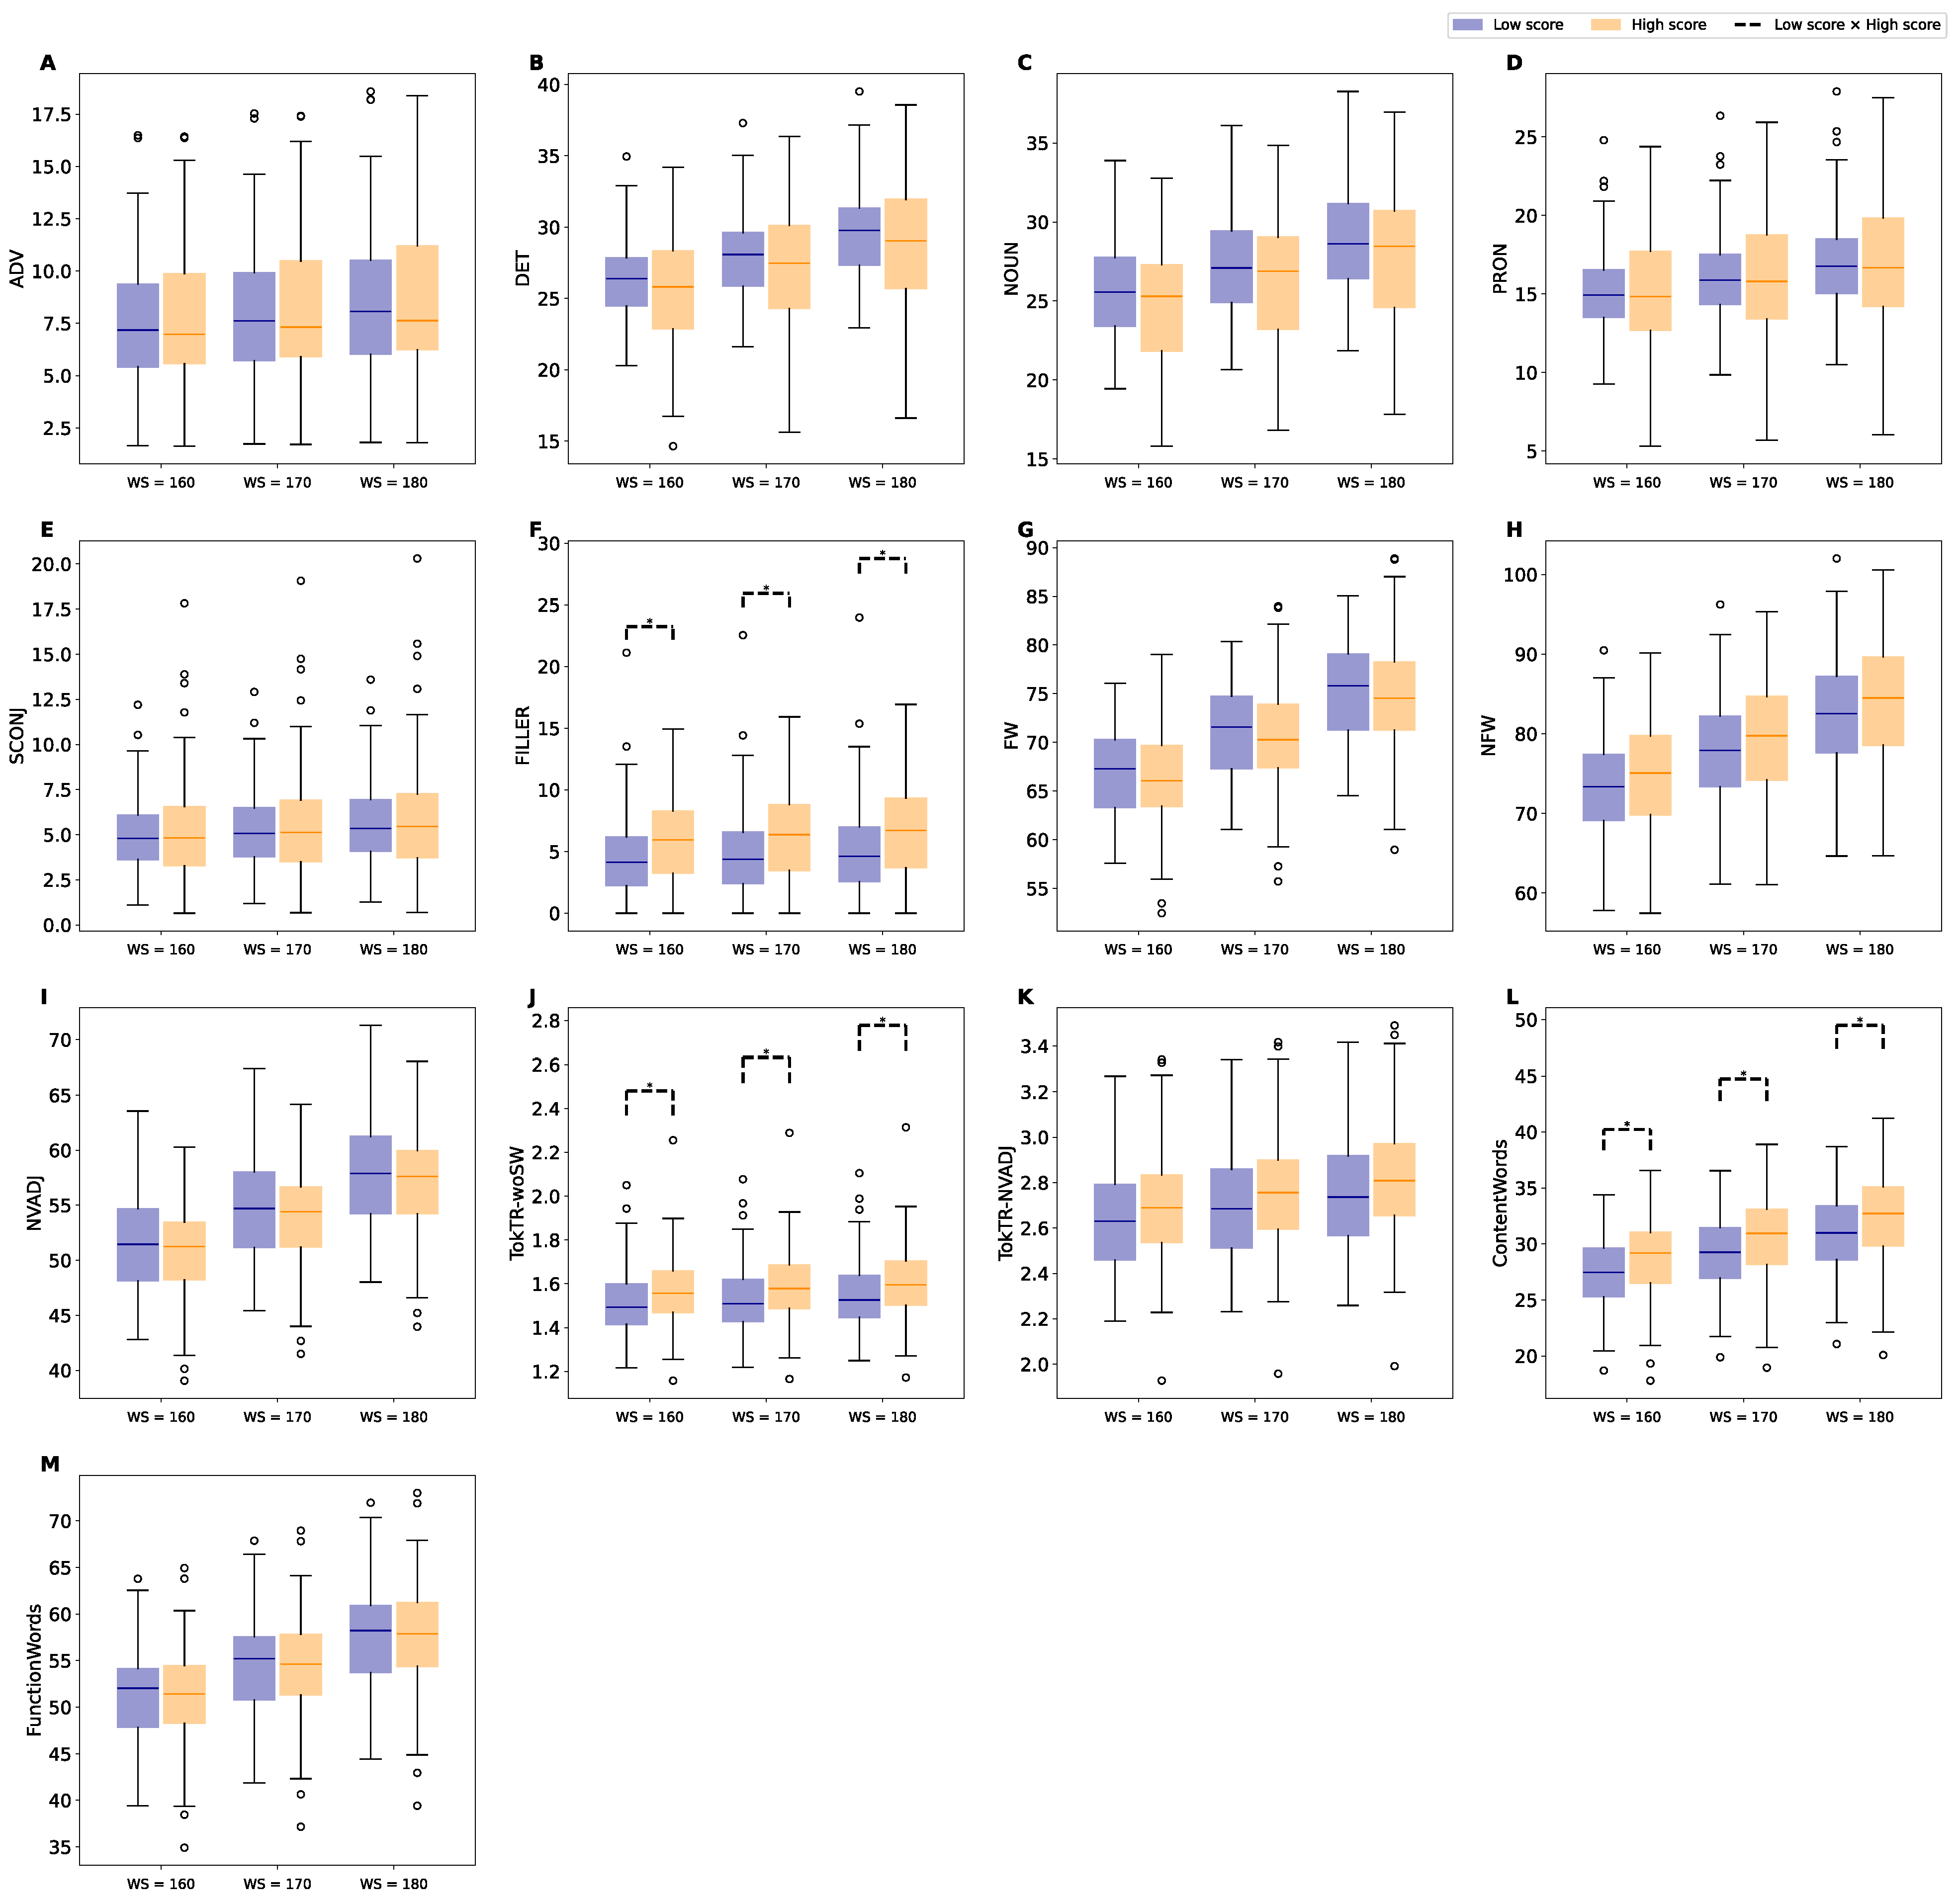
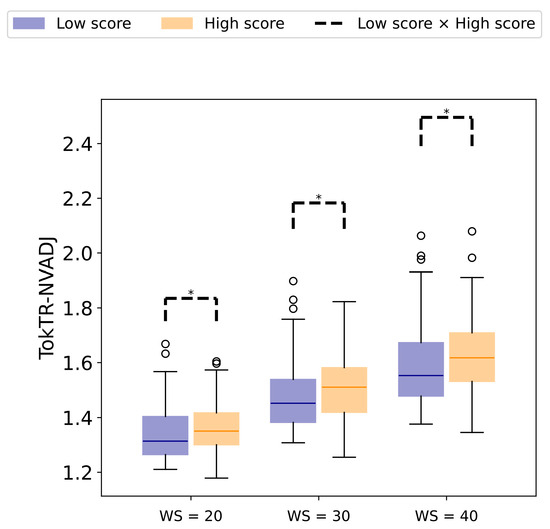
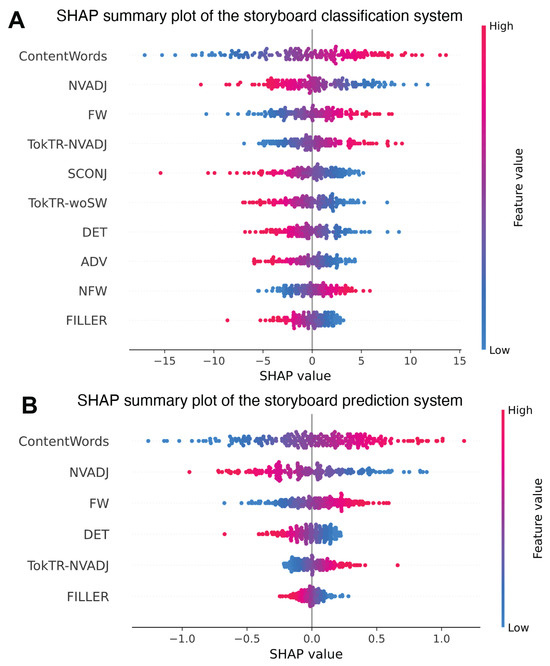
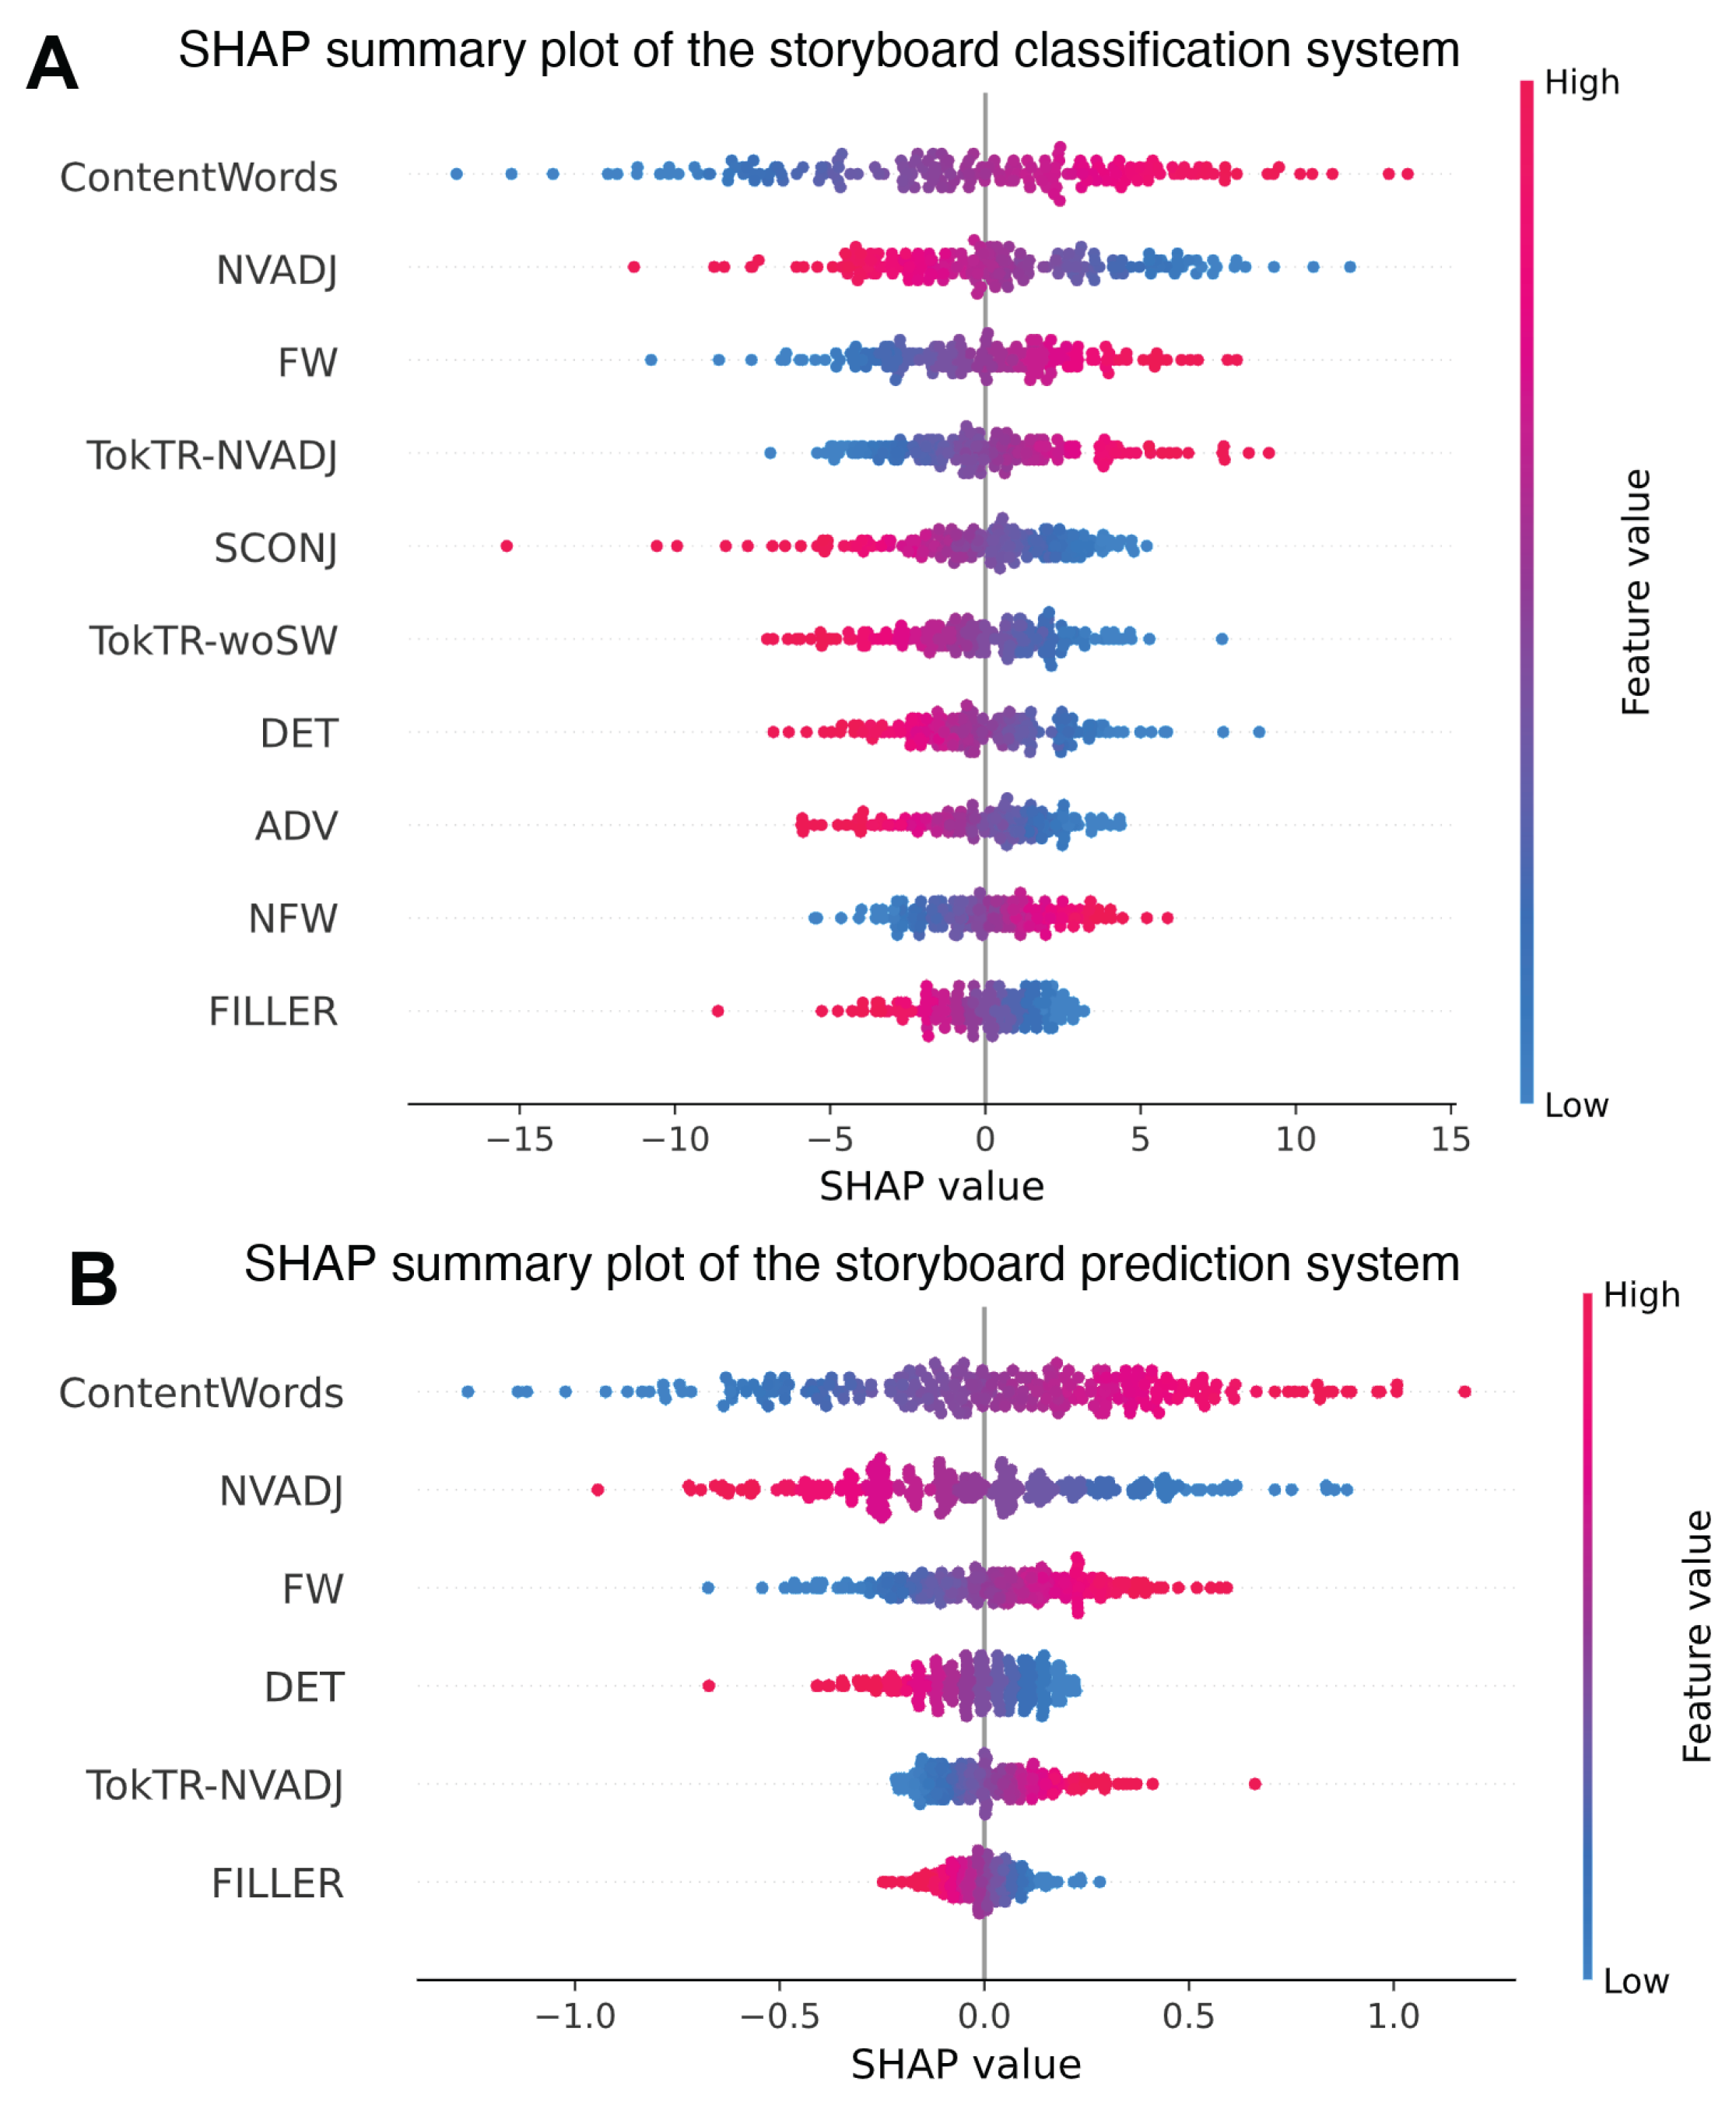

Disclaimer/Publisher’s Note: The statements, opinions and data contained in all publications are solely those of the individual author(s) and contributor(s) and not of MDPI and/or the editor(s). MDPI and/or the editor(s) disclaim responsibility for any injury to people or property resulting from any ideas, methods, instructions or products referred to in the content. |
© 2026 by the authors. Licensee MDPI, Basel, Switzerland. This article is an open access article distributed under the terms and conditions of the Creative Commons Attribution (CC BY) license.