


Abstract
This paper presents a study in the field of external ballistics focusing on the drag force of selected .223 rem projectiles. The drag force characteristics of projectiles with different geometric features were compared, including variations in projectile slenderness, ogive shape, boat-tail geometry, and projectile base design. The research combined theoretical analysis, experimental measurements, and CFD simulations. An initial assessment was performed to evaluate the influence of individual projectile geometry features on drag force across different flight regimes, namely the subsonic, transonic, and supersonic regions. These regimes exhibit fundamentally different aerodynamic characteristics, particularly due to the formation and evolution of shock waves, resulting in varying contributions of individual geometric features to the overall drag force. The results presented in this paper provide a foundation for future research. Subsequent studies will systematically investigate the influence of individual projectile geometry features on drag force in each flight regime, enabling a more comprehensive understanding of their aerodynamic significance.
1. Introduction
The presented paper represents a continuation of a series of studies devoted to supersonic flow under low-pressure conditions, a research topic that has been systematically investigated by the research group at the Department of Electrical and Electronic Technology, Faculty of Electrical Engineering and Communication, Brno University of Technology, in collaboration with the Institute of Scientific Instruments of the Czech Academy of Sciences. One of the principal research directions of this team focuses on Environmental Scanning Electron Microscopy (ESEM), where two regions characterized by substantially different pressure levels are interconnected through an intermediate differentially pumped chamber operating at an elevated pressure. This configuration enables the observation of non-conductive samples without the need for conductive coating, as well as the investigation of samples under in situ conditions, thereby extending the range of applications of electron microscopy [1,2,3,4].
Another major research area of our team focuses on the flow field around the tips of Pitot probes under supersonic conditions, together with the related topics of external ballistics and the aerodynamic behavior of selected projectile geometries. Our research follows the Industry 4.0 paradigm, integrating theoretical analysis, Computational Fluid Dynamics (CFD) simulations, and experimental measurements into a unified methodology. This multidisciplinary approach enables accurate calibration and validation of CFD models using experimentally acquired data, thereby improving the reliability and predictive capability of the numerical simulations [5,6].
The expertise gained from these research activities has subsequently been applied to a third research direction, which likewise involves supersonic flow and shock-wave phenomena, namely external ballistics and the evaluation of projectile aerodynamic characteristics, particularly Drag Force and Drag Coefficient. This research investigates the influence of projectile geometry on aerodynamic resistance throughout the entire flight envelope, with particular emphasis on the distinct flow physics governing subsonic, transonic, and supersonic flight regimes.
The projectiles trajectory is governed by a range of physical phenomena collectively described by the field of external ballistics [7,8]. As external ballistics encompasses a broad spectrum of research topics, the present study is deliberately focused on a specific aspect, namely the influence of projectile geometry and dimensions on aerodynamic drag force.
From the perspective of the current state of knowledge, the studies reported in [7,9,10,11,12] provide an important foundation for the evaluation of projectile aerodynamics. McCoy [9] primarily establishes the physical basis for describing aerodynamic drag and its individual components, particularly wave drag, skin-friction drag, and base drag. The approach presented by McCoy [9] can be summarized as follows: The drag on a projectile is composed of wave drag, base drag, and skin friction drag.
Litz [10,11] complements these findings with experimental measurements of aerodynamic drag and evaluates the influence of projectile geometric parameters, particularly the ogive shape and length, meplat diameter, boat-tail geometry, and projectile length, using specific projectile designs. Sjösteen [7] provides a broader perspective on external ballistics and the relationship between projectile design and flight characteristics, while Massaro [12] places projectile aerodynamics within a more general ballistic and engineering context. These studies collectively provide conclusions regarding the influence of individual projectile design parameters on aerodynamic drag. Current knowledge in the field of external ballistics indicates that projectile aerodynamic drag is strongly influenced by its overall geometry, with the shape of the projectile nose and base playing a particularly important role. As reported primarily by McCoy [9] and Litz [10,11], appropriate modifications to projectile geometry can substantially reduce both wave drag and base drag, thereby improving the ballistic coefficient.
For the front section of the projectile, the shape and length of the ogive, as well as the meplat size, are the most influential geometric parameters. In general, a longer, aerodynamically optimized ogive and a smaller meplat reduce aerodynamic drag, particularly in the supersonic regime. Based on experimental measurements, Litz [10,11] further demonstrates that even relatively small differences in ogive geometry can result in measurable changes in aerodynamic drag.
The rear section of the projectile also plays a significant role. The use of a boat-tail generally reduces base drag compared with flat-base projectiles; however, its effectiveness depends on the boat-tail length and taper angle. Therefore, the available evidence does not indicate that a longer boat-tail necessarily results in lower aerodynamic drag. Instead, it suggests the existence of an optimal boat-tail geometry that depends on the specific projectile design and velocity regime.
McCoy [9] and Litz [10,11] also emphasize that individual geometric parameters cannot be evaluated in isolation. The overall aerodynamic drag results from the combined effects of the ogive shape, meplat, cylindrical section, boat-tail, and projectile base. Consequently, an optimal projectile design represents a compromise between the individual drag components, and its aerodynamic performance varies with the Mach number. Modern experimental techniques, particularly Doppler radar measurements, have confirmed that projectile drag is not constant but changes significantly with velocity. Therefore, accurate evaluation of aerodynamic performance is better achieved by analyzing the variation in the drag coefficient as a function of Mach number rather than relying solely on a single ballistic coefficient value.
Based on the current state of knowledge, it can be concluded that the lowest aerodynamic drag cannot be achieved by optimizing a single design parameter. Instead, it results from an appropriate combination of the ogive shape, meplat size, projectile slenderness, and the geometry of the boat-tail and projectile base. The relative importance of these parameters varies with the velocity regime, which is particularly significant in the transonic and supersonic flow regimes.
The present study builds upon the authors’ previous work [13] and aims to provide a more detailed evaluation of the influence of projectile geometry on aerodynamic drag using CFD analyses. For this purpose, six .223 Rem projectiles were selected, differing in the shape and dimensions of their key geometric features, particularly the meplat, ogive, cylindrical section, boat-tail, and projectile base, as well as in their overall length. These geometric differences enable the influence of individual design characteristics on the resulting drag force and its variation with flow velocity to be assessed. Accordingly, the CFD analyses were performed across the full range of characteristic velocity regimes, including subsonic, transonic, and supersonic flow. The objective is to identify how the influence of individual projectile design parameters on aerodynamic drag changes with the Mach number and to determine the extent to which the differences in drag force among the investigated projectiles can be explained by their specific geometric configurations.
The studies cited above indicate that individual projectile components contribute differently to the overall aerodynamic performance. This is explicitly stated by Litz [11], who notes that the three major components of aerodynamic drag on a bullet are (shock) wave drag, base drag, and skin friction drag. He further assigns the relative importance of the individual geometric features as follows: Wave drag makes up most of the drag and is affected most by the ogive length and shape, including meplat diameter. Base drag is the second most important component of drag and can be reduced with a properly designed boat-tail. Skin friction drag is the least important component of drag and is proportional to the wetted area of the bullet [11].
These effects are examined in the following sections and verified through CFD analyses performed on six different .223 Rem projectile geometries. Furthermore, Litz [11] experimentally demonstrated that, even for two highly similar projectiles, the resulting aerodynamic performance may reflect the combined effects of competing geometric factors. A longer projectile has a larger wetted surface area and therefore higher skin-friction drag, whereas a smaller meplat may simultaneously improve its aerodynamic performance.
Since the optimal geometry of an aerodynamic body results from the interaction of multiple interrelated factors, whose influence on aerodynamic drag varies with the velocity regime and may, in some cases, have opposing effects, the geometric optimization of high-speed bodies remains an active area of research and development. Current trends indicate that the pursuit of optimal aerodynamic performance is far from complete and continues through both the refinement of existing geometries and the development of new design concepts. An example of this ongoing development is the current U.S. 6.8 mm ammunition family developed under the Next Generation Squad Weapon (NGSW) program, which represents a new design concept compared with the previously adopted 5.56 mm system. The new 6.8 × 51 mm cartridge has already been introduced into the M7 and M250 weapon systems, and its development and further optimization continue. This example is presented solely to illustrate that the geometric optimization of high-speed aerodynamic bodies and the search for an appropriate balance among their aerodynamic characteristics remain active research topics, rather than to emphasize any military application.
The present paper addresses this research problem by employing six geometrically distinct .223 Rem projectiles as representative aerodynamic bodies for investigating the physics of high-speed and supersonic flow. In this study, the projectile is considered primarily as a well-defined slender body with a characteristic geometry rather than in terms of its military or practical application. Differences in the geometry of the meplat, ogive, cylindrical section, boat-tail, projectile base, and overall length enable a systematic investigation of their influence on aerodynamic drag force using CFD analyses. The simulations were performed over a wide range of velocities encompassing the subsonic, transonic, and supersonic regimes, with particular emphasis on the evolution of the flow field during the transition through the transonic region and into supersonic flow. The objective is to identify how the influence of individual geometric parameters changes with increasing Mach number and how these changes are reflected in the resulting aerodynamic drag force acting on the body.
The primary objective of this work is to develop, calibrate, and validate a CFD model for the external ballistics of selected .223 rem projectile variants under supersonic flow conditions [14]. The model is established using a combination of theoretical principles and experimentally acquired data in accordance with the integrated methodology described above. Experimental investigation of projectiles in supersonic flight is inherently challenging due to the extreme flow conditions and the limited accessibility of the flow field. Consequently, the development of a rigorously validated CFD model is essential for the detailed investigation of projectile aerodynamics, particularly for phenomena that are difficult or impossible to quantify experimentally, such as the influence of shock-wave structures on aerodynamic drag.
In the subsonic regime, the aerodynamic drag acting on a projectile is governed predominantly by viscous friction between the airflow and the projectile surface. Under these conditions, the influence of geometric parameters, such as the shape of the projectile nose or base, is relatively limited, and the overall projectile geometry has only a minor effect on the resulting drag force. In contrast, as the flow transitions into the supersonic regime, the influence of projectile geometry becomes substantially more pronounced. The aerodynamic drag is then strongly affected by the nose profile, which determines the formation and characteristics of shock waves, while the geometry of the entire projectile body also plays a significant role in the overall aerodynamic behavior.
In the supersonic flight regime, the total aerodynamic drag force is composed primarily of wave drag and skin-friction drag. Wave drag is associated with the compression of air ahead of the moving projectile and with the formation of shock waves, the characteristics of which are strongly dependent on the geometry of the projectile nose. Skin-friction drag, in contrast, results from the shear interaction between the airflow and the projectile surface, with the projectile body shape and its length-to-diameter proportions playing a particularly important role. These effects are further analyzed and discussed in the present study.
As it was mentioned, the aerodynamic drag of projectiles traveling at supersonic velocities represents a complex physical problem influenced by numerous parameters, including projectile geometry, flight velocity, ambient gas density, and other atmospheric conditions. Accurate quantification of drag forces requires the application of advanced aerodynamic approaches, either through numerical simulations or experimental measurements, both of which are technically demanding and time-consuming [15,16]. Consequently, the combination of theoretical analysis, experimental validation, and Computational Fluid Dynamics (CFD) simulations represents an effective methodology for the detailed investigation of external flow fields and the associated aerodynamic phenomena [17].
It should be emphasized that the external ballistic behavior of a projectile is influenced by a number of interacting factors. Therefore, this study focuses on one of these significant factors, namely the aerodynamic drag of the projectile, and specifically on its dependence on the overall projectile geometry under different flight regimes. The selection of drag as the primary parameter of interest does not represent a limitation of the validity of the results but rather defines a specific physical aspect of external ballistics that is analyzed in this study.
At the same time, it should be taken into account that the individual geometric characteristics of a projectile do not act independently. The ogive geometry, projectile slenderness, boat-tail geometry, and the shape of the projectile base and tip may mutually affect the resulting aerodynamic characteristics. For this reason, the present study is designed as the first step in a systematic research effort. Based on the results obtained herein, subsequent studies will analyze the individual geometric characteristics separately, followed by an assessment of their combined effects. This approach will allow the individual influence of the respective geometric parameters to be better distinguished and their significance under different flow regimes to be clarified.
In the subsequent research, the influence of caliber and the associated geometric characteristics of the projectile will also be taken into account. The aerodynamic behavior of a slender small-caliber projectile, such as the .223 Rem, cannot be directly generalized to a larger-caliber projectile, such as the .308 Win, since a change in caliber may involve not only a change in the transverse dimension, but also differences in the slenderness ratio, projectile length, ogive shape, boat-tail geometry, and other dimensional characteristics. Future research will therefore extend the present analysis to different calibers, making it possible to assess the extent to which the identified relationships between geometry and drag force are generally applicable and the extent to which they depend on the specific caliber and the associated projectile geometry.
2. Methodology
As mentioned above, the present study is based on an integrated methodology that combines theoretical analysis, experimental measurements, and CFD simulations. The theoretical component addresses the fundamental physical principles of external ballistics. The experimental component consists of a series of projectile velocity measurements acquired during flight [18]. The numerical analyses were performed using AnsysFluent (Ansys 2024 R2), which employs the finite volume method (FVM) to solve the governing equations of continuum fluid mechanics [19].
2.1. External Ballistics
As discussed above, the trajectory of a projectile is governed by a variety of physical phenomena collectively described within the field of external ballistics [20,21,22].
The present study is focused on a specific aspect of external ballistics, namely the aerodynamic drag acting on a projectile [23], with particular emphasis on the aerodynamic drag coefficient and ballistic coefficient BC [24,25,26].
The resultant aerodynamic force acting on the projectile can be decomposed into two orthogonal components.
where is gravitational force vector and is air resistence vector (Drag force).
These force components can be expressed as follows [12]:
where m is mass of the projectile, Cd is drag coefficient, S is the cross-sectional area of the projectile, ρ is air density, and v is projectile velocity.
Compared with aerodynamic drag, the influence of gravity on projectile motion is generally less significant, particularly over the short flight intervals considered in this study. As the projectile transitions into the supersonic regime, the aerodynamic drag increases abruptly due to the formation of shock waves [7]. These shock waves introduce flow discontinuities that substantially increase the aerodynamic resistance acting on the projectile. In contrast, under subsonic conditions, drag is dominated primarily by viscous friction between the projectile surface and the surrounding air, and the influence of projectile geometry is comparatively limited. However, for supersonic flight (M > 1), projectile geometry becomes a dominant factor governing aerodynamic drag. In particular, the shape of the projectile nose and the overall body profile strongly influence shock-wave formation and the resulting drag force. The investigation of these geometric effects on projectile drag constitutes the central objective of the present study.
For supersonic flight (M > 1), the total aerodynamic drag consists primarily of two components: skin-friction drag and wave drag. Skin-friction drag originates from the viscous interaction between the airflow and the projectile surface, and its magnitude is strongly influenced by the geometry, surface area, and length of the projectile body. In contrast, wave drag arises from the compression of air ahead of the projectile, leading to the formation of shock waves at the projectile nose [27]. Consequently, the nose geometry has a decisive influence on the magnitude of this drag component. Slender, pointed nose profiles promote weaker shock-wave formation and therefore reduce wave drag, while an aerodynamically optimized body shape further minimizes the overall aerodynamic resistance acting on the projectile during flight.
The geometry of the projectile body largely determines the magnitude of skin-friction drag acting on its surface. In the case of a boat-tail projectile, i.e., a projectile with a tapered rear section, the gradual reduction in cross-sectional area suppresses flow separation and reduces the formation of vortices in the wake region. As a result, the wake recovers more smoothly, leading to a reduction in base drag and consequently a lower overall aerodynamic drag force acting on the projectile.
The projectile surface is generally manufactured with a smooth finish to minimize viscous friction and thereby reduce aerodynamic drag. Nevertheless, under certain conditions, surface modifications such as grooves or other surface treatments may alter the characteristics of the boundary layer, potentially delaying flow separation and reducing the overall aerodynamic resistance. The influence of such surface features depends on the specific flow regime and projectile geometry.
Confusion occasionally arises in the terminology of external ballistics because three closely related, yet distinct, quantities are often used interchangeably. Therefore, it is appropriate to clarify the terminology adopted in this study, following the conventions established by McCoy [9].
The drag coefficient (Cd) characterizes the aerodynamic drag of a specific projectile geometry under given flight conditions. In contrast, the standard drag functions (G1–G7) represent reference drag models corresponding to standardized projectile shapes and are primarily used for ballistic calculations and performance comparisons. The form factor (i) is a dimensionless parameter that quantifies the aerodynamic efficiency of a projectile relative to the selected standard drag model. Finally, the ballistic coefficient (BC) expresses a projectile’s ability to overcome aerodynamic drag and is defined by the following relationship:
where SD is sectional density.
The drag coefficient is a purely aerodynamic, dimensionless parameter that quantifies the aerodynamic resistance of a projectile independently of its mass. It is defined as the ratio of the aerodynamic drag force to the dynamic pressure acting on the projectile’s reference area and is expressed by Equation (5):
where Fd is drag force, ϱ is ambient air density, v is projectile velocity, and S is cross-sectional area of the projectile.
The drag coefficient depends primarily on the projectile geometry and the Mach number, while exhibiting a weaker dependence on the Reynolds number. Owing to its aerodynamic nature, this parameter can be accurately determined using CFD simulations, making it particularly suitable for the analysis and comparison of different projectile designs under a wide range of flow conditions [28]. McCoy [9] provides tabulated standard drag functions for the reference projectile families G1–G7. For the G1 standard adopted in this study, the corresponding drag function is presented [13]. The G1 reference projectile is defined as a flat-base projectile with a mass of one pound and a caliber of one inch.
As shown by the G1 drag function, the transition from the transonic to the supersonic regime is characterized by a pronounced increase in aerodynamic drag due to the formation of shock waves. Beyond the transonic region, the drag continues to increase with Mach number, although at a significantly lower rate. Nevertheless, the slope of the drag function in the supersonic regime remains greater than that observed under subsonic conditions.
For the G1 model, the standard drag function specifies the drag coefficient of the G1 reference projectile as a function of the Mach number [13]. Mathematically, this relationship is expressed as Cd,G1 (M).
The form factor (i) expresses the aerodynamic relationship between the projectile under investigation and the selected standard reference projectile (G1). It is defined as the ratio of the drag coefficient of the investigated projectile to the drag coefficient of the G1 standard projectile under identical flight conditions, i.e., at the same Mach number:
A form factor of (i < 1) indicates that the projectile is aerodynamically more efficient than the G1 reference projectile, whereas a value of (i > 1) indicates inferior aerodynamic performance relative to the G1 standard.
It should be noted that the drag function describes only the aerodynamic resistance exerted by the surrounding fluid on the projectile. It does not account for projectile mass, which plays a fundamental role in determining the projectile’s ability to overcome aerodynamic drag and retain its velocity during flight. This effect is quantified by the ballistic coefficient (BC), which combines the aerodynamic characteristics of the projectile with its mass and is calculated using Equation (7).
where Bc is ballistic coefficient of the projectile, SD is sectional density of a projectile synonymously its cross-sectional loading, and i is the form factor of a projectile defined as the ratio of the projectile’s aerodynamic drag to the aerodynamic drag of a standard reference projectile.
Sectional density of a projectile is given from:
where d is diameter of the projectile (caliber).
These relationships show that the ballistic coefficient increases with projectile mass and decreases with increasing projectile diameter and form factor. Consequently, a higher ballistic coefficient generally corresponds to a projectile that retains its velocity more effectively during flight and is less susceptible to aerodynamic drag. As a result, projectiles with higher ballistic coefficients typically exhibit a flatter trajectory, greater effective range, and improved resistance to environmental influences such as wind.
The principal advantage of a high ballistic coefficient is a flatter trajectory, resulting in reduced projectile drop due to gravity and facilitating accurate engagement at extended ranges. In addition, projectiles with higher ballistic coefficients are generally less susceptible to crosswind effects and retain a greater proportion of their kinetic energy over long distances. Conversely, achieving a high ballistic coefficient is often associated with increased projectile mass and larger dimensions, which may not be desirable for all applications. Consequently, the optimum ballistic coefficient depends on the intended application and the specific operational requirements.
The relationships described above can be directly integrated into a CFD-based evaluation methodology. First, the aerodynamic drag force (Fd) is obtained from the CFD simulations. This value is then used to determine the actual drag coefficient of the projectile, . For the corresponding Mach number, the drag coefficient of the G1 reference projectile , is obtained from the standard drag function. These quantities allow the form factor to be calculated using Equation (6), from which the ballistic coefficient can subsequently be determined.
In addition to the standard methodology, this study employs a simplified relationship for determining the G1 drag coefficient, as previously published in [22].
where v is velocity of the projectile at a given distance from the barrel, x is the flight path. The indices for the velocity value indicate the distance of the projectile from the barrel.
This relationship (Equation (10)) provides an approximate, rather than an exact, determination of the G1 drag coefficient. Therefore, the assumptions and potential limitations associated with its application must be carefully considered. One of the principal assumptions of Equation (10) is that the projectile undergoes constant deceleration along the entire flight trajectory. In reality, this assumption is not strictly valid, as the aerodynamic drag force depends strongly on projectile velocity and therefore varies continuously throughout the flight.
Consequently, the simplified formulation is applicable only when the projectile velocity remains within a relatively narrow range in which the drag force can be considered approximately constant. In the present study, Equation (10) is employed solely to obtain an approximate drag coefficient from the experimental measurements. These results are subsequently compared with the more accurate values derived from the validated CFD simulations.
The aerodynamics of a projectile in supersonic flight represent a highly complex phenomenon influenced by numerous interacting parameters. The aerodynamic performance of a projectile depends on its geometry as well as on the operating conditions, including flight velocity, ambient air density, and the intended application. Consequently, projectile shape optimization remains an active area of research aimed at minimizing aerodynamic drag while maximizing ballistic performance.
For all .223 rem projectiles investigated in this study, however, the G7 reference projectile provides a more appropriate basis for ballistic analysis than the G1 standard. These projectiles are characterized by a pointed spitzer nose and a tapered boat-tail base, resulting in aerodynamic characteristics that more closely resemble those of the G7 reference geometry. Consequently, the G7 drag model provides a more accurate representation of their aerodynamic behavior and yields a form factor that better reflects the actual projectile geometry than the G1 standard.
For both the G1 and G7 reference projectiles, the drag characteristics were determined experimentally over the full range of practical flight velocities and are reported in the literature [9].
As discussed above, the form factor (i) quantifies the aerodynamic similarity between a given projectile and a selected standard reference projectile (e.g., G1 or G7 or other). The closer the projectile geometry resembles the reference standard, the closer the form factor is to unity. Consequently, for a projectile of a given mass and caliber, a lower form factor corresponds to a higher ballistic coefficient.
The form factor can be defined as follows:
The ballistic coefficient and the corresponding standard reference drag functions are widely used in the construction of ballistic tables, which describe projectile trajectories as a function of flight velocity. These tables are particularly important for long-range shooting applications, where they enable corrections for aerodynamic drag, gravitational effects, and other environmental influences, thereby improving shooting accuracy.
In the Results section, the form factor was also evaluated using the projectile velocity profile, which was experimentally measured along the entire flight trajectory at a constant spatial interval of 0.5 m.
For each measurement point, the drag coefficient of the ballistic reference projectile, , corresponding to the experimentally determined Mach number was obtained by linear interpolation of the reference data previously presented in [13] according to the following Equation (12):
where is the nearest tabulated Mach number lower than the measured value , is the nearest tabulated Mach number higher than , and , and are the corresponding tabulated drag coefficient values of the reference projectile.
The actual drag coefficient of the projectile, , was assumed to be a function of the form factor, , and the drag coefficient of the reference projectile, and is expressed as:
The change in projectile velocity per unit distance is described by the equation of motion of exterior ballistics:
where is the air density, is projectile velocity, is the drag coefficient, is the projectile mass, and is the projectile cross-sectional area, defined in terms of the projectile diameter d as:
The theoretical projectile velocity profile as a function of flight distance was obtained using the Euler numerical integration method. The integration step was set to Δx = 0.5 m, corresponding exactly to the spatial resolution of the experimental velocity measurements along the projectile trajectory:
where is the velocity at the current position along the trajectory, is the velocity at the subsequent position along the trajectory, and is the change in velocity per unit distance.
The central objective of the entire calculation was the determination of the form factor , which was used as the primary tuning parameter. The value of the form factor was systematically varied within the simulation model and numerically optimized to minimize the deviation between the theoretically calculated velocity profile and the experimentally measured data along the entire flight trajectory. The aim of this optimization was to achieve the minimum difference between the theoretical and measured projectile velocity at the end of the evaluated section, corresponding to a distance of 98 m.
2.2. Experimental Equipment
In the experimental part of this study, live-fire tests were conducted using selected types of .223 rem ammunition manufactured by Sellier & Bellot, as listed in Table 1 and shown in Figure 1. The firing tests were performed at the War Zone Blansko shooting range (Czech Republic), an indoor facility suitable for experimental testing of this ammunition type over a sufficiently long distance, allowing the observation of projectile velocity reduction after 98 m of flight.
Table 1.
Types of investigated projectiles.
Figure 1.
.223 rem projectiles manufactured by Sellier & Bellot: 1—.223 rem SP 55; 2—.223 rem FMJ 55; 3—.223 rem FMJ 69; 4—.223 rem HPBT 52; 5—.223 rem HPBT 69; 6—.223 rem HPBT 77.
The firearm used for the experiment was an AR-15 V-AR rifle chambered in .223 rem, equipped with a heavy barrel with a length of 22 inches and a 1:7 twist rate. The barrel of the test rifle used in this experimental measurement was two inches longer than the barrel originally used by the manufacturer for ballistic testing of the selected ammunition. All data related to the manufacturer’s ammunition testing, including the reported ballistic parameters, were obtained from Sellier & Bellot [29].
For the purposes of this study, six different types of .223 rem cartridges manufactured by Sellier & Bellot were selected (Figure 1). The main parameters of the tested ammunition types are summarized in Table 2.
Table 2.
.223 rem parameters manufactured by Sellier & Bellot .223 REM [30].
The projectile masses were also selected with respect to the 1:7 twist rate of the rifle used in the experiment. For this twist rate, projectile weights ranging from 40 to 55 g are considered safe; however, they do not represent the optimal range for this barrel configuration. Projectile masses between 55 and 69 g are generally considered suitable for a 1:7 twist rate, while projectiles weighing 69 g and above represent the most favorable range for this barrel specification. The selected ammunition covers a projectile weight range of 52–77 g, which corresponds to the range defined by firearm manufacturers as suitable to optimal for a 1:7 twist rate barrel [10].
A boat-tail projectile design is characterized by an aerodynamically tapered rear section, which significantly influences projectile behavior during flight. This geometry has a particularly pronounced effect in long-range shooting applications. As previously mentioned, a wake region is formed behind a moving projectile, consisting of a low-pressure zone accompanied by turbulent flow structures. This phenomenon results in an aerodynamic force acting opposite to the direction of motion, leading to increased drag and projectile deceleration. The boat-tail design reduces aerodynamic drag by enabling smoother airflow around the rear section of the projectile and decreasing turbulence intensity in the wake region. Consequently, the projectile retains its velocity over a longer distance and becomes less sensitive to crosswind effects. Furthermore, boat-tail geometry positively affects the ballistic coefficient. A higher ballistic coefficient corresponds to reduced aerodynamic drag, allowing the projectile to maintain a higher proportion of its initial velocity and kinetic energy during flight.
Another important aspect is the geometry of the projectile base, which can be either completely flat (flat base) or recessed inward (concave base). The base design has a significant influence on projectile accuracy, particularly during the transition phase when the projectile exits the firearm barrel.
For flat-base projectiles, the propellant gases act uniformly on the rear surface of the projectile at the moment of muzzle exit. This reduces the possibility of asymmetric forces acting on the projectile and minimizes initial deviations from the trajectory. These projectiles are generally more suitable for short- and medium-range shooting compared to boat-tail designs. However, due to their higher aerodynamic drag, flat-base projectiles experience a greater velocity loss over distance.
In the case of concave-base projectiles, the impact of propellant gases on the recessed rear surface promotes improved sealing between the projectile and the barrel bore. This reduces gas leakage around the projectile and contributes to a more consistent muzzle velocity. The concave-base geometry also shifts the projectile center of gravity slightly forward, which can improve in-flight stability. Additionally, the cavity at the rear of the projectile influences the wake region by reducing turbulent flow structures immediately behind the projectile and contributing to more stable airflow development.
Modern rifle projectiles often combine a boat-tail design with either a flat base or a concave base geometry. This approach allows designers to achieve a balance between the aerodynamic advantages of the boat-tail configuration and the improved launch stability provided by optimized base geometry, effectively combining the advantages of both design concepts.
The following chapter describes the methodology used for CFD analyses. However, to ensure that the CFD simulations were performed accurately and reliably, it was necessary to obtain precise geometrical representations of the tested projectiles. This was achieved through 3D scanning of individual projectiles, providing their actual geometrical shape rather than relying on idealized theoretical models. Consequently, the CFD simulations were based on realistic projectile geometries, including possible manufacturing deviations from the nominal design.
The 3D scanning was performed by AMS 3D spol. s.r.o. (Brno, Czech Republic) with an accuracy of 0.01 mm. The company also guaranteed that the achieved accuracy would not be lower than the stated value of 0.01 mm. An optical ATOS 3D scanner manufactured by ZEISS (Jena, Germany) was used for the measurements. The scanner operates based on structured light projection. In practice, this means that predefined light patterns are projected onto the measured object, while a pair of cameras captures their deformation on the surface of the component. Based on these deformations, the three-dimensional geometry of the object is reconstructed with high accuracy in the form of a point cloud.
The acquired data are subsequently processed using ZEISS INSPECT software, where polygonization is performed, i.e., the conversion of the measured point cloud into a polygonal mesh, typically consisting of triangular elements. The resulting model represents a compact and computationally efficient 3D geometry suitable for further analysis or comparison with CAD models.
From the perspective of data quality, the strategy used by the polygonization algorithm is of particular importance. Unlike some approaches that rely on extensive interpolation and generate a more uniform mesh distribution, the ATOS system preserves higher point density in geometrically critical regions, such as radii, edges, and areas with complex surface curvature. At the same time, unnecessary mesh refinement on simple planar or low-curvature regions is avoided.
The resulting mesh therefore provides an effective balance between data size and the ability to accurately capture the real geometry of the measured object. This aspect is particularly important in applications where small geometric deviations or surface details may influence the final behavior of the analyzed object. In the case of projectile analysis, even minor deviations from the nominal geometry can significantly affect aerodynamic characteristics and, consequently, the resulting flight performance.
For the experimental velocity measurements, an electronic Caldwell Chronograph Premium optical gate system was selected. The complete measurement setup, including the chronograph, infrared LED illumination, and supporting tripod, is shown in Figure 2. This type of device belongs to the group of optical chronographs (skyscreen chronographs) and determines projectile velocity based on changes in incident light intensity caused by the projectile passing through two measurement points.
Figure 2.
Caldwell Chronograph Premium electronic gates.
The distance between the optical sensors is fixed by the device design and calibrated by the manufacturer (typically within the range of 0.3–0.6 m), while the measured time intervals are in the order of hundreds of microseconds. Each optical gate consists of a photodiode or phototransistor, an optical diffuser, and analog signal-processing electronics. The sensors are oriented toward a light source (natural sky illumination or artificial lighting) and continuously monitor variations in light intensity.
The passage of a projectile causes partial interruption of the incident light field, resulting in a rapid temporal change in the detected signal. This detection principle increases the system’s resistance to slow variations in illumination conditions and enables reliable identification of the actual projectile passage event. According to the manufacturer, the measurement accuracy is 0.25% of the measured value, corresponding to an absolute uncertainty of 0.75 m·s−1 at a projectile velocity of 300 m·s−1. Under practical measurement conditions, the absolute error typically ranges from 1 to 3 m·s−1, depending on ambient lighting conditions, projectile trajectory height above the sensors (recommended distance of 5–10 cm), and the mechanical stability of the measurement setup [30,31].
For this purpose, the optical chronograph method was deliberately selected because it provides direct and sufficiently accurate measurements of projectile velocity at precisely defined measurement locations. The method is also straightforward, reproducible, and well suited for comparative measurements of different projectile geometries under identical experimental conditions. Using the same measurement setup at both locations allows the velocity loss over the defined distance of 100 m to be determined without the need for continuous trajectory tracking. Since the primary focus of the present study is the CFD analysis of the aerodynamic behavior of different projectile geometries, the experimental measurements serve mainly to verify and validate the numerical simulation results. Consequently, the optical chronograph represents a simple and sufficiently accurate experimental technique for this purpose, without requiring a more complex system capable of continuous ballistic trajectory measurements.
2.3. CFD Analyses Settings
The CFD analyses were performed using Ansys Fluent (Ansys 2024 R2). Ansys Fluent provides a wide range of numerical models and solver settings, enabling simulations of varying complexity, from relatively simple flow problems to highly sophisticated multiphysics analyses. Consequently, the solver configuration must be carefully selected to ensure that the numerical model accurately represents the physical problem while avoiding both unnecessary computational complexity and oversimplification that could compromise the accuracy of the simulation results.
Considering the supersonic nature of the flow, a density-based solver was selected for the CFD analysis, as it is particularly suitable for the simulation of compressible flows at higher Mach numbers [32]. This approach solves the governing equations describing the conservation of mass, momentum, and energy together with the transport equations for chemical species. The remaining scalar transport equations are subsequently solved sequentially. Due to the significant compressibility of the flow around the projectile and the strong coupling between the individual flow variables, implicit linearization of the governing equations was employed. Within the fully implicit solution approach, the flow variables at the interfaces between individual computational cells are determined simultaneously. This approach contributes to increased numerical stability and robustness of the computation, which is particularly important for the simulation of supersonic flows characterized by pronounced pressure gradients and the formation of shock waves.
The Advection Upstream Splitting Method (AUSM) was used for the discretization of convective and compressive fluxes. This is a numerical scheme designed for the solution of compressible flows, which splits the flux across computational cell interfaces into contributions associated with mass flux and pressure. Its formulation is based on the characteristic eigenvalues of the Jacobian matrices of the governing equations. AUSM enables accurate capturing of important structures in compressible flows, particularly shock waves and contact discontinuities, while providing good numerical stability over a wide range of Mach numbers. Owing to these properties, it is well suited for the simulation of complex supersonic flow fields, such as those occurring around a projectile.
The transfer of information between computational cells was performed using a second-order upwind discretization scheme combined with linear reconstruction of multiple variables [32,33,34]. Compared with first-order schemes, the second-order scheme enables more accurate representation of spatial variations in flow variables, particularly pronounced pressure gradients and shock waves, while maintaining sufficient numerical stability. Although the QUICK and MUSCL schemes may provide higher accuracy, they are generally more sensitive to the quality of the computational mesh and may be more prone to numerical oscillations when simulating highly compressible supersonic flows [35].
To ensure accurate CFD predictions, a carefully designed computational mesh was employed. A hybrid mesh topology was adopted, combining structured quadrilateral elements in geometrically regular regions with unstructured triangular elements where greater geometric flexibility was required. This approach reduced numerical errors associated with mesh non-orthogonality while optimizing the total cell count in predominantly regular regions of the computational domain (Figure 3).
Figure 3.
Structured mesh: Overall view of the entire 2D axisymmetric model (a), detailed view of SP 55 (b), detailed view of FMJ 55 (c), detailed view of FMJ 69 (d), detailed view of HPBT 52 (e), detailed view of HPBT 69 (f), detailed view of HPBT 77 (g).
Figure 3a presents an overall view of the mesh of the entire 2D axisymmetric model, which was generated using a combination of structured and unstructured meshes. Boundary-layer treatment was also applied along the bullet surfaces, with the height of the first adjacent cell determined according to boundary-layer theory, as described below. Inflation layers were generated along the arc of the computational domain. The subsequent figures (Figure 3b–g) provide detailed views of the individual projectiles, showing both the refined mesh in their vicinity and the resulting mesh after adaptive refinement during the calculation. Adaptive refinement was performed primarily according to pressure gradients and, in some cases, based on the development of residuals, turbulent kinetic energy, and velocity. The examples shown correspond to variants with the highest velocity of 1000 m·s−1. Therefore, some of the results differ. Multiple criteria based on experience were considered both for the initial mesh generation and for its subsequent adaptive refinement. One of the main criteria determining the mesh resolution and subsequent adaptive refinement was the geometry of the projectiles. In particular, for the HPBT projectile, special attention had to be paid to the mesh refinement at the nose upstream of the cavity and at the cavity opening. For some bullets, the depth of adaptive refinement was unnecessary, as indicated by certain refined regions extending from the projectile surface that do not directly correspond to oblique shock waves. This refinement was one of the components of the sensitivity analysis. These 2D geometries with the generated meshes also provide a detailed representation of the shapes investigated.
During the simulations, the computational mesh was adaptively refined based on the local pressure and velocity gradients. In addition, mesh adaptation was performed using the turbulent kinetic energy (TKE) gradient to improve the resolution of the projectile wake. Adaptive refinement was implemented using a cell subdivision scheme with a maximum refinement level of four. This strategy enabled accurate discretization of regions characterized by strong pressure gradients within the supersonic flow field, as well as the highly turbulent structures developing in the wake behind the projectile. Adaptive refinement of the projectile surface was also performed with respect to the Drag Force variable. The refinement process was continued until mesh-independent results were achieved, i.e., further refinement did not produce any measurable improvement in the numerical solution or the predicted flow-field characteristics.
A key parameter in the computational mesh design was the size of the first cell adjacent to the projectile wall, particularly in the regions where the boundary layer develops along the projectile surface. The SST k–ω turbulence model was employed in the simulations, with the dimensionless wall distance deliberately maintained within the range of 0–1 to ensure accurate resolution of the near-wall flow. The accuracy of the CFD simulations presented in this study strongly depends on the quality of the computational mesh, including an adequate mesh topology and sufficient resolution within the boundary layer. Therefore, particular attention was devoted to determining the size of the first mesh cell adjacent to the projectile wall. For the SST k–ω turbulence model, the thickness of the first cell layer was determined to satisfy the requirement of . This ensured adequate boundary layer resolution and accurate reproduction of the near-wall velocity field through local mesh refinement. The procedure used to determine the first-cell height has been described previously in [13].
Based on the relationships presented in [13], the first-cell size was determined for each projectile type, and the corresponding values are listed in Table 3 for 102,000 Pa and 24 °C.
Table 3.
The minimal cell size at the projectile wall as a function of flow velocity for each projectile type.
Boundary Condition Settings
Another essential step in obtaining accurate CFD results is the appropriate definition of the boundary conditions. The entire problem was solved as a 2D axisymmetric model, since the projectile geometry allows this simplified representation without affecting the accuracy of the results. The primary advantage of the 2D axisymmetric approach is the substantial reduction in the number of computational cells, resulting in lower computational cost and shorter simulation time. The axis of symmetry is indicated by the blue line in Figure 4.
Figure 4.
Boundary condition.
The inlet boundary condition was defined by the flow velocity specified in Table 3. The inlet boundary is shown as the black line in Figure 4. The inlet temperature and pressure were set according to the measured ambient conditions inside the WarZone Blansko indoor shooting range, namely 24 °C and 102 kPa. The outlet boundary condition (red line in Figure 4) was defined using the same ambient conditions, with a temperature of 24 °C and a pressure of 102 kPa.
The surrounding domain was defined using a farfield boundary condition (yellow line in Figure 4), representing an effectively infinite external flow domain. The free-stream velocity was specified according to the values listed in Table 3, with the corresponding Mach number determined from the inlet velocity for each projectile variant. The ambient temperature and pressure were set consistently with the other boundary conditions, namely 24 °C and 102 kPa, respectively.
Another important factor affecting the accuracy of CFD simulations is the proper definition of the initial conditions. These include the inlet velocity, pressure, temperature, and air composition. Accurate specification of these parameters is essential, as any inaccuracies may lead to erroneous simulation results. In the present study, the inlet pressure and temperature were explicitly defined, while the turbulence intensity was set to 5%, reflecting the semi-circular configuration of the inlet region.
The accuracy of the numerical solution may also be influenced by several additional factors. One of these is the specification of the outlet pressure and flow conditions, which can affect the upstream propagation of shock waves. In the present study, the outlet pressure was set to 102 kPa, corresponding to the ambient pressure. Consequently, the outlet boundary condition did not introduce either overpressure or underpressure, thereby minimizing its influence on the computed flow field.
To minimize the undesirable influence of boundary conditions in the surrounding domain, particularly the reflection of shock waves that may occur when wall boundary conditions are applied, a farfield boundary condition was imposed at the outer boundary of the computational domain (yellow line in Figure 4).
The influence of unsteady flow phenomena also had to be assessed. In transonic flow, particularly around Mach 1, a steady-state solution may not adequately represent the physical behavior of the flow. Typical unsteady phenomena include vortex shedding and flow oscillations. In the present study, the transient flow behavior was addressed using the pseudo-transient approach. The simulation time step was determined according to Equation (17).
where ∆t is the time step, ∆x is characteristic mesh cell size, CFLmax is maximal Courant number, and vmax is maximal velocity.
The initial time-step size was estimated using Equation (17), resulting in a value of 5 × 10⁻⁷ s. During the numerical simulations, this value was further optimized, and a final time step of 3 × 10⁻⁷ s was selected to ensure stable convergence and accurate resolution of the transient flow.
The selection of the numerical model is also closely related to the geometric symmetry of the problem. For the determination of aerodynamic drag, a two-dimensional axisymmetric model provides sufficiently accurate results while significantly reducing the computational cost. In contrast, the assessment of projectile flight stability and the investigation of the wake flow require a fully three-dimensional model. Only a 3D approach is capable of capturing asymmetric flow structures and other complex aerodynamic phenomena that cannot be accurately represented using an axisymmetric formulation.
3. Results
3.1. Experimental Measurements Using Electronic Chronograph Gates
A series of experimental measurements using chronograph gates was performed to evaluate the drag coefficient of individual projectiles. The experimental measurements were conducted at the War-Zone Blansko shooting range using a pair of electronic chronograph gates. The first gate measured the muzzle velocity, while the second gate recorded the projectile velocity after a flight distance of 98 m. Measurements were performed for all investigated projectile types, and the results are summarized in Table 4. The table presents the muzzle velocity v0 and the projectile velocity after travelling a distance of 98 m (v98). Based on the measured velocity values, the G1 drag coefficient (CD) was calculated for each measurement according to Equation (10), and the average value was subsequently determined.
Table 4.
Experimental shooting measured using electronic gates.
To evaluate the reliability of the measurements, the standard error of the mean (SEM) was determined for the Sellier & Bellot .223 REM FMJ 69 projectile at the muzzle velocity v0. The SEM represents the estimated variability between the sample mean and the corresponding population mean by quantifying the standard deviation of the sampling distribution. It was computed using Equation (18), and the resulting values are presented in Table 5.
Table 5.
Evaluation of the Standard Error of the Mean (SEM) from measured velocities for the Sellier & Bellot .223 REM FMJ 69 projectile.
The twelve repeated measurements of the muzzle velocity, v0 (Table 5), served as the basis for a comprehensive uncertainty analysis performed in accordance with the ISO/GUM framework. The uncertainty budget was derived using Equations (19)–(26), with the calculated results reported in Table 6.
Table 6.
Rigorous uncertainty budget following ISO/GUM.
Measurement model:
Sensitivity coefficient:
Covariance between inputs:
where rij is correlation coefficient (.
Combined standard uncertainty:
Effective degrees of freedom (Welch–Satterthwaite):
Expanded uncertainty:
where k is coverage factor z t-distribution:
Measurement result (with 95% confidence interval):
The results were validated by comparing the evaluation of the form factor obtained from the values listed in Table 4 using Equations (10) and (11) with the form factor obtained through the iterative method based on the methodology described above. The comparison is presented in Table 7.
Table 7.
Comparison of values.
The results show good agreement between the values calculated according to Equation (10) for the G1 reference model and the iteratively determined values for G1. An interesting result is the ratio between the G1 and G7 values obtained using the iterative method, where the ratio reaches approximately 0.49. This value is consistent with the findings reported in [11].
3.2. CFD Analyses
To evaluate the drag force results obtained from CFD analyses, it is first necessary to assess the individual projectile shape features that influence the resulting drag force (Figure 5). These features have different effects in the subsonic, transonic, and supersonic flight regimes. The main influencing aspects are the ogive, boat-tail, projectile base, and projectile head (Figure 5).
Figure 5.
Projectile part description.
As will be demonstrated further, this order is not arbitrary. These geometric features, listed in this sequence, together with their specific shapes, have a significant influence on the resulting drag force.
Each of these aspects has a different level of influence in the subsonic region (), transonic region (), and supersonic region ().
In the subsonic regime, the projectile ogive has a dominant influence on the resulting drag force. The flow is primarily governed by pressure drag around the nose region and skin friction effects. The boat-tail already affects the drag in the subsonic regime; however, its influence becomes more significant at higher velocities. The projectile head shape has only a minor effect at this stage, and the projectile base geometry has a limited influence on the wake region.
In the transonic regime, the aerodynamic behavior changes significantly due to the formation and evolution of shock waves. Unlike the stable shock structures observed at higher velocities, the shock waves in this region are highly variable. Therefore, the nose slenderness of the projectile has an extremely significant influence, while the boat-tail geometry becomes almost equally important. Consequently, the influence of the projectile head and base shapes also increases. In this unstable flow regime, the interaction of these effects can lead to changes in the ranking of projectiles according to their resulting drag force.
In the supersonic regime, the projectile nose slenderness remains the most influential parameter. The effect of the boat-tail, which is nearly comparable to the nose geometry in the transonic regime, slightly decreases but remains significantly greater than in the subsonic regime. The projectile base geometry, which primarily affects the base drag, becomes more influential in the supersonic regime than the projectile head shape. The projectile head configuration, whether closed or featuring a cavity, has almost no effect on the resulting drag force at supersonic velocities.
The results of the drag force obtained using ANSYS Fluent according to the methodology described in Section 2.3 are presented in Table 8 and Figure 6. CFD analyses were performed for the selected projectiles over a defined velocity range under atmospheric conditions of 102 kPa pressure and an air temperature of 24 °C.
Table 8.
The results of the drag force obtained using ANSYS Fluent system.
Figure 6.
Drag force distribution as a function of Mach number.
The results show the expected significant increase in drag force in the velocity range around 1 Mach. Up to this region, the drag force increases only gradually. In the transonic transition region near 1 Mach, a rapid increase in drag force occurs due to the development of shock-wave structures and associated compressibility effects. Beyond the transonic regime, in the supersonic region, the increase in drag force becomes less steep; however, it remains significantly higher compared with the subsonic regime.
For the evaluation of the results, the analyzed velocity range will be divided into the three previously defined regimes: subsonic, transonic, and supersonic.
3.2.1. Evaluation of the Subsonic Regime
In this regime, the SP 55 projectile exhibits by far the highest drag force. This is caused by the combination of a very short ogive, minimal boat-tail, flat and aerodynamically unfavorable projectile nose, and a flat base. Therefore, this projectile exhibits unfavorable characteristics in all four evaluated geometric aspects compared with the other projectiles.
The remaining three projectiles (FMJ 55, FMJ 69, and HPBT 52) exhibit similar drag force values, which are significantly lower than those of SP 55. This is partly due to their more favorable boat-tail geometry, which reduces the region of flow separation behind the projectile and consequently decreases the pressure base drag. However, this effect becomes more pronounced in the supersonic regime, where a strong turbulent wake develops behind the projectile and shock waves are generated. In the subsonic regime, shock waves are not present.
These projectiles also have a smaller base area exposed to the low-pressure region within the wake behind the projectile. The flow separation occurs more gradually, resulting in a smaller pressure drop behind the projectile and a reduced recirculation region. Consequently, the base drag is lower. These effects contribute to the lower drag force compared with the SP 55 projectile; however, their influence becomes even more significant in the supersonic regime.
A further advantage of these three projectiles is their lower friction drag, which is mainly affected by the ogive geometry and the projectile slenderness ratio, i.e., the ratio between projectile length and diameter. In the subsonic regime, this parameter has the greatest influence on drag force among all investigated geometric characteristics. In the transonic and supersonic regimes, other geometric features become more dominant.
Among the three projectiles with similar drag force values (FMJ 55, FMJ 69, and HPBT 52), the FMJ 69 projectile performs the best due to its more elongated ogive. The FMJ 55 and HPBT 52 projectiles have very similar ogive and boat-tail geometries. However, the HPBT 52 projectile has an advantage due to its flat base compared with the concave base of the FMJ 55 projectile.
The HPBT 69 and HPBT 77 projectiles exhibit very similar geometric characteristics. The HPBT 77 projectile achieves the lowest drag force among them due to its most pronounced ogive and the longest boat-tail geometry compared with the other investigated projectiles (Figure 7).
Figure 7.
Drag force distribution as a function of Mach number—subsonic regime.
The influence of individual geometric parameters and their contribution to aerodynamic drag will be discussed in greater detail in a subsequent related publication.
3.2.2. Evaluation of the Transonic Regime
This regime is particularly challenging for analysis because the aerodynamic behavior changes most sensitively within this region, especially around 0.96 Mach. In this velocity range, the first local supersonic regions begin to develop on the projectile surface. Their location depends on the ogive radius, ogive length, length of the subsequent cylindrical section, and the transition between the ogive and cylindrical part. It is possible that projectiles exhibit similar drag force values at approximately 0.85 Mach, while at 0.96 Mach one projectile may begin to generate a stronger shock wave due to differences in its geometry. Consequently, the drag force values of individual projectiles may change their relative ranking within this region. For this reason, the transonic regime requires detailed investigation using CFD analyses with a pseudo-transient approach, which allows the transient aerodynamic phenomena associated with shock-wave formation and evolution to be captured more accurately.
In the transonic regime, the influence of the projectile base geometry (flat versus concave) is smaller than in the subsonic regime. This was confirmed by additional CFD analyses comparing the FMJ 55 and HPBT 52 projectiles. Although the FMJ 55 projectile exhibits a higher drag force in the supersonic regime, an additional sensitivity study was performed in which the concave base of the FMJ 55 projectile was replaced by a flat base while all other geometric parameters remained unchanged. At 0.87 Mach, this modification had almost no effect on the drag force, which decreased only within the numerical uncertainty from 0.20 N to 0.19 N. In contrast, at 0.72 Mach (subsonic regime), the effect was more pronounced, with the drag force decreasing from 0.136 N to 0.126 N. These results indicate that the influence of the base geometry diminishes as the flow approaches the transonic regime (Figure 8).
Figure 8.
Drag force distribution as a function of Mach number—transonic regime.
In the transonic regime, the boat-tail geometry has a substantially greater influence than in the subsonic regime. The shorter boat-tail of the HPBT 52 projectile promotes earlier flow separation and accelerates the flow over the tapered rear section, which may contribute to local shock-wave formation. Furthermore, the lower slenderness ratio and the hollow-point cavity of the HPBT 52 projectile have a greater adverse effect in the transonic regime than in the subsonic regime. The combined influence of these geometric features alters the relative drag-force performance of the investigated projectiles in the transonic velocity range.
3.2.3. Evaluation of the Supersonic Regime
In the supersonic regime, the most influential geometric parameters are the projectile slenderness ratio and the ogive shape. The second most important factor is the boat-tail geometry. The ranking of the investigated projectiles according to drag force at Mach 2.9 is presented in Figure 6. The FMJ 55 and SP 55 projectiles exhibit the highest drag force values due to their relatively low slenderness ratios and short boat-tail geometries. Although the SP 55 projectile has the shorter boat-tail, which promotes earlier flow separation and increases base drag, the FMJ 55 projectile has a less aerodynamically efficient ogive geometry, resulting in higher skin-friction and pressure drag. The combined effect of these geometric characteristics leads to similarly high drag force values for both projectiles in the supersonic regime.
The HPBT 77 projectile exhibited the lowest drag force, which can be attributed to its well-optimized geometry. It features the most aerodynamically efficient boat-tail design and a long, slender ogive. An interesting observation is the poorer performance of the HPBT 69 projectile, which has a shorter boat-tail than the FMJ 69 projectile.
The following section presents an example of the evaluation of Drag Force by decomposing it into two components, namely pressure drag and viscous drag. This example compares two projectiles with similar Drag Force values at a velocity of 1000 m·s−1. The comparison is therefore performed for the HPBT 52 and HPBT 69 projectiles. The results are presented in Table 9. The analyses show that the Pressure Drag Force values for both projectiles are practically identical. The higher total drag of the HPBT 69 projectile is therefore primarily caused by an increase in viscous drag from 0.357 N to 0.406 N, which results from its greater length.
Table 9.
Total Drag Force and Its Pressure and Viscous Components.
The results are now compared with those for the HPBT 77 projectile, revealing qualitatively different behavior. Compared with the HPBT 69 projectile, the viscous drag of the HPBT 77 projectile is higher due to its longer body, whereas the pressure drag decreases significantly. This reduction is not caused by the flow behind the boat-tail, as the HPBT 77 projectile exhibits a more pronounced low-pressure region in the wake and, consequently, higher base drag. The reason is illustrated in Figure 9, which shows the pressure gradient and flow separation at the boat-tail edge. This difference is attributed to the different boat-tail angles of the two projectiles. In the HPBT 77 projectile, the boat-tail inclination is less pronounced; however, a larger angle subsequently occurs between the boat-tail slope and the rear surface of the projectile. This region is marked with a red circle in Figure 9. The reduction in pressure drag is therefore attributed to the geometry of the ogive section. This interpretation is further supported by the experimental results, according to which the FMJ 69 projectile, despite having the same mass, exhibited a greater velocity loss over the investigated 98 m supersonic flight path (Table 9).
Figure 9.
Pressure gradient layout.
The results presented in this paper will be examined in greater detail in subsequent publications and should be regarded as a foundation for further research.
Future work will investigate the influence of individual projectile geometry features, including slenderness, ogive shape, boat-tail geometry, projectile base, and projectile nose, on external ballistic performance with respect to drag force. The investigation will cover the complete range of flight regimes, from subsonic through transonic to supersonic conditions, taking into account that the influence of these geometric features varies significantly with the flight regime.
It should be emphasized that this study addresses only one aspect of external ballistics, namely drag force. Projectile ballistic performance is influenced by numerous interacting factors. A geometric feature that appears disadvantageous from the perspective of drag force may provide advantages in other aspects of ballistics, such as the interaction with propellant gases during the projectile’s acceleration within the barrel, as well as in other ballistic phenomena.
The results demonstrated that projectile geometry leads to distinct aerodynamic characteristics. In combination with other aspects of ballistics, these differences determine the suitability of individual projectile designs for specific applications, depending on factors such as the intended purpose and shooting distance. Therefore, selecting an appropriate type of ammunition is essential for a given shooting application.
3.3. Comparison of CFD Analyses with Experimental Data
The ballistic coefficients determined from the measured velocity loss over the 98 m trajectory were systematically higher than the G1 values reported by the manufacturer. Therefore, experimentally determined ballistic coefficient values provided by the manufacturer and published on its website [22] were also included in this study. This difference can be attributed, at least partially, to the limited velocity range covered by the experiment, which was restricted to high supersonic velocities. The experimentally determined values therefore represent effective ballistic coefficients characteristic of this specific velocity range rather than values averaged over the trajectory and applicable to a broader range of flight conditions. In addition, the relatively short measurement distance increases the sensitivity of the calculated ballistic coefficient to uncertainties in the measured initial and final velocities.
The good agreement between the CFD results and the drag characteristics derived from the ballistic coefficients reported by the manufacturer suggests that the observed difference is more likely related to the experimental determination of a local ballistic coefficient than to systematic overestimation of aerodynamic drag by the CFD model.
Nevertheless, the experimental measurements remain an important part of this study. In addition to providing an independent experimental basis for the analysis, they demonstrate the high sensitivity of projectile aerodynamic behavior in the high-supersonic velocity regime. The experiment was also used to develop and validate an iterative procedure for determining the projectile form factor. This methodology represents one of the important outcomes of the present study and will be further applied and refined in subsequent research.
First, the results obtained from the CFD analyses were compared with the data provided on the website of the manufacturer Sellier & Bellot (hereafter referred to as MM—Manufacturer-Measured), which include, among other parameters, G1, G7, and sectional density (SD). These values, together with the subsequently calculated form factor according to Equation (4), are presented in Table 10.
Table 10.
Ballistic parameters based on manufacturer-provided data.
The drag coefficient profiles for the individual projectiles for both G1 and G7, as reported by the manufacturer, were plotted from the data presented in Table 10. These graphs were subsequently compared with the drag coefficient results obtained from the CFD analyses. The drag coefficient was calculated from the drag force values obtained using Ansys Fluent and presented in Table 8, using Equations (6)–(9) for the respective projectiles and flow velocities. The resulting values are presented in Table 11.
Table 11.
The results of the drag coefficient obtained from drag force.
Figure 10 presents a comparison of the drag coefficient profiles for the G1 method. The graphs show both the reference curve for the G1 standard projectile (red curve) and the difference between the curve based on the manufacturer-measured data (MM) and the curve obtained from the CFD analyses (F).
Figure 10.
Comparison of drag coefficient profiles for the G1 method.
Subsequently, the relative error was evaluated according to Equation (27) and results are presented in Table 12.
Table 12.
Evaluation of the drag coefficient error between the manufacturer-provided values (MM) and the values obtained from Ansys Fluent (F) for G1.
Analogously, the theoretical manufacturer-provided data were evaluated and compared with the results obtained from the CFD analyses using the G7 reference projectile. The following curves (Figure 11) therefore present a comparison of the drag coefficient profiles for the G7 method. The graphs show both the reference curve for the G7 standard projectile (red curve) and the difference between the curve based on the manufacturer-measured data (MM) and the curve obtained from the CFD analyses (F).
Figure 11.
Comparison of drag coefficient profiles for the G7 method.
Again, the relative error was evaluated according to the G7 methodology, and the results are presented in Table 13.
Table 13.
Evaluation of the drag coefficient error between the manufacturer-provided values (MM) and the values obtained from Ansys Fluent (F) for G7.
Table 14 presents the average errors for the individual variants and for both G1 and G7 reference projectiles. The comparison with the G7 reference projectile shows slightly better agreement.
Table 14.
Evaluation of the average error for the G1 and G7 reference projectiles.
More importantly, the evaluation according to velocity, presented in Table 15, provides a more detailed assessment.
Table 15.
Evaluation of the average error as a function of velocity.
In the subsonic regime, G7 is not unequivocally superior. For example, at a velocity of 250 m·s−1, G1 exhibits an average error of 8.33%, whereas G7 shows an error of 14.50%. At 330 m·s−1, G7 provides better agreement, with errors of 5.77% and 7.72% for G7 and G1, respectively. The most pronounced difference occurs at 370 m·s−1, i.e., just above Mach 1. In the supersonic regime, the difference is also significant. G7 shows substantially better agreement with the CFD results, particularly in the transonic and supersonic regimes.
When interpreting the results, the different resolutions of the compared datasets should be taken into account, with this effect being most pronounced in the transonic regime. The CFD analyses were performed for seven discrete velocities selected to represent the subsonic, transonic, and supersonic regimes, whereas the reference drag coefficient curves were defined by approximately twenty data points. Due to the very steep variation in the drag coefficient in this region, interpolation between the individual CFD points may not accurately reproduce the position or magnitude of the local maximum in the drag coefficient. Therefore, the visually observed difference between the continuous curves within this narrow region in the graphs cannot be attributed exclusively to deviations of the CFD model, as it is also partially influenced by the different density of the discrete data points and their subsequent interpolation. This effect should also be considered when interpreting the higher local relative deviations in the transonic regime, which may have a significant influence on the overall average error.
A finer velocity discretization in the immediate vicinity of the transonic regime would enable more accurate determination of the position and magnitude of the transonic maximum and represents a suitable subject for further research in subsequent studies.
The results demonstrated that projectiles with an HPBT nose and a more elongated boat-tail exhibit lower Cd values in the subsonic regime, as the boat-tail limits the rapid expansion of the flow, affects flow separation, and influences base pressure drag. However, the best results were obtained for flat-base projectiles, as they appropriately modify the recirculation region and base drag behind the projectile.
The transonic regime is the most complex, as local supersonic regions, shock waves, and flow separation develop around the projectile and change rapidly. Therefore, projectile geometry is particularly important in this regime. The most favorable designs are projectiles with a slender ogive, a small frontal area, and a longer boat-tail, which also results in a smaller rear surface area. A short and excessively steep boat-tail can induce flow separation. Projectile design for transonic flight is the most challenging because the ogive and boat-tail interact with each other and must therefore be appropriately combined. The transonic regime differs fundamentally from the subsonic regime because both subsonic and local supersonic regions occur simultaneously around the projectile, accompanied by the formation of shock waves. Consequently, the relative importance of individual geometric features also changes.
In the purely subsonic regime, classical wave drag does not occur. Therefore, the rear section of the projectile is particularly important, as it determines flow separation, wake size, and base drag behind the projectile. Consequently, a change in the projectile base or boat-tail may have a relatively greater effect than a minor modification of the nose. In the transonic regime, the importance of the ogive geometry increases significantly due to the formation of local supersonic regions and shock waves. The resulting drag is therefore more sensitive to the combined geometry of the forward and rear sections of the projectile. This is also evident from the results presented in the graphs, where short projectiles with a short ogive and a large diameter increase over a short distance exhibit the highest drag. In contrast, slender, elongated projectiles show substantially more favorable performance. The presence of a frontal cavity also has a relatively minor effect on the flow around the projectile nose, as the HPBT52 projectile exhibits a more favorable drag force profile than projectiles with a short ogive and no frontal cavity.
4. Conclusions
This study investigated selected .223 rem projectiles with respect to external ballistics, focusing on the influence of characteristic projectile geometry on drag force. Particular attention was paid to geometric features such as projectile slenderness, ogive shape, boat-tail geometry, projectile base, and nose.
The study combined experimental results, including measurements of projectile velocity and velocity loss over a distance of 98 m, manufacturer-provided ballistic data, and numerical simulations using computational fluid dynamics (CFD). An iterative procedure was employed to determine the form factor, which was subsequently verified using the CFD results. The study therefore integrates theoretical analysis, experimental measurements, and numerical simulations to provide a comprehensive assessment of projectile aerodynamic performance.
The results demonstrated that projectile geometry has a significant influence on drag force characteristics, with the effect strongly dependent on the flight regime. The most pronounced differences were observed in the transonic region, while distinct aerodynamic behavior was also identified between the subsonic and supersonic regimes.
The results presented in this study provide a basis for subsequent systematic investigation of the individual geometric parameters affecting the aerodynamic drag of projectiles. This study focuses on a comparison of projectiles with different overall geometries, while the effects of individual geometric features and their mutual interactions will be investigated separately in subsequent studies. This subsequent research will also be extended to projectiles of different calibers to determine whether the observed relationships between projectile geometry and aerodynamic drag can be generalized across different caliber classes. This is particularly important because a change in caliber is generally accompanied by changes in projectile diameter, length, slenderness ratio, and other geometric characteristics, which may alter the relative contribution of individual geometric features to the resulting aerodynamic drag.
5. Dual-Use Research of Concern (DURC) Statement
Current research is limited to the investigation of compressible flow and computational fluid dynamics within the field of mechanical engineering. Its objective is to advance computational fluid dynamics methodologies, experimentally validate numerical models, and improve the understanding of aerodynamic phenomena, and it does not pose a threat to public health or national security. It concerns research on supersonic aerodynamics, and projectiles and their geometries are suitable tools for experimental measurements and CFD analyses.
Authors acknowledge the dual-use potential of the research involving external ballistics and confirm that all necessary precautions have been taken to prevent potential misuse. As an ethical responsibility, the authors strictly adhere to relevant national and international laws about DURC. The authors advocate for responsible deployment, ethical considerations, regulatory compliance, and transparent reporting to mitigate misuse risks and foster beneficial outcomes.
Author Contributions
Conceptualization, J.M. and P.Š. (Pavla Šabacká); methodology, J.M. and P.Š. (Pavla Šabacká); software, J.M. and P.Š. (Pavla Šabacká); validation, J.M., J.Š., P.Š. (Pavel Šafl) and P.B.; formal analysis, J.M., P.Š. (Pavla Šabacká) and T.B.; investigation, P.Š. (Pavel Šafl), J.M., P.Š. (Pavla Šabacká), J.Š. and P.B.; resources, Z.N.; T.B., J.T., R.K. and R.B.; data curation, J.M., R.B. and P.Š. (Pavla Šabacká); writing—original draft preparation, J.M. and P.Š. (Pavla Šabacká); writing—review and editing, P.Š. (Pavla Šabacká), T.B. and J.T.; visualization, P.Š. (Pavla Šabacká), R.K. and R.B.; supervision, J.M., J.Š. and T.B.; project administration, P.B. and J.Š.; funding acquisition, J.Š., J.T. and P.B. All authors have read and agreed to the published version of the manuscript.
Funding
This research was founded by the Czech Science Foundation, project number GA, 26-20858S.
Institutional Review Board Statement
Not applicable.
Informed Consent Statement
Not applicable.
Data Availability Statement
The data presented in this study are available on request from the corresponding author.
Acknowledgments
This work was supported by Ministry of Defence of the Czech Republic projects No. DZRO K-109, and by specific graduate research of Brno University of Technology No. FEKT-S-26-8946.
Conflicts of Interest
The authors declare no conflicts of interest.
References
- Neděla, V.; Hřib, J.; Vooková, B. Imaging of early conifer embryogenic tissues with the environmental scanning electron microscope. Biol. Plant. 2012, 56, 595–598. [Google Scholar] [CrossRef] [Scilit]
- Stelate, A.; Tihlaříková, E.; Schwarzerová, K.; Neděla, V.; Petrášek, J. Correlative Light-Environmental Scanning Electron Microscopy of Plasma Membrane Efflux Carriers of Plant Hormone Auxin. Biomolecules 2021, 11, 1407. [Google Scholar] [CrossRef] [Scilit]
- Neděla, V. Methods for Additive Hydration Allowing Observation of Fully Hydrated State of Wet Samples in Environmental SEM. Microsc. Res. Tech. 2007, 70, 95–100. [Google Scholar] [CrossRef] [Scilit]
- Závacká, K.; Neděla, V.; Tihlaříková, E.; Šabacká, P.; Maxa, J.; Heger, D. Esem Methodology for the Study of Ice Samples at Environmentally Relevant Subzero Temperatures: “Subzero Esem”. Microsc. Microanal. 2021, 28, 196–209. [Google Scholar] [CrossRef] [Scilit]
- Subrahmanyam, P. Development of an Interactive Hypersonic Flow Solver Framework for Aerothermodynamic Analysis. Eng. Appl. Comput. Fluid Mech. 2008, 2, 436–455. [Google Scholar] [CrossRef] [Scilit]
- Zhu, Y.; Fukuda, T.; Yabuki, N. Integrating Animated Computational Fluid Dynamics into Mixed Reality for Building-Renovation Design. Technologies 2020, 8, 4. [Google Scholar] [CrossRef] [Scilit]
- Sjösteen, J. External Ballistics for Rifle Shooting; Jonatan Sjösteen: Norrköping, Sweden, 2024. [Google Scholar]
- Kneubuehl, B.P. Wound Ballistics; Springer: Berlin/Heidelberg, Germany; Verlag GmbH & Co.: Weinheim, Germany, 2014. [Google Scholar]
- Mc Coy, L. Robert, Modern Exterior Ballistics, 2nd ed.; Schiffer Publishing Ltd.: Atglen, PA, USA, 2009. [Google Scholar]
- Litz, B. Modern Advancements in Long Range Shooting; Applied Ballistics: Cedar Springs, MI, USA, 2014. [Google Scholar]
- Litz, B. Applied Ballistics for Long Range Shooting; Applied Ballistics: Cedar Springs, MI, USA, 2015. [Google Scholar]
- Massaro, P.P. The Ballistics Handbook: Factors Affecting Bullet Flight from Muzzle to Target; Gun Digest Books: Appleton, WI, USA, 2024. [Google Scholar]
- Maxa, J.; Šabacká, P.; Bayer, R.; Binar, T.; Bača, P.; Švecová, J.; Talár, J.; Vlkovský, M.; Dobšáková, L. The Tuning of a CFD Model for External Ballistics, Followed by Analyses of the Principal Influences on the Drag Coefficient of the.223 Rem Caliber. Technologies 2025, 13, 190. [Google Scholar] [CrossRef] [Scilit]
- Yin, J.; Wu, X.; Lei, J. Body-Fin Interference on the Magnus Effect of Spinning Projectile in Supersonic Flows. Eng. Appl. Comput. Fluid Mech. 2017, 11, 496–512. [Google Scholar] [CrossRef] [Scilit]
- Luke, M. Long Range Shooting; U.S. Army: Arlington, VA, USA, 2024. [Google Scholar]
- U.S. Army. The Official US Army Sniper Training and Operations Manual: Full Size Edition: The Most Authoritative & Comprehensive Long-Range Combat Shooter’s Book; CreateSpace Independent Publishing Platform: North Charleston, SC, USA, 2017. [Google Scholar]
- Anderson, J.D. Computational Fluid Dynamics; McGraw-Hill: New York, NY, USA, 1995. [Google Scholar]
- Luo, J.; Chen, Y.; Cheng, Y.; Lin, J.; Wang, Z.; Yin, X. Study on Robotic Projectile Launching Based on Multi-Factor Analysis and Parameter Optimization. Front. Mech. Eng. 2025, 11, 1707301. [Google Scholar] [CrossRef] [Scilit]
- Pitchard, P.J. Introduction to fluid mechanics. In Manhattan College; John Wiley and Sons: Hoboken, NJ, USA, 2011. [Google Scholar]
- Juříček, L. Vnější Balistika Palně Zbraně; Vysoká škola Karla Engliše: Ostrava, Czech Republic, 2012. [Google Scholar]
- Anderson, J.D. Fundamentals of Aerodynamics, 2nd ed.; McGraw-Hill: New York, NY, USA, 1991. [Google Scholar]
- Cleckner, R.M. Long Range Shooting Handbook; North Shadow Press: Sydney, Australia, 2016. [Google Scholar]
- Li, Z.; Wang, H.; Chen, J. Ground Effects on the Hypervelocity Jet Flow and the Stability of Projectile. Eng. Appl. Comput. Fluid Mech. 2018, 12, 375–384. [Google Scholar] [CrossRef] [Scilit]
- Gillespie-Brown, J. Precision Long Range Shooting and Hunting V2: Fundamentals, Ballistics and Reading the Wind; CreateSpace Independent Publishing Platform: North Charleston, SC, USA, 2017. [Google Scholar]
- Jirsák, Č.; Kodym, P. Vnější Balistika A Teorie Střelby; Naše vojsko: Prague, Czech Republic, 2017. [Google Scholar]
- Kneubuehl, B.P. Balistika; Naše vojsko: Prague, Czech Republic, 2013. [Google Scholar]
- Anderson, J.D. Modern Compressible Flow, 2nd ed.; McGraw-Hill: New York, NY, USA, 1990. [Google Scholar]
- Kılıç, R.C.; Cellek, F.; Kantaroğlu, E. Numerical Investigation of the Aerodynamic Characteristics of A.40 S&W Jhp Bullet. Kastamonu Univ. J. Eng. Sci. 2026, 12, 32–42. [Google Scholar] [CrossRef] [Scilit]
- Sellier & Bellot. Kulové Náboje. Available online: https://www.sellier-bellot.cz/produkty/kulove-naboje/kulove-naboje-training-fmj// (accessed on 26 February 2025).
- Palmaro, F. Caldwell Ballistic Precision Chronograph. Available online: https://www.all4shooters.com/en/shooting/accessories/caldwell-ballistic-precision-premium-kit-ballistic-chronograph/ (accessed on 9 March 2025).
- Caldwell. Ballistic Precision Chronograph Premium Kit. Available online: https://www.caldwellshooting.com/range-gear/chronographs-and-wind-meters/ballistic-precision-chronograph-premium-kit/721122.html (accessed on 9 March 2025).
- Baehr, H.D.; Kabelac, S. Thermodynamik, 14th ed.; Springer: Berlin/Heidelberg, Germany, 2009. [Google Scholar]
- Ansys Fluent Theory Guide. 2022. Available online: www.ansys.com (accessed on 21 October 2022).
- Yang, Y.; Li, M.; Shu, S.; Xiao, A. High order schemes based on upwind schemes with modified coefficients. J. Comput. Appl. Math. 2006, 195, 242–251. [Google Scholar] [CrossRef] [Scilit]
- Barth, T.; Jespersen, D. The design and application of upwind schemes on unstructured meshes. In Proceedings of the 27th Aerospace Sciences Meeting, Reno, NV, USA, 9–12 January 1989. [Google Scholar]
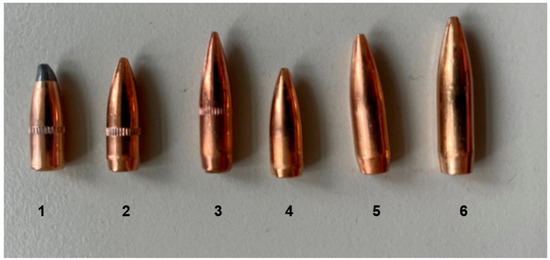
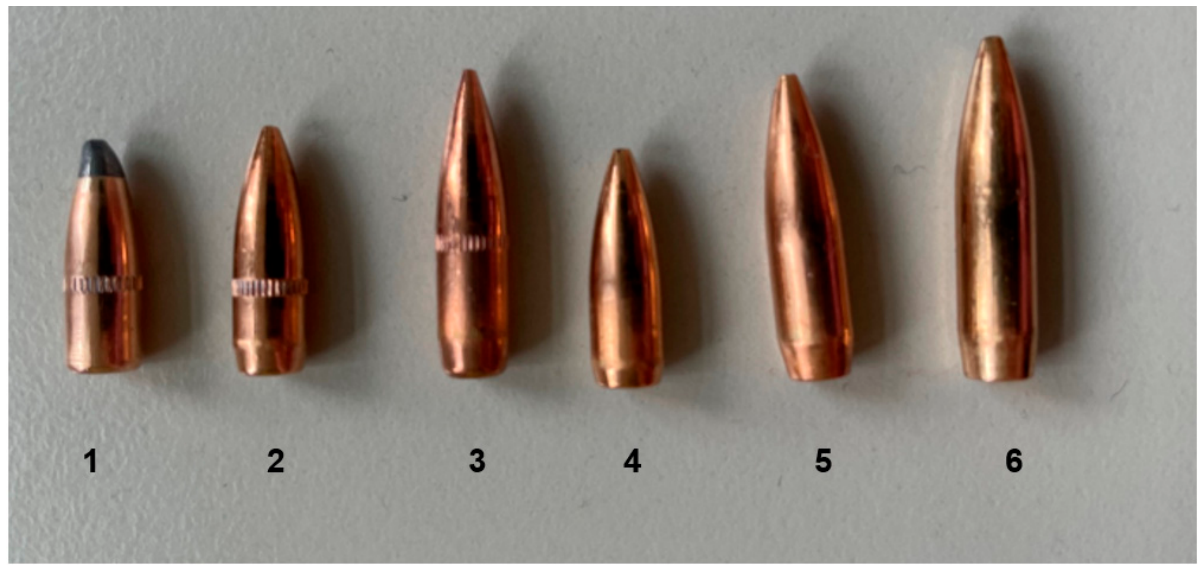
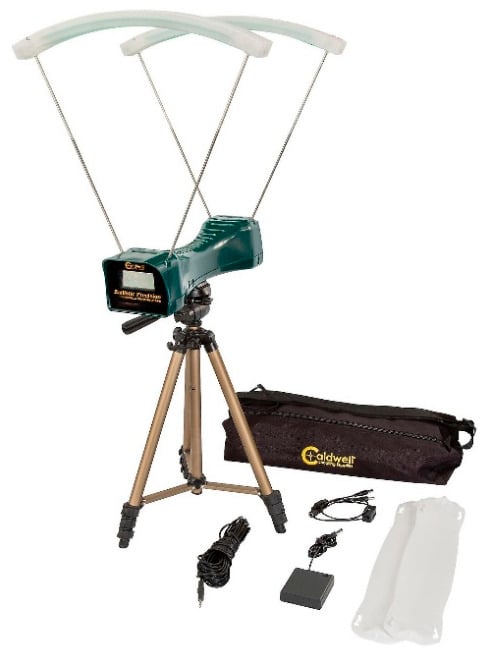
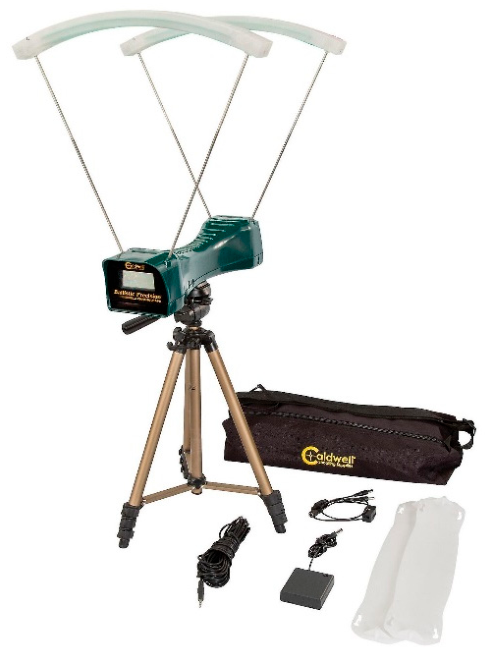
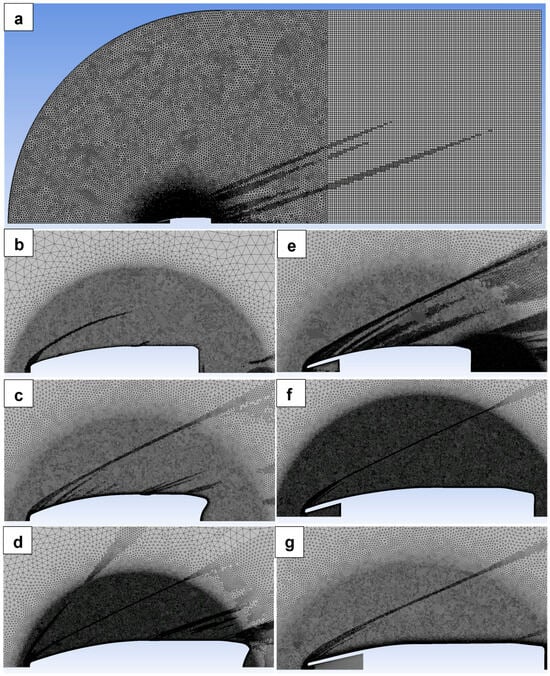
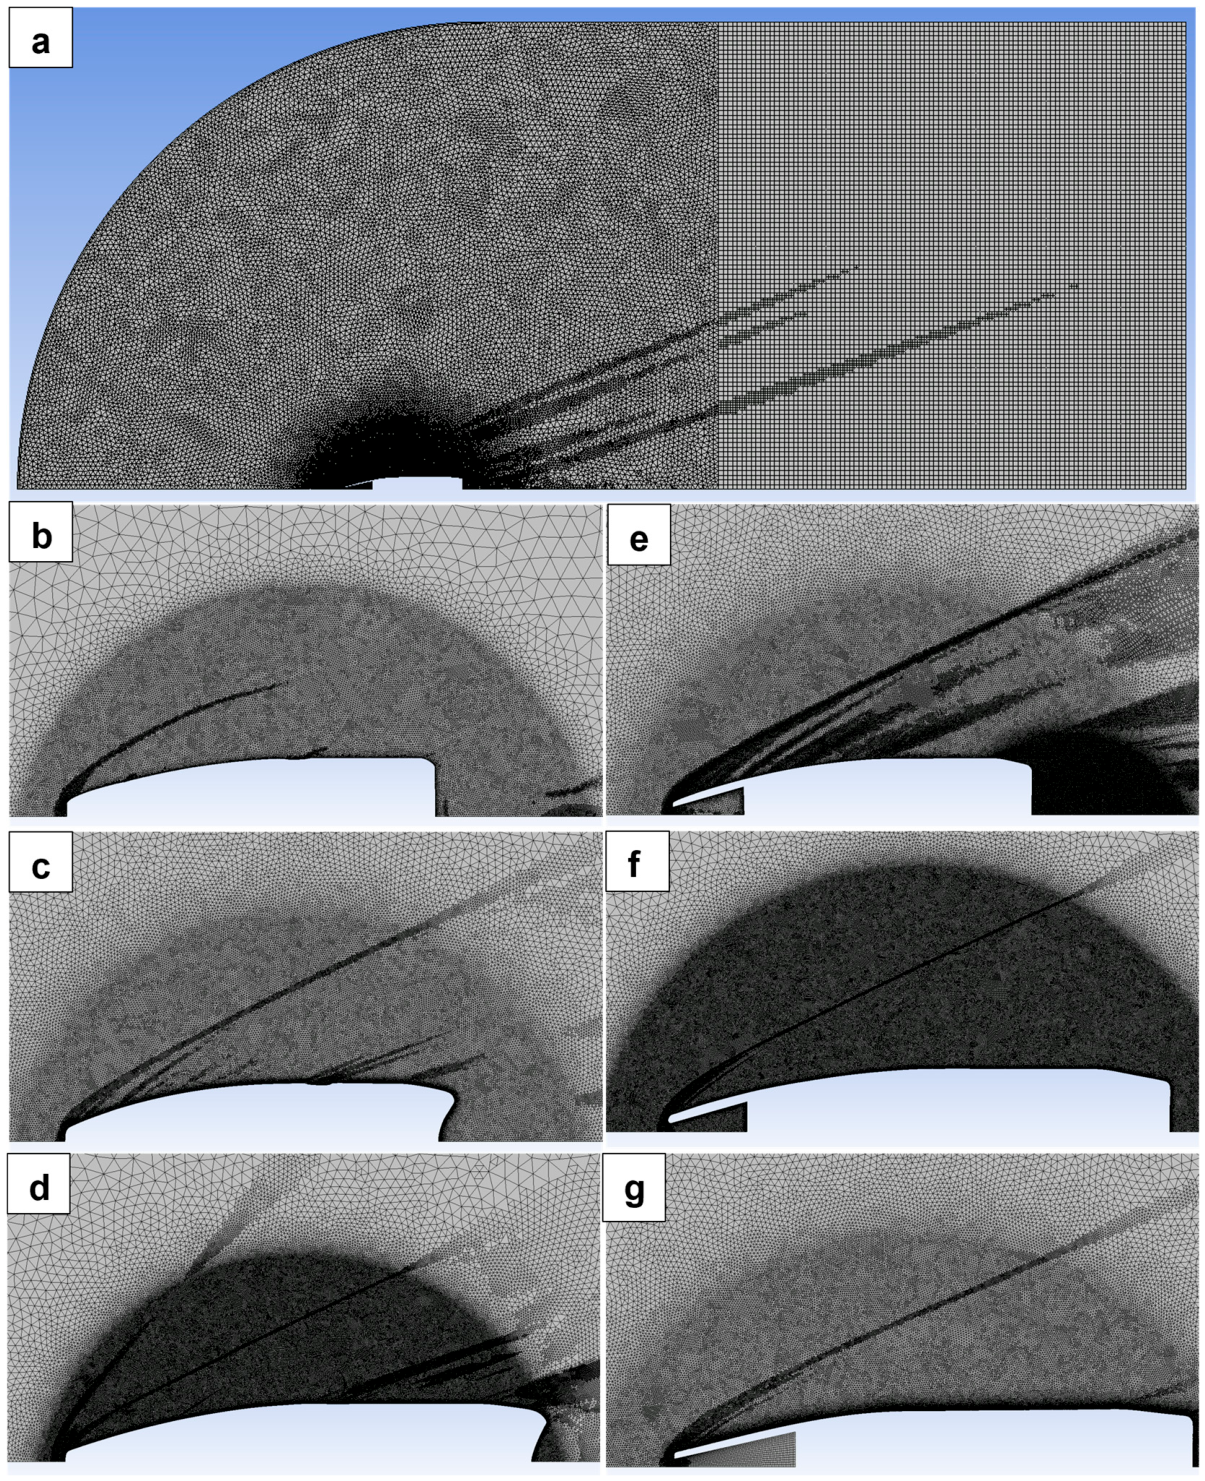
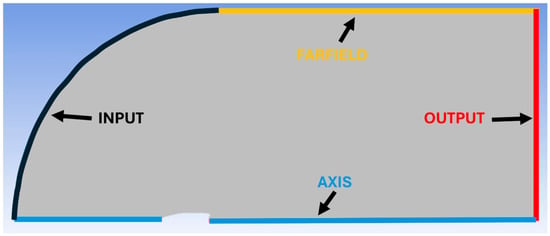
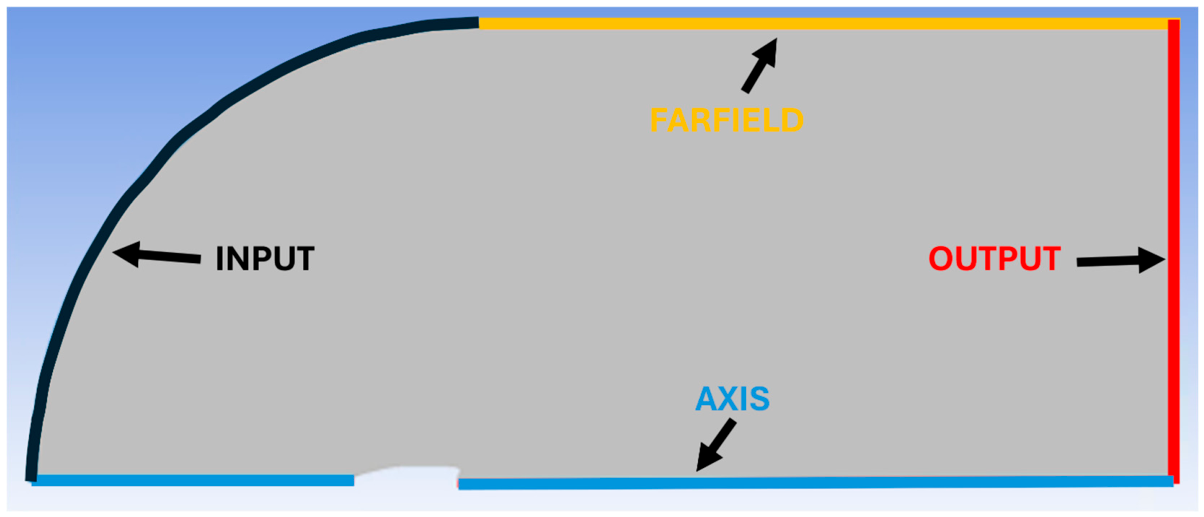
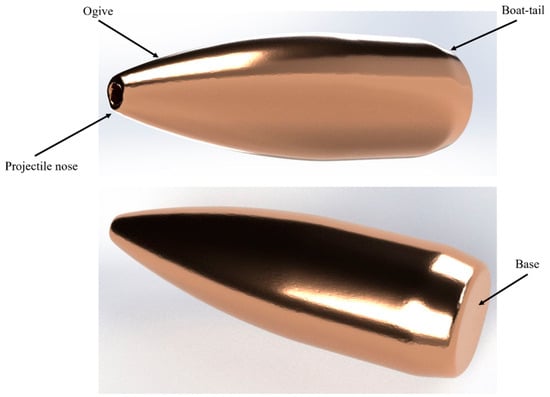
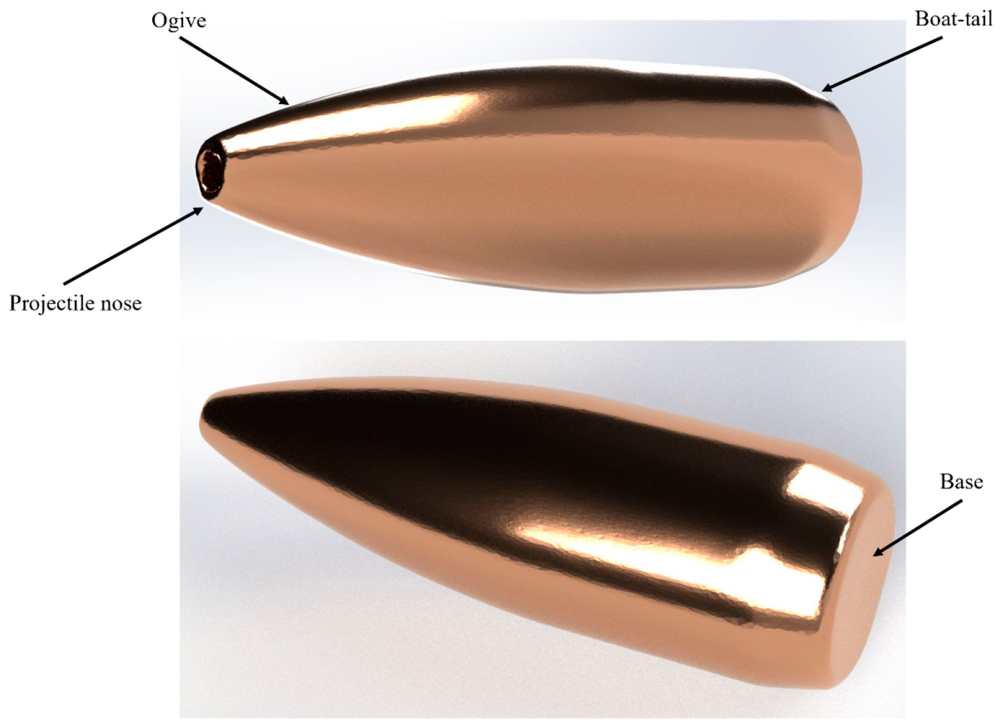
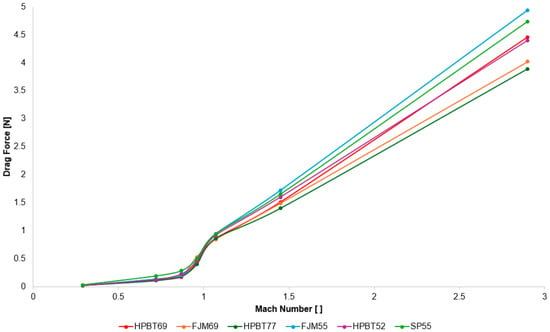
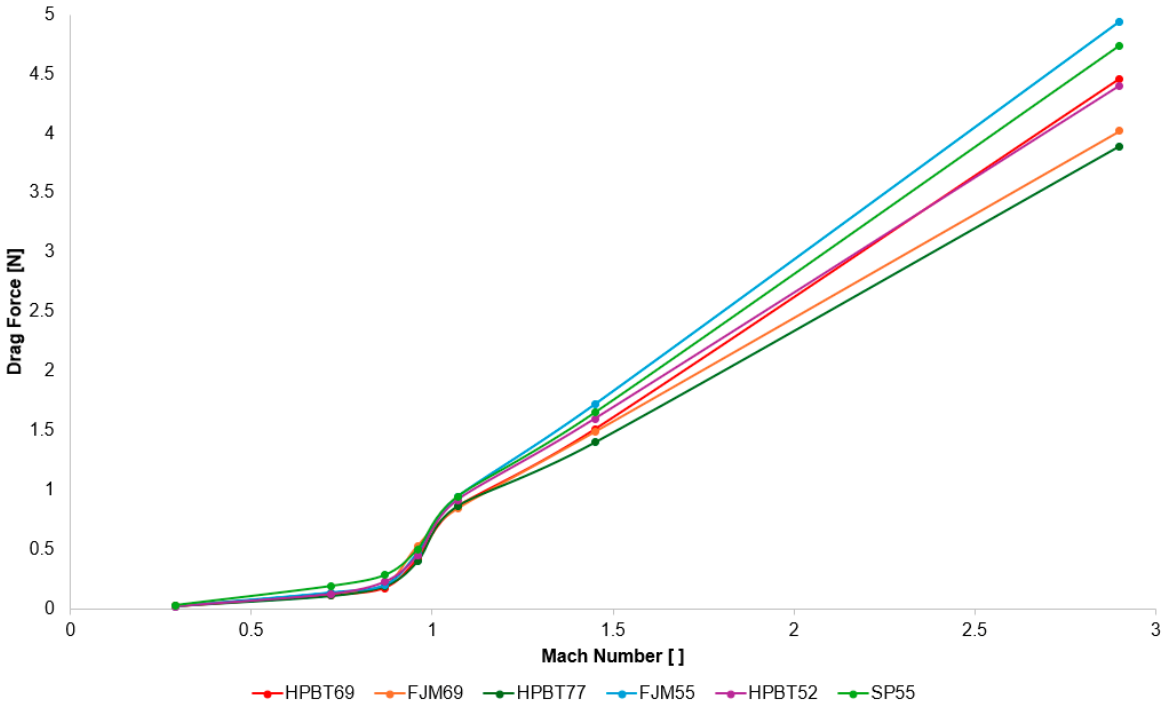
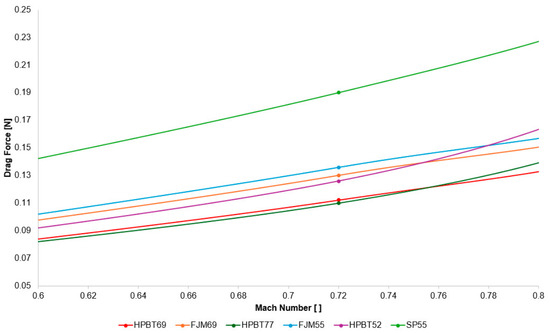
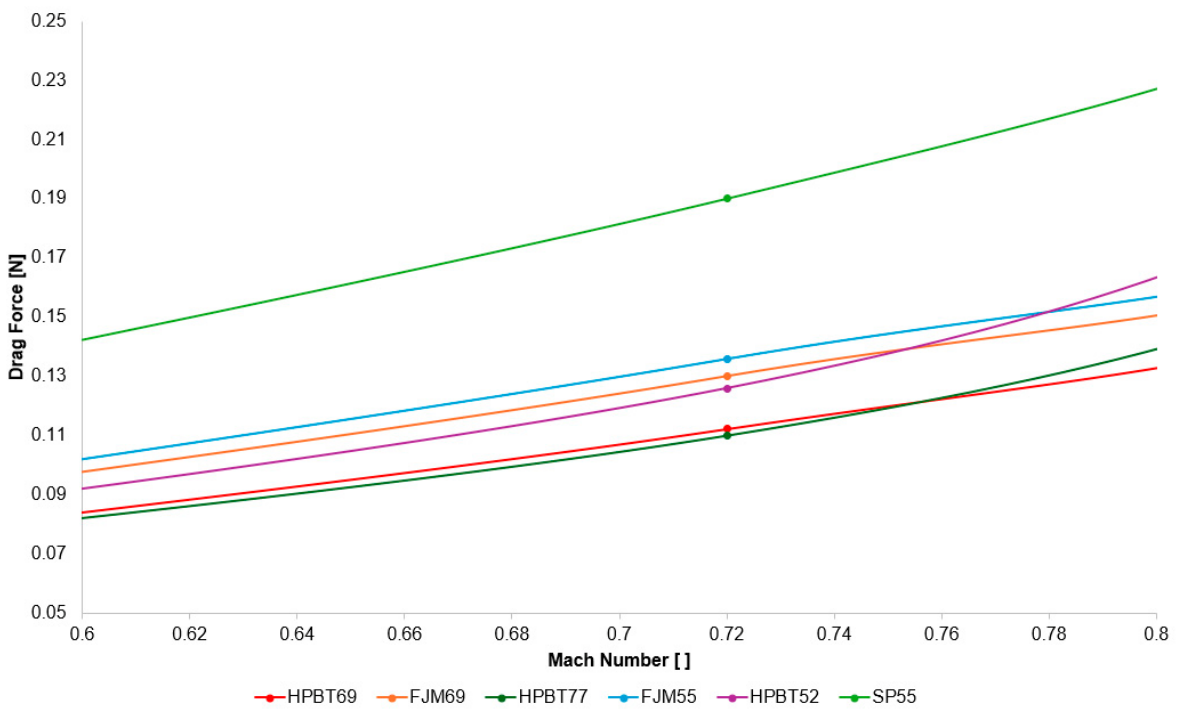
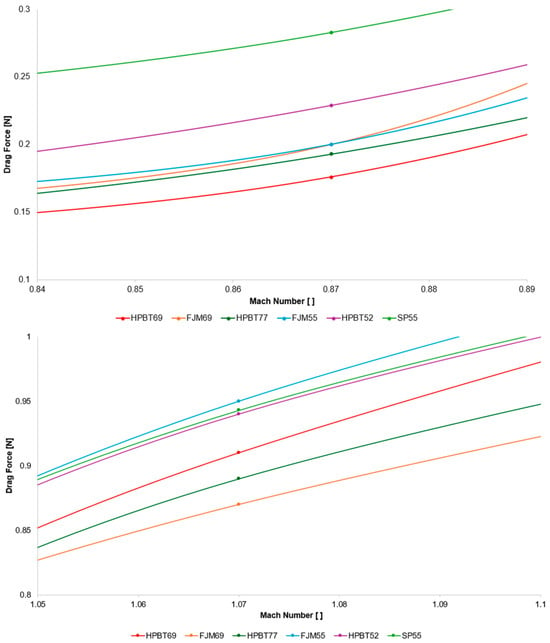
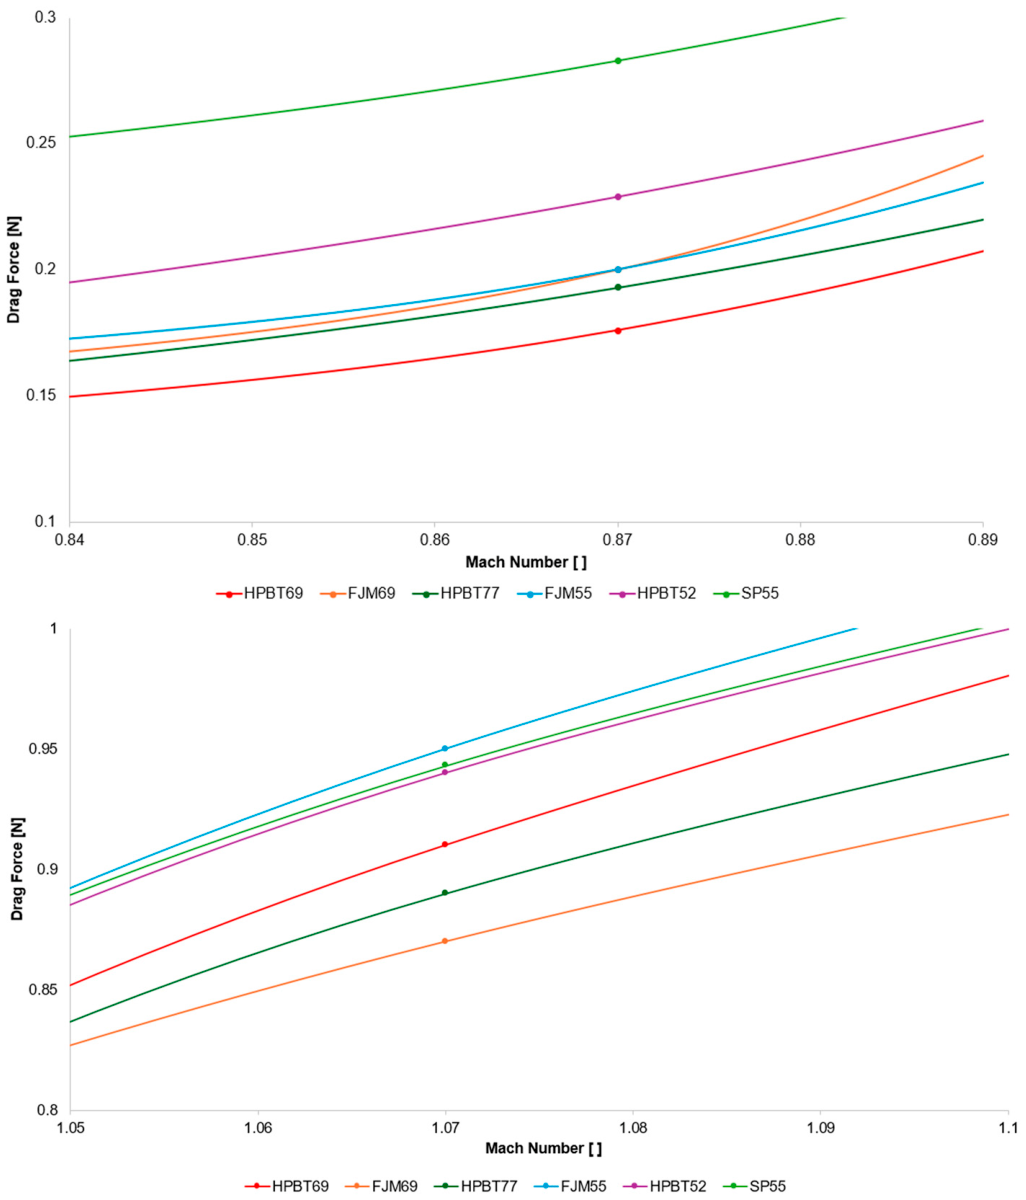
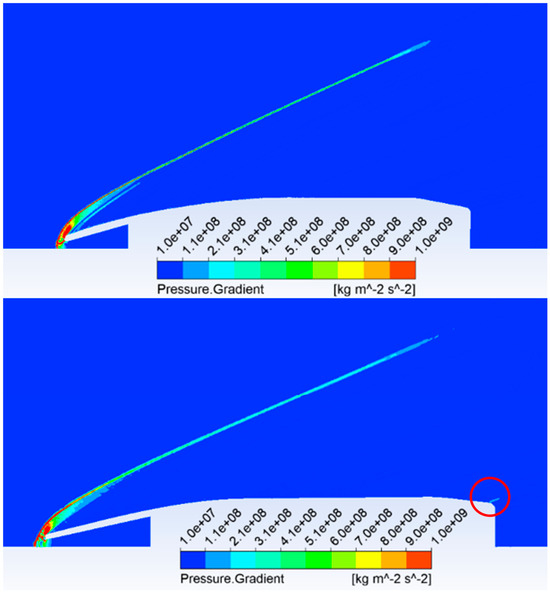
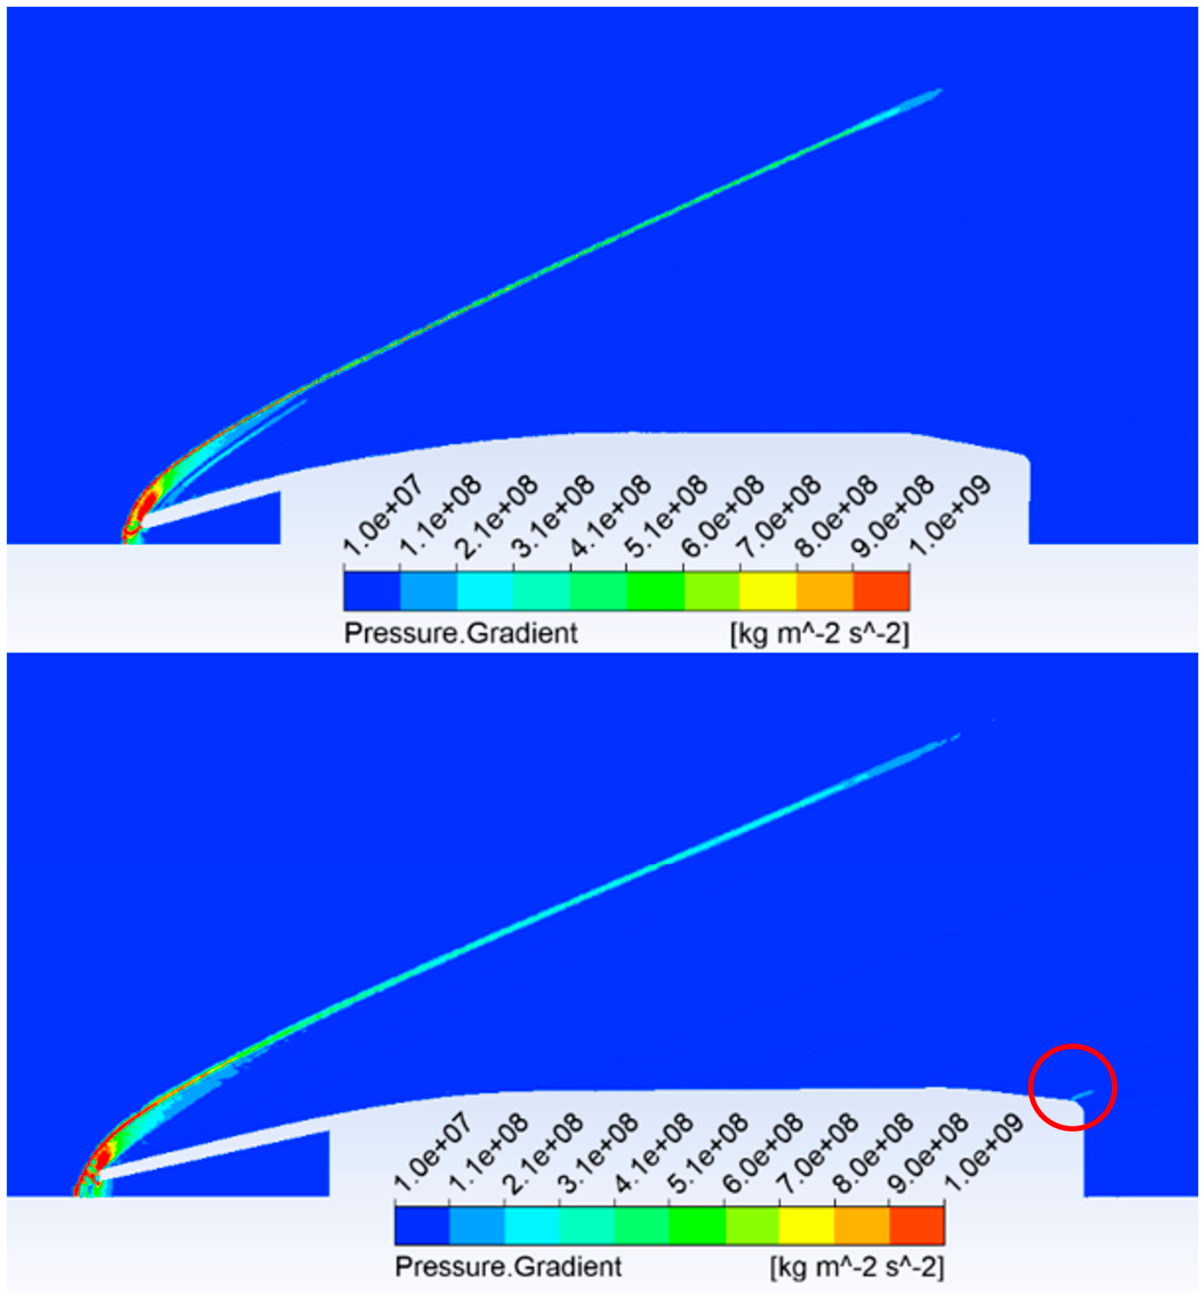
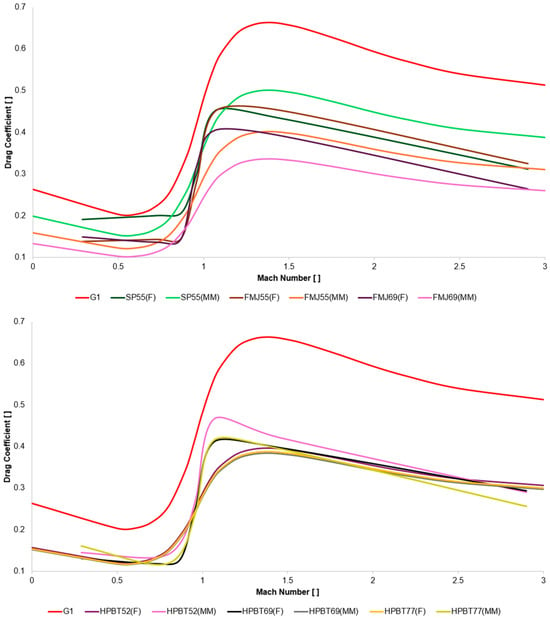
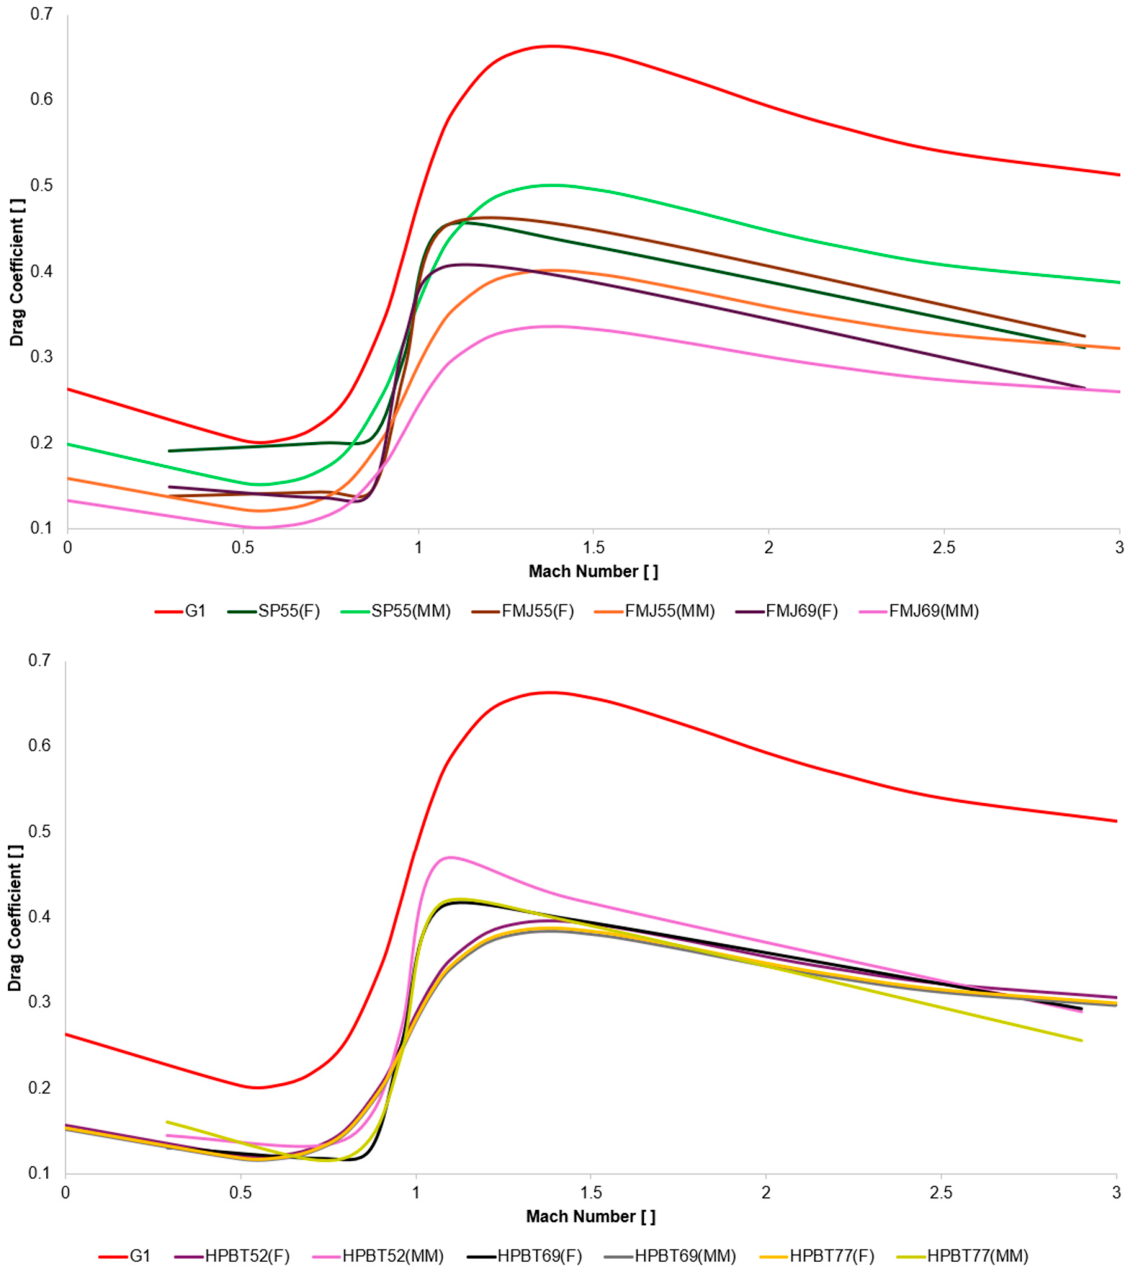
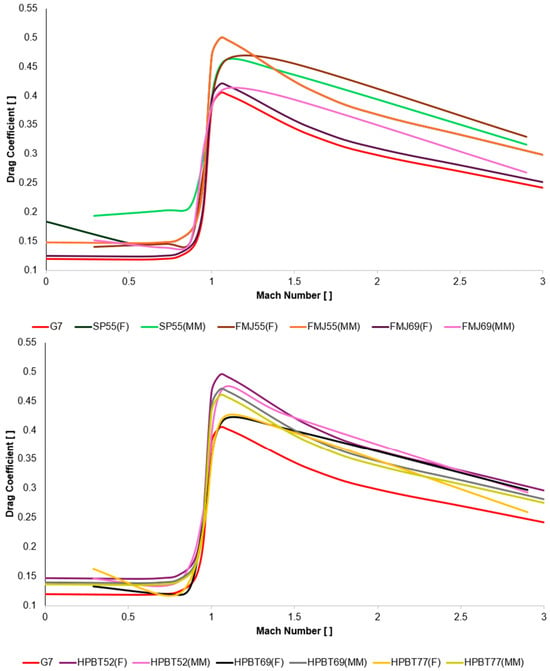
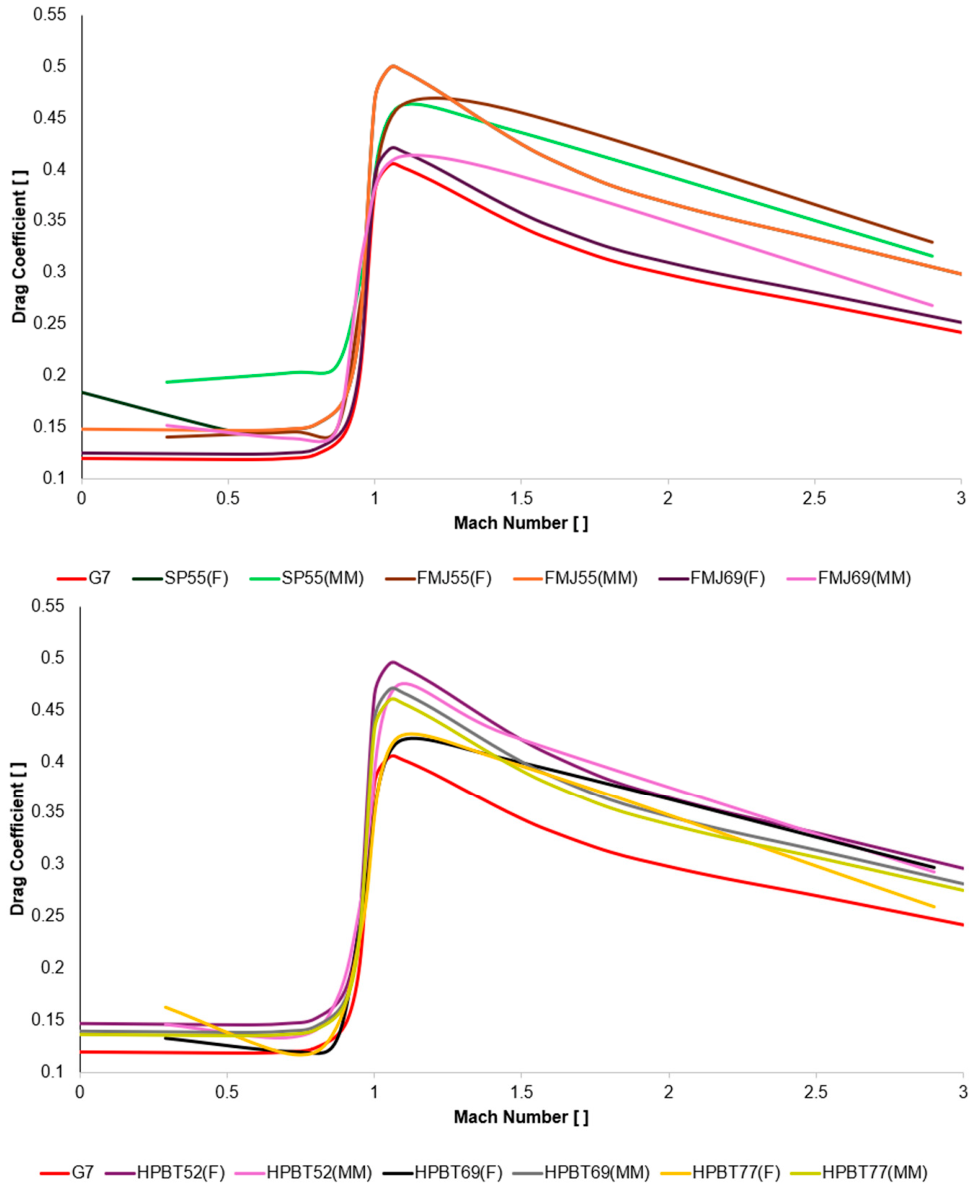

Disclaimer/Publisher’s Note: The statements, opinions and data contained in all publications are solely those of the individual author(s) and contributor(s) and not of MDPI and/or the editor(s). MDPI and/or the editor(s) disclaim responsibility for any injury to people or property resulting from any ideas, methods, instructions or products referred to in the content. |
© 2026 by the authors. Licensee MDPI, Basel, Switzerland. This article is an open access article distributed under the terms and conditions of the Creative Commons Attribution (CC BY) license.