


Abstract
Artificial Intelligence (AI) has evolved from a tool for automation into a strategic component of organizational decision-making. However, the extent to which the dimensions of Human–AI Interaction are associated with leadership remains underexplored, particularly in emerging economies. This study examines how interaction quality, productivity enhancement, user experience, organizational impact, ethical governance, and innovation are associated with Leadership Effectiveness and Organizational Sustainability in Colombian organizations. We applied Structural Equation Modeling (SEM) to data collected from 170 participants using a purpose-built 30-item instrument designed to measure eight dimensions of the human–AI relationship through a five-point Likert scale. Six dimensions assessed Human–AI Interaction (Interaction Quality, Productivity and Efficiency, User Experience and Acceptance, Organizational Impact, Ethical Governance, and Innovation and Transformation), while two dimensions assessed leadership (Leadership Effectiveness and Organizational Sustainability). Estimation used maximum likelihood (ML/FIML) as the primary method, with robust ML (MLR) and an item-level WLSMV estimator as sensitivity checks. Correlation analysis (Pearson, with Spearman as a robustness check) revealed consistent positive and significant associations among all construct indicators. Confirmatory Factor Analysis (CFA) confirmed convergent validity, with innovation () emerging as the highest-loading dimension. The structural model demonstrated a significant association between Human–AI Interaction and leadership (two-parcel model: , ). Under a more conservative six-item leadership specification, the association attenuates to (), which we treat as the substantive estimate. Common-method-variance diagnostics (Harman’s first factor ; a common latent factor accounting for ≈41% of variance) and an elevated RMSEA (= 0.13) signal the need for expanded measurement models and longitudinal designs to address causality. The findings suggest that ethical governance and innovation-oriented AI interaction are primary correlates of leadership effectiveness in digital organizations operating in emerging economies.
1. Introduction
The recent literature views AI as a socio-technical phenomenon that reconfigures fundamental relationships between people, systems, and organizational structures [1,2]. In emerging economies such as Colombia, AI adoption faces unique challenges, including digital gaps, heterogeneous technological capabilities, and evolving regulatory frameworks [3,4,5]. These conditions imply that AI implementation is not a linear process but a complex evolution dependent on critical organizational factors such as leadership, culture, and governance [6,7,8].
Despite the growing attention devoted to AI-driven organizational change, empirical research on the association between human–AI interaction dimensions and leadership remains limited, particularly in Latin American contexts characterized by institutional heterogeneity and uneven digital maturity [3,9]. Existing research has tended to address AI and leadership either theoretically or in technologically advanced economies, leaving a substantial gap regarding the socio-technical dynamics of AI adoption in emerging settings [10,11].
This study addresses this gap by empirically evaluating the structural association between Human–AI Interaction and leadership dimensions through a structural equation modeling (SEM) approach. We examine the extent to which Human–AI Interaction is associated with Leadership, operationalized through Leadership Effectiveness (Manage) and Organizational Sustainability (Sustain) in Colombian organizations. Furthermore, we identify which dimensions of Human–AI Interaction (Interaction, Productivity, User Experience, Organizational Impact, Ethical Governance, and Innovation) exhibit the strongest associations with leadership. In doing so, we contribute to the literature on AI management, socio-technical systems, and leadership in emerging economies.
1.1. Research Question
This study is guided by one central question:
- RQ.
- To what extent is Human–AI Interaction associated with leadership effectiveness and organizational sustainability in Colombian organizations, and which dimensions of Human–AI Interaction exhibit the strongest associations with Leadership Effectiveness and Organizational Sustainability?
1.2. Formal Hypotheses
Drawing on the socio-technical framework presented in Section 2, this study evaluates two central hypotheses:
- H1.
- The six Human–AI Interaction dimensions and the two leadership-related dimensions adequately represent their respective latent constructs, exhibiting significant and substantial factor loadings [12,13,14].
- H2.
- Human–AI Interaction is positively and significantly associated with Leadership Effectiveness and Organizational Sustainability in organizations [15,16].
2. Background and Theoretical Framework
The integration of AI into organizational structures represents a shift from simple task automation to a complex socio-technical environment [17,18]. This study defines the multidimensional nature of Human–AI Interaction (Human–AI) as a latent construct sensitive to technological and organizational environments [15,19]. Recent bibliometric evidence confirms that the thematic landscape of this field is dominated by interaction, collaboration, and augmentation as foundational concerns [9].
2.1. Dimensions of Human–AI Interaction (Human–AI)
Human–AI interaction has moved well beyond a peripheral technical activity and has become a central socio-technical component associated with organizational performance [9,20]. We operationalize this construct through six theoretically distinct dimensions, each grounded in established organizational and information systems research.
2.1.1. Interaction Quality (Interac)
The quality and frequency of communicative exchange between human actors and AI systems form the foundational layer of the human–AI nexus. Modern interaction involves a bidirectional flow of information in which AI provides predictive insights that shape human judgment [21,22]. This recursive process reconfigures traditional workflows, since leaders must balance their intuitive expertise with algorithmic outputs generated by machine learning models [23]. Effective interaction protocols ensure that AI systems operate as transparent collaborators rather than opaque “black boxes,” enhancing the leader’s ability to coordinate complex tasks [24,25].
2.1.2. Productivity and Efficiency (Product)
AI-driven productivity gains stem primarily from the augmentation of human cognitive capabilities and the automation of high-frequency, low-complexity tasks. By offloading routine administrative functions to intelligent systems, leaders can redirect attention toward strategic thinking and relationship management [1,2]. This efficiency gain is not merely quantitative; it reflects a structural improvement in the organization’s capacity to process information and respond to market volatility [26]. Research consistently shows that productivity is maximized when AI is used as an augmentative force rather than a wholesale replacement for human oversight [27,28]. Organizations that leverage AI effectively tend to exhibit greater agility and more sustainable management practices [6].
2.1.3. User Experience and Acceptance (Experien)
For an AI system to be adopted effectively, it must minimize cognitive load and facilitate seamless decision-making. Usability and perceived usefulness are central predictors of technology adoption [29,30]. A positive user experience fosters self-efficacy among managers and reduces resistance to technological change [7,31]. Beyond interface design, user experience encompasses the trust and psychological safety that arise from interacting with predictive systems. When interfaces are counterintuitive or outputs are difficult to interpret, the resulting technostress can undermine leadership performance and underutilize available AI capabilities.
2.1.4. Organizational Impact (Impact)
The organizational impact of AI refers to how it reconfigures authority, coordination, and decision-making mechanisms. As AI systems assume roles in performance monitoring and resource allocation, traditional boundaries of managerial authority shift [32,33]. This creates a new organizational landscape where leadership is distributed across human and non-human agents, requiring a re-evaluation of goal-setting and pursuit processes [8,34]. In emerging economies, the strategic impact of AI is also measured by its capacity to provide data-driven legitimacy to management decisions and to bridge structural inefficiencies [35]. The depth of this impact depends on how thoroughly AI has been integrated into the firm’s core leadership model [20].
2.1.5. Ethical Governance (Gobethic)
Ethical governance encompasses the regulatory and moral frameworks that guide AI deployment. As AI systems influence critical organizational decisions—including hiring, promotions, and strategic pivots—the need for transparency, fairness, and accountability becomes paramount [36,37]. Leaders must ensure that AI interactions are governed by principles that prevent algorithmic bias and protect stakeholder interests [4,38]. Zárate-Torres et al. [10] propose that leadership mediates the human–AI relationship through an ethical and strategic function, establishing governance mechanisms that align automated decisions with human judgment. Effective governance thus ensures that technological advancement does not compromise social responsibility, supporting the long-term sustainability goals of the organization [16].
2.1.6. Innovation and Transformation (Innovat)
Innovation-oriented interaction captures AI’s capacity to support creative processes and enable new business models. By identifying patterns in large datasets that are not apparent to human observers, AI can catalyze combinatorial innovation—the synthesis of existing ideas into novel solutions [39,40]. This dimension is particularly relevant for leaders seeking to maintain a competitive edge through continuous adaptation [41]. The role of AI in innovation extends beyond technical R&D to include the redesign of organizational cultures: when AI is positioned as a tool for experimentation rather than mere optimization, employees at all levels are empowered to propose data-backed improvements [42]. For organizations in Latin America, leveraging AI for innovation is a strategic pathway to move up the value chain [11,43].
2.2. Leadership
2.2.1. Leadership Effectiveness (Manage)
Leadership effectiveness in the age of AI is increasingly measured by the ability to manage the joint functioning of human and machine decision-making. Traditional management models are giving way to adaptive frameworks in which the leader’s central role is to ensure that AI-driven insights are ethically and strategically aligned with organizational goals [15,24]. The relevant study by Zárate-Torres et al. [10] shows that leadership serves as the axis connecting human and technological systems, establishing a hybrid interaction that is at once flexible, efficient, and ethically governed. Effective leadership also involves actively mitigating risks associated with algorithmic opacity and data-driven bias [44].
2.2.2. Organizational Sustainability (Sustain)
Organizational sustainability through AI extends beyond environmental concerns to encompass the long-term viability of the firm within a digital-first economy. Sustainability is achieved when AI systems are used to optimize resource allocation, enhance transparency, and support inclusive growth models [3,16]. This requires a shift from short-term optimization toward a strategic vision in which AI serves as a pillar for ethical and responsible value generation [36]. In emerging markets such as Latin America, sustainability is intrinsically linked to digital inclusion and the ethical use of technology to bridge structural inequalities [35,37]. When human–AI interaction is grounded in ethical governance and a genuine orientation toward innovation, the result is a self-reinforcing dynamic that stabilizes the organization against market volatility [11,19,43].
2.3. Socio-Technical Synthesis
This study is grounded in socio-technical systems theory, which argues that organizational outcomes emerge from the joint optimization of social and technical subsystems [45]. From this perspective, AI is not treated as an isolated technological resource, but as part of a broader organizational configuration in which human judgment, digital infrastructures, ethical rules, and managerial practices interact [18,20,36].
The six dimensions of Human–AI Interaction proposed in this study reflect this socio-technical logic. Interaction Quality, Productivity and Efficiency, User Experience and Acceptance, Organizational Impact, Ethical Governance, and Innovation and Transformation capture complementary ways in which AI becomes embedded in organizational work, decision-making, governance, and adaptation [9,18,20]. Together, these six dimensions operationalize Human–AI Interaction as a first-order latent construct. The model does not assume a higher-order hierarchical structure; instead, it treats the six dimensions as theoretically grounded indicators of a common socio-technical phenomenon.
Complexity leadership theory complements this argument by suggesting that leadership in AI-intensive organizations emerges from dynamic interactions among people, technologies, routines, and institutional conditions [46]. Leadership effectiveness and organizational sustainability are therefore understood as leadership-related outcomes associated with the quality of Human–AI Interaction. In this framework, AI governance provides the normative layer of the model, since transparency, fairness, accountability, and responsible data use are central to the organizational integration of AI [20,36].
Accordingly, this study proposes that Human–AI Interaction is positively associated with Leadership Effectiveness and Organizational Sustainability. Given the cross-sectional and single-source design, this association is interpreted as shared variance rather than evidence of temporal precedence or causal prediction.
3. Materials and Methods
This section describes the empirical approach used to evaluate the statistical association between Human–AI Interaction and leadership within the organizational context of an emerging economy. We adopt a quantitative, cross-sectional design utilizing Structural Equation Modeling (SEM) to test the proposed socio-technical framework [44].
The analysis combined Pearson correlations, with Spearman correlations as a robustness check, using the R package psych (version 2.2.9) [47] and Confirmatory Factor Analysis (CFA) implemented with the lavaan (version 0.6-21) R package [48], following Bollen’s [13] framework. When the psychometric structure is theoretically established in advance, a preliminary Exploratory Factor Analysis is not methodologically necessary. As Bollen [13] (p. 228) clarifies: “in confirmatory factor analysis a model is constructed in advance, the number of latent variables is set by the analyst.” To specify structural models, we used the software Ωnyx [49], whose syntax was exported and estimated in RStudio (version 2025.09.1+401), with reporting facilitated by the semTable (version 1.8) R package [50].
3.1. Participants and Data Collection
The study was conducted among a sample of 170 participants who voluntarily responded to the research instrument following informed consent procedures. Participants were managers, directors, and operational leaders with direct experience of AI-enabled processes in their organizations. The sample included professionals from diverse sectors (manufacturing, financial services, consulting, and public administration) and varying organizational sizes. The sample included an average of approximately 3.3 respondents per organization. However, because the available dataset does not include a reproducible organization-level identifier, cluster-robust standard errors could not be estimated. Therefore, intra-organizational clustering is acknowledged as a design limitation rather than modeled statistically. After listwise deletion of eight responses with missing data, the final analytical sample comprised 170 participants. This study was performed following the principles of the Declaration of Helsinki. The Ethics Committee of the Colegio de Estudios Superiores de Administración approved the study (Approval No. 002) on 1 September 2020.
3.2. Research Instrument
Data were collected using a purpose-built instrument designed to capture professional perceptions of human–AI relationships within administrative and leadership contexts. The instrument comprised 30 items across eight theoretically grounded dimensions: six measured Human–AI Interaction, and two measured leadership. The Human–AI construct—interaction quality (Interac, 4 items), Productivity and efficiency (Product, 4 items), User experience and acceptance (Experien, 4 items), Organizational impact (Impact, 3 items), Ethical governance (Gobethic, 5 items), and Innovation and transformation (Innovat, 4 items)—and the leadership construct: Leadership effectiveness (Manage, 3 items) and Organizational sustainability (Sustain, 3 items). All items are scored on a five-point Likert-type frequency scale anchored at 1 (Never) and 5 (Always), with intermediate points at 2 (Rarely), 3 (Sometimes), and 4 (Often). Each item presents a declarative statement about AI use in the respondent’s organization, and participants are asked to rate how frequently the described situation occurs.
The instrument was administered in Spanish, the respondents’ native language, and an English translation is available from the corresponding author upon request. The complete instrument is provided as Supplementary Materials.
3.3. Measurement Model (CFA)
To assess the validity of the proposed constructs, we conducted confirmatory factor analysis (CFA) using the lavaan (version 0.6-21) package in R [48]. The measurement model specifies Human–AI as a first-order latent construct measured by six parcel-level indicators: Interac, Product, Experien, Impact, Gobethic, and Innovat. Each parcel represents the mean score of the items belonging to its respective dimension. This specification does not model Human–AI as a higher-order or second-order construct. Instead, the six dimensions are treated as theoretically grounded indicators of a common socio-technical phenomenon.
This first-order specification is consistent with the theoretical logic of the study, which conceptualizes Human–AI Interaction as the organizational configuration through which human judgment, AI-enabled tools, governance mechanisms, user experience, productivity, and innovation become interconnected. Although future studies could examine alternative hierarchical specifications, such as second-order models distinguishing operational socio-technical dimensions from strategic-normative dimensions, the present study retains a first-order model to preserve parsimony and avoid additional identification constraints given the available sample size.
The measurement model consists of two primary latent variables:
- Human–AI:
- A multidimensional construct measured through six parcel-level indicators: Interac, Product, Experien, Impact, Gobethic, and Innovat. Each parcel aggregates the items within its respective dimension using the mean score, reducing parameter estimation demands while preserving construct breadth [14,44].
- Leadership:
- A composite leadership construct measured through two indicators: Manage (Leadership Effectiveness, items 25–27 averaged) and Sustain (Organizational Sustainability, items 28–30 averaged). Although modeling these as a single latent variable restricts the model, it reflects the theoretical position that both leadership dimensions jointly represent AI-mediated leadership performance [10]. Sensitivity analysis treating Manage and Sustain as separate correlated constructs is noted as a direction for future work.
The measurement model was estimated using maximum likelihood with full information maximum likelihood (ML/FIML) as the primary estimator. Because the parcels departed only mildly from normality ( ≤0.87), we additionally report robust maximum likelihood (MLR) and an item-level WLSMV analysis based on the polychoric correlation matrix of the 30 items as sensitivity analyses. Model fit was evaluated using CFI, TLI (thresholds ≥0.95 and ≥0.90, respectively), SRMR (<0.08), and RMSEA with 90% confidence interval [51,52,53].
All analyses were conducted in R version 4.5.0 [54]. Data management and preprocessing were performed using the readr (version 2.2.0) and dplyr (version 1.2.1) packages. The measurement and structural models were estimated with the lavaan package (version 0.6-21) [48], which is widely used for confirmatory factor analysis and structural equation modeling. Supplementary reporting procedures, including the generation of publication-ready tables, were supported by the flextable (version 0.9.11) and officer (version 0.7.4) packages.
3.4. Correlation Analysis
Prior to structural estimation, bivariate correlation analyses were conducted to identify associations among the observed indicators. Pearson correlations were used as the primary descriptive association measure because the SEM models were estimated using parcel-level mean scores treated as continuous approximations. Spearman rank-order correlations were additionally inspected as a robustness check, given the ordinal origin of the Likert-type items and the possibility of non-normal distributions in organizational data. This approach allowed us to assess whether the pattern of associations was consistent across parametric and non-parametric correlation measures.
3.5. Structural Equation Modeling (SEM)
The structural model specifies Human–AI interaction and Leadership as two associated latent constructs, with Leadership modeled as the endogenous construct for statistical estimation purposes. Two specifications of the leadership construct were compared, both estimated using ML/FIML: Model 1 (Leadership measured by two parcels) and Model 2 (Leadership measured by its six items, p25–p30), with the latter reported as the conservative and substantively preferred specification. This approach goes beyond simple regression by accounting for measurement error and providing a systemic view of how AI interaction reconfigures organizational authority [13,55].
We focused on standardized path coefficients () to assess the strength of the statistical association and on the coefficient of determination () to assess shared variance between the constructs. These estimates are not interpreted as evidence of temporal precedence or causal prediction. We also report RMSEA confidence intervals. Because the instrument uses an ordered five-point Likert scale, WLSMV was also applied to the polychoric correlation matrix as a theoretically preferable estimator for ordinal data [56], and the results are reported as a sensitivity analysis. The present analysis uses parcel-level mean scores as continuous approximations under FIML. This choice is justified by the modest skewness of the parcels ( ≤0.87), while the item-level WLSMV sensitivity analysis reported in Section 4.2 confirms that the substantive conclusions remain unchanged. Common method variance (CMV) is acknowledged as a potential confounding factor because all data were obtained from single-source, cross-sectional self-reports [46]. As a procedural remedy, the questionnaire was administered anonymously, and respondents were explicitly informed that there were no correct or incorrect answers. Future research should employ multi-source or longitudinal designs to address endogeneity and CMV more rigorously.
4. Results
4.1. Correlation Analysis
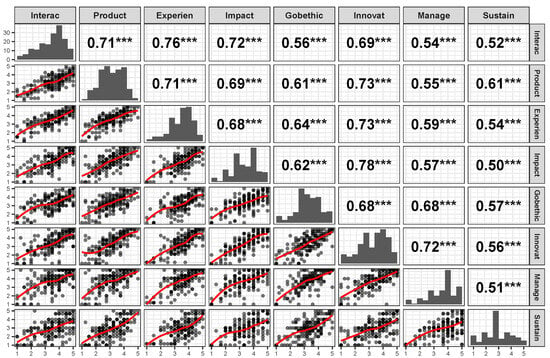
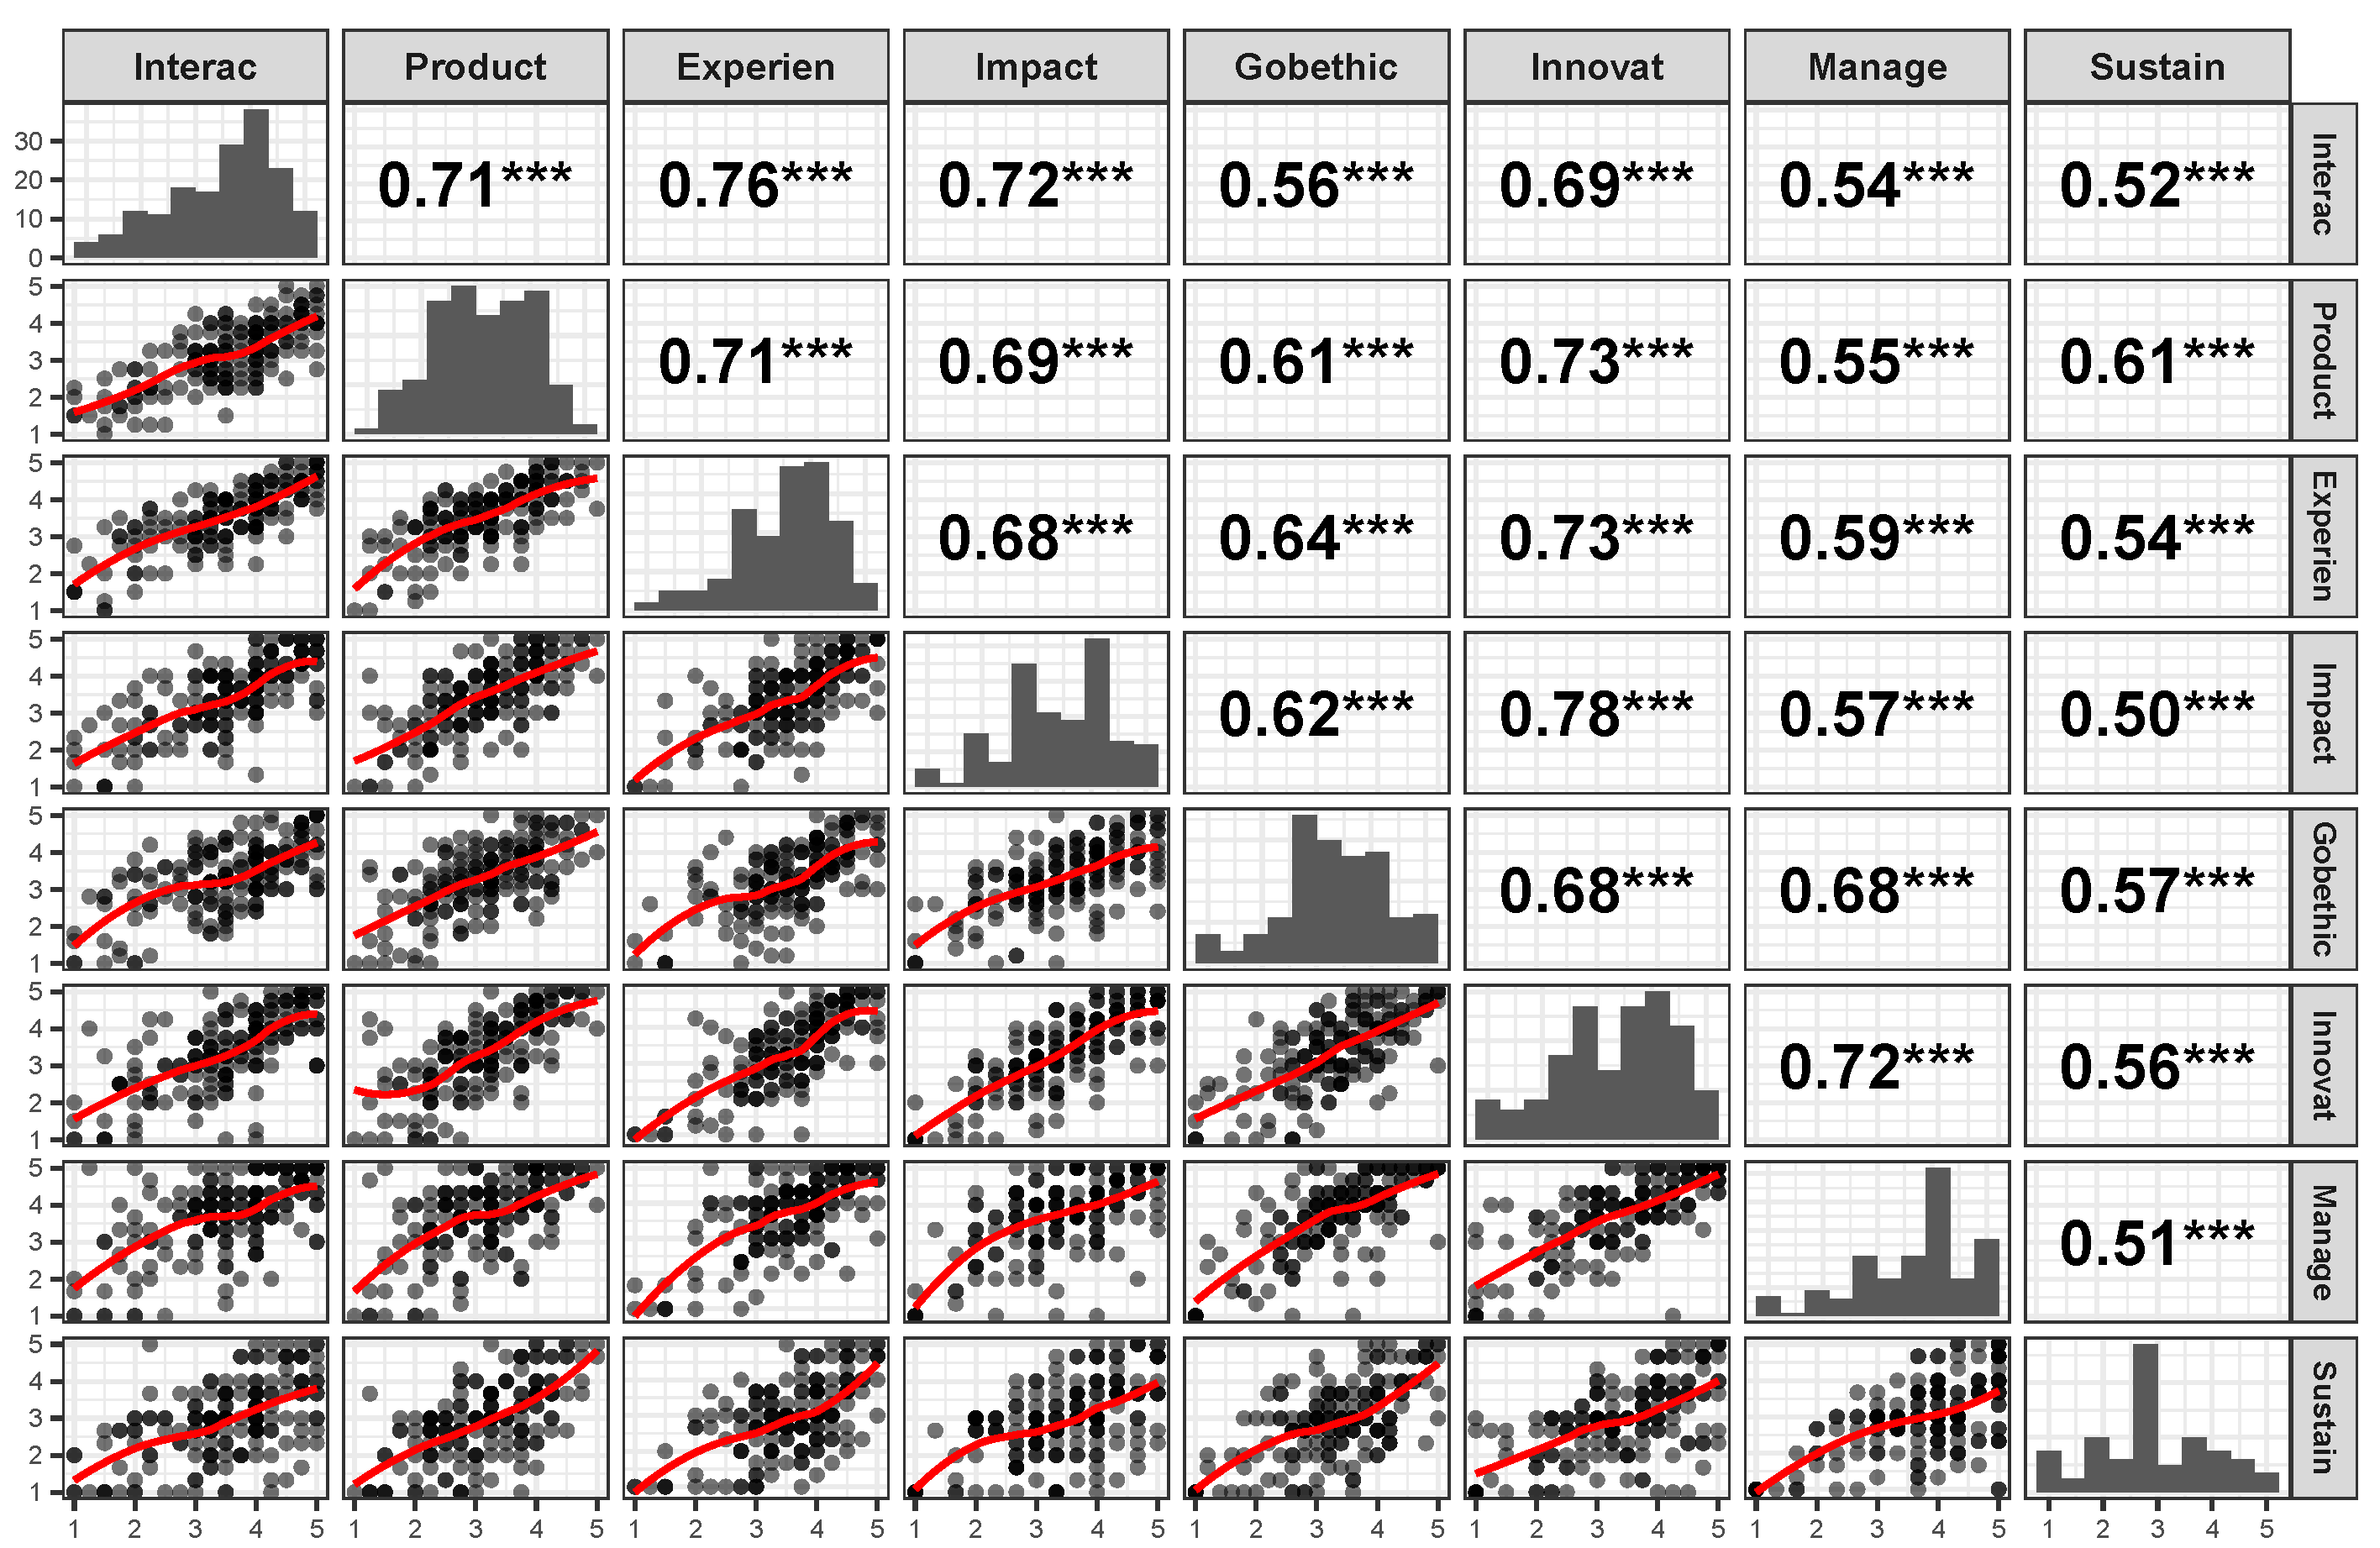
Pearson correlation analysis, Figure 1 revealed a consistent pattern of positive and statistically significant associations among all indicators of the Human–AI Interaction construct and the two Leadership dimensions. Spearman rank-order correlations showed a similar pattern and were used as a robustness check. Overall, the inter-indicator correlations ranged from moderate to strong, supporting the internal coherence of the Human–AI Interaction construct and the relevance of both leadership indicators, while remaining descriptive rather than causal.
Figure 1.
Pearson correlation matrix plot for the six Human–AI Interaction indicators and the two Leadership indicators. *** .
4.1.1. Associations with Leadership Effectiveness (Manage)
The Manage variable exhibits its most robust associations with Innovat () and Gobethic (), highlighting the central role of innovation and ethical governance within human–AI interaction. These findings suggest that perceived administrative leadership effectiveness is intrinsically linked to the organization’s capacity for technological innovation and the presence of rigorous ethical governance frameworks. Moderate-to-strong associations with Experien () and Impact () indicate that seamless user experience and tangible organizational transformation are important correlates of management performance in digital environments.
4.1.2. Associations with Organizational Sustainability (Sustain)
The Sustain dimension shows significant but moderately lower correlations compared to Manage. Sustain showed its strongest associations with Gobethic and Product, which are statistically indistinguishable under Pearson ( vs. 0.63) and favor Product under Spearman (0.61 vs. 0.57), reinforcing the theoretical premise that organizational sustainability under AI integration depends heavily on moral accountability and regulatory transparency. Additionally, Innovat () and Experien () show positive associations, suggesting that AI interaction not only optimizes immediate task execution but also contributes to the long-term viability and ethical responsibility of the firm.
4.2. Confirmatory Factor Analysis (CFA)
CFA was conducted to evaluate the proposed measurement model. Following methodological recommendations to ensure parameter stability and address potential non-normality in organizational data, the primary estimator was ML/FIML, with MLR and an item-level WLSMV analysis as robustness checks [51,56].
4.2.1. Factor Loadings and Construct Validity
As shown in Table 1, all factor loadings were statistically significant at the level in both models, indicating that the observed indicators adequately represent their respective latent constructs. H1 is therefore supported with respect to convergent validity (significant, substantial loadings); discriminant validity among the dimensions is limited (see below), which we address by modeling Human–AI Interaction as a single first-order construct. All factor loadings were statistically significant and exceeded the minimum threshold established for construct representation. [45]. For the Human–AI construct, the Innovat indicator presented the highest loading (). The Leadership construct showed solid loadings on both indicators: Manage () and Sustain (). Composite reliability ranged from 0.77 to 0.88 (all ), and AVE exceeded 0.50 for seven of the eight constructs (Product ; Table 2; Supplementary Table S1). Discriminant validity was limited: 19 of the 28 inter-construct correlations exceeded the square root of the AVE (Fornell–Larcker; Supplementary Table S2), HTMT exceeded 0.85 for 9 of the 28 pairs (Supplementary Table S3), and the aggregate Human–AI versus Leadership HTMT was 0.875 [57], indicating that the six Human–AI dimensions are not empirically separable and that the predictor and outcome share substantial variance.
Table 1.
Standardized factor loadings and explained variance () for the parcel-level measurement model estimated using ML/FIML.
Table 2.
Standardized factor loadings, structural coefficients, and model fit for the two SEM specifications.
4.2.2. Model Fit Evaluation
Model 1, the two-parcel leadership specification estimated using ML/FIML, showed acceptable fit according to incremental and residual-based indices, with CFI , TLI , and SRMR [51]. However, the RMSEA value was elevated (RMSEA ; 90% CI ), exceeding Browne and Cudeck’s [52] threshold of ≤0.08 for acceptable fit and approaching their cutoff of >0.10 for poor fit. Model 2, the six-item leadership specification also estimated using ML/FIML, showed weaker overall fit (, CFI , TLI , RMSEA , SRMR ). This pattern is expected because parcelling averages out item-level residual variance, whereas the six-item specification reveals sources of measurement misfit that are masked by the parcel solution. Accordingly, Model 2 is retained as the conservative, substantively preferred specification, while MLR and item-level WLSMV are reported separately as sensitivity analyses rather than as alternative substantive models.
The six-item specification (Model 2), which we treat as the substantive model, exhibited a somewhat weaker overall fit (, CFI , TLI , RMSEA ) than the two-parcel model. This result is expected because parcelling averages out item-level residual variance, whereas the item-level model reveals sources of misfit that are masked by the parcel solution. The principal substantive contribution of Model 2 is the attenuated structural coefficient () rather than its overall model fit. Importantly, both specifications consistently indicate a strong, positive association between Human–AI Interaction and Leadership. Consequently, the elevated RMSEA is interpreted as a limitation of the measurement model common to both specifications rather than as evidence against the direction or substantive interpretation of the structural association.
Taken alongside the significant (), the overall fit evidence indicates that the model is misspecified rather than merely sensitive to sample size. Modification indices point primarily to potential residual covariances between the Manage and Sustain indicators, consistent with the theoretical position (H2) that these constructs are conceptually distinct, and with the possibility that common method variance inflates their shared variance beyond what the leadership factor captures [46]. Readers should therefore interpret the structural coefficients as descriptive of shared variance under this specification, not as evidence of well-fitting causal structure.
4.2.3. Measurement Model Limitations
A technical limitation is the use of only two indicators for the Leadership construct. Although this specification allows model identification, it restricts the stability of estimates and limits the robustness of global fit indices [44]. The elevated RMSEA is primarily a function of this specification, as documented in the SEM literature for just-identified sub-models [52]. Future research should expand the Leadership construct with at least four indicators to improve fit stability. Additionally, composite reliability (CR) and average variance extracted (AVE) were computed at the item level and are reported in Table 2 (all CR ; AVE for seven of the eight constructs; Product ) [14,58].
4.3. Structural Equation Modeling (SEM)
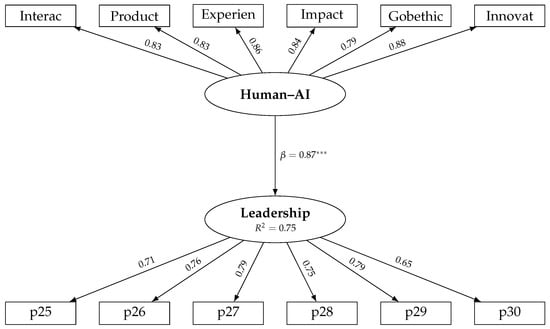
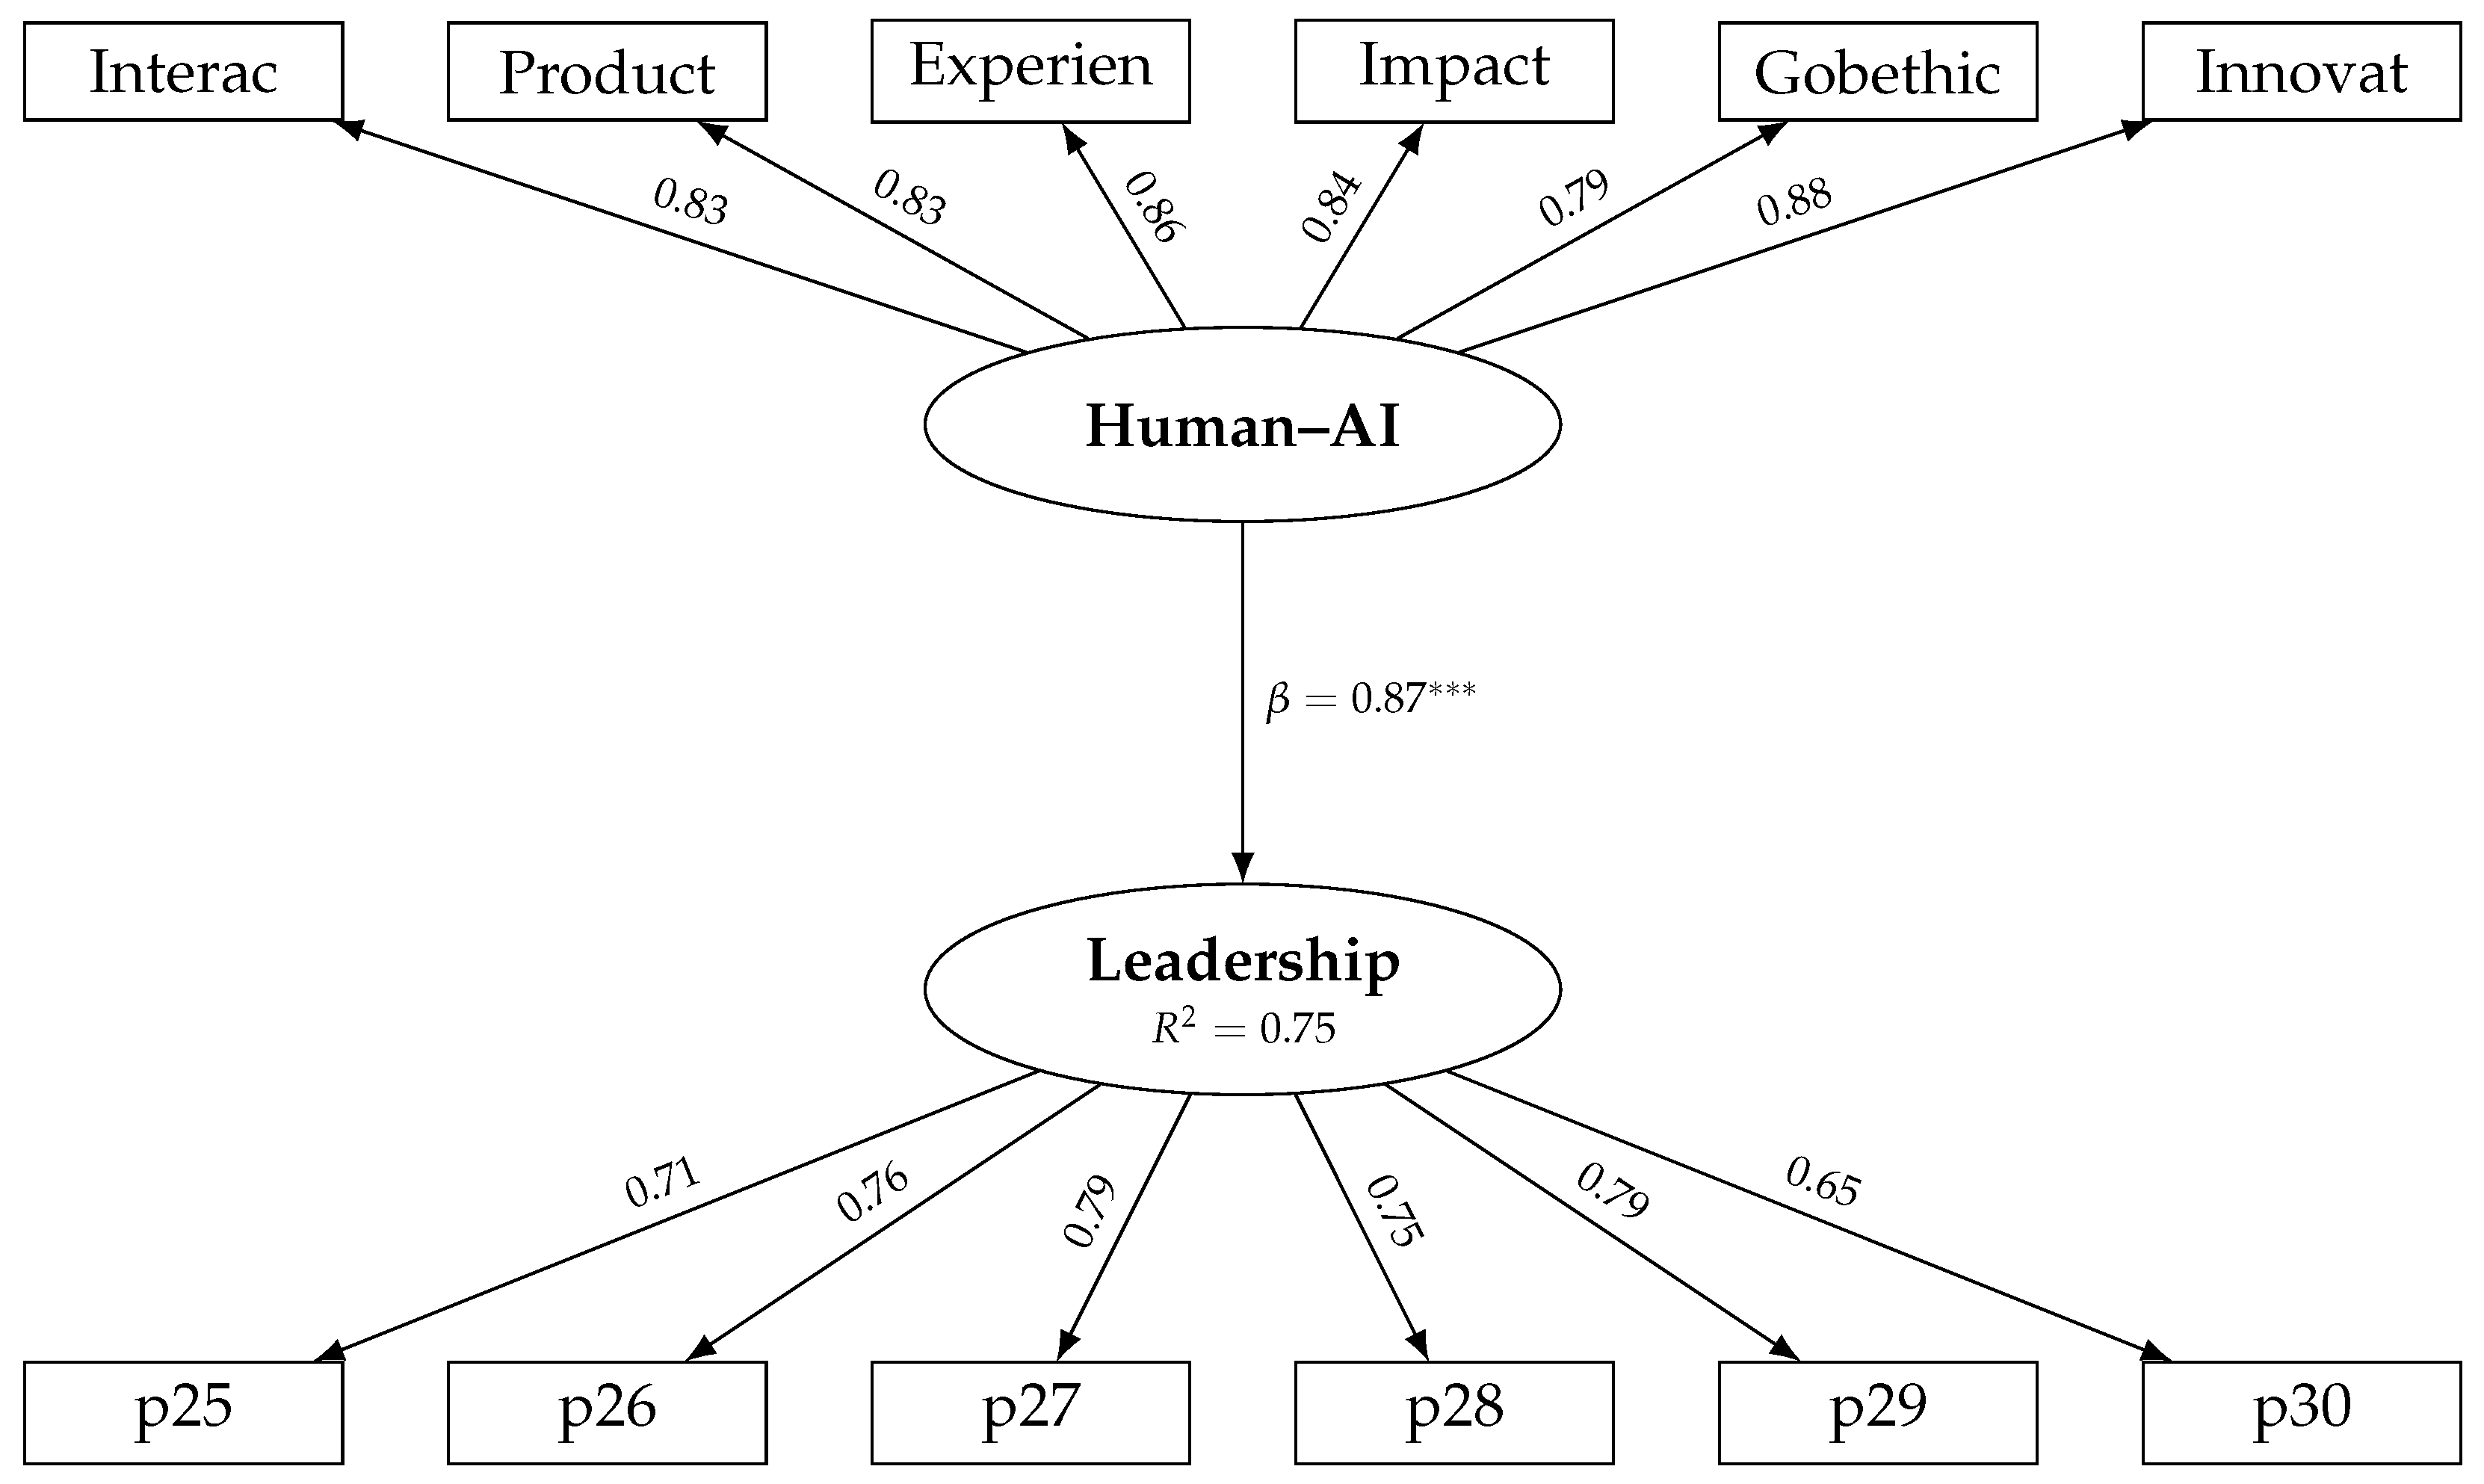
SEM was employed to evaluate the association between Human–AI and Leadership. As shown in Figure 2, two specifications of leadership were compared, both by ML/FIML (two parcels and six items). The structural component specified Leadership as the endogenous latent construct associated with the Human–AI multidimensional factor.
Figure 2.
Standardized structural equation model (SEM) for the six-item leadership specification (Model 2). The standardized path coefficient from Human–AI Interaction to Leadership was *** (), explaining 75% of the variance in Leadership (). *** .
4.3.1. Structural Path and Shared Variance
As shown in Table 2, the structural path from Human–AI to Leadership was positive and statistically significant () in both models. In Model 1, the standardized path coefficient reached , indicating a dominant positive association between AI interaction quality and leadership. The structural path from Human–AI Interaction to Leadership was positive and statistically significant (). Therefore, H2 is supported. The model showed a high degree of shared variance between Human–AI Interaction and Leadership under the specified cross-sectional model. While the value is remarkably high, it is consistent with the limited degrees of freedom in the Leadership construct (two indicators), common method variance in single-source cross-sectional data [46], and potential conceptual overlap between the Human–AI dimensions and the leadership items [46]. Readers should interpret this as reflecting strong shared variance rather than a causal relationship.
4.3.2. Model Comparison and Fit Indices
Model fit was evaluated following the two-index strategy recommended by Hu and Bentler [51]: the combination of (<0.08) and (≥0.95) provides acceptable evidence of fit for Model 1. Model 1 (FIML) demonstrated a substantially superior global fit, reaching acceptable values for CFI () and TLI (), both exceeding the recommended threshold of [51]. ML/FIML was used as the primary estimator. Robust maximum likelihood (MLR) yielded consistent parameter estimates with an improved RMSEA (= 0.11), whereas the item-level WLSMV analysis confirmed the structural coefficient () with acceptable model fit (RMSEA ; CFI ) [51,59].
However, the RMSEA value for Model 1 (; 90% CI []) constitutes a major limitation of the present model: it exceeds Browne and Cudeck’s [52] threshold of ≤0.08 for acceptable fit and approaches their cutoff of >0.10 for poor fit. The elevated RMSEA is acknowledged as a limitation; however, Kenny et al. [59] demonstrate that RMSEA is systematically inflated in models with small degrees of freedom (), which applies to the present specification (). Consistent with their recommendation, incremental and residual-based indices (CFI, TLI, SRMR) are prioritized in the overall fit evaluation.
4.3.3. Common Method Variance
Three diagnostic procedures were applied. Harman’s first unrotated factor accounted for 48.8% of the total variance, remaining below the conventional 50% benchmark. A one-factor CFA exhibited poor model fit (CFI ) relative to the eight-factor measurement model (CFI ), indicating that the covariance structure cannot be explained by a single common method factor. An unmeasured common latent factor (CLF) accounted for approximately 41% of the common variance; however, because this model is only weakly identified, this estimate should be interpreted as approximate [60]. Overall, common method variance (CMV) remains a material but only partially mitigated concern given the single-source, cross-sectional research design (Supplementary Table S4).
5. Discussion
The present study investigated the association between Human–AI Interaction and leadership within an organizational context. The findings provide substantial evidence that Human–AI interaction covaries strongly with Leadership, showing a high degree of shared variance under the specified model. This result should be interpreted as evidence of a strong statistical association rather than as evidence that Human–AI Interaction causally explains leadership outcomes [12,20].
5.1. Theoretical Implications
The strong structural association suggests that leadership in AI-intensive organizations is closely related to the quality of interaction with complex technological systems. However, given the cross-sectional and single-source design, this finding should not be interpreted as evidence that Human–AI Interaction causally shapes leadership outcomes. This aligns with complexity leadership theory [61] and socio-technical systems research [12], which view leadership as an emergent property of human–technology joint systems rather than an individual trait. Innovation (Innovat) emerged as the dimension with the highest factor loading (0.88), consistent with the measurement model results, and showed the strongest correlation with Leadership Effectiveness (). This underscores that leadership in emerging economies is increasingly defined by the capacity to foster innovation-oriented environments through AI [11,40].
The significant association between Ethical Governance (Gobethic) and Leadership Effectiveness () reinforces the growing importance of moral accountability in digital leadership [36,37]. This dimension’s somewhat stronger association with Organizational Sustainability () compared to some other interaction dimensions suggests a differentiated role of ethical governance in sustainability-related outcomes, indicating a functional differentiation between dimensions that future studies with larger samples should test formally.
The finding that Human–AI dimensions jointly account for such a large proportion of variance in Leadership also invites caution. From an HTMT perspective [58], such high shared variance may signal conceptual proximity between the predictor and leadership constructs—particularly for items measuring innovation leadership and AI-governance leadership, which may partially overlap with the Leadership items [46]. Future studies should report discriminant validity evidence directly. Specifically, the Fornell–Larcker criterion identified 19 of the 28 inter-construct correlations as exceeding the recommended threshold, while the aggregate Human–AI versus Leadership HTMT was 0.875, indicating substantial shared variance and limited discriminant validity between the predictor and outcome constructs [58].
5.2. Practical Implications
The findings offer practical implications for organizations operating in emerging digital economies. In the Colombian context, where AI adoption is shaped by uneven digital capabilities, developing regulatory frameworks, and heterogeneous organizational resources, Human–AI Interaction should be managed as a socio-technical process rather than as a purely technological implementation [1,18,26].
Organizations should first establish AI governance committees or AI ethics boards to define principles, review high-risk AI applications, and monitor the consequences of AI-supported decisions. These bodies should include technical, managerial, legal, and human talent perspectives, particularly when AI is used in recruitment, performance evaluation, promotion, customer segmentation, credit assessment, or other high-impact decisions. Such governance mechanisms are consistent with the need for transparency, fairness, accountability, and responsible AI deployment [20,36]. Second, firms should implement periodic bias and impact audits to evaluate whether algorithmic outputs generate systematic disadvantages, whether training data are appropriate for the local context, and whether managers understand the limits of AI-generated recommendations [20,24,36,60].
Third, organizations should strengthen AI and data literacy among managers and middle-level leaders. Leadership development programs should include training in algorithmic interpretation, human oversight, digital ethics, data protection, and responsible decision-making. This is especially important because AI adoption depends not only on technical availability, but also on perceived usefulness, trust, and the capacity of users to integrate digital tools into organizational routines [27,30,37]. Fourth, firms should conduct user-experience pilots before scaling AI solutions across business units. These pilots should assess usability, trust, perceived usefulness, workflow integration, and resistance to technological change [3,27,29]. Finally, innovation-oriented AI strategies should be connected to organizational learning mechanisms, allowing managers and employees to identify use cases, evaluate results, share lessons learned, and adjust AI practices according to ethical, operational, and strategic criteria [10,18,39].
These recommendations may be transferable to other emerging economies when similar conditions are present, including uneven digital infrastructure, developing AI regulation, limited experience with algorithmic governance, and the need to balance innovation with social responsibility [1,26,34]. However, organizations in countries with different regulatory frameworks, higher levels of digital maturity, or stronger institutional oversight should adapt these measures to their own governance requirements, data protection standards, labor regulations, and sector-specific risks. Thus, the practical implications should be interpreted as context-sensitive guidance rather than universal prescriptions.
5.3. Limitations
Several limitations must be acknowledged. First, the cross-sectional, single-source design introduces substantial common method variance risk [46], which is the most plausible alternative explanation for the very high (0.91) and (0.95) values. Procedural mitigants (anonymity, absence-of-correct-answers framing) were employed, but CMV cannot be formally ruled out without multi-source data or a longitudinal design. Second, in the original parcel-level specification, the Leadership construct was measured with two parceled indicators (Manage, Sustain), restricting degrees of freedom and contributing to the elevated RMSEA (0.13) [52,53]. Third, the sample of 170 participants is adequate but modest for SEM, and the average of approximately 3.3 respondents per organization suggests potential intra-organizational clustering. Because the dataset did not include a reproducible organization-level identifier, cluster-robust standard errors and multilevel SEM could not be estimated. Future studies should collect sufficient organization-level identifiers and observations per organization to model nested data structures explicitly. Fourth, the data are drawn exclusively from Colombian organizations, limiting generalizability across other emerging economies. Fifth, the cross-sectional design precludes causal inference; throughout this manuscript, the term “predictor” refers to statistical association, not temporal or causal precedence.
5.4. Future Research Directions
Future research should address several methodological and theoretical extensions of the present study. First, longitudinal designs are needed to examine whether Human–AI Interaction precedes changes in Leadership Effectiveness and Organizational Sustainability over time. The cross-sectional design used in this study allows the estimation of statistical associations, but it does not establish temporal precedence or causal direction. Longitudinal studies would make it possible to assess whether improvements in AI governance, user experience, innovation, or productivity are followed by subsequent changes in leadership-related outcomes.
Second, future studies should use multi-source data to reduce the risk of common method variance. The present study relies on self-reported perceptions collected from the same respondents at a single point in time. Subsequent research could combine managerial surveys with employee evaluations, objective organizational indicators, AI system usage data, performance metrics, or external assessments of governance practices. This would help distinguish substantive associations from shared-method effects and would provide a more robust test of the relationship between Human–AI Interaction and leadership-related outcomes.
Third, multilevel research designs are recommended. Since respondents are nested within organizations, future studies should collect sufficient observations per organization to estimate multilevel SEM models. Such models would allow researchers to distinguish individual-level perceptions from organization-level AI capabilities, governance structures, and innovation climates. This distinction is particularly important in AI-intensive environments, where leadership and technology adoption may depend not only on individual perceptions but also on organizational routines, resources, and institutional conditions.
Fourth, the Leadership construct should be expanded and refined. Future versions of the instrument should include a broader set of leadership indicators beyond Leadership Effectiveness and Organizational Sustainability. Additional indicators could capture ethical leadership, adaptive leadership, digital leadership, strategic decision-making, change leadership, and human oversight of AI-supported decisions. A more extensive measurement structure would improve construct validity, increase model stability, and allow researchers to examine whether different forms of leadership relate differently to the dimensions of Human–AI Interaction.
Fifth, experimental or quasi-experimental studies would help evaluate the effects of specific AI-related interventions. For example, future research could examine whether AI governance training, bias-audit protocols, user-experience pilots, or AI literacy programs improve leadership-related outcomes. Such designs would provide stronger evidence about mechanisms and would complement the associative evidence provided by cross-sectional SEM.
Finally, international validation is necessary to assess the generalizability of the proposed model. Future studies should replicate the instrument and structural model in other emerging economies and, where possible, compare them with organizations in more digitally mature contexts. Cross-national validation would help determine whether the association between Human–AI Interaction and leadership is stable across institutional environments or whether it varies according to regulatory maturity, digital infrastructure, sectoral composition, and cultural expectations regarding technology and leadership.
6. Conclusions
This study empirically evaluated the relationship between Human–AI Interaction and leadership in Colombian organizations through a Structural Equation Modeling (SEM) approach. The results provide evidence of a strong statistical association between Human–AI Interaction and leadership, operationalized through Leadership Effectiveness and Organizational Sustainability. This association suggests that leadership-related perceptions and Human–AI Interaction dimensions are closely connected in Colombian organizations.
The study’s two hypotheses were supported. First, the measurement model confirmed that the eight dimensions measured by the instrument adequately represent the proposed latent constructs. Second, Human–AI Interaction exhibited a strong and statistically significant positive association with Leadership. The findings of this study confirm that Human–AI Interaction is a robust and statistically significant correlate of leadership in contemporary Colombian organizations. The structural model indicates a high degree of shared variance between Human–AI Interaction and Leadership under the specified model. This high degree of shared variance suggests that perceptions of leadership are closely intertwined with the socio-technical interplay between human actors and AI systems. However, this interpretation remains associative and should be validated through longitudinal, multi-source, and cross-national research designs.
Specifically, the results underscore that innovation-oriented interaction and ethical governance are the primary correlates of management effectiveness. These dimensions do not merely support leadership tasks but act as structural components that reconfigure organizational authority. Consequently, organizations must prioritize the development of ethical oversight mechanisms and technological literacy to ensure sustainable management outcomes.
Future research should address the following priorities: (1) longitudinal and experimental designs to establish temporal precedence and provide stronger evidence regarding causal mechanisms; (2) expanded measurement models for both Human–AI and Leadership constructs; (3) multi-source data to mitigate common method variance; (4) multilevel SEM to account for organizational clustering; (5) expanded structural models incorporating mediating and moderating mechanisms that may help clarify the association between Human–AI Interaction and Leadership; and (6) replication in other emerging economies to assess cross-national generalizability. Human–AI Interaction should be treated as a strategic component of leadership development programs operating in AI-intensive organizational environments.
Supplementary Materials
The following supporting information can be downloaded at https://github.com/rodzarate/IAM (accessed on 6 July 2026), Table S1: Convergent validity: Composite reliability (CR) and average variance extracted (AVE). Table S2: Discriminant validity—Fornell–Larcker criterion. Table S3: Discriminant validity—heterotrait–monotrait ratio (HTMT); and Table S4: Common-method-variance diagnostics.
Author Contributions
Conceptualization, R.A.Z.-T. and J.C.A.-P.; Methodology, R.A.Z.-T. and A.M.-N.; Software, R.A.Z.-T.; Validation, C.F.R.-S. and A.M.-N.; Formal analysis, R.A.Z.-T.; Investigation, R.A.Z.-T., C.F.R.-S., and J.C.A.-P.; Resources, C.F.R.-S.; Data curation, R.A.Z.-T.; Writing—original draft preparation, R.A.Z.-T.; Writing—review and editing, C.F.R.-S., J.C.A.-P. and A.M.-N.; Visualization, R.A.Z.-T.; Supervision, J.C.A.-P.; Project administration, C.F.R.-S.; Funding acquisition, R.A.Z.-T. All authors have read and agreed to the published version of the manuscript.
Funding
This research and the APC were funded by Fondo Nacional de Financiamiento para la Ciencia, Tecnología y la Innovación Francisco José de Caldas, grant number 0352-937-100909.
Institutional Review Board Statement
The study was conducted in accordance with the Declaration of Helsinki, and approved by the Ethics Committee of the Colegio de Estudios Superiores de Administración—CESA (protocol code No. 002 on 2020-01-09).
Informed Consent Statement
Informed consent was obtained from all subjects involved in the study.
Data Availability Statement
The databases used in this study are available at https://github.com/rodzarate/IAM (accessed on 1 June 2026).
Acknowledgments
The authors thank the Ministerio de Ciencia, Tecnología e Innovación de Colombia—Minciencias and the Colegio de Estudios Superiores de Administración—CESA.
Conflicts of Interest
The authors declare no conflicts of interest.
References
- Brynjolfsson, E.; McAfee, A.; Spence, M. Artificial intelligence and the modern productivity paradox: A clash of expectations and statistics. In The Economics of Artificial Intelligence; National Bureau of Economic Research: Cambridge, MA, USA, 2017. [Google Scholar] [CrossRef] [Scilit]
- Davenport, T.H. The AI Advantage: How to Put the Artificial Intelligence Revolution to Work; MIT Press: Cambridge, MA, USA, 2018. [Google Scholar]
- Dwivedi, Y.K.; Hughes, L.; Ismagilova, E.; Aarts, G.; Coombs, C.; Crick, T.; Duan, Y.; Dwivedi, R.; Edwards, J.; Eirug, A.; et al. Setting the future of digital and social media marketing research. Int. J. Inf. Manag. 2021, 59, 102168. [Google Scholar] [CrossRef] [Scilit]
- Awad, E.; Dsouza, S.; Kim, R.; Schulz, J.; Henrich, J.; Shariff, A.; Rahwan, I. The moral machine experiment. Nature 2018, 563, 59–64. [Google Scholar] [CrossRef] [Scilit] [PubMed]
- Gómez-Trujillo, A.M.; González-Pérez, M.A. Digital transformation as a strategy to reach sustainability. Smart Sustain. Built Environ. 2021, 11, 1137–1162. [Google Scholar] [CrossRef] [Scilit]
- Kane, G.C.; Palmer, D.; Phillips, A.N.; Kiron, D.; Buckley, N. Strategy, not technology, drives digital transformation. MIT Sloan Manag. Rev. 2015, 57, 1–25. [Google Scholar]
- Vial, G. Understanding digital transformation: A review and a research agenda. J. Strateg. Inf. Syst. 2019, 28, 118–144. [Google Scholar] [CrossRef] [Scilit]
- Yoo, Y.; Henfridsson, O.; Lyytinen, K. Research commentary—The new organizing logic of digital innovation: An agenda for information systems research. Inf. Syst. Res. 2010, 21, 724–735. [Google Scholar] [CrossRef] [Scilit]
- Gómez-Cruz, N.A.; Rodríguez Castro, D.Y.; Rey-Sarmiento, F.; Zarate-Torres, R.; Moncada Niño, A. Mapping Human–AI Relationships: Intellectual Structure and Conceptual Insights. Technologies 2026, 14, 83. [Google Scholar] [CrossRef] [Scilit]
- Zárate-Torres, R.; Rey-Sarmiento, C.F.; Acosta-Prado, J.C.; Gómez-Cruz, N.A.; Rodríguez Castro, D.Y.; Camargo, J. Influence of leadership on human–artificial intelligence collaboration. Behav. Sci. 2025, 15, 873. [Google Scholar] [CrossRef] [Scilit] [PubMed]
- Ilcic, A.; Fuentes, M.; Lawler, D. Artificial Intelligence, Complexity, and Systemic Resilience in Global Governance. Front. Artif. Intell. 2025, 8, 1562095. [Google Scholar] [CrossRef] [Scilit] [PubMed]
- Trist, E.L. The evolution of socio-technical systems as a conceptual framework and as an action research program. In Perspectives on Organization Design and Behavior; Van de Ven, A.H., Joyce, W.F., Eds.; Wiley: New York, NY, USA, 1981; pp. 19–75. [Google Scholar]
- Bollen, K.A. Structural Equations with Latent Variables; John Wiley & Sons: New York, NY, USA, 1989. [Google Scholar]
- Anderson, J.C.; Gerbing, D.W. Structural equation modeling in practice: A review and recommended two-step approach. Psychol. Bull. 1988, 103, 411–423. [Google Scholar] [CrossRef]
- Avolio, B.J.; Sosik, J.J.; Kahai, S.S.; Baker, B. E-leadership: Re-examining transformations in leadership source and transmission. Leadersh. Q. 2014, 25, 105–131. [Google Scholar] [CrossRef] [Scilit]
- Sætra, H.S. AI for the Sustainable Development Goals; CRC Press: Boca Raton, FL, USA, 2022. [Google Scholar]
- Baxter, G.; Sommerville, I. Socio-technical systems: From design methods to systems engineering. Interact. Comput. 2011, 23, 4–17. [Google Scholar] [CrossRef] [Scilit]
- Eason, K. Information Technology and Organizational Change; Taylor & Francis: London, UK, 2014. [Google Scholar] [CrossRef] [Scilit]
- Batool, A.; Zowghi, D.; Bano, M. AI Governance: A Systematic Literature Review. AI Ethics 2025, 5, 3265–3279. [Google Scholar] [CrossRef] [Scilit]
- Raisch, S.; Krakowski, S. Artificial intelligence and management: The automation–augmentation paradox. Acad. Manag. Rev. 2021, 46, 192–210. [Google Scholar] [CrossRef] [Scilit]
- Grudin, J. From Tool to Partner: The Evolution of Human-Computer Interaction; Morgan & Claypool: San Rafael, CA, USA, 2017. [Google Scholar]
- Hancock, P.A.; Nourbakhsh, I.; Stewart, J. On the future of transportation in an era of automated and autonomous vehicles. Proc. Natl. Acad. Sci. USA 2019, 116, 7684–7691. [Google Scholar] [CrossRef] [Scilit] [PubMed]
- Shrestha, Y.R.; Ben-Menahem, S.M.; Von Krogh, G. Organizational decision-making structures in the age of artificial intelligence. Calif. Manag. Rev. 2021, 63, 66–83. [Google Scholar] [CrossRef] [Scilit]
- Kolbjørnsrud, V.; Amico, R.; Thomas, R.J. How artificial intelligence will redefine management. Harv. Bus. Rev. 2016, 2, 1–6. [Google Scholar]
- Pasquale, F. The Black Box Society: The Secret Algorithms That Control Money and Information; Harvard University Press: Cambridge, MA, USA, 2015. [Google Scholar]
- Agrawal, A.; Gans, J.; Goldfarb, A. Prediction Machines: The Simple Economics of Artificial Intelligence; Harvard Business Press: Boston, MA, USA, 2018. [Google Scholar]
- Pan, Y.; Froese, F.; Liu, N.; Hu, Y.; Ye, M. The adoption of artificial intelligence in employee recruitment: The influence of contextual factors. Int. J. Hum. Resour. Manag. 2022, 33, 1125–1147. [Google Scholar] [CrossRef] [Scilit]
- Westerman, G.; Bonnet, D.; McAfee, A. Leading Digital: Turning Technology into Business Transformation; Harvard Business Press: Boston, MA, USA, 2014. [Google Scholar]
- Davis, F.D. Perceived usefulness, perceived ease of use, and user acceptance of information technology. MIS Q. 1989, 13, 319–340. [Google Scholar] [CrossRef] [Scilit] [PubMed]
- Norman, D.A. The Design of Everyday Things: Revised and Expanded Edition; Basic Books: New York, NY, USA, 2013. [Google Scholar]
- Venkatesh, V.; Morris, M.G.; Davis, G.B.; Davis, F.D. User acceptance of information technology: Toward a unified view. MIS Q. 2003, 27, 425–478. [Google Scholar] [CrossRef] [Scilit]
- Bharadwaj, A.; El Sawy, O.A.; Pavlou, P.A.; Venkatraman, N. Digital business strategy: Toward a next generation of insights. MIS Q. 2013, 37, 471–482. [Google Scholar] [CrossRef] [Scilit]
- Zuboff, S. The Age of Surveillance Capitalism: The Fight for a Human Future at the New Frontier of Power; PublicAffairs: New York, NY, USA, 2019. [Google Scholar]
- Zammuto, R.F.; Griffith, T.L.; Majchrzak, A.; Dougherty, D.J.; Faraj, S. Information technology and the changing fabric of organization. Organ. Sci. 2007, 18, 749–762. [Google Scholar] [CrossRef] [Scilit]
- UNCTAD. Technology and Innovation Report 2021: Catching Technological Waves—Innovation with Equity; Technical Report; United Nations: Geneva, Switzerland, 2021. [Google Scholar]
- Floridi, L.; Cowls, J.; Beltrametti, M.; Chatila, R.; Chazerand, P.; Dignum, V.; Luetge, C.; Madelin, R.; Pagallo, U.; Rossi, F.; et al. AI4People—An ethical framework for a good AI society. Minds Mach. 2018, 28, 689–707. [Google Scholar] [CrossRef] [Scilit] [PubMed]
- Jobin, A.; Ienca, M.; Vayena, E. The global landscape of AI ethics guidelines. Nat. Mach. Intell. 2019, 1, 389–399. [Google Scholar] [CrossRef] [Scilit]
- McKnight, D.H.; Carter, M.; Thatcher, J.B.; Clay, P.F. Trust in a specific technology: An investigation of its components and measures. ACM Trans. Manag. Inf. Syst. (TMIS) 2011, 2, 12. [Google Scholar] [CrossRef] [Scilit]
- Amabile, T.M. Creativity in Context; Routledge: New York, NY, USA, 2016. [Google Scholar]
- Davenport, T.H.; Guha, A.; Grewal, D.; Bressgott, T. How artificial intelligence will change the future of marketing. J. Acad. Mark. Sci. 2020, 48, 24–42. [Google Scholar] [CrossRef] [Scilit]
- Nonaka, I.; Takeuchi, H. The Knowledge-Creating Company; Oxford University Press: New York, NY, USA, 1995. [Google Scholar]
- Verhoef, P.C.; Broekhuizen, T.; Bart, Y.; Bhattacharya, A.; Qi Dong, J.; Fabian, N.; Haenlein, M. Digital transformation: A multidisciplinary reflection and research agenda. J. Bus. Res. 2021, 122, 889–901. [Google Scholar] [CrossRef] [Scilit]
- Porter, M.E.; Heppelmann, J.E. How smart, connected products are transforming competition. Harv. Bus. Rev. 2014, 92, 64–88. [Google Scholar]
- Hair, J.F.; Black, W.C.; Babin, B.J.; Anderson, R.E. Multivariate Data Analysis, 8th ed.; Cengage Learning: Andover, UK, 2019. [Google Scholar]
- Kline, R.B. Principles and Practice of Structural Equation Modeling, 4th ed.; Guilford Press: New York, NY, USA, 2015. [Google Scholar]
- Podsakoff, P.M.; MacKenzie, S.B.; Lee, J.Y.; Podsakoff, N.P. Common method biases in behavioral research: A critical review of the literature and recommended remedies. J. Appl. Psychol. 2003, 88, 879–903. [Google Scholar] [CrossRef] [Scilit] [PubMed]
- Revelle, W. psych: Procedures for Psychological, Psychometric, and Personality Research, R Package Version 2.2.9; Northwestern University: Evanston, IL, USA, 2022.
- Rosseel, Y. lavaan: An R package for structural equation modeling. J. Stat. Softw. 2012, 48, 1–36. [Google Scholar] [CrossRef] [Scilit]
- von Oertzen, T.; Brandmaier, A.M.; Tsang, S. Structural equation modeling with Ωnyx. Struct. Equ. Model. Multidiscip. J. 2015, 22, 148–161. [Google Scholar] [CrossRef] [Scilit]
- Johnson, P.E.; Kite, B.A. semTable: Model Summary Tables for Structural Equation Models, R Package Version 1.8; University of Kansas: Lawrence, KS, USA, 2020. [Google Scholar]
- Hu, L.; Bentler, P.M. Cutoff criteria for fit indexes in covariance structure analysis: Conventional criteria versus new alternatives. Struct. Equ. Model. Multidiscip. J. 1999, 6, 1–55. [Google Scholar] [CrossRef] [Scilit]
- Browne, M.W.; Cudeck, R. Alternative ways of assessing model fit. In Testing Structural Equation Models; Bollen, K.A., Long, J.S., Eds.; Sage: Newbury Park, CA, USA, 1993; pp. 136–162. [Google Scholar]
- Steiger, J.H.; Lind, J.C. Statistically based tests for the number of common factors. In Proceedings of the Annual Meeting of the Psychometric Society, Iowa City, IA, USA, 8–10 May 1980. [Google Scholar]
- R Core Team. R: A Language and Environment for Statistical Computing; R Foundation for Statistical Computing: Vienna, Austria, 2025. [Google Scholar]
- Gandrud, C. Reproducible Research with R and RStudio, 2nd ed.; Chapman and Hall/CRC: Boca Raton, FL, USA, 2018. [Google Scholar]
- Li, C.H. The performance of ML, DWLS, and ULS estimation with robust corrections in structural equation models with ordinal variables. Psychol. Methods 2016, 21, 369. [Google Scholar] [CrossRef] [Scilit] [PubMed]
- Henseler, J.; Ringle, C.M.; Sarstedt, M. A new criterion for assessing discriminant validity in variance-based structural equation modeling. J. Acad. Mark. Sci. 2015, 43, 115–135. [Google Scholar] [CrossRef] [Scilit]
- Fornell, C.; Larcker, D.F. Evaluating structural equation models with unobservable variables and measurement error. J. Mark. Res. 1981, 18, 39–50. [Google Scholar] [CrossRef] [Scilit]
- Kenny, D.A.; Kaniskan, B.; McCoach, D.B. The Performance of RMSEA in Models with Small Degrees of Freedom. Sociol. Methods Res. 2015, 44, 486–507. [Google Scholar] [CrossRef] [Scilit]
- Raji, I.D.; Smart, A.; White, R.N.; Mitchell, M.; Gebru, T.; Hutchinson, B.; Smith-Loud, J.; Theron, D.; Barnes, P. Closing the AI accountability gap: Defining an end-to-end framework for internal algorithmic auditing. In Proceedings of the 2020 Conference on Fairness, Accountability, and Transparency, Barcelona, Spain, 27–30 January 2020; pp. 33–44. [Google Scholar] [CrossRef] [Scilit]
- Uhl-Bien, M.; Arena, M. Complexity leadership theory: Shifting from human capital to social capital. People Strategy 2018, 40, 22–27. [Google Scholar]

Disclaimer/Publisher’s Note: The statements, opinions and data contained in all publications are solely those of the individual author(s) and contributor(s) and not of MDPI and/or the editor(s). MDPI and/or the editor(s) disclaim responsibility for any injury to people or property resulting from any ideas, methods, instructions or products referred to in the content. |
© 2026 by the authors. Licensee MDPI, Basel, Switzerland. This article is an open access article distributed under the terms and conditions of the Creative Commons Attribution (CC BY) license.