


Abstract
The perforated backup plate of KARL KROYER MP 2C120 diaphragm pumps, used in the starch processing food industry, exhibits recurrent in-service fractures whose quantitative explanation and redesign solution have not been previously addressed in the literature. To solve this problem, an integrated analytical model is developed that combines, in a calibrable expression, small-magnitude spherical curvature, regular square-pattern perforation, and stepped peripheral clamping, calibrated against finite element numerical simulation and applied to the screening of eighteen geometrically feasible configurations. The chemical composition of the installed material was verified by portable optical emission spectrometry (PMI), identifying it as austenitic stainless steel AISI 301/1.4310 X10CrNi18-8, with nominal annealed yield strength MPa according to EN 10088-2. The calibration quantifies an overestimation of for the simply supported edge model and an underestimation of for the clamped edge model; the dimensionless parameter describes the effective degradation of clamping due to the reduced stiffness of the perforated belt adjacent to the edge and supports the use of the simply supported model as a conservative screening bound. The currently installed configuration operates with a safety factor with respect to yield strength, quantitatively explaining the observed fractures. Within the standard manufacturable space, the configuration mm, mm () minimizes the maximum equivalent stress predicted by the conservative screening model; this selection corresponds to the configuration with the maximal ligament efficiency and is preserved under the single-point calibration, which acts as a single global positive scale factor. The screening is verified by a direct finite element campaign performed on the complete mm family (configurations 1, 2 and 3) with the experimentally verified material properties. The verification confirms the predicted ranking and the peripheral location of the critical region, but shows that the smooth cross-center field is essentially invariant across configurations (, and MPa), so the linear-scaling estimate previously used to anchor absolute margins is not supported; the benefit of the redesign accrues at the governing hole-edge concentration, which decreases from to MPa ( reduction) yet remains above the yield strength of the annealed material. Geometric modification alone is therefore insufficient, and industrial adoption requires combining configuration 3 with material substitution to a cold-worked hardened state (C700: on the governing peak) or a duplex alloy (), together with periodic non-destructive inspection. The central contribution of this work is the parameter as a quantitative descriptor of effective clamping degradation and the proposal of an industrially feasible redesign, integrated with complementary mitigation strategies, for KARL KROYER MP 2C120 pumps and geometrically equivalent equipment.
1. Introduction
The analysis of the stress state in perforated plates constitutes a classical problem in solid mechanics, with widespread applications in the design of tube sheets in heat exchangers and steam generators, filter plates in chemical reactors, structural panels in aerospace applications, and backup plates in industrial diaphragm pumps and compressors [1,2]. The presence of holes introduces geometric discontinuities that disturb the stress field, generate local stress concentrations in the ligaments between perforations, and reduce the effective stiffness in bending and in-plane behavior [3,4]. When the holes are arranged in regular patterns, local effects interact with each other, leading to structural responses that generally do not admit direct analytical solutions and require combinations of homogenization, numerical modeling, or experimental treatment [5,6].
The reference methodological framework for the structural analysis of perforated plates was established by O’Donnell and Langer [7], who introduced the concept of anisotropic effective elastic constants dependent on ligament efficiency. This formulation allows the perforated plate to be replaced by an equivalent solid plate for calculation purposes and was extended by Slot and O’Donnell [8] to the case of thick plates with square and triangular patterns, and by O’Donnell [9] to the bending of thin plates. This body of work was incorporated into the ASME Boiler and Pressure Vessel Code, Section III, Appendix A-8000 [10], and currently constitutes the international standard for the design of tube sheets in power and process applications [11,12]. However, the methodology was mainly developed for flat plates, and its extension to curved geometries and bending-dominated regimes requires additional assumptions or specific numerical complements.
For the case of flat circular perforated plates subjected to bending, recent literature provides a relatively complete characterization. Saraçoğlu et al. [13] analyzed, through finite element methods, various perforation configurations with different thickness-to-diameter ratios, systematically comparing clamped and simply supported boundary conditions under self-weight and uniformly distributed loads; their results show that the quantitative distinction between both boundary conditions remains regardless of the perforation degree, with a stable factor between the corresponding central deflections. Previous works by the same group [14], together with those of Atanasiu and Sorohan [15], Konieczny et al. [16], and Wu et al. [17], have characterized the stress behavior and elastoplastic response of flat circular perforated plates under various combinations of loading, constraints, and perforation patterns, confirming the applicability of the classical ligament efficiency analytical framework in flat geometries.
The extension of the analysis to geometries with curvature, however, has received substantially less systematic treatment. Reissner [18] developed asymptotic analytical solutions for shallow spherical shells with a single hole or rigid insert, identifying regions of coexistence between membrane and inextensional bending responses in the vicinity of the perforation. Syas’kii et al. [19] solved the case of two neighboring holes in a spherical shell under internal pressure, showing amplified stress concentrations in the intermediate ligament. More recently, the modeling of spherical plates and cylindrical shells with regular perforation through the combination of effective elastic constants and finite element simulation has been explored for specific applications [20]; however, these works do not provide closed-form analytical formulations and remain dependent on simulation campaigns tailored to each candidate geometry.
From this overview, three specific gaps in the open literature emerge that motivate the present work. First, no closed-form analytical model is identified for the stress state of circular plates with small curvature and regular vertical square-pattern perforation under uniform normal pressure and peripheral clamping by an annular step adjacent to the perforated region. Available solutions cover the flat case [7,8,9,11,12,13,15,16,17], the curved case with a single hole [18], or the curved case with effective properties combined with numerical simulation [20], but not the geometric combination characteristic of a specific industrial regime: small curvature, thin ligaments, dense square pattern, and stepped clamping. Second, the absence of a closed-form model forces reliance on finite element simulation for each candidate configuration, discouraging systematic parametric exploration required by the design problem and limiting the transfer of results to industrial contexts with restricted computational resources. Third, the available literature is insufficient to support quantitative preliminary redesign criteria in this regime; in particular, the selection of an appropriate reference analytical model in the presence of perforation near the boundary has not been systematically characterized.
These gaps are not merely academic. A representative case is provided by the high-pressure diaphragm pump KARL KROYER MP 2C120 used in the food industry for pumping acidified starch milk in corn glucose production processes. Its backup plate, manufactured from austenitic stainless steel with regular vertical square-pattern perforation, exhibits recurrent fractures that cause costly production shutdowns, long replacement times, and cross-contamination between the process fluid and the hydraulic driving fluid. Noa-Aguila et al. [21] characterized the stress state of this plate using finite element simulation, reporting maximum equivalent stresses close to the nominal yield strength of the material, consistent with the failure mode observed in operation. However, that work does not address the three gaps identified above: it does not provide a closed-form analytical model to explore alternative configurations, does not perform a parametric sweep over the design space, and does not establish a quantitative redesign criterion based on an analytical reference model. Consequently, current industrial practice replaces the failed plate with copies of the original design, perpetuating operation near the yield limit and, therefore, the recurrence of failure.
The present work addresses these three gaps through the following contributions. First, a closed-form analytical model is formulated for the stress state of thin curved circular plates with regular vertical square-pattern perforation under uniform normal pressure, based on the small-curvature plate bending theory of Feodosiev [22], with modification of the moment of inertia per unit length to incorporate the effect of perforations. Second, the model is evaluated over a parametric sweep representative of the feasible configuration space under two idealized boundary conditions. Third, analytical predictions are compared with the available reference finite element simulation for the original configuration. Fourth, the chemical composition of the installed material is experimentally verified using portable optical emission spectrometry (PMI), identifying it as AISI 301/1.4310 steel and consequently updating the adopted nominal mechanical properties. Fifth, a redesign configuration is proposed that minimizes the maximum equivalent stress within the standard manufacturable space, with explicit quantification of its safety margin and the complementary strategies required to meet the standard admissibility criterion. Sixth, the implications of the observed structural behavior for the design practice of backup plates in diaphragm pumps and compressors are discussed. Seventh, a direct finite element verification campaign is performed on the complete mm family of the sweep (installed configuration, intermediate configuration, and redesign candidate) with the experimentally verified material properties, testing both the predicted ranking and the linear-scaling calibration hypothesis. Additionally, the comparison between the two idealized analytical solutions and the reference numerical simulation motivates a discussion on the selection of the appropriate analytical model for configuration screening.
The objective of this work is to develop and calibrate a closed-form analytical screening model for the stress state of thin curved circular plates with regular square-pattern perforation and stepped peripheral clamping, and to rank, within the standard manufacturable space, the geometrically feasible configurations by their predicted maximum equivalent stress under a conservative reference model. The significance is twofold. Methodologically, the work introduces the dimensionless parameter as a quantitative descriptor of the effective clamping degradation produced by the perforated belt adjacent to the edge, and establishes a calibrated screening criterion that decouples the relative ordering of configurations—governed solely by the ligament efficiency—from the absolute stress magnitude, which is anchored by finite element calibration. Industrially, it provides a transferable, low-computational-cost preliminary redesign criterion for KARL KROYER MP 2C120 pumps and geometrically equivalent perforated components, reducing the dependence on configuration-by-configuration finite element campaigns. The present study combines the screening stage with a first design-verification stage: the analytical model identifies and ranks the redesign candidate, and a direct finite element campaign on the mm family verifies the ranking, quantifies the actual margins of the candidate, and tests the calibration hypothesis on which the absolute screening estimates relied.
The remainder of the manuscript is structured as follows. Section 1 introduces the problem, reviews the state of the art, identifies the research gaps, and states the main contributions of the work. Section 2 describes the component, presents the experimental verification of the material composition by PMI, formulates the analytical model, and defines the evaluated configurations. Section 3 reports the model predictions, their comparison with the reference numerical simulation, the screening of configurations under the proposed safety criterion, and the recommended redesign configuration. Section 4 discusses the observed structural behavior, its physical interpretation, the implications of the actual in-service failure mode, and the combined strategies required for its mitigation. Section 5 summarizes the conclusions and outlines immediate future research directions.
2. Materials and Methods
2.1. Component Description
The analyzed backup plate corresponds to the high-pressure diaphragm pump (KARL KROYER, model MP 2C120; Karl Kroyer A/S, Copenhagen, Denmark) used in the food industry for pumping acidified starch milk in corn glucose production processes. The pump operates at a nominal pressure MPa and an average volumetric flow rate of m3/h. The plate, located between the flexible diaphragm and the hydraulic oil chamber, has a shallow spherical cap geometry, with active radius mm, thickness mm, and cap radius of curvature mm. The peripheral edge is supported on an annular step machined into the pump body, defining a physical boundary condition of stepped clamping on the plate section adjacent to the perforated belt.
The central region of the plate exhibits regular vertical perforation with a square pattern, with constant hole diameter d and pitch p. The original configuration installed by the manufacturer corresponds to mm and mm, with ligament thickness mm. This configuration has shown recurrent fractures during operation, documented both in the previously published finite element simulation study [21] and in the visual inspection of the plate removed from service. The load applied to the plate during the pressurization phase of the pumping cycle is modeled as a uniformly distributed normal pressure MPa acting on the concave face, transmitted by the flexible diaphragm under full-contact conditions. Loads associated with the suction phase, fluid inertia, and diaphragm viscoelastic effects are considered negligible compared to the nominal operating pressure, maintaining the equivalent static loading assumption consistent with design practice for positive displacement pumps [1,23]; the implications of this approximation under the actual cyclic operating regime are discussed in Section 4.6. This equivalent-static assumption is adopted as a conservative envelope of the elastic stress field for the sole purpose of configuration screening, and is not intended to represent the cyclic fatigue behavior of the component: a fatigue assessment would require the cycle frequency, the pressure-amplitude spectrum, and an S–N characterization of the material in its real metallurgical state, none of which is undertaken here. The reported safety factors must therefore be read as margins on nominal stress levels under the equivalent-static idealization, not as margins against fatigue failure.
The geometry, the adopted cylindrical coordinate system , and the loading and boundary conditions are schematically illustrated in Figure 1.
Figure 1.
Geometry, coordinate system, and boundary conditions of the perforated backup plate of the KARL KROYER MP 2C120 pump. The pressure MPa is applied to the concave (inner) face, transmitted by the flexible diaphragm; the peripheral edge is clamped on the annular step machined in the pump body.
2.2. Experimental Material Characterization by Optical Emission Spectrometry
The chemical composition of the installed plate material was experimentally verified using portable optical emission spectrometry (Positive Material Identification, PMI) with an Oxford Instruments PMI-MASTER PRO optical emission spectrometer (Oxford Instruments Analytical Ltd., High Wycombe, Buckinghamshire, UK; S/N 13P0189) available at the “Carlos Manuel de Céspedes” Thermoelectric Power Plant in Cienfuegos. This verification goes beyond the assumption of standard properties used in the previously published study [21] and constitutes the experimental basis for the nominal mechanical properties adopted in the remainder of the analysis.
2.2.1. Experimental Procedure
The measurement surface was prepared by mechanical abrasion using an abrasive stone and degreasing with ethanol to remove surface oxides, corrosion products, and organic contaminants that could interfere with spectroscopic analysis. Two measurement campaigns were performed on the same specimen: one without inert atmosphere (standard probe) and another with argon flow as arc shielding gas. In each campaign, five measurements were carried out, discarding the first as equipment calibration according to the manufacturer’s protocol, resulting in four valid measurements per campaign. The campaign without argon does not allow quantification of light elements (C, P, S, N), whose spectral lines in the near ultraviolet are absorbed by atmospheric oxygen and nitrogen during the electric arc; therefore, the argon-assisted campaign constitutes the metrologically valid measurement for unequivocal alloy grade identification, while the non-argon campaign is retained only as qualitative verification. Consistently with this limitation, the grade-matching algorithm of the instrument, operating on the non-argon campaign without carbon information, returned the generic austenitic designation 1.4301 as a preliminary match; this preliminary match is superseded by the argon-shielded campaign, whose complete elemental suite—including carbon—was matched by the instrument to grade 1.4310 X10CrNi18-8. The photographic record of the measurement campaign (probe on the component with the argon-shielded arc, analysis screen with burns and grade verdict, grade-matching dialog, and overall measurement scene) is provided in Section S5 of the Supplementary Material.
2.2.2. PMI Verification Results
The instrument automatically identified the material as austenitic stainless steel AISI 301 (European designation 1.4310 X10CrNi18-8 according to EN 10088-2 [24]). The average elemental composition obtained in the argon-assisted campaign is presented in Table 1, compared with the standard ranges for the two candidate designations: 1.4301 (AISI 304, originally assumed in the previous study) and 1.4310 (AISI 301, instrument identification).
Table 1.
Average chemical composition obtained by PMI with argon (four valid measurements) on the backup plate removed from service, compared with the ranges of EN 10088-2 [24] for the two candidate designations. The discriminating element is carbon. Values are the mean of the four argon-shielded measurements; for the grade-discriminating elements, the standard deviation of the four measurements is indicated.
The measured carbon content (, mean ± standard deviation of four measurements) exceeds by the maximum value allowed by EN 10088-2 for designation 1.4301 (≤0.07%); the excess () amounts to approximately four times the observed measurement repeatability, which excludes this designation within the precision of the technique. At the same time, all quantified elements fall within the standard ranges for 1.4310, confirming the automatic identification by the instrument. The identification of the material as 1.4310 is decisive for the nominal mechanical properties adopted in the remainder of the analysis and modifies the values used in the previously published study [21], where the material had not been experimentally verified.
2.2.3. Adopted Nominal Mechanical Properties
The nominal elastic and mechanical properties adopted in the present analysis, corresponding to the annealed condition at room temperature of steel 1.4310 according to EN 10088-2 [24], are: Young’s modulus GPa, Poisson’s ratio , conventional yield strength MPa (minimum specified by the standard for the annealed condition), ultimate tensile strength –750 MPa, and density kg/m3. The material selection by the manufacturer is justified by its resistance to the pumped acidic medium, its capacity for strain hardening (a distinctive feature of 1.4310 as a metastable austenitic steel compared to the stable austenitic 1.4301), its commercial availability, and its weldability [25].
It is explicitly acknowledged as a limitation of the present analysis that the actual mechanical properties of the installed material (yield strength measured by tensile testing, hardness, actual metallurgical state—annealed versus residual cold-worked condition) have not been experimentally verified. The adopted nominal values correspond to the minimum standard values for the annealed condition; in a cold-worked condition, 1.4310 may exhibit between 350 and 700 MPa depending on the degree of hardening, which constitutes a significant variable discussed in Section 4.6. Furthermore, the measured carbon content () exceeds the susceptibility threshold for sensitization by chromium carbide precipitation at grain boundaries if the material is exposed to temperatures between 450 and 850 °C, which is relevant in the heat-affected zones of the weld repairs visible in Figure 2; this aspect is addressed in Section 4.3.
Figure 2.
Backup plate removed from service after recurrent failure. Fractures traverse multiple ligaments of the perforated peripheral belt, with evidence of prior weld repairs (visible silver beads in the upper sector). The peripheral location of the failure is consistent with the FEM predictions of Noa-Aguila et al. [21] and with the physical interpretation of the perforated belt as a region of effective clamping degradation developed in Section 4.1.
2.3. Analytical Model Formulation
2.3.1. Model Assumptions
The analytical model is constructed based on the following assumptions:
- H1.
- The plate is idealized as a shallow spherical cap with ratio , satisfying the applicability criterion of classical thin plate theory [6] ().
- H2.
- The material is homogeneous, isotropic, and linearly elastic within the considered regime, which is verified a posteriori by checking that the predicted maximum stresses remain below the conventional yield strength.
- H3.
- The load is static and uniformly distributed over the entire concave surface. The implications of this approximation under the actual cyclic regime are discussed in Section 4.6.
- H4.
- The physical stepped clamping boundary condition is modeled through two idealized comparison cases: simply supported edge and clamped edge.
- H5.
- Local stress concentrations at the edges of individual holes are considered beyond the scope of the first-order analytical model and are attributed to numerical simulation for detailed characterization.
2.3.2. Governing Equation and Constitutive Relations
Under assumptions H1–H3, the transverse displacement of the axisymmetric circular plate satisfies the Lagrange–Sophie Germain governing equation [6], expressed as Equation (1):
where D = flexural rigidity of the solid plate [N·m], = transverse displacement, r = radial coordinate [m], and = distributed load per unit area [Pa].
The flexural rigidity of the solid plate is given by Equation (3):
where E = Young’s modulus [Pa], h = plate thickness [m], and = Poisson’s ratio [–].
The bending moments per unit length are obtained from the displacement field through Equations (4) and (5):
where = radial bending moment per unit length and = circumferential bending moment per unit length.
The normal stresses at the extreme fiber are related to the bending moments by Equation (6):
where = radial normal stress [Pa] and = circumferential normal stress [Pa].
2.3.3. Solutions for Flat Plate Under Uniform Pressure
For uniform load , the general solution of Equations (1) and (2) regular at is given by Equation (7):
where P = uniform pressure [Pa], and are integration constants.
These constants are determined from boundary conditions at . For the two idealized cases in assumption H4:
Case A: Simply Supported Edge
Conditions and yield maximum moment at the plate center. The maximum radial stress is Equation (8) [6]:
By symmetry, .
Case B: Clamped Edge
Conditions and yield maximum stress at the edge:
The stress state at the clamped edge is biaxial and unbalanced, with proportional to through Poisson’s ratio.
2.3.4. Extension to Shallow Curvature Plate
For a plate with small curvature, the structural response under normal pressure incorporates a membrane contribution coupled with bending, according to the formulation developed by Feodosiev [22]. In the regime with maximum deflection on the order of the thickness, the resulting maximum stress can be expressed as:
where is the dimensionless curvature correction factor and is the radius of curvature of the spherical cap. For the considered parametric ranges, is evaluated numerically following the tables and charts provided by Feodosiev [22] for thin spherical caps, and is applied as a correction to the maximum stresses obtained under the flat plate idealization. It is observed that takes different values for simply supported and clamped boundary conditions, reflecting the specific interaction between curvature and rotational restraint in each case.
2.3.5. Incorporation of Regular Perforation Effect
To account for the effect of regular vertical square-pattern perforation on bending stiffness, a reduction of the moment of inertia per unit length proportional to the geometric ligament efficiency is adopted [22,26,27]. The ligament efficiency is defined as:
where is the geometric ligament efficiency, p is the pitch, d is the hole diameter, and is the ligament thickness between adjacent holes. The effective moment of inertia and effective flexural rigidity are defined as:
By substituting into Equation (1), the maximum stresses of the perforated plate are obtained by replacing with in the denominator of Equations (8)–(10).
It is explicitly noted that the linear reduction is adopted as a first-order screening idealization. The rigorous equivalent bending stiffness of perforated plates is a non-linear, pattern-dependent function of ligament efficiency, of the diameter-to-pitch and thickness-to-diameter ratios, and of Poisson’s ratio [7,8,9]. To leading order, with all macroscopic factors common to every configuration, the modeled stress decreases with ligament efficiency approximately as : the screening stress is governed primarily by , with a secondary monotonic dependence on the absolute ligament width that a refined effective-elastic-constants treatment would resolve. Consequently, the relative ordering of configurations produced by the model is robust to the specific stiffness-reduction law, and the single-point finite element calibration (Equation (27)), entering as a single global positive scale factor, anchors the absolute magnitudes without altering this ordering. Such a refinement would adjust the absolute values without changing the screening ranking, and lies beyond the scope of the present preliminary study.
2.3.6. Modeled Maximum Stresses
Case A (Simply Supported Edge), Plate Center
Case B (Clamped Edge), Plate Edge
2.3.7. Equivalent Stress Criterion
The evaluation of the biaxial stress state is performed using the Von Mises criterion [28,29], which for plane stress is expressed as:
Applied to the critical points [16,29]:
Case A (Center, Equal Biaxial)
Case B (Edge, Unbalanced Biaxial with )
2.4. Definition of the Parametric Sweep
The configuration space is constructed from the feasible manufacturing range. The hole diameter varies between mm and mm in increments of 1 mm. For each d, three pitch values p are selected that satisfy:
The combined application yields the eighteen configurations listed in Table 2. Configuration 1 corresponds to the original installed design [21].
Table 2.
Geometric configurations evaluated in the parametric sweep, including derived parameters and . Configuration 1 corresponds to the original design installed by the manufacturer.
2.5. Reference Numerical Simulation
The partial validation of the analytical model is carried out by comparison with the finite element simulation reported by Noa-Aguila et al. [21] for configuration 1 ( mm, mm). That study, a direct precedent of the present work, models the full plate as a three-dimensional solid in ANSYS R18.1 [30], meshed with tetrahedral elements with curvature-based sizing and locally refined in the perforated region through mesh controls at the strong geometric transitions to resolve the stress concentrations at the edge of each hole [21]. The clamped boundary condition is imposed on the annular support step (fixed support), and the uniform normal pressure MPa is applied to the concave face. The authors report maximum Von Mises equivalent stresses of MPa on the concave face and MPa on the convex face, with the critical region located in the peripheral belt adjacent to the support step. These values correspond, in the terminology of the reference, to the maximum in the measurement series at the “cross-center” formed by four adjacent holes; the complementary series at the “hole edge” shows higher local peaks at the ends of the radial profile, associated with individual geometric stress concentrators not captured by the first-order analytical model (assumption H5).
Two complementary numerical anchors are used in the present work. First, the published simulation of the installed configuration [21] provides the historical reference: the comparison is anchored on the full radial Von Mises profiles of the concave and convex faces (43 measurement points per face; Figure S1 of the Supplementary Material), the cross-center maximum of which ( MPa) is used as the absolute calibration point of the analytical model. Because this calibration enters as a single global positive scale factor applied identically to every configuration, the resulting ranking of configurations is preserved independently of its value. Second, a direct finite element verification campaign, described in Section 2.6, is performed on the complete mm family with the experimentally verified material properties, in order to test the predicted ranking, the location of the critical region, and the linear-scaling hypothesis of Equation (27). Model predictions for the remaining fifteen configurations are presented under assumptions H1–H5 defined in Section 2.3.1.
2.6. Direct Finite Element Verification Campaign
A direct finite element verification campaign was performed on the complete mm family of the parametric sweep: configuration 1 (installed, mm), configuration 2 ( mm), and configuration 3 (redesign candidate, mm). The three models were solved in ANSYS Mechanical 2025 R2 [31] under conditions identical to the reference simulation [21]: three-dimensional solid geometry imported from parametric CAD, fixed support imposed on the annular step surfaces, and uniform normal pressure MPa applied to the concave face. Tetrahedral meshes with program-controlled adaptive sizing and one adaptive refinement loop yielded , and nodes (, and elements) for configurations 1, 2 and 3, respectively. The verified nominal elastic properties of Section 2.2.3 were assigned ( GPa, , kg/m3). It is noted that, in the linear-elastic regime with imposed pressure loading, the computed stress field is independent of the Young’s modulus and of the assigned strength properties, and depends on the elastic constants only through the Poisson’s ratio, which is common to the two candidate grades 1.4301 and 1.4310; the experimental identification of the installed grade (Section 2.2.2) therefore updates the admissibility threshold against which the computed stresses are judged, not the stress field itself.
For each solved configuration, the complete nodal fields of the concave and convex faces were exported (– nodes per face; raw data provided as Dataset S1) and post-processed to reproduce numerically the two measurement series of the reference study [21]. The perforation lattice was reconstructed from the nodal coordinates (square grid of pitch p aligned with the plate axes, with one hole centered at the origin), and each surface node was classified by its in-plane distance to the nearest hole axis: nodes with constitute the hole-edge series (local concentration at the perforation walls), whereas nodes with constitute the cross-center series (smooth field at the centers of the four-hole cells, located at ). Radial envelope profiles were then constructed for each series by taking the maximum equivalent stress within 4 mm bins of the radial coordinate . The processed profiles and the campaign summary are provided as Dataset S2 and in Section S6 of the Supplementary Material.
2.7. Evaluation Criterion and Screening Procedure
The admissibility of each configuration is evaluated [27,32] against an allowable stress criterion derived from the material yield strength and an explicit safety factor [33,34]:
A safety factor is adopted with respect to the yield strength, consistent with industrial practice for structural components subjected to low-frequency cyclic loading with significant economic consequences in case of failure, without direct risk to human safety [33]. With MPa (annealed 1.4310, Section 2.2.3) and , the allowable stress is MPa.
The procedure is systematically applied to each configuration:
The final selection minimizes subject to compliance with the criterion under the reference model, whose identification is discussed in Section 4 based on comparison with numerical simulation.
3. Results
3.1. Radial Stress Distribution for the Original Configuration
The application of the analytical model to configuration 1 ( mm, mm, ) yields the radial distribution of Von Mises equivalent stress shown in Figure 3.
Figure 3.
Radial distribution of Von Mises equivalent stress for the original configuration ( mm, mm) under the two idealized analytical boundary conditions (SS, C). The diamond marks the maximum FEM equivalent stress on the concave face at the cross-center series ( MPa) reported by Noa-Aguila et al. [21], used as the absolute calibration point of the analytical model; the full radial FEM profiles of both faces (convex and concave) are provided in Figure S1 of the Supplementary Material. The green dashed line indicates the allowable stress MPa with over MPa (annealed 1.4310); the gray dotted line indicates the yield strength.
The radial profile under the simply supported model shows its absolute maximum MPa at the plate center (), decreasing monotonically to MPa at the edge. The profile under the clamped model shows its absolute maximum MPa also at the center, with a local minimum near cm and a secondary increase at the edge up to MPa. This distribution reflects the adopted formulation for a thin curved plate with coupled membrane effects [22].
The maximum equivalent stress reported by FEM for this configuration [21] is MPa (concave face, cross-center series). The FEM value lies between the predictions of the two analytical models, considerably closer to the simply supported case than to the clamped one, providing the first quantitative evidence of the characteristic structural behavior discussed in Section 3.3. Beyond this single value, the full radial FEM profiles of both faces (43 points each, Figure 3) show that the simply supported curve envelopes the FEM field along the entire radius, so the conservative-bound property rests on a full-profile comparison rather than on a single point.
3.2. Comparison with Reference Numerical Simulation
The quantitative comparison between the analytical model predictions and the finite element simulation [21] for configuration 1 is summarized in Table 3.
Table 3.
Comparison between analytical model predictions for configuration 1 ( mm, mm) and the reference numerical simulation reported by Noa-Aguila et al. [21].
The simply supported model overestimates the FEM stress by , while the clamped model underestimates it by . The absolute difference between the simply supported prediction and FEM ( MPa) is approximately half of that between the clamped prediction and FEM ( MPa), demonstrating that the simply supported model, although conservative, provides a substantially closer approximation to the numerical reference.
The concave (inner) face is adopted as the calibration reference because it is the loaded face onto which the diaphragm transmits the pressure, consistent with the load application in the analytical model. The difference between faces ( MPa concave vs. MPa convex) renders this choice inconsequential for the conclusions: adopting the convex face would shift the transition parameter from to , preserving the same interpretation of proximity to the simply supported response.
3.3. Effective Structural Behavior and Reference Model Selection
To quantitatively characterize the relative position of the FEM response with respect to the two idealized predictions, the dimensionless transition parameter is introduced, defined as:
where indicates full agreement with the simply supported prediction and with the clamped prediction. Substituting the values from Table 3:
The FEM response of the physically clamped plate lies at of the range between the clamped and simply supported predictions, considerably closer to the latter. This suggests that the regular perforation adjacent to the edge partially degrades the effective clamping condition; the physical mechanism is discussed in Section 4.
The operational implication for screening is methodological: the simply supported model provides a conservative reference that remains close to the FEM response, whereas the clamped model systematically underestimates the stress. The adoption of the simply supported model is justified because (i) it provides an upper bound to the observed FEM response without assuming more favorable conditions than those actually present, and (ii) in the presence of uncertainties associated with material properties, local stress concentrations, and possible additional degradation under cyclic operation, the conservative model represents a defensible design practice.
3.4. Parametric Sweep Results
The application of the analytical model to the eighteen configurations yields the results shown in Table 4. An extended version including the relative stress reduction and the operational safety factor of every configuration is provided in Table S1 of the Supplementary Material. The curvature factors and were evaluated numerically following Feodosiev [22] for the cap geometry ( mm, mm, mm) and remain constant across all configurations, since the macroscopic geometry does not change.
Table 4.
Parametric sweep results: maximum Von Mises equivalent stress under the two idealized boundary conditions and verification of the admissibility criterion MPa with over MPa.
Figure 4 shows that both curves decrease monotonically with increasing , consistent with a leading-order trend, with the simply supported case consistently above the clamped case by a factor of approximately for . The singularity at corresponds to relocation of the stress maximum.
Figure 4.
Maximum Von Mises equivalent stress as a function of ligament efficiency for the eighteen configurations under both boundary conditions. Highlighted markers indicate the original configuration and configuration 3, which minimizes the predicted screening stress.
Figure 5 shows that for fixed , stress increases approximately linearly with d. The ordering confirms ligament thickness as the dominant design variable.
Figure 5.
Maximum stress vs hole diameter d, grouped by ligament thickness .
Figure 6 summarizes the stress distribution over the parameter plane for the two boundary conditions considered, providing an overview of the response of the proposed model across the analyzed design space.
Figure 6.
Stress maps over the plane for both boundary conditions.
The maps show that the minimum stress region is located at low d and high p, with the global minimum at configuration 3 ( mm, mm).
3.5. Percentage Variation Relative to the Original Configuration
Out of the eighteen configurations, only four exhibit lower maximum stress than the original under the simply supported model: configuration 3 (; reduction), configuration 2 (; ), configuration 6 (; ), and configuration 9 (; ). The remaining fourteen configurations show increases ranging from to . A summary is provided in Table 5.
Table 5.
Configurations achieving reduction in maximum equivalent stress relative to the original under the simply supported model. Operational safety factors are calculated with respect to MPa (annealed 1.4310).
Table 5 confirms that configuration 3 maximizes the operational safety factor under the simply supported model, with . This value is below the standard , but remains above unity, maintaining elastic behavior under nominal loads. An estimate based on calibration with the FEM response of the original configuration, using linear scaling expressed by Equation (27):
Under this calibration, the effective safety factor with respect to the verified material yield strength is . This value represents a substantial improvement over the original component (Section 4.4) but does not reach the standard requirement established in Section 2.7. This estimate is conditional on the linear-scaling assumption of Equation (27) and is therefore reported as a model-based value; its combination with complementary mitigation strategies is discussed in Section 4.4 and Section 4.5. The complete calibration procedure, including the derivation of and the calibrated estimates for the four stress-reducing candidates, is detailed in the Supplementary Material (Section S3 and Table S2). The direct verification campaign of Section 3.6 shows that this linear-scaling estimate is not supported by dedicated simulation of the candidate; the value is therefore superseded by the directly computed margins reported therein.
Figure 7 compares the maximum equivalent stress of each configuration with respect to the original geometry, allowing the stress reduction achieved by the different design alternatives to be directly assessed.
Figure 7.
Stress reduction of for each configuration relative to the original (). Positive values indicate reduction; negative values indicate increase. Only four configurations (3, 2, 6, 9) achieve a positive reduction.
3.6. Direct Finite Element Verification of the Screening
Table 6 summarizes the direct verification campaign of Section 2.6: for each configuration of the mm family, it reports the analytical prediction, the calibrated estimate of Equation (27), and the directly computed maxima of the cross-center and hole-edge series on the concave (loaded) face, together with their radial locations and the maximum total deformation.
Table 6.
Direct finite element verification of the mm family: analytical prediction, calibrated estimate (Equation (27)), and directly computed maxima of the cross-center and hole-edge series on the concave (loaded) face, with the radial location of each maximum. The last column reports the maximum total deformation.
Two results of Table 6 are immediate. First, the ranking predicted by the screening model is confirmed: the governing hole-edge maximum decreases monotonically with ligament efficiency, from MPa (configuration 1) to MPa (configuration 2) and MPa (configuration 3), and in all three cases the critical region is located in the perforated peripheral belt (–146 mm), in agreement with the reference simulation [21] and with the location of the in-service fractures (Figure 2). Second, the maximum total deformations (– mm) remain below of the plate thickness, verifying a posteriori the linearity assumption H2 and the small-deflection idealization adopted in the campaign. The radial structure underlying these maxima is presented in Figure 8.
Figure 8.
Radial envelope profiles of the Von Mises equivalent stress on the concave (loaded) face for the three configurations of the mm family, obtained from the direct verification campaign: (a) hole-edge series (local concentration at the perforation walls); (b) cross-center series (smooth field at the centers of the four-hole cells). The gray dotted line indicates MPa (annealed 1.4310); the green dashed line indicates MPa ().
Figure 8 shows that the concave-face profile shape reproduces the reference study [21]: a low central plateau (≈40–60 MPa) rising toward the peripheral belt and dropping over the solid outer annulus, with the hole-edge envelope (panel a) systematically above the cross-center envelope (panel b) and clearly separated between configurations at the peripheral peak. Panel (b) reveals the central finding of the campaign: the smooth cross-center field is essentially invariant across the three configurations (, and MPa; variation below and non-monotonic), in contrast with the scaling embedded in the analytical model ( MPa, a predicted reduction). This behavior is physically consistent with the effective elastic constants framework [7,8,9]: the homogenized bending field is governed by the macroscopic cap geometry and the load, which are common to every configuration, whereas the ligament efficiency controls the local amplification within the perforated pattern. The practical benefit of the redesign therefore accrues at the hole-edge concentration, which is reduced by , rather than at the smooth field, which is reduced by only . The consequence of this invariance for the calibrated estimates is confronted in Figure 9.
Figure 9.
Confrontation, for each configuration of the mm family, of the analytical simply supported prediction, the calibrated estimate of Equation (27), and the directly computed maxima of the cross-center and hole-edge series on the concave face. The calibrated estimate tracks neither series for configurations 2 and 3, whereas the ranking of the hole-edge maxima reproduces the ranking predicted by the screening model.
Figure 9 makes the outcome of the verification explicit: the linear-scaling estimate of Equation (27) is not supported by the direct simulation. The calibrated value for configuration 3, MPa, underestimates the directly computed cross-center maximum ( MPa) by . Re-based on the direct results, the safety factors of the candidate with respect to the verified annealed yield strength are on the smooth cross-center field and on the governing hole-edge peak, compared with for the installed configuration on the same basis. The redesign therefore improves the governing margin substantially but does not remove local exceedance of the annealed yield strength, which strengthens the requirement of material substitution discussed in Section 4.5. Consistently, the anchor-dependence of the transition parameter must be reported: evaluated with the cross-center maximum of the new campaign, Equation (25) yields , versus with the reference value of [21]; the parameter is a relative descriptor conditional on the numerical anchor, not a physical constant.
Finally, the comparison with the reference simulation quantifies the sensitivity of both series to the discretization. The cross-center maximum of the installed configuration computed here ( MPa) is below the reference value ( MPa [21]), and the hole-edge peak ( MPa) is approximately above the reference peak (≈259 MPa), differences attributable to the distinct meshing strategies (adaptive program-controlled sizing here versus local refinement controls in the reference) and to nodal averaging of the stress results. The qualitative structure of the field (profile shape, critical location, ranking) is insensitive to these differences, whereas the absolute magnitudes are not; a formal mesh convergence study is identified as immediate follow-up work in Section 4.6.
3.7. Sensitivity Analysis
The relative sensitivity of the model to each parameter corresponds to the exponent of the parameter in Equation (15): for P, for R, for h, and for . The results are summarized in Table 7.
Table 7.
Sensitivity analysis of maximum equivalent stress under the simply supported model for configuration 3 under parameter variations.
Plate thickness h is the most influential parameter, followed by radius R, ligament efficiency , and pressure P. The inverse quadratic dependence on thickness implies that typical manufacturing variability of mm introduces an uncertainty of approximately in the predicted stress, which is acceptable for the comparative purposes of this study.
Figure 10 presents the sensitivity analysis of the maximum equivalent stress with respect to the main model parameters, highlighting the relative influence of each variable on the structural response for the selected configuration.
Figure 10.
Sensitivity analysis of maximum equivalent stress under the simply supported model for configuration 3 ( MPa): (a) percentage variation curves for parameter changes; (b) Tornado diagram for variation, ranked by impact magnitude.
3.8. Synthesis of Results
- 1.
- The radial distribution under the simply supported model (Figure 3) exhibits an absolute maximum at the center with a value of MPa for the original configuration, higher than the reference FEM value [21].
- 2.
- The parameter (Equation (26)) places the FEM response at of the range between clamped and simply supported predictions, supporting the use of the simply supported model as a conservative screening criterion.
- 3.
- All eighteen configurations exceed MPa under the simply supported model, ranging from MPa (configuration 3) to MPa (configuration 16).
- 4.
- Only four configurations reduce stress relative to the original; configuration 3 achieves the largest reduction () and the highest operational safety factor .
- 5.
- Under FEM calibration, MPa and were reported as model-based estimates; the direct verification campaign (Section 3.6) does not support the linear-scaling assumption behind them, and the margins of configuration 3 re-based on dedicated simulation are on the cross-center field and on the governing hole-edge peak. The selection of configuration 3 is a calibration-independent geometric result and is confirmed by the direct campaign.
- 6.
- Sensitivity analysis shows that thickness h and radius R dominate the response; typical manufacturing variability introduces acceptable uncertainty of about .
- 7.
- The direct finite element campaign on the mm family confirms the predicted ranking and the peripheral critical location, reveals that the smooth cross-center field is essentially invariant across configurations (, , MPa), and quantifies the real benefit of the redesign as a reduction of the governing hole-edge peak ( MPa).
4. Discussion
4.1. Physical Interpretation of Effective Structural Behavior
The parameter indicates that the FEM stress response of the physically clamped plate lies at of the interval between the two idealized analytical predictions, significantly closer to the simply supported behavior. This observation, seemingly paradoxical for a plate whose boundary is geometrically designed as a clamped annular step, admits a direct physical interpretation when considering the nature of the perforated belt adjacent to the edge.
The classical clamped boundary condition [6] requires that the surrounding medium transmits both shear force and bending moment, maintaining zero rotation at the edge. In the present component, the outermost perforated belt, located between the last row of holes and the annular support step, exhibits reduced flexural stiffness proportional to the ligament efficiency [7,8,9]. This belt acts as a transition region between the rigid external medium (pump casing) and the perforated plate, behaving as a compliant ring that allows partial rotation under bending moment. The macroscopic consequence is an effective degradation of the clamping condition, whose magnitude increases as the stiffness of the belt decreases, i.e., as decreases near the boundary.
This interpretation is consistent with the effective elastic constants formalism developed by O’Donnell and co-authors [7,9,12] for perforated plates. In that framework, a perforated plate is modeled as an equivalent solid plate with effective elastic properties dependent on and the perforation pattern [8]. Applying this reduction locally to the perforated peripheral belt, while assuming the rest of the boundary behaves as a solid region, qualitatively explains the effective degradation of clamping quantified by . The distinction between the bulk effect of perforation (captured by classical theory) and the boundary effect identified here constitutes a key conceptual contribution of this work.
4.2. Validity of the Analytical Model as a Screening Tool
The systematic overestimation of by the simply supported model relative to the FEM response requires specific analysis in its dual role as limitation and methodological advantage.
As a limitation, the absolute magnitude of the error implies that stresses predicted by the simply supported model cannot be directly interpreted against admissibility criteria based on yield strength. Any absolute application requires calibration, as in Equation (27), using numerical simulation of at least one reference configuration. This dependence arises from the adopted idealizations (axisymmetric equivalent geometry, effective stiffness via multiplicative factor , and curvature factor calibrated at a point).
As an advantage, the systematic direction of the error (overestimation, never underestimation, for the validated configuration) provides the simply supported model with the property of a conservative upper bound for effective stress in the critical region. In parametric screening, this reduces the risk of erroneous selection due to underestimation. Compared to the clamped model, which underestimates by and could lead to acceptance of unsafe configurations, the simply supported model is the more robust methodological choice.
A further property underpins the use of the model for screening independently of the absolute calibration error. The modeled screening stress decreases monotonically with ligament efficiency, and configuration 3 attains both the maximal feasible and the minimal stress within the sweep. Decisively, the calibration of Equation (27) enters as a single global positive scale factor applied identically to every configuration, and therefore cannot alter their relative ordering. The identification of the stress-minimizing configuration is thus invariant under the calibration, which affects only the absolute stress magnitude and the derived safety factor, not the ranking on which the selection rests. This decouples the robust outcome of the screening—the relative ranking and the resulting selection of configuration 3, which possesses the maximal feasible —from the model-based absolute quantities, which remain conditional on the calibration. The conservative-bound property itself applies to the smooth cross-center stress field; the local stress concentrations at individual hole edges (assumption H5) are not bounded by the simply supported model and are addressed in Section 4.3 and Section 4.6.
The direct verification campaign of Section 3.6 delimits the scope of the conservative-bound property. At the calibration point (configuration 1) the simply supported prediction ( MPa) indeed bounds the directly computed cross-center maximum ( MPa) from above. For configuration 3, however, the analytical prediction ( MPa) underestimates the directly computed cross-center maximum ( MPa) by , because the physical smooth field does not follow the scaling embedded in the model. The conservative-bound property is therefore a local property of the calibration point and is not transferable across the sweep; what the verification confirms as robust is precisely what the screening rests on: the relative ordering of configurations by the governing hole-edge maximum. Accordingly, the model is repositioned in this work strictly as a ranking tool, and all absolute margins are taken from the direct simulations.
The validity of the simplified model as a conservative upper bound holds only for configurations close to the validated case. Extrapolation of the behavior to configurations with is not supported by direct evidence and should be treated as a hypothesis. A full characterization of as a function of , through numerical simulation of representative configurations, lies beyond the scope of the present screening study.
4.3. Perforated Peripheral Belt and Failure Mechanism in Operation
The recurrent fractures observed in operation for the original configuration [21], documented in Figure 2, are located in the perforated peripheral belt adjacent to the support step, not at the plate center. This spatial pattern is consistent with FEM results, which identify this belt as the critical region [21]. In contrast, the analytical model predicts maximum stress at the center, highlighting a spatial discrepancy between simplified modeling and observed behavior.
This discrepancy is physically consistent with the interpretation developed in Section 4.1. The analytical model assumes homogeneous effective stiffness across the perforated region, whereas the real structure exhibits strong heterogeneity: the peripheral belt combines (i) reduced stiffness due to perforation, (ii) high bending moment near the clamped transition, and (iii) local stress concentrations at hole edges. The superposition of these effects produces local stress peaks not captured by the first-order model. These local concentrations at the hole edges exceed the smooth-field prediction to which the conservative-bound property of the simply supported model applies, and would require a dedicated stress concentration factor within the fatigue assessment.
The crack morphology observed in Figure 2—tortuous paths through successive ligaments, propagation along rows of holes, and evidence of prior weld repairs—is consistent with fatigue crack growth characteristics under cyclic loading rather than catastrophic plastic collapse; this failure mode is suspected but not confirmed, and its definitive characterization requires SEM fractographic examination. This is consistent with the pump operating cycle and the operational safety factor below unity discussed in Section 4.4. A rigorous fatigue failure characterization, including SEM fractography, is necessary and acknowledged in Section 4.6.
Additionally, the measured carbon content (, Table 1) exceeds the threshold typical of low-carbon “L” grades (≤0.03%), making the material susceptible to sensitization via chromium carbide precipitation if exposed to 450–850 °C. Weld repairs introduce heat-affected zones within this range. The combination of sensitization, acidic environment, and high stress may lead to intergranular corrosion or corrosion-fatigue, explaining the observed crack paths. This has direct implications for material selection in redesign, discussed in Section 4.5.
Local stress concentrations around holes in perforated plates have been characterized by Konieczny et al. [16] and Wu et al. [17]; for spherical shells, Syas’kii et al. [19] provide limited analytical insight. Full characterization of the local stress field in the peripheral belt of the proposed redesign is therefore a necessary step for industrial validation.
4.4. Critical Analysis of the Proposed Redesign Configuration
The selection of configuration 3 ( mm, mm, ) as the principal redesign candidate is supported by four verifiable quantitative elements, now re-based on the direct verification campaign of Section 3.6: (i) minimization of the screening stress within the feasible sweep ( MPa), a calibration-independent geometric result; (ii) confirmation of that minimization by dedicated simulation, with the governing hole-edge maximum decreasing from MPa (installed) to MPa (candidate), a reduction; (iii) improvement of the governing safety factor from to with respect to the verified annealed yield strength; and (iv) preservation of the smooth-field margin ( on the cross-center series). Elements (ii)–(iv) replace the former model-based estimates ( MPa, ), which the verification showed to rely on a linear-scaling assumption not supported by the physical smooth field.
The most substantial limitation of the geometric redesign, quantified by the direct campaign, is that the governing hole-edge peak of configuration 3 ( MPa) remains above the annealed yield strength (): the geometric modification alone does not remove local exceedance in the critical belt. This requires explicit discussion of the actual safety margin and the conditions needed to achieve the standard criterion.
Three considerations bound the scope of this limitation:
4.4.1. First Consideration: Improvement over the Currently Installed Design
On the common basis of the direct campaign, the installed configuration operates with a governing peak of MPa () and the candidate with MPa (), a improvement of the governing margin; on the smooth cross-center field the candidate remains marginally elastic (). The remaining deficit with respect to the admissibility criterion is closed through the complementary strategies discussed in Section 4.5, which the verification elevates from advisable to strictly necessary.
4.4.2. Second Consideration: Limits of the Manufacturable Design Space
The parametric sweep fully covers feasible configurations under constraints mm and mm (Section 2.4). Configuration 3 represents the upper bound in ligament efficiency (), achieved with minimum hole diameter and maximum ligament thickness. By construction, no further improvement is possible within standard manufacturing limits without resorting to non-conventional solutions (smaller holes, larger ligaments, or non-regular patterns). Therefore, configuration 3 is the stress-minimizing configuration within industrial feasibility constraints.
4.4.3. Third Consideration: Applicability of Static Framework to Fatigue Failure
The safety factors reported here are defined with respect to yield under equivalent static loading. As discussed in Section 4.3, the actual failure mechanism is likely fatigue (or corrosion-fatigue) under cyclic loading. Therefore, these factors should be interpreted as margins on nominal stress levels feeding a fatigue analysis, not as final safety margins against failure. A rigorous fatigue assessment, including stress concentration factors , environmental effects, and S–N characterization of the material in its actual condition, is required and identified as future work.
4.5. Complementary Mitigation Strategies
The recognition that geometric modification of the perforation pattern alone does not achieve the standard criterion requires integrating configuration 3 with complementary strategies acting on other design parameters. This integration is not optional but a necessary condition for a defensible industrial implementation.
4.5.1. Material Substitution for Higher Yield Strength
The identification of the installed material as 1.4310 (Section 2.2.2) enables three distinct substitution pathways, summarized in Table 8.
Table 8.
Comparison of material alternatives for the redesign, including minimum yield strength according to EN 10088-2 and resulting safety factor for configuration 3 evaluated on the governing hole-edge peak obtained from the direct verification campaign ( MPa).
Substitution with standard austenitic steels in annealed condition (304L, 316L, 316Ti) leaves the governing safety factor essentially unchanged and below unity, and is therefore ineffective. The technically effective alternatives are: (i) maintaining 1.4310 in a cold-worked condition (C700 or higher), leveraging its metastable austenitic nature to achieve significant strengthening via strain-induced martensitic transformation ( on the governing peak); or (ii) substituting with duplex stainless steel 1.4462 (). Both options exceed the standard criterion on the governing local peak of the verified candidate geometry and enable industrial adoption of the geometric redesign. The direct verification thus converts material substitution from a complementary measure into a necessary condition: without it, the redesigned plate would still operate with local exceedance of the yield strength in the critical belt.
The selection between these alternatives requires verification of chemical compatibility with the acidic starch slurry, and in the case of cold-worked material, evaluation of weldability for future repairs. Additionally, both alternatives exhibit lower susceptibility to sensitization than the current 1.4310 with , reducing the risk of corrosion-fatigue mechanisms identified in Section 4.3.
4.5.2. Reduction of Operating Pressure
The linear sensitivity of the stress field with respect to P (Table 7) implies that the governing hole-edge peak of the verified candidate scales proportionally with the operating pressure. Achieving the standard criterion on that peak ( MPa) would therefore require a pressure reduction of approximately , and even restoring elastic behavior at the peak () would require approximately ; both are industrially unfeasible without redefining the pumping process, its throughput, and the upstream and downstream hydraulic systems. Pressure reduction is consequently discarded as a primary mitigation strategy, which reinforces material substitution as the load-bearing measure of the redesign.
4.5.3. In-Service Monitoring and Periodic Inspection
The implementation of a periodic inspection scheme based on non-destructive testing (ultrasonic testing, dye penetrant, magnetic particles) would allow early detection of crack initiation in the peripheral belt before reaching critical size. This strategy does not reduce the maximum stress but manages risk associated with reduced safety margins through preventive intervention. Given the fatigue failure mode identified, this measure is considered practically mandatory regardless of other mitigation strategies.
4.5.4. Recommended Strategy
The operational recommendation of this work is the combination of configuration 3 with material substitution to cold-worked 1.4310 (C700 or higher) or duplex stainless steel 1.4462, complemented by periodic inspection. This combination closes the safety factor deficit with a wide margin (Table 8), mitigates sensitization risk in future weld heat-affected zones, and actively manages the identified fatigue failure mode. The final selection between material alternatives depends on economic, logistical, and process considerations beyond purely mechanical aspects.
4.6. Study Limitations and Validity of Conclusions
The validity of the conclusions is subject to the following explicitly stated limitations:
4.6.1. Limitation 1: Mechanical Properties Not Experimentally Verified
Although chemical composition was verified by PMI (Section 2.2.2), the adopted mechanical properties ( MPa, GPa) correspond to minimum EN 10088-2 values for the annealed state [24]. The actual metallurgical condition (annealed vs residual cold-worked) has not been verified by tensile or hardness testing. For metastable austenitic 1.4310, this uncertainty can span a factor of 2–3 in (350–700 MPa), significantly affecting all safety factors. Direct mechanical characterization is therefore required.
4.6.2. Limitation 2: Scope and Outcome of the Numerical Verification
In the first version of this work, the calibration using rested solely on the published simulation of the installed configuration [21], and the linear-scaling assumption (Equation (27)) was explicitly flagged as requiring verification. The direct campaign of Section 3.6 performed that verification for the mm family: the relative ranking and the critical location are confirmed, whereas the linear-scaling assumption is refuted for absolute magnitudes, and the corresponding estimates have been superseded by directly computed values. Two residual limitations remain. First, the verification covers the mm family; the ranking of the remaining fifteen configurations, all of which increase the screening stress, rests on the analytical model alone. Second, the comparison with the reference simulation reveals discretization sensitivity of the absolute magnitudes (cross-center maximum below, hole-edge peak above the reference values), attributable to the different meshing strategies and to nodal averaging; a formal mesh convergence study of the installed and candidate configurations is identified as immediate follow-up work, and the absolute values reported here must be read within that band.
4.6.3. Limitation 3: Static Model Under Cyclic Fatigue Conditions
The plate operates under cyclic loading. The present analysis uses an equivalent static approach, neglecting load reversal, diaphragm viscoelasticity, and fatigue behavior. As discussed in Section 4.3, the failure mode is likely fatigue or corrosion-fatigue. The reported safety factors are margins with respect to yield under the equivalent-static idealization, not fatigue safety margins. A full fatigue analysis requires S–N curves, stress concentration factors , surface finish, size effects, and environmental correction factors, which are beyond the scope of this work.
4.6.4. Limitation 4: Local Stress Concentrations Not Captured by the Analytical Model
The analytical model based on effective stiffness does not capture local stress concentrations at individual hole boundaries. The direct verification campaign quantifies them for the mm family (hole-edge series of Section 3.6); their mesh-converged magnitude, particularly in the peripheral belt, requires the refined discretization study identified in Limitation 2.
4.6.5. Limitation 5: Pending Fractographic Analysis
SEM fractographic examination of the fracture surface of the installed plate, which would definitively confirm the failure mechanism (fatigue striations, beach marks, crack initiation sites, presence of intergranular corrosion products), has not been performed. This verification is low-cost and highly informative and is included as immediate follow-up work.
4.6.6. Limitation 6: Manufacturing Variability Not Included
The analysis uses nominal values without manufacturing tolerances. Sensitivity analysis shows that typical thickness variations of mm introduce approximately uncertainty in predicted stress.
4.7. Contribution of the Work in the Context of the State of the Art
To position the specific contribution of this work, Table 9 summarizes the main verified references in four categories.
Table 9.
Systematic comparison of the present work with key references on stress analysis of perforated plates and curved shells.
The systematic review supports three key observations that underpin the specific contribution of this work:
4.7.1. First Observation: Classical Literature on Perforated Plates in Bending Is Strictly Limited to Flat Geometries
Foundational works [7,8,9,12], synthesized by Osweiller [11], establish the framework of effective elastic constants for flat plates. Subsequent developments [13,15,16,17,26] maintain this geometric idealization.
4.7.2. Second Observation: Analysis of Perforated Curved Shells Is Restricted to Non-Comparable Cases
Syas’kii et al. [19] address only two isolated holes; Mareks et al. [20] focus on cylindrical geometry rather than spherical, with decoupled membrane stresses instead of the biaxial coupling characteristic of spherical shells [6,22].
4.7.3. Third Observation: The Direct Precedent Lacks Parametric Analysis and Experimental Material Verification
Noa-Aguila et al. [21] are limited to stress diagnosis of a single configuration via FEM, without parametric sweep, redesign proposal, PMI verification of the installed material, or characterization of the actual in-service failure mechanism.
The specific contribution of the present work is articulated through five integrated elements: (i) the formulation of an operational analytical model that simultaneously incorporates spherical curvature, dense square-pattern regular perforation, and stepped peripheral clamping into a calibrable expression suitable for redesign screening; (ii) the introduction of the dimensionless parameter as a quantitative descriptor of effective clamping degradation caused by the adjacent perforated belt, distinguishing this boundary effect from the bulk effect captured by the classical O’Donnell–Slot framework; (iii) the experimental verification of the installed material composition by PMI, identifying it as AISI 301/1.4310 (rather than AISI 304 as originally assumed) and updating all nominal mechanical properties and safety factors accordingly; (iv) the direct finite element verification campaign on the complete mm family with the verified material properties, which confirms the screening ranking and the critical location, refutes the linear-scaling hypothesis, and quantifies the real margins of the candidate; and (v) the proposal of an integrated, industrially feasible redesign strategy (configuration 3 + material substitution to cold-worked state or duplex alloy + periodic inspection), with explicit quantification of its safety margin and required complementary validations.
The industrial scope is limited to KARL KROYER MP 2C120 pumps and geometrically equivalent equipment. Extension to other components (tube sheets, perforated pressure vessel heads, other positive displacement pumps) requires recalibration of the parameter and reassessment of model assumptions for each specific geometry.
5. Conclusions
An analytical model was developed that integrates spherical curvature, square perforation, and stepped peripheral clamping. Calibration against FEM [21] shows a overestimation under simply supported conditions and a underestimation under clamped conditions; the dimensionless parameter supports the use of the simply supported model as a conservative screening bound and constitutes the quantitative descriptor of the central conceptual contribution.
The chemical composition of the installed material was verified by optical emission spectrometry (PMI), identifying it as AISI 301/1.4310 X10CrNi18-8, with nominal annealed yield strength MPa according to EN 10088-2.
The original configuration ( mm, mm) operates with relative to the verified yield strength, a value below unity that quantitatively explains the observed in-service fractures.
The parametric sweep of eighteen configurations identifies configuration 3 ( mm, mm, ) as the configuration that minimizes the equivalent stress predicted by the conservative screening model within the standard manufacturable space; because the single-point calibration rescales all configurations by a common positive factor, this selection is calibration-independent. The direct finite element verification campaign performed on the complete mm family with the verified material properties confirms the selection: the governing hole-edge maximum decreases monotonically from MPa (installed) to MPa (candidate), a reduction, with the critical region in the perforated peripheral belt in all cases. The verification simultaneously refutes the linear-scaling calibration hypothesis: the smooth cross-center field is essentially invariant across configurations (, , MPa), so the former model-based estimates ( MPa, ) are superseded by the directly computed margins ( on the cross-center field, on the governing peak). The transition parameter is likewise anchor-dependent ( with the reference simulation, with the present campaign) and must be read as a relative descriptor conditional on the numerical anchor. The analytical model is accordingly established as a verified ranking tool, not as a predictor of absolute margins.
Geometric modification alone does not meet the admissibility criterion: the governing hole-edge peak of the verified candidate ( MPa) remains above the annealed yield strength. Industrial adoption requires combining configuration 3 with material substitution to cold-worked 1.4310 (C700: MPa, on the governing peak; C1000: ) or duplex stainless steel 1.4462 ( MPa, ), which simultaneously reduce sensitization risk in heat-affected zones from weld repairs. Periodic inspection using non-destructive testing is considered mandatory.
Stress sensitivity is dominated by thickness h and active radius R ( to for ∓10%); typical manufacturing tolerances introduce acceptable uncertainty of about .
The analyzed geometric combination (thin spherical cap with dense square perforation and stepped clamping) has not been previously addressed in the accessible literature. The main contribution is articulated in five elements: the parameter as a boundary-effect descriptor, experimental PMI material verification, the direct finite element verification campaign of the mm family, an integrated redesign strategy (geometry + material + monitoring), and recognition of fatigue as the governing failure mechanism beyond static safety factors.
Industrial implementation would require four complementary verifications beyond the present scope: a formal mesh convergence study of the installed and candidate configurations, extension of the direct verification to the remaining stress-reducing configurations for the parametric characterization of , mechanical testing (Vickers hardness or tensile) to determine the actual material state, and SEM fractographic analysis together with a fatigue assessment including the stress concentration factor and environmental correction.
Supplementary Materials
The following supporting information can be downloaded at: https://www.mdpi.com/article/10.3390/technologies14080457/s1.
Author Contributions
Conceptualization, J.G.N.Á., Y.L.G., R.J.B., Y.C.A. and R.Q.S.; methodology, J.G.N.Á., Y.L.G., R.J.B., Y.C.A. and R.Q.S.; software, J.G.N.Á., Y.L.G. and R.J.B.; validation, J.G.N.Á., Y.C.A. and R.J.B.; formal analysis, Y.C.A., R.J.B. and R.Q.S.; investigation, Y.L.G., Y.C.A. and R.J.B.; resources, J.G.N.Á., R.J.B. and R.Q.S.; data curation, J.G.N.Á. and Y.L.G.; writing—original draft preparation, Y.C.A. and R.J.B.; writing—review and editing, J.G.N.Á., Y.L.G., R.J.B., Y.C.A. and R.Q.S. All authors have read and agreed to the published version of the manuscript.
Funding
This research received no external funding.
Data Availability Statement
The original contributions presented in this study are included in the article and its Supplementary Material (Datasets S1 and S2). Further inquiries may be directed to the corresponding authors.
Conflicts of Interest
The authors declare no conflicts of interest.
Abbreviations
The following abbreviations are used in this manuscript:
| PMI | Positive Material Identification |
| OES | Optical Emission Spectrometry |
| FEM | Finite Element Method |
| SS | Simply Supported edge |
| C | Clamped edge |
| HAZ | Heat-Affected Zone |
| SCC | Stress Corrosion Cracking |
| FS | Safety Factor |
| NDT | Non-Destructive Testing |
References
- Karassik, I.J.; Messina, J.P.; Cooper, P.; Heald, C.C. (Eds.) Pump Handbook, 4th ed.; McGraw-Hill: New York, NY, USA, 2008. [Google Scholar]
- Volk, M. Pump Characteristics and Applications, 3rd ed.; CRC Press: Boca Raton, FL, USA, 2014. [Google Scholar]
- Abdelhak, K.; Touzain, A.; Ouinas, D. Stress and failure analysis of composite plates with a circular hole subjected to shear loading. Compos. Theory Pract. 2022, 22, 225–232. [Google Scholar]
- Ashish, P.; Kumar, C. Stress concentration around an elliptical hole in a large rectangular plate subjected to linearly varying in-plane loading on two opposite edges. Theor. Appl. Fract. Mech. 2020, 106, 102456. [Google Scholar] [CrossRef] [Scilit]
- Zhu, D.; Wang, P.; Li, Q. Semi-analytical solution of elastic stresses within infinite and half planes including multiple holes of complex shapes. Appl. Math. Model. 2023, 117, 187–208. [Google Scholar] [CrossRef] [Scilit]
- Timoshenko, S.P.; Woinowsky-Krieger, S. Theory of Plates and Shells, 2nd ed.; McGraw-Hill: New York, NY, USA, 1959. [Google Scholar]
- O’Donnell, W.J.; Langer, B.F. Design of perforated plates. ASME J. Eng. Ind. 1962, 84, 307–319. [Google Scholar] [CrossRef] [Scilit]
- Slot, T.; O’Donnell, W.J. Effective elastic constants for thick perforated plates with square and triangular penetration patterns. J. Eng. Ind. 1971, 93, 935–942. [Google Scholar] [CrossRef] [Scilit]
- O’Donnell, W.J. Effective elastic constants for the bending of thin perforated plates with triangular and square penetration patterns. J. Eng. Ind. 1973, 95, 121–128. [Google Scholar] [CrossRef] [Scilit]
- American Society of Mechanical Engineers. ASME Boiler and Pressure Vessel Code, Section III, Appendix A-8000: Stresses in Perforated Flat Plates; ASME: New York, NY, USA, 2023. [Google Scholar]
- Osweiller, F. Evolution and synthesis of the effective elastic constants concept for the design of tubesheets. J. Press. Vessel Technol. 1989, 111, 209–217. [Google Scholar] [CrossRef] [Scilit]
- Porowski, J.S.; O’Donnell, W.J. Elastic design methods for perforated plates. J. Eng. Power 1978, 100, 356–362. [Google Scholar] [CrossRef] [Scilit]
- Saraçoğlu, M.H.; Uslu, F.; Albayrak, U. Stress and displacement analysis of perforated circular plates. Chall. J. Struct. Mech. 2020, 6, 150–159. [Google Scholar] [CrossRef] [Scilit]
- Saraçoğlu, M.H.; Albayrak, U. Linear static analysis of perforated plates with round and staggered holes under their self-weights. Res. Eng. Struct. Mater. 2016, 2, 39–47. [Google Scholar] [CrossRef] [Scilit]
- Atanasiu, C.; Sorohan, S. Displacements and stresses in bending of circular perforated plate. IOP Conf. Ser. Mater. Sci. Eng. 2016, 147, 012095. [Google Scholar] [CrossRef] [Scilit]
- Konieczny, M.M.; Achtelik, H.; Gasiak, G. Finite element analysis (FEA) and experimental stress analysis in circular perforated plates loaded with concentrated force. Frat. Integrità Strutt. 2020, 14, 164–173. [Google Scholar] [CrossRef] [Scilit]
- Wu, D.; Peddieson, J.; Buchanan, G.R.; Rochelle, S.G. Large axisymmetric deformations of elastic/plastic perforated circular plates. J. Press. Vessel Technol. 2003, 125, 357–364. [Google Scholar] [CrossRef] [Scilit]
- Reissner, E. Some problems of shearing and twisting of shallow spherical shells. In Selected Works in Applied Mechanics and Mathematics; Springer: Tokyo, Japan, 1996. [Google Scholar]
- Syas’kii, A.A.; Mulyar, V.P.; Savichenko, A.A. Stress concentration in a spherical shell with two neighboring circular holes. Int. Appl. Mech. 2012, 47, 691–700. [Google Scholar]
- Lasenko, I.; Mironovs, V.; Akishin, P.; Osipova, M.; Sirotkina, A.; Skromulis, A. Influence of perforation on elastic modulus and shear modulus of lightweight thin-walled cylindrical shells. Metals 2025, 15, 1263. [Google Scholar] [CrossRef] [Scilit]
- Noa-Aguila, J.G.; Quiza-Sardiñas, R.; Montelier-Hernández, S. Simulación del estado tensional de la placa de respaldo de bomba KARL KROYER MP 2C120. Ing. Mecánica 2023, 26, e683. [Google Scholar]
- Feodosiev, V.I. Strength of Materials, 3rd ed.; Mir Publishers: Moscow, Russia, 1985. [Google Scholar]
- American Petroleum Institute. API Standard 674: Positive Displacement Pumps—Reciprocating, 3rd ed.; API: Washington, DC, USA, 2010. [Google Scholar]
- EN 10088-2:2014; European Committee for Standardization. Stainless Steels—Part 2: Technical Delivery Conditions for Sheet/Plate and Strip of Corrosion Resisting Steels for General Purposes. CEN: Brussels, Belgium, 2014.
- Davis, J.R. (Ed.) ASM Specialty Handbook: Stainless Steels; ASM International: Materials Park, OH, USA, 1994. [Google Scholar]
- Jhung, M.J.; Jeong, K.H. Free vibration analysis of perforated plate with square penetration pattern using equivalent material properties. Nucl. Eng. Technol. 2015, 47, 500–511. [Google Scholar] [CrossRef] [Scilit]
- Mironovs, V.; Osipova, M.; Akishin, P.; Zemchenkovs, V.; Serdjuks, D. Methods for Evaluating the Elastic Properties of Stainless Steel Perforated Plates. Metals 2025, 15, 711. [Google Scholar] [CrossRef] [Scilit]
- von Mises, R. Mechanik der festen Körper im plastisch-deformablen Zustand. Nachr. Ges. Wiss. Göttingen Math.-Phys. Kl. 1913, 1, 582–592. [Google Scholar]
- da Silveira, T.; Crestani, E.A.; dos Santos, E.D.; Isoldi, L.A. Numerical Analysis of Aspect Ratio Effects on the Mechanical Behavior of Perforated Steel Plates. Metals 2025, 15, 786. [Google Scholar] [CrossRef] [Scilit]
- ANSYS, Inc. ANSYS Mechanical User’s Guide, Release 18.1; ANSYS, Inc.: Canonsburg, PA, USA, 2018. [Google Scholar]
- ANSYS, Inc. ANSYS Mechanical User’s Guide, Release 2025 R2; ANSYS, Inc.: Canonsburg, PA, USA, 2025. [Google Scholar]
- Quin, S.; Widera, G.E.O. Use of Stress-Strength Model in Determination of Safety Factor for Pressure Vessel Design. ASME J. Press. Vessel Technol. 1996, 118, 27–32. [Google Scholar] [CrossRef] [Scilit]
- Boresi, A.P.; Schmidt, R.J. Advanced Mechanics of Materials, 6th ed.; John Wiley & Sons: Hoboken, NJ, USA, 2003. [Google Scholar]
- Young, W.C.; Budynas, R.G.; Sadegh, A.M. Roark’s Formulas for Stress and Strain, 9th ed.; McGraw-Hill: New York, NY, USA, 2020. [Google Scholar]
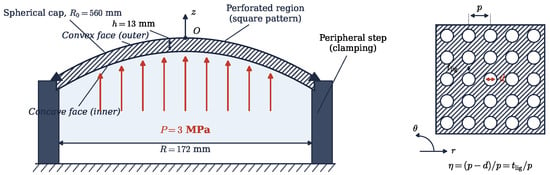
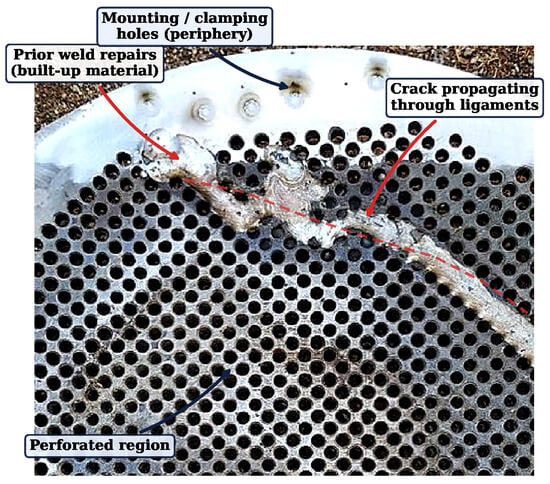
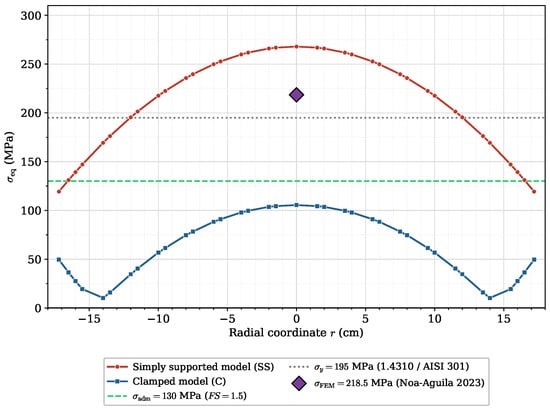
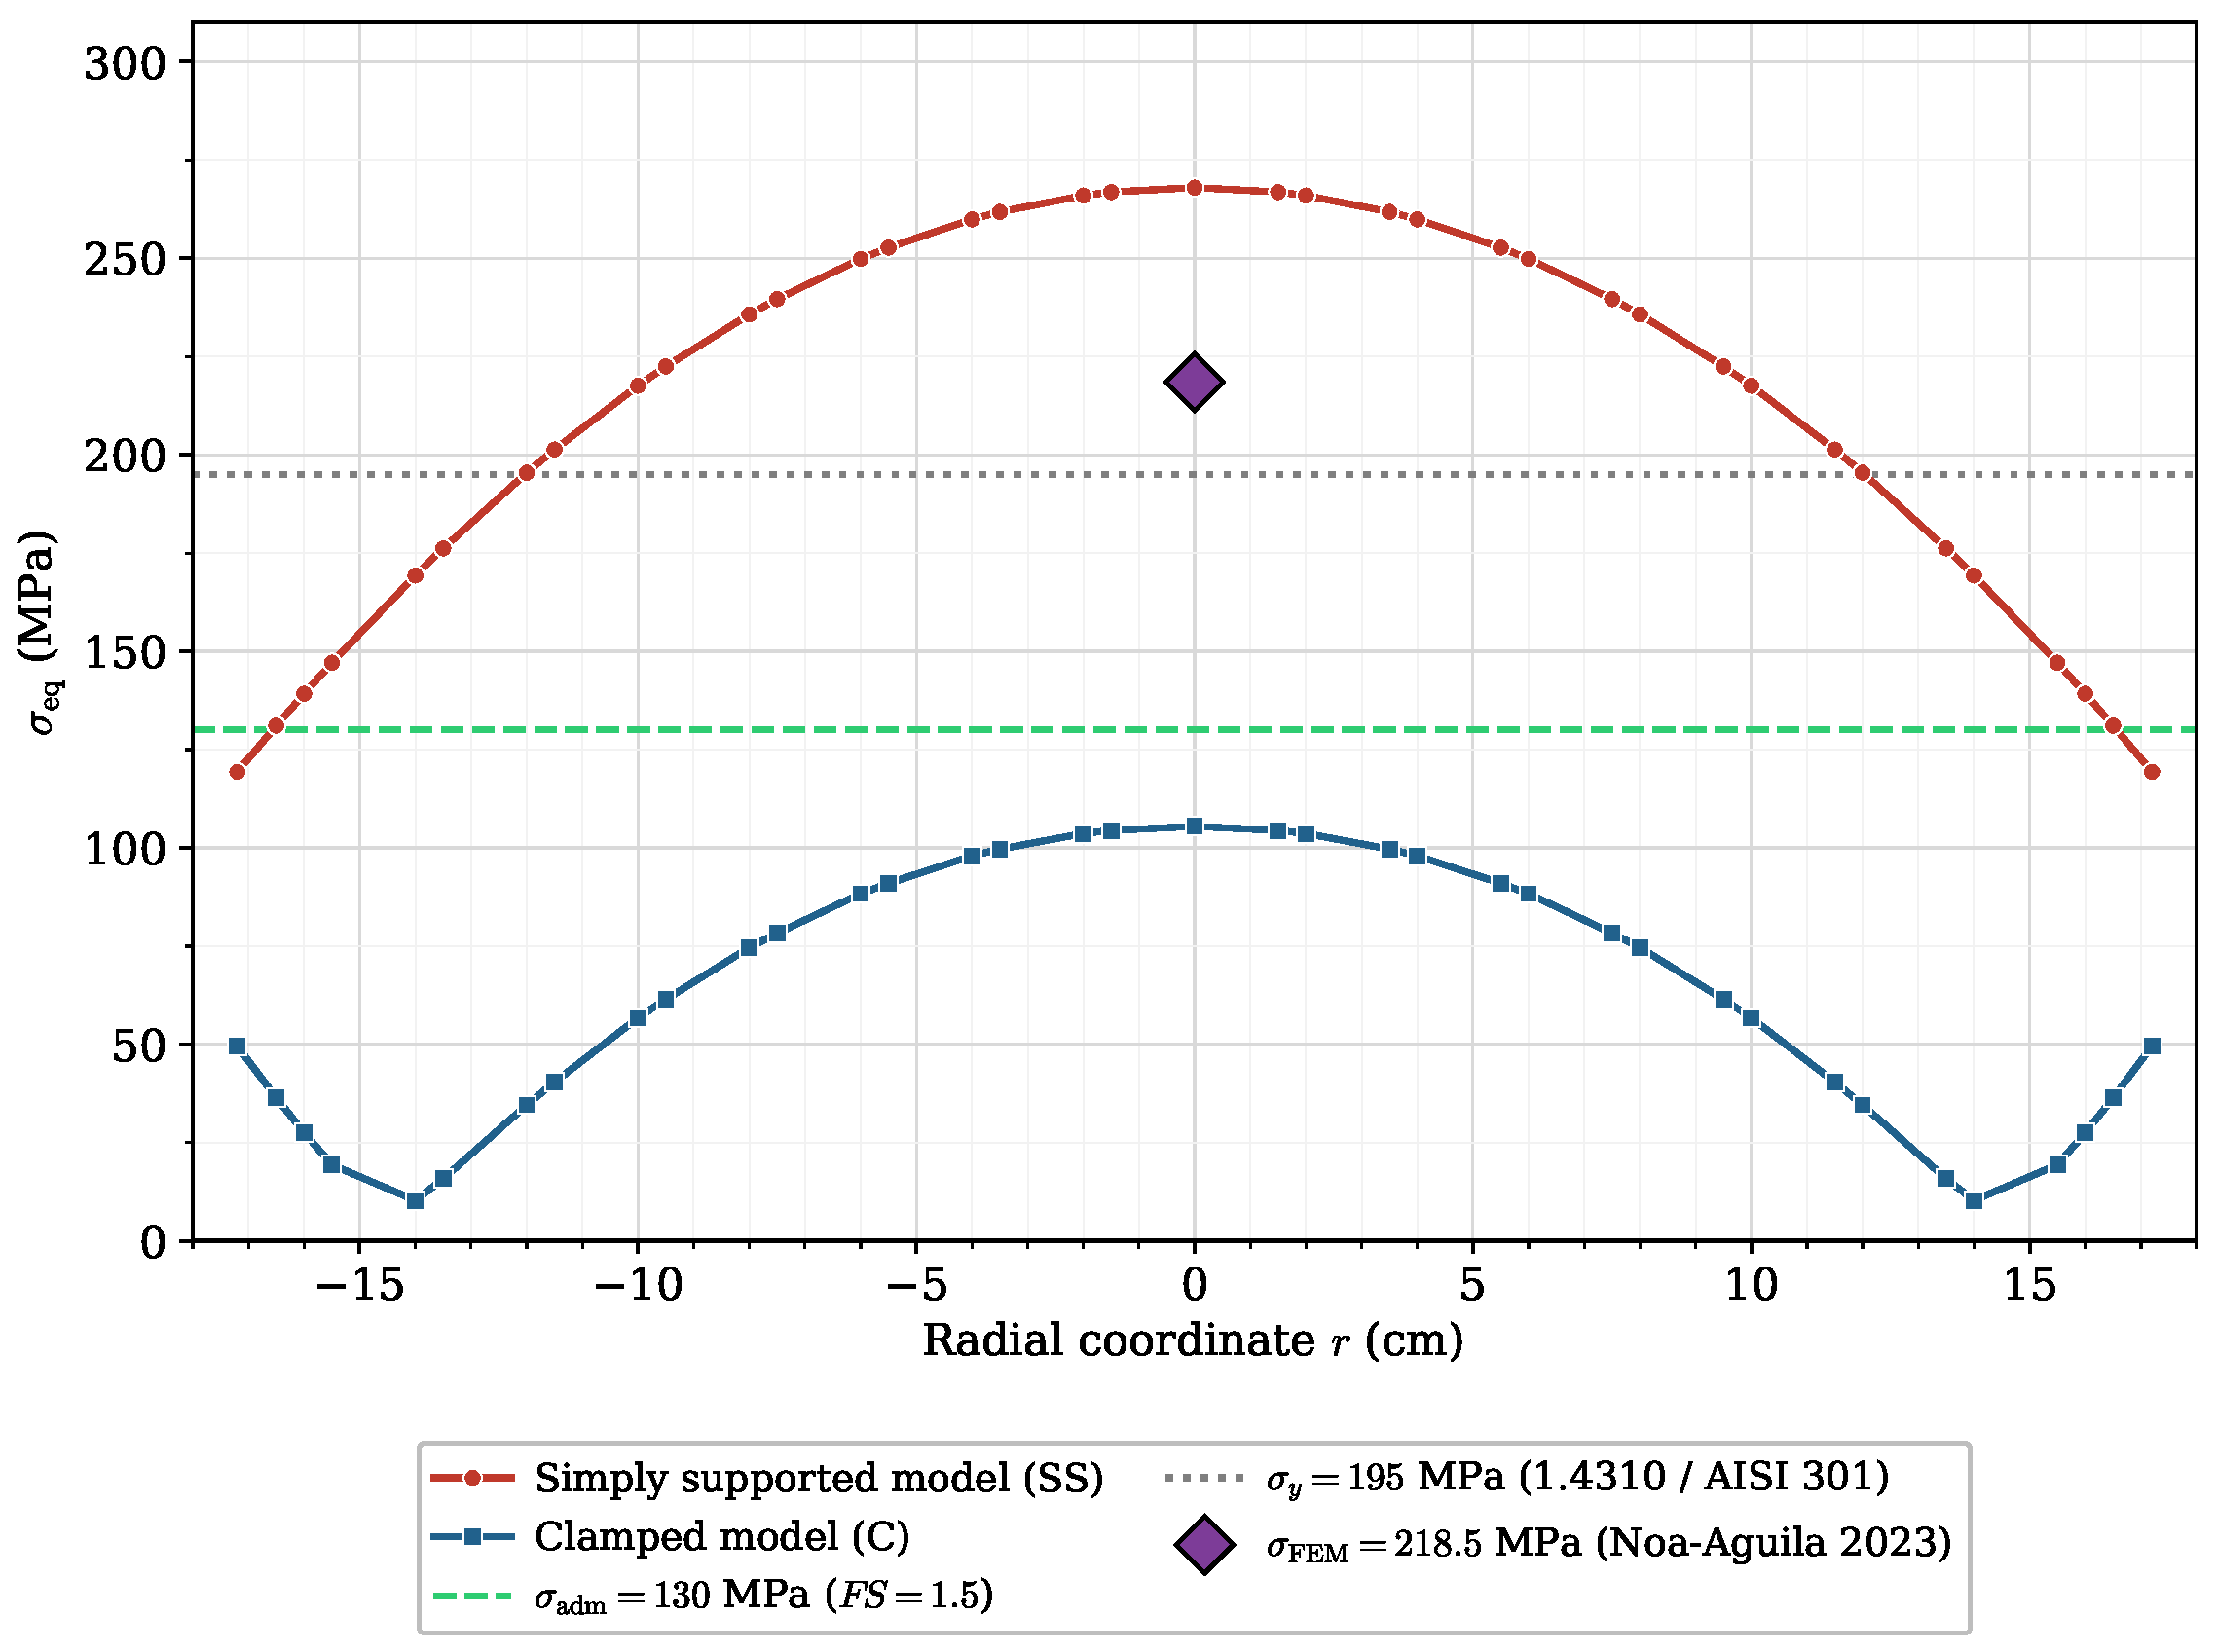
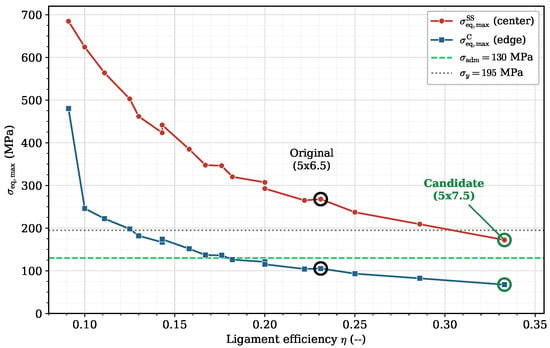
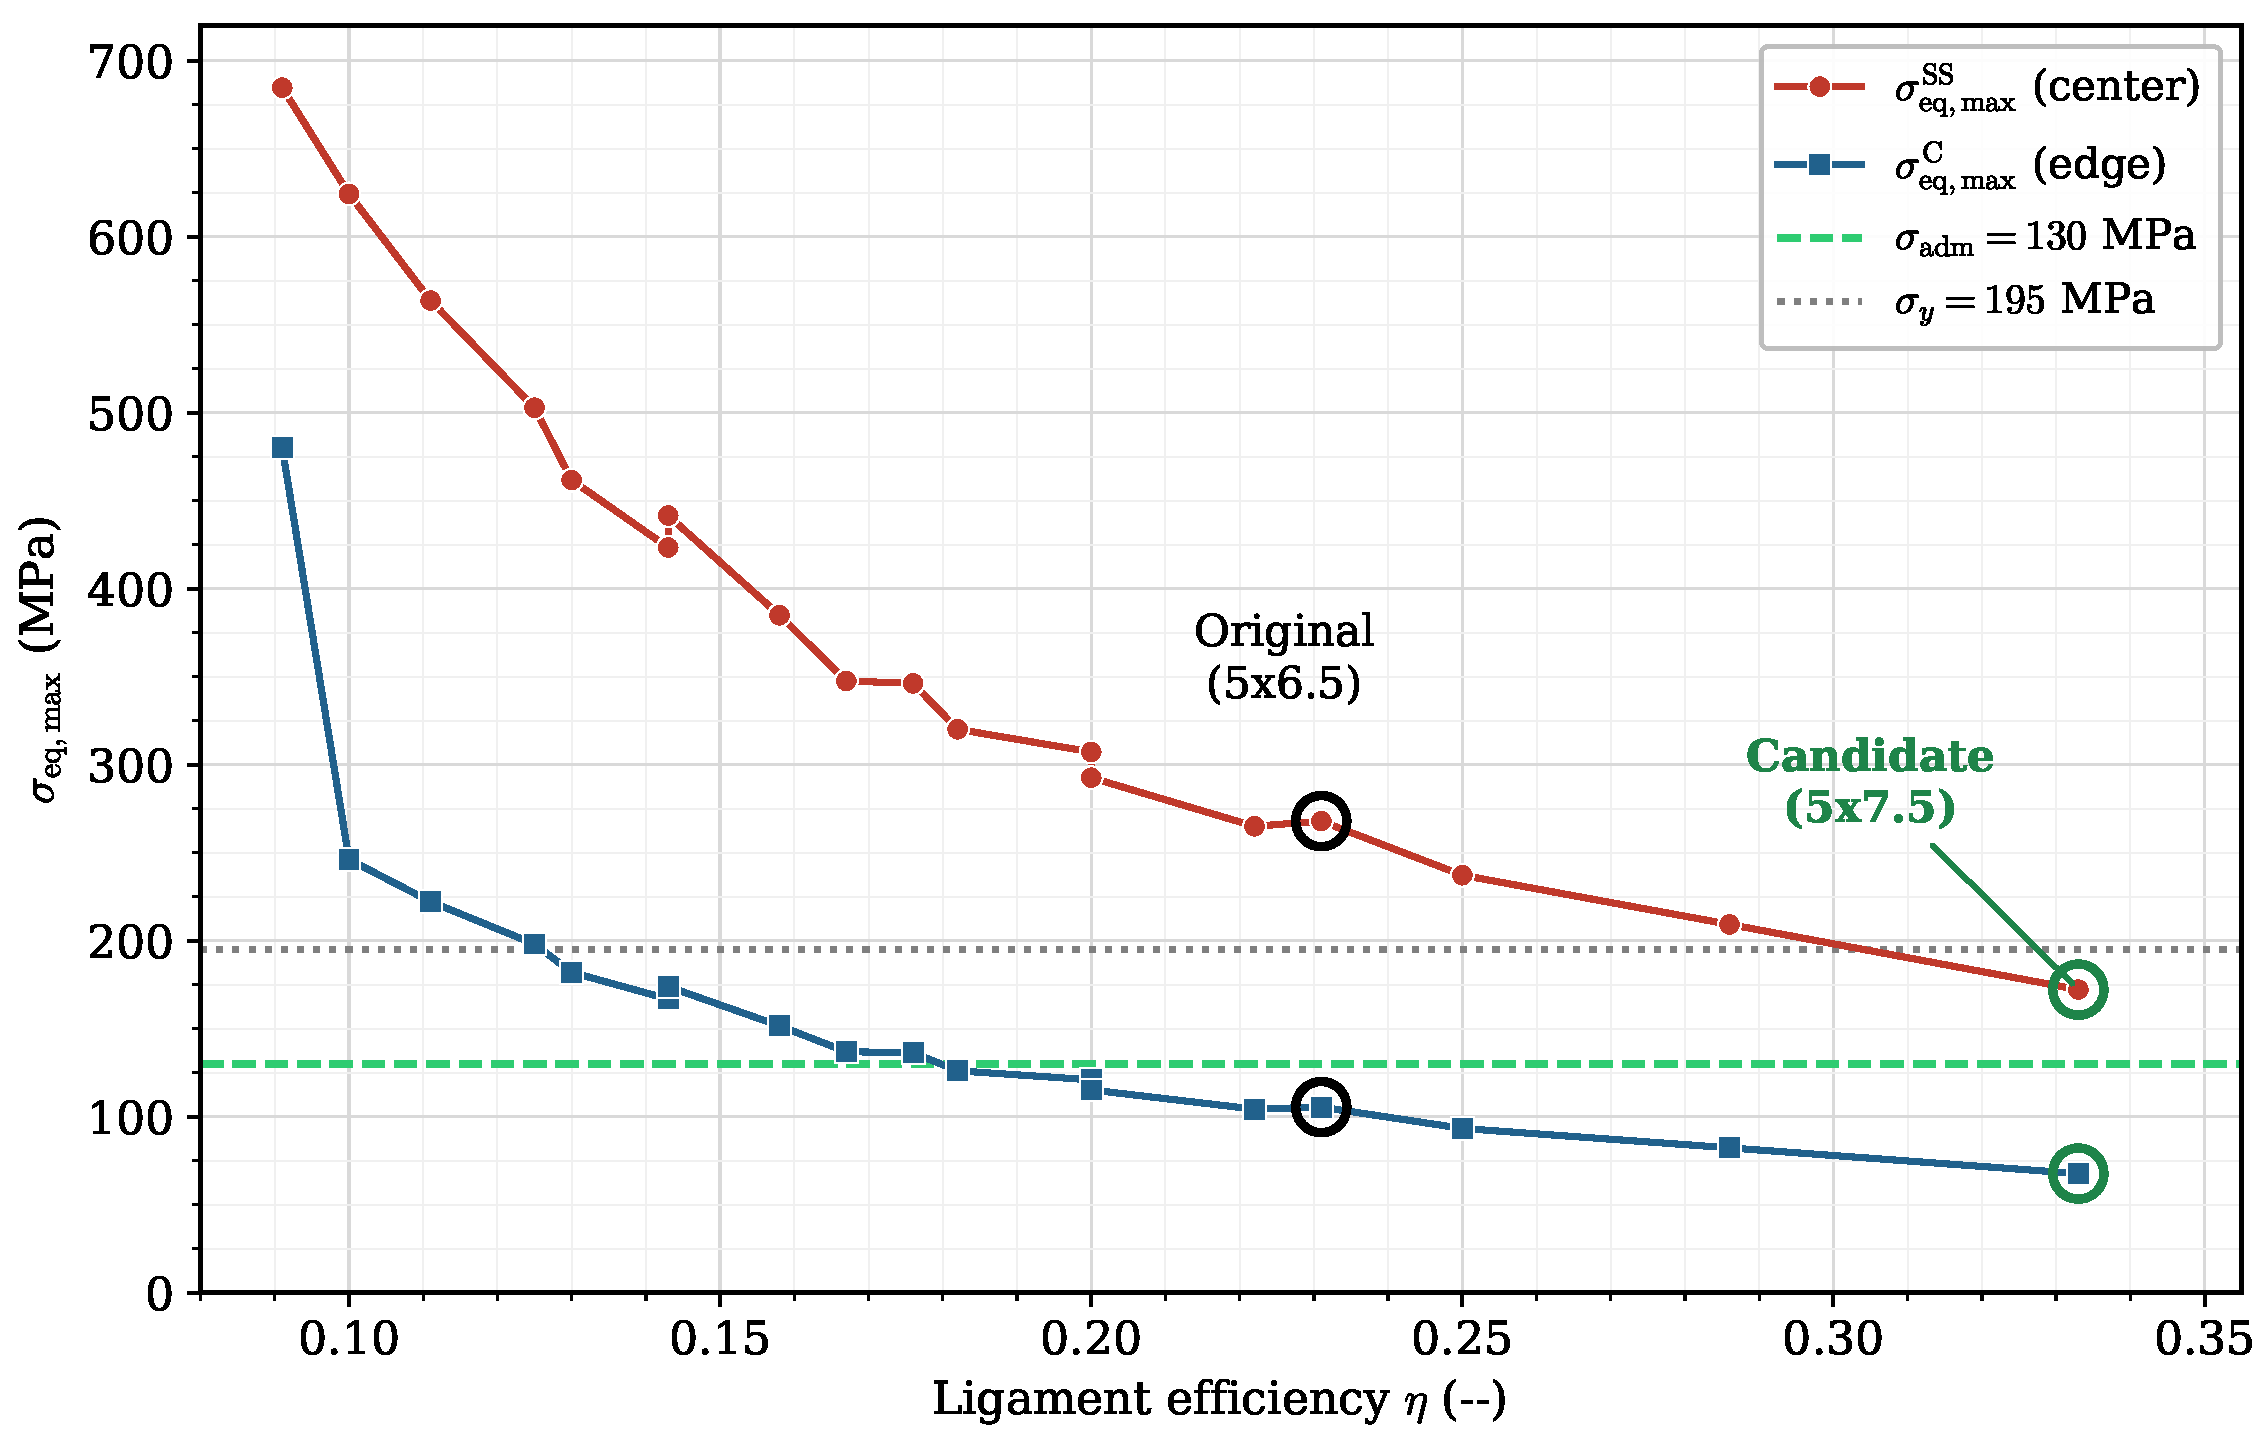
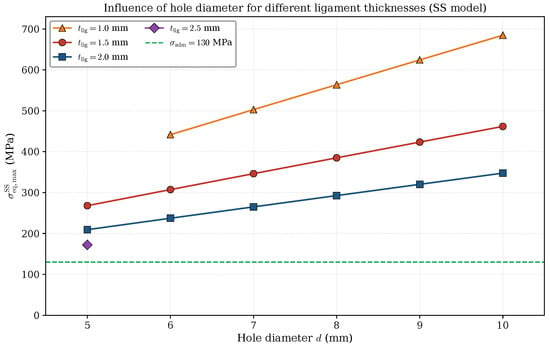
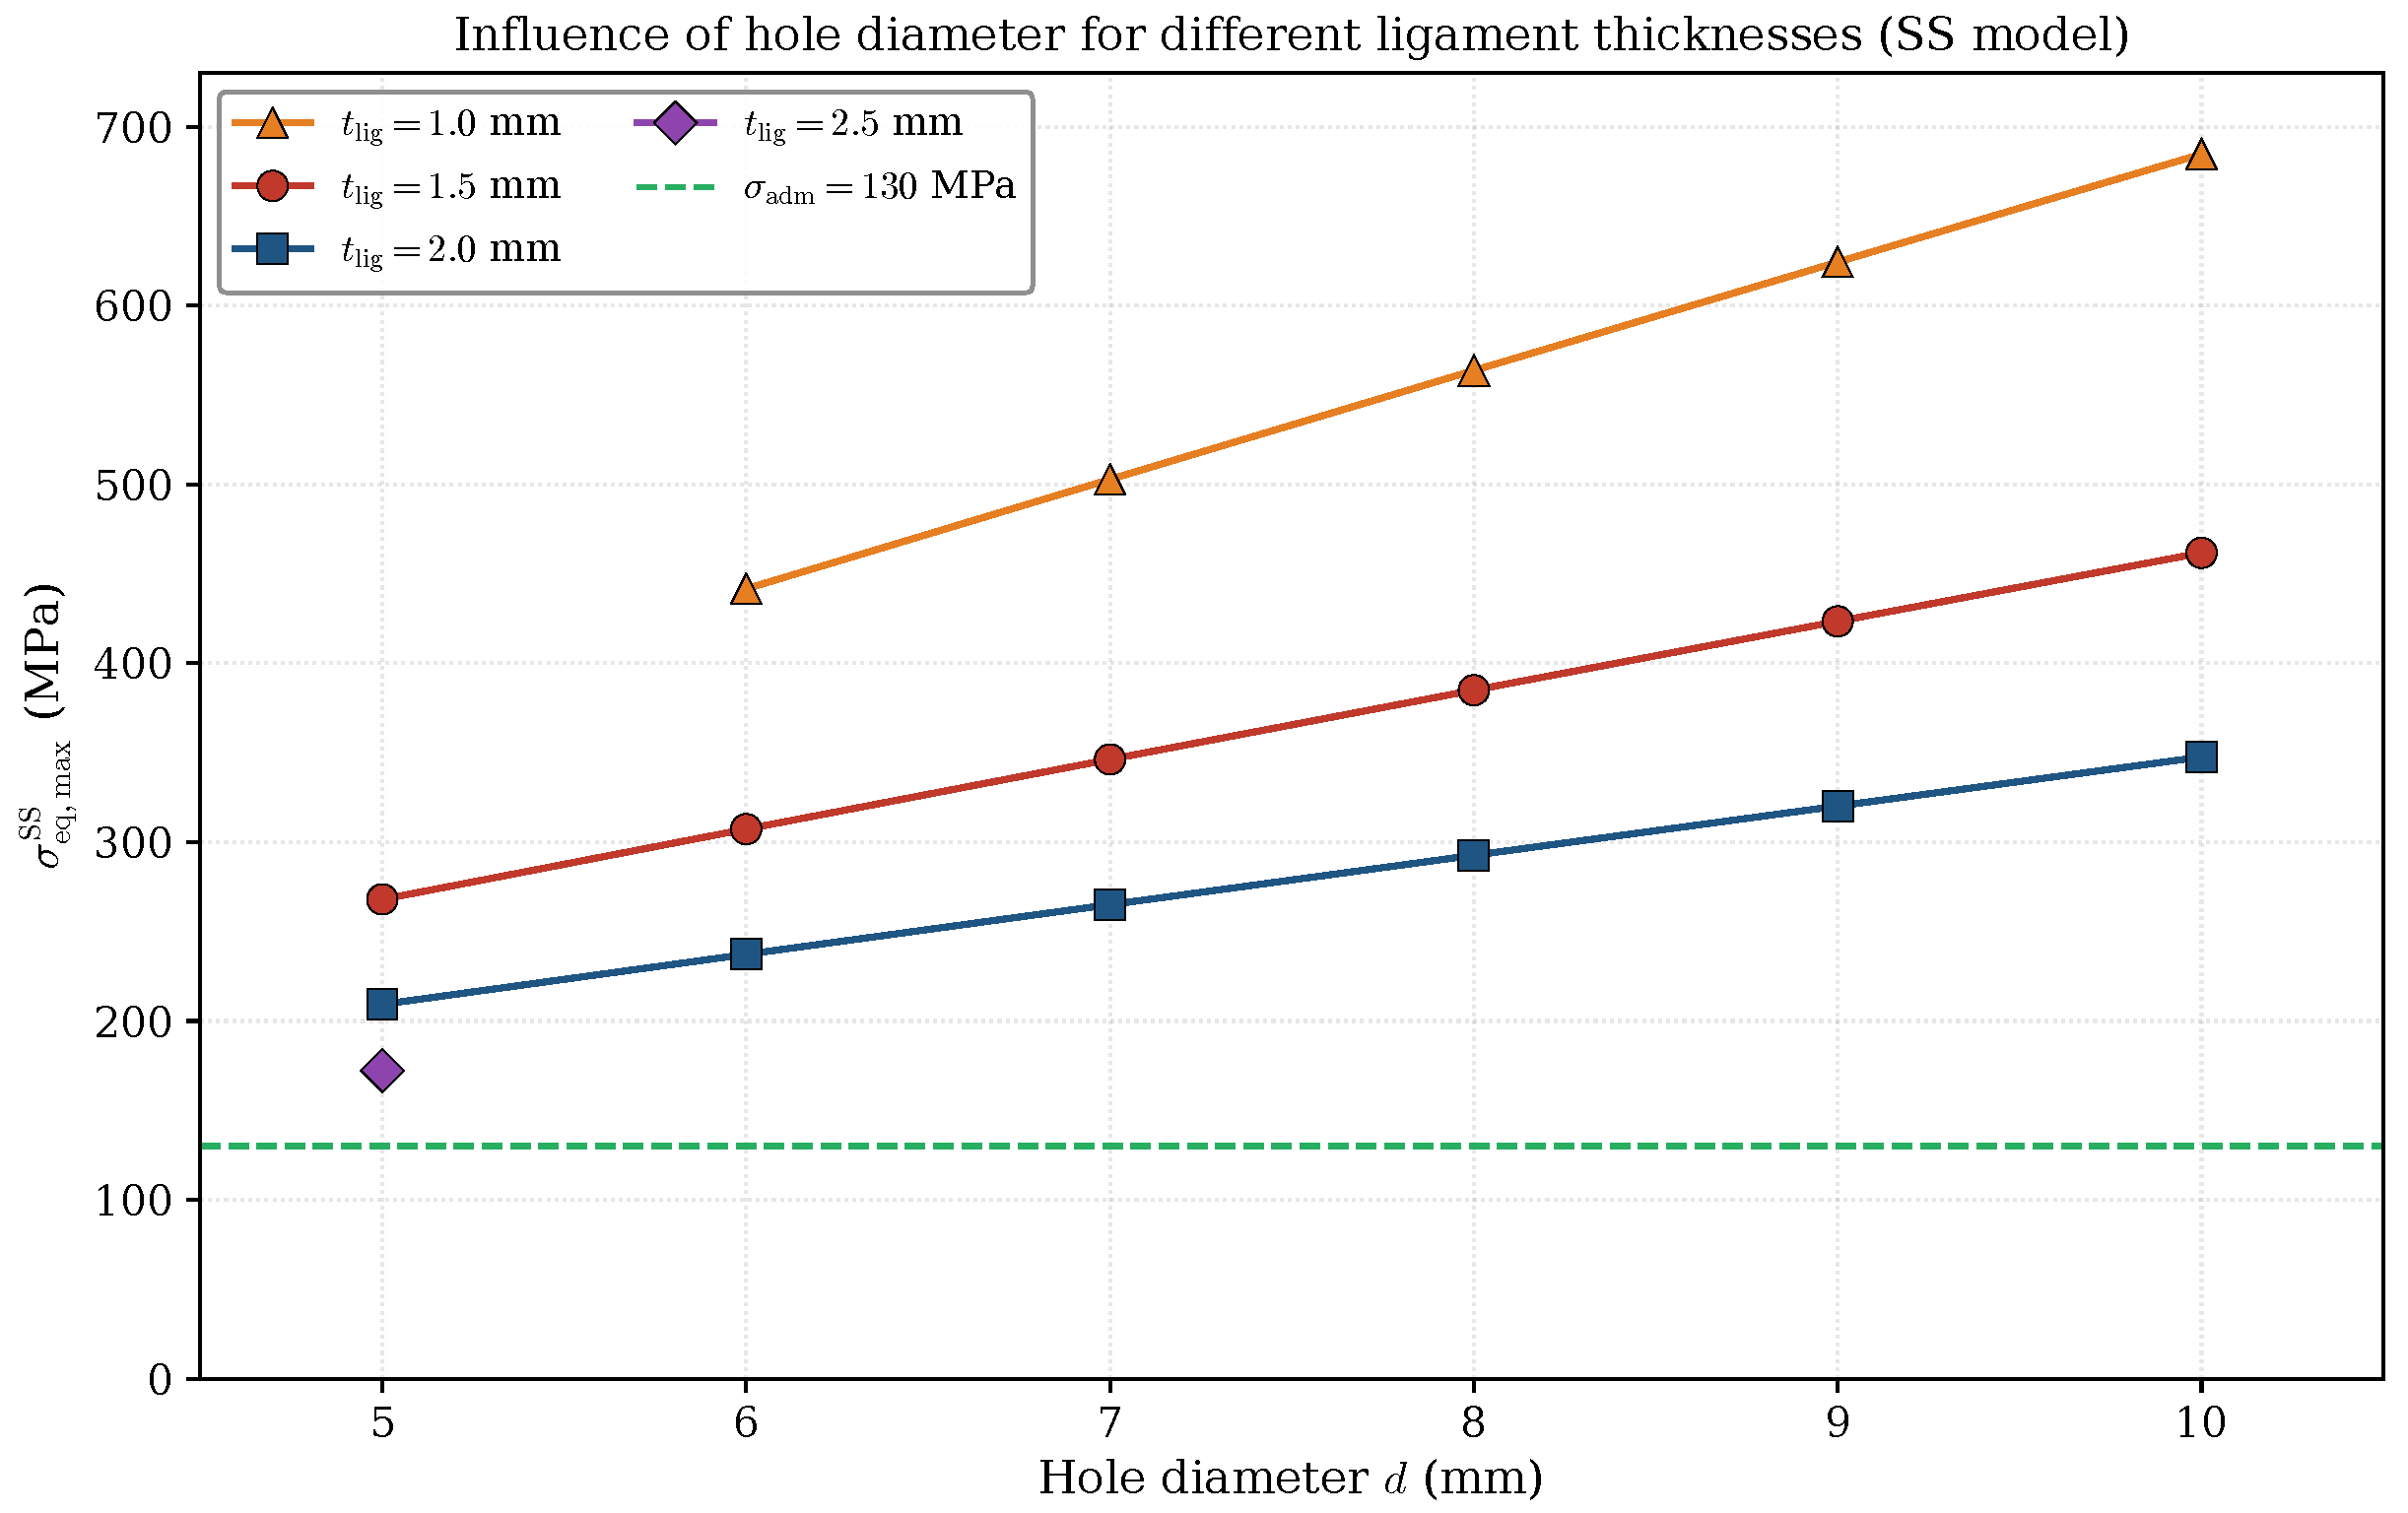
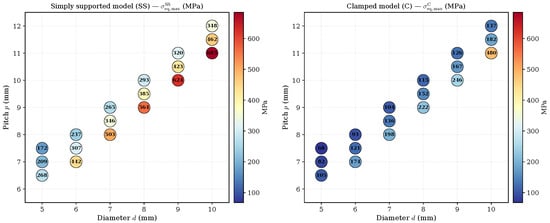
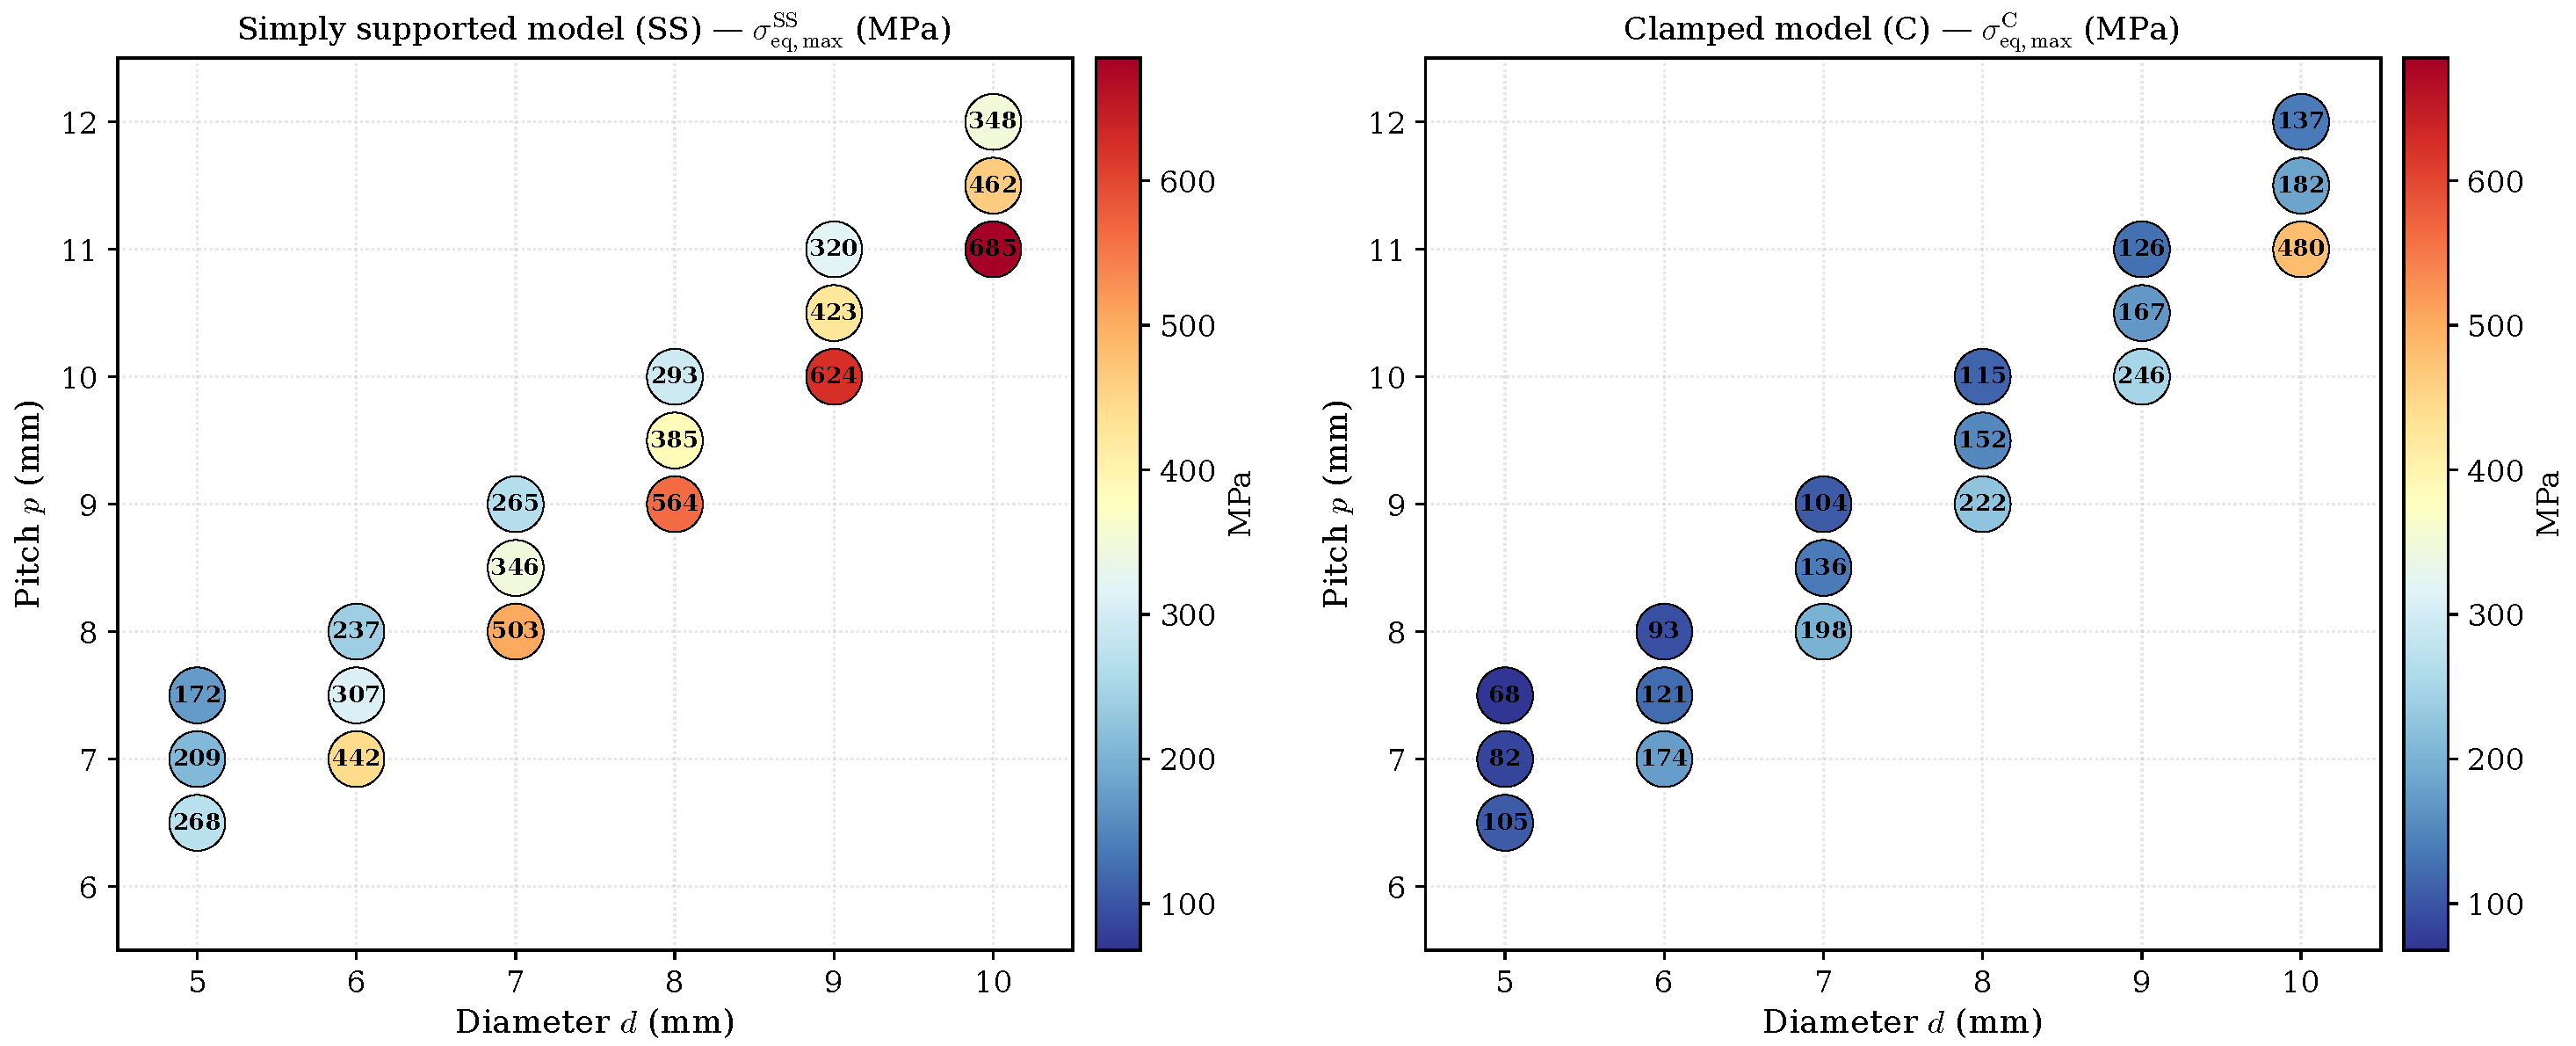
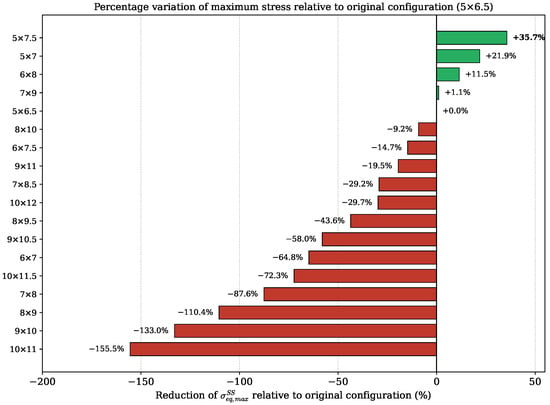
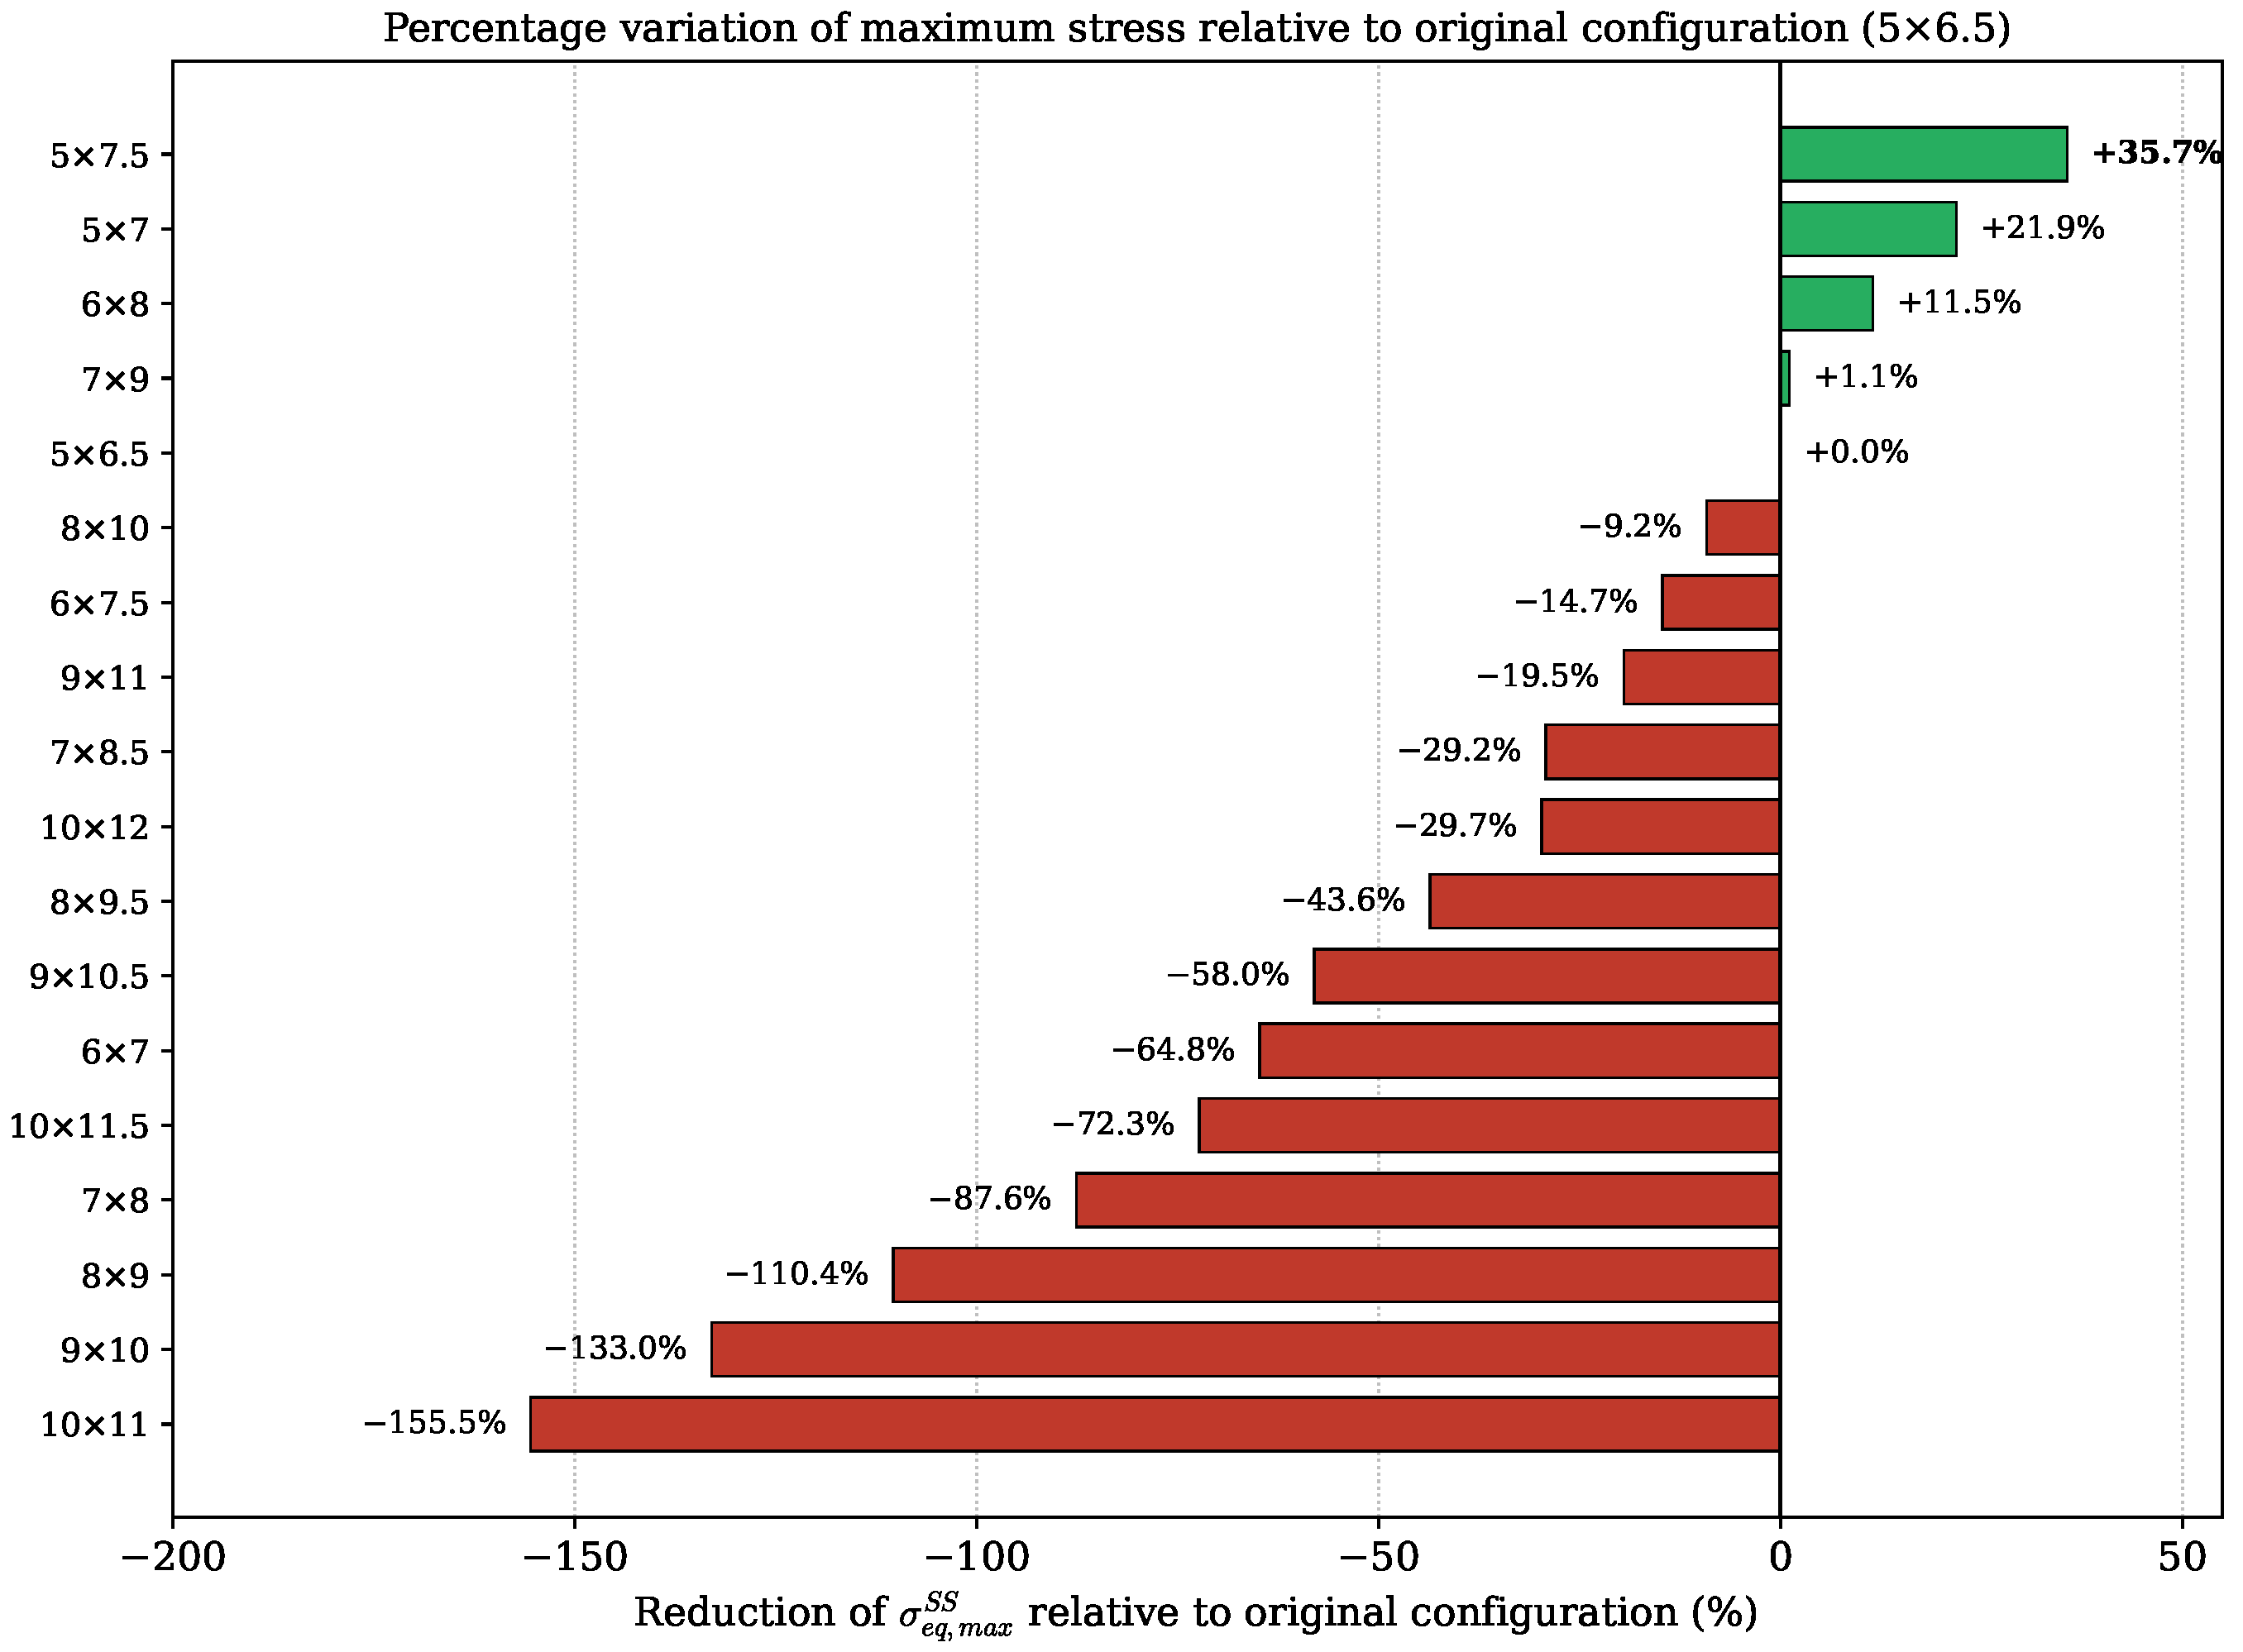
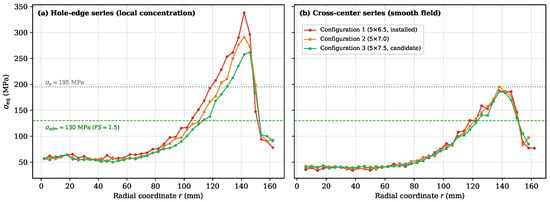
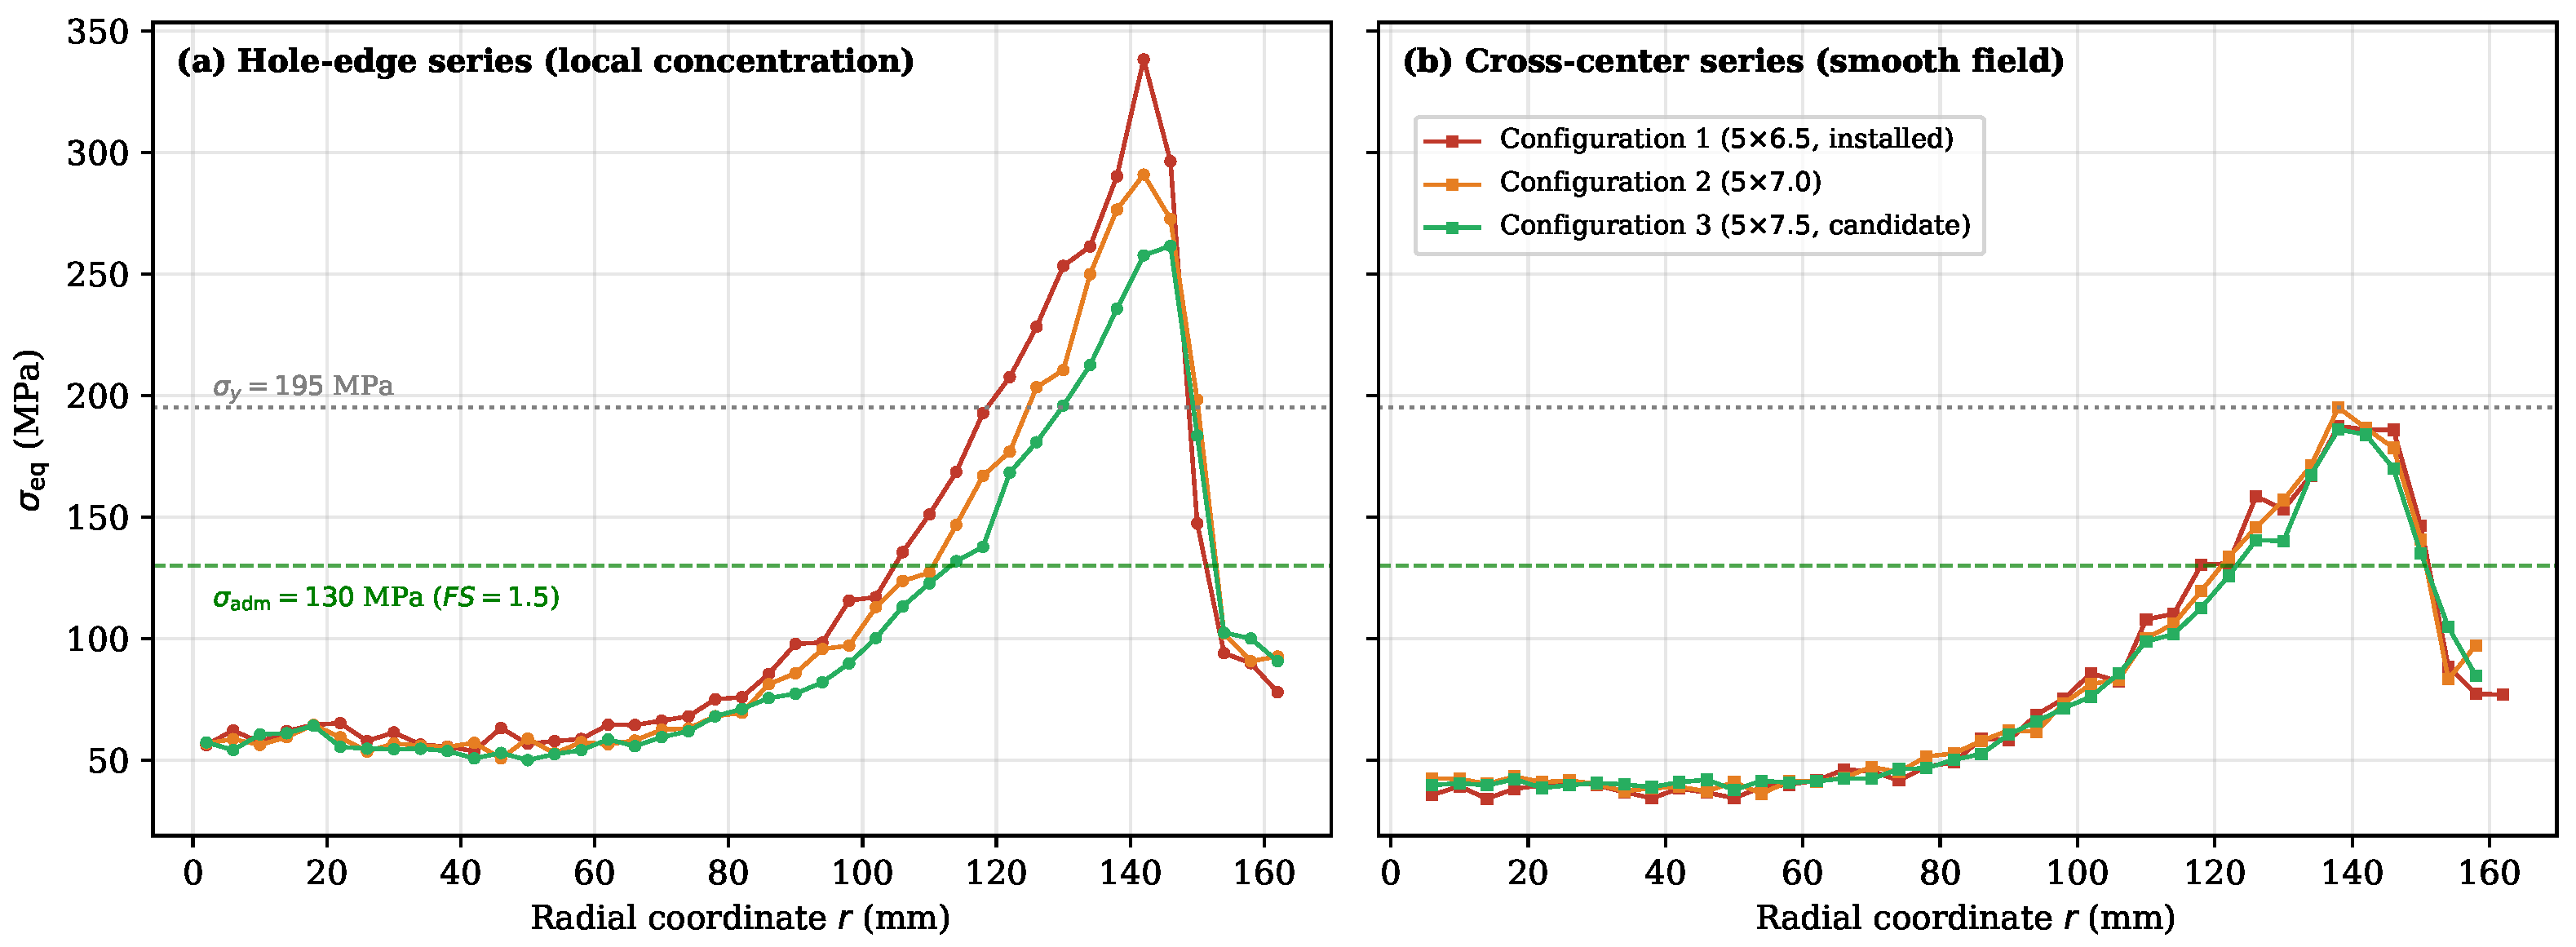
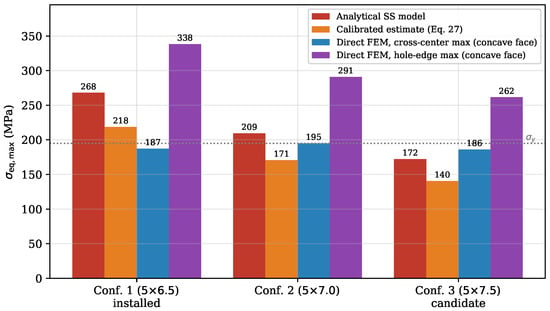
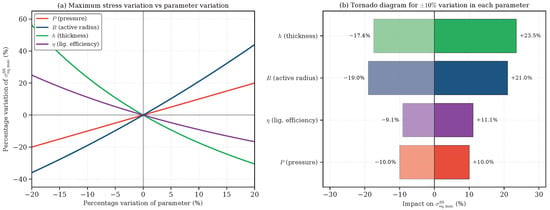

Disclaimer/Publisher’s Note: The statements, opinions and data contained in all publications are solely those of the individual author(s) and contributor(s) and not of MDPI and/or the editor(s). MDPI and/or the editor(s) disclaim responsibility for any injury to people or property resulting from any ideas, methods, instructions or products referred to in the content. |
© 2026 by the authors. Licensee MDPI, Basel, Switzerland. This article is an open access article distributed under the terms and conditions of the Creative Commons Attribution (CC BY) license.