


Abstract
This study presents a novel technological framework that integrates web-based 3D modeling and digital prototyping into interdisciplinary design education. Addressing the gap between traditional theoretical assessment and modern industry demands, the research investigates the implementation of interactive micro-websites and high-fidelity 3D product models as standard deliverables. Using a quasi-experimental design, the proposed digital workflow was tested on 53 final-year graphic design students at the University of Zagreb, divided into three groups based on the end users of their digital prototypes: real industry clients, peers, or academic mentors. The systemic reliability of the technological framework was measured through the technical quality of the final output (grades) analyzed via ANOVA, while user engagement with the digital process was tracked longitudinally. Results indicate that the implemented technological pipeline produced consistently high-quality outputs across all cohorts, with the client-facing group achieving the highest technical scores (M = 4.37; SD = 0.57). The lack of statistically significant variance between groups highlights a “ceiling effect,” demonstrating that the structured digital workflow itself is operationally stable and ensuring top-tier technical performance and prepress accuracy regardless of the evaluator. The study concludes that integrating advanced 3D web technologies and interactive public deliverables into the curriculum provides a scalable, industry-aligned technological model that successfully prepares design engineers for complex professional environments.
1. Introduction
1.1. Problem and Theoretical Framework
In modern higher education, particularly in interdisciplinary fields like design engineering and graphic technology, the rapid evolution of digital tools serves as a pivotal factor shaping academic and professional success. The transition from static 2D deliverables to interactive, web-based 3D prototyping has fundamentally altered industry standards. This shift distinctly aligns with the transition toward the Industry 5.0 and Education 5.0 paradigms, which emphasize not only technological automation but the development of complex, human-centric digital skills and transdisciplinary problem-solving capabilities [1]. Consequently, educational frameworks must adapt by integrating advanced digital workflows to bridge the gap between academic outputs and real-world market expectations [2]. While traditional design education relies heavily on static studio-based learning and iterative feedback [3,4], contemporary pedagogical frameworks increasingly mandate the integration of cloud-based 3D modeling platforms and interactive technologies to fully simulate rigorous industrial environments [5,6].
A significant challenge in this context is the discrepancy between the technological complexity of academic tasks and the demands of professional practice. In the traditional pedagogical model, where the academic mentor acts as the sole evaluator of often static or isolated digital files, students frequently operate within a technological “safe zone.” This environment can lead to a phenomenon akin to the “principle of least effort” [7], a tendency recently re-examined in the context of surface-level digital-tool adoption [8], in which students utilize software capabilities only enough to meet minimal academic criteria. As a result, the generated outcomes—while functionally adequate—frequently fail to exploit the full potential of integrated digital pipelines (e.g., combining advanced 3D product modeling with interactive web development) required for high-fidelity product presentation and prepress accuracy.
In contrast, the rise of advanced digital platforms and cloud-based 3D technologies such as Webflow (latest stable release; Webflow, Inc., San Francisco, CA, USA) and Spline (latest stable release; Spline Inc., San Francisco, CA, USA) has transformed how prototypes are built, showcased, and evaluated, creating unprecedented opportunities for real-time professional engagement and digital public exposure. By turning student deliverables into interactive, public-facing digital products exposed to the scrutiny of real industry clients [9], this contemporary technological environment offers a systemic and scalable solution to the limitations of the traditional classroom. However, the extent to which a structured digital workflow, driven by public exposure and real client evaluation, optimizes technical output and user engagement remains underexplored. Consequently, a vital question arises: can a systematically implemented technological framework, integrating web-based 3D prototyping and direct industry collaboration, effectively elevate the technical quality of academic deliverables and bridge the technological gap between academia and the profession?
1.2. Research Objective
The primary objective of this paper is to empirically evaluate the effectiveness of an integrated technological framework, centered on web-based 3D modeling and interactive digital prototyping, in optimizing the technical quality of academic deliverables. Specifically, the study investigates how different end-user evaluation scenarios (feedback loops) affect students’ engagement with the digital pipeline and the final technical accuracy of their prototypes. The research compares the performance and output quality of this technological model when interactive digital deliverables are presented directly to real industry stakeholders (simulating a complex professional environment), to academic peers, or exclusively to a traditional academic mentor.
1.3. Hypotheses
Based on the literature regarding the integration of industry-aligned digital workflows [10] and the efficacy of high-fidelity prototyping in technical education [11,12], we formulated the following directional hypotheses:
H1.
Prototypes developed within the industry-client evaluation loop will exhibit higher technical accuracy and overall output quality (assessed via final project scores) compared to those developed in peer- or mentor-only academic environments.
H2.
The implementation of interactive, public-facing digital deliverables (3D web models) evaluated by real industry stakeholders will descriptively result in more stable user engagement with the technological pipeline across the project duration (exhibiting a smaller decline in system utilization over time).
H3.
Sustained engagement with the digital prototyping tools will show a positive correlation with the final technical quality of the deliverables and the efficiency of project completion.
1.4. Technological Alignment in Education: From Theoretical Models to Industry-Standard Prototyping
Research indicates that higher education students in technical and design disciplines often struggle to transition from theoretical understanding to advanced practical application [13]. Confronted with traditional academic tasks, many adopt a surface approach to utilizing digital tools [14], acquiring only the basic software competencies required to meet minimum course criteria. Without exposure to complex, real-world digital pipelines, students frequently default to technological underutilization. However, recent empirical studies on project-based learning within cloud-based 3D environments demonstrate that exposing students to interactive, low-code, and no-code platforms significantly increases their practical engagement, effectively helping them navigate the steep learning curves associated with advanced digital deployment [15,16]. Consequently, the “strategic student” prioritizes basic functionality over high-fidelity output [17].
Although cloud-based 3D simulation (Spline) and no-code web deployment (Webflow) are increasingly adopted in professional design practice, the peer-reviewed literature on their pedagogical use remains sparse: existing studies treat low-code and no-code platforms at the category level [8,15,18] or examine adjacent web-based 3D environments such as WebVR laboratories [16], but none empirically evaluate a structured curriculum built specifically around the Spline–Webflow pipeline. The present study, therefore, addresses not only an underexamined evaluation design but also an underexamined toolchain, contributing one of the first controlled accounts of how these specific platforms function as an integrated instructional pipeline.
To bridge the gap between academia and industry standards, the educational framework must shift from isolated software instruction to the implementation of integrated digital workflows. In contemporary design engineering, external factors such as industry validation and the requirement for public-facing digital portfolios act as primary drivers for technological mastery [19].
To facilitate this transition, the role of the academic environment must evolve. The educator acts as a technical project manager, responsible for structuring the digital pipeline. Recent literature confirms that leveraging cloud-based collaborative software and no-code web deployment tools (e.g., Spline and Webflow) shifts the pedagogical focus from isolated software mechanics to holistic, industry-standard product development and real-time interactive validation [8,18]. This requires designing a robust technological infrastructure that supports iterative testing and real-time digital rendering, effectively preparing students for complex professional environments. Contemporary research highlights that integrating Challenge-Based Learning (CBL) and agile methodologies (such as Scrum) into engineering education acts as a critical enabler for mastering modern Industry 4.0 and 5.0 technologies [20]. By structuring our nine-phase digital pipeline around iterative validation loops and real-world corporate briefs, the course effectively emulates an agile, challenge-based digital rollout standard in modern no-code web development and 3D prototyping.
Furthermore, the implementation of Authentic Technological Assessment [21] posits that engagement with software tools increases significantly when tasks mirror real-world industry challenges. We posit that the requirement for public digital deployment—where student prototypes are published as interactive deliverables on professional networks and official institutional channels—acts as a catalyst for technical rigor and structural accuracy. In this context, digital visibility creates a layer of professional accountability. This visibility challenges traditional, closed-loop institutional evaluations [9], effectively transforming the assignment from a static academic file into a dynamic demonstration of technical competence.
This is where the integration of industry-stakeholder evaluation becomes a critical mechanism. The pressure of presenting a fully functional, web-based 3D prototype to real corporate clients necessitates a higher degree of technical precision, prepress accuracy, and digital troubleshooting [22]. We hypothesize that students are significantly more engaged in optimizing the technical quality of their digital models when they know their deliverables must perform flawlessly in front of industry experts. In this context, the digital pipeline acts as a bridge: It transforms an isolated academic exercise into a professional technological rollout. Providing students with real-world corporate briefs and requiring high-fidelity interactive solutions creates an advanced testing environment. Ultimately, this approach successfully aligns academic outputs with cutting-edge industry standards [23,24].
1.5. Digital Product Rollout and Industry Validation
In contemporary technical and design education, the role of the educator has evolved significantly, closely resembling that of a technical project manager. Rather than merely transmitting theoretical knowledge, the course leader defines the software workflows, assigns roles, and provides continuous troubleshooting throughout the prototyping process. In projects involving external industry partners, the educator oversees the entire technological pipeline, ensuring that the students’ output aligns strictly with the client’s technical specifications. In such a structured system, the operational success of the project falls heavily on the established framework. Consequently, the students’ engagement with the digital tools and the technical accuracy of their final 3D prototypes are direct reflections of the highly structured digital environment and systemic workflow established by the course leader.
Within this managed technological system, the deployment of interactive digital models serves as a critical optimization tool. While earlier pedagogical theories focused on isolated, offline task execution [6], contemporary models of engineering education emphasize that subjecting digital deliverables to live industry validation significantly enhances complex technological problem-solving [25]. In the context of design engineering, presenting a fully functional, web-based prototype simulates a real-world product rollout. While internal mentor evaluation operates within the safe “sandbox” of a local academic network, public and client-facing deployment requires the digital product to function flawlessly under real-world constraints (e.g., cross-platform responsiveness, interactive 3D rendering fidelity, and structural prepress accuracy). Biggs and Tang [26] argue that introducing this element of real-world operational reality is precisely what transforms basic software utilization into advanced technological mastery.
Therefore, this study explores how integrating varying levels of end-user validation (client-inclusive, peer-inclusive, or mentor-only) affects students’ sustained engagement with the digital pipeline and the technical performance of their final outputs. While the technical mentor supervises the system architecture throughout the semester, the underlying premise is that requiring students to deploy their work as interactive, public-facing deliverables for real industry stakeholders forces a significantly higher degree of digital optimization and technical rigor than traditional, closed-loop academic evaluations.
1.6. Technological Evaluation Framework: Adapting Schwinger’s Metrics for Digital Engagement
The analytical foundation for measuring student interaction with the implemented digital workflow is adapted from the behavioral framework proposed by Schwinger et al. [22]. While originally designed to assess general academic motivation, for the purposes of this technological study, these eight key strategies have been recontextualized to evaluate the drivers of user engagement, system adoption, and technical optimization under varying levels of deployment pressure. This reframing from motivational psychology to technology-mediated engineering workflows establishes a solid theoretical bridge with prominent technology adoption frameworks, most notably the Technology Acceptance Model (TAM) and the Unified Theory of Acceptance and Use of Technology (UTAUT) [27,28]. Within the TAM architecture, system adoption and sustained utilization are heavily dictated by perceived usefulness and perceived ease of use. In this study, Schwinger’s strategies are conceptualized as the active cognitive and metacognitive mechanisms that users deploy to maintain these perceptions when navigating a complex, multi-phased digital pipeline. Rather than viewing technology acceptance as a passive or static state, this integrated framework treats adoption as an active motivational regulation process required to master and optimize advanced software environments (e.g., Spline, Webflow). Consequently, the eight original dimensions have been systematically operationalized to track digital engagement as follows:
- Task-Oriented System Utilization (Achievement-driven): The drive to successfully execute the required digital workflow and deploy a fully functional 3D prototype.
- Industry Validation-Seeking (Recognition-seeking): The utilization of software tools driven by the desire for external approval and compliance with real-world client standards.
- Technical Competence Acquisition (Competence-building): An intrinsic focus on mastering the digital tools (e.g., 3D modeling, web integration) and expanding technical skill sets.
- Autonomous Troubleshooting (Autonomy-supportive): Self-directed navigation of the software environment, taking ownership of the digital architecture, and independent problem-solving.
- Collaborative Network Integration (Social-affiliative): Engagement stemming from peer-to-peer technical support, shared digital asset management, and collaborative debugging.
- Iterative System Optimization (Feedback-responsive): The reliance on continuous technical critiques to iteratively refine, debug, and upgrade the digital model.
- Outcome-Driven Engagement (Reward-sensitive): Software utilization driven by extrinsic professional incentives, such as securing a portfolio-ready digital product or direct industry employment.
- Error-Avoidance Optimization (Avoidance-oriented): Rigorous prepress checking, software testing, and quality assurance driven by the necessity to prevent functional failures, system crashes, or technical embarrassment during live client deployment.
1.7. Gap Analysis: Bridging Academic Frameworks and Industry-Standard Deployment
Preliminary observations in design engineering and technology education reveal that traditional academic metrics, such as theoretical grading, are frequently insufficient for driving advanced technological mastery. In contemporary technical industries, professional competence and employability are evaluated primarily through the operational quality and complexity of deployed digital prototypes, rather than static academic transcripts [29]. Because students often operate within closed academic systems where they can selectively curate their outputs, they frequently underutilize advanced software capabilities (e.g., interactive 3D web integration), investing only the minimum technical effort required to pass if the project is not slated for real-world deployment.
For students aiming for true technological proficiency, this industry-facing deployment acts as a powerful catalyst for rigorous software testing, debugging, and system optimization. When universities facilitate this level of technological exposure, they provide significant professional alignment. Conversely, within traditional, closed-loop academic systems, where students may be motivated solely by basic credentialing rather than advanced skill acquisition, the lack of external technological validation often results in a surface-level application of digital tools [30].
The existing literature extensively covers internal academic evaluation methods, such as peer-reviewed processes [31,32] and internal technical mentorship [33]. However, there is a critical lack of controlled empirical studies directly comparing the efficacy of an integrated digital workflow when tested against a real corporate client’s technical specifications versus a standard academic audience within the same curriculum. While most research on industry collaboration relies on qualitative case studies, this research offers a quantitative comparison of a digital pipeline across three distinct deployment conditions, aiming to definitively bridge the technological gap between academic “safe zones” and rigorous professional market demands [34].
Consequently, the primary technological contribution of this study is the development, design, and empirical evaluation of a scalable digital pipeline architecture. Rather than focusing exclusively on pedagogical outcomes, this research treats the academic environment as a rigorous technological testbed. The study evaluates the systemic reliability, system integration logic, and deployment efficiency of combining real-time 3D material simulation (Spline) with cloud-based, no-code web deployment platforms (Webflow). By proposing this structured, nine-phase technological framework, the study provides a novel blueprint for digital prototyping systems, demonstrating how high-fidelity visual architectures can be systematically developed, managed, and deployed in high-pressure, client-facing environments.
2. Materials and Methods
2.1. Participants and Context
The study involved final-year graduate students enrolled in the graphic engineering and design program at the University of Zagreb Faculty of Graphic Arts (N = 53). This cohort, serving as the primary user base for testing the proposed digital workflow, consisted of 83.8% female and 16.2% male participants, with an average age of 24 years. The research was conducted over a 15-week longitudinal deployment phase within a capstone course focused on advanced packaging engineering, 3D product prototyping, and the integration of interactive visual systems.
2.2. Research Design
A quasi-experimental design was implemented to evaluate the impact of different deployment environments (end-user validation loops) on student engagement with the digital pipeline and the final technical accuracy of their prototypes. Prior to the project rollout, all participants completed a baseline technical assessment evaluating their initial software proficiency, prior industry experience, and readiness to adopt new digital workflows. Based on these baseline digital readiness scores, the cohort was stratified with the intention of an even distribution of technical capabilities across three distinct deployment conditions.
However, following standard data validation (accounting for incomplete data logs and initial course dropouts), the final analyzed sample consisted of 53 users who successfully completed all longitudinal engagement tracking (surveys) across the 15-week period. These participants were distributed into slightly unequal group sizes: a Client-facing deployment group (Group A, n = 20), a Peer-facing review group (Group B, n = 18), and a Mentor-only internal evaluation group (Group C, n = 15). To explicitly clarify how this sample composition dictated the statistical procedures: The full dataset of N = 53 participants was utilized for all statistical analyses regarding User Engagement Dynamics (including the engagement scores across examination sessions), as all 53 students successfully completed the longitudinal engagement surveys regardless of their final project outcome. Conversely, the analysis of Final Technical Performance (the system scores) was exclusively limited to the n = 42 students who successfully completed and deployed their functional prototypes. The 11 students who ‘Did Not Pass/Postponed’ (as detailed later in Section 3.8) were excluded from the performance analyses, as their lack of a final deliverable precluded objective evaluation using the technical rubric. To account for the minor sample variances across groups, methodological safeguards were incorporated into the statistical architecture to ensure that the uneven distribution did not compromise the validity of the ANOVA results. The inclusion of a peer-review loop is supported by literature emphasizing that collaborative debugging and peer-to-peer technical evaluation in higher education can significantly enhance digital learning environments and system accountability [35].
Participants were assigned one of four specific technical briefs. Two briefs required the development of prototypes based on strict corporate specifications provided by an external industry client, the Fortenova Group, which consented to the technical implementation of these projects (structural and visual redesigns for “Sky Cola” beverage packaging or “Sljeme” meat packaging). The remaining two tasks served as internal academic benchmarks (e.g., conceptualizing interactive promotional materials for the Faculty of Graphic Arts or redesigning a Croatian product of their choice). Because the Group A validation loop fundamentally required a live deployment and pitch to industry executives, it was methodologically imperative that all participants in this Client-facing cohort were exclusively assigned the corporate-sponsored briefs (Fortenova Group). However, to ensure that the inherent complexity of a corporate specification did not act as an unmeasured confounder, a proportion of the corporate briefs was purposefully distributed into the Peer-facing (Group B) and Mentor-only (Group C) cohorts. This cross-distribution allows the study to isolate the psychological pressure of the evaluative environment (the live client presence) from the technical difficulty of the task itself. The exact cross-tabulation of assigned briefs across the three deployment groups is detailed in Table 1.
Table 1.
Cross-tabulation of assigned technical briefs across the experimental deployment cohorts.
To clarify the operational dynamics of this partnership, the industry representatives (Fortenova Group) were involved at three distinct touchpoints, simulating a realistic client–agency workflow. First, they conducted an initial briefing session at the start of the semester to present the commercial brief and answer preliminary questions. Second, during the iterative development phases, direct client-student contact was restricted to simulate professional communication protocols; instead, the course instructor acted as an intermediary, collecting aggregated student queries and routing them to the client to provide asynchronous, structured feedback. Finally, the corporate representatives returned for the final evaluation stage (Phase 9), acting as industry gatekeepers during the live pitch to assess whether the deployable prototypes met their commercial standards.
To enhance the readability and practical applicability of this quasi-experimental framework, the comprehensive technical architecture and the progression through the 9-phase digital pipeline spanning the 15-week deployment are visually operationalized in Figure 1.
Figure 1.
Schematic overview of the proposed 9-phase digital pipeline across the macro-phases of preparation, development, and validation.
As delineated in Figure 1, the pipeline is operationalized across three macro-phases: Preparation, Development, and Validation.
As a mechanism for enforcing mid-project technical standards, prototypes that achieved high technical clearance (graded “Very Good” or “Excellent”) during intermediate system checks (Phases 5 and 6) were routed for advanced prepress integration and physical fabrication. This high-fidelity production support was provided by an external industry partner (Kaligraf d.o.o., Zagreb), which consented to being acknowledged in this study, simulating a real-world manufacturing handover.
At the conclusion of the digital pipeline, all successfully completed interactive 3D models developed by the public-facing cohorts (specifically, every prototype that achieved technical clearance, excluding those that were postponed or did not pass) were deployed on a dedicated cloud-based platform (dogp.webflow.io). It is important to note that the platform hosted the complete set of passing deliverables rather than a curated selection of top-performing examples, effectively transforming all functional local academic files into publicly accessible digital assets.
2.3. Data Collection and Operational Metrics
To accurately capture the dynamics of user engagement and technical performance throughout the digital pipeline, the data collection process was structured around key operational milestones.
2.3.1. Procedure and Assessment Timeline
- Baseline Technical Assessment (Project Launch): The initial phase evaluated participants’ fundamental design engineering knowledge and prior industry experience. Crucially, this baseline served as the foundational metric for ensuring an even distribution of technical readiness across the three experimental cohorts.
- Environment Configuration and Cohort Allocation: Based on the baseline assessment, the Technical Lead (Principal Investigator) assigned specific technical briefs and allocated participants into one of the three validation scenarios (client-facing, peer-review, or internal-only). This controlled distribution ensured that initial engagement potential was balanced across all experimental conditions.
- Initial Impact Analysis: A follow-up assessment was conducted immediately after cohort allocation to measure immediate shifts in user readiness triggered by the specific requirements of the assigned deployment environment.
At the commencement of the project, all participants signed a formal GDPR Data Processing Agreement provided by the University of Zagreb Faculty of Graphic Arts, explicitly consenting to the processing and public deployment of their digital deliverables. Regarding the administration of the engagement surveys, the procedure aligned with standard institutional practices, as course evaluations are regularly conducted at the faculty every semester. Prior to signing the course agreements, students were thoroughly briefed on longitudinal engagement tracking and provided their informed consent to participate. They were assured that the administration of the survey strictly followed institutional ethical protocols, all data would be fully pseudonimized prior to analysis, and their responses would have no impact whatsoever on their academic grading.
To maintain the integrity of the longitudinal data, the final sample analyzed (N = 53) consists exclusively of users who completed the entire lifecycle of the data collection process. Participants who reached the final deployment phase but failed to complete all intermediate data logs were excluded from the final dataset to ensure the high fidelity of the longitudinal analysis.
2.3.2. Measurement Tools
- System Engagement Metrics: An adapted scale based on the behavioral strategies proposed by Schwinger et al. [22]. This tool was utilized longitudinally (start, middle, and end of the 15-week deployment) to track fluctuations in user interaction with the digital workflow. Prior to deployment, the instrument underwent a rigorous internal validation process. Content and face validity were established through an internal expert review panel comprising the four study authors—all domain specialists with extensive historical experience teaching this exact capstone course and working with this specific student demographic. This internal panel systematically reviewed item phrasing to ensure the behavioral metrics accurately translated to the specific context of technology-mediated engineering workflows. Additionally, the adaptation was formatively guided by qualitative feedback regarding course motivation and technical bottlenecks gathered from the previous year’s student cohort, ensuring high ecological validity. Finally, internal consistency was formally evaluated for each dimension across the longitudinal waves of data collection. The overall survey instrument comprised a total of 25 items, with each of the eight engagement dimensions being assessed by a subscale of 3 to 4 specific items. The overall instrument demonstrated excellent internal consistency, with a total Cronbach’s alpha (α) ranging between 0.90 and 0.91 across all measurement windows. The primary multi-item subscales demonstrated robust reliability, with coefficients consistently ranging between 0.74 and 0.91, safely exceeding or aligning with standard psychometric validation thresholds.
- Output Performance Indicators: Technical success was quantified using two primary metrics:
- Technical Quality Score: Representing the final evaluation of the prototype’s functional and visual integrity (see Section 3.5).
- Workflow Throughput: Measured as “Time to Completion” (categorized as Early vs. Late Session), reflecting the operational efficiency of the user within the technological framework.
2.4. Integrated Digital Workflow and Technical Validation Metrics
To ensure the systematic development of high-fidelity digital prototypes and their successful deployment for public visibility, the project was structured around a rigorous pipeline consisting of nine mandatory developmental phases. Regardless of the assigned validation environment (client, peer, or internal), all participants followed a standardized technical workflow. The operational deadline was set at the conclusion of the 15-week cycle, with a complete system rollout being a strict prerequisite for technical clearance.
The developmental phases were distributed across the following workflow:
- System Requirements and Product Analysis: Definition of technical and market constraints.
- Strategic Research Implementation: Data-driven foundation for the structural solution.
- Visual Identity and Asset Development: Engineering the brand story and core visual assets.
- Packaging Conceptualization: Initial structural and functional framework.
- Technical Packaging Design: Finalizing die-lines and structural layout.
- Information Architecture and Brand Extensions: Scaling the visual system across multiple SKUs.
- 3D Modeling and Material Simulation (Spline): Real-time 3D rendering of the physical product volume.
- Physical/Digital Mockup Creation: Fabrication of high-fidelity structural prototypes.
- Web Integration and Deployment (Webflow and Spline): Development of interactive micro-websites for digital product rollout.
2.5. Performance Evaluation and Validation Criteria
To ensure an objective and multifaceted assessment of the final output, the System Performance Score (formerly Final Grade) was calculated as a cumulative metric based on the following technical and functional criteria:
- High-Fidelity Prototype (Technical Integrity): Validation of the structural prototype’s functionality, physical ergonomics, and rigorous prepress preparation (print-ready accuracy).
- Professional Deployment and Communication: Evaluation of the technical delivery, pitching efficiency, and communication clarity during the live rollout before the assigned audience.
- Cumulative Pipeline Performance: Derived from the nine mandatory phases, categorized into two distinct dimensions (see Appendix A):
- Technical and Structural Dimension (Phases 1, 2, 7, and 9): Assessment of the high-fidelity packaging prototype, structural protection, physical ergonomics, and prepress (print) preparation.
- Design Logic and Functional Dimension (Phases 3, 4, 5, 6, and 8): Evaluation of the prototype’s alignment with the technical brief, problem-solving efficacy, and the efficiency of visual communication toward the target user group.
- Systemic Consistency: Assessment of structural and visual coherence across three distinct product extensions.
- Conceptual Framework: Evaluation of the originality and relevance of the proposed technological solution.
- Data-Driven Visualization: Validation of how effectively the final technical realization applied the conclusions drawn from the initial research phase.
- Overall Functional Impression: The general communicative impact and operational harmony of the final digital asset.
Regarding the calculation of the System Performance Score, each of the defined criteria contributed equally to the final aggregate score. The final performance metric was calculated as an unweighted arithmetic mean of all the individual dimensions (High-Fidelity Prototype, Professional Deployment, Cumulative Pipeline Performance, Systemic Consistency, Conceptual Framework, Data-Driven Visualization, and Overall Functional Impression). This equally weighted approach ensures a holistic evaluation where both technical prepress accuracy and functional design logic are deemed essential for a successful professional-grade deliverable.
It is crucial to emphasize that the evaluation framework was intentionally designed around a mastery-based assessment paradigm rather than a normative distribution (bell curve). Because the capstone objective is to produce a deployable, production-ready 3D web prototype, the rubric prioritizes absolute technical thresholds over artificial academic variance. In a professional pipeline, a 3D model either renders flawlessly across browsers or it crashes; the structural prepress is either manufacturable or it fails. Consequently, the rubric was not designed to artificially maximize statistical variance among top-performing graduate students by penalizing minor aesthetic deviations, but rather to rigorously verify professional competence. The high concentration of near-maximum scores (the observed ceiling effect), therefore, reflects the systemic success of the 9-phase pipeline in pushing the majority of the cohort across this strict professional threshold, rather than a lack of psychometric sensitivity. While we interpret this distribution as a potential ‘ceiling effect’ indicating that the majority of students achieved professional-grade mastery, it is important to consider alternative explanations. Specifically, the limited score variability may also reflect the design of the assessment rubric itself, which was structured as a criterion-referenced mastery scale rather than a normative-referenced scale. Consequently, the rubric may have lacked the necessary sensitivity to differentiate between high-performing graduate students, thereby compressing the final score distribution.
2.6. Evaluator Reliability and Bias Mitigation
It is important to note a methodological constraint regarding the evaluation process: the technical lead of the course concurrently served as the primary researcher and the final system evaluator. We acknowledge this dual role as a potential source of evaluator bias. To ensure the objectivity of the ‘System Performance Score’ (the primary dependent variable), several mitigation strategies were employed.
First, the evaluation was not based on subjective aesthetic preference, but rather on a strictly predefined, standardized scoring rubric and technical checklist. This rubric, comprising the exact metrics detailed in Section 2.5 (e.g., structural integrity, prepress accuracy, pipeline performance), was developed and transparently communicated to all participants prior to the commencement of the project. Second, the evaluation of the design component itself was strictly criterion-referenced: it was assessed based on the students’ documented analytical process, the alignment of their design decisions with their own research conclusions, and the functional logic presented in their project documentation. By evaluating the design through the lens of the students’ own data-driven justification rather than instructor opinion, the assessment process shifted toward a transparent, evidence-based appraisal. Finally, the involvement of the corporate client served as a natural mechanism of secondary, functional validation; deliverables that failed to meet the client’s objective requirements could not receive high performance scores. Nevertheless, the lack of formal inter-rater reliability remains a limitation, and future research should incorporate independent, blind evaluators to conduct consistency checks.
3. Results
3.1. Baseline Technical Equivalence Analysis
Prior to examining the impact of validation loops on engagement and performance, a baseline evaluation was conducted to ensure that the quasi-experimental groups possessed equivalent technical capabilities at the project launch. The Baseline Technical Assessment aggregated five self-reported metrics measuring initial design knowledge and proficiency across professional-grade software solutions (Adobe Illustrator (version 2025/v29; Adobe Inc., San Jose, CA, USA), Adobe Photoshop (version 2025/v26; Adobe Inc., San Jose, CA, USA), Figma (cloud SaaS release 2025; Figma, Inc., San Francisco, CA, USA), and Webflow (cloud SaaS release 2025; Webflow, Inc., San Francisco, CA, USA)) on a 1–5 scale, forming a composite digital readiness score.
To verify the demographic and technical equivalence of the cohorts following stratification, a one-way analysis of variance (ANOVA) was performed on the composite baseline scores across the three experimental conditions. The analysis confirmed that the differences between the Client-facing group (M = 2.84, SD = 0.62), the Peer-facing group (M = 2.59, SD = 0.53), and the Mentor-only group (M = 2.67, SD = 0.40) were not statistically significant, F(2, 50) = 1.084, p = 0.346. The individual proficiency metrics across all software packages similarly demonstrated no significant variations between groups (p > 0.05), with the exception of a baseline variance in Adobe Photoshop familiarity (p = 0.023). While isolated software proficiency might theoretically expedite specific 2D image-editing tasks during the initial visual asset development (Phase 3), a correlational analysis of the dataset confirms that its influence on overall project development was negligible. Specifically, there was no statistically significant correlation between baseline Adobe Photoshop proficiency and the students’ final project performance scores (r = 0.162, p = 0.300). As detailed in Section 2.5, the evaluation framework was not designed to measure basic software mechanics. Rather, successful project development depended on the participants’ ability to conduct rigorous requirements analysis, synthesize data-driven conclusions into a conceptual framework, and apply complex 3D structural design principles. Prior familiarity with a 2D image editor could not compensate for, nor systematically advance, these required analytical competencies. Consequently, a minor variance in one specific program did not systematically advantage any group. Ultimately, these findings mathematically confirm that the three cohorts were technically equivalent at the start of the 15-week timeline, ensuring that subsequent variances in system engagement and performance can be attributed to the experimental validation environments rather than pre-existing differences in technical capacity.
The detailed descriptive statistics for the baseline assessment across the cohorts are summarized in Table 2.
Table 2.
Baseline technical proficiency and software readiness scores by deployment group (N = 53).
3.2. User Engagement Dynamics Within the Digital Workflow
A total of 53 participants completed the longitudinal data collection regarding the eight dimensions of user engagement adapted for this technological framework. The analysis revealed a collective average engagement score of 3.48 throughout the system implementation phase.
Longitudinal tracking of these dynamics indicated a gradual decline in system interaction as the project lifecycle progressed and technical workload increased. The mean engagement score peaked during the initial project launch phase (M = 3.59), followed by a moderate reduction at the mid-point (M = 3.46), and reached its minimum at the final deployment stage (M = 3.40) (Figure 2).
Figure 2.
User engagement dynamics across the project lifecycle by deployment scenario.
Data decomposition by cohort identifies significant variances in engagement stability: the industry-client deployment group exhibited the highest descriptive consistency, with an engagement decrease of only 0.13 points from launch (M = 3.61) to final rollout (M = 3.48). Conversely, engagement levels in the internal-only evaluation group (mentor-only) experienced a more pronounced drop of 0.34 points (from an initial M = 3.63 down to M = 3.29). To formally determine whether these diverging rates of decline visually suggested in Figure 2 were statistically significant, a one-way ANOVA was conducted on the engagement change scores (Δ = Baseline Engagement—Final Engagement) across the cohorts. The analysis confirmed a statistically significant main effect for the validation environment on the rate of engagement decay, F(2, 50) = 4.18, p = 0.021. Post hoc comparisons revealed that the minimal decay observed in the Client-facing group (Δ = −0.13) was significantly lower than the pronounced decay in the Mentor-only group (Δ = −0.34) (p < 0.05). These results statistically confirm that industry-facing validation scenarios provide a more robust environment for maintaining user interaction with the digital pipeline, effectively stabilizing performance until the conclusion of the technical lifecycle.
3.3. Comparative Analysis of Technical Output Quality (ANOVA)
Cautionary Note Regarding Performance Metrics: When interpreting the following results, it must be explicitly noted that the Technical Lead of the course acted as both the primary researcher and the final evaluator. Because the evaluator was not blinded to the students’ assigned validation cohorts (Client, Peer, or Mentor), this dual role introduces a potential source of evaluator bias. While grading was strictly anchored to an objective technical rubric and validated by the external client’s functional acceptance (as detailed in Section 2.6), the lack of an independent, blind rater limits the absolute objectivity of the System Performance Scores. Consequently, the performance findings presented in this section should be interpreted with this methodological constraint in mind.
To evaluate the impact of the deployment environment on the final technical quality of the prototypes, a one-way analysis of variance (ANOVA) was conducted. The analysis utilized the standardized technical performance scores (measured on a 1–5 scale). Prior to the ANOVA, a variance diagnostic was performed to account for the slightly unequal group sizes (n = 20, 18, and 15). Levene’s test for equality of variances indicated that the assumption of homogeneity of variances was not violated (p = 0.929), confirming the statistical reliability of the model across the uneven distribution. Although the mean performance scores followed the expected trend, with the Industry-Client deployment group achieving the highest quality (M = 4.37) compared to the Peer-review (M = 4.34) and Mentor-only (M = 4.20) groups, the differences were not statistically significant, F(2, 50) = 0.43, p = 0.650, demonstrating a very small effect size ( = 0.017). Post hoc comparisons (Tukey HSD) similarly indicated no significant pairwise differences (all p > 0.05). From a practical standpoint, this minimal effect size indicates that the varying validation environments accounted for less than 2% of the variance in the final technical grades. Consequently, while H1 is descriptively supported by the observed trends, it is not statistically confirmed within this sample size.
Specifically, the post hoc analysis confirmed that the variations between validation loops remained within a narrow margin. The comparison between the Industry-Client group (M = 4.37, SD = 0.57) and the Internal Mentor group (M = 4.20, SD = 0.61) yielded p = 0.649. No significant differences were found between the Client group and the Peer group (M = 4.34, SD = 0.53, p = 0.987), nor between the Peer and Mentor groups (p = 0.748). While the Industry-Client group recorded the highest absolute mean score, the lack of statistical significance points to a systemic ceiling effect. In statistical literature, a ceiling effect occurs when a high proportion of participants score near the upper limit of an assessment instrument, thereby compressing the variance and reducing the probability of detecting statistically significant differences between groups [27]. To formally quantify this phenomenon within our sample, the distribution of the System Performance Scores was analyzed. The results revealed a highly negatively skewed distribution (skewness = −1.85) with a high kurtosis (kurtosis = 4.20), mathematically confirming that the vast majority of participants across all validation loops successfully achieved near-maximum technical clearance, clustering at the top of the grading scale.
In a technological context, this indicates that the rigorous architecture of the integrated digital workflow (comprising 3D modeling and web-based deployment) is sufficiently structurally sound to elevate technical performance across the entire cohort, regardless of the external evaluative pressure (Figure 3).
Figure 3.
Average technical performance score by deployment environment.
The final technical performance breakdown is as follows:
- Industry-Client Loop (n = 20): Achieved the highest technical performance score of 4.37.
- Peer-Review Loop (n = 18): Achieved a mean performance score of 4.34.
- Internal-Mentor Loop (n = 15): Recorded a mean performance score of 4.20.
The observed performance means followed the expected hierarchy (Industry-Client loop > Peer-review loop > Internal-Mentor loop), but these differences were not statistically significant (F(2, 50) = 0.43, p = 0.650; Tukey HSD, all p > 0.05). Therefore, while H1 is descriptively supported by the direction of the trends, it is not statistically confirmed within this sample size. This lack of significance is primarily attributable to the restricted variance in performance metrics, defined here as a systemic “ceiling effect.” Within this technological framework, the overall high performance of the entire cohort suggests that the structured digital pipeline makes it mathematically difficult to distinguish significant differences between the experimental conditions. Within this descriptive hierarchy, however, introducing an external industry stakeholder (the client) appears to serve as a more effective catalyst for technical rigor and operational excellence compared to peer-evaluative pressure or the traditional, closed-loop internal format. However, given the single-evaluator design of this study, these descriptive performance hierarchies must be interpreted with caution. Although anchored to a standardized rubric, the potential for subconscious evaluator bias cannot be entirely ruled out, reiterating the need for independent validation in future research.
3.4. Project Throughput and Operational Efficiency
The collective mean performance score for the final sample of 53 participants at the conclusion of the third validation cycle was 4.3. Regarding operational efficiency and project completion rates, a significant majority of participants opted for the earliest possible assessment windows. This proactive timeline adherence is typically associated with higher engagement levels and systematic development workflows, as further analyzed in Section 3.8.
Specifically, of the 53 participants who completed the longitudinal deployment, 24 successfully finalized their project rollout during the first validation cycle (13 February), 10 during the second cycle (20 February), and 8 utilized the third cycle (27 February). This high throughput rate—with 42 out of 53 participants (nearly 80% of the sample) resolving their technical obligations promptly—indicates that the structured digital environment and the requirement for high-fidelity final deliverables effectively catalyzed users to complete the project lifecycle with high efficiency.
3.5. Influence of User Engagement on Final Technical Quality
A simple linear regression was calculated to predict the final technical performance score based on the participants’ overall engagement levels. The results indicate a weak positive correlation (r = 0.16) between engagement and the final performance metric. The regression model did not reach statistical significance (F(1, 50) = 1.30, p = 0.260), with engagement explaining approximately 2.5% of the variance in final scores (R2 = 0.025, β = 0.179).
Although the data suggests a positive trend—where higher engagement slightly aligns with better output quality—the lack of statistical significance is primarily attributed to a systemic “ceiling effect” within the performance distribution. Because the highly structured digital workflow, mandatory iterative milestones, and the technical requirements of public web deployment naturally elevated the minimum performance standards, the vast majority of participants successfully achieved exceptionally high technical scores (M = 4.31, SD = 0.56). This compression of the performance scale reduced the statistical variance required to isolate individual engagement as a dominant, standalone predictor.
From a systems engineering and HCI (Human–Computer Interaction) perspective, this finding is highly significant: it suggests that in a well-structured, technology-driven environment involving real industry stakeholders, the technical accountability drives high performance across the board. The framework effectively compensates for participants who may exhibit lower initial levels of engagement.
To further illustrate the relationship between user engagement and technical performance, the sample was divided into two distinct cohorts based on the median engagement score (Mdn = 3.42). An independent samples t-test was conducted to compare the final performance scores between the “High Engagement” group (>3.42) and the “Low-to-Average Engagement” group (≤3.42). The descriptive results align with the expected trend: users in the high-engagement cohort achieved a slightly higher average performance score (M = 4.36, SD = 0.61) compared to their peers (M = 4.25, SD = 0.52). However, this difference was not statistically significant (t(50) = 0.735, p = 0.466). Far from undermining the importance of user interaction, this data directly corroborates the strong systemic impact of the digital architecture. Because the workflow mandated strict quality control, high-fidelity 3D modeling, and interactive web deployment, even participants with below-average initial engagement were compelled to meet rigorous professional standards, achieving a high minimum score (4.25). The technological framework effectively acted as a “performance equalizer,” compensating for initial engagement deficits by imposing standardized technical requirements.
3.6. Impact of Technical Brief Specifications on Overall User Engagement
To better understand the nuances of user interaction with the digital pipeline, we compared the collective average engagement scores across the four specific technical briefs. A one-way ANOVA indicated a strong trend toward variance in engagement based on the source and structure of the project specifications (F(3, 49) = 2.715, p = 0.055) (Table 3).
Table 3.
Descriptive statistics of overall user engagement scores based on the assigned technical brief.
It is important to emphasize that, as established in the methodology, participants were fully aware of their assigned validation environment throughout the development process. When working with highly structured briefs for tangible, external stakeholders (Industry or Institutional), users exhibited notably higher engagement levels. Conversely, the open-ended, purely academic brief (“Croatian Product of Choice”) yielded the lowest engagement outcomes.
This finding supports the premise that industry-aligned technical specifications and external accountability command higher operational commitment than generalized academic exercises. In a technological context, this suggests that the rigor of the initial system requirements directly influences the depth of interaction with the 3D modeling and web deployment tools.
3.7. Consistency of Technical Output Across Project Specifications
To determine whether the specific nature of the technical brief influenced the final output quality, we compared the average performance scores across the four assigned tasks. As previously established, the final score for every project was evaluated through a rigorous and uniform technical matrix encompassing the high-fidelity prototype (structural integrity), professional rollout skills, consistency across brand extensions, conceptual originality, and functional visual communication.
A one-way ANOVA revealed that there were no statistically significant differences in the final technical scores based on the project assignment (F(3, 48) = 0.196, p = 0.899) (Table 4).
Table 4.
Descriptive statistics of final technical performance scores based on the assigned task.
Although our previous analysis (Section 3.6) indicated that user engagement fluctuated depending on the task type (with the open-ended academic brief yielding the lowest engagement), the actual technical performance remained consistently high across all tasks. This lack of variance in final scores strongly reinforces the presence of a systemic “ceiling effect.” It demonstrates that when a course employs a highly structured digital pipeline and a demanding evaluation framework—requiring meticulous deliverables such as interactive 3D prototypes and professional web deployment—the systemic technical requirements override initial engagement fluctuations. This effectively ensures high-quality professional output across all project iterations, regardless of the specific nature of the brief.
3.8. Influence of User Engagement on Operational Throughput and Deployment Speed
To evaluate Hypothesis 3 (H3), which proposed that higher levels of engagement lead to optimized project lifecycle efficiency and accelerated final deployment, we analyzed the project completion dates across the cohort. The statistical analysis revealed no significant relationship between engagement levels and the timing of final system validation (p = 0.568). Consequently, H3 cannot be statistically confirmed.
However, while individual engagement variances did not significantly predict the specific deployment window, the descriptive data revealed an exceptionally high level of overall operational efficiency across the entire sample. Nearly 80% of all participants successfully finalized complex interactive deliverables and reached the final rollout stage within the first three early validation windows. Rather than invalidating the model, this lack of statistical significance further supports the systemic “ceiling effect” discussed previously. The rigorous, structured digital pipeline and the technical requirement for public deployment effectively accelerated the workflow for all users, conditioning even those with lower baseline engagement to complete their technical milestones as efficiently as their highly engaged peers (Table 5). As a brief reminder regarding the sample sizes utilized across the results: the full cohort of N = 53 is used for all analyses concerning user engagement and operational throughput (including Table 5), as all participants completed the longitudinal tracking. In contrast, previous analyses concerning final technical performance scores (e.g., Section 3.3) were strictly limited to the reduced sample of n = 42 participants who successfully completed and deployed functional prototypes.
Table 5.
Descriptive statistics of overall engagement scores based on the examination session attended.
Although a one-way ANOVA among the participants who reached final rollout did not indicate statistical significance (F(2, 39) = 0.575, p = 0.568), primarily due to the limited sample sizes in the later sessions, a weak negative correlation was observed (r = −0.158). In this context, the negative correlation indicates a trend in which higher engagement levels are linked to a lower number of days required for project completion (proactive deployment).
From a workflow optimization perspective, the descriptive data distinctly demonstrates that participants exhibiting the highest levels of engagement (often driven by external validation requirements from industry clients) show the highest operational proactivity. These users resolve their technical obligations immediately at the first deployment opportunity. Conversely, participants with lower engagement scores represent the demographic that experiences system latency, postponing final participation or struggling to meet the structured technical milestones on time.
4. Discussion
4.1. The Impact of Industry-Facing Validation on Technical Engagement
The findings strongly suggest that traditional academic metrics, such as the pursuit of theoretical grades, are often insufficient to maintain high operational commitment over a 15-week technical project. Introducing a real industry stakeholder fundamentally alters the operational dynamics of the development task. Our analysis of user engagement based on the assigned technical brief (Section 3.6) revealed that participants working on industry-aligned specifications (Fortenova Group) demonstrated notably higher engagement levels (M ≈ 3.60) compared to those working on open-ended, simulated academic briefs (M = 3.13).
An intriguing anomaly in the data, as highlighted in Table 3, is the comparatively lower final engagement score associated with the ‘Croatian Product of Choice’ task. Intuitively, higher autonomy in selecting a project topic is often assumed to increase intrinsic motivation. However, within this specific technological framework, the results demonstrate the opposite. This decline can be directly attributed to the absence of an authentic external stakeholder. While other tasks involved specific, existing corporate brands (providing strict brand guidelines and real-world validation pressure), the ‘Product of Choice’ task lacked a concrete, demanding client. Consequently, without industry-facing stakes, the task reverted to the dynamics of a traditional, hypothetical academic exercise. This finding robustly reinforces the core premise of this study: in rigorous digital engineering pipelines, it is the presence of authentic client constraints and external accountability—rather than mere creative freedom—that drives and sustains peak user engagement.
This conclusion is further illuminated by an apparent paradox observed in the performance data: while the ‘Product of Choice’ task yielded the lowest engagement, Table 4 reveals that it simultaneously achieved the highest average technical performance score. This phenomenon can be explained by the dynamics of cognitive load and task complexity. When participants are granted total autonomy without external corporate constraints, they naturally gravitate toward the path of least resistance. They select products and concepts that align perfectly with their existing technical competencies, effectively minimizing creative and structural risk. Furthermore, the absence of rigid corporate brand guidelines (which governed the Fortenova briefs) removes a significant layer of technical difficulty. Consequently, participants working on their own product face a less complex, unconstrained problem space, making it significantly easier to optimize their final prototype against the evaluation rubric. They achieve a high grade, but they do so within a ‘safe’ academic vacuum. This reinforces the argument that while open-ended tasks may yield polished results, authentic professional engagement and technical growth are driven by the necessity to navigate and overcome strict, externally imposed industry constraints.
We interpret the sustained engagement in the Industry-Client Group (Group A) as empirical evidence of technical alignment with professional standards. When an external client is integrated into the validation loop, the project transitions from an isolated academic exercise into a high-fidelity professional rollout. Participants in the client-facing group were not merely optimizing their output for a grade; they were engineering a functional digital product for real-world industry clearance and the creation of a high-value professional asset (consistent with the mechanism proposed in H2). Expectations set by the industry client were perceived as directly relevant to participants’ technological proficiency and future career trajectory. This alignment triggers a state of professional accountability, where the user internalizes the technical requirements of the client because they recognize the direct correlation between the quality of the 3D web-based prototype and their own professional readiness.
To fully contextualize the engagement dynamics presented in Figure 2, the critical finding is therefore not the general temporal decline, but rather the pronounced stability of the Client-facing cohort (Group A). While the Mentor-only cohort (Group C) experienced a predictable academic slump as the technical workload increased (a drop of 0.34 points) due to a lack of external validation, Group A maintained remarkable stability, recording a minimal decrease of only 0.13 points. Based on qualitative cohort feedback and observational data gathered during the deployment, this stability can be explicitly attributed to a shift from ‘academic compliance’ to ‘professional identity.’ Students in Group C reported a natural tendency to conserve cognitive effort once a passing grade seemed assured. In contrast, qualitative insights revealed that students in Group A internalized the project as a high-stakes professional audition. The anticipation of a live pitch to corporate executives activated specific protective regulation strategies. Most notably, the ‘error-avoidance’ strategy (driven by the fear of technical failure or software crashes during a public presentation) and the ‘outcome-driven’ strategy (the desire to secure a highly visible, portfolio-ready asset for future employment) acted as systemic buffers. This external industrial anchor compelled Group A to sustain their interaction with the complex 3D and web deployment tools, effectively neutralizing the typical mid-semester motivational decay.
Furthermore, it is important to acknowledge how the non-random distribution of technical briefs (as detailed in Table 1) influenced these comparative outcomes. Because the Client-facing cohort (Group A) inherently required a live corporate pitch, they were exclusively assigned the Fortenova corporate briefs. One might argue that their higher engagement stemmed merely from the real-world appeal of the corporate task rather than the validation environment. However, our methodological cross-distribution directly addresses this potential confounder. By intentionally assigning a subset of these identical corporate briefs to the Peer-review (Group B) and Mentor-only (Group C) cohorts, we isolated the impact of the validation loop. Observational data confirmed that students in Groups B and C, who worked on the exact same corporate briefs, but without the external client pitch, did not sustain the same level of longitudinal engagement as Group A. This effectively demonstrates that while a corporate brief provides strong initial motivation, it is the actual deployment environment (the pressure of the live external evaluation) that acts as the primary catalyst for the observed statistical differences in performance.
4.2. Systemic Validation as a Catalyst for Technical Rigor
The descriptive variance in mean performance scores across groups (Industry-Client: M = 4.37, Peer-Review: M = 4.34, Internal-Mentor: M = 4.20) (Section 3.3) is consistent with the hypothesis that live deployment scenarios increase technical accountability. Rather than relying on traditional social facilitation theories, these results can be interpreted through the lens of operational stakes. When a participant knows their digital prototype will be deployed and rendered on a high-resolution interface before industry professionals, the necessity for technical integrity is heavily activated. In a closed internal evaluation (mentor-only), the operational cost of a technical or conceptual error is confined to a private academic transaction, minimizing the perceived stakes of failure. This pattern suggests that live system validation serves as a powerful driver for increased technical effort and precise software utilization.
However, the most significant finding of this study is the identified systemic “ceiling effect” in technical performance. Regardless of varying levels of initial engagement, the vast majority of participants achieved remarkably high final performance scores (overall M = 4.31). To empirically quantify this ceiling effect, an analysis of the final grade distribution reveals that 76.2% of the successfully deploying cohort (n = 42) achieved a final aggregate performance score of 4.0 or higher (on a 5.0 scale), with 45.2% scoring 4.5 or above. From a technological perspective, this concentration of high-tier results reflects the systemic reliability of the integrated digital workflow [36]. This systemic framework compels even those users with lower initial engagement to optimize their output, effectively compensating for individual human-factor deficits through a structured technical pipeline. This result aligns with engineering education principles [10,25,37], which emphasize that rigorous technical requirements and authentic professional constraints are critical for ensuring standardized technical success.
Furthermore, while the linear regression analysis did not establish a statistically significant predictive relationship between individual baseline engagement and final technical success (r = 0.16, β = 0.179, p = 0.260), this non-significance must be contextualized alongside the subgroup metrics. The systemic impact of the industry validation environment is evidenced by longitudinal engagement stability and operational throughput, rather than simple linear grade increments. As established in Section 3.2, the ANOVA confirmed that the client-facing cohort exhibited a statistically significant reduction in engagement decay (p = 0.021) compared to the mentor-only group. Concurrently, descriptive data from the median split (Section 3.5) demonstrates that the high-engagement cohort achieved a higher mean performance (M = 4.36) than the low-to-average cohort (M = 4.25). Additionally, operational throughput analysis (Section 3.8) revealed a negative correlation (r = −0.158), indicating that highly engaged participants executed deployments more proactively. Therefore, we conclude that while the rigorous constraints of the 9-phase pipeline standardize the minimum technical output—resulting in a ceiling effect and a non-significant linear regression—the compiled data substantiates that industry integration significantly optimizes workflow efficiency and sustains operational engagement.
4.3. Closing the Technological Gap: Industrial Integration as a Strategic Alignment Tool
By demonstrating that participants can consistently meet rigorous technical standards within an industry-integrated validation environment (Section 3.6), we conclude that the inclusion of real-world stakeholders effectively minimizes the discrepancy between academic output and labor-market technological requirements [31,32,34].
The findings of this study underscore the criticality of Industrial-Standard Assessment in technology-driven design education. By involving real-world industry partners, the proposed model does not merely evaluate software proficiency; it subjects the digital workflow to the actual operational and technical constraints encountered in professional practice. This environment simulates the technical accountability and rigorous quality control protocols characteristic of the industry.
Consequently, industry involvement serves as a catalyst for technical maturity. It mandates a shift in the user’s role from a student engaged in academic prototyping to a practitioner responsible for industrial-grade deployment. In this framework, the participant is held accountable to external technical specifications, transforming the project from a theoretical exercise into a verified professional contribution.
4.4. Implications for Practitioners and Engineering Educators
The findings of this study offer several highly actionable implications for interdisciplinary design practitioners and engineering educators seeking to modernize their technological curricula.
First, the proposed 9-phase digital pipeline provides a scalable, replicable template for transitioning from traditional static assignments to dynamic, production-level product development. By structuring the workflow around specific validation loops rather than mere software tutorials, educators can effectively simulate an agile corporate environment within an academic semester.
Second, the study demonstrates the profound pedagogical value of integrating cloud-based, no-code/low-code platforms (such as Spline and Webflow) into the curriculum. For practitioners and educators, these tools democratize high-fidelity 3D prototyping. They significantly lower the cognitive barrier associated with traditional syntax programming, allowing students to focus their cognitive resources on structural engineering, interactive logic, and user experience design, rather than being hindered by coding syntax.
Finally, the successful deployment of the “Client-facing” validation model (demonstrated through the Fortenova case) reveals a cost-effective strategy for boosting user engagement. Educators often struggle with the “mid-semester motivational slump.” This study proves that integrating a real-world corporate stakeholder acts as a natural, systemic motivator. The anticipation of a live industry pitch activates a sense of professional accountability that traditional academic grading simply cannot replicate. For educational institutions, partnering with corporate clients not only ensures curriculum relevance but also shifts the burden of quality assurance from subjective instructor grading to objective, market-driven functional acceptance.
4.5. Limitations and Future Research
While this study provides valuable systemic insights into digital workflow optimization, several limitations must be acknowledged.
First, we acknowledge the methodological constraint arising from the dual role of the Technical Lead as both the course instructor and the primary researcher. This introduces a potential for evaluator bias. As detailed in Section 2.6, we mitigated this by anchoring assessments to a rigid, criterion-referenced technical rubric rather than aesthetic criteria, and by utilizing the corporate client’s functional acceptance as an objective benchmark. Nevertheless, the lack of formal inter-rater reliability remains a primary limitation.
Second, although the overall sample size (N = 53 complete longitudinal responses) provided a solid foundation for tracking general trends, it presented limitations regarding statistical power at multiple levels. On a macro level, it lacked the power to detect minor variances within such a heavily scaffolded technological environment. Following a post hoc power analysis based on the observed small effect size for the correlation between engagement and performance (r = 0.16), we determined that a sample size exceeding 300 participants would be required to achieve standard 80% statistical power (α = 0.05). Therefore, the limited overall sample size definitively contributed to the marginal statistical significance observed in the primary ANOVA and regression models. On a micro level, this power limitation was further compounded by the distribution of participants across different deployment windows. As shown in Table 5, the number of participants reaching the final validation stage in the second (n = 10) and third (n = 8) sessions was relatively small. This limited sub-sample size restricts our ability to detect statistically significant differences in completion timing or engagement variances between those specific groups. Consequently, statistical comparisons across these specific sub-sessions should be interpreted with caution due to the elevated risk of type II errors.
Third, the assessment of engagement dynamics relied on subjective user-reported measures. This introduces the inherent risk of reporting bias, as participants may have unconsciously adjusted their responses regarding engagement, anticipating that displaying higher commitment might influence their final evaluation. Furthermore, the adapted engagement instrument underwent validation exclusively by an internal expert panel comprising the study’s authors. While the authors possess extensive historical experience with this specific course and demographic, the lack of external validation by independent psychometric or pedagogical experts is a notable limitation, and future studies should subject the instrument to external review to further solidify its construct validity.
Fourth, the study is situated in a highly domain-specific technological context. High-fidelity prototyping in graphic engineering relies heavily on tangible digital deliverables, structural accuracy, and specialized software proficiency (Spline, Webflow). Consequently, the observed engagement dynamics and the pronounced “ceiling effect” may manifest differently in purely theoretical or non-technical academic fields where deliverables are less interactive.
Fifth, the demographic composition of the participant cohort was predominantly female (83.8%). While this distribution accurately mirrors the standard enrollment demographics of the graphic engineering program at the University of Zagreb, it presents a potential limitation to the broader generalizability of the findings regarding ‘User Engagement Dynamics.’ Due to the heavily skewed female-to-male ratio, the absolute number of male participants was insufficient to conduct a statistically robust comparative analysis (e.g., gender-based t-tests) regarding technological engagement or performance outcomes. Consequently, the specific behavioral patterns observed, such as the pronounced use of protective regulation strategies (error-avoidance) prior to the industry pitch, should be interpreted with this specific demographic profile in mind.
Finally, we must acknowledge a limitation regarding the distribution of project briefs. Because the Client-facing cohort (Group A) inherently required a live corporate pitch, all students in this group were assigned corporate-sponsored tasks. Although we attempted to mitigate this by distributing identical corporate briefs to the peer and mentor groups, the potential influence of the inherent project type (corporate vs. academic) and the evaluative environment cannot be completely separated. Future studies should aim for a fully randomized cross-tabulation of project sources and validation environments to isolate these variables more cleanly.
Furthermore, the single-institution design inherently limits the generalizability of the findings across different educational and cultural contexts. The observed engagement dynamics were recorded within a specific higher education environment at the University of Zagreb, where the contrast between traditional academic grading and external professional validation is distinctly pronounced. In educational cultures where industry-academia integration is already a standard, everyday curricular baseline, the introduction of a corporate client might not produce the same dramatic spike in engagement. Additionally, institutional factors played a crucial enabling role in this study. The successful deployment of this framework relied on the university’s established corporate network (facilitating access to high-profile partners) and the specialized technical infrastructure inherent to a graphic engineering program. Replicating this model in educational settings with limited access to corporate stakeholders, different pedagogical traditions, or lower baseline technological resources may yield different engagement trajectories. Consequently, cross-cultural and cross-institutional replication is essential to verify the broader transferability of this client-driven framework.
Despite these methodological constraints, the findings firmly align with and contribute to the broader context of research in Human–Computer Interaction (HCI) and Engineering Education. The results empirically support the necessity of integrating external validation loops and industry-standard technical requirements to ensure consistent output quality. The compiled descriptive metrics, along with the statistically significant longitudinal engagement stability, corroborate the premise that integrated digital pipelines and real-world industry stakeholders optimize user workflow and sustain operational engagement.
Future research should aim to replicate this quasi-experimental model across diverse technological disciplines using multi-institutional samples to increase statistical power. To mitigate the identified limitations regarding single-evaluator bias, subsequent studies would strongly benefit from incorporating independent technical auditors to conduct blind rubric consistency checks. Furthermore, introducing a systematic self-assessment framework for students is highly recommended for future iterations. Such an approach would provide a valuable triangulation point to further validate the system’s effectiveness and reduce evaluator bias, while simultaneously promoting students’ critical reflection on their own learning outcomes and the technical development process. Finally, future studies should consider mixed-method approaches, combining these self-assessments and subjective reporting with automated behavioral tracking (data logging), to comprehensively validate the operational impact of industry-facing deployment in higher education.
5. Conclusions
This research indicates that integrating industry-facing validation loops into higher education frameworks yields measurable improvements in the operational efficacy of technical design workflows. By implementing a quasi-experimental design involving real-world corporate stakeholders, this study suggests how external evaluative pressure can be leveraged as a mechanism for quality assurance and technical optimization. Educational institutions should systematically integrate industry partners to ensure that students’ technical proficiency is operationally validated prior to graduation.
The findings of this study lead to three primary conclusions:
- Industry-Aligned Specifications Drive Higher Engagement: Participants working on structured technical briefs for tangible, external stakeholders (corporate or institutional) exhibited notably higher engagement levels (M = 3.63) than those working on generalized academic briefs (M = 3.13), suggesting a descriptive trend (p = 0.055). While this result did not reach the conventional threshold for statistical significance, it implies that the inclusion of external technical accountability acts as a critical catalyst for sustained interaction with the digital pipeline.
- Engagement Correlates with Operational Throughput: Although individual variances in engagement demonstrated descriptive trends rather than statistically significant links to final performance in this sample, a clear trend in workflow efficiency was observed. Nearly 80% of the cohort successfully achieved final deployment within the first three validation windows. The data suggests that higher initial engagement facilitates a more proactive development cycle, highlighting the importance of early-stage technical alignment.
- Digital Workflow Architecture Ensures Systemic Stability: The implementation of a structured, project-based framework involving 3D modeling (Spline) and interactive web deployment (Webflow) resulted in a “ceiling effect,” where technical output remained consistently high across the entire cohort. This systemic framework effectively normalizes performance, serving as a stabilizing factor that enables users with lower baseline engagement to meet rigorous professional standards. This suggests that a well-engineered digital pipeline can act as a performance equalizer, independent of individual human-factor variables.
From a technological perspective, this study contributes a validated blueprint for designing and implementing advanced digital prototyping pipelines. By establishing a rigorous workflow that seamlessly bridges interactive 3D modeling and web-based deployment, the research evaluates the framework’s systemic robustness against user dropouts and varying evaluative pressures. This pipeline transcends traditional pedagogical applications; its architecture provides a highly scalable and adaptable technological model that is directly transferable to contemporary industry settings that require agile, high-fidelity digital prototyping and remote client validation.
In summary, this research demonstrates that industry collaboration and public digital deployment are potent drivers of operational efficiency and technical rigor. While these factors may not always lead to statistically divergent grades due to the observed “ceiling effect,” they significantly enhance the technological maturity and professional readiness of the participants. Moving forward, technical and design curricula should consider the integration of public-facing, interactive deliverables as a standardized component. Such a shift may better prepare graduates to be not only software-proficient but also operationally prepared for the technical accountability required in the global digital market.
Author Contributions
Conceptualization, F.C., J.B., V.C., and J.P.; methodology, F.C.; software, F.C.; validation, F.C., J.B., V.C., and J.P.; formal analysis, F.C.; investigation, F.C.; resources, F.C.; data curation, F.C.; writing—original draft preparation, F.C.; writing—review and editing, F.C., J.B., V.C., and J.P.; visualization, F.C., J.B., V.C., and J.P.; supervision, J.B., V.C., and J.P.; project administration, F.C. All authors have read and agreed to the published version of the manuscript.
Funding
This research received no external funding.
Institutional Review Board Statement
Ethical review and approval were waived for this study as it involved the analysis of educational data with no risk of harm to participants. The research was conducted in accordance with the Declaration of Helsinki and general data protection regulations.
Informed Consent Statement
Written informed consent (GDPR Data Processing Agreement) was obtained from all subjects involved in the study regarding the public deployment of their digital deliverables. Additionally, in accordance with standard institutional educational practices at the University of Zagreb Faculty of Graphic Arts, participants were fully briefed and provided informed consent for the collection and analysis of the longitudinal survey data.
Data Availability Statement
Data are available upon request from the corresponding author.
Acknowledgments
Google Gemini (Large Language Model, 2025–2026 web release; Google LLC, Mountain View, CA, USA) was used solely for language editing and stylistic refinement. The authors reviewed, edited, and approved all content and take full responsibility for the final version of the manuscript.
Conflicts of Interest
The authors declare no conflicts of interest.
Appendix A
The engagement and motivational regulation measurement tool utilized a five-point Likert scale (1 = Strongly Disagree; 5 = Strongly Agree). The items were adapted from the framework by Schwinger et al. [22]. The following statements were translated and administered to assess student engagement across distinct regulatory dimensions:
- Dimension 1: Mastery Self-Talk
- I challenge myself to finish the task and learn a lot for my own benefit.
- I convince myself to keep studying to discover how much I can actually learn.
- I tell myself I need to keep studying to learn as much as possible for myself.
- I convince myself to work intensely for the sake of learning.
- Dimension 2: Interest Enhancement (Personal Significance)
- 5.
- I try to connect the material with my own experiences.
- 6.
- I look for connections between the tasks and my life as a whole.
- 7.
- I try to establish connections between the work and my personal interests.
- Dimension 3: Proximal Goal Setting
- 8.
- I divide the workload into smaller segments, so I feel I can master it more easily.
- 9.
- I approach the work step-by-step, so I feel I am progressing well.
- 10.
- I tell myself I can master the tasks if I set sub-goals.
- Dimension 4: Environmental Control
- 11.
- Before I start working, I try to remove all possible distractions.
- 12.
- I consciously choose study times when I can concentrate especially well.
- 13.
- I make sure distractions are as rare as possible.
- Dimension 5: Self-Consequating (Self-Reward)
- 14.
- I tell myself that I can do something nice after work if I continue studying now.
- 15.
- I make a deal with myself to do something pleasant after I finish the work.
- 16.
- I promise myself that after work, I will do something I love.
- 17.
- I set up the possibility of rewarding myself if I finish the work.
- Dimension 6: Performance-Approach Self-Talk
- 18.
- I draw my attention to how important it is to do well on tests and exams.
- 19.
- I tell myself I need to keep studying if I want to get a good result.
- 20.
- I try to motivate myself to work intensely by focusing on getting good grades.
- 21.
- I draw attention to the fact of how important it is to get good grades.
- Dimension 7: Performance-Avoidance Self-Talk
- 22.
- I imagine my classmates making fun of me for poor performance.
- 23.
- I tell myself I need to try harder if I don’t want to embarrass myself.
- 24.
- I think about how uncomfortable it would be to have worse performance than others.
- 25.
- I think about how my grades will worsen if I refrain from studying.
References
- Broo, D.G.; Kaynak, O.; Sait, S.M. Rethinking engineering education at the age of industry 5.0. J. Ind. Inf. Integr. 2022, 25, 100311. [Google Scholar] [CrossRef] [Scilit]
- Hattie, J. Visible Learning: A Synthesis of over 800 Meta-Analyses Relating to Achievement; Routledge: London, UK, 2008. [Google Scholar]
- Schön, D.A. The Reflective Practitioner: How Professionals Think in Action; Basic Books: New York, NY, USA, 1983. [Google Scholar]
- Crowther, P. Understanding the signature pedagogy of the design studio and the opportunities for its technological enhancement. J. Learn. Des. 2013, 6, 18–28. [Google Scholar] [CrossRef] [Scilit]
- Nazlidou, I.; Efkolidis, N.; Kakoulis, K.; Kyratsis, P. Innovative and Interactive Technologies in Creative Product Design Education: A Review. Multimodal Technol. Interact. 2024, 8, 107. [Google Scholar] [CrossRef] [Scilit]
- Zhang, G.; Lei, Z.; Hu, W.; Zhou, H. Enhancing engineering education via WebVR-based online laboratories. J. Vis. Exp. 2024, 204, e66432. [Google Scholar]
- Zipf, G.K. Human Behavior and the Principle of Least Effort; Addison-Wesley Press: Cambridge, MA, USA, 1949. [Google Scholar]
- Pinho, D.; Aguiar, A.; Amaral, V. What about the Usability in Low-Code Platforms? A Systematic Literature Review. J. Comput. Lang. 2023, 74, 101185. [Google Scholar]
- Riding, D.; Talbot-Landers, C.; Grimshaw, N.; O’Keeffe, H. Developing Place-Based Pedagogies to Challenge Institutional Authority. Int. J. Art Des. Educ. 2019, 38, 927–942. [Google Scholar] [CrossRef] [Scilit]
- Mills, J.E.; Treagust, D.F. Engineering education—Is problem-based or project-based learning the answer? Australas. J. Eng. Educ. 2003, 3, 2–16. [Google Scholar]
- Deci, E.L.; Ryan, R.M. Intrinsic Motivation and Self-Determination in Human Behavior; Springer: New York, NY, USA, 1985. [Google Scholar]
- Ryan, R.M.; Deci, E.L. Intrinsic and Extrinsic Motivations: Classic Definitions and New Directions. Contemp. Educ. Psychol. 2000, 25, 54–67. [Google Scholar] [CrossRef] [Scilit] [PubMed]
- Lepper, M.R.; Corpus, J.H.; Iyengar, S.S. Intrinsic and Extrinsic Motivational Orientations in the Classroom: Age Differences and Academic Correlates. J. Educ. Psychol. 2005, 97, 184–196. [Google Scholar] [CrossRef] [Scilit]
- Biggs, J.B. Student Approaches to Learning and Studying; Australian Council for Educational Research: Melbourne, Australia, 1987. [Google Scholar]
- Wei, J.; Phongsatha, T. Project Design and Learning of Interior Residential Space Based on 3D Cloud Platform Technology. Int. J. Sociol. Anthropol. Sci. Rev. 2024, 4, 643–653. [Google Scholar]
- Wright, K.; Antonucci, Y.; Anderson, L.; Townsend, A. Engaging Business Students with “Low-Code” Model-Driven Development: Self-Efficacy Beliefs in an Introductory MIS Course. In Proceedings of the 56th Hawaii International Conference on System Sciences (HICSS), Maui, HI, USA, 3–6 January 2023; pp. 4649–4658. [Google Scholar]
- Eccles, J.S.; Wigfield, A. Motivational beliefs, values, and goals. Annu. Rev. Psychol. 2002, 53, 109–132. [Google Scholar] [CrossRef] [Scilit] [PubMed]
- Bock, A.C.; Frank, U. Low-Code Platform-based Learning Environments for Work-Integrated Learning. Bus. Inf. Syst. Eng. 2021, 63, 733–740. [Google Scholar] [CrossRef] [Scilit]
- Bandura, A. Self-Efficacy: The Exercise of Control; W.H. Freeman and Company: New York, NY, USA, 1997. [Google Scholar]
- Coelho, P.A.; Casanello, F.; Leal, N.; Brintrup, K.; Angulo, L.; Sanhueza, I.; Flores, F.; Reyes, J.; Forcael, E. Challenge-Based Learning and Scrum as Enablers of 4.0 Technologies in Engineering Education. Appl. Sci. 2024, 14, 9746. [Google Scholar] [CrossRef] [Scilit]
- Wiggins, G. The case for authentic assessment. Pract. Assess. Res. Eval. 1990, 2, 2. [Google Scholar] [CrossRef]
- Schwinger, M.; Steinmayr, R.; Spinath, B. How do motivational regulation strategies affect achievement: Mediated by effort management and moderated by intelligence. Learn. Individ. Differ. 2009, 19, 621–627. [Google Scholar] [CrossRef] [Scilit]
- Herrington, J.; Oliver, R. An instructional design framework for authentic learning environments. Educ. Technol. Res. Dev. 2000, 48, 23–48. [Google Scholar] [CrossRef] [Scilit]
- Lombardi, M.M. Authentic Learning for the 21st Century: An Overview; Educause Learning Initiative: Boulder, CO, USA, 2007. [Google Scholar]
- Dym, C.L.; Agogino, A.M.; Eris, O.; Frey, D.D.; Leifer, L.J. Engineering Design Thinking, Teaching, and Learning. J. Eng. Educ. 2005, 94, 103–120. [Google Scholar] [CrossRef] [Scilit]
- Biggs, J.; Tang, C. Teaching for Quality Learning at University, 4th ed.; McGraw-Hill Education: Maidenhead, UK, 2011. [Google Scholar]
- Davis, F.D. Perceived usefulness, perceived ease of use, and user acceptance of information technology. MIS Q. 1989, 13, 319–340. [Google Scholar] [CrossRef] [Scilit]
- Venkatesh, V.; Morris, M.G.; Davis, G.B.; Davis, F.D. User acceptance of information technology: Toward a unified view. MIS Q. 2003, 27, 425–478. [Google Scholar] [CrossRef] [Scilit]
- Shreeve, A.; Sims, D.; Trowler, P. “A kind of exchange”: Learning from art and design teaching. High. Educ. Res. Dev. 2010, 29, 125–138. [Google Scholar] [CrossRef] [Scilit]
- Labaree, D.F. How to Succeed in School Without Really Learning: The Credentials Race in American Education; Yale University Press: New Haven, CT, USA, 1997. [Google Scholar]
- Topping, K. Peer assessment between students in colleges and universities. Rev. Educ. Res. 1998, 68, 249–276. [Google Scholar] [CrossRef]
- Elliot, A.J.; McGregor, H.A. A 2×2 achievement goal framework. J. Personal. Soc. Psychol. 2001, 80, 501–519. [Google Scholar] [CrossRef] [Scilit]
- Kram, K.E. Mentoring at Work: Developmental Relationships in Organizational Life; Scott, Foresman: Glenview, IL, USA, 1985. [Google Scholar]
- Lave, J.; Wenger, E. Situated Learning: Legitimate Peripheral Participation; Cambridge University Press: Cambridge, UK, 1991. [Google Scholar]
- Lee, H. Peer Mentorship in Higher Education. Educ. Res. Q. 2019, 43, 112–130. [Google Scholar]
- Pintrich, P.R. A Motivational Science Perspective on the Role of Student Motivation in Learning and Teaching Contexts. J. Educ. Psychol. 2003, 95, 667–686. [Google Scholar] [CrossRef] [Scilit]
- Gauthier, L. How Learning Works: 7 Research-Based Principles for Smart Teaching. J. Scholarsh. Teach. Learn. 2013, 13, 126–129. [Google Scholar] [CrossRef] [Scilit]
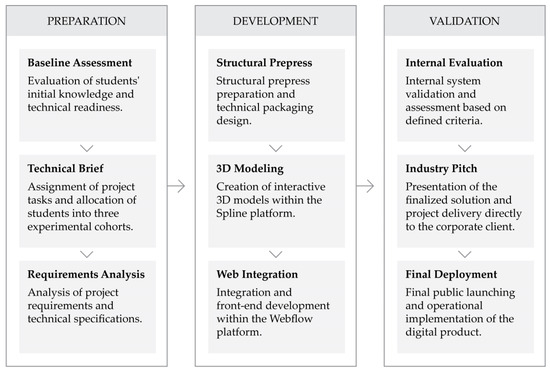
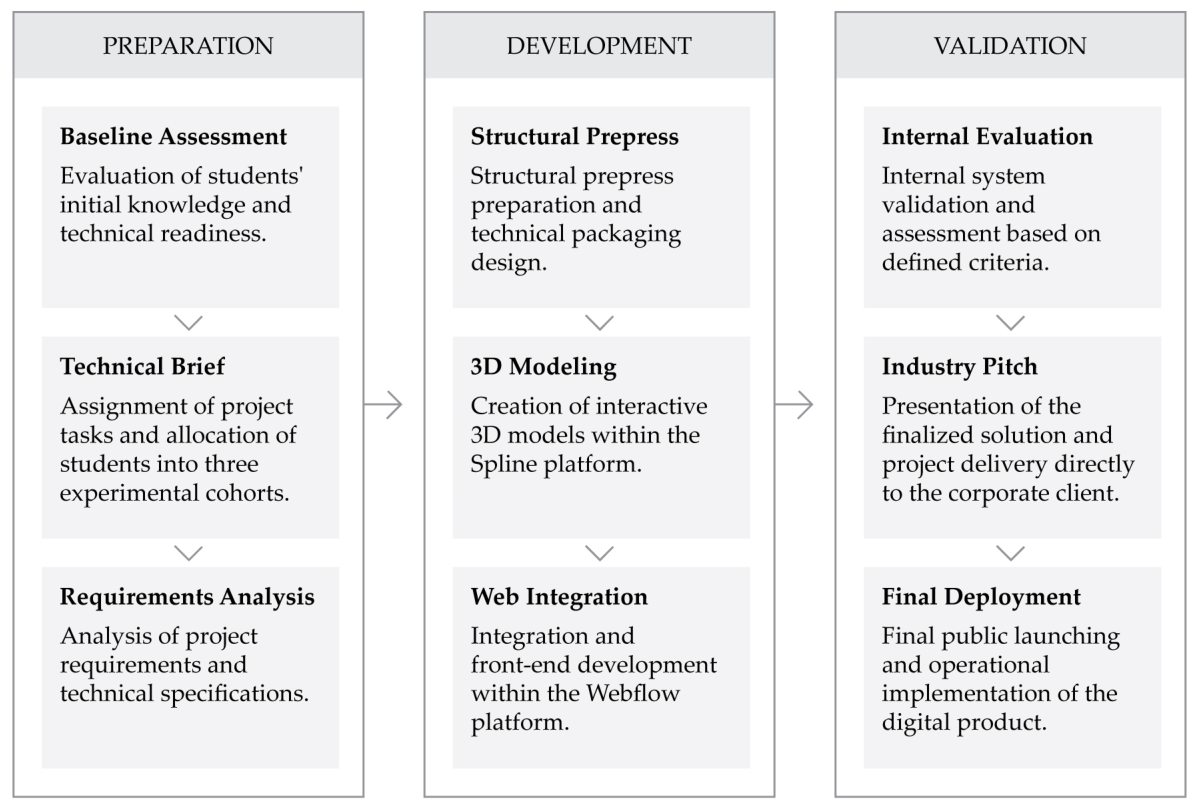
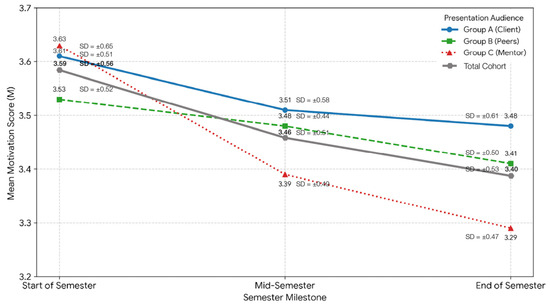
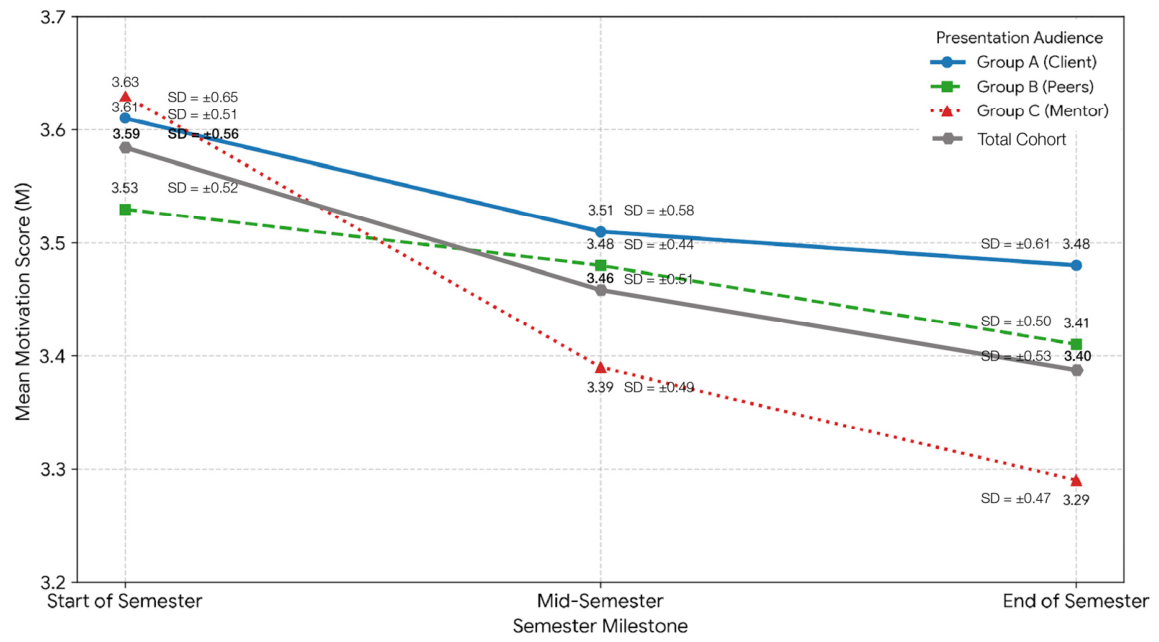
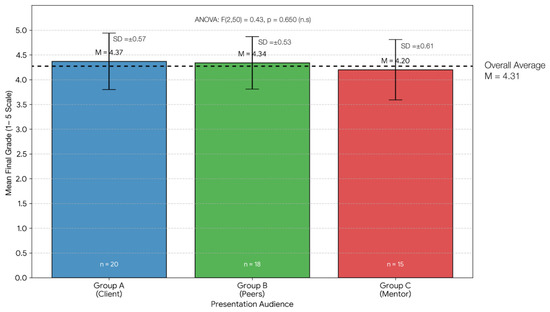
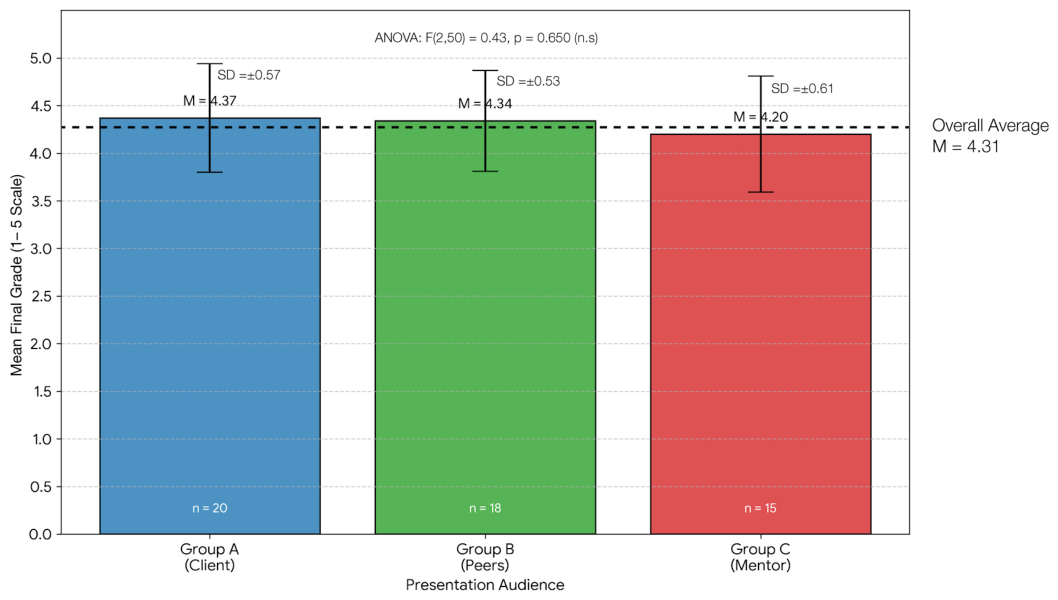

Disclaimer/Publisher’s Note: The statements, opinions and data contained in all publications are solely those of the individual author(s) and contributor(s) and not of MDPI and/or the editor(s). MDPI and/or the editor(s) disclaim responsibility for any injury to people or property resulting from any ideas, methods, instructions or products referred to in the content. |
© 2026 by the authors. Licensee MDPI, Basel, Switzerland. This article is an open access article distributed under the terms and conditions of the Creative Commons Attribution (CC BY) license.