


Abstract
Hydrogen production and storage constitute a promising technology in the path towards a global energy scenario featured by renewable energy penetration, decarbonization, sustainable development and resilience. In particular, so-called green hydrogen is generated from renewable energy sources, generally produced in an electrolyzer by means of Proton Exchange Membrane (PEM) water electrolysis. To make these expectations reality, experimental and real-world facilities are required, dealing with challenging aspects such as new technologies and integration of equipment. Thus, this paper presents the implementation and operation of a pilot plant for green hydrogen generation and storage based on a commercial 30 kW PEM electrolyzer. The renewable source is a photovoltaic generator of 60.6 kW which supplies the hydrogen generator through an inverter. Furthermore, the deployment of a supervisory system entirely based on open-source technologies is reported. The equipment employed and the supervisory system developed in this work exhibit a level of complexity and scale that is uncommon in the literature. Therefore, this article is a novelty in the literature and aims to contribute to the advancement of green hydrogen production and storage by providing experimental data and descriptions of a fully functional plant operating under real-world conditions. The achieved results under real operation conditions prove the successful implementation of the pilot plant as well as the suitability of the supervisory system to effectively track the most relevant variables.
1. Introduction
Today, green hydrogen generated from renewable energies and water electrolysis is the most common alternative to produce carbon-free hydrogen [1] and is considered one of the most promising pathways for sustainable energy [2]. This renewably generated hydrogen has emerged as a promising energy vector and a fundamental solution for decarbonizing multiple sectors [3]. Hydrogen exhibits versatility and adaptability to different temporal and geographical requirements [1].
In this sense, green hydrogen is considered particularly essential for hard-to-abate sectors and long-term energy storage [3]. Hydrogen-based energy storage provides a viable solution for seasonal storage needs and for addressing long-term fluctuations in renewable energy availability [4].
In particular, Proton Exchange Membrane (PEM) water electrolysis is among the most promising routes for producing green hydrogen in systems coupled to photovoltaic, wind and hybrid microgrids. This way, PEM electrolysis has become especially attractive because it combines compactness, high gas purity and fast transient response. These characteristics position this choice as an ideal solution for implementation in energy microgrids and hybrid systems, where the variability in generation requires devices capable of adapting to rapid changes in operating conditions.
Nevertheless, hydrogen-based technologies still need to overcome significant challenges concerning safety handling, efficient storage and economic feasibility to ensure a broad deployment and acceptance as energy storage means [1].
In this context, a noticeable issue is the scarcity of publications in the scientific literature dealing with experimental and real-world hydrogen plants [1,5,6,7]. Many existing studies rely heavily on simulation or Hardware-In-the-Loop (HIL) methods, which do not fully replicate the operational complexities of real-world systems [5]. These approaches often overlook transient uncertainties and integration challenges associated with physical hydrogen components [5]. The majority of previous works on renewable-powered electrolysis systems are theoretical and based on modeling approaches [6]. In contrast, only a limited number of studies provide experimental analyses of integrated systems operating under real-world, variable conditions [6]. In the same sense, as asserted by Maestre et al. [1], it is required to develop experimental setups and pilot plants to further advance the knowledge through experience and face unpredicted problems and phenomena [1].
Moreover, the deployment of a real facility requires addressing a series of cross-cutting issues such as the study of each piece of equipment to be implemented and the definition of a control system and the energy management strategy that will allow for correct integration and interaction between them [1].
In the path towards addressing the challenges for the real deployment of green energy systems, among the unresolved challenges are their adequate supervision and data integration. In this sense, the integration and communication of systems and components is essential for the operation of green hydrogen plants, but the requirement for standardized interoperability is not easy to achieve with the mix of power converters, batteries, and hydrogen equipment available today [8]. Namely, the appropriate choice of communication protocols and the optimal design of the network are critical to achieve data management and visualization, which allows for the proper integration of the heterogeneous equipment and its safe and optimal operation.
Moreover, this data serves to feed the supervisory system, which is key to its continuous operation and monitoring [7,9]. The operator of the plant must be continuously informed about the status and evolution of the hydrogen production and the associated magnitudes [7]. Efficient supervision systems are needed to detect sensor/actuator faults as well as to plan maintenance tasks to avoid system failure, supporting the operator’s decisions about the faulty or healthy situation of the generator [10]. In fact, more studies on monitoring the operation and the aging process of hydrogen-based systems are necessary to meet the industrial needs and to improve hydrogen system durability and reliability [11].
In recent years, the implementation of supervisory systems, commonly known as Supervisory Control and Data Acquisition (SCADA) systems, has increasingly relied on open-source software solutions within the energy sector. This approach has gained relevance due to its flexibility, scalability, cost-effectiveness, and potential for integration with heterogeneous monitoring and control infrastructures [3,5,7,12,13,14]. The utilization of an open-source platform avoids the expensive subscription costs associated with commercial software [5]. Among open-source software packages, Grafana and Node-RED stand out in the literature for their ease of development, performance, and low computational cost [5,7,13].
Both key aspects, communication and supervision, are commonly underestimated and/or scarcely described in most scientific publications.
To address the aforementioned limitations, this article presents the implementation and operation of a system for green hydrogen generation and storage based on a 30 kW PEM electrolyzer. This generator is part of a pilot plant that also includes auxiliary equipment for compressing the produced hydrogen and storing it at high pressure, up to 750 bar. A 60.6 kW photovoltaic field is used to supply the plant. This renewable energy source confers the green character to the produced hydrogen by supplying the electrical power required by the electrolyzer through the photovoltaic inverter.
Furthermore, the development and deployment of a supervisory system entirely based on open-source technologies is reported. Specifically, the Node-RED and Grafana software environments are used for data acquisition and data supervision, respectively. The installation is conceived as a medium-power pilot plant intended for research activities.
Indeed, the motivation for this work arose within the framework of research and development (R & D) activities focused on green hydrogen generation and consumption through the integration of medium-power commercial equipment. During the operation of the hydrogen generator, the lack of access to critical process variables became a major limitation. The Human–Machine Interface (HMI) embedded in the equipment, which was provided and configured by the manufacturer, only displays instantaneous operating values. Consequently, it does not allow the system evolution to be visualized or historical datasets to be generated for subsequent analysis. Furthermore, the embedded HMI does not provide online remote access or alarm notification capabilities, meaning that alarms can only be detected on site. In this regard, the automation system of the electrolyzer effectively behaves as a black box, hindering both operation and R & D activities. Therefore, it became necessary to develop a completely new and fully functional supervisory solution.
In addition, the fact of deploying a whole hydrogen plant and the associated software and communication infrastructure provides relevant advantages in the research context. To begin with, the purpose of hydrogen-related pilot plants is to answer significant industry questions that impact green hydrogen scale-up and production costs with uncertainties in efficiency and degradation of production, component lifetimes, hydrogen storage, system efficiency and maintenance, control methods, and other critical aspects [8].
From the viewpoint of supervision and data exchange, a research pilot plant can also serve as a learning platform to test and validate technology advances, and component incompatibilities are more readily delineated and resolved [8].
It must be noted that a 30 kW PEM generator sits in a very interesting middle ground. It is a modest yet meaningful scale which offers the opportunity to reduce commercial risk and enable solid returns on major investments at commercial scale [8]. In fact, very few research-level hydrogen testbeds, typically based at universities, have been constructed at the kW scale [8]. The 30 kW electrolyzer in the present work is large enough to exhibit the same electrochemical and operational phenomena that appear in industrial systems, but still small enough to be instrumented in depth and to be deployed in research environments where experimentation is possible. This way, the developed pilot plant bridges the nexus between laboratory-based research (usually at the sub-kW scale) and industry-scale demonstrator projects (currently increasing to the MW and GW scale) [8].
The literature background is provided below, describing the most recent and/or noteworthy works dealing with hydrogen generation and storage in experimental facilities.
To begin with, some articles report very small-scale applications. For example, the data acquisition and visualization system of a PEM electrolyzer for implementing a digital twin is presented In ref. [13]. The electrolyzer is laboratory-scale, of very low power (36 W, 120 mL/min), and Grafana is used to design dashboards in order to visualize its main variables, emphasizing its applicability and benefits for this purpose. In ref. [15], the experimental validation of a small-scale photovoltaic and hydrogen system prototype based on PEM technology is carried out. In particular, they report a 2.1 kW photovoltaic array, a 4 kW solar inverter, and a PEM electrolyzer with a production rate of 3.6 L/h. The monitoring of the installation is performed using so-called “energy SCADA software” version 9.5, without providing details on how it is configured or on its functionalities.
A low-cost open-source monitoring system for PEM electrolyzers is reported In ref. [16]. A 1.2 kW electrolyzer prototype is used for validation under laboratory conditions. The system relies on an Arduino microcontroller and Excel for visualization of acquired data. The ongoing design of a digital twin of a microgrid including hydrogen is presented In ref. [17]. Grafana serves as the user interface to present real-time data, but there is no information in the publication about the power of the electrolyzer, and there are no figures of Grafana dashboards. The voltage control of a hydrogen microgrid is reported In ref. [5]. In this case, the electrolyzer is emulated through a 1.8 kW programmable electronic load, and Node-RED and Grafana are used for data exchange and visualization, respectively. Regarding communications, Ethernet and CAN lines are mentioned without further explanations.
When dealing with higher-power hydrogen generators, the following publications can be found. In ref. [18], a Programmable Logic Controller (PLC) is described for monitoring the safety of a hydrogen plant based on a 5.5 kW electrolyzer. The Modbus protocol and a SCADA system are mentioned, but neither the configuration of the implemented communication network nor the software used for such a supervisory system is detailed. In ref. [9], the deployment and operation of an alkaline electrolyzer integrated into a microgrid are described. This publication presents results on a testing platform for the photovoltaic generator and the fuel cell, but not for the electrolyzer. Regarding communications and supervision, the important role of the SCADA system is highlighted, although its implementation is not specified. In ref. [19], a microgrid including a 7.5 kW PEM electrolyzer is described. Regarding physical equipment, this publication does mention auxiliary devices such as a booster, valves, and pressure regulators. Concerning the supervisory system, the authors indicate that the Modbus TCP communication protocol is used to send data to a SCADA system developed with the proprietary Elipse E3 software using a structured database. In ref. [20], a controller is developed for the management of a 100 kW PEM electrolyzer. The authors use experimental data to model the hydrogen generator, and the control strategy is evaluated using simulated data. This publication does not include any mention of communications or supervision; it only indicates that a LabVIEW interface is involved.
A microgrid testbed including two commercial electrolyzers of different technology is developed and reported In ref. [8]. In particular, a 10 kW Anion Exchange Membrane (AEM) and 40 kW PEM hydrogen generators are used to produce renewable hydrogen from photovoltaic energy. The authors mention monitoring in terms of measuring and detecting hydrogen and leaks, but not regarding the monitoring and tracking of equipment operation.
The operation of a pilot-scale plant for green hydrogen production from photovoltaic energy is analyzed In ref. [6]. The paper describes the plant (photovoltaic generator, battery, 10 kW alkaline electrolyzer, and fuel cell) and includes detailed experimental results from the different phases (inerting, production, etc.). However, there is no information on the communications network or the monitoring system. In ref. [3], the retrofitting of a 19.5 kW alkaline electrolyzer for green hydrogen generation in a microgrid is described. The authors mention the ScadaBR software, which is open-source, as well as the CAN bus (Controller Area Network) and Modbus protocols. However, they provide very limited information on how the communication network is implemented, or on the development and appearance of the SCADA system. Weerakoon et al. [2] present the experimental results of a hydrogen-battery integrated system based on an Anion Exchange Membrane electrolyzer of 2.4 kW. A complete description of commercial equipment (electrolyzer and fuel cell) is reported. In such a publication, however, there is no information about how the monitoring of the facility has been solved. Regarding communications, Modbus TCP is mentioned but there are no more details about networks or data handling. In ref. [1] a self-sufficient demonstrative photovoltaic hydrogen plant for residential applications is described. An Anion Exchange Membrane electrolyzer of 2.4 kW and experimental data are reported. Regarding communications, protocols such as Modbus TCP and CAN are indicated, whilst a SCADA system is mentioned. However, there are no explanations about how data integration is approached or about the development of the monitoring system of the plant. In refs. [7] and [14] the authors develop an industrial IoT-featured monitoring system for a small-scale PEM electrolyzer (0.75 kW) under laboratory conditions. In this case, Grafana is applied for visualization purposes, Node-RED for data gathering and Modbus TCP for data transmission. It should be noted that, in both previous studies, the electrolyzer architecture was fully accessible, allowing for the integration of custom instrumentation and the implementation of a PLC program entirely configurable by the researchers. This represents a substantial difference with respect to the present work, where the PLC controlling the electrolyzer is factory-programmed and protected against modification. Consequently, access to internal control logic, parameter configuration and additional instrumentation is significantly restricted, limiting the degree of intervention that can be performed by the research team.
A comparison of previous publications is presented in Table 1, summarizing the main features such as electrolyzer type, power, monitoring approach, communication protocol and identified limitations.
Table 1.
Comparison of the main features of previous publications and the present proposal.
As can be observed, on the one hand, there are few publications dealing with electrolyzers of such high power and experimental nature. On the other hand, in most works, the hardware and software equipment used for supervision and data integration is presented only superficially, without providing information or details regarding its configuration or the reasons for its selection. Furthermore, the application of open-source environments for supervising hydrogen generators has been reported in very few scientific works, thereby highlighting the novelty of the present work. Following the literature review, it can be confirmed that the increasing number of scientific publications on experimental facilities reflects interest in this topic, although such publications are still scarce and highly valuable. The equipment employed and the supervisory system developed in this work exhibit a level of complexity and scale that is uncommon in the literature. Therefore, this article aims to contribute to the advancement of green hydrogen production and storage by providing experimental data and descriptions of a fully functional plant operating under real-world conditions.
To sum up, the main strength of the present work lies in the real-world implementation of a medium-scale hydrogen generation plant, the management of integration challenges and the fully customizable open-source supervisory system of the whole process.
The structure of the article is as follows. The second section describes the plant under study. The third section deals with the architecture followed to deploy the supervisory system and the communication network and their practical implementation is detailed in the fourth section. Then, experimental results under real-world conditions are reported, demonstrating the successful operation of the hydrogen plant and the supervisory system. Finally, the main conclusions of the research and future work are presented.
2. Materials and Methods
The hydrogen generation and storage plant consists of a photovoltaic power generation system that supplies a hydrogen generation, compression, and storage subsystem. Figure 1 schematically shows the different subsystems mentioned above.
Figure 1.
General schematic of the pilot plant.
First of all, the backbone of the data acquisition system is the data bus, which constitutes the interconnection between the supervisory system, i.e., the computer, and the data acquisition devices, enabling the capture, transmission, and management of operational information.
Secondly, the block diagram associated with the alternating-current electrical buses is defined, distinguishing between the single-phase and three-phase grids. The single-phase line supplies the auxiliary systems, including the compressed-air filtering and drying unit. On the other hand, the three-phase line supplies power to the equipment with higher energy demand, namely the electrolyzer and the compressor.
Finally, the hydrogen bus is described, comprising the generation, compression, and storage processes. In this subsystem, the electrolyzer produces hydrogen, while the compressor, through a pressure-boosting system, enables its conditioning and storage in cylinders, thereby ensuring efficient management of the generated gas.
The subsystems composing the plant from the energy perspective are described below.
- (a)
- Photovoltaic generator
Photovoltaic power generation is carried out by means of eight strings of fourteen LR5-72HPH modules connected in series, with a rated power of 545 W each. These strings provide a total power of 61.04 kW. This configuration was defined according to the architecture of the SOFAR 50-KTLM (Sofar Solar, Wuxi, China) inverter used, which includes four Maximum Power Point Trackers (MPPTs) and eight direct-current inputs, allowing for the connection of two strings per MPPT.
Consequently, the eight strings are electrically grouped in a 2:1 configuration, resulting in four combiner boxes, each associated with one MPPT. This arrangement optimizes the use of the inverter tracking capabilities and ensures proper management of the generated energy.
Figure 2 and Table 2 show, respectively, the physical deployment of the photovoltaic generator and its main technical characteristics.
Figure 2.
Overview of photovoltaic generator modules.
Table 2.
Variables of photovoltaic generator modules.
- (b)
- Hydrogen generator
The hydrogen generator is based on a 30 kW PEM electrolyzer, model SIRIO 500D, manufactured by ErreDue (Livorno, Italy), with a nominal production capacity of 5000 NL/h. It should be noted that the stated hydrogen production capacity of 5000 NL/h corresponds to the nominal value specified by the manufacturer of the commercial PEM electrolyzer. In turn, the 30 kW rating refers to the nominal power of the electrolyzer considered as an integrated system, including not only the stack but also its internal auxiliary components, such as the compressor, cooling systems, ventilation, and the automation and control system. Consequently, these values are presented as nominal specifications of the complete system and should not be interpreted as a direct calculation of the stack-level efficiency. The physical aspect of this equipment can be seen in Figure 3.
Figure 3.
SIRIO 500D electrolyzer.
Regarding the structural configuration of the PEM electrolyzer, it is composed of multiple electrochemical cells connected in series, forming a stack that enables the water electrolysis process. This electrochemical reaction involves the dissociation of water molecules into hydrogen and oxygen, as expressed in Equation (1):
where E denotes the electrical energy required to drive the electrolysis process.
2H2O (l) + E = 2H2 (g) + O2 (g)
The start-up process of the electrolyzer is structured as an automated three-stage sequence: hydration of the stack cells, inertization of the lines by means of nitrogen purging, and, finally, pressurization of the internal tank until the established operating pressure is reached.
In the context of this study, the system operates with a target storage pressure of 200 bar, which requires setting an internal pressure of 25 bar in the electrolyzer. Once the start-up sequence has been completed and the validity of the operating parameters has been verified, the equipment enters its normal operating regime.
During the hydrogen production phase, the opening of the hydrogen outlet valve constitutes a critical aspect to avoid undesired transients. An abrupt opening may generate flow-rate peaks derived from the pressure gradient between the internal tank and the feed line of the compression system, which triggers “excess gas consumption” alarms and the automatic closure of the valve. Therefore, the start of hydrogen production must be carried out progressively through the sequential opening of a pressure regulator.
The first step carried out is the hydration process of the cells composing the stack. This step is essential to ensure adequate proton conductivity of the membrane, thereby enabling efficient proton transport and preventing premature degradation during start-up.
The second step is the inertization of the lines through which the gas will circulate, by purging them with an inert gas, namely nitrogen. This process is carried out to remove any potentially residual air and oxygen. This action prevents the formation of explosive mixtures and ensures safe conditions prior to hydrogen production.
The third and final step is the pressurization, as show as Figure 4, of the electrolyzer internal tank up to the operating pressure. Once the parameters are correct, the electrolyzer enters its normal operating regime.
Figure 4.
Pressurization of the electrolyzer.
- (c)
- Hydrogen storage
Hydrogen storage is carried out by means of a system comprising 18 pressurized B50-type cylinders (50 L, 200 bar), interconnected through AISI 316 stainless-steel manifolds with welded joints, ensuring the tightness and safety of the system. The assembly incorporates pressure instrumentation (0–300 bar) and provides a total capacity of 900 L.
To achieve the storage conditions, the installation includes a pneumatic compression subsystem composed of a SIRIO air compressor (15 kW, up to 10 bar), shown in Figure 5, and a Haskel booster, shown in Figure 6, which uses compressed air as the driving fluid to increase the hydrogen pressure from the electrolyzer outlet to the required levels. This solution enables efficient compression without electrical equipment being in direct contact with hydrogen, thereby improving system safety.
Figure 5.
SIRIO compressor, 15/10 bar.
Figure 6.
Haskel booster.
As a preventive maintenance measure, the incorporation of a compressed-air drying subsystem is required, as well as an oil filter intended to protect the pressure-boosting equipment. The presence of oil in the air line is due to lubricant carryover from the mechanical components of the compressor during the compression process. The removal of these contaminants improves the efficiency of the pressure booster and prevents its premature deterioration, thus ensuring more reliable system operation.
Table 3 details the characteristic variables of both compression systems.
Table 3.
Variables of compressor and booster.
3. Supervision, Data Acquisition and Integration
The acquisition, storage, and visualization of the plant operating data are implemented through a software architecture based on open-source tools that are increasingly being developed and adopted in industrial and energy supervision environments. In particular, the infrastructure consists of the Node-RED integration platform, a MariaDB database management system administered through phpMyAdmin, and the Grafana visualization environment. The distribution licenses associated with these software environments are as follows: GNU Affero General Public License version 3 (AGPLv3) for Grafana, Apache License 2.0 for Node-RED, and GNU Affero General Public License version 2 (AGPLv2) for phpMyAdmin and MariaDB.
The system has been orchestrated according to a four-level multilayer IIoT architecture [14], as shown in Figure 7. At the sensing layer, the field devices capture the process variables; at the network layer, the data are transmitted through industrial protocols such as Modbus TCP and HTTP. The intermediate layer acts as middleware, where the data are integrated and processed using tools such as Node-RED and MariaDB. Finally, at the application layer, Grafana enables the visualization and analysis of the information, thereby completing a structured and scalable flow from data acquisition to supervision.
Figure 7.
IIoT architecture.
3.1. Network Layer
In the present case, this layer includes Modbus TCP, which is widely recognized as a de facto standard for industrial communication networks. Currently, the TCP implementation of Modbus is regarded as an IoT protocol, resulting from its continuous evolution and adaptation to modern decentralized architectures [7]. Communication is based on a client/server model, in which both nodes establish connectivity through IP addressing.
3.2. Middleware Layer
Node-RED is used as an integration and communication orchestration environment, enabling data acquisition from the different plant devices through industrial protocols, mainly Modbus TCP. This platform, based on flow-oriented programming, facilitates the implementation of processing logic, data transformation and normalization, as well as the efficient management of communications between field devices, such as the electrolyzer and the photovoltaic inverter, and the upper data storage and supervision layers.
Furthermore, Node-RED acts as middleware within the proposed architecture, enabling the decoupling between the acquisition layer and the data storage layer through the generation and adaptation of information structures for their insertion into relational databases. Additionally, it facilitates the implementation of basic control mechanisms, event management, and real-time processing, which is particularly relevant in environments with high operational variability.
Its modular architecture, extensible through specific nodes, together with its compatibility with multiple industrial protocols and communication standards, makes it a robust and flexible solution for the development of monitoring and supervisory systems in energy applications and industrial automation [5,7,13,14].
Concerning the data storage, the acquired information is stored in a MariaDB relational database, selected for its robustness, scalability, and efficiency in handling large volumes of time-series data. Its increasingly widespread adoption in industrial monitoring environments, together with its compatibility with SQL standards, makes it a suitable solution for the structured storage of process variables.
Database management and administration are carried out through the phpMyAdmin web interface, which enables the creation, modification, and maintenance of schemes and tables, as well as the supervision and validation of the stored records. This approach facilitates the organization of data according to their nature and sampling frequency, ensuring the integrity and traceability of the information.
Furthermore, the database structure is oriented towards the historical storage of process variables, enabling their subsequent exploitation for operational analysis, system performance assessment, and the development of optimization strategies.
3.3. Application Layer
Data visualization and analysis are performed in the application layer using Grafana, a cloud-based time-series-oriented monitoring platform that enables the development of interactive supervisory dashboards. Through this tool, it is possible to represent, in real time, the behavior of the different plant subsystems, including hydrogen production and the electrical variables of the photovoltaic generator.
The direct integration of Grafana with the MariaDB database enables access to both real-time data and historical records, facilitating the generation of advanced graphical representations and the analysis of operational trends. Moreover, the configurability of dashboards and queries allows the visualization environment to be adapted to different supervision levels, ranging from basic monitoring to detailed analysis of system performance.
Overall, the proposed software architecture enables the implementation of a flexible, scalable, and low-cost supervisory system, suitable for real-time monitoring of the plant energy processes.
In conclusion, the developed software architecture integrates data acquisition, storage, and visualization into a coherent and efficient workflow based on Node-RED, MariaDB, and Grafana. This solution enables real-time monitoring and historical analysis of the plant energy processes, ensuring data integrity and accessibility. Furthermore, its modular, scalable nature, together with its reliance on open-source tools, promotes the replicability of the system and its adaptation to other hydrogen generation and storage facilities. Therefore, Section 4 provides a detailed description of each stage involved in the data acquisition, storage and visualization processes, with the aim of enhancing the transparency and reproducibility of the proposed architecture. This level of detail facilitates the replication, adaptation and validation of the system by other researchers working on hydrogen production, industrial monitoring and IIoT-based supervisory applications.
4. Implementation
4.1. Communication with the Electrolyzer
This section develops the procedure for implementing an external communication system with the electrolyzer in order to overcome, mitigate, and address the limitations of the closed control system provided by the manufacturer. The main limitation identified lies in the absence of historical information provided by the equipment itself, since the available variables are presented only as instantaneous values through the embedded, proprietary, and non-modifiable HMI. This restriction is especially relevant in the context of a research pilot plant, where the analysis of the temporal evolution of the operating parameters is essential to correctly interpret the behavior of the system. Consequently, certain operating situations cannot be adequately analyzed without a historical record that provides context.
The limitations outlined for the built-in HMI require local supervision, demanding the constant presence of an operator and the visual monitoring of analog instrumentation in order to stabilize the operation. In addition, this lack of information limits the understanding of the system’s dynamic behavior under different operating conditions. Thus, the need to implement an external supervisory system is justified, allowing for the historical recording of data and the analysis of trends based on the production regime and operating time.
It should be highlighted that system control is performed by an AC500 PLC manufactured by ABB (Zurich, Switzerland), whose access is restricted by the manufacturer. This prevents inspection of the internal operating logic and limits the ability to intervene in the process. This circumstance further reinforces the need to develop an external solution enabling the acquisition, storage, and analysis of operational data. It should be noted that all the variables presented in Table 4 are obtained through the PLC embedded in the commercial electrolyzer.
Table 4.
Electrolyzer variables and corresponding Modbus addresses.
In this context, data acquisition is developed using Node-RED, following the architecture described in the previous section, where Node-RED acts as the Modbus client and the embedded PLC acts as the server. To establish this data exchange, it is necessary to access the variables available in the PLC. These variables are reported in Table 4, which shows the variable map. This table includes the variable names, a brief description, the Modbus address, the data range, and the scaling level associated with each data item.
As shown in Figure 8, this is a local connection among the devices interconnected within the plant. The IP addresses used are local addresses, thereby preventing direct access from the Internet. However, remote access to the plant supervisory system is possible from any device connected to the LAN network.
Figure 8.
Plant network IP addressing scheme.
Furthermore, the computer, database, and supervisory system are protected using strong username and password authentication. In addition, physical access to the plant is strictly restricted to authorized researchers.
The relevant process variables are structured into three main blocks, as shown in Figure 9 and Table 4. This segmentation is due to the non-consecutive arrangement of the memory addresses, which motivated their grouping into three independent readings in order to increase the robustness and reliability of data acquisition. In this context, the analyzed variables correspond to the fundamental system parameters on which the study is focused.
Figure 9.
Node-RED electrolyzer communication.
As shown in Figure 9 corresponding to the complete view, the flow incorporates different debug nodes that allow the data processing to be verified at each stage. The first node displays the raw readings obtained from the PLC, whereas the second one, located at the output of the function block, presents the variables after processing and scaling.
Regarding the sampling time, a period of 200 ms is configured. This sampling time enables the evolution of the variables to be visualized, allowing for a comprehensive understanding of the system without overloading the communication system. This ability to adjust the sampling time makes it possible to accurately understand the variability in hydrogen generation through the pipelines carried out by the electrolyzer.
The use of Node-RED provides a highly flexible framework that can be tailored to the specific data acquisition requirements of the application. In the present case, the platform was configured to capture pressure fluctuations generated by the booster system. Consequently, the selected sampling interval was chosen to ensure an adequate temporal resolution, enabling the acquisition of a representative dataset capable of accurately characterizing the dynamics of the hydrogen production process. For process variables exhibiting slower temporal variations, longer sampling intervals may be adopted without compromising the quality or relevance of the acquired information.
The programming structure is designed so that the code is encapsulated within a single block. This facilitates its handling and simplifies error detection by organizing the logic into different “function” blocks.
Communication with the PLC is established through the standard Modbus TCP port 502. Each device on the network is assigned a local IP address according to the IP addressing scheme shown in Figure 10.
Figure 10.
Properties of the Modbus-Read node and Modbus TCP server.
As previously described, the variable programming is orchestrated by segmenting the Modbus client requests according to their respective addresses as shown in Figure 11.
Figure 11.
Code of the Node-RED function node.
The processing of the variables is carried out through the code implemented within the “function” block. To start with, a data-safety layer is programmed for the incoming data in order to avoid obtaining null values. Next, the vector used to define and scale the variables received in the first segment of the client request is defined. Afterward, the block of variables that will be used later is established, known as Block 1.
It is worth highlighting the presence of key variables, such as the operating pressure and the hydrogen outlet pressure. The latter constitutes one of the main objects of study of the present manuscript, as it enables the analysis of the behavior of the pressure booster within the storage system and its influence on the operation of the electrolyzer. Likewise, other relevant variables are considered, such as stack temperature, water volume and consumption, and production percentage, among others, to comprehensively characterize the performance of the system.
After defining the variables, the SQL command is created. The last two lines are particularly relevant for improving the efficiency of the Node-RED flow. Loading Block 1 into the payload makes it possible to visualize the instantaneous variable readings in the Node-RED debug node and, therefore, to confirm and verify that the acquisition process is correct. For this reason, the implementation is based on segmented and low-level programming.
Prior to storage in the database, it is necessary to adapt the data structure to the format required by the SQL insertion node. To this end, a “change” node is used, whose function is to transfer the objects previously stored in “dbValues” to the “payload” field. Initially, the “payload” contains the structure corresponding to the reading block, “Block 1”; after applying this node, it contains the formatted data, “dbValues”, according to the requirements of the storage node. The configuration of this process is observed in Figure 12.
Figure 12.
Configuration of the Node-RED change node.
Finally, the data are sent to the database through the MySQL node. The corresponding configuration is shown in Figure 13. As can be observed, the IP address corresponds to “localhost”, since this is a local connection within the same PC. The communication port is 3306, which is commonly used for data exchange with databases and must also be used by Grafana, as described in Section 3.3.
Figure 13.
Properties of the MySQL database node.
4.2. Communication with the Inverter
The pilot plant is supplied by photovoltaic energy, and communication with the inverter is also implemented using the Modbus TCP protocol. This confirms the ability of integrating all the equipment using the same communication protocol, as shown in Figure 14.
Figure 14.
Communication flow of the inverter nodes in Node-RED.
This communication enables access to both instantaneous production values and historical production records, thereby allowing for the construction of a complete database for the analysis and supervision of the photovoltaic subsystem. This section describes the connection implemented with the inverter, as well as the variables acquired through the Modbus TCP protocol. The measured variables are presented in Table 4, as well as the corresponding Modbus addresses.
The client/server configuration is implemented analogously to that used for the electrolyzer. In this case, the inverter acts as the Modbus server, whereas Node-RED acts as the client. Likewise, read requests to the registers are also segmented, since the variables of interest are not stored in consecutive addresses.
As previously indicated in Section 2, the inverter includes four MPPTs. For this reason, each input is evaluated independently to supervise the voltage and current associated with each photovoltaic production string. This strategy enables more accurate operating diagnostics, as well as the detection of possible deviations, faults, or performance losses in the photovoltaic modules.
In addition to the variables associated with the DC inputs, the inverter output variables are also acquired. Since it is a three-phase system, the electrical magnitudes per phase, the grid frequency, and the total generated power are recorded. Overall, these parameters provide the information required to perform a complete supervision of the photovoltaic generation subsystem from both an operational and an energy perspective.
4.3. Data Storage
Data storage constitutes a critical component within the system architecture. In line with the open-source tool-based approach adopted in this work, a solution based on the MariaDB database is implemented. Database administration, configuration, and maintenance are carried out through the phpMyAdmin web interface, as indicated in Figure 15.
Figure 15.
Database variables managed through phpMyAdmin.
The configuration is defined so that each subsystem has a dedicated database. Thus, two clearly differentiated databases are available: one corresponding to the electrolyzer and the other to the inverter. Two relevant variables are included in each table, serving not only to organize the acquired data according to date and time, but also as an index to order the data within the Grafana visualization tool.
Regarding the electrolyzer, three variable tables are created according to the three read requests implemented in Node-RED. The objective is to preserve the organizational structure previously established in the communication section. This organization is key to identifying possible programming errors and, if future modifications to one of the tables are required, to keeping the remaining tables active. The variable sampling time is configured through Node-RED.
Following the same storage programming scheme, the inverter tables are arranged in a similar way, establishing a division according to the variables grouped by their corresponding memory addresses.
4.4. Data Visualization and Supervisory System
As mentioned in Section 3, the visualization of historical data is carried out through Grafana. In this regard, the visualization environment is developed according to the key variables under study, defining several supervisory dashboards with different visualization approaches.
First, the connection to the MariaDB database is established through port 3306 configured in Grafana, as shown in Figure 16. The corresponding username and password are also included to protect data access. Once the time-zone configuration has been completed, to prevent possible errors derived from time differences, the database connection is established and tested.
Figure 16.
Connection host URL.
Next, the dashboards are configured according to the preferences defined by the user. Subsequently, the visualizers are parameterized in a time-series format, which is the most suitable representation for analyzing the evolution of the different subsystems.
This way, the supervisory dashboard includes the most relevant energy and production variables over time. Monitoring the electrolyzer stack’s consumption levels is necessary to track its evolution throughout the production process, as well as the volume and consumption of available and used water. Nevertheless, the variables that may be of greatest interest, such as the hydrogen production rate, operating and outlet pressures, and stack temperature, are clearly defined in this dashboard, constituting the core elements of the supervisory system.
An example of the configuration of the Grafana time-series panel can be found in Figure 17, where the selection of variables and other parameters are edited by SQL command in the code part. In this particular case, the panel corresponds to two magnitudes.
Figure 17.
Grafana panel configuration code.
On the other hand, the inverter dashboard is focused on the most significant variables of the photovoltaic subsystem. In this case, the main variables are the total production levels and the energy variables associated with each MPPT. As with the electrolyzer, the inverter does not provide historical data storage capabilities. Since the inverter only displays instantaneous values, it is not possible to perform proper supervisory tasks on the key operating parameters without an external data acquisition and visualization system. The development of this dashboard therefore enables detailed monitoring of photovoltaic production levels and inverter efficiency. This latter aspect also makes it possible to continuously monitor the condition of the photovoltaic panels, allowing potential generation issues or degraded panel performance to be identified.
5. Results
The development of the SCADA system through the technologies and procedures previously described yielded a series of results that enabled the identification of different operating behaviors within the pilot plant. The visualization of the most critical parameters was essential for analyzing the interoperability among the components of each subsystem, especially in the case of the electrolyzer. Likewise, the evolution of the photovoltaic generation system was also observed, as it constitutes another essential element within the overall process.
As mentioned before, one of the main objectives of this work is to determine the proper operating point in terms of production levels, as well as to set the optimal conditions to improve the control of the plant. This is necessary to ensure equipment durability, prevent premature aging, and guarantee stable and safe operation. Similarly, it is essential to fully understand the behavior of each of the devices involved, in order to confirm their proper integration within the general system architecture.
This section describes the evolution of the system under different operating states, regimes, and tests, together with the behaviors observed in each case. On the one hand, hydrogen production is analyzed; on the other hand, the operating pressure and outlet pressure associated with the process are examined. These three variables constitute key parameters for interpreting the operation of the electrolyzer and its production regime.
Two 50-inch screens are used to display the graphs with the collected data. Figure 18 shows the appearance of these screens with some results from the pilot plant operating under real conditions.
Figure 18.
SCADA system workstation.
The core of this pilot plant is the hydrogen generator. During the tests, numerous start-ups were carried out in which patterns of behaviors, evolutions in terms of production, and system warnings were observed that were continuously repeated. Nevertheless, the manufacturer does not provide any useful information to determine the reason for these behaviors.
Some warnings provided by the manufacturer, such as “high hydrogen temperature”, are of limited operational usefulness, as they do not include quantitative information regarding the actual temperature value or the causes that led to the warning. This lack of detail prevents the identification of the internal variations or operating conditions that triggered the alarm, thereby hindering the analysis of the electrolyzer behavior and the adoption of well-founded operational decisions.
This situation motivated the development of a system capable of supervising parameters that could help identify the underlying problem, not only determining what triggers it, but also how it evolves. Examining the components of the hydrogen generator and evaluating the historical data were therefore decisive for understanding its behavior over time.
As previously described in Section 2 (c) Hydrogen storage, the use of a pneumatic pressure booster is required to reach the high pressure needed for storing the generated hydrogen. As derived from the tests carried out, the operating conditions of this equipment directly influence hydrogen production, as well as the premature aging of the components of both the booster itself and the electrolyzer.
Another situation that motivated the development of the SCADA system was the need to supervise the variables involved in hydrogen generation and stabilization. This supervision made it possible to regulate production and also provided a better understanding of the hydrogen compression process.
Once the start-up operations previously described in Section 2 were completed, hydrogen production was regulated by acting on the pressure regulator. Three plots are presented in Figure 19. The upper plot shows the production level, represented in green, expressed in normal liters per hour, NL/h. The intermediate plot shows the operating pressure, represented in purple, and the hydrogen outlet pressure, represented in orange. Finally, the last plot corresponds to the stack temperature, represented in red.
Figure 19.
Temporal evolution of the electrolyzer during the four tests performed.
Figure 19 shows the behavior of the electrolyzer throughout the tests performed. Likewise, Table 5 summarizes the ranges of the main variables corresponding to each test, as well as the time interval considered between them.
Table 5.
Summary table of the experimental tests.
5.1. Test 1
The production level was set to 60% of its nominal capacity, while the compressed-air flow rate was adjusted to 15%. This configuration enabled stable electrolyzer production within the range of 6 to 13 bar. No abrupt variations related to hydrogen production or stack temperature were observed.
In this operating regime, hydrogen production is observed to oscillate between 2400 and 3200 NL/h. The middle plot in Figure 20 clearly portrays each pressure pulse produced by the pressure booster during hydrogen generation. This event is highly relevant for analyzing the operation of the production and storage process since it involves a variable operating point, i.e., a variable generated flow rate, also referred to as dynamic operation. In fact, as stated in the previous literature, dynamic operation negatively affects the degradation and performance of PEM-type stacks [21,22].
Figure 20.
Results over time of Test 1.
5.2. Test 2
In this test, the production level was adjusted to intermediate values, around 2300 NL/h, corresponding to 45% of the nominal capacity, while the compressed-air flow rate supplied to the pressure booster was increased up to 40% of its maximum value.
Under these operating conditions, as shown in Figure 21, a substantial improvement in the stabilization of the hydrogen production pressure was achieved. In fact, there are no longer any noticeable oscillations due to the booster. The operating pressure remained constant at the stipulated production value of 25 bar, as in Test 1, indicating normal operation and no difficulty for the stack in reaching the required internal hydrogen pressurization levels. Regarding stack temperature, it can be noted that it remained around 50 °C during the test.
Figure 21.
Results over time of Test 2.
In this configuration, the outlet pressure stabilizes between 4 and 6 bar. An increase in the pressure booster pulsations is observed as a result of the higher supplied compressed-air flow rate. In this way, the pressure booster chamber does not fill completely and empties before reaching a pressure of 25 bar, thus achieving stability of the hydrogen outlet pressure and reducing the difference between maximum and minimum values.
According to the above, the use of a pressure booster has a direct influence on the production profile. The observed fluctuations may cause premature aging of the electrolyzer components; therefore, further operating conditions will continue to be tested in order to study the evolution and dynamic behavior of the system.
5.3. Test 3
Figure 22 presents the results obtained after introducing new adjustments to the system configuration. In this scenario, hydrogen production is progressively increased from 0% up to 100% of the nominal capacity within a 15 s interval, achieving a stable flow rate of 5000 NL/h.
Figure 22.
Results over time of Test 3.
Regarding the pressure booster, maintaining the compressed-air flow supplied to the pressure booster at 25% of its total capacity, a hydrogen flow without significant fluctuations is achieved. However, this configuration leads to a high actuation frequency of the internal piston of the pressure booster. This operating regime is counterproductive in this type of production system, since the vibrations generated by the booster may have detrimental effects on the pipelines connected to it, including the hydrogen and compressed-air inlet lines, as well as the pressurized hydrogen outlet line.
Consequently, operation under these conditions may promote future disconnections, leakage, or failures in the threaded fittings of the flexible hoses, particularly due to the high storage pressures, ranging from 0 to 200 bar. As a consequence of operating at nominal hydrogen production, an increase in stack temperature from 49 °C to 51 °C was observed, together with a slight rise in the hydrogen outlet pressure, as can be seen at the end of the graph.
5.4. Test 4
In a fourth test, the compressed-air flow rate supplied to the pressure booster was adjusted to 5% of its total flow capacity, while the hydrogen flow rate was regulated to 4500 NL/h, corresponding to 90% of the nominal production capacity. The results obtained with this configuration are shown in Figure 23.
Figure 23.
Results over time of Test 4.
As a result of regulating the compressed-air flow rate, a more linear behavior was achieved in both hydrogen production and pressure booster pulsing. Under this operating scenario, the cycles were reduced and the hydrogen outlet pressure ranged between 18 and 25 bar. As shown in previous configurations, the outlet pressure did not reach the operating pressure, whereas this new configuration does allow it to be reached. In this way, by reducing the pulse rate, there is enough time for the outlet pressure to be reached both in the chamber and in the pipe.
In this case, as can be observed in Figure 23, production is constrained within the range of 4000–5000 NL/h, with a lower number of booster pulses than in the previous cases. Operation under this regime leads to an increase in stack temperature. While a gradual increase had been observed in the aforementioned test, under this configuration the stack temperature remains at a maximum value of 52 °C.
As a consequence of these tests, a new and more efficient control algorithm is currently being developed to manage the overall operation of the pilot plant.
5.5. Test 5: Achievement of Thermal Stabilization Under Real-World Operating Conditions
To achieve a stable behavior, with fewer fluctuations in hydrogen production, and in view of the previous results, a set of changes were made to the electrolyzer configuration. This last test corresponds to a hydrogen production level of 80% of the nominal flow rate, that is, 4000 NL/h, together with a compressed-air supply to the pressure booster set at 15% of its total capacity. Figure 24 shows the evolution of the system over a 25 min period, and a progressive increase in stack temperature from ambient temperature, around 20 °C, up to 45 °C is observed.
Figure 24.
Results of Test 5 over 25 min.
The smoothing of hydrogen production observed at 10:30 in Figure 24 refers to the slight increase in the booster feed pressure, which causes a higher number of pulses and smooths the hydrogen production profile, as previously discussed.
On the other hand, Figure 25 shows a more conservative configuration during a longer interval in comparison with previous tests, namely, over a period of 5 h and 20 min. In this case, the compressed-air flow rate is kept at 15%, but the hydrogen production is reduced to 20% of its total flow rate, 1000 NL/h. During this test, an increase in stack temperature was observed as the production level rose, showing a direct relationship between the flow rate and the stack temperature. Figure 25 shows the hydrogen production at a pressure of 4 bar with a stabilized temperature between 46 °C and 53 °C. Once this temperature threshold is reached, the electrolyzer internal cooler comes into play and regulates the temperature for the remainder of the test.
Figure 25.
Controlled hydrogen production over a 5 h and 20 min period.
The change in production was intentional; the production level was slightly increased for a few minutes, which also led to an increase in the stack temperature.
5.6. Temperature Analysis
The temperature is an essential operating parameter, especially for PEM electrolyzers, to be able to provide optimum efficiency and safety and prevent premature aging or destruction [23].
In the literature, many theoretical models express temperature dependence relationships of parameters such as current density, voltage, activation overpotential, reversible cell potential, open circuit potential, etc. [24]. Even so, there are purely theoretical models and others that are empirical or semi-empirical; there is no standard pressure and temperature range, and in some works different anode and cathode temperatures are even considered [24].
Despite the valuable contributions based on theoretical models, in a real-world plant, measuring these variables is difficult or impossible, so the information provided by the equipment and the manufacturer must be used. Given the relevance of this variable, the importance of measuring, recording and visualizing stack temperature is clear, so it was considered appropriate to include a subsection to discuss its behavior throughout the described tests.
Thanks to the creation of historical data records and detailed visualization through Grafana, it was also possible to observe the evolution of the stack temperature. In the graph shown in Figure 26, its evolution is represented in red, together with its behavior during the different tests previously carried out, which confirms the observations discussed above regarding the operating values of the stack.
Figure 26.
Temperature analysis over the carried-out tests.
As shown in Figure 26, during the first 35 min of operation, the temperature increases from ambient temperature, 20 °C, up to a maximum value of 50 °C. After that, the stack temperature stabilizes during the following 20 min of operation within the range of 48–52 °C. The active cooling method consists of a chiller composed of a radiator and a fan, which evacuates heat from the cabinet where the stack is located. As observed in the graph, the temperature remains within the aforementioned range for the rest of the test.
5.7. Photovoltaic Generator
Figure 27, Figure 28 and Figure 29 present the variables associated with photovoltaic production during a sunny day, as provided by the inverter.
Figure 27.
Total inverter power output.
Figure 28.
AC variable evolution over time.
Figure 29.
DC variable evolution over time.
On the one hand, the total power generated by the photovoltaic system is shown in Figure 27, reaching a maximum value of 50 kW and a minimum value of 0.5 kW during the analyzed interval. Furthermore, the bottom plot shows the evolution of the four MPPTs. As can be observed, all of them consistently follow the total generated power curve. Since these are independent variables, this behavior indicates that the four MPPTs are properly balanced. The power values produced by each MPPT range approximately from 0.125 kW to 12.5 kW.
On the other hand, Figure 28 and Figure 29 show the electrical variables associated with the voltage and current of the MPPT inputs, as well as those corresponding to the three-phase AC output.
In Figure 28, the three AC phases are represented together, with voltage values ranging from 0 V to 248 V and current values ranging from 0 A to 70 A. Each of the phases is identified in a different color. This programming approach was selected to facilitate the identification of each phase at a glance and to clearly determine whether any irregularity exists in any of them, as well as in any of the phases.
Figure 29 shows the voltage and current values corresponding to the four MPPTs. As can be observed, the graph showing the DC variables is divided into four colors (red, green, yellow, blue) to identify each of them with each MPPT.
The voltage values are presented in the left plot, ranging from 0 V to a maximum of 610 V. In the right plot, the current values are shown, ranging from 0.5 A to a maximum of 25 A.
Based on the representation shown above, the proper balance among the four MPPTs of the inverter is evidenced. This behavior results in a balanced input power and, consequently, in a stable AC output.
6. Discussion
Commercial equipment is closed-source; that is, the hydrogen generation system developed by the manufacturer is a black box and the associated control system is closed and cannot be modified by the user. For safety and warranty reasons, this feature makes sense, but in a research context it is necessary to be able to directly measure some variables as well as to be able to modify operating parameters and commands in order to optimize behavior or to detect or even prevent degradation. Furthermore, these results demonstrate the suitability and effectiveness of the presented supervision system.
The designed user interfaces provide instant information and historical evolution of key plant variables, especially critical magnitudes of the hydrogen generator. In this way, the SCADA system promotes the monitoring and tracking of plant operations and allows for informed decision-making and intervention in case of anomalies or alarm situations. Furthermore, access to the acquired data is possible remotely, through a web browser, facilitating online supervision.
The supervisory and communications system is completely open, functional, and replicable, described in detail to help other researchers who want to develop open systems that overcome the limitations of commercial equipment.
The choice of open-source technologies, namely Grafana and Node-RED, is aligned with the modern trend of using this type of resource for automation and monitoring purposes, even for renewable and hydrogen-related plants [7,13]. As the results prove, these environments are successfully applied and provide seamless data management and interactive supervision of the key variables of the electrolyzer and of the whole pilot plant.
Moreover, particularly regarding the supervisory aspect, it must be noted that cloud-based monitoring systems have become fundamental tools for real-time analysis and visualization of complex data, particularly those leveraging Grafana [13]. In this regard, implementing cloud-based monitoring and Grafana dashboards for the investigation of PEM electrolyzers allows for safe, scalable data storage, collaborative visualization, anomaly detection, and faster analysis of experimental data [13].
An additional advantage of using open-source technology is its low-cost nature. Even in this case, Grafana, Node-RED and MariaDB are completely free. This way, reducing the expenses associated with supervision and data management contributes to spreading the deployment of hydrogen-related equipment [7].
According to the scientific literature consulted to date, this work is the first to apply open-source technology, specifically Grafana and Node-RED, for data management and supervision of a real-world hydrogen generation facility with such high power.
In fact, thanks to the use of Grafana, real behaviors of the hydrogen generation and storage system were detected. These behaviors would be impossible to detect using the HMI provided by the manufacturer. Specifically, as discussed in Section 5.1 of the results, shattering of the electrolyzer outlet pressure is observed. Furthermore, these phenomena are not observable in instantaneous values or in curves with a sampling time that is too long, which would produce overly smoothed curves, masking these phenomena. These behaviors cannot be observed in simulation proposals and are not generally found in the manuals and data sheets provided by the manufacturer. These behaviors have a critical impact on the degradation and lifespan of the electrolyzer stack. The acquired and visualized data allow for their study and analysis.
Furthermore, the developed architecture follows a modular and decoupled design approach, significantly enhancing the system’s resilience and operational reliability. Consequently, a failure in the visualization layer, such as an interruption of the Grafana service, does not affect either data acquisition or storage processes, which continue operating independently. As a future improvement, the implementation of a redundant infrastructure based on Raspberry Pi devices is proposed to further improve fault tolerance, increase system availability, and ensure the continuity of supervisory and monitoring functions.
As stated in the Introduction, managing interoperability and compatibility is currently an unresolved task. To advance in this direction, this work uses the standardized and open industrial protocol Modbus TCP, which allows for the interoperability of heterogeneous equipment that must be seamlessly integrated. In this way, an effective exchange of data was achieved between the main components (inverter, electrolyzer, SCADA system).
In this regard, it is noteworthy that the Node-RED middleware can handle a vast number of communication protocols, which justifies its selection within the developed architecture. Even if it were necessary to integrate some equipment through a different interface, protocol, or communication method, it could be easily done using Node-RED, which is also an advantage of this work.
A key aspect is the detection, notification and acknowledgment of alarms and abnormal situations of the hydrogen generator. Without the developed SCADA system, monitoring operational magnitudes in comparison to their nominal ranges would only be possible in situ, that is, with the operator constantly in front of the integrated HMI screen.
Despite the successful results, some limitations of the work have arisen. The main disadvantage of using open-source technology is the need for programming knowledge (such as JavaScript) to implement advanced features.
A limitation associated with cybersecurity is the presence of inherent vulnerabilities in the software components employed within the proposed architecture [14]. Examples include the Common Vulnerabilities and Exposures (CVEs) reported for Grafana (CVE-2026-33376 and CVE-2026-33377) and Node-RED (CVE-2025-41656). Although the pilot plant currently operates within an isolated network environment without Internet connectivity, mitigating these risks remains an important consideration for future deployments. To address this limitation, security patches and software updates will be systematically applied to remediate known vulnerabilities. Furthermore, future developments will incorporate more secure communication mechanisms, including Transport Layer Security (TLS) and Hypertext Transfer Protocol Secure (HTTPS). In addition, the adoption of Modbus TCP Security, which encapsulates Modbus TCP traffic within TLS, is envisaged to provide authentication, integrity, and confidentiality for industrial communications. These measures will contribute to enhancing the overall cybersecurity posture of the supervisory architecture and improving its suitability for deployment in larger-scale industrial environments.
Furthermore, the measurements currently available are largely limited to the process variables provided by the proprietary PLC integrated within the electrolyzer. Consequently, additional parameters required for a more comprehensive characterization of the system will be acquired through external instrumentation independently installed by the research team. Future work will address this limitation by expanding the sensing infrastructure, with particular emphasis on the evaluation of system efficiency from both electrical and hydrogen production perspectives. Such enhancements will enable a more detailed assessment of energy performance and contribute to a deeper understanding of the operational behavior of the plant.
7. Conclusions
This paper has reported the development and implementation of a pilot plant for green hydrogen production from photovoltaic energy and the required supervisory system. Hydrogen is generated through a commercial 30 kW PEM electrolyzer and open-source technologies are used to gather and supervise the operational variables of the equipment.
The architecture to deploy the supervisory system and its implementation have been described in order to contribute to the scarcity of this information in previous publications.
To prove the suitability of the system, a set of experimental tests have been conducted under different operational parameters, mainly modifying the hydrogen production flow and the pressure of a pneumatic booster.
The results have been analyzed and highlight the relevance of setting different operating regimes to achieve stable hydrogen production and to mitigate severe actions that cause premature aging of the electrolyzer.
These adjustments have been possible thanks to the supervisory system, overcoming the limitations imposed by the electrolyzer manufacturer and enabling research activities.
The main strength of the present work lies in the real-world implementation of a medium-scale hydrogen generation plant, the management of integration challenges and the fully customizable open-source supervisory system of the whole process.
Future research guidelines are mainly focused on developing an energy management strategy taking into consideration the achieved results in order to optimize the balance between the photovoltaic generator and the green hydrogen production. Moreover, to this purpose, increasing the instrumentation and measurements in the electrolyzer, such as energy meters, will also be approached. Future research will focus on the development and implementation of advanced cybersecurity countermeasures aimed at strengthening the robustness, resilience, and security of the proposed monitoring and supervisory framework.
Author Contributions
Conceptualization, I.G. and A.J.C.; Methodology, I.G., D.C. and A.J.C.; Validation, A.J.C.; Investigation, I.G., D.C. and A.J.C.; Data Curation, D.C. and A.J.C.; Writing—Original Draft Preparation, I.G., D.C. and A.J.C.; Writing—Review and Editing, I.G. and A.J.C.; Supervision, I.G. and A.J.C. All authors have read and agreed to the published version of the manuscript.
Funding
This work has been supported by MCIN with funding from European Union Next Generation EU (PRTR-C17.11) and by the Junta de Extremadura with funding from European Regional Development Funds (FEDER).
Institutional Review Board Statement
Not applicable.
Informed Consent Statement
Not applicable.
Data Availability Statement
The datasets presented in this article are not readily available because the data are part of an ongoing study. Requests to access the datasets should be directed to authors.
Conflicts of Interest
The authors declare no conflicts of interest.
References
- Maestre, V.M.; Ortiz, A.; Ortiz, I. Sustainable and self-sufficient social home through a combined PV-hydrogen pilot. Appl. Energy 2024, 363, 123061. [Google Scholar] [CrossRef] [Scilit]
- Weerakoon, A.H.S.; Assadi, M. Experimental Assessment and Digital Twin Modeling of Integrated AEM Electrolyzer–PEM Fuel Cell–BESS for Smart Hydrogen Energy Applications. Energies 2025, 18, 6318. [Google Scholar] [CrossRef] [Scilit]
- da Silva Junior, R.L.; Carneiro, F.T.; Campanhol, L.B.G.; Pissaia, G.G.; Jahn, T.G.; Quispe, A.A.; Jakubiu, C.B.; Cantane, D.A.; Mai, L.S.; Valverde, J.A.; et al. Hydrogen Production Plant Retrofit for Green H2: Experimental Validation of a High-Efficiency Retrofit of an Alkaline Hydrogen Plant Using an Isolated DC Microgrid. Energies 2025, 18, 5439. [Google Scholar] [CrossRef] [Scilit]
- Ochoa-Correa, D.; Arévalo, P.; Martinez, S. Pathways to 100% Renewable Energy in Island Systems: A Systematic Review of Challenges, Solutions Strategies, and Success Cases. Technologies 2025, 13, 180. [Google Scholar] [CrossRef] [Scilit]
- Hossain, M.A. Experimental validation of DC-link based voltage control framework for islanded hydrogen DC microgrids. Int. J. Hydrogen Energy 2025, 189, 152033. [Google Scholar] [CrossRef] [Scilit]
- Bonaccorsi, L.; Carbone, R.; La Foresta, F.; Marino, C.; Nucara, A.; Pietrafesa, M.; Versaci, M. Operational Analysis of a Pilot-Scale Plant for Hydrogen Production via an Electrolyser Powered by a Photovoltaic System. Energies 2025, 18, 3949. [Google Scholar] [CrossRef] [Scilit]
- Folgado, F.J.; González, I.; Calderón, A.J. Data acquisition and monitoring system framed in Industrial Internet of Things for PEM hydrogen generators. Internet Things 2023, 22, 100795. [Google Scholar] [CrossRef] [Scilit]
- Love, J.G.; Gane, M.; O’Mullane, A.P.; Mackinnon, I.D.R. Integrated Design and Construction of a 50 kW Flexible Hybrid Renewable Power Hydrogen System Testbed. Energy Storage Appl. 2025, 2, 5. [Google Scholar] [CrossRef] [Scilit]
- Wang, X.; Huang, J.; Xu, Z.; Zhang, C.; Guan, X. Real-World Scale Deployment of Hydrogen-Integrated Microgrid: Design and Control. IEEE Trans. Sustain. Energy 2024, 15, 2380–2392. [Google Scholar] [CrossRef] [Scilit]
- Lebbal, M.E.; Lecœuche, S. Identification and monitoring of a PEM electrolyser based on dynamical modelling. Int. J. Hydrogen Energy 2009, 34, 5992–5999. [Google Scholar] [CrossRef] [Scilit]
- Yue, M.; Lambert, H.; Pahon, E.; Roche, R.; Jemei, S.; Hissel, D. Hydrogen energy systems: A critical review of technologies, applications, trends and challenges. Renew. Sustain. Energy Rev. 2021, 146, 111180. [Google Scholar] [CrossRef] [Scilit]
- Antonini, G.; Rahman, M.M.; Brooks, C.; Santoro, D.; Muller, C.; Al-Omari, A.; Bell, K.; Pearce, J.M. Portable Solar-Integrated Open-Source Chemistry Lab for Water Treatment with Electrolysis. Technologies 2025, 13, 57. [Google Scholar] [CrossRef] [Scilit]
- Naanani, H.; Kaysouny, M.; Aberhouch, A.; Sair, S.; Faik, A. Digital twin framework with physics-informed neural networks for real-time monitoring of PEM electrolyzers in renewable microgrids. Comput. Chem. Eng. 2026, 208, 109582. [Google Scholar] [CrossRef] [Scilit]
- Calderón, D.; Folgado, F.J.; González, I.; Calderón, A.J. Implementation and Experimental Application of Industrial IoT Architecture Using Automation and IoT Hardware/Software. Sensors 2024, 24, 8074. [Google Scholar] [CrossRef] [Scilit] [PubMed]
- Alici, H.; Demirdelen, T.; Çeltikçi, B. Prototype Development and Experimental Validation of a Modular Rooftop Solar-Driven PV–PEM Green Hydrogen System as a Natural Gas Alternative for Decarbonizing Textile Manufacturing. Sustainability 2026, 18, 1881. [Google Scholar] [CrossRef] [Scilit]
- Paredes-Baños, A.B.; Molina-Garcia, A.; Mateo-Aroca, A.; López-Cascales, J.J. Scalable and Multi-Channel Real-Time Low Cost Monitoring System for PEM Electrolyzers Based on IoT Applications. Electronics 2024, 13, 296. [Google Scholar] [CrossRef] [Scilit]
- Becerra, G.; Aguilera-Gonzalez, A.; Vechiu, I.; Ali, H.; Francois, B. Design and Development of a Digital Twin for a Building Microgrid Demonstrator; Institute of Electrical and Electronics Engineers (IEEE): New York, NY, USA, 2025; pp. 1–5. [Google Scholar] [CrossRef] [Scilit]
- Ferrucci, F. Design and implementation of the safety system of a solar-driven smart micro-grid comprising hydrogen production for electricity & cooling co-generation. Int. J. Hydrogen Energy 2024, 51, 1096–1119. [Google Scholar] [CrossRef] [Scilit]
- Bustamante, G.T.; Haddad, J.; Guimaraes, B.P.B.; Ribeiro Junior, R.F.; de O. Assuncao, F.; Bonaldi, E.L.; Borges-Da-Silva, L.E.; Steiner, F.M.; Junior, J.J.d.O.; Costa, C.I.d.A. Experimental Validation of a Modular Skid for Hydrogen Production in a Hybrid Microgrid. Energies 2025, 18, 3910. [Google Scholar] [CrossRef] [Scilit]
- Flamm, B.; Peter, C.; Büchi, F.N.; Lygeros, J. Electrolyzer modeling and real-time control for optimized production of hydrogen gas. Appl. Energy 2021, 281, 116031. [Google Scholar] [CrossRef] [Scilit]
- Frensch, S.H.; Fouda-Onana, F.; Serre, G.; Thoby, D.; Araya, S.S.; Kær, S.K. Influence of the operation mode on PEM water electrolysis degradation. Int. J. Hydrogen Energy 2019, 44, 29889–29898. [Google Scholar] [CrossRef] [Scilit]
- Weiß, A.; Siebel, A.; Bernt, M.; Shen, T.-H.; Tileli, V.; Gasteiger, H.A. Impact of Intermittent Operation on Lifetime and Performance of a PEM Water Electrolyzer. J. Electrochem. Soc. 2019, 166, F487–F497. [Google Scholar] [CrossRef] [Scilit]
- Keller, R.; Baader, F.J.; Bardow, A.; Müller, M.; Peters, R. Experimental demonstration of dynamic demand response scheduling for PEM-electrolyzers. Appl. Energy 2025, 393, 126014. [Google Scholar] [CrossRef] [Scilit]
- Falcão, D.S.; Pinto, A.M.F.R. A review on PEM electrolyzer modelling: Guidelines for beginners. J. Clean. Prod. 2020, 261, 121184. [Google Scholar] [CrossRef] [Scilit]
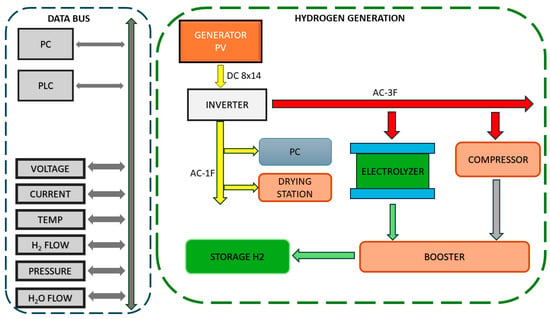
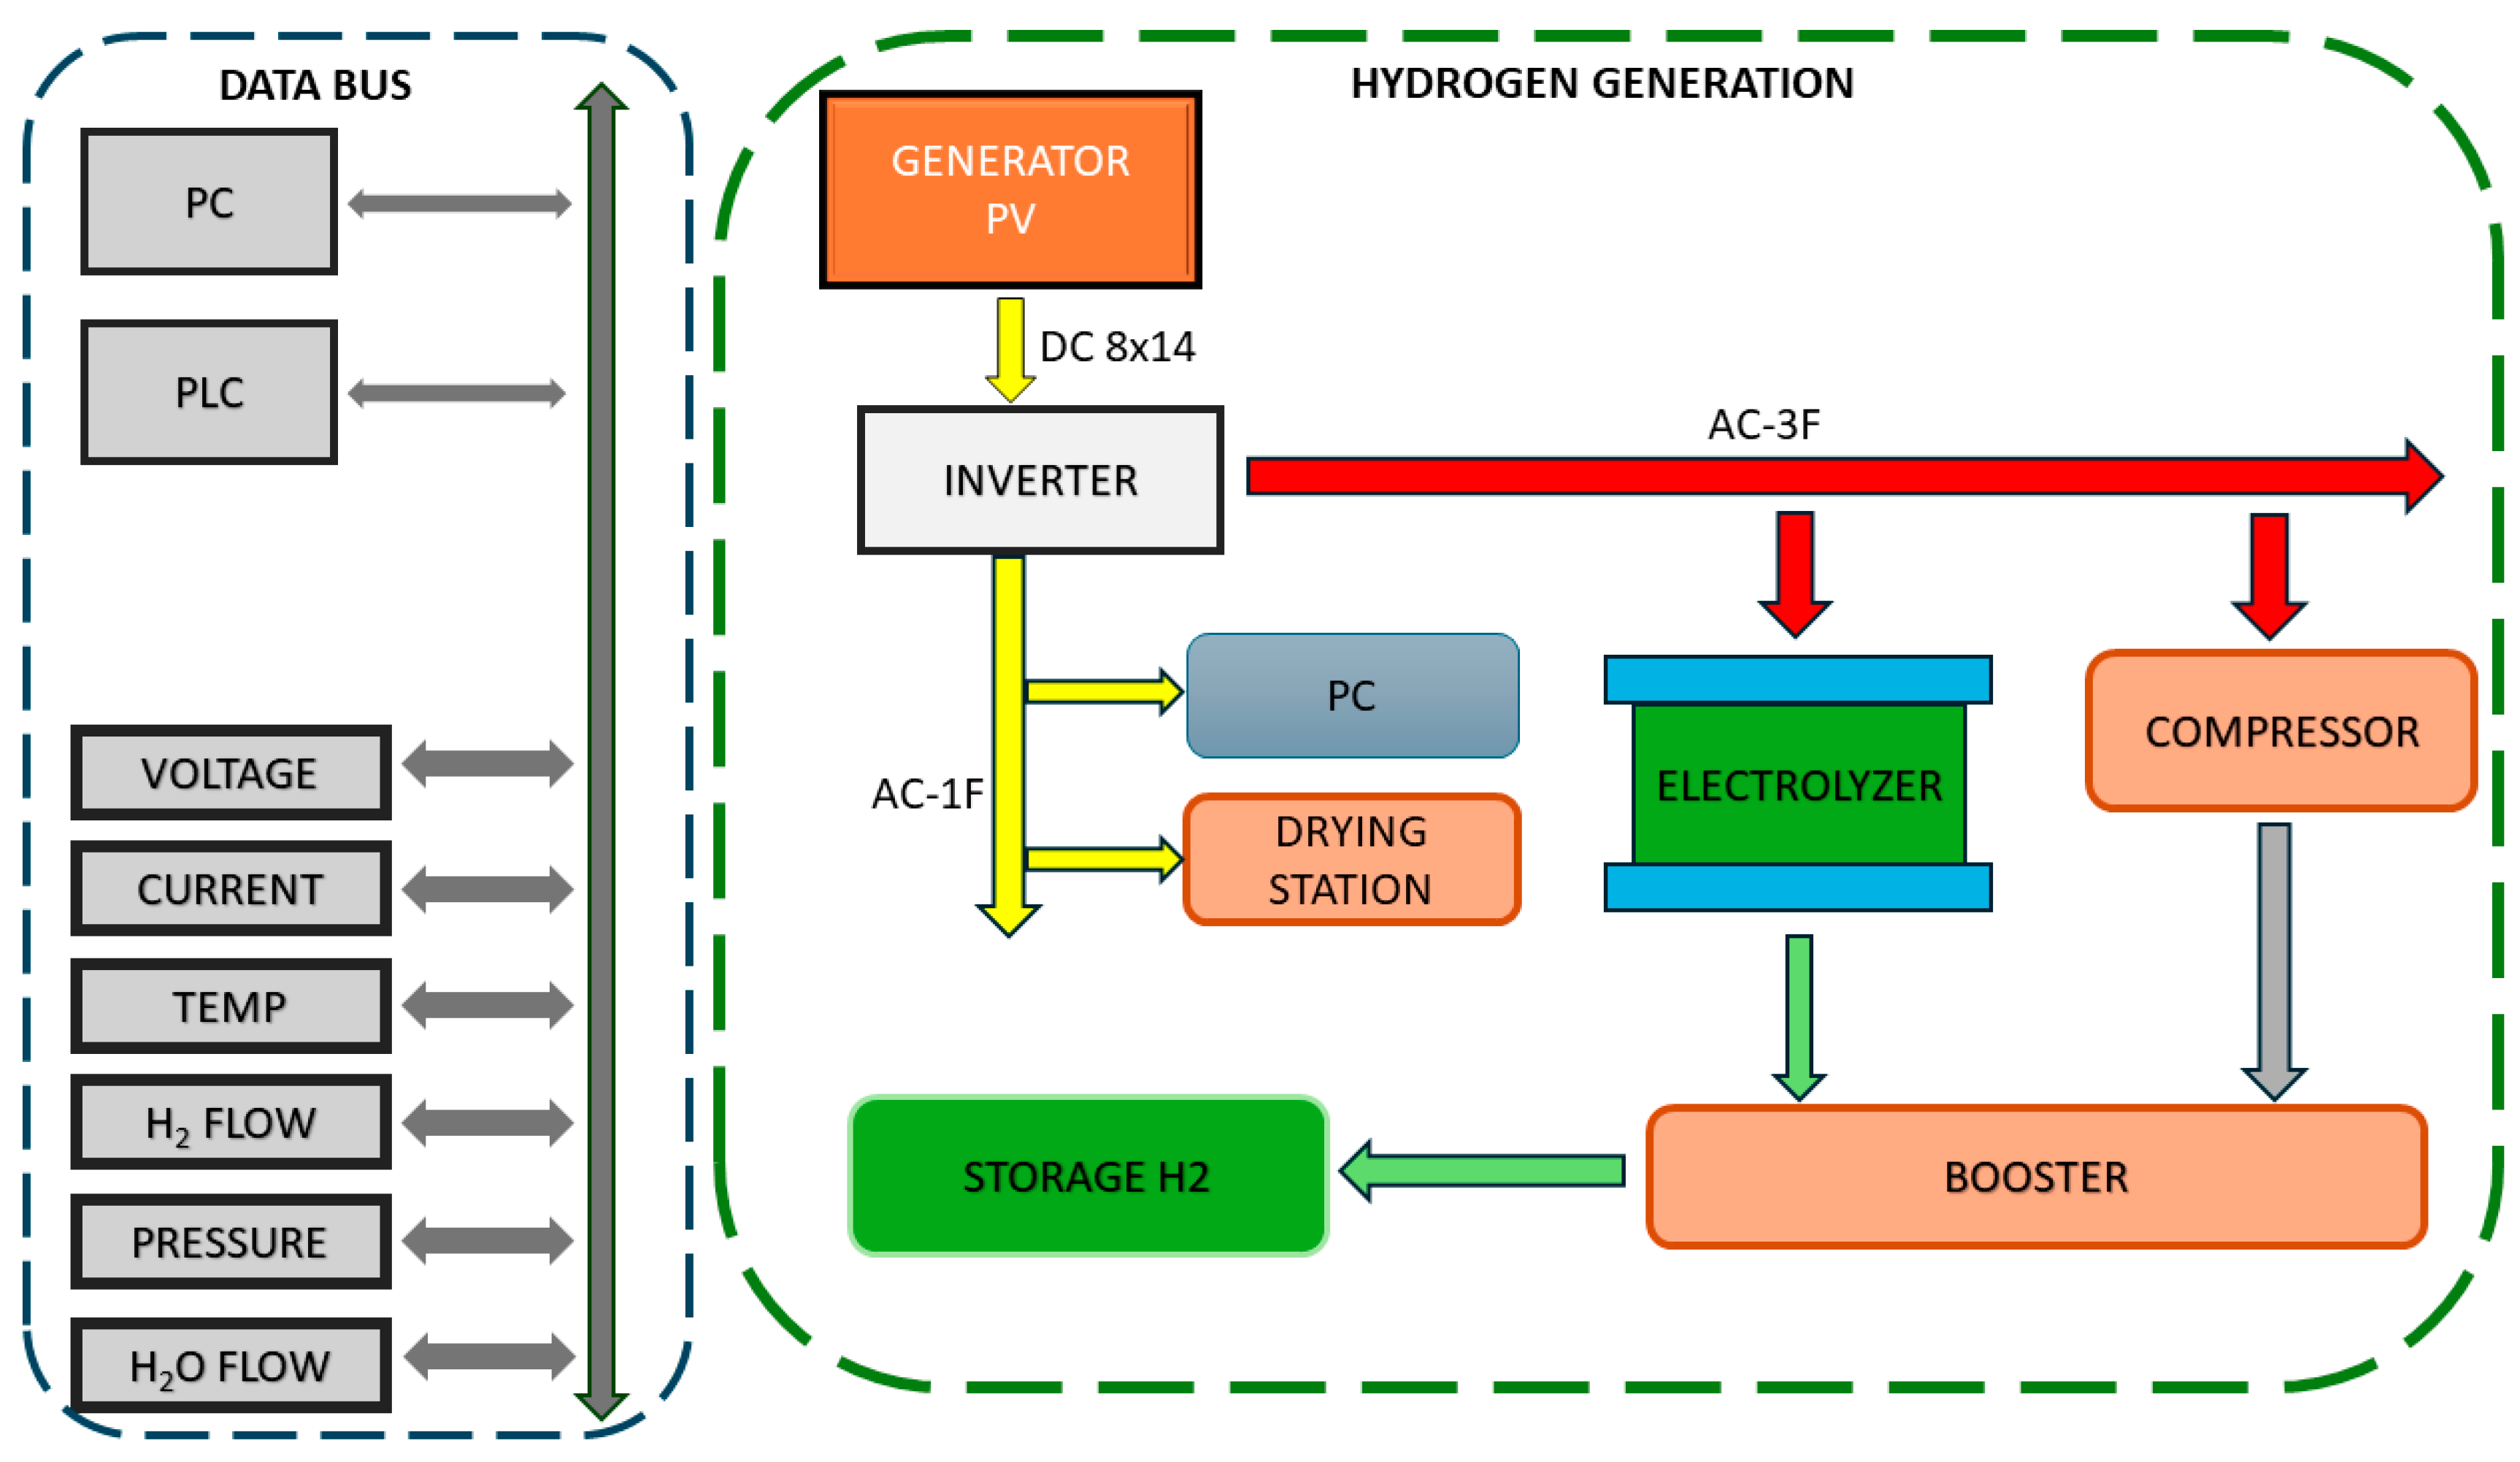
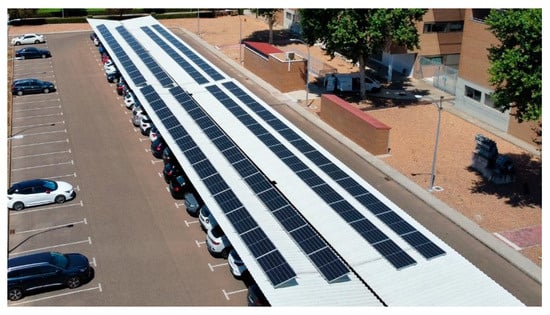
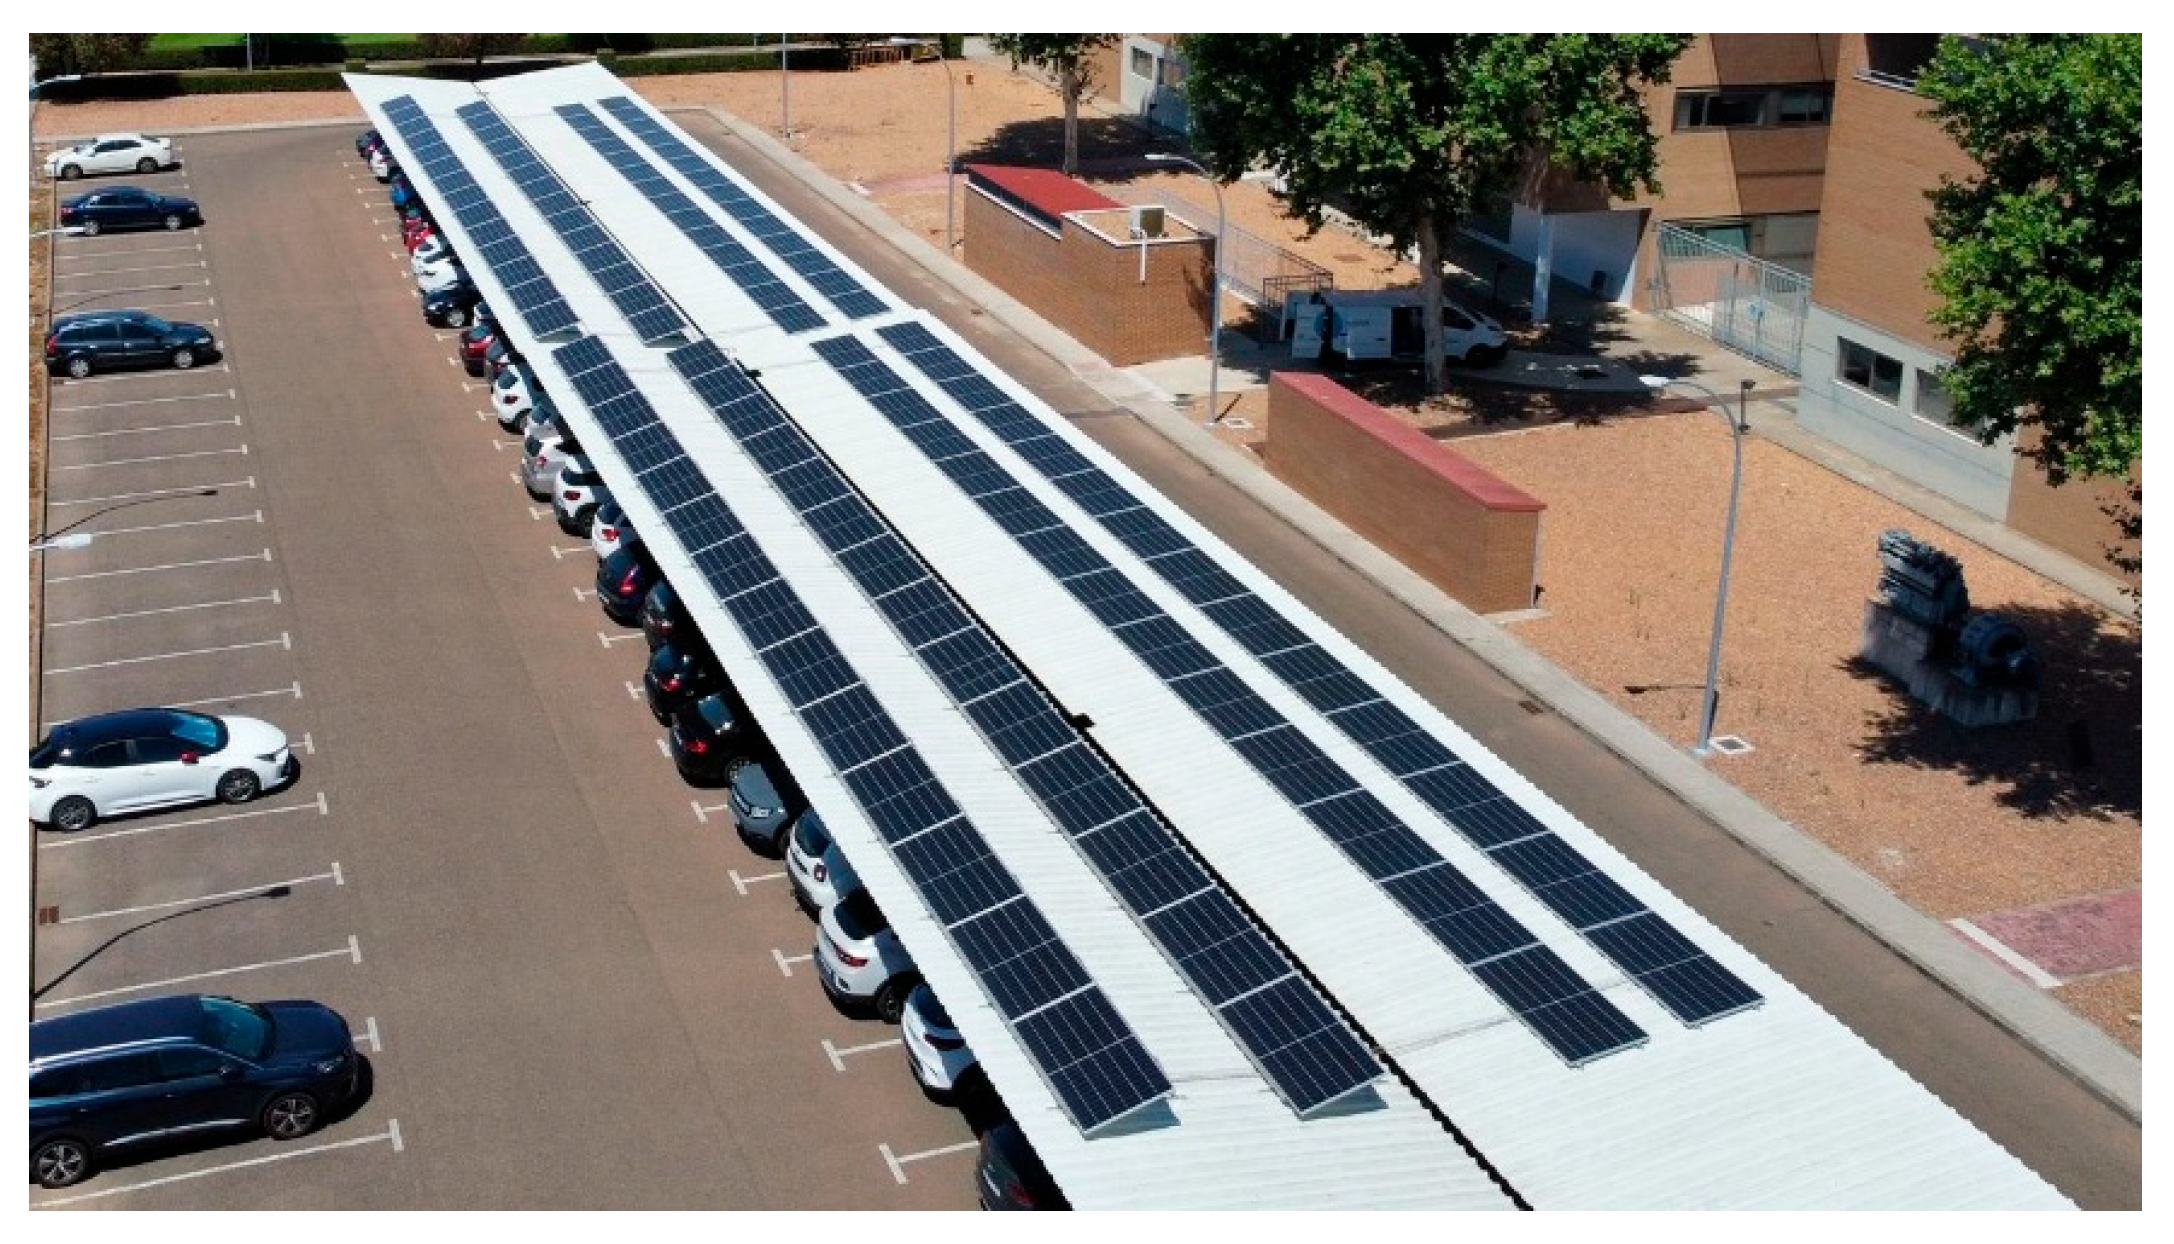
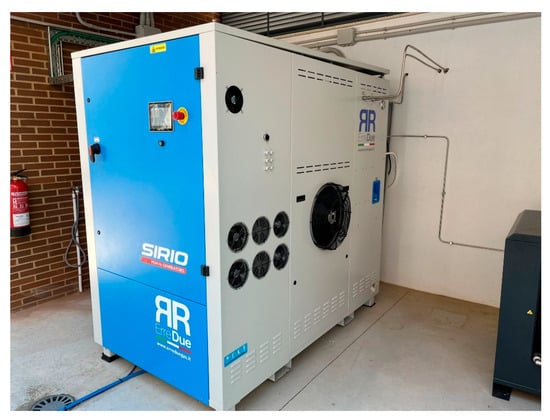
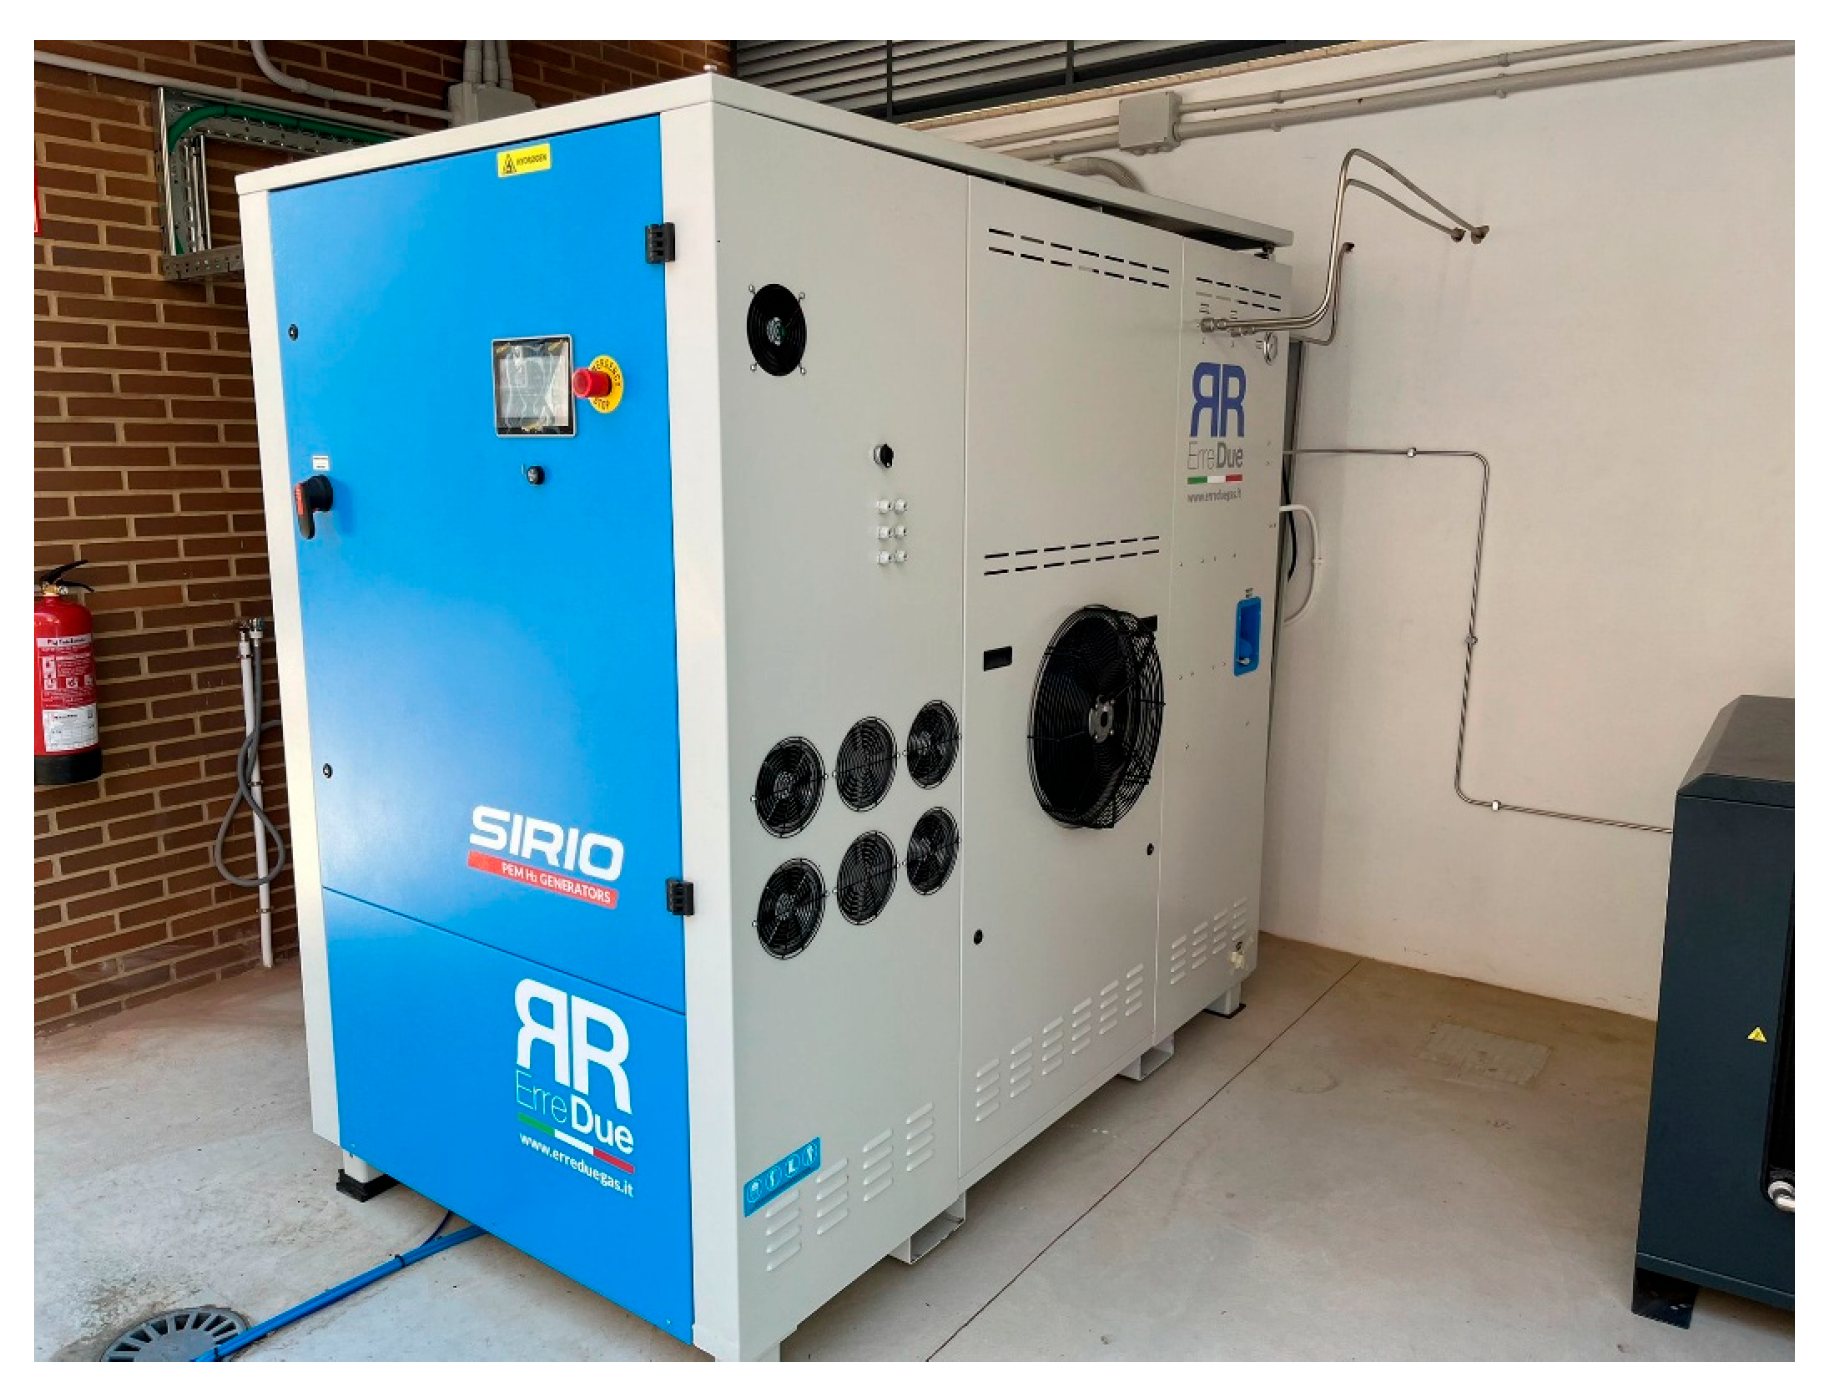


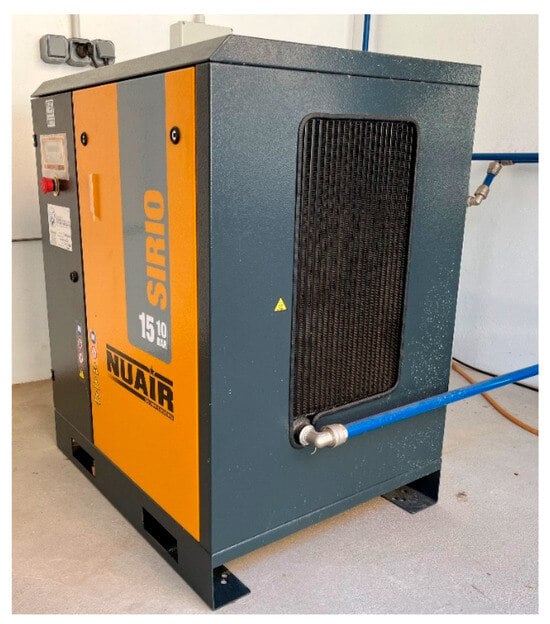
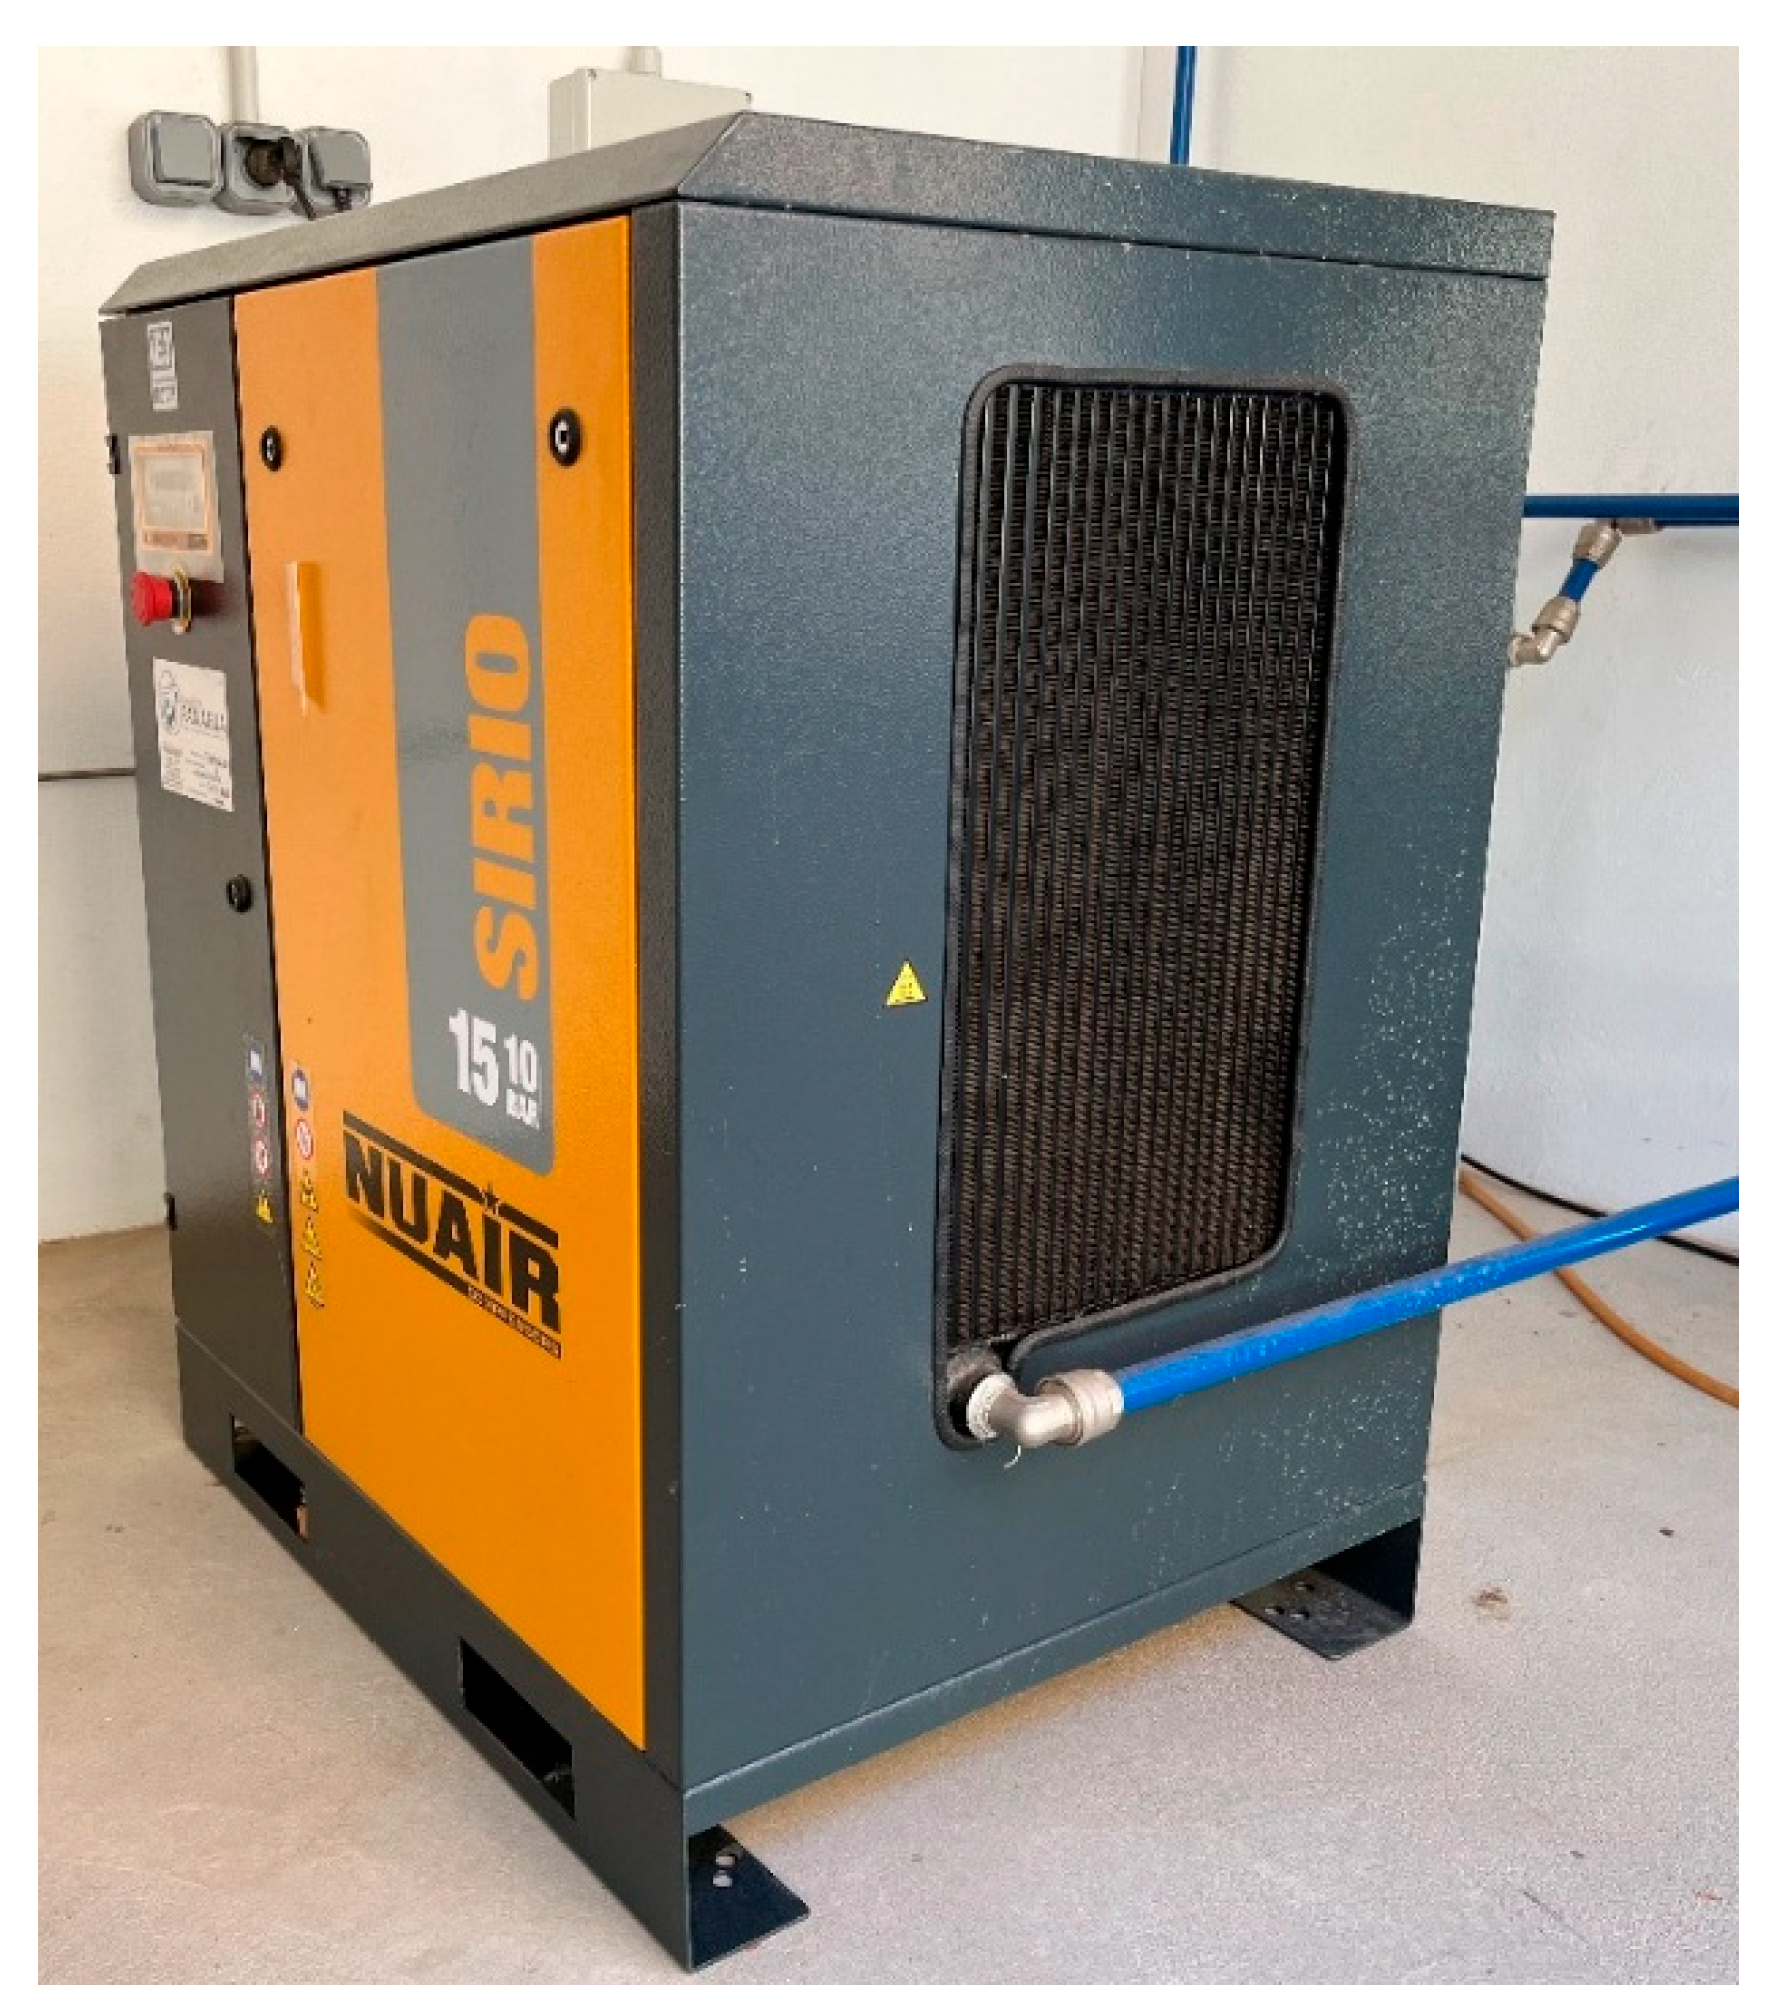
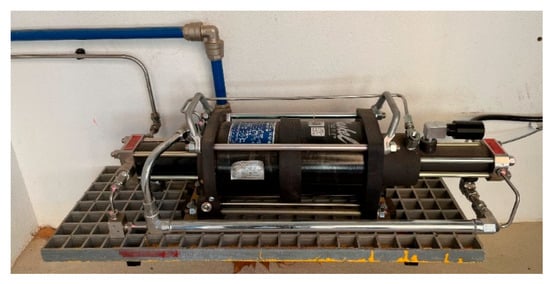
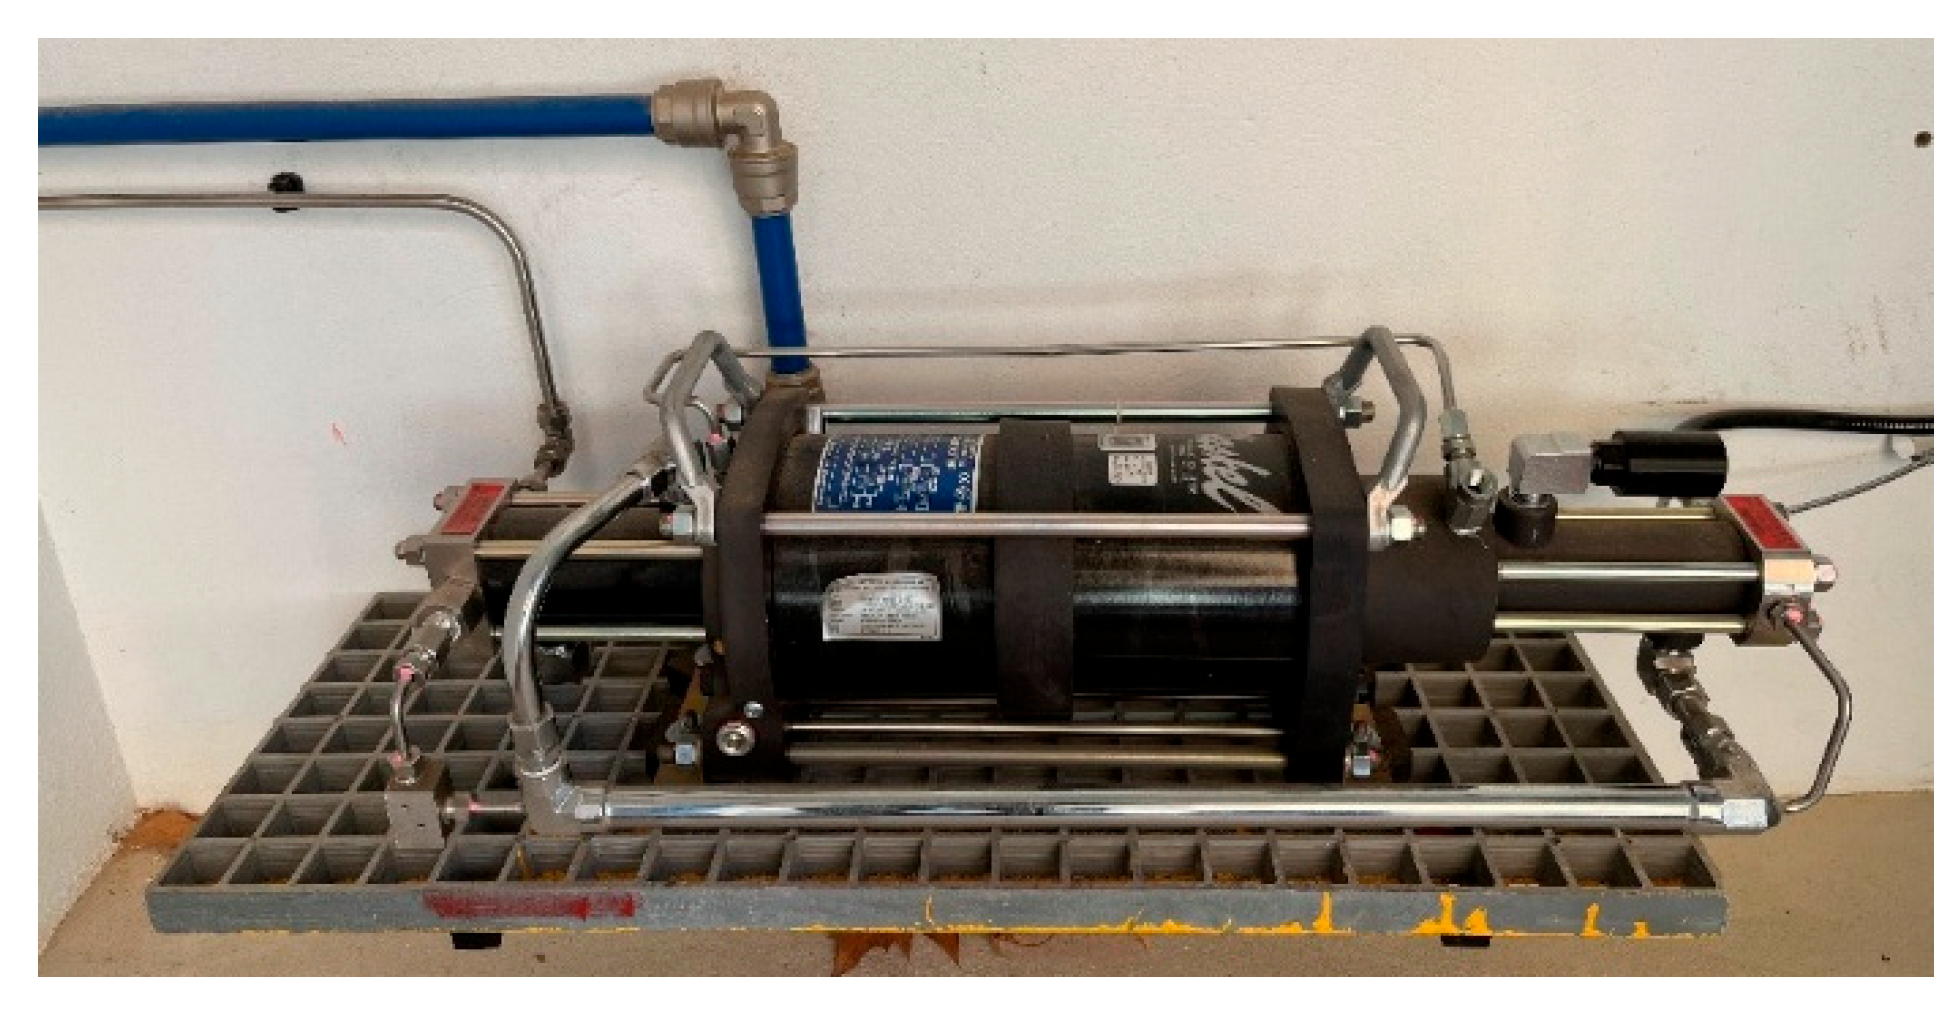
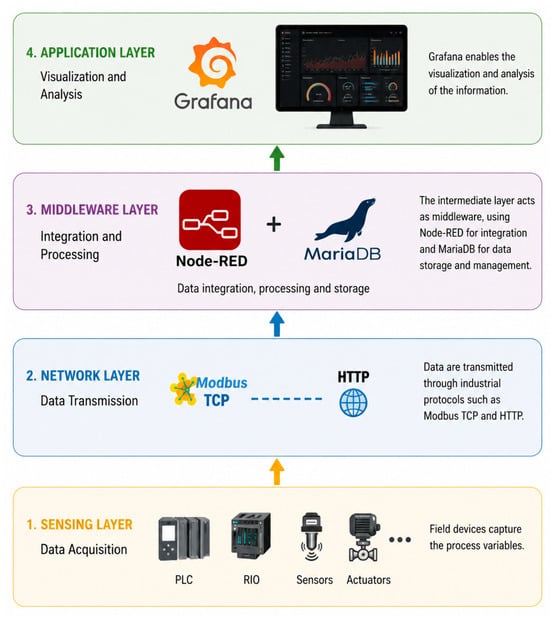
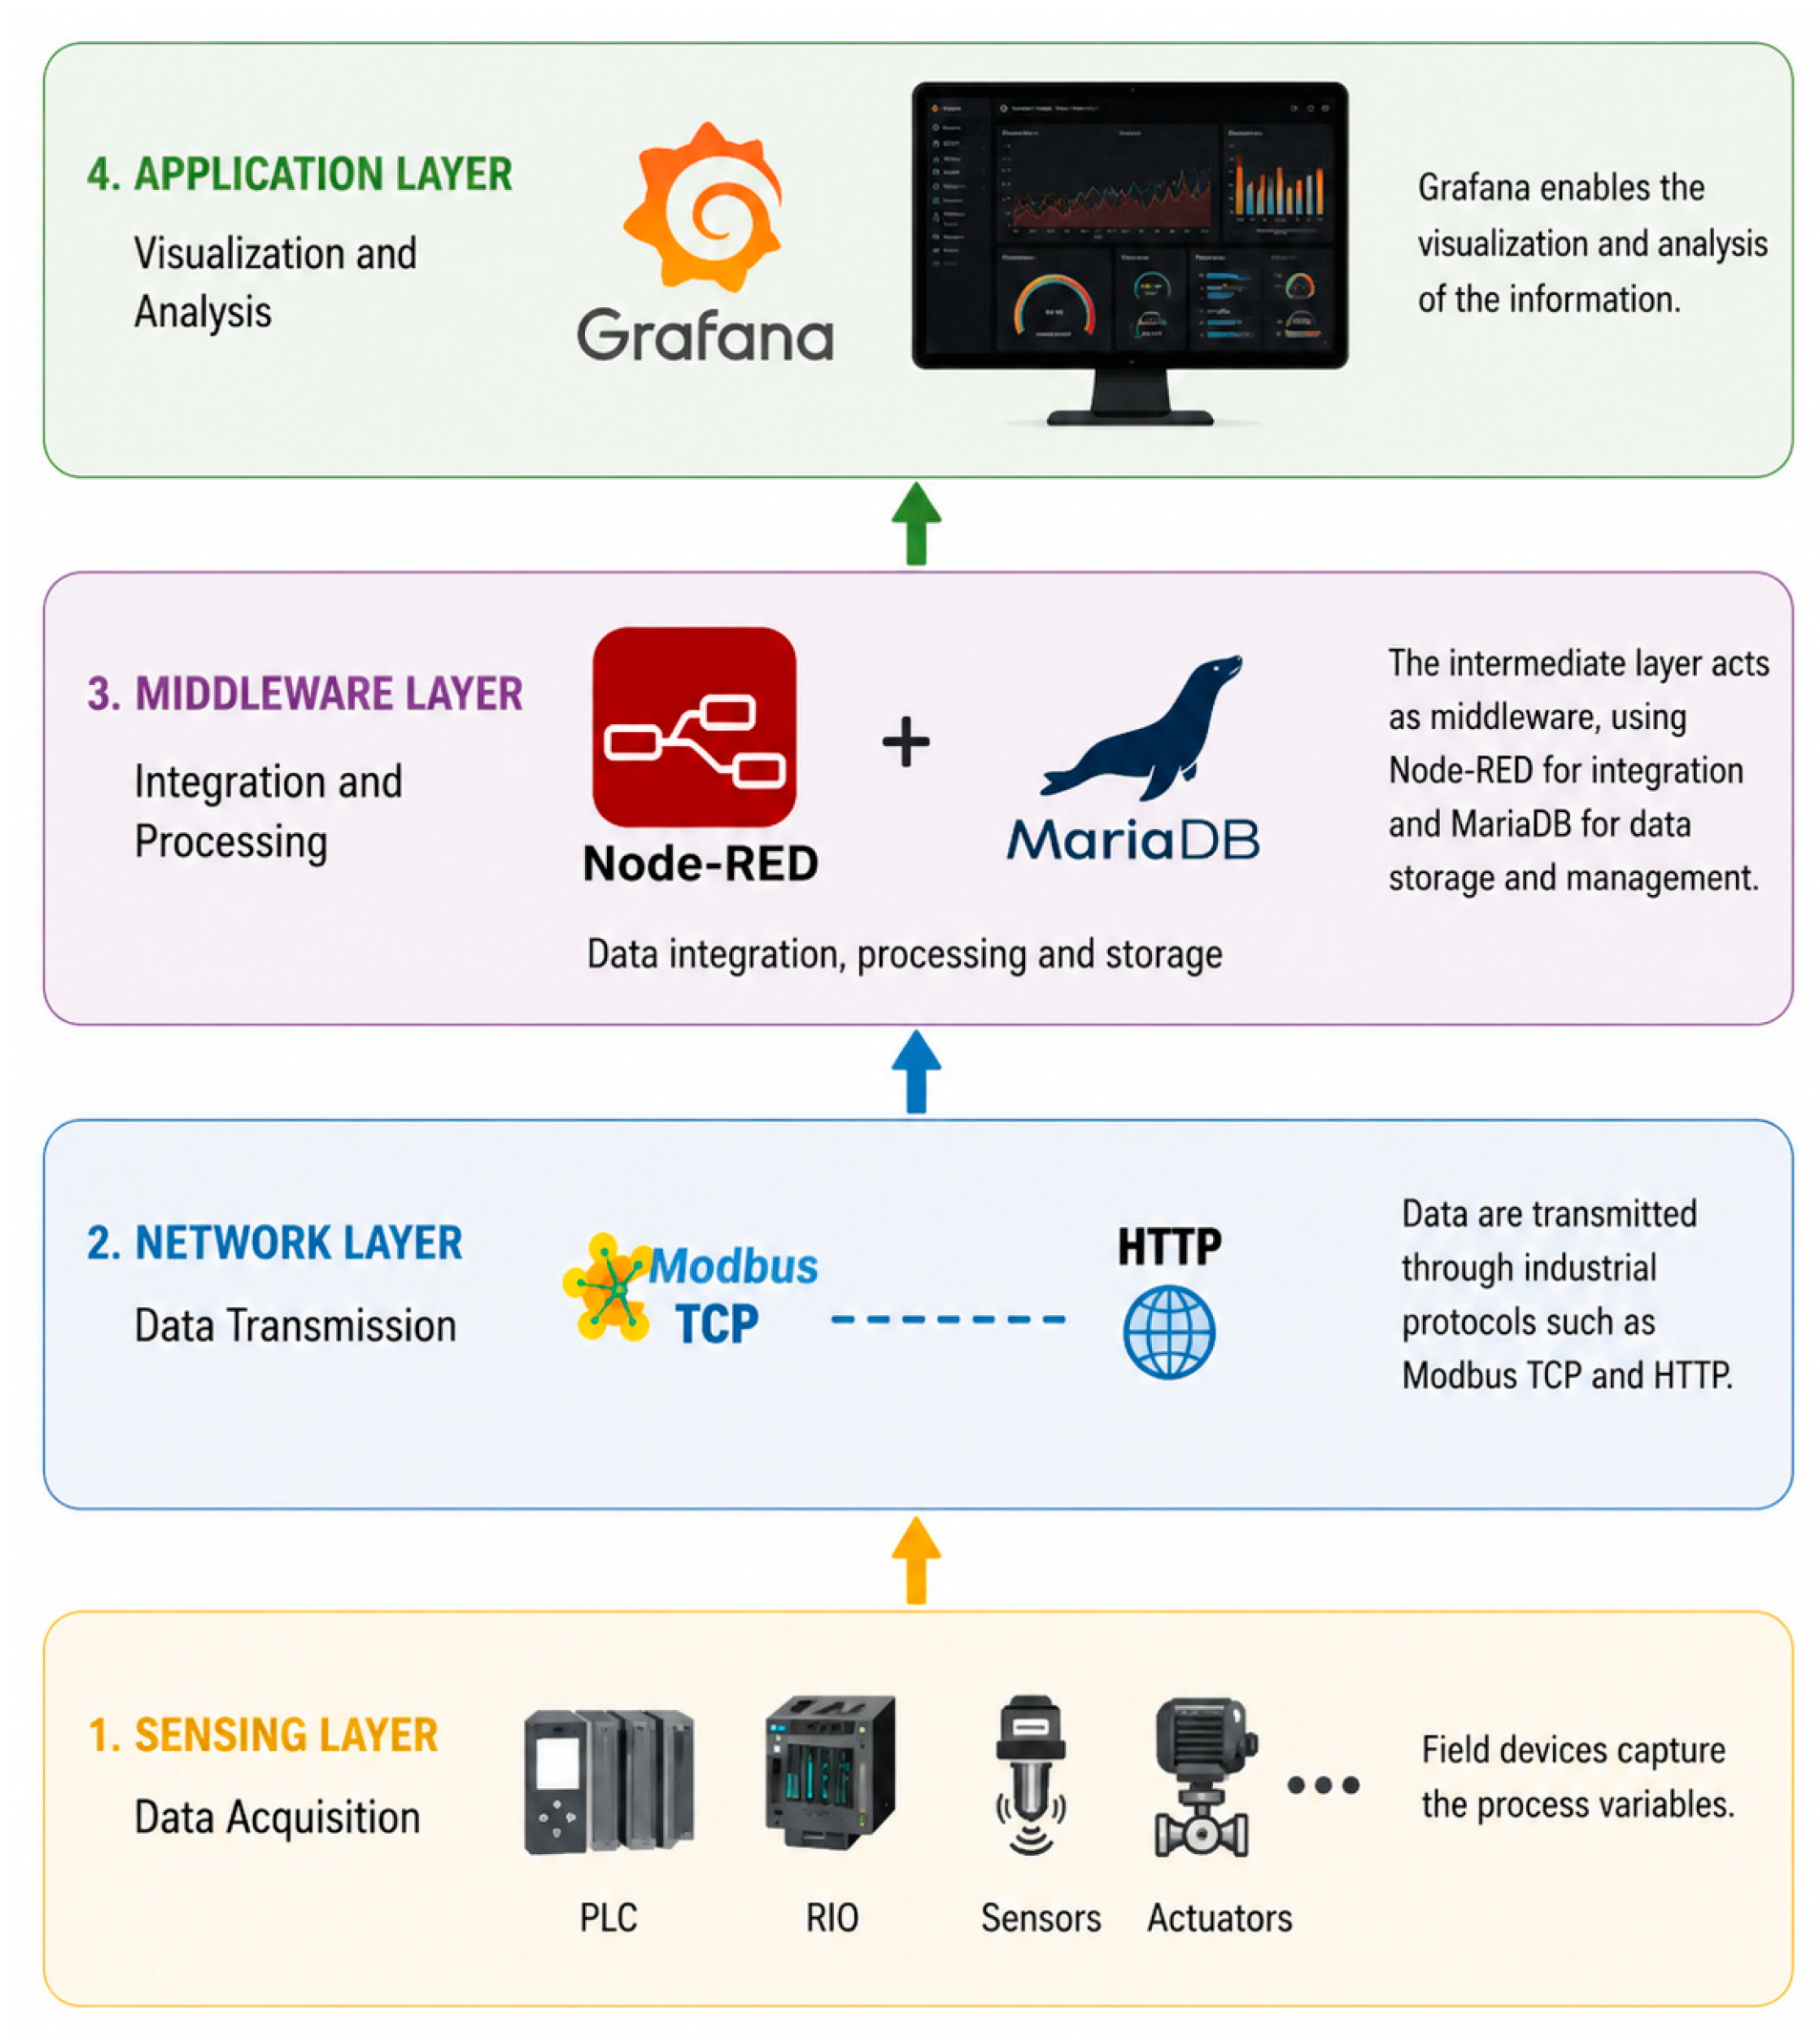
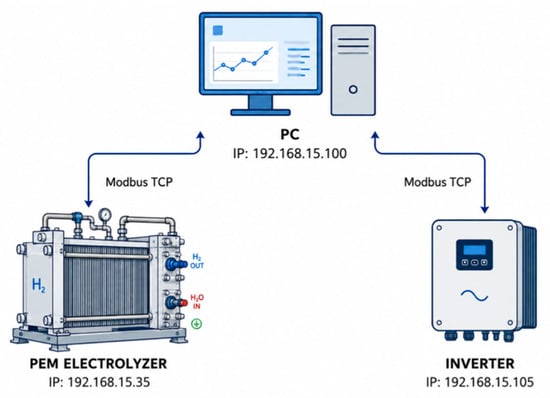
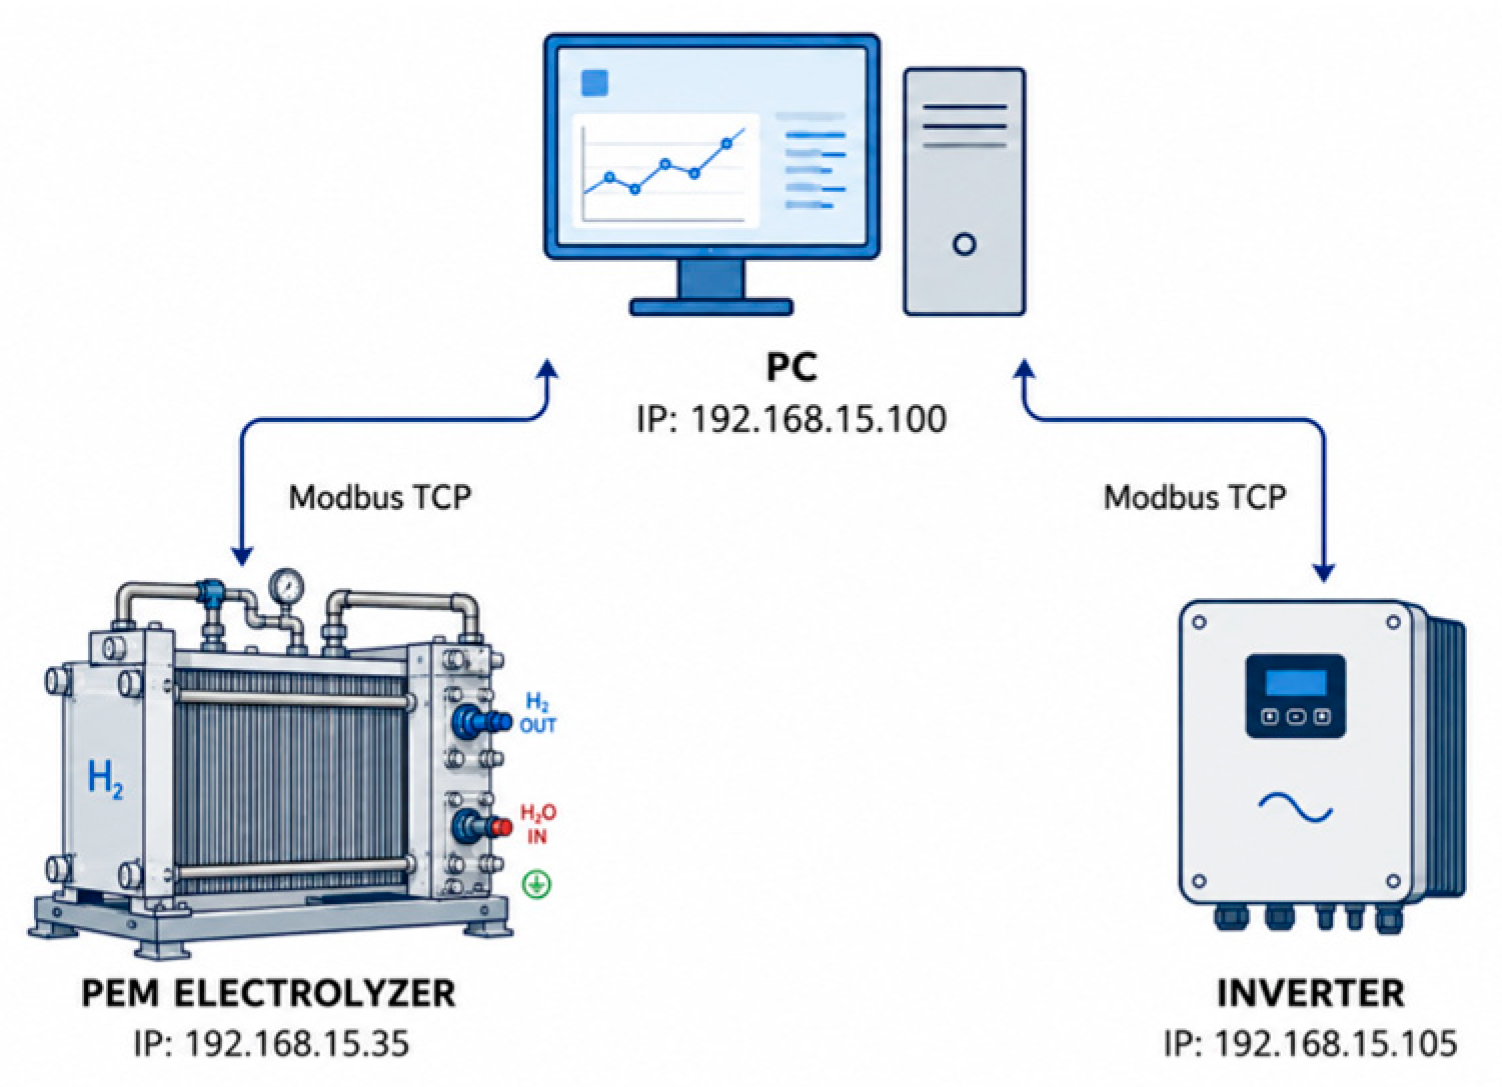
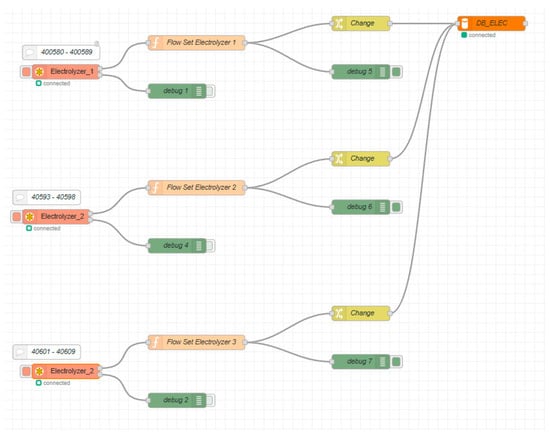
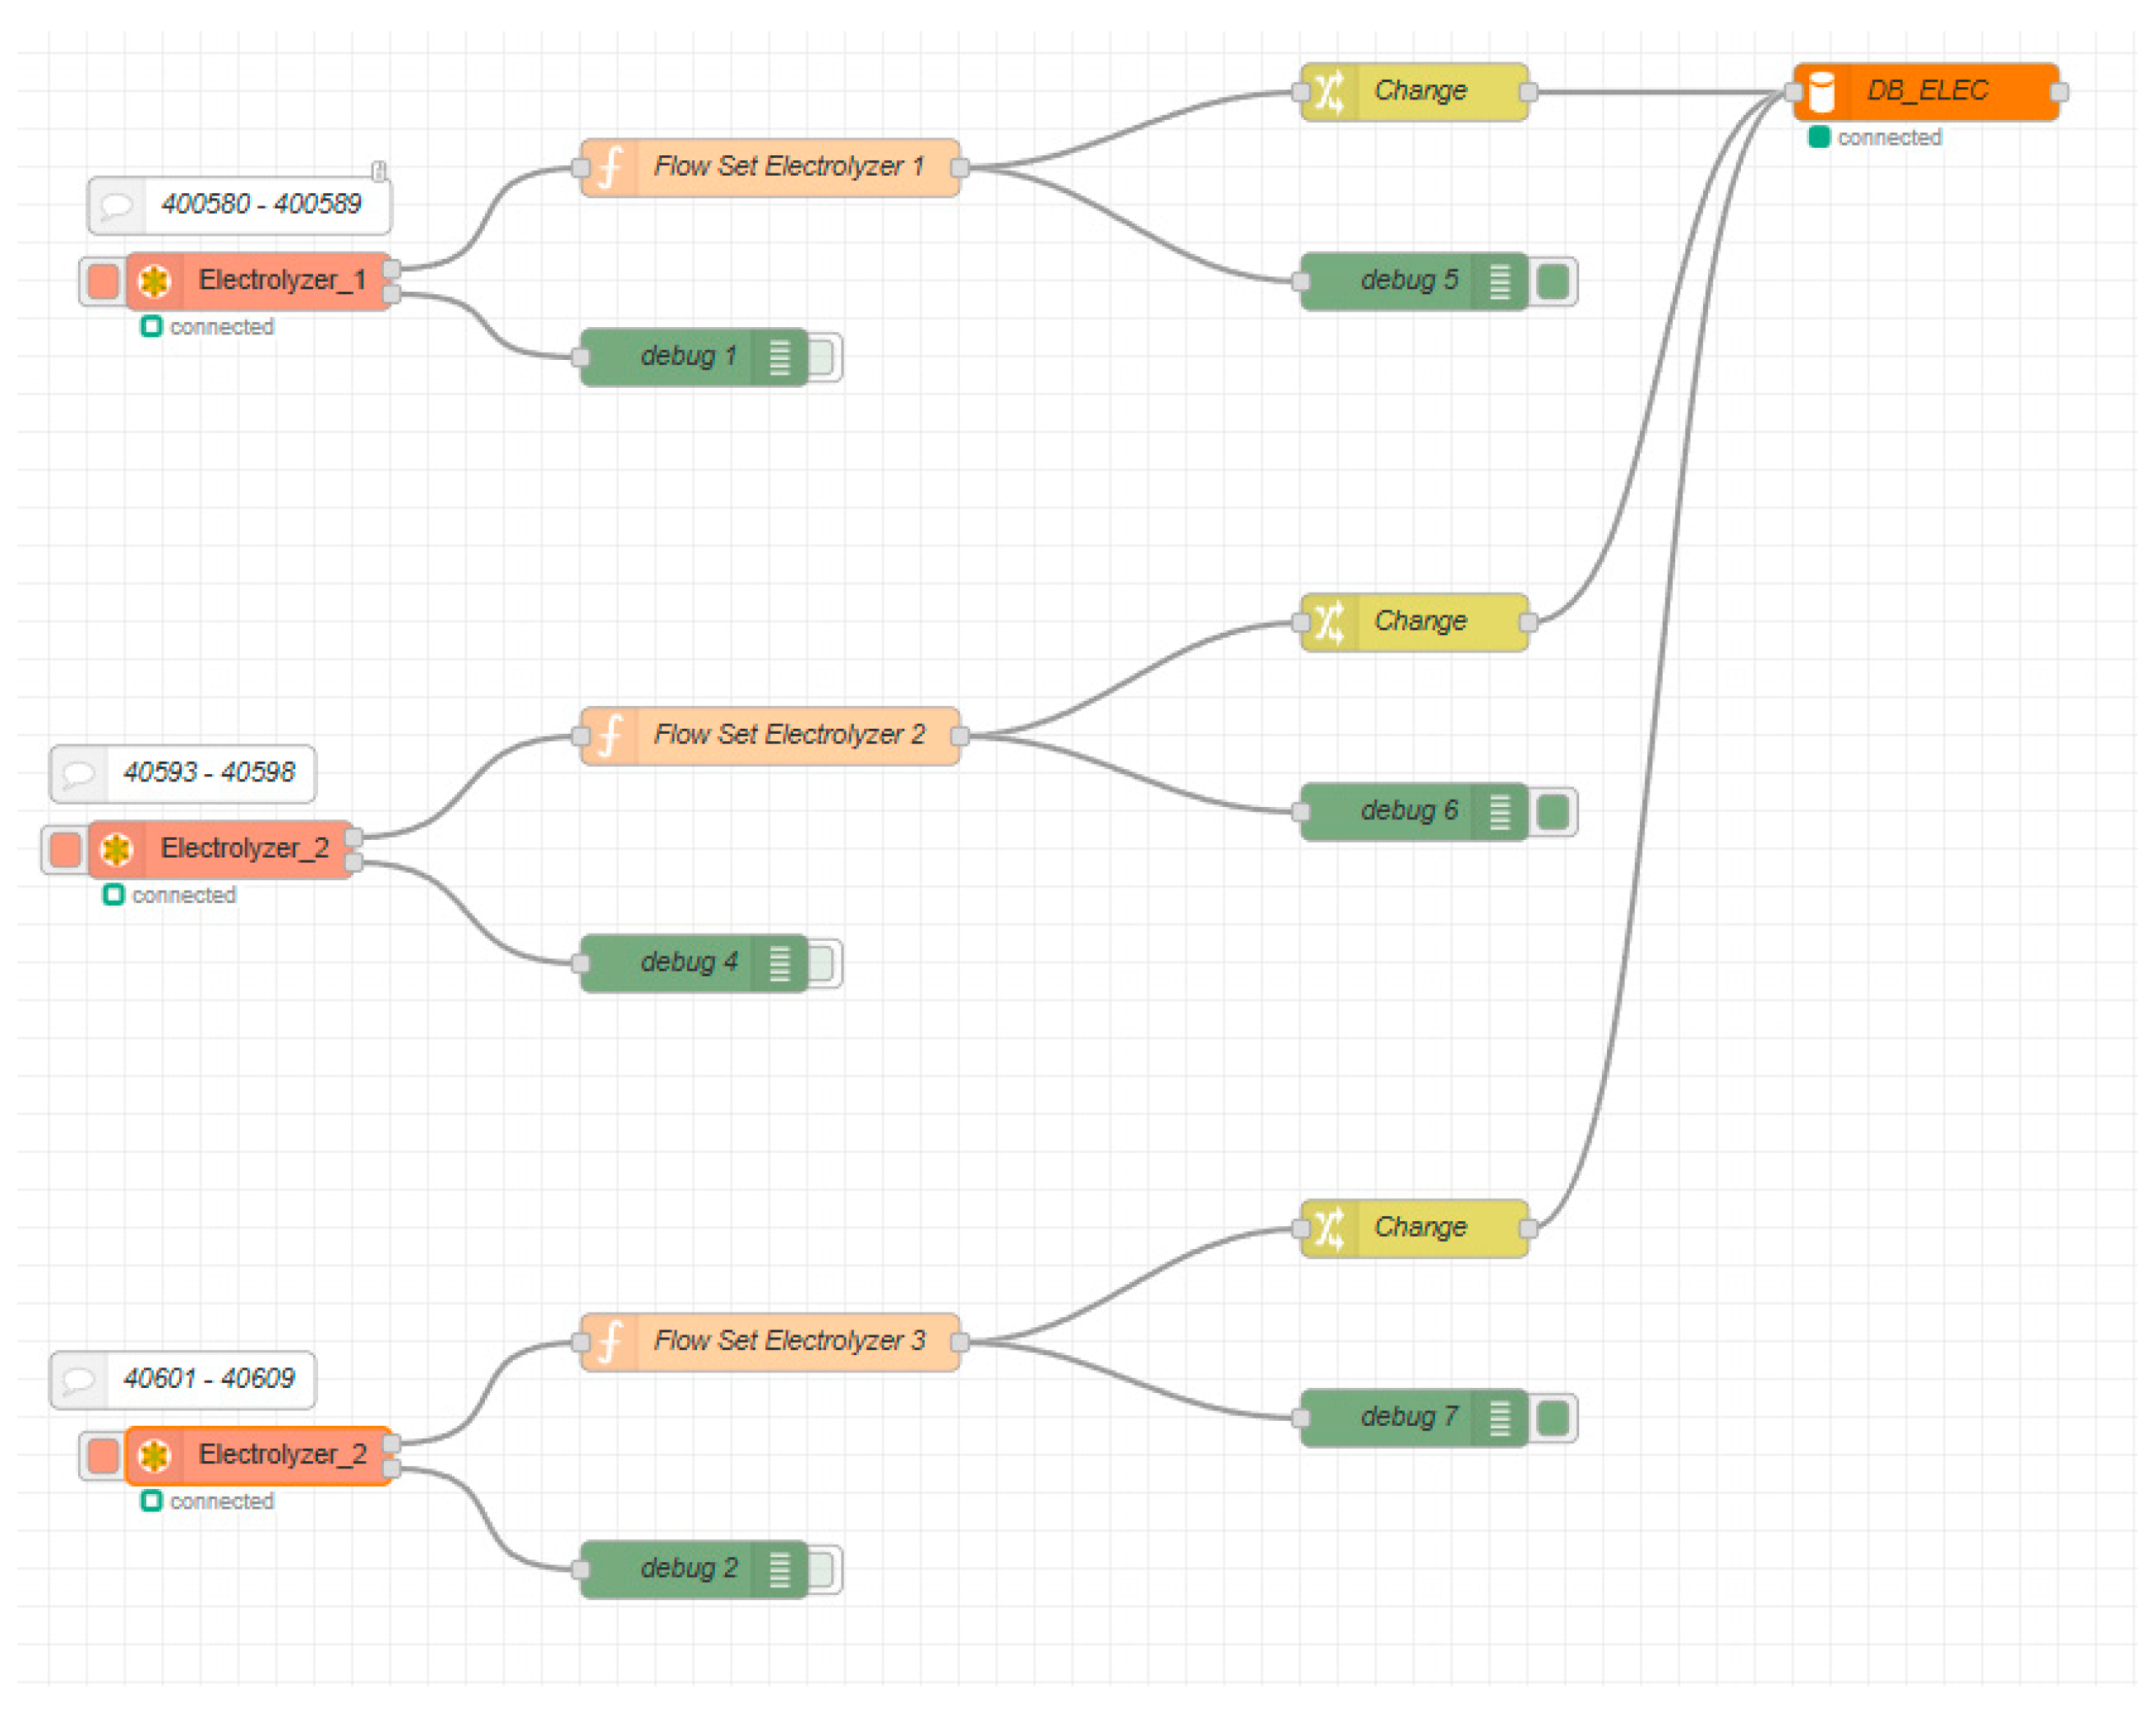
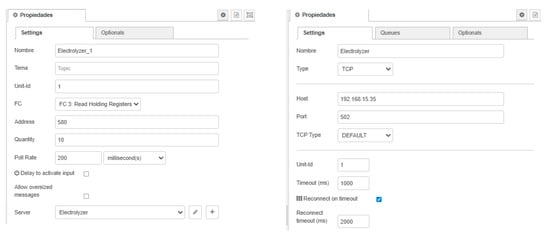
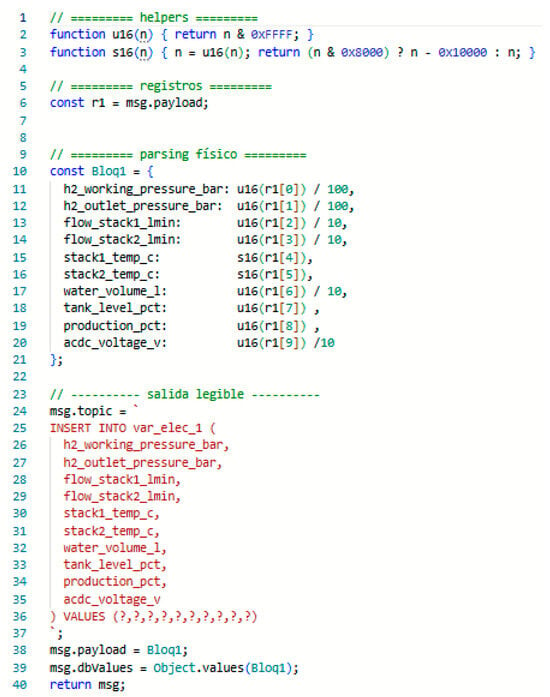
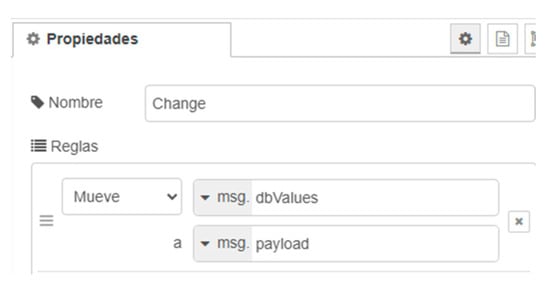
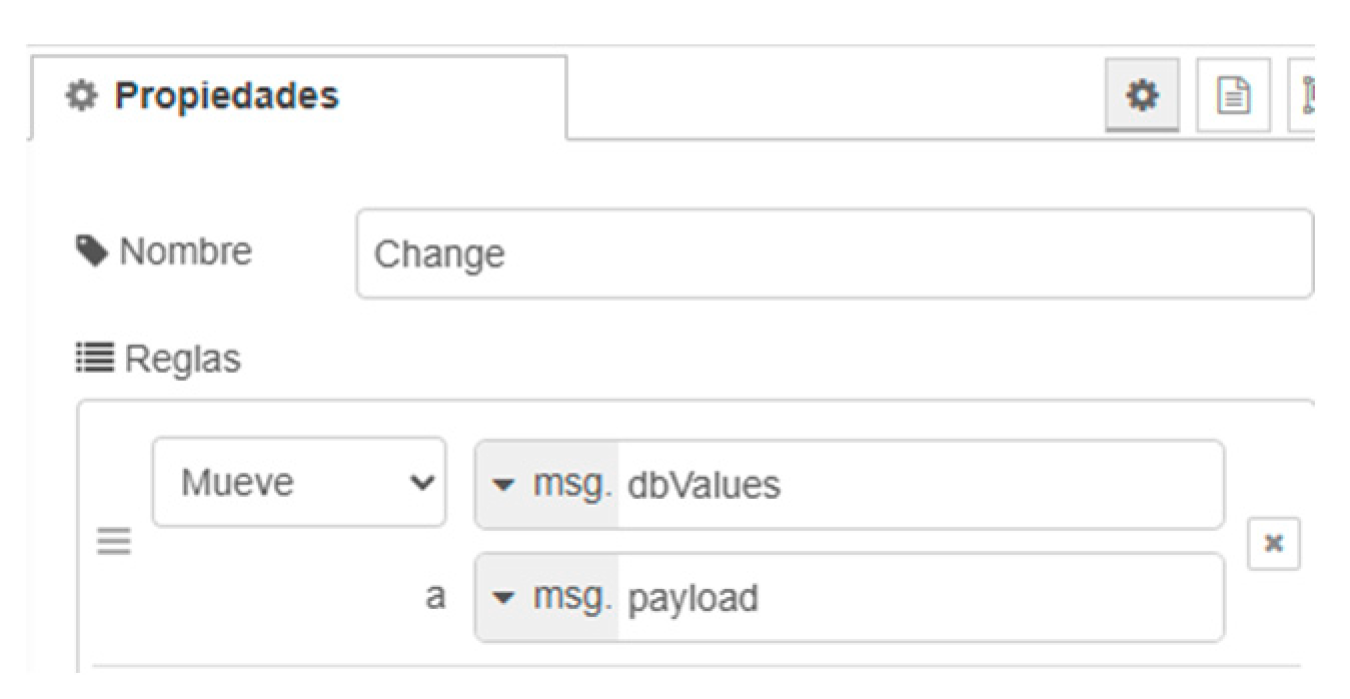
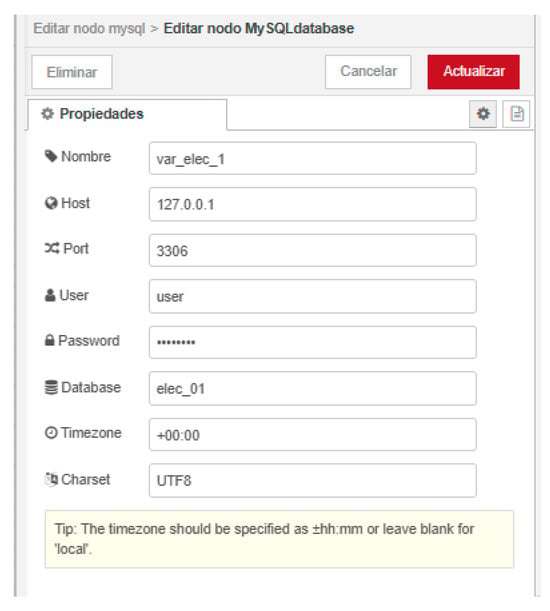
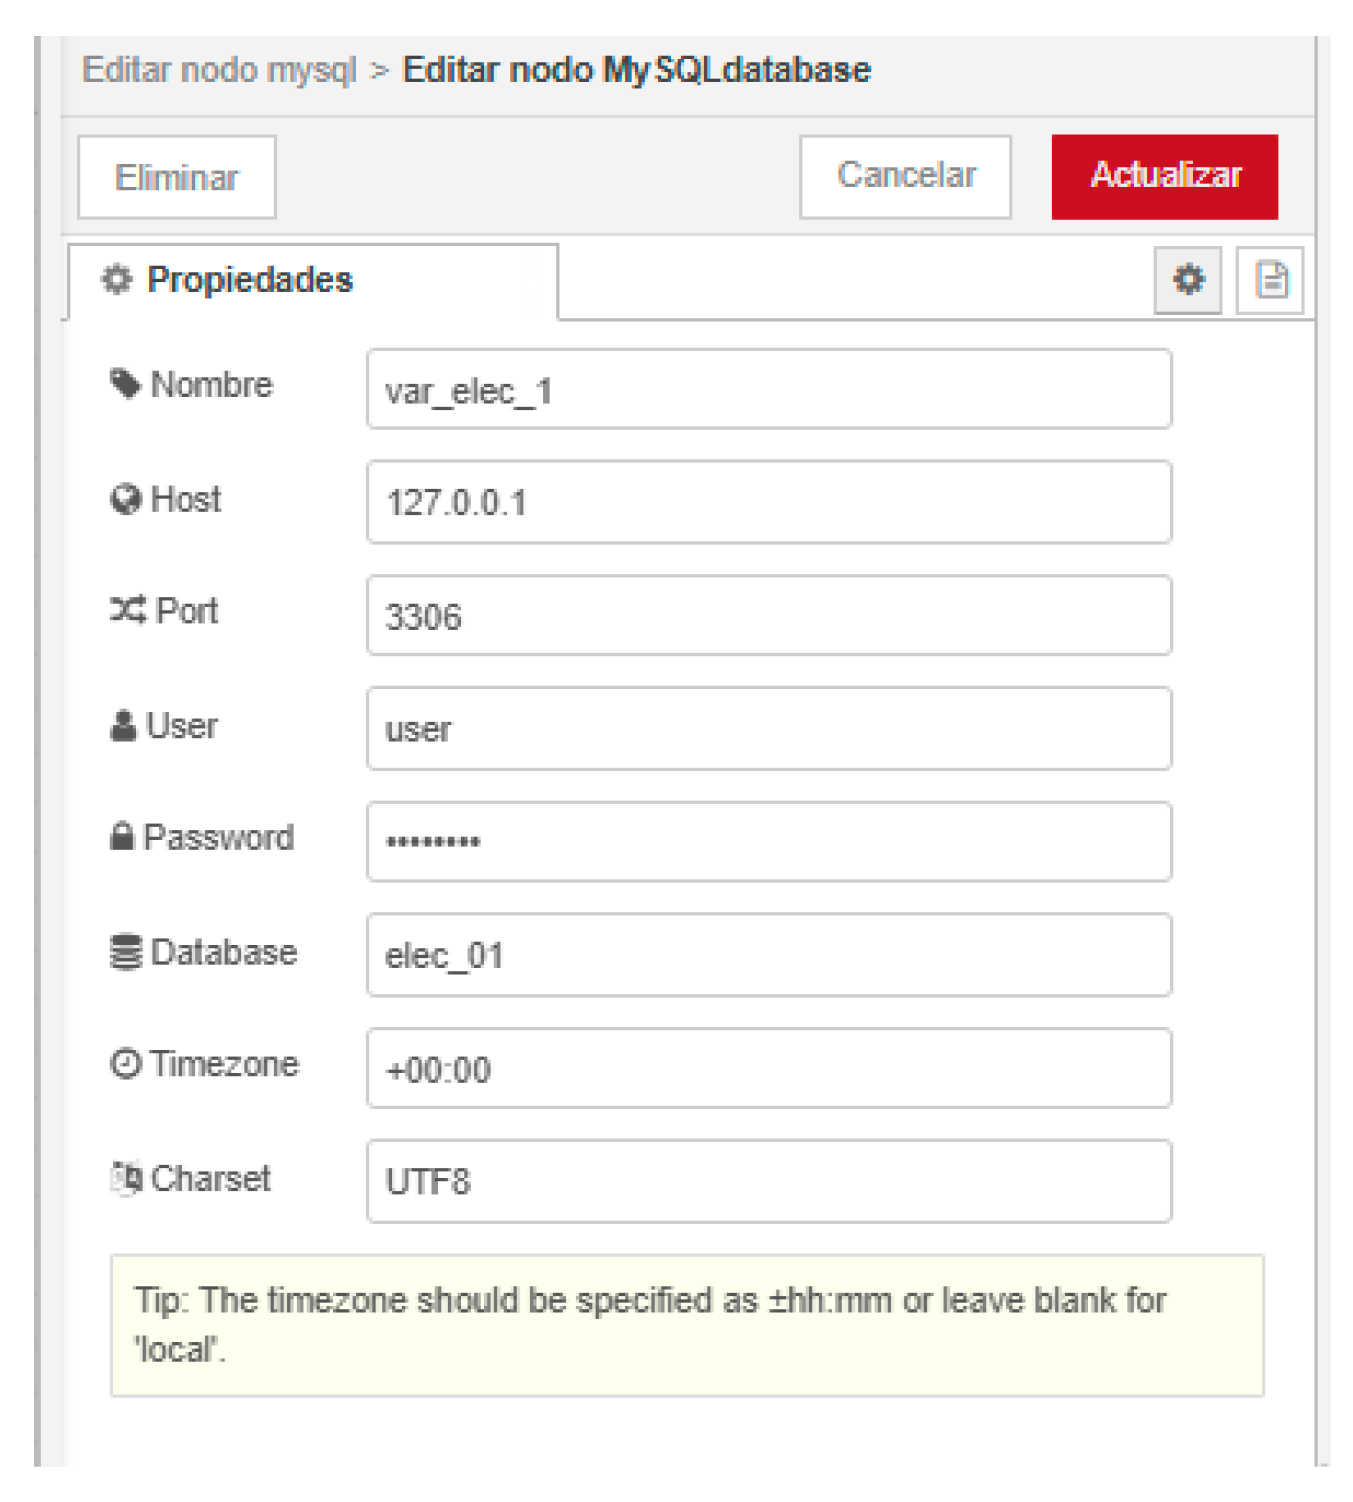
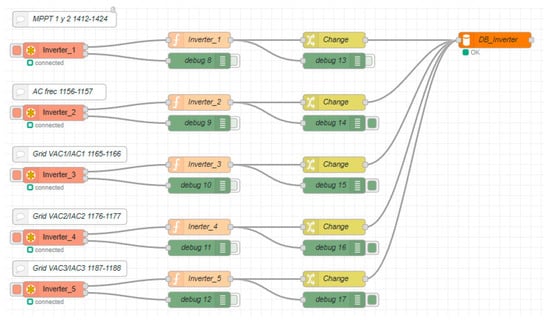
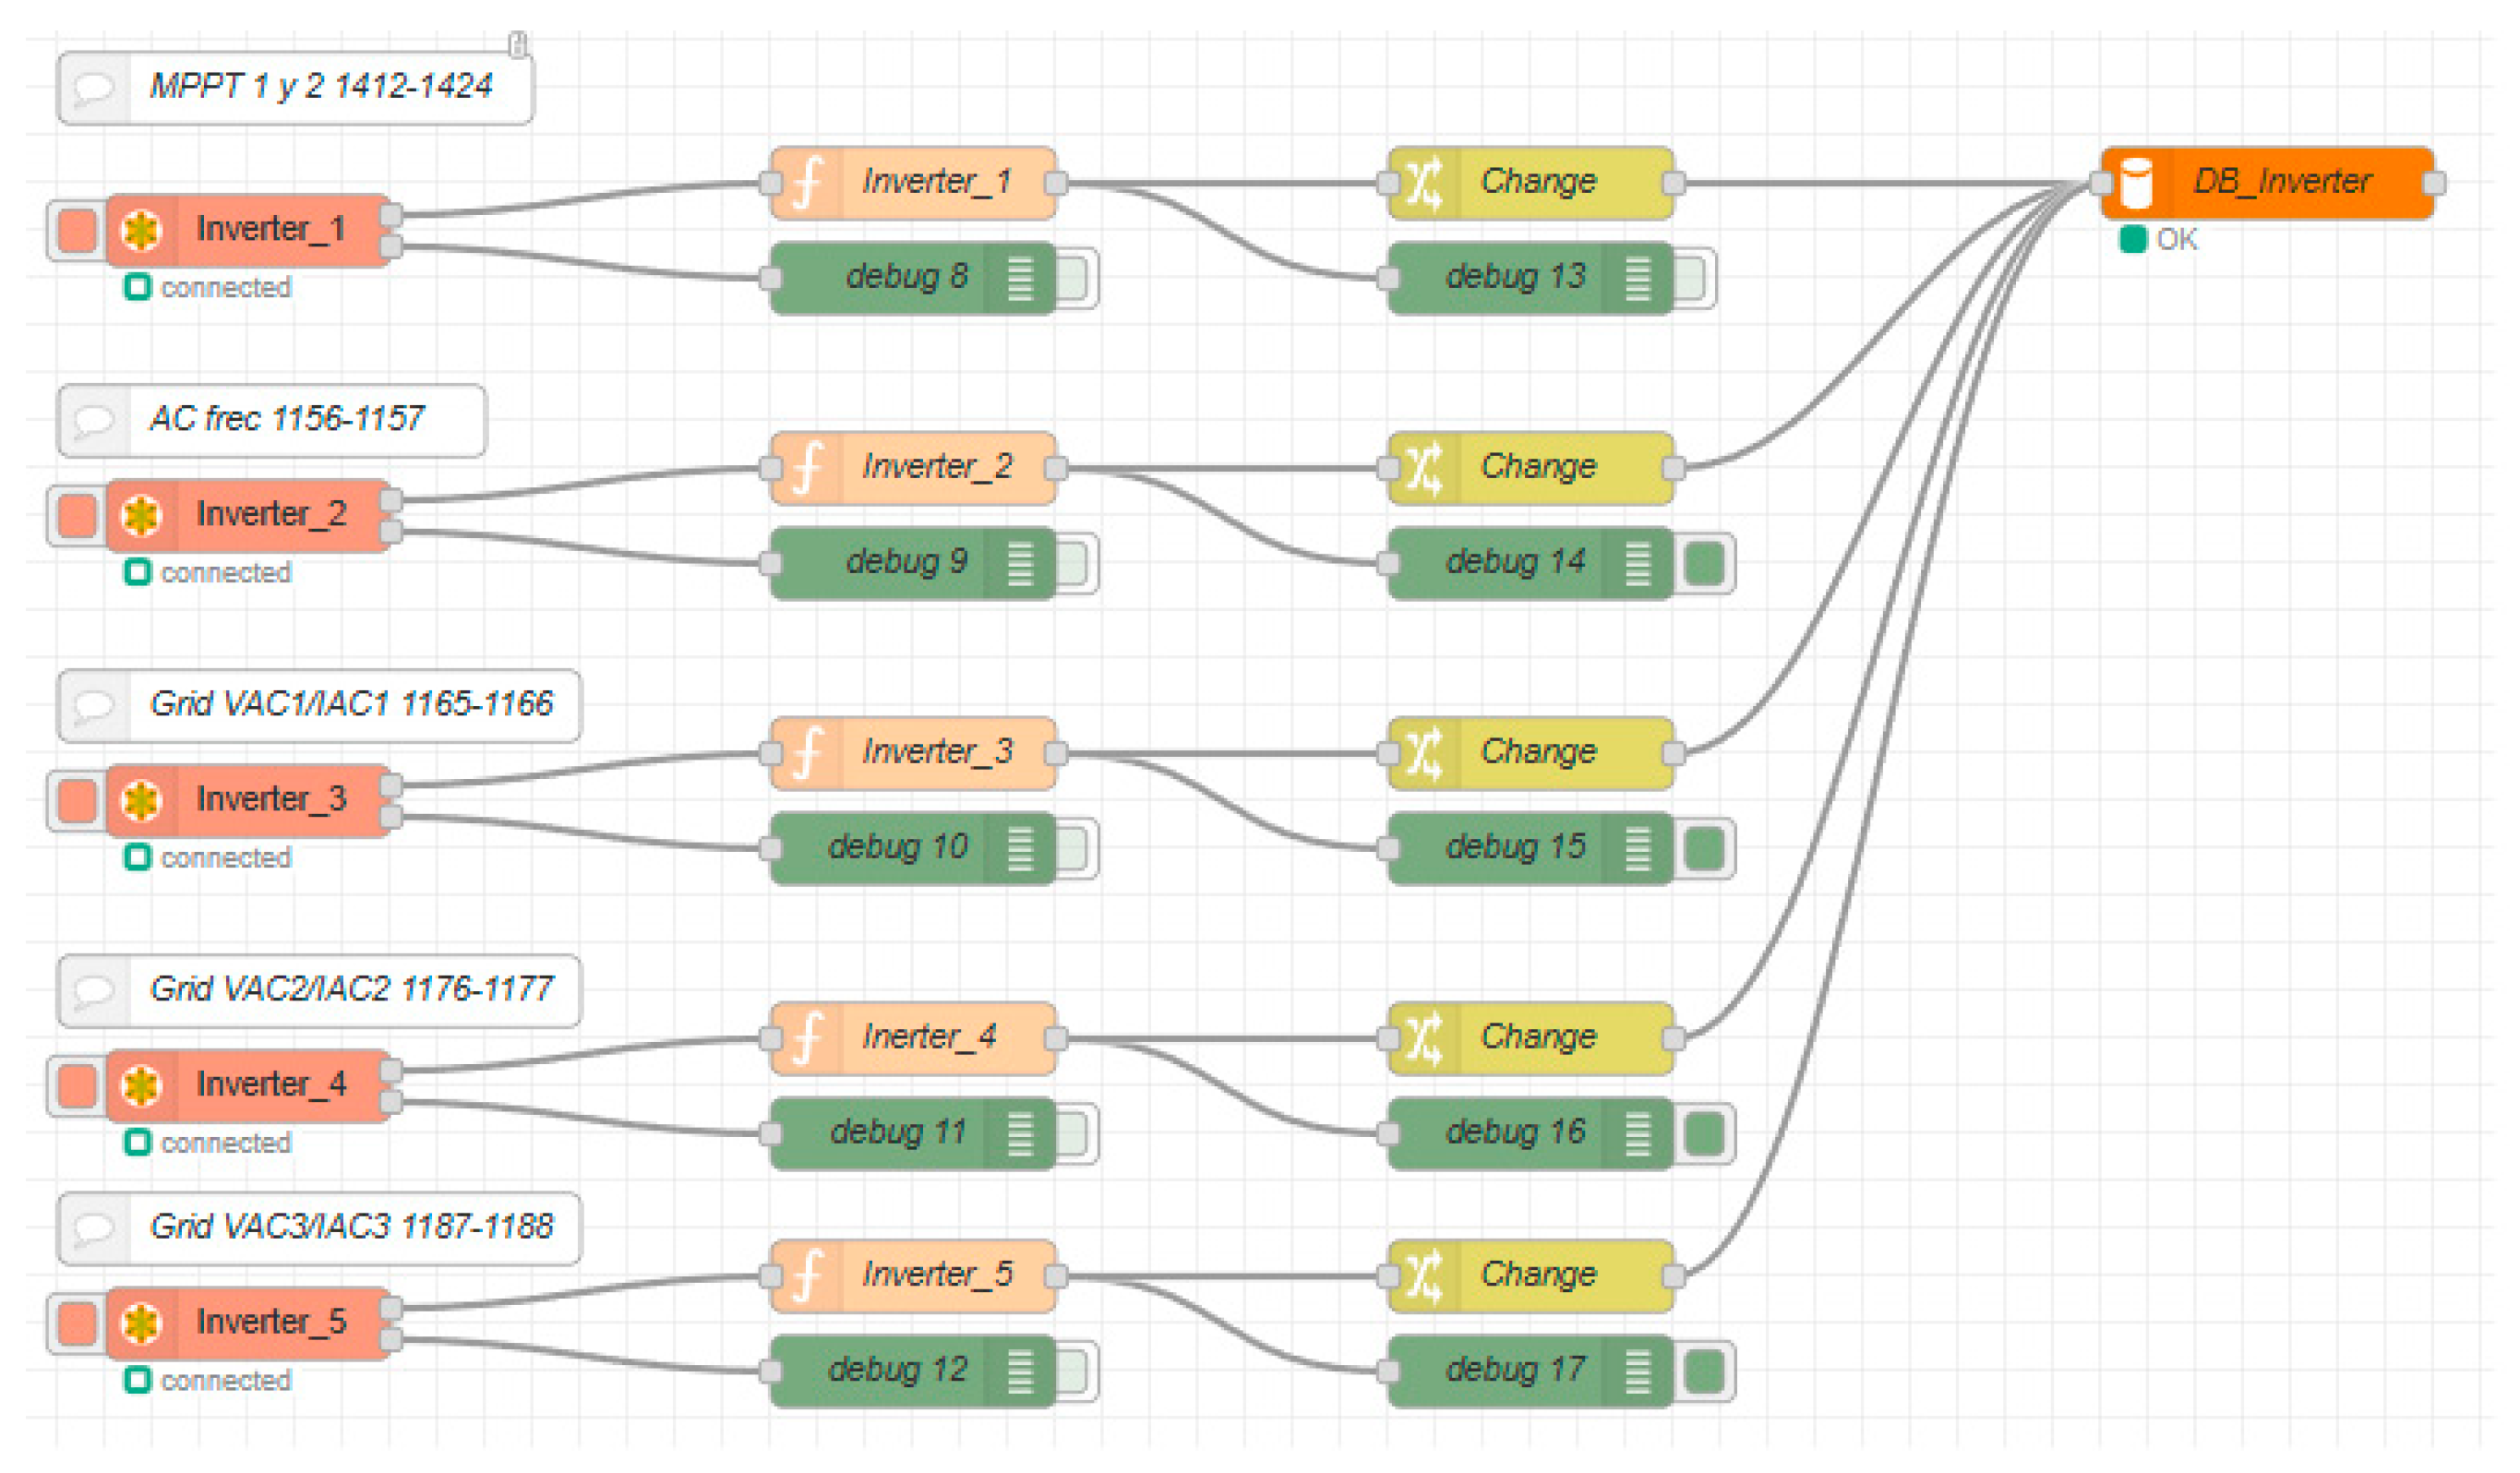
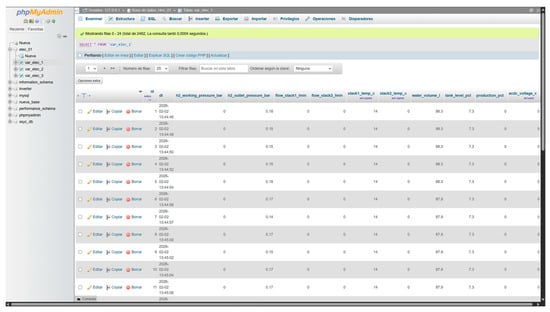
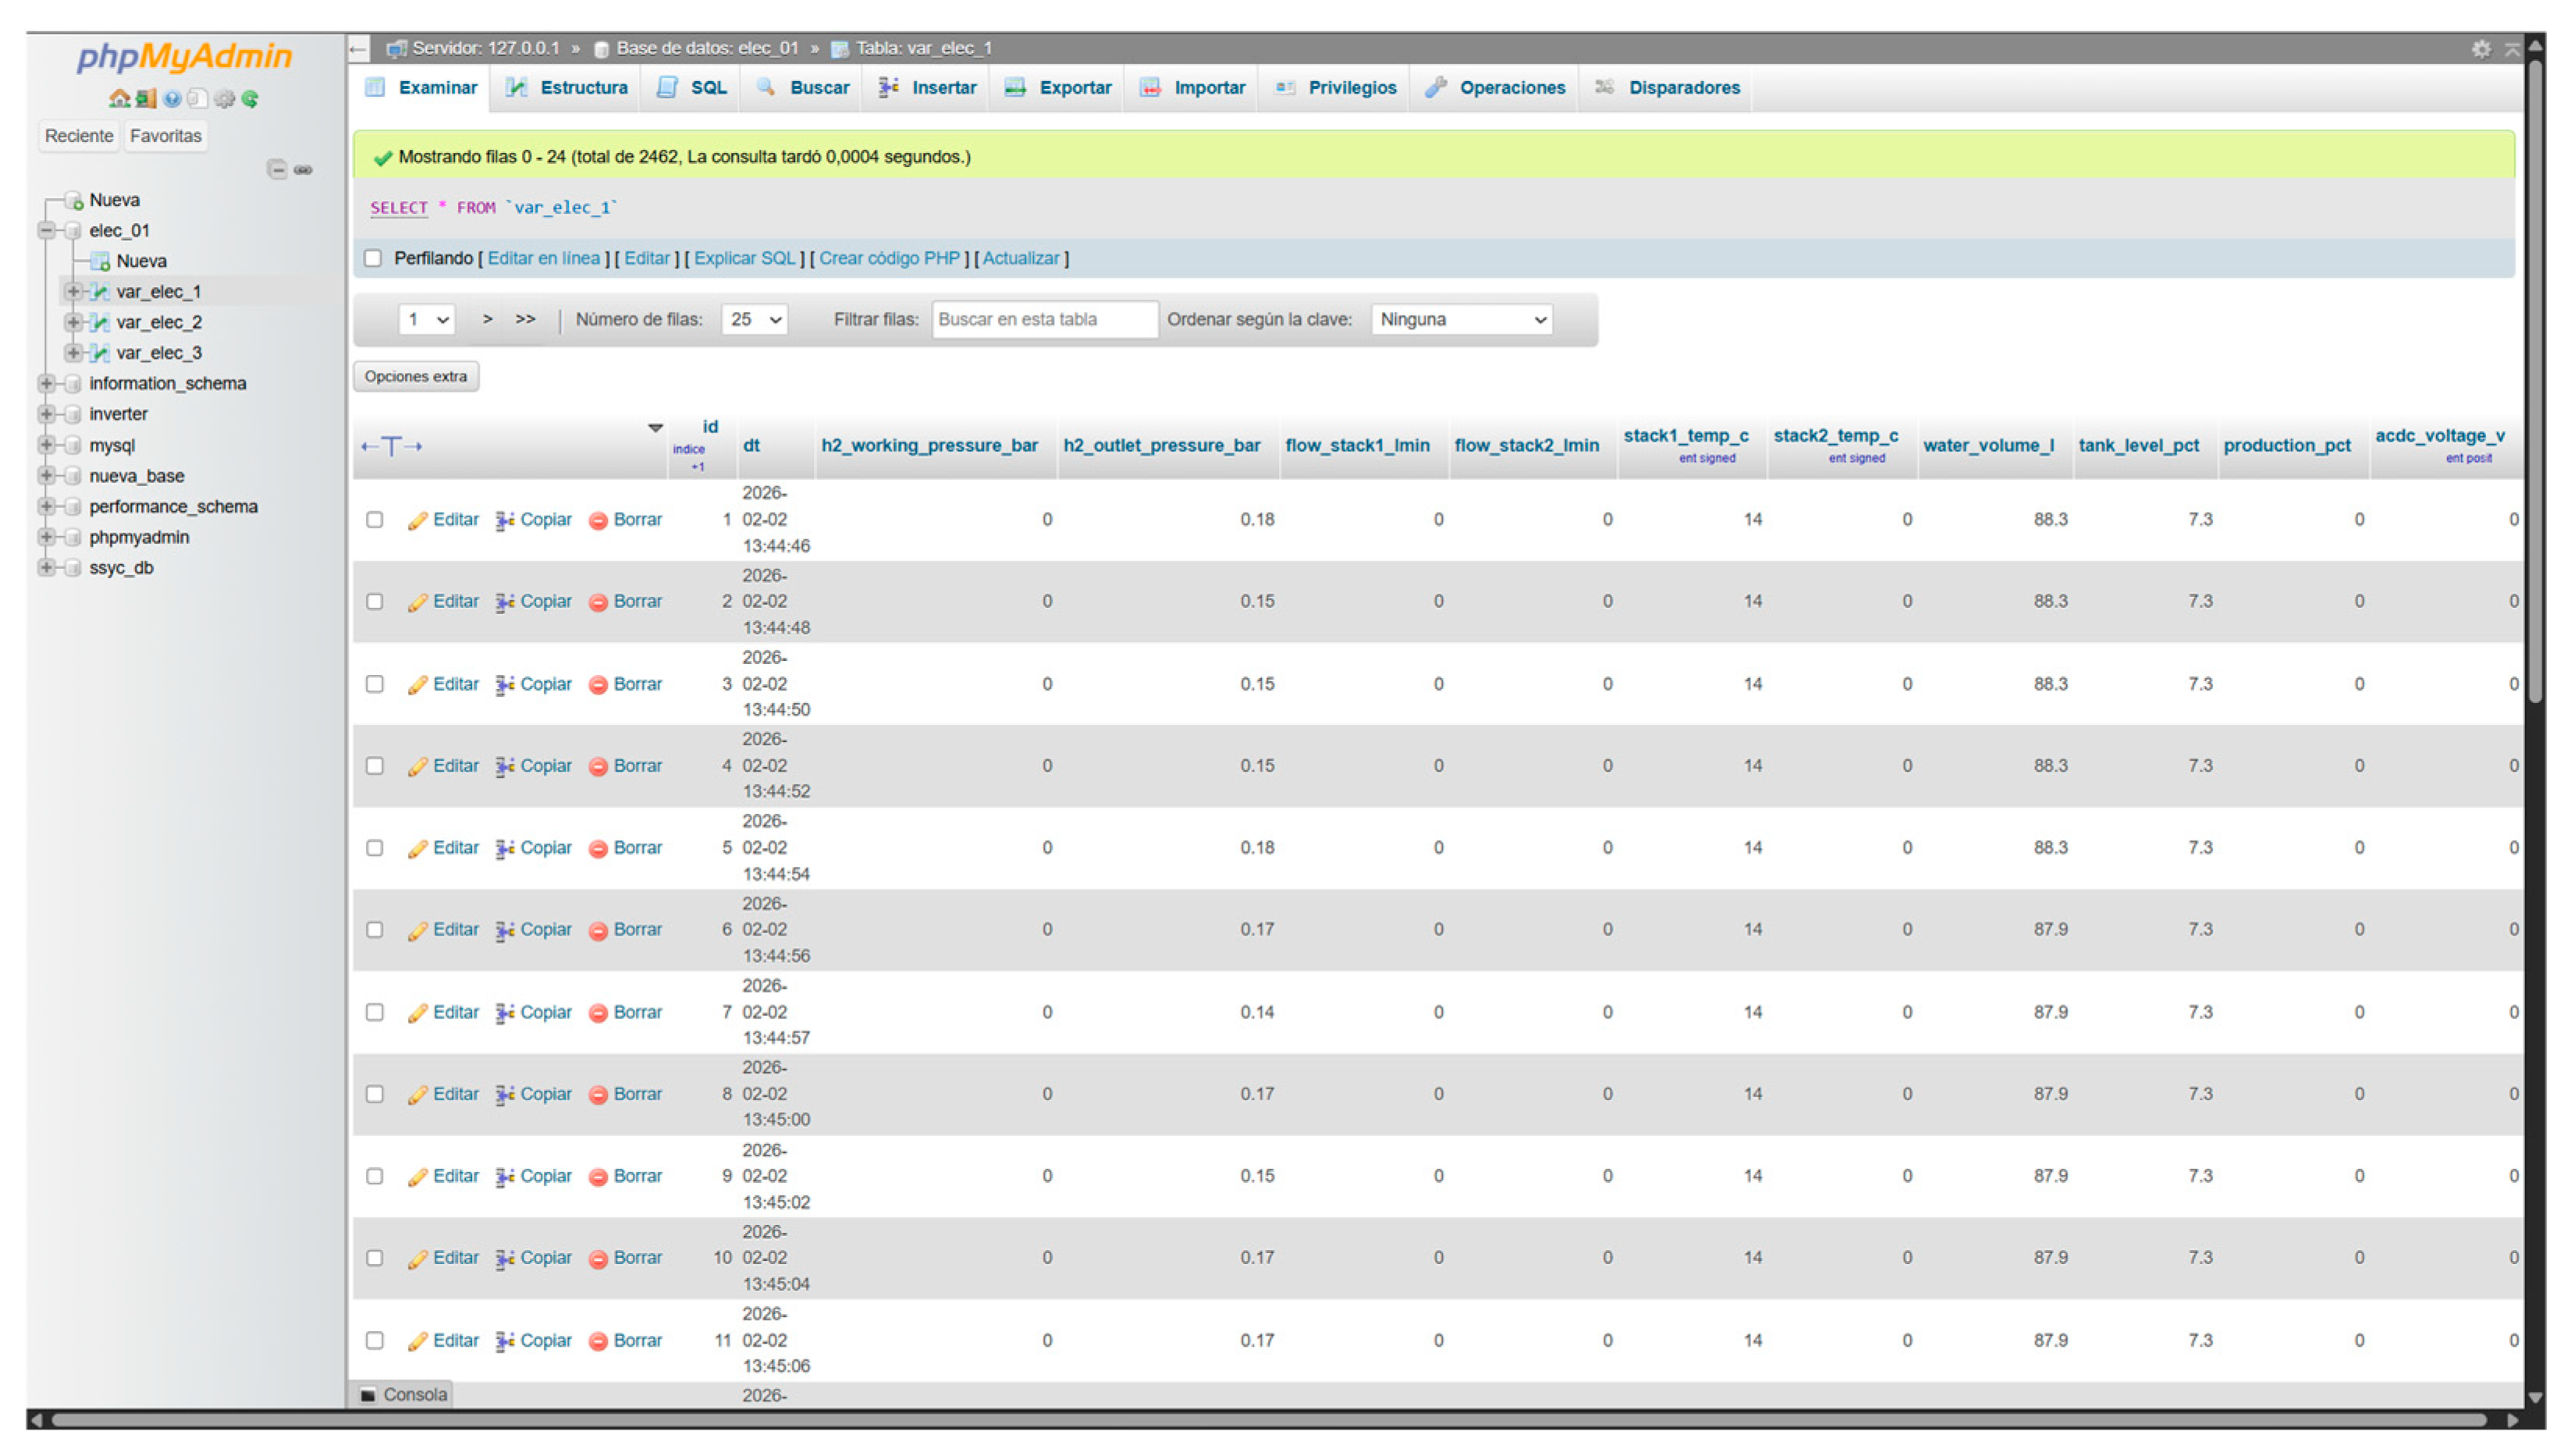
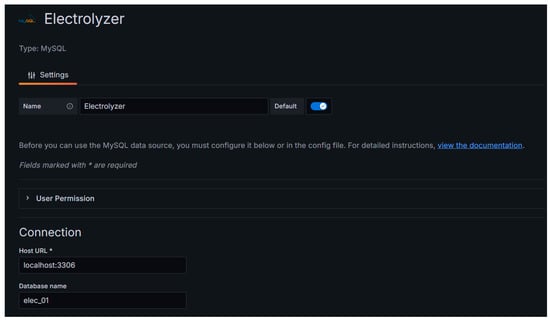
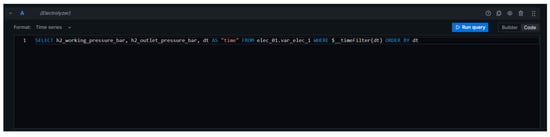
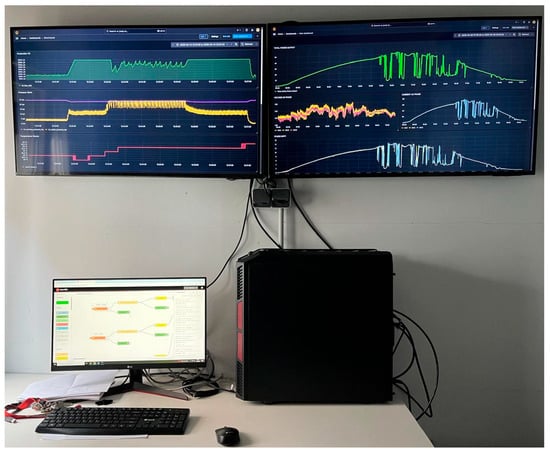
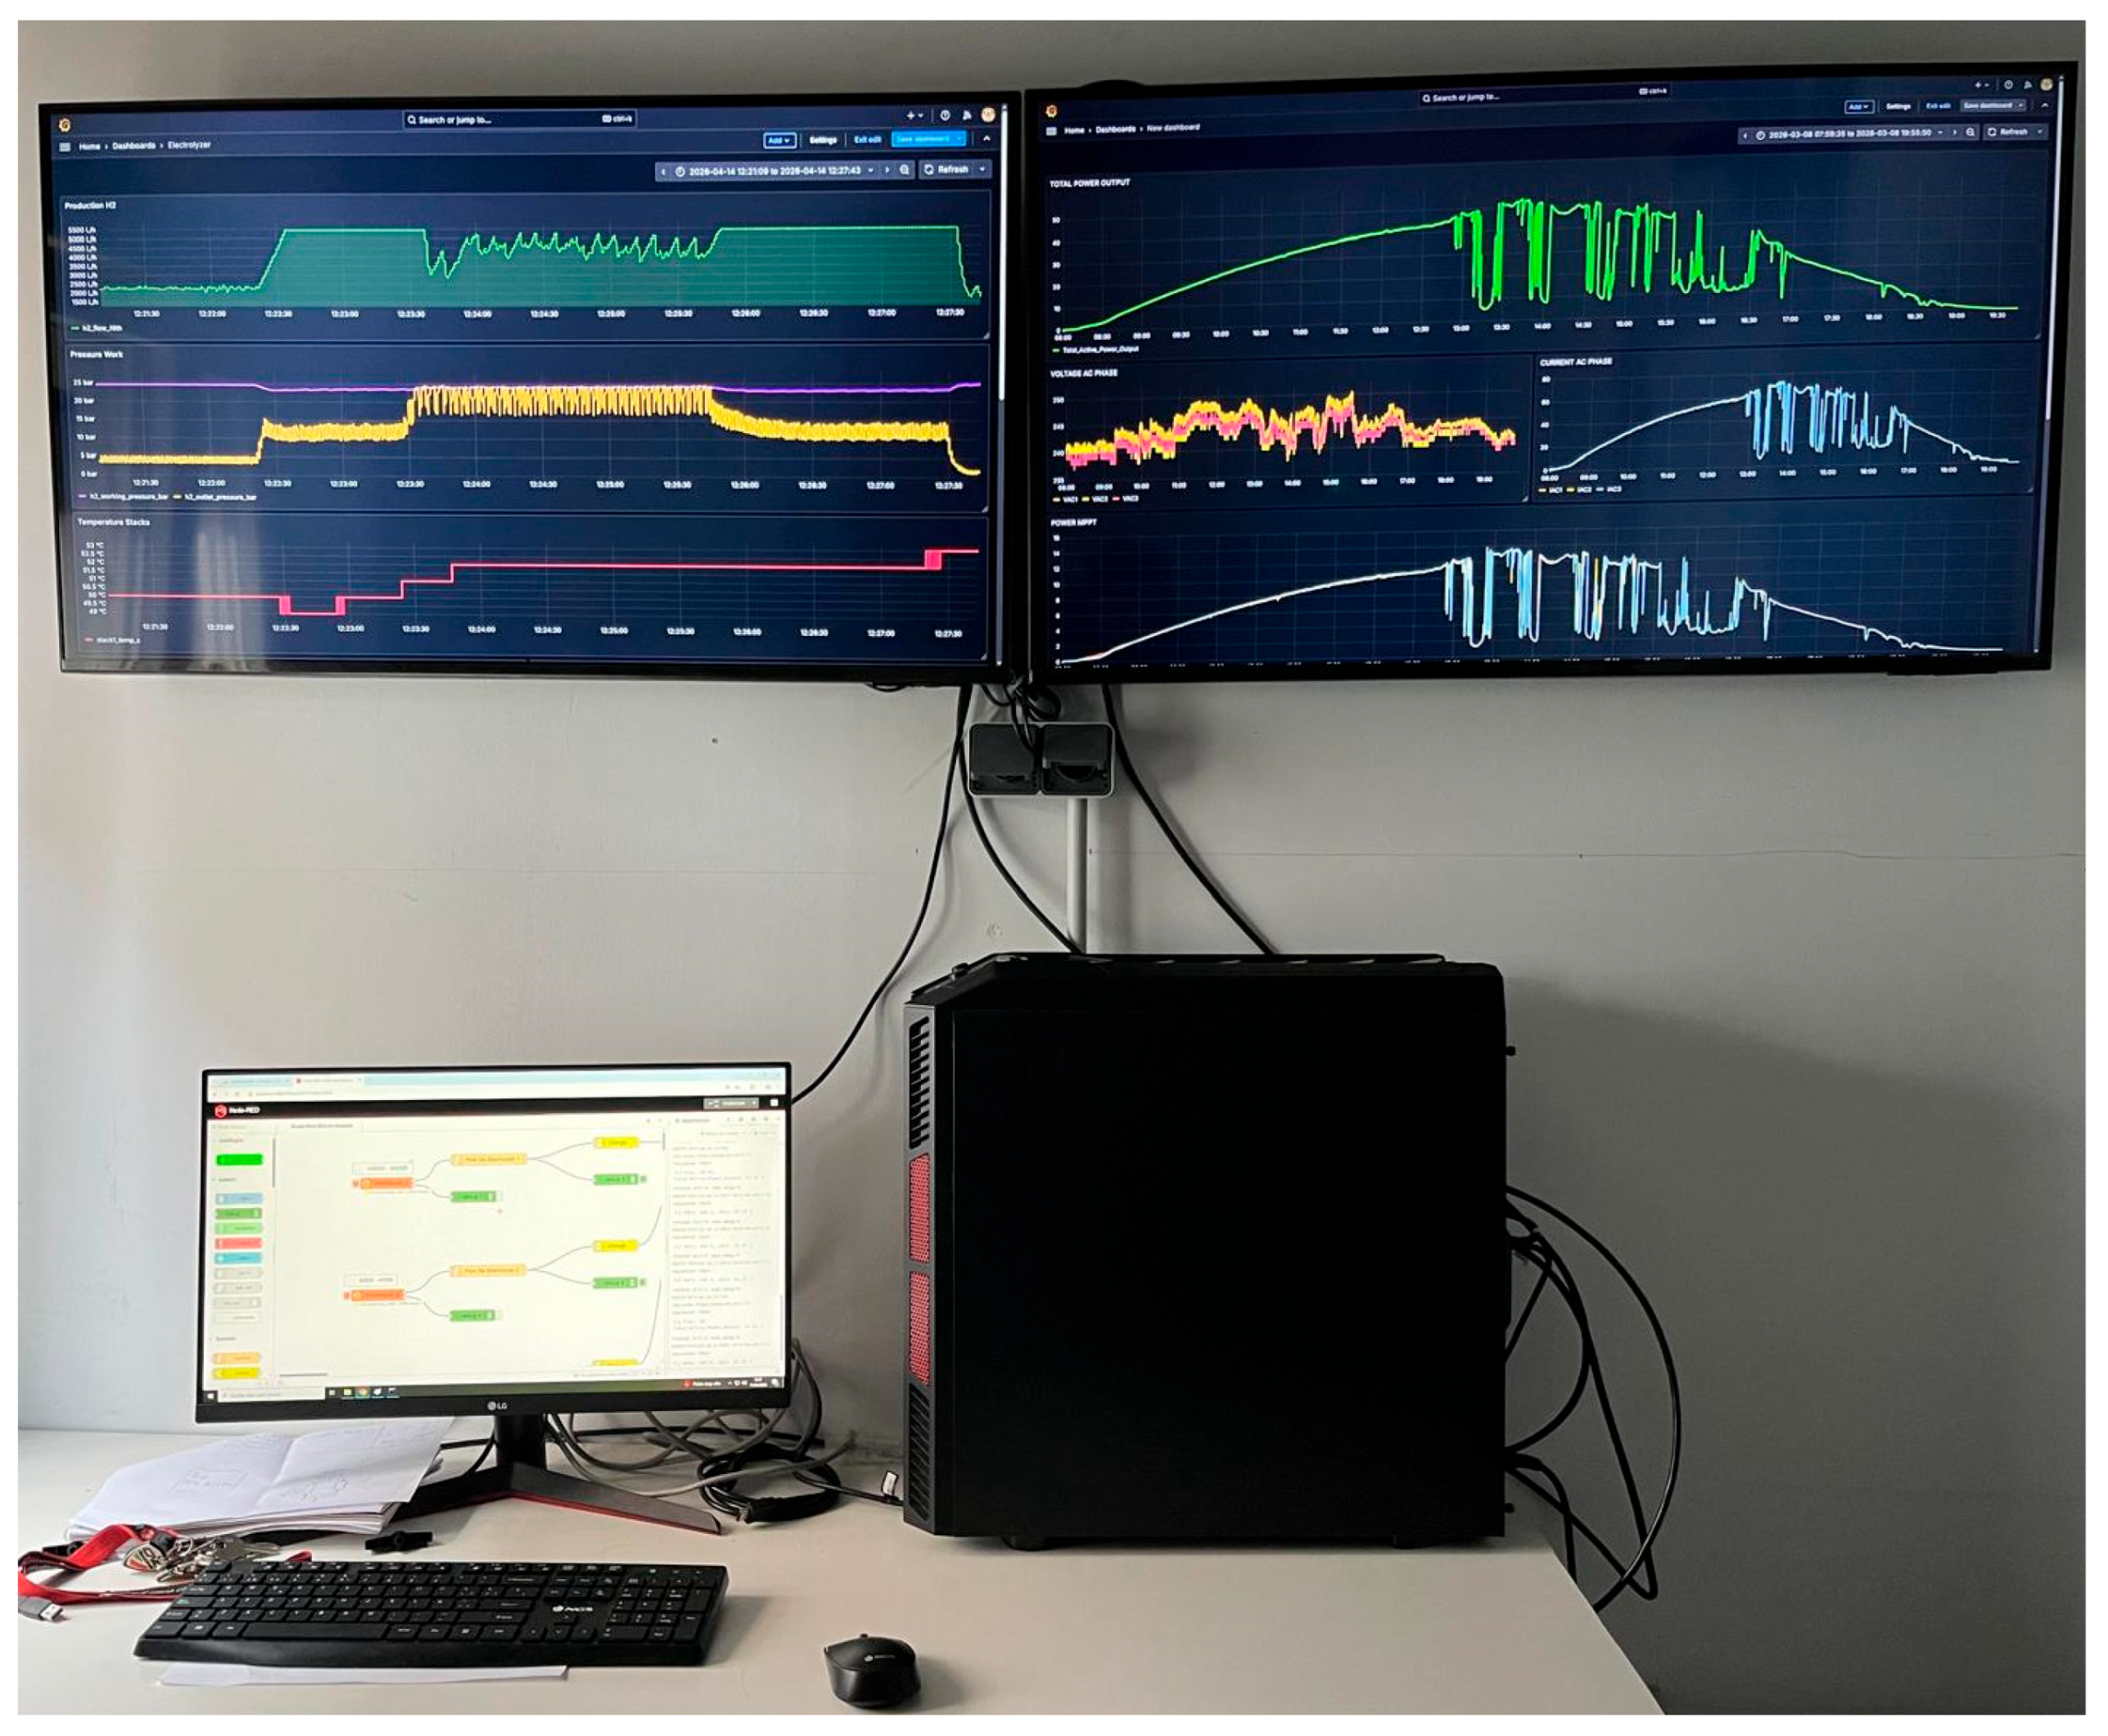
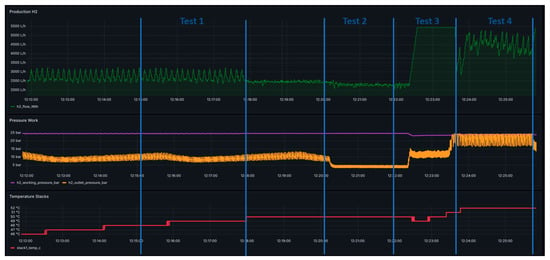
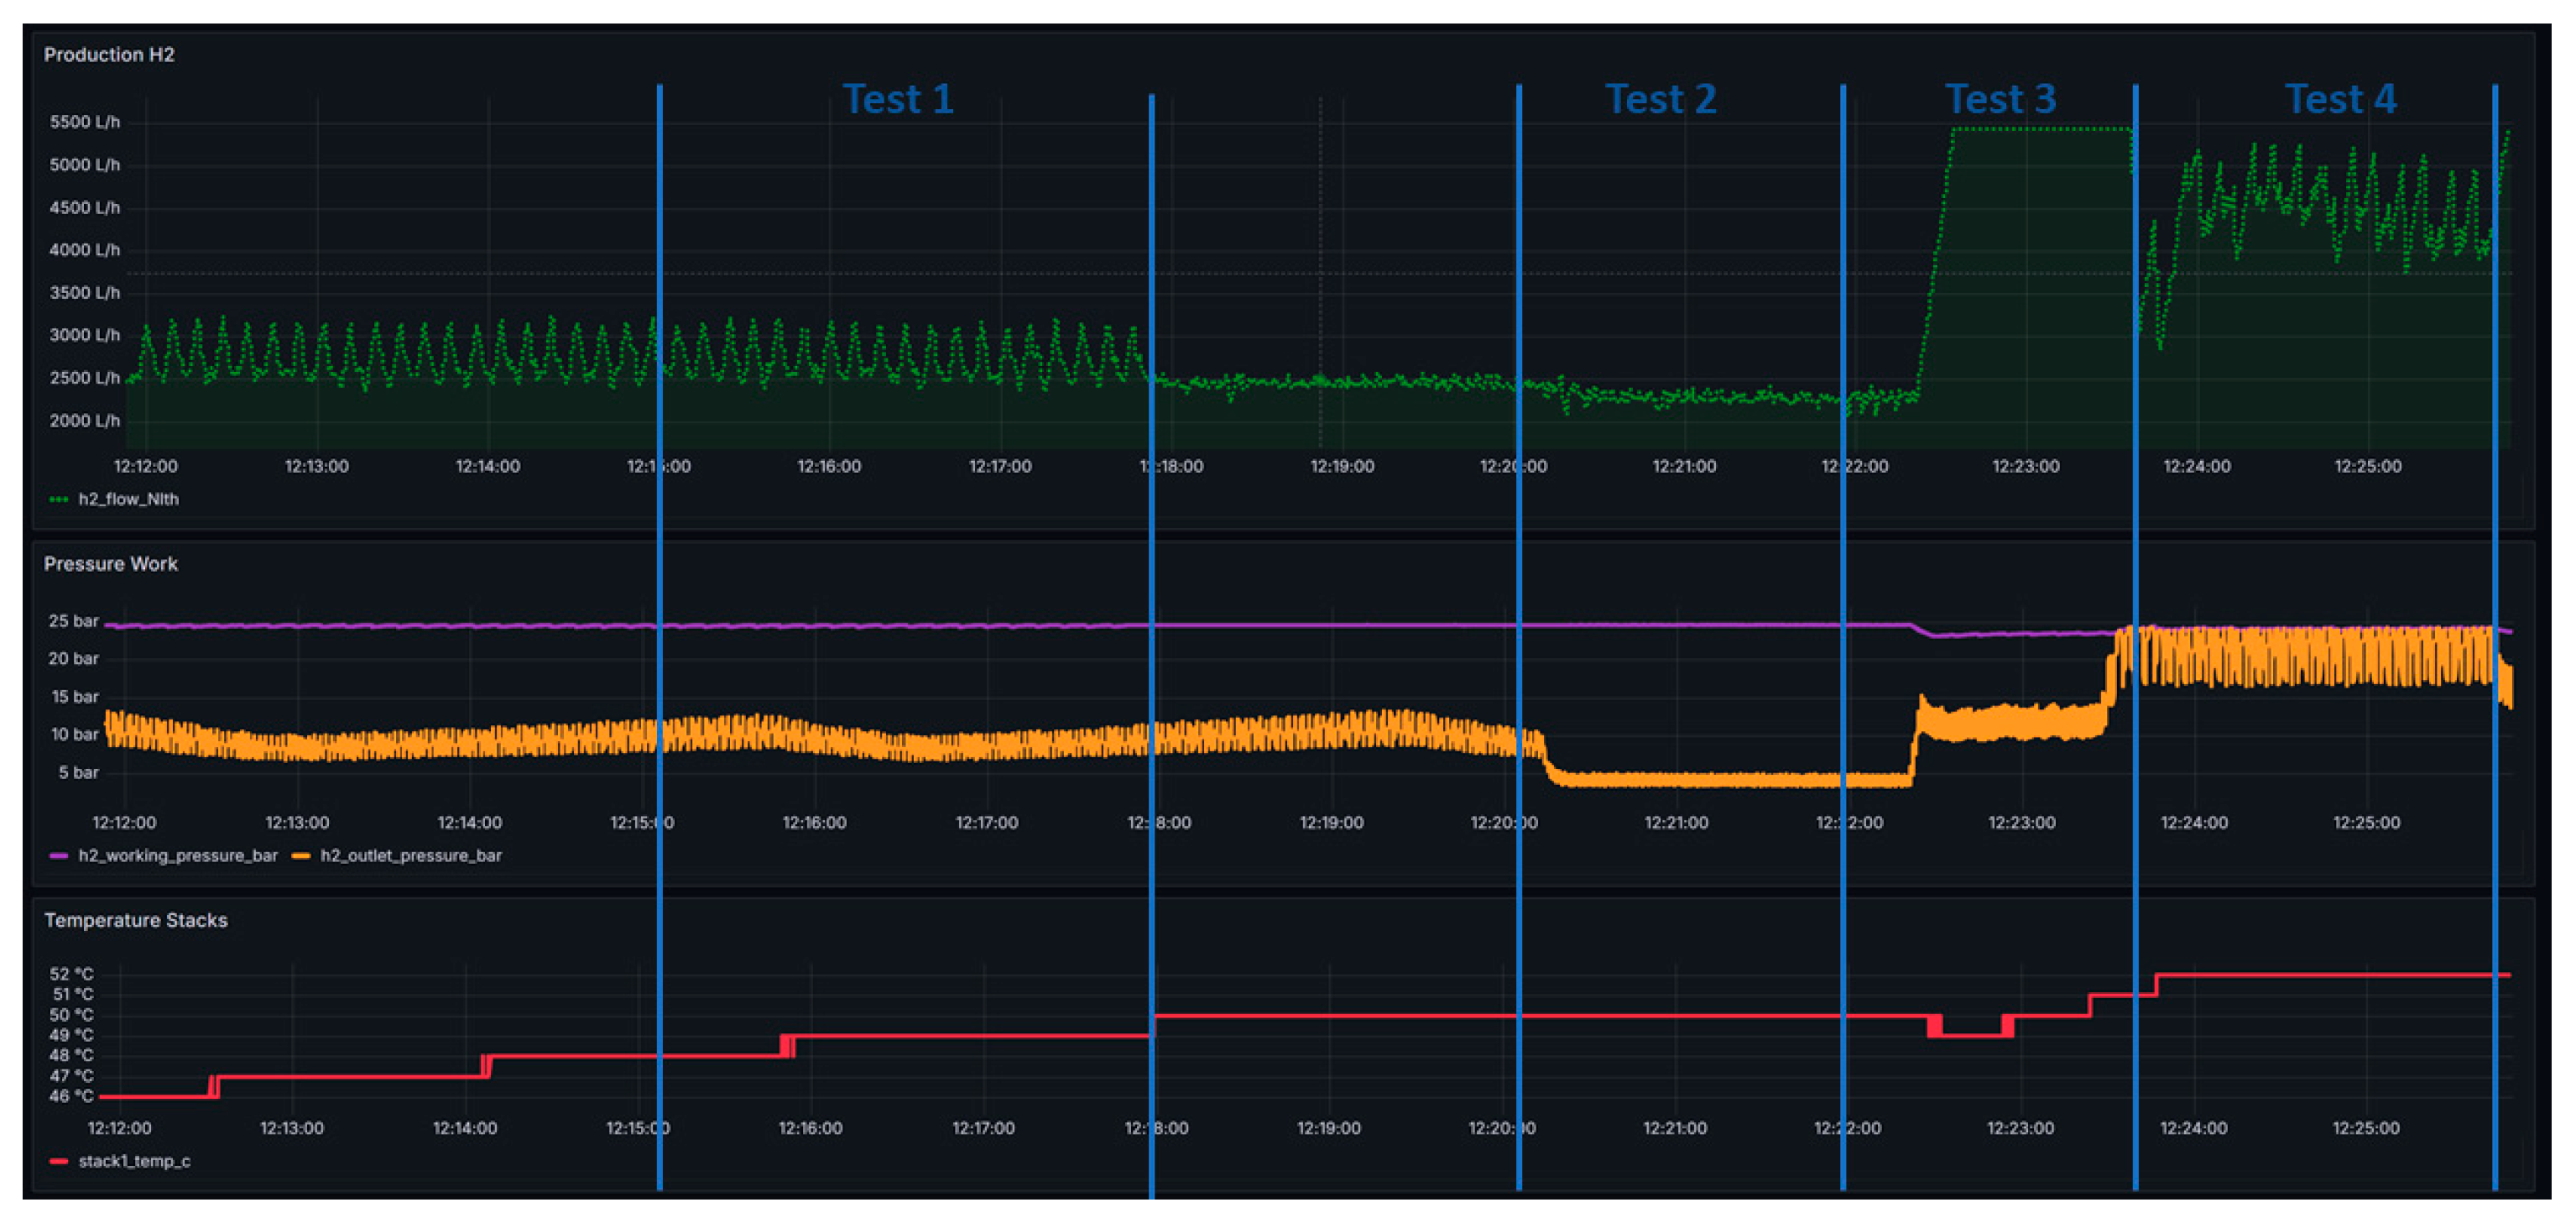
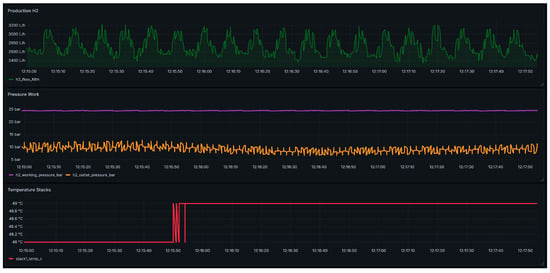
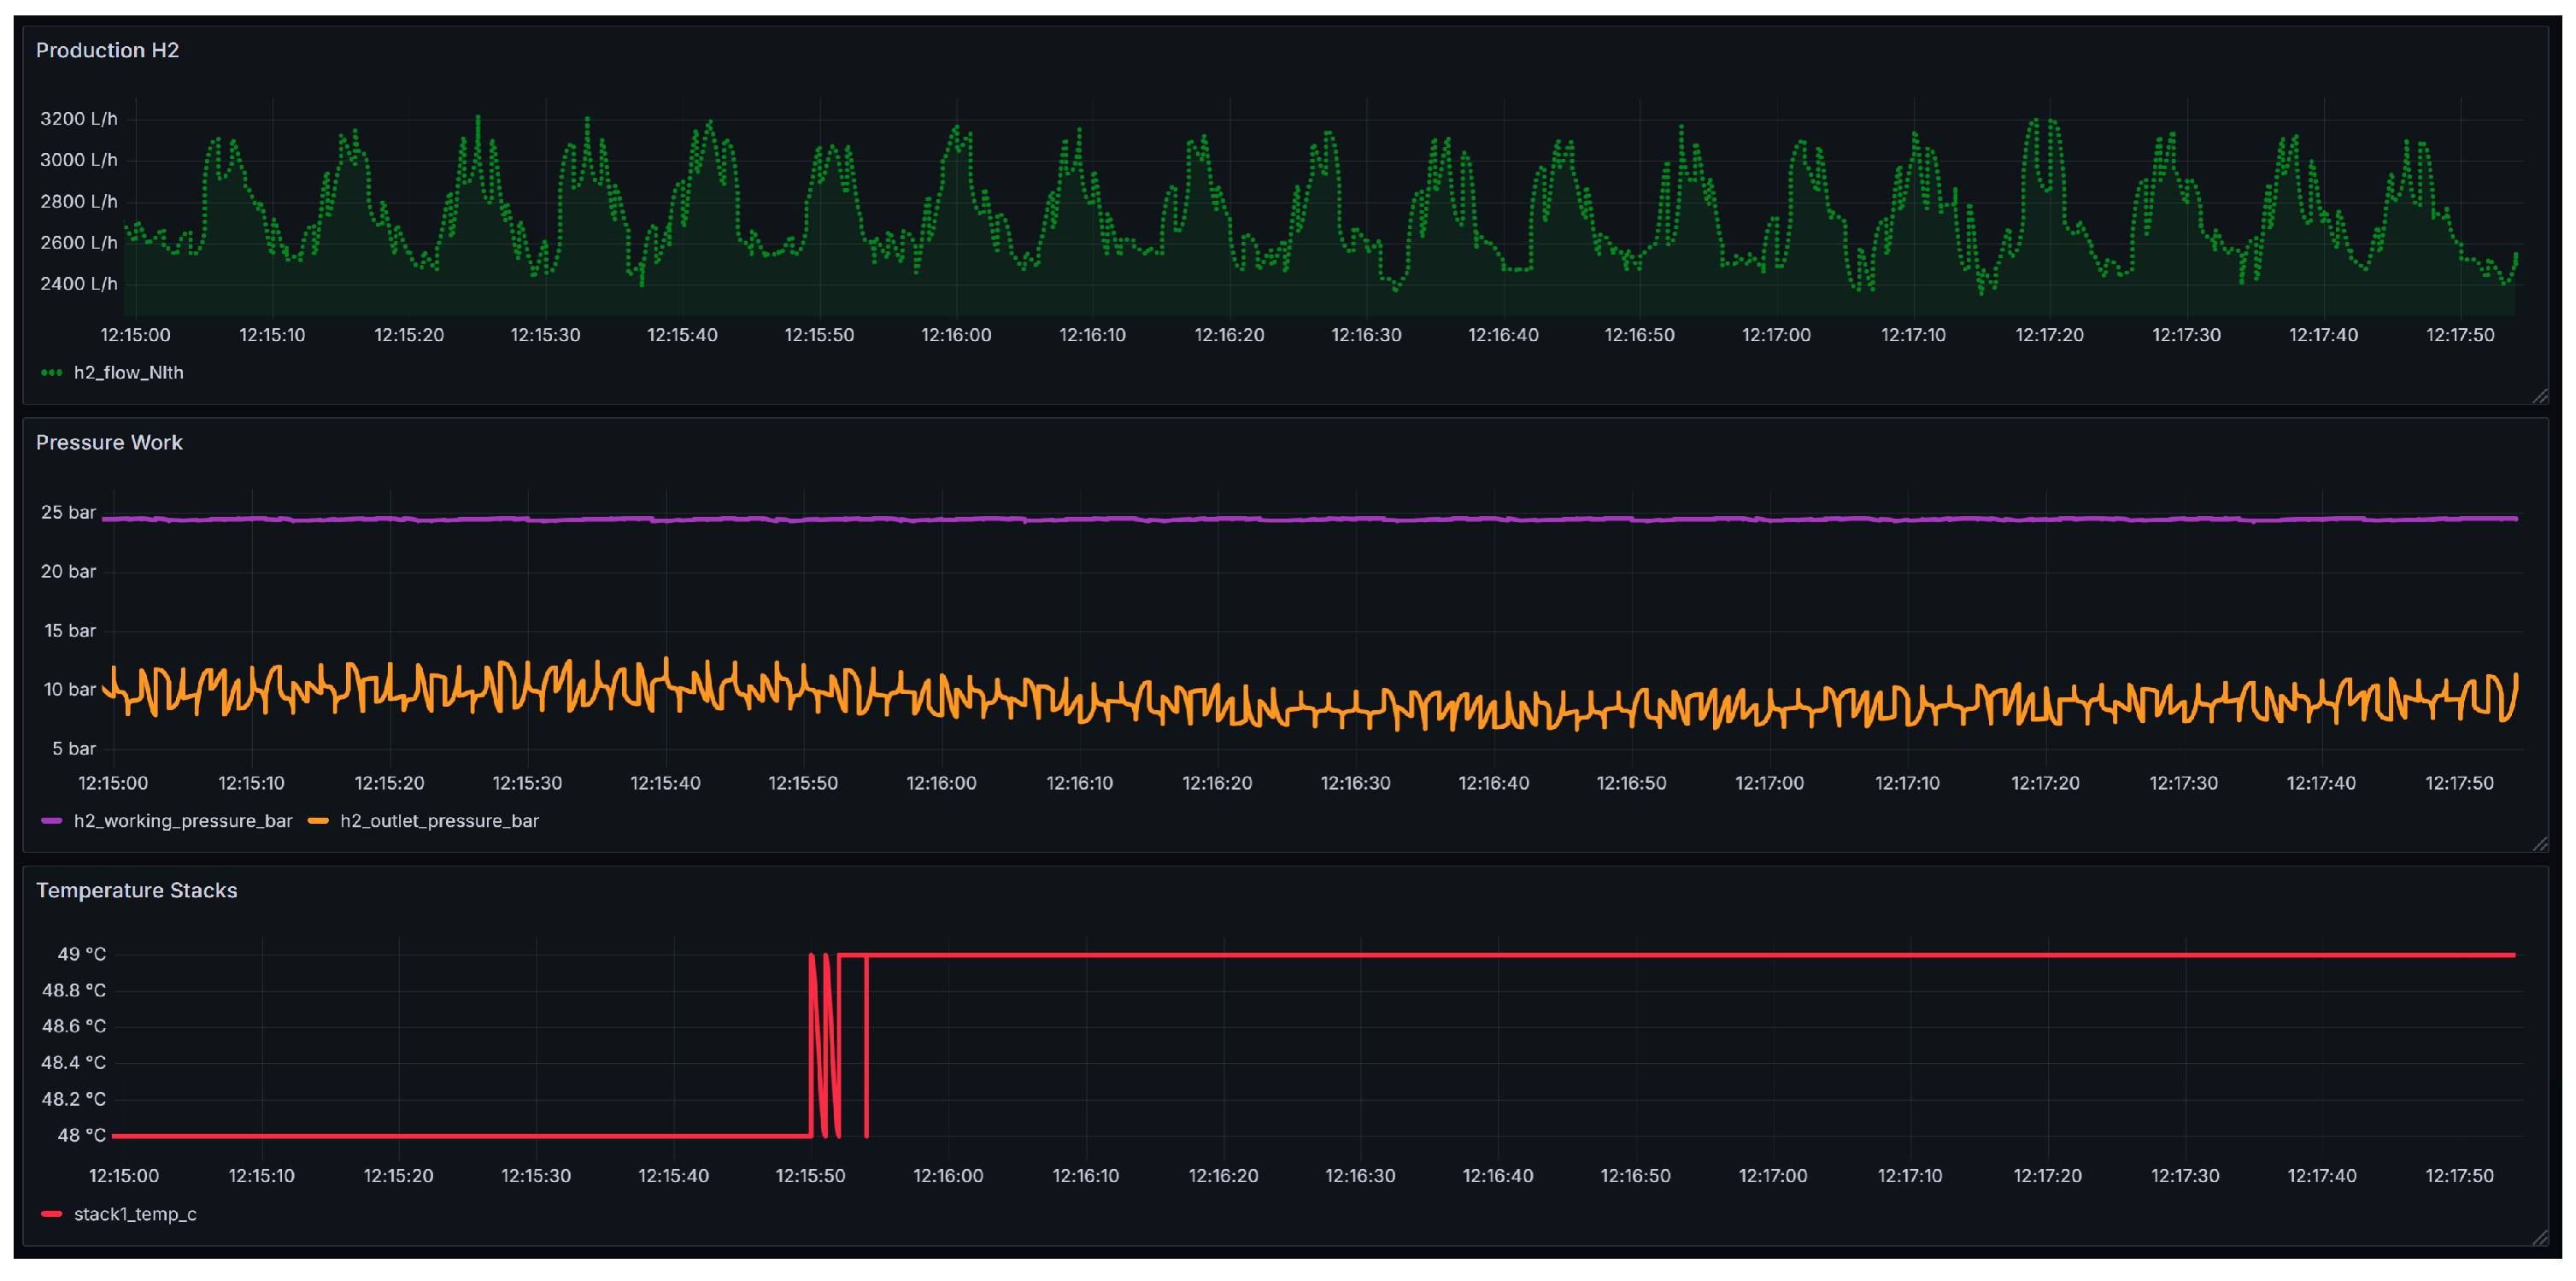
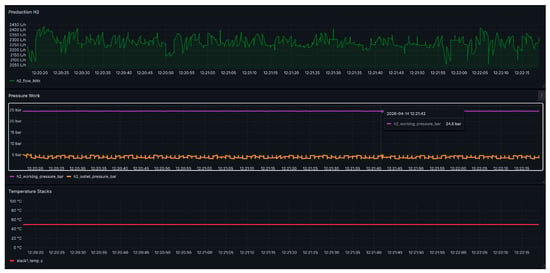
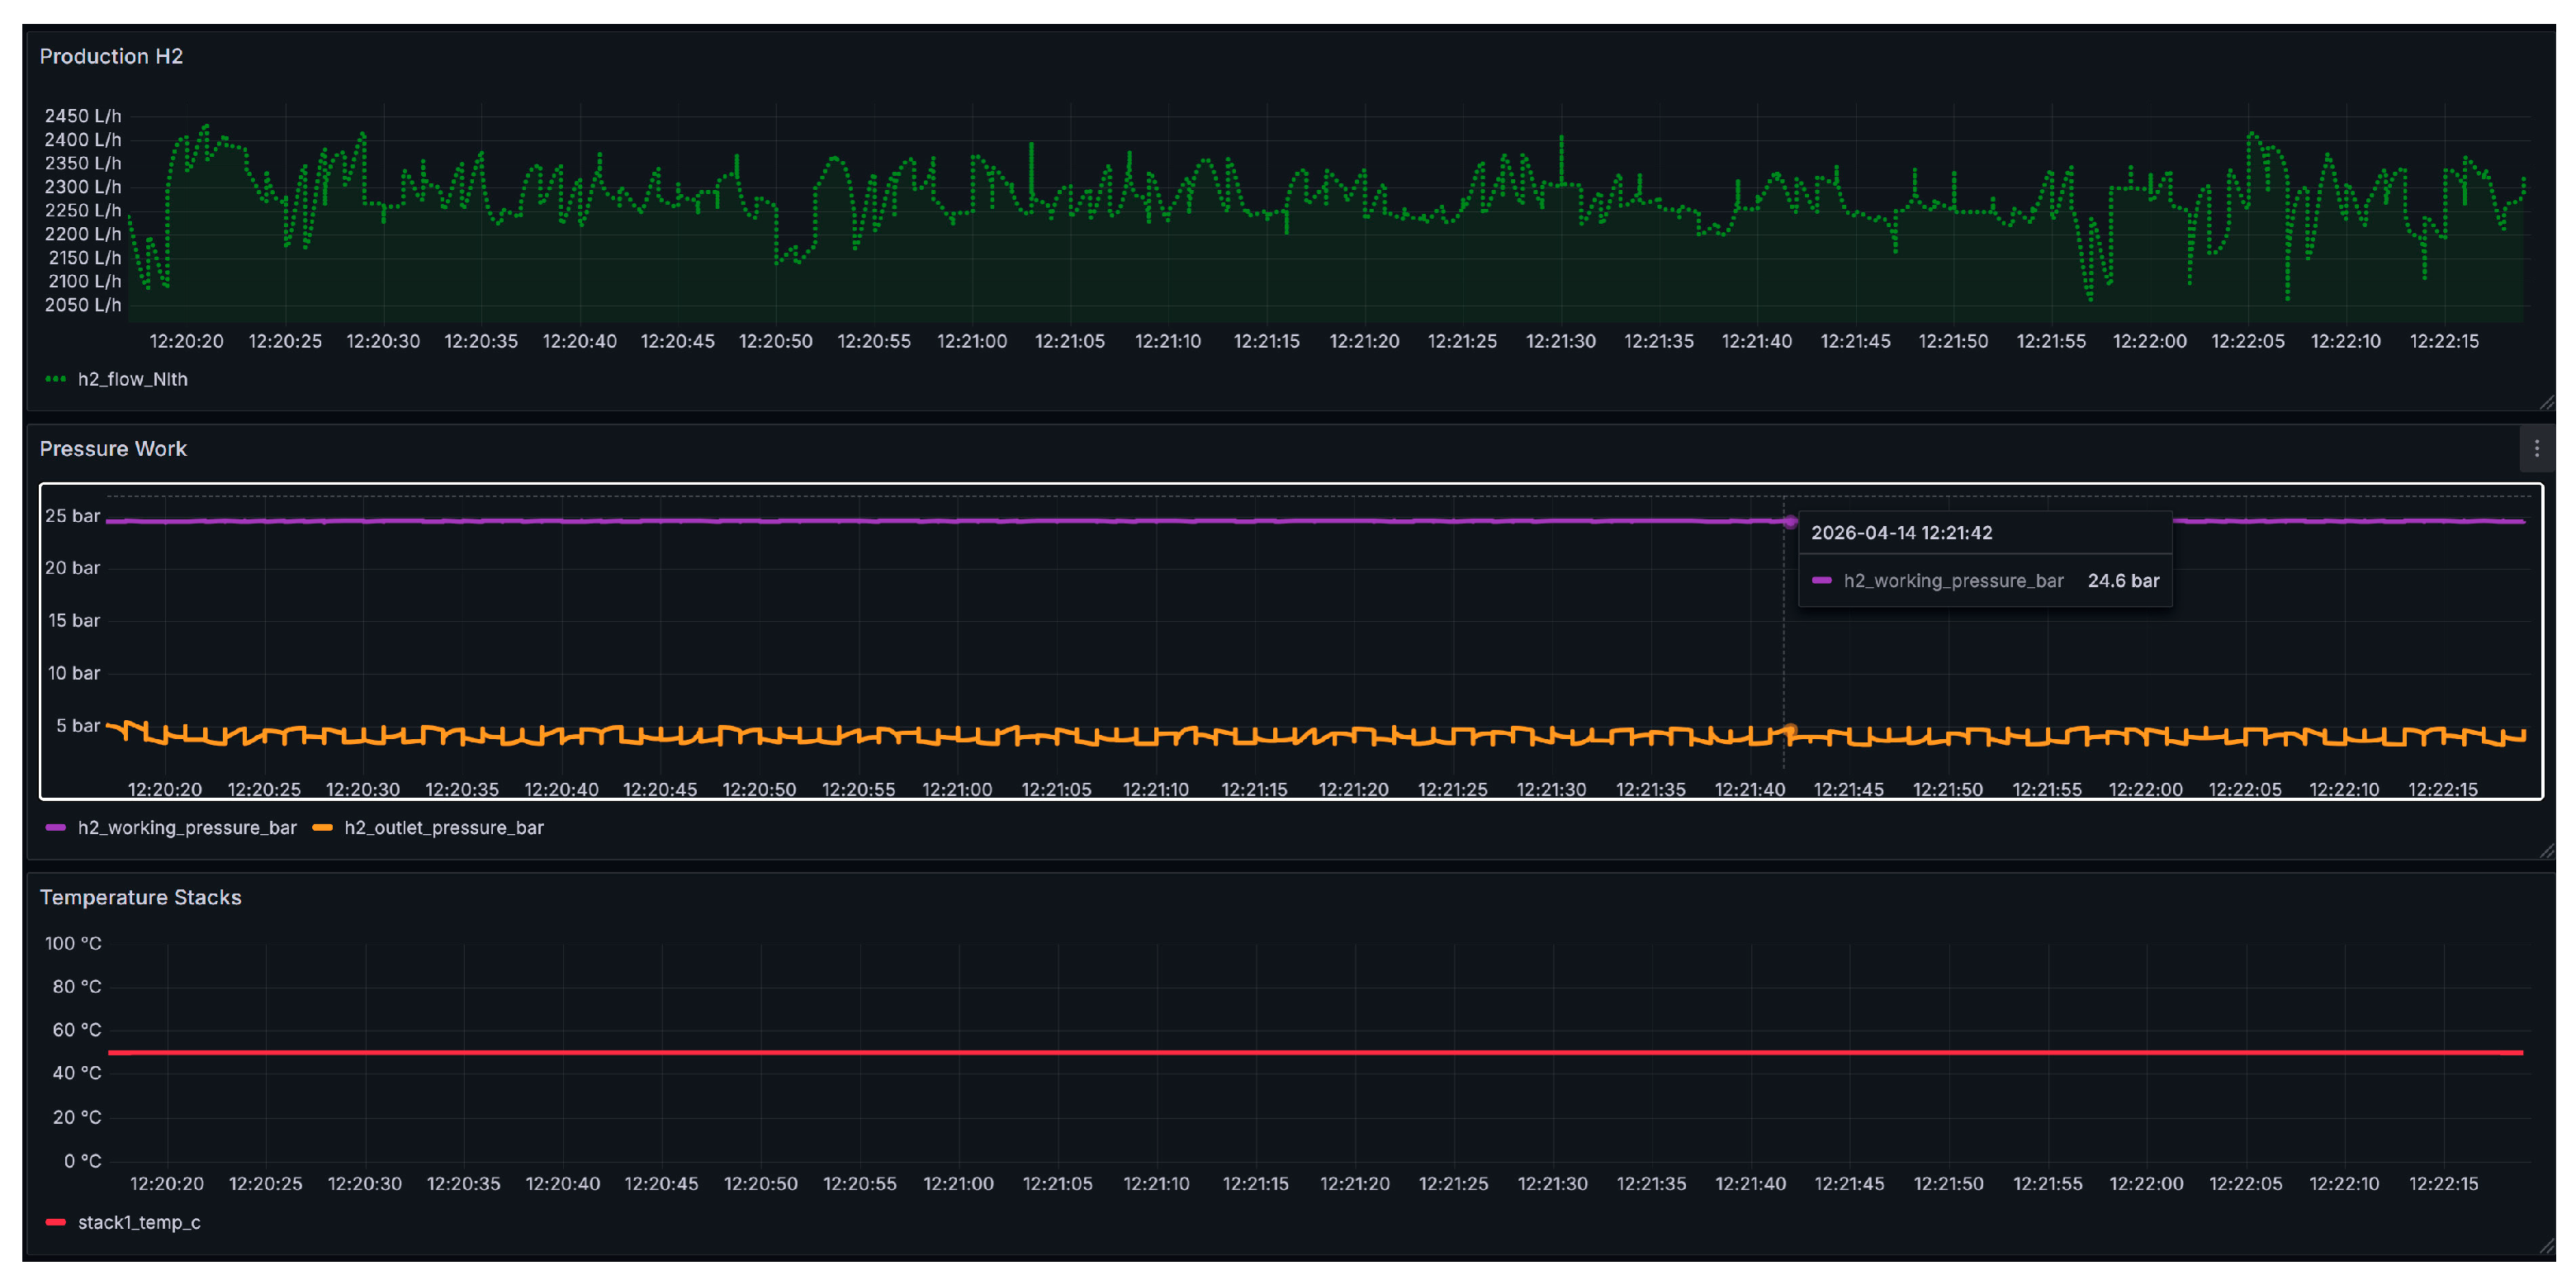
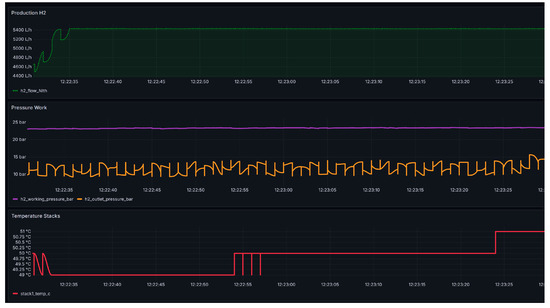
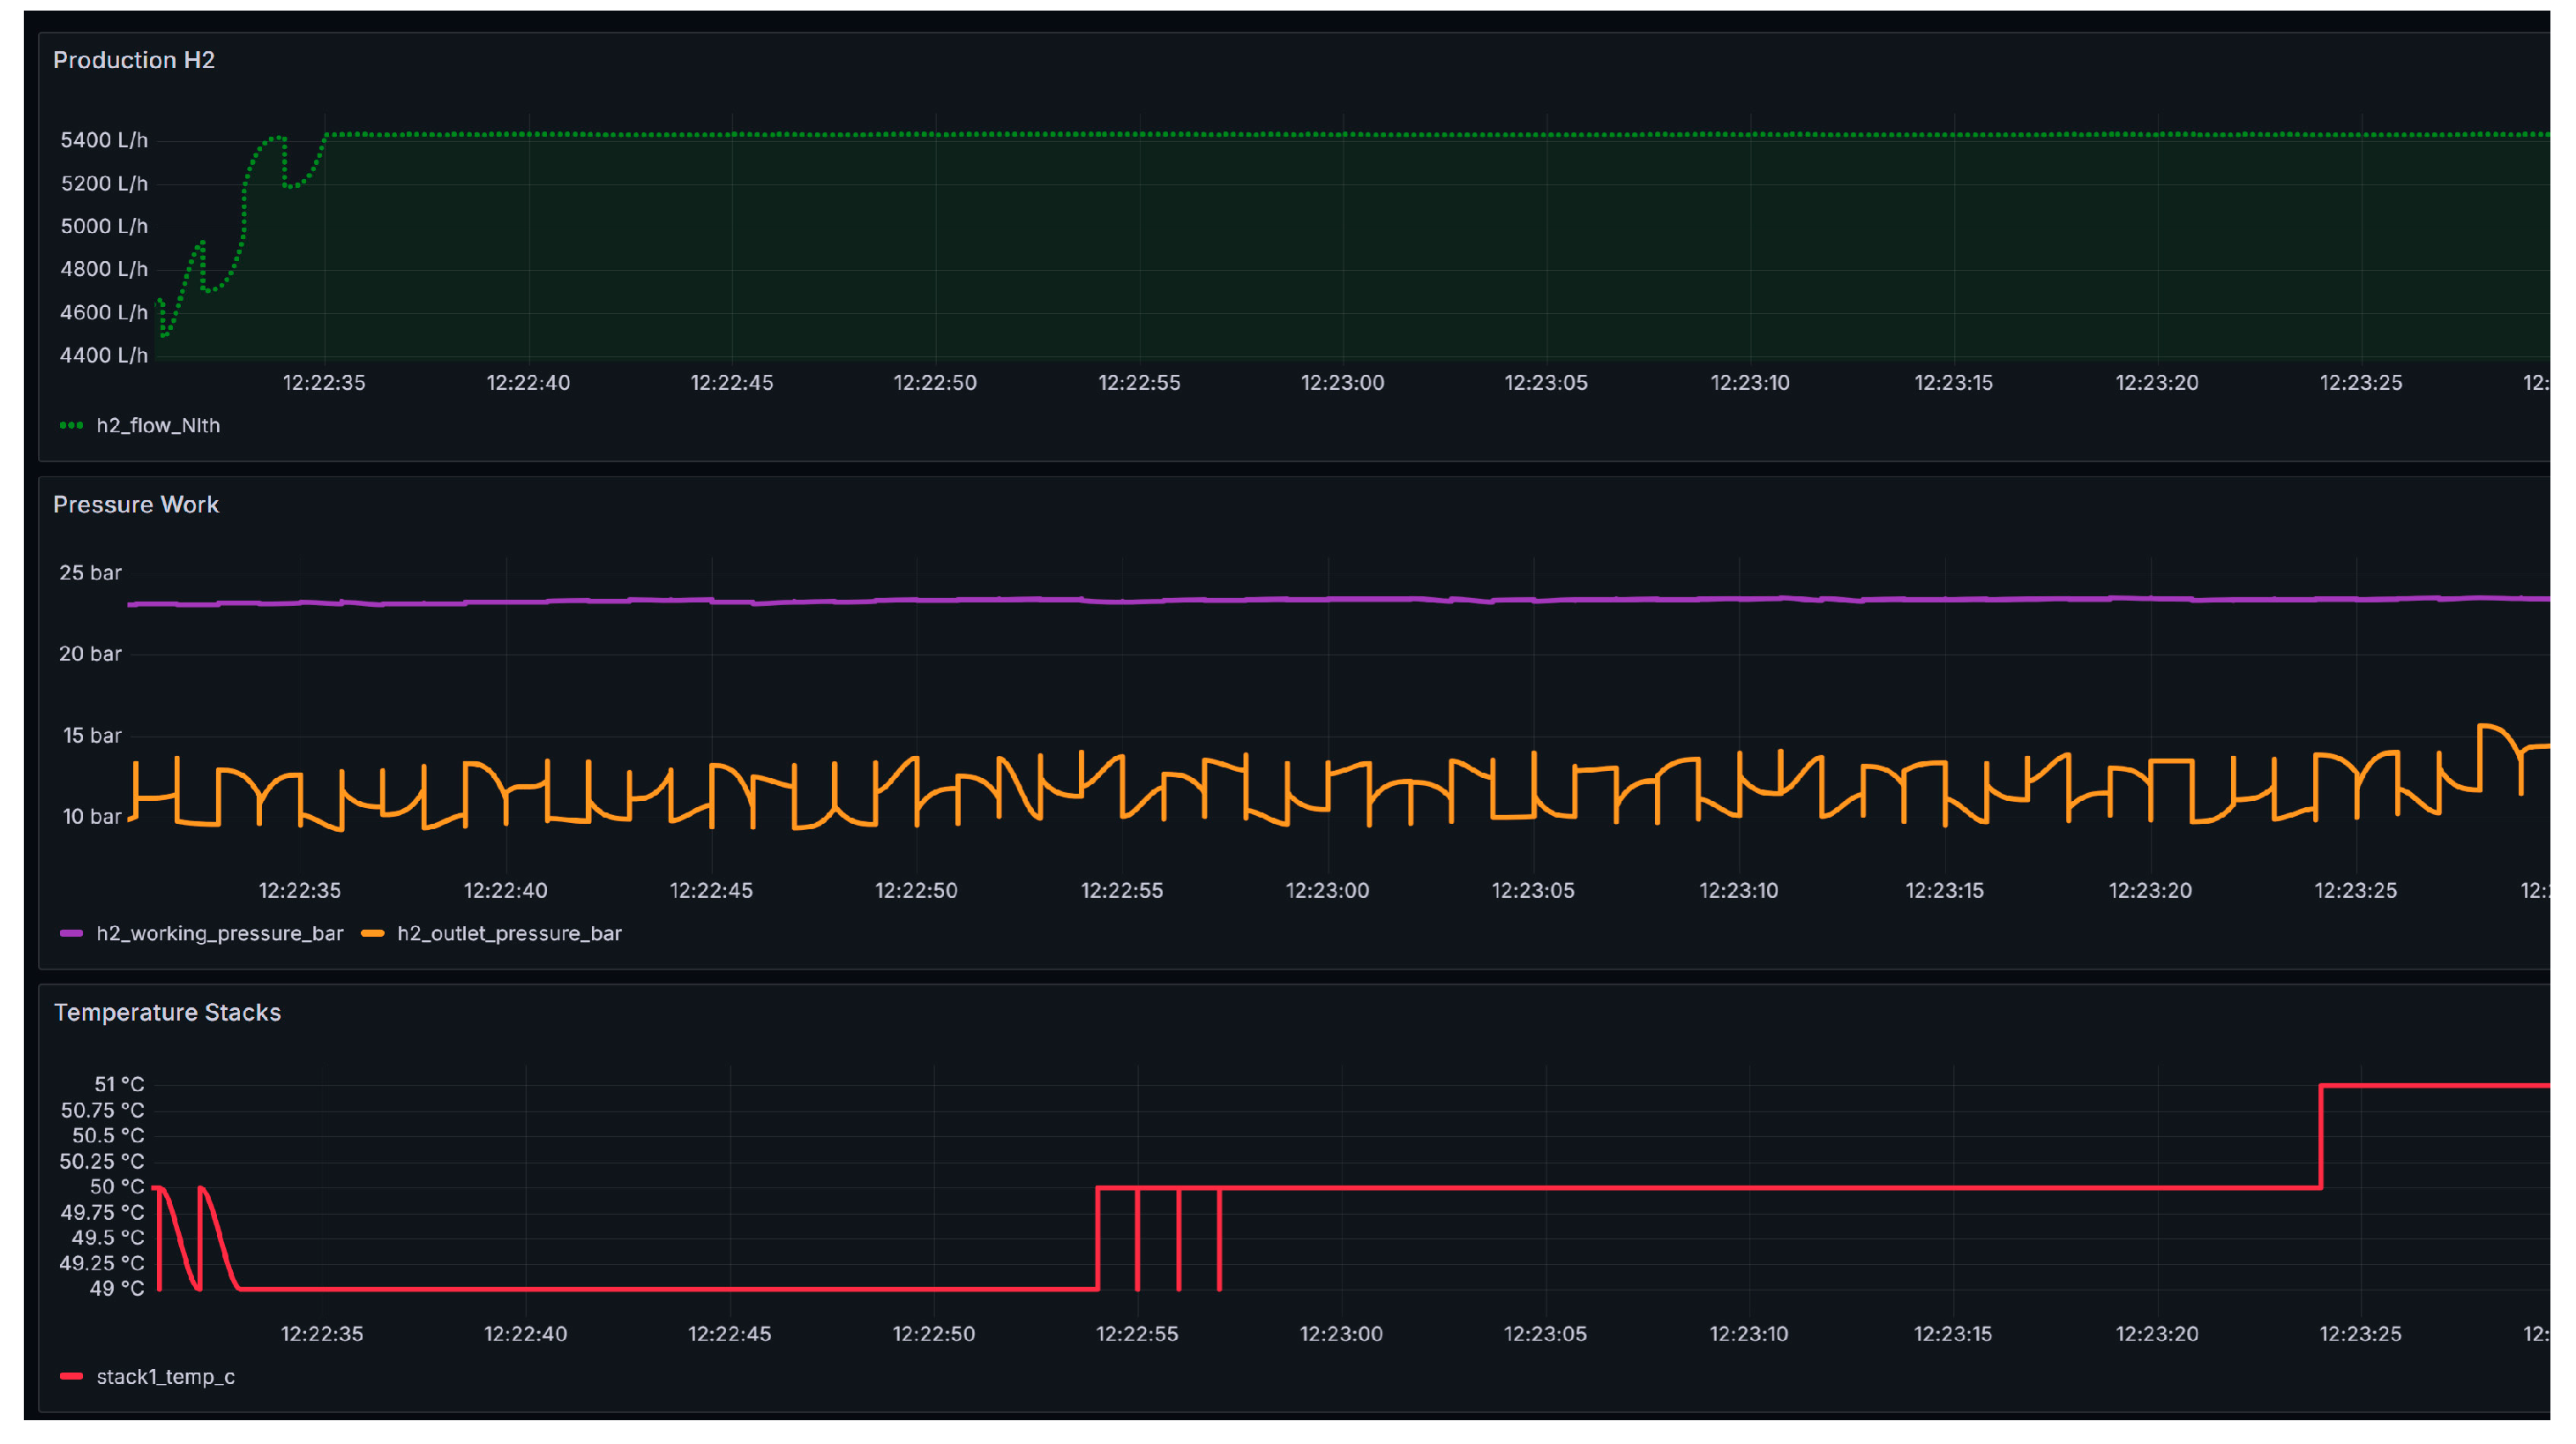
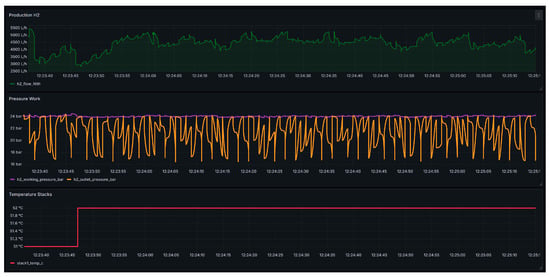
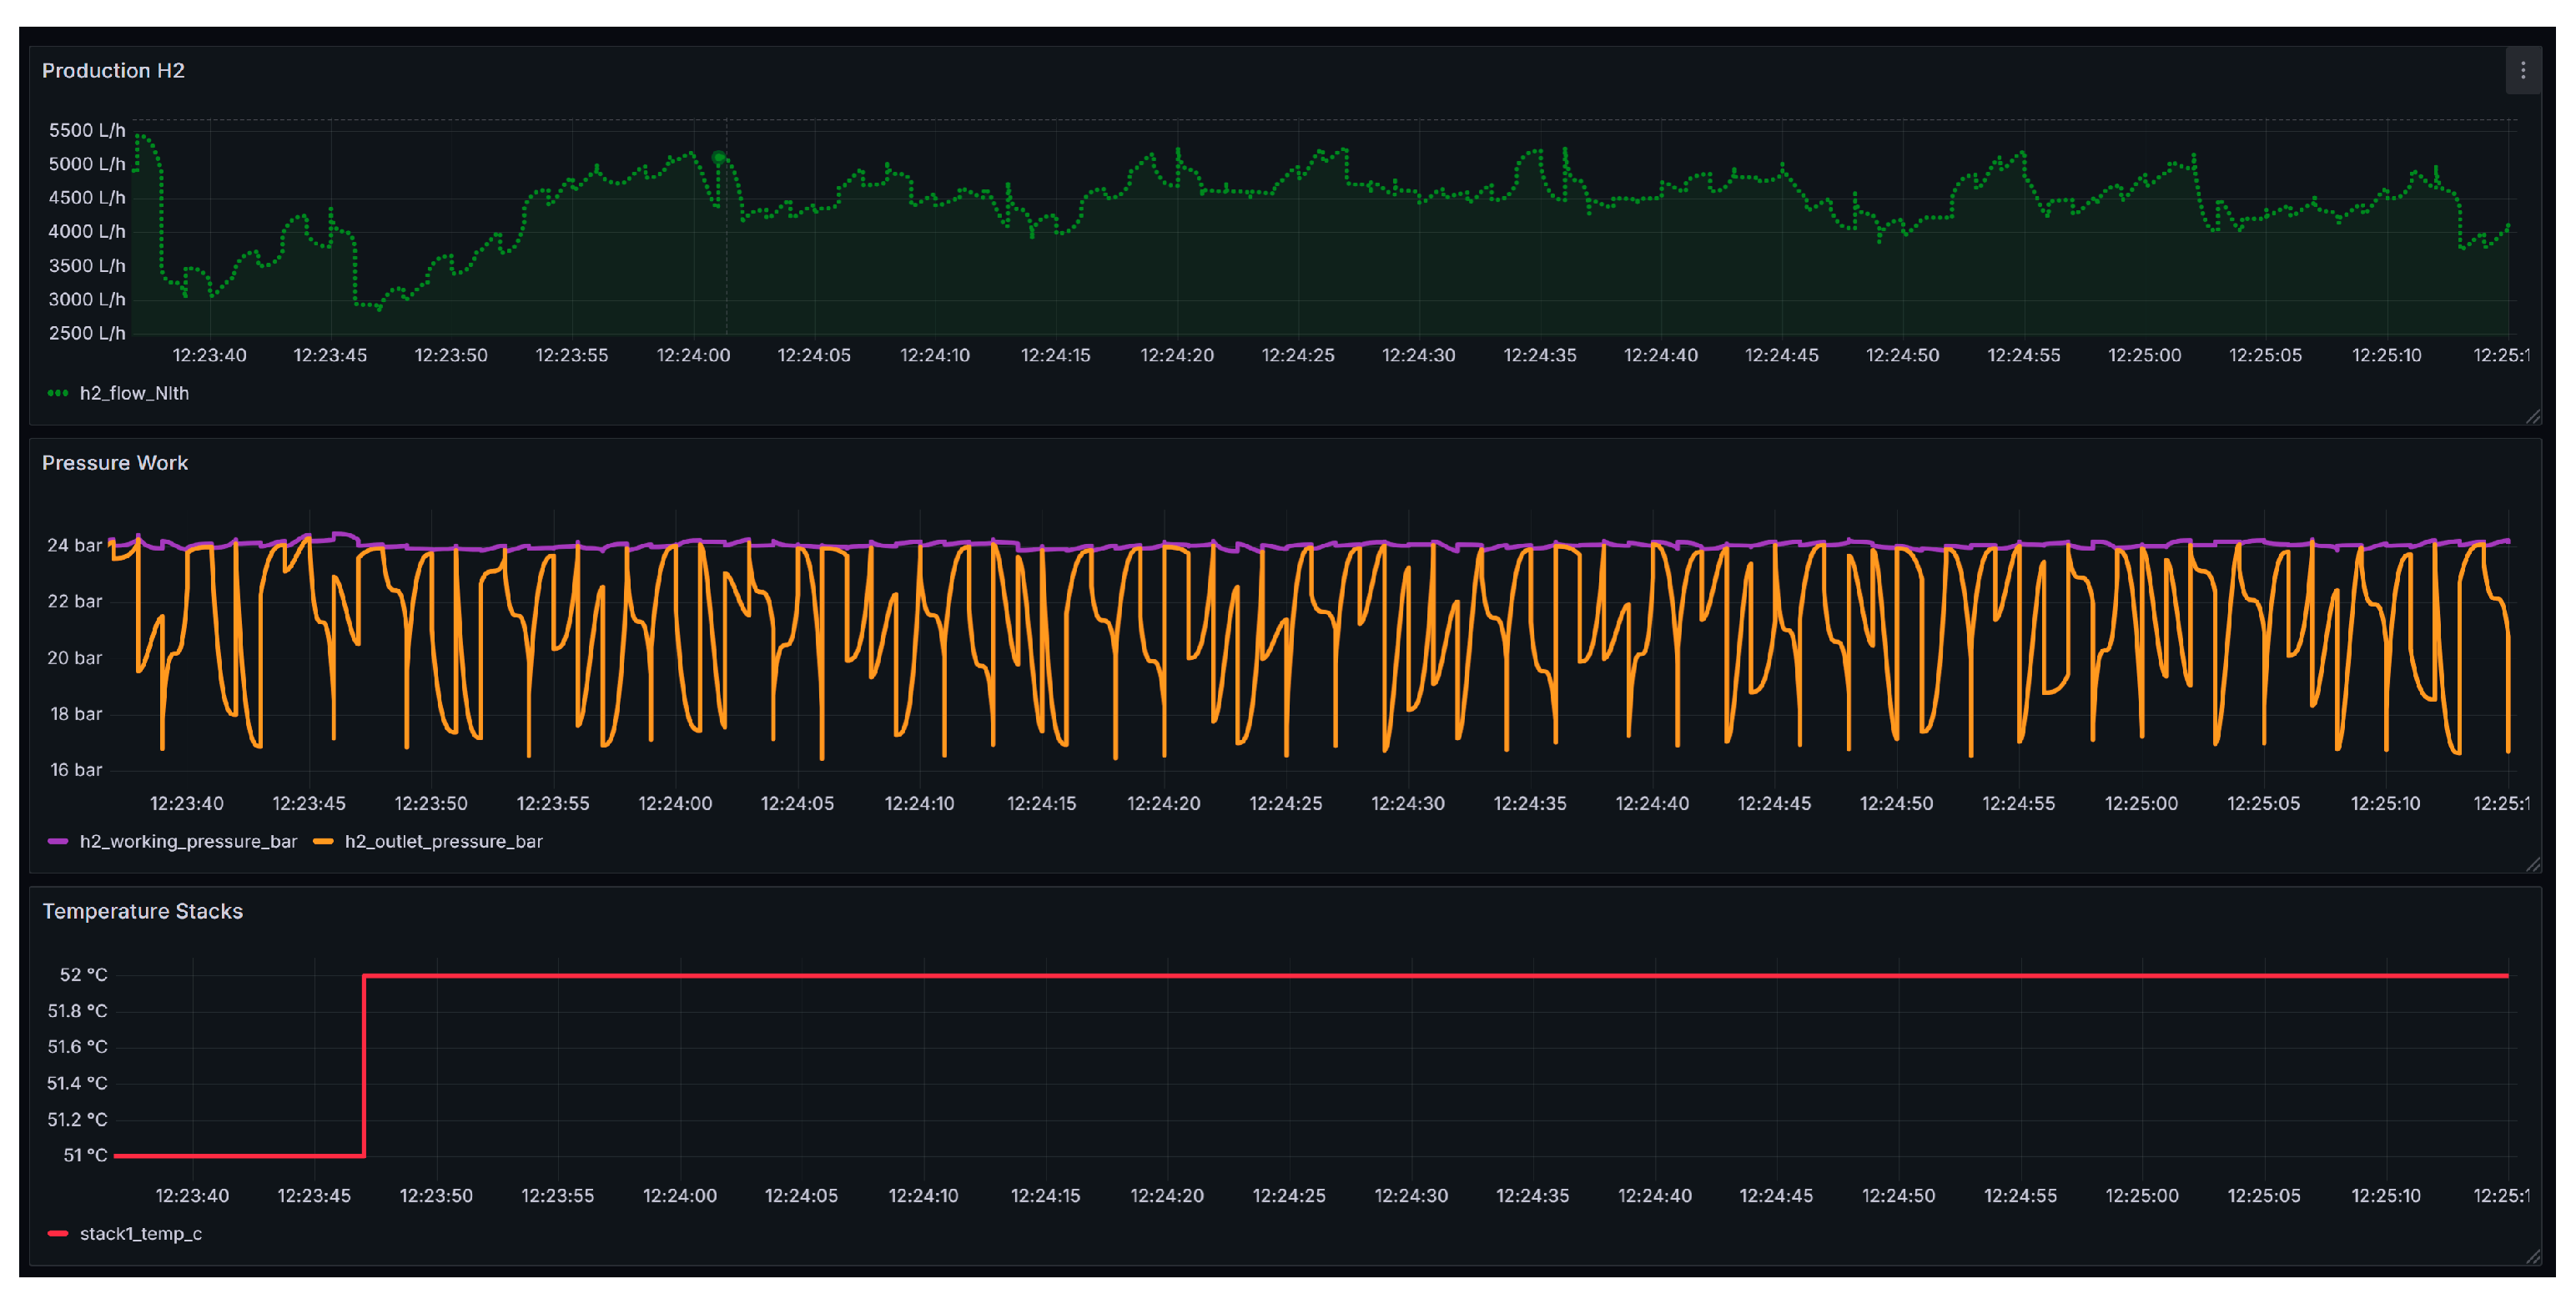
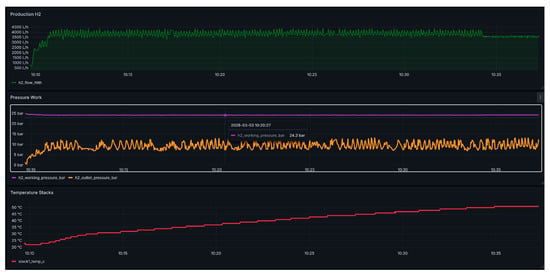
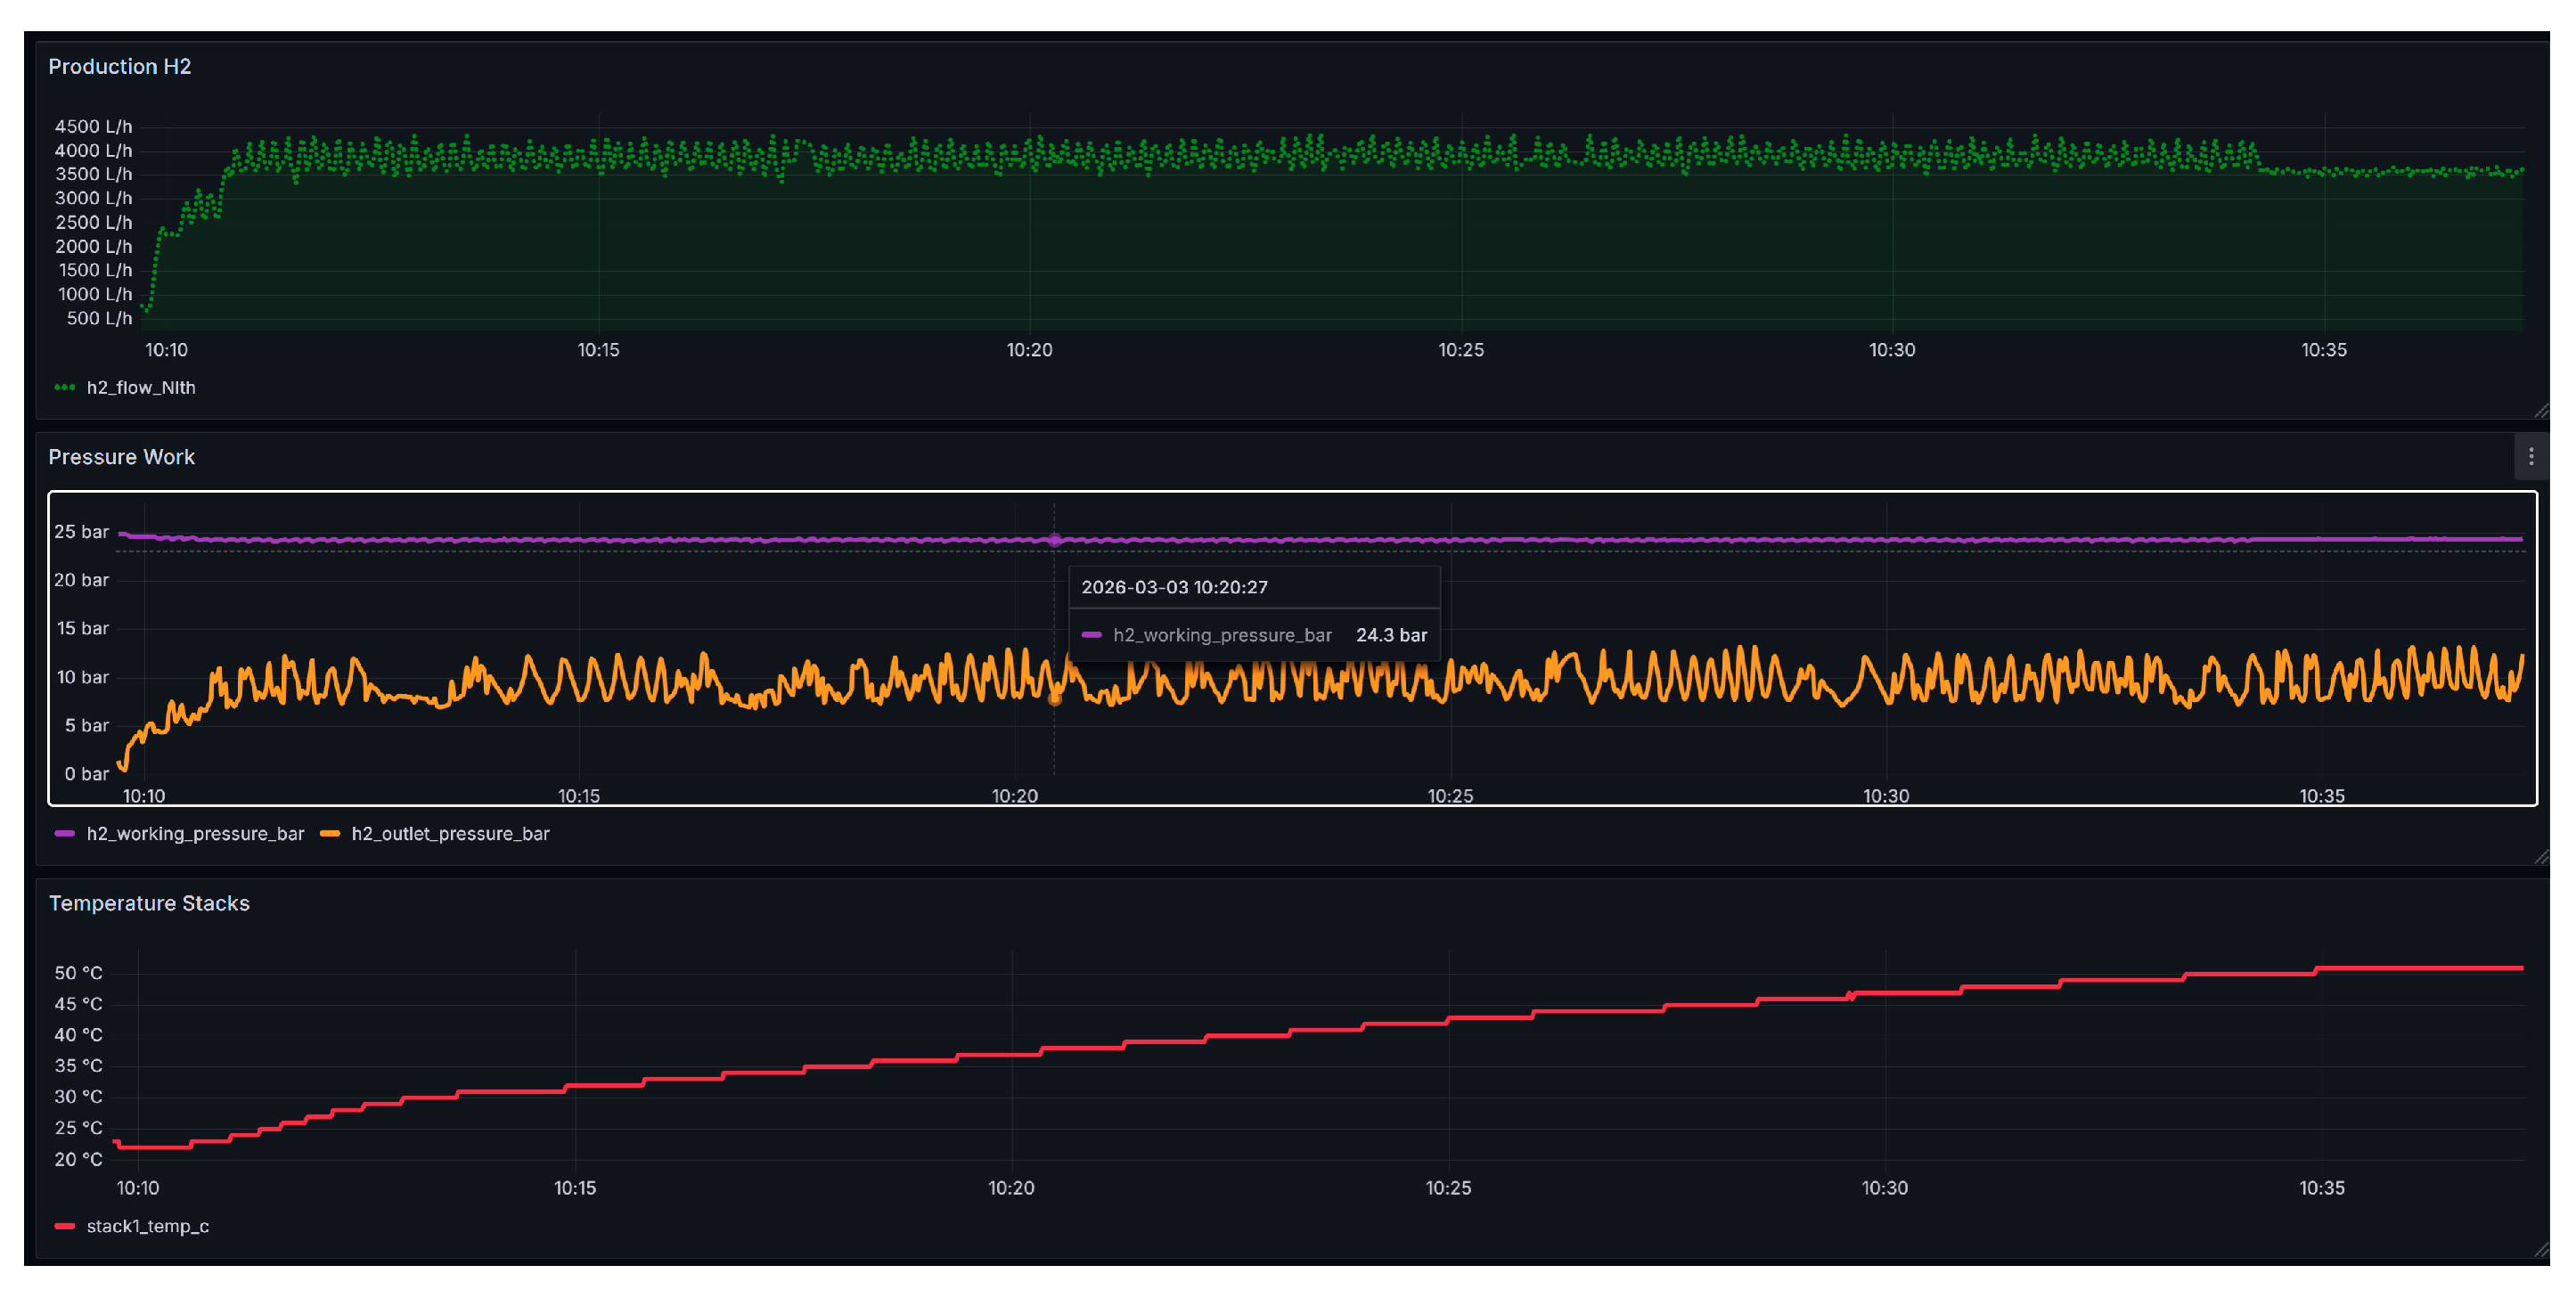
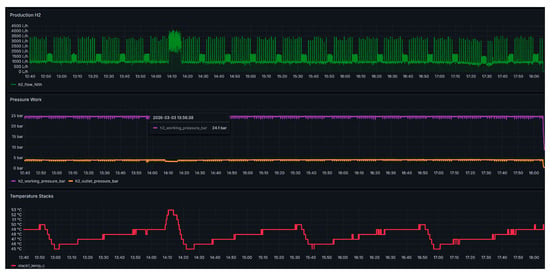
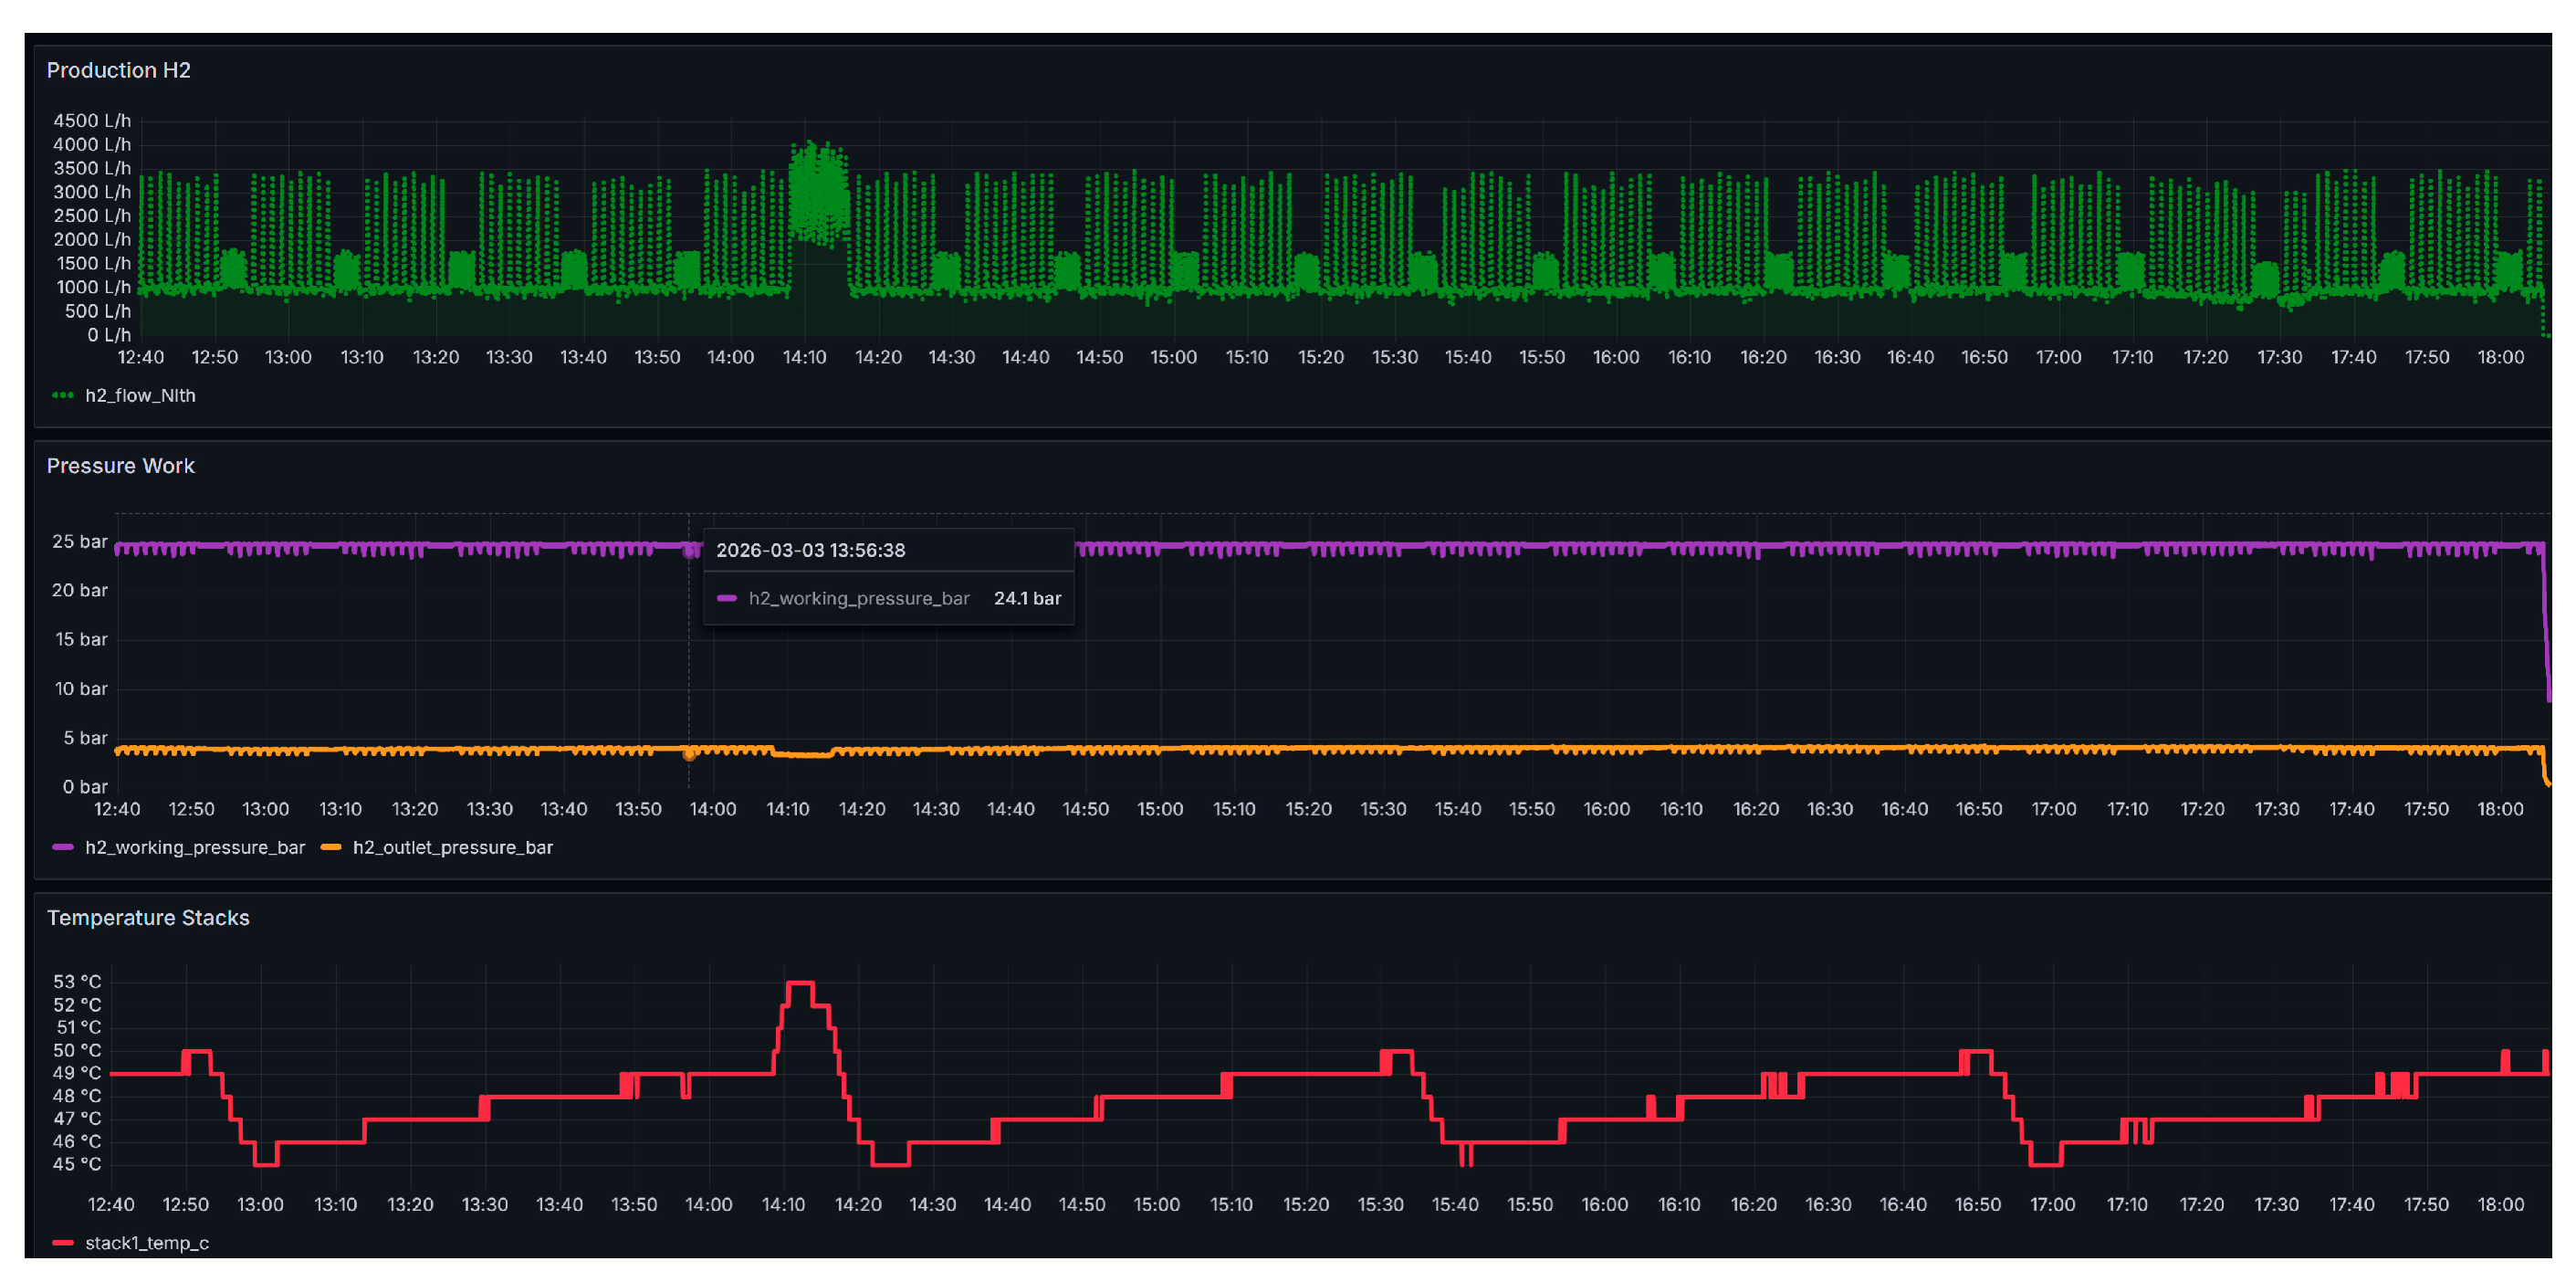
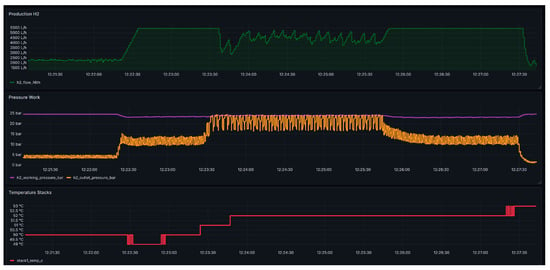
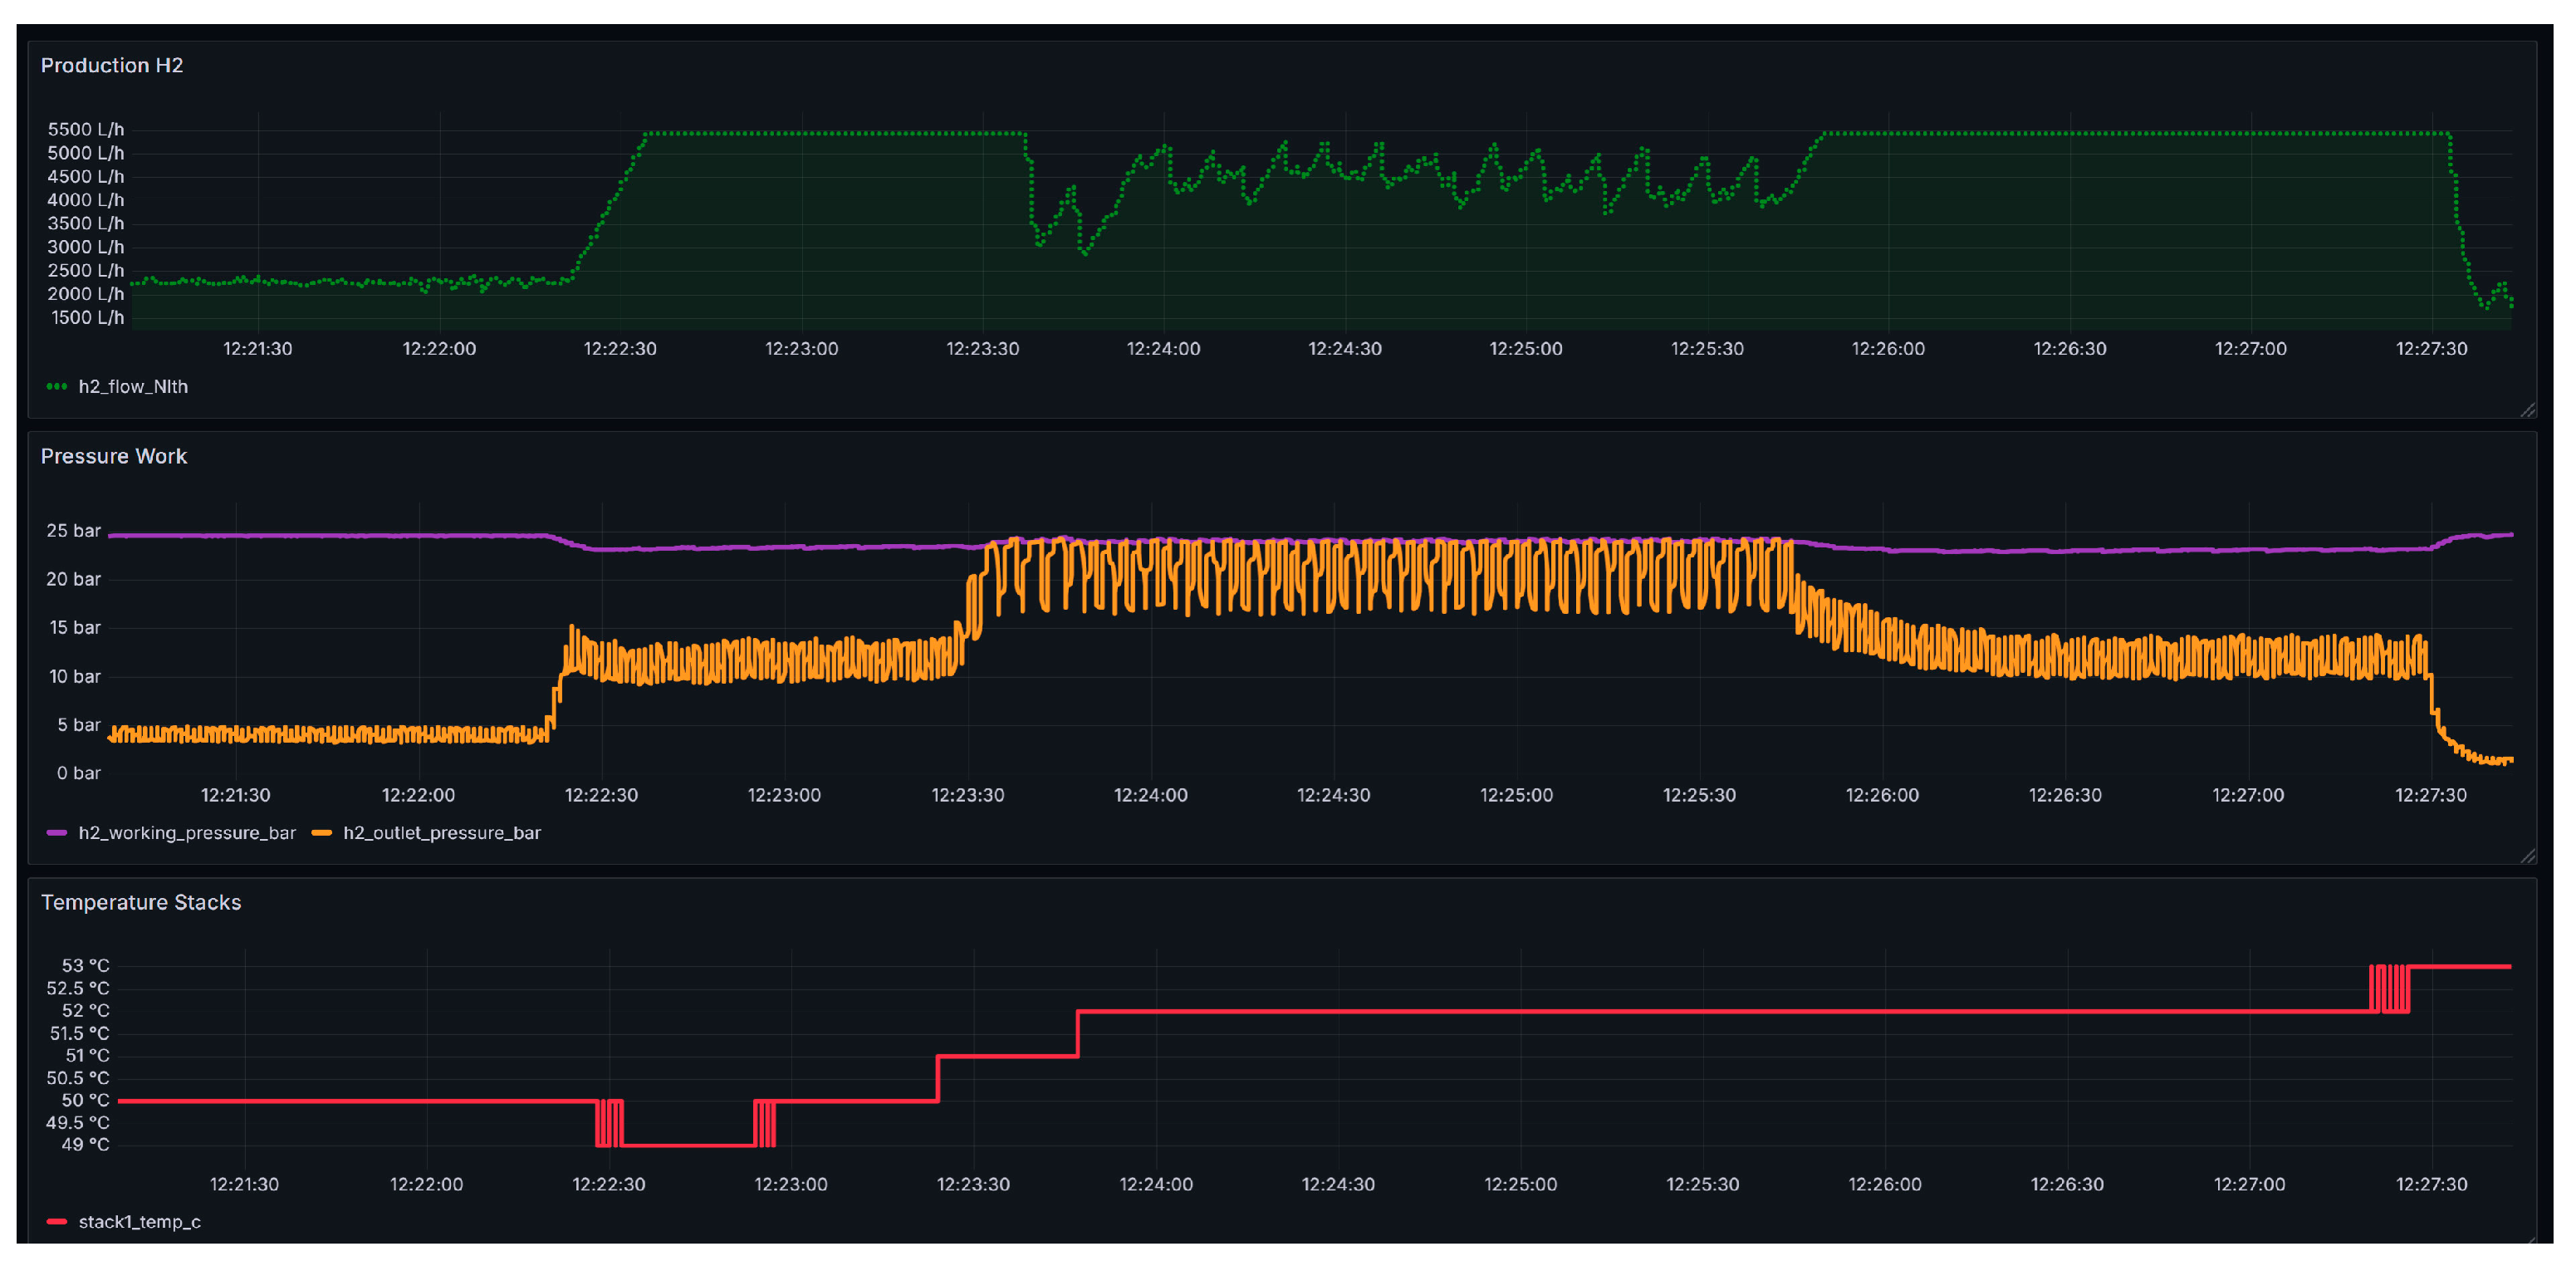
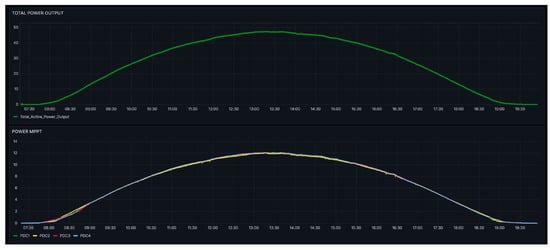
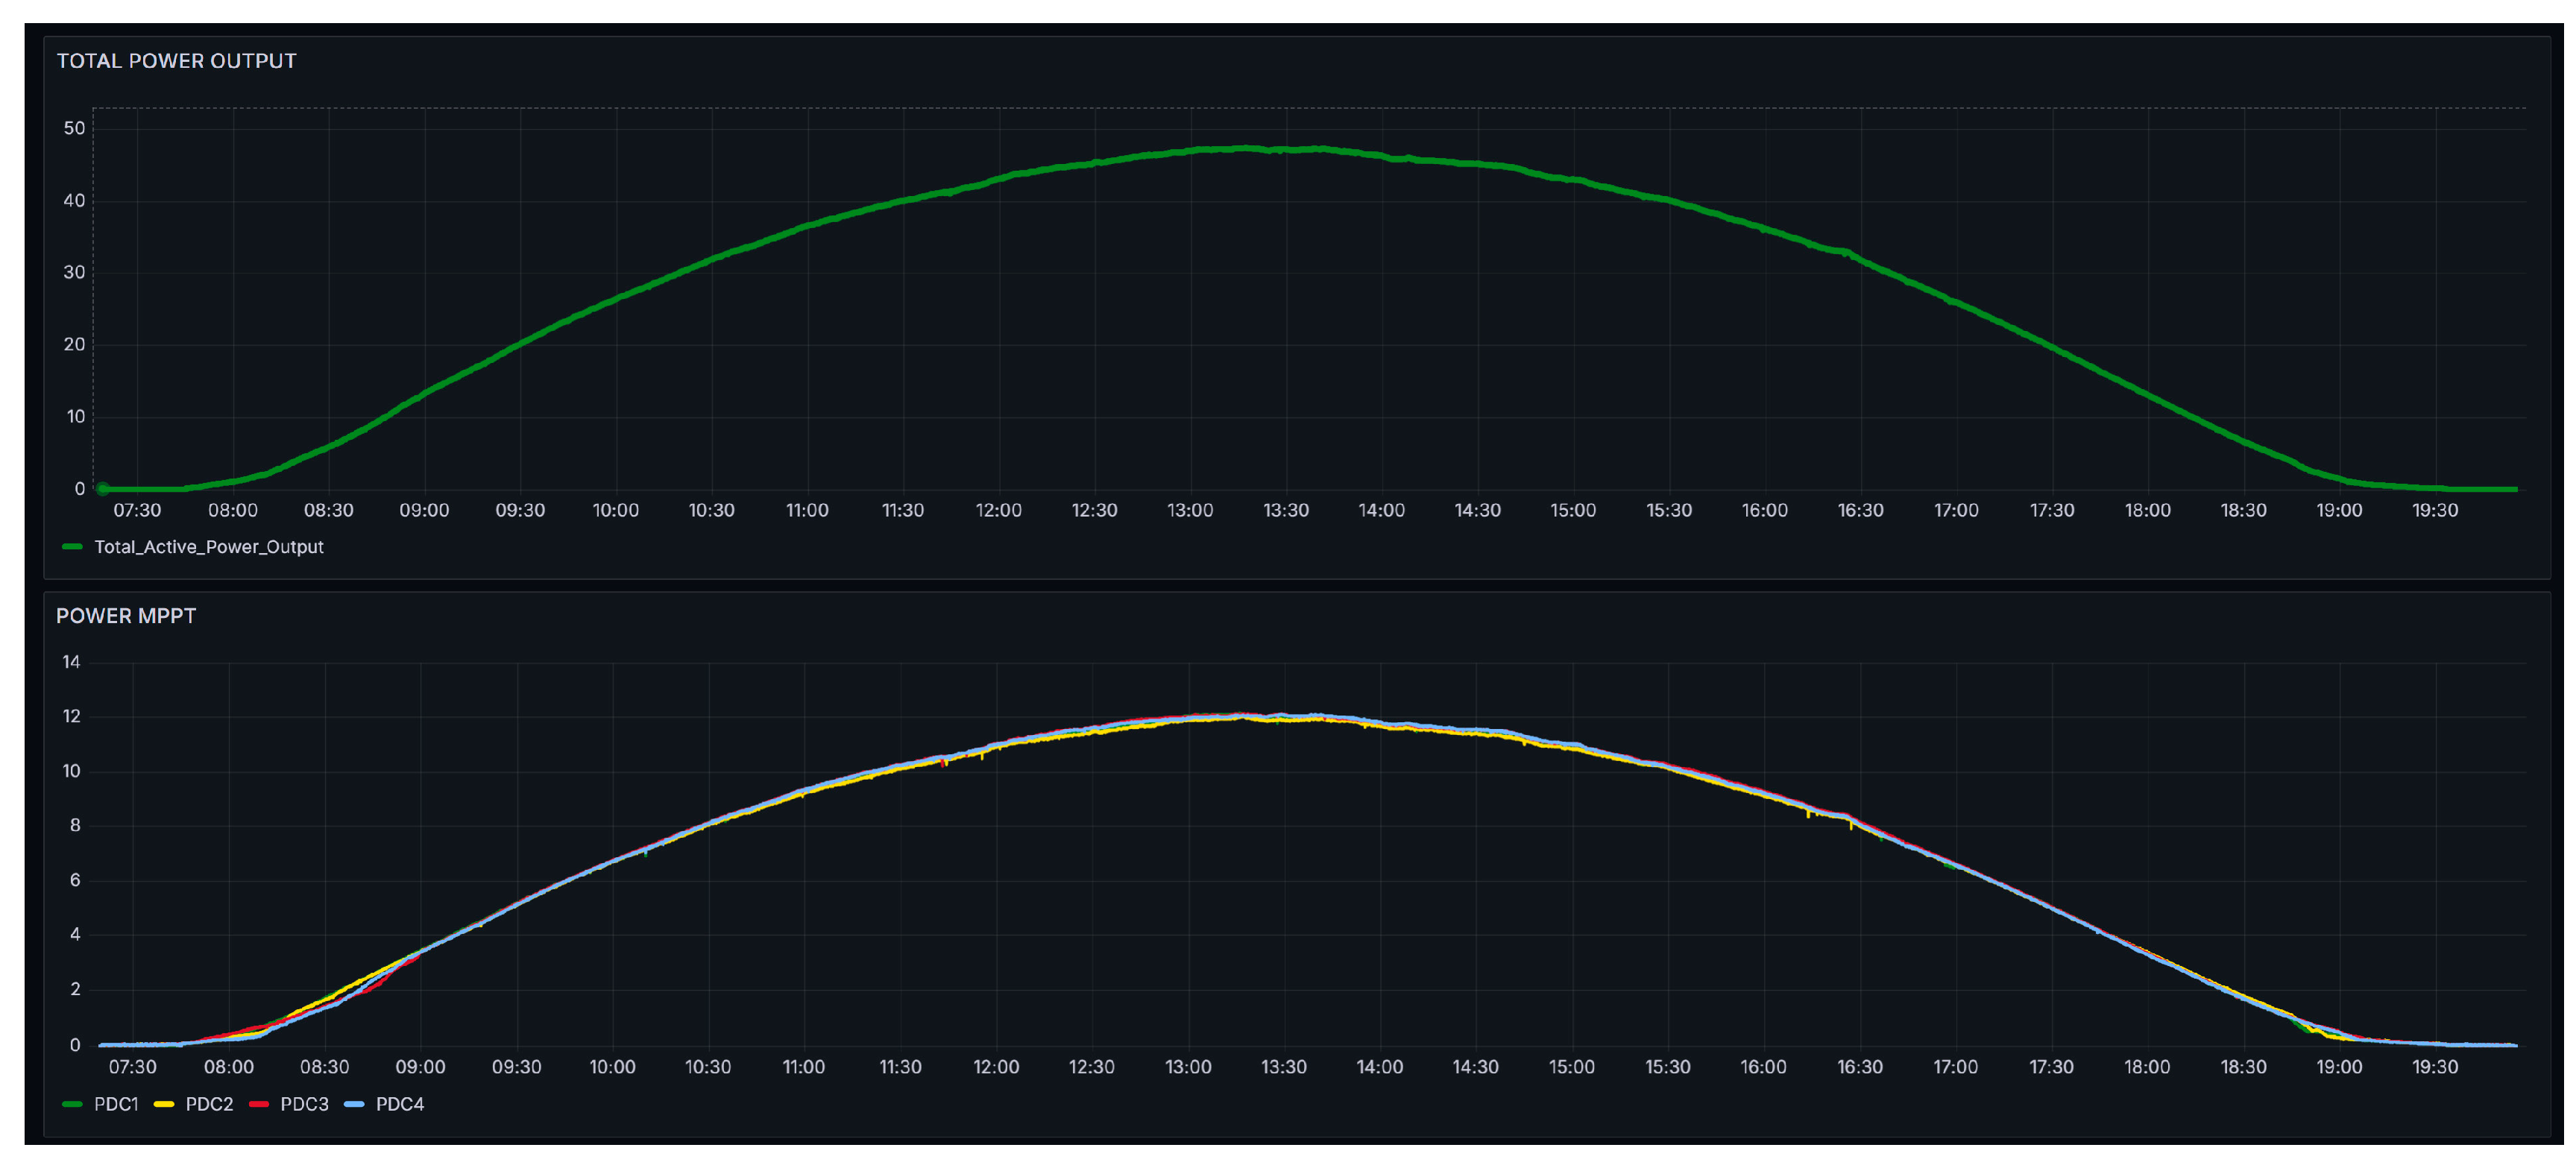





Disclaimer/Publisher’s Note: The statements, opinions and data contained in all publications are solely those of the individual author(s) and contributor(s) and not of MDPI and/or the editor(s). MDPI and/or the editor(s) disclaim responsibility for any injury to people or property resulting from any ideas, methods, instructions or products referred to in the content. |
© 2026 by the authors. Licensee MDPI, Basel, Switzerland. This article is an open access article distributed under the terms and conditions of the Creative Commons Attribution (CC BY) license.