


Abstract
This study presents a hybrid controller that integrates fuzzy logic control and the Incremental Conductance method. This controller optimizes maximum power point tracking in a 330 W photovoltaic system by designing a DC-DC converter. The study evaluates how the number and distribution of membership functions, specifically three-, five-, and seven-function configurations, affect system performance using the Integral Square Error (ISE) and Integral Absolute Error (IAE) indices. The empirical results demonstrate that the seven-function architecture yields optimal performance, minimizing ISE and IAE to 0.1155 and , respectively. Furthermore, this optimal configuration attains an energy efficiency of 99.7%, notably outperforming the baseline three-function configuration, which exhibited a worst-case efficiency of 98.9 %. To assess robustness against dynamic environmental variations, this study subjects the optimal configuration to fluctuating irradiance and temperature profiles. Additionally, an analysis of computational resource consumption reveals that the proposed hybrid controller incurs a lower computational load for rule evaluation than three controllers reported in the recent literature. These findings demonstrate the system’s structural efficiency and superior optimization capability, achieving maximized photovoltaic energy harvesting at a low computational cost.
1. Introduction
The photovoltaic (PV) solar cell constitutes the core component of a PV energy system and is typically modeled as a P–N junction device. For a comprehensive overview of PV technologies and efficiencies, the reader is referred to Green et al. [1].
The performance of a PV system depends on operating conditions such as solar irradiation, temperature, and load variations, which directly affect its electrical characteristics. In stand-alone systems, energy storage is typically achieved using battery banks to ensure supply continuity. Given the significant investment required for PV installations, maximizing both energy extraction and storage efficiency is essential for achieving technical and economic sustainability [2].
A PV panel delivers its maximum electrical power when operating at the maximum power point (MPP), which varies with atmospheric conditions. Consequently, maximum power point tracking (MPPT) techniques are essential for ensuring optimal energy extraction [3]. These methods typically regulate the duty cycle of a DC–DC converter to match the PV operating point to its optimum. However, direct duty-cycle control may introduce switching stress and power losses [4]. To address this, some studies incorporate PI-based current and/or voltage control loops to improve stability and reduce oscillations [5].
Several configurations combine MPPT with battery charge control strategies based on battery voltage and state of charge [6,7]. Nevertheless, many approaches primarily focus on tracking efficiency while overlooking the role of converter-based battery charge regulation. This limitation is particularly critical in off-grid systems, where the battery bank represents a substantial portion of the total investment [8], and inefficient charge management can lead to increased life cycle costs and premature degradation [2,9].
The extant literature categorizes battery charging profiles into several techniques, including constant current, constant voltage, and on–off control [7,10,11]. However, these methods often fail to fully charge lead acid batteries and do not adequately protect against premature aging [12]. According to manufacturers, two-stage charging strategies provide a more effective solution for restoring battery capacity and extending operational lifespan.
On the other hand, hybrid MPPT algorithms based on fuzzy logic control (FLC) have been proposed to improve tracking performance under dynamic operating conditions. For example, Nivedha and Vijayalaxmi [10] presented a fuzzy-logic-based hybrid MPPT that combines fuzzy fractional short-circuit control (FSCC) and fuzzy “perturb and observe” (PO) techniques, demonstrating improved dynamic response compared to conventional approaches. The efficacy of their method was validated using performance metrics (IAE, ISE, ITAE). Various climatic conditions were used to assess comparable hybrid fuzzy MPPT approaches using simulation-based comparative analyses [11]. Further recent studies have explored hybrid approaches combining Incremental Conductance (IC) and FLC to enhance robustness, tracking speed, and accuracy [13,14,15,16].
The contemporary literature has proposed various MPPT strategies aimed at improving tracking efficiency under dynamic operating conditions. For example, it has been shown that improved IC methods, combined with FLC, increase convergence speed and robustness [13,17,18]. Conventional load control strategies remain widely adopted in battery-backed PV systems due to their simplicity and experimental feasibility [19]. In 2024, artificial intelligence (AI) techniques—specifically long short-term memory (LSTM) networks—achieved superior tracking accuracy, albeit requiring significant computational overhead and hardware resources [20]. Alternatively, hardware-oriented designs, including nonlinear controllers based on Field-Programmable Gate Arrays (FPGA), have been explored to augment real-time operational robustness [21]. Table 1 provides a comparative summary of recent Maximum Power Point Tracking (MPPT) methodologies published between 2023 and 2026. The evaluation highlights key architectural and experimental features, including the specific MPPT technique, controller taxonomy, number of membership functions (NMF), deployment strategy, performance evaluation metrics, and the inclusion of statistical validation. In this taxonomy, NS and NA denote “Not specified” and “Not applicable”, respectively. For algorithmic clarity, Table 1 abbreviates “incremental conductance” as IC, “fuzzy logic control” as FLC, and “artificial intelligence” as AI.
Table 1.
Comparative analysis of recent MPPT methodologies (2023–2026) for photovoltaic systems integrated with energy storage.
As illustrated in Table 1, contemporary research primarily targets enhancements in tracking accuracy and transient response. However, the direct influence of controller topology and the NMF on computational complexity remains under-analyzed. Section 4.1 delineates a comprehensive comparative analysis of classical, intelligent, and hybrid MPPT strategies, focusing particularly on IC-FLC-based frameworks. The discussion isolates the specific limitations of state-of-the-art methodologies, thereby establishing the theoretical and practical justifications for the hybrid approach proposed in this work.
In this context, the primary contribution and novelty of this work lie in the systematic analysis and structural optimization of a hybrid IC-FLC MPPT controller. In particular, this study evaluated the impact of the quantity and spatial distribution of membership functions on both tracking performance and computational complexity. The proposed framework evaluated configurations utilizing three, five, and seven membership functions to identify an effective trade-off between dynamic performance and implementation overhead.
Additionally, the performance of the proposed controller was assessed using integral error criteria, namely the integral of squared error (ISE) and the integral of absolute error (IAE). An FLC strategy was implemented to regulate the duty cycle of a DC-DC converter, which operated as an efficient two-stage charger for lead acid batteries in an autonomous PV system. The control scheme used feedback from both PV power and battery power, aiming to maximize energy extraction while extending battery lifespan through precise charge regulation. The proposed controller follows a typical fuzzy cascade structure.
The remainder of this paper is organized as follows: Section 2 delineates the architecture of the proposed hybrid MPPT system and its corresponding evaluation methodology, which integrates the battery charging protocol, FLC design, performance metrics, and membership function tuning. Section 3 discusses the simulation-based validation of the hybrid controller and the PV system modeled within the MATLAB/Simulink environment. Section 4 benchmarks the computational resource consumption of the proposed controller against contemporary alternatives. Section 5 addresses the future work of this study, covering hardware implementation, IoT/embedded applications, AI integration, adaptive FLC tuning, and deep learning (DL) applications in MPPT. Lastly, Section 6 formulates concluding remarks on this study.
2. Materials and Methods
This section describes the materials and methods considered in a PV system developed with an IC- and FLC-based hybrid MPPT controller to optimize energy extraction from a solar panel while regulating lead acid battery charging via DC-DC converter. Initially, the battery charging strategies are detailed, followed by the presentation of the system’s general block diagram and the design parameters of the DC-DC converter, accounting for manufacturer specifications and PV panel responses to temperature and irradiance fluctuations. Subsequently, the methodology for evaluating the controller and the implementation of the hybrid MPPT are outlined. This section delineates how the error derived from the IC is calculated and how the FLC is structured. It also includes the input and output membership functions and their corresponding rule bases. Lastly, the performance evaluation criteria, validation methodology, and the membership function tuning procedures in the simulation setup are established to ensure efficient and stable MPPT operation.
2.1. Battery Charging Strategy
A control strategy is necessary to fully charge a battery used in PV systems within the permitted current and voltage ranges. The daily energy output of the PV panel to charge the battery is intrinsically limited. In this context, numerous lead acid battery manufacturers recommend a three-stage charging profile comprising initial charge (Region 1), absorption (Region 2), and float charge (Region 3). This multi-stage process is depicted in Figure 1.
Figure 1.
Operational regions of the battery charging process.
- Initial charge (Region 1): In the low-charge battery condition, the battery voltage can be between its minimum allowed value and its maximum overcharge value . In this case, the MPPT algorithm must be executed to extract the maximum power from the panel. At this stage, the charging current is limited to the maximum deep charging current . This current corresponds to a percentage of the battery capacity to prevent overheating and premature wear. During this stage, the battery’s state of charge (SoC) is generally recovered to approximately 80% to 90% of its nominal capacity.
- Absorption stage (Region 2): Transition to region 2 is triggered when the battery voltage () reaches its maximum threshold (). In this region, voltage control is applied, with the set point adjusted to . It should be noted that this region is not included in the design of the MPPT and the DC-DC converter for this study.
- Float charge (Region 3): Once falls below , the controller reduces its set point to the float voltage (). This reference voltage generates a minimal charging current, which is sufficient only to compensate for internal self-discharge. To mitigate deep discharge beyond the manufacturer-specified thresholds, the control system engages a disconnect relay whenever falls below the minimum permissible voltage and auxiliary charging energy is unavailable.
However, the manufacturer of the battery model “CALE-SOLAR 31T” used in this study recommended a two-stage charging strategy: (1) initial load (Region 1) and (2) float charge (Region 3). Therefore, although the three-region model is presented for a general understanding of the process, a fuzzy controller was designed to implement the control strategy, following the two-stage (Regions 1 and 3) approach adapted to the target battery system. Additionally, a battery protection stage was added to the float charger’s design, featuring two conditions based on battery voltage and to ensure that lead acid batteries were charged fully, quickly, and safely.
2.2. MPPT System and Converter Design
Figure 2 illustrates the schematic block diagram of the proposed solar energy conversion and storage architecture, which integrates a photovoltaic (PV) array, a DC-DC converter, and a battery storage subsystem.
Figure 2.
General block diagram of the MPPT system.
Operation begins at the PV array, which delivers a time-varying voltage and current . Dedicated voltage and current sensors measure these variables and transmit them directly to the MPPT control block. To condition the generated electrical power, the system employs a DC-DC converter, utilizing a MOSFET as its main switching element. The MPPT algorithm dynamically regulates the MOSFET duty cycle via a pulse-width modulation (PWM) signal. In parallel, the system monitors the battery voltage and estimates its state of charge (); these variables serve as supervisory conditions that safeguard the battery energy storage unit.
The MPPT block processes , , , and and generates the PWM signal. This modulation adjusts the converter’s duty cycle through the MOSFET transistor, thereby constraining the PV array to its optimal MPP.
2.3. Evaluation Methodology
The following four steps describe a procedural method for evaluating the design of a hybrid MPPT.
- 1.
- Electrical characteristics of the PV system. The current–voltage (I-V) and power–voltage (P-V) curves of the PV system reveal that external environmental factors such as irradiance and temperature significantly influence output power and conversion efficiency. The system’s power output exhibits direct proportionality to irradiation, whereas its relationship with operational temperature remains inversely proportional. Nevertheless, by merging a DC-DC converter and the control system topology, the MPP can be continuously tracked despite temperature and irradiation fluctuations, as shown in Figure 3 and Figure 4.Figure 3. Influence of temperature variations on the power–voltage (P-V) and current–voltage (I-V) characteristic curves of the PV array.Figure 4. Photovoltaic P-V and I-V characteristics under varying irradiance levels.The module used in this study was a 330 W polycrystalline “EPL33024” panel. Its main parameters are shown in Table 2.Table 2. Conditions and module parameters considering 1000 W/m2 at 25 °C.These features allow you to model the behavior of the system under different environmental conditions in MATLAB/Simulink.
- 2.
- DC-DC converter design. The output power of a PV system varies according to changes in atmospheric conditions. Therefore, a DC-DC converter is used to maintain the output current and voltage of the PV source at an MPP. The graphical representation of a DC-DC converter is shown in Figure 5. The converter changes the input DC voltage to an output voltage . A control signal known as a PWM signal is applied, which remains high (1) for a designated period “ON” and low (0) for a period “OFF”, thereby regulating the duty cycle. A DC-DC converter maintains the current and output voltage of the PV system, as the output power of the system varies with atmospheric conditions. For this study, a DC-DC converter was selected since the panel voltage was higher than the nominal battery voltage (12 V).Figure 5. Electrical schematic of the proposed DC-DC converter.The DC-DC converter operates in continuous conduction mode (CCM) under the assumptions of ideal switching conditions and negligible losses. It is important to note that the DC-DC converter was modeled assuming ideal switching conditions and negligible losses. In practical applications, non-idealities are inevitable; these include semiconductor conduction and switching losses, parasitic resistances of passive components (e.g., inductor winding resistance and equivalent series resistance of the capacitor), and magnetic losses. These effects typically result in reduced conversion efficiency, deviations in voltage regulation, increased output voltage ripple, and additional thermal stress on the components. In this study, the ideal converter model was intentionally adopted to isolate the behavior of the proposed MPPT control and power management strategy under optimal conditions. The inclusion of imperfections would primarily affect the system’s absolute efficiency values, while the dynamic behavior and relative performance trends are expected to remain unchanged.Under these assumptions, the transfer function, , given in Equation (1) represents the small-signal linearized model of the DC-DC converter. Note that L is expressed in microhenries and C in microfarads. Equation (1) relates the duty cycle directly to the output voltage, yielding the DC-DC converter’s voltage conversion ratio in Equation (2).The DC-DC converter is designed to act as an interface between the PV panel and the battery. This allows the MPPT algorithm to regulate the operating point of the PV system by controlling the duty cycle. Therefore, when designing the converter, it is essential to select parameters that ensure a rapid dynamic response and stable operation of the PV panel under varying environmental conditions.In this study, the design of the passive components (the inductor and capacitor) accounts for current ripple, voltage ripple, and nominal operating conditions specified in Table 3. Assuming a variation in the input voltage, the control framework determines the duty cycle range to guarantee stable operation across diverse irradiance levels. The system employs a 12 V, 100 Ah “CALE-SOLAR 31T” battery model and defines the charging behavior through the following localized regions:Table 3. Nominal electrical parameters and hardware design specifications for the DC-DC converter.Region 1. The DC-DC converter enforces an output voltage of approximately 14.8 V for initial battery charging.Region 2: The current control architecture omits this stage, consistent with manufacturer guidelines.Region 3. The system depresses the DC-DC converter output voltage to approximately 13.2 V.Note that represents the switching frequency of the MOSFET.Therefore, Equation (3) defines the current that the semiconductor device must switch and block, while Equation (4) yields the equivalent resistance R.Note that when the PV panel is supplied with a voltage of = 37.87 V , the duty cycle must satisfy that 0.3256 0.4885.On the other hand, given that = 2.23 A and considering Equation (5), L = 894.86 H when D = 0.3256 and L = 679 H when D = 0.4885.Substituting the calculated electrical design parameters (L = 894.86 H, C = 557.5 F, and ) into Equation (1) yields Equation (7), which describes the dynamic mathematical model of the DC-DC converter. From this formulation, circuit analysis yields a theoretical damping factor of = 0.95 and a natural frequency of = 1414.21 rad/s.Subsequently, to analyze the dynamic behavior of the system under the influence of the IC-Fuzzy MPPT algorithm, the framework utilizes the “Linear Analysis Tool” in MATLAB/Simulink. Note that D of the converter must be configured as the input and as the output for the linearization process. The resulting frequency response was exported directly to the MATLAB workspace and subsequently fitted using the “Tfest” system identification tool. This yielded the following mathematical model in Equation (8), where incorporates the dynamics of the DC-DC converter alongside the effects of the battery and PV panel.From Equation (8), the system model yields a damping ratio of = 0.1136 and a natural frequency of = 1240.96 rad/s. These parameters are critical for evaluating the system’s robustness and stability. Furthermore, in Equation (9), , is the sensitivity function as the open-loop transfer function comprising the DC-DC converter and the IC-FLC MPPT controller. , determines the open-loop frequency response, which a Nyquist plot maps to assess the stability margins of the closed-loop system.This analysis uses the following quantitative metrics in the frequency domain: maximum sensitivity (), minimum distance from the critical point on the Nyquist plane (−1, 0) and phase margin.
- 3.
- General diagram of the MPPT system. PV systems exhibit nonlinear behavior due to continuous variations in irradiance and temperature. These changes alter the MPP, which corresponds to the operating condition in which the panel delivers its maximum power. To ensure the system operates near its optimal point, the control framework uses MPPT algorithms to dynamically adjust the converter and maintain the panel at the MPP. The MPPT block shown in Figure 6 implements the hybrid strategy for FLC receiving , , , and as inputs. The controller generates a preliminary D based on fuzzy logic rules, improving the tracking dynamics and reducing steady-state oscillations around the MPP.Figure 6. Structural configuration of the proposed system control and conditioning logic.In addition, to safeguard the operational integrity of the CALE-SOLAR 31T battery (12 V, 100 Ah), two cascaded logic multipliers condition D for the fuzzy controller, as illustrated in Figure 6. Although () acts as a primary input to the control algorithm, it is not regarded as a safety condition. The constraints focus exclusively on the output node to protect the battery and any load system that depends on it. The first constraint stipulates that the output voltage must satisfy the condition V, a threshold defined by the manufacturer for the float charging region that prevents prolonged chemical stress. The second constraint ensures that the is less than 100%, which inhibits energy transfer once full nominal capacity is reached. If either condition is false (logical value 0), the Boolean multiplication operation cancels the duty cycle (). Finally, the PWM generator produces a switching signal that is applied to the DC-DC converter’s MOSFET. The MOSFET stops immediately if the preconditions are not met, ensuring safe and efficient load management.
- 4.
- Figure 7 illustrates the structural execution of the Incremental Conductance (IC) method merged with a fuzzy logic control framework.Figure 7. Detailed structural block diagram of the co-designed hybrid Incremental Conductance (IC) and fuzzy logic MPPT control loop.In this approach, the P-V characteristic curve of the PV panel identifies the MPPT. This algorithm dynamically monitors the PV panel current and voltage to calculate the generated power via Equation (10).where represents the instantaneous power of the PV panel. Subsequently, the system logs the calculated power and voltage according to Equations (11) and (12).The calculations of the increments are determined using Equations (13) and (14).where , and represent the power and voltage from the PV panel at the previous discrete-time step. The control loop subsequently calculates the system tracking error and its corresponding variation, which serve as the crisp inputs for the fuzzy inference system as expressed in Equation (15).Therefore, the control law assumes thatThe performance of the proposed algorithm selects the derivative power with respect to voltage, defined as , as the input error signal for the fuzzy controller for the following mathematical and operational reasons:
- (a)
- Maximum power condition: Mathematically, the MPP occurs when the slope of the P-V curve is zero (). Therefore, any value other than zero represents an “error” or deviation from the optimum operating point.
- (b)
- Identification of the region of operation: The sign of the derivative indicates whether the side of the curve lies to the left or right of the curve’s peak, providing a control signal for the controller:
- If : The system operates to the left of the MPP (constant current region). The controller must increase the voltage.
- If : The system operates to the right of the MPP (constant voltage region). The controller must decrease the voltage.
- (c)
- Relationship with IC: This input links fuzzy logic with the IC method, where the condition is equivalent to . By utilizing the derivative as an input, the fuzzy system detects the direction of the tracking error while using the magnitude of the slope to dynamically modulate D. Consequently, steep gradients trigger larger step changes to accelerate transient tracking, while slopes close to zero activate fine steps to reduce steady-state oscillations around the MPP.
Fuzzy rule-based systems translate qualitative, vague, and imprecise human experiences and judgments into control rules. Membership functions are empirically determined based on given guidelines through trial and error. The performance of a conventional controller is typically specified by the steady-state behavior of a closed-loop system (steady-state error) and the transient response (transient error) of a feedback control system. Similarly, the rules of a fuzzy controller can also be specified by the desired steady-state and transient responses, expressed in fuzzy terms, such as fast rise time, minimum overshoot, steady-state error, and transient error.
The objective of these systems is to generate fuzzy rules or membership functions without relying on an experienced human operator with in-depth knowledge of controlling the plant in question. Although the original purpose of using fuzzy logic in control systems was to incorporate human contributions, an experienced operator may not always be available. In these cases, the knowledge of the operator must be recreated through a learning process in which the input/output parameters of the plant are measured and recorded as input/output time vectors. One type of learning occurs in the presence of a performance evaluator (J) that indicates the necessary structural or parameter modifications compared to a predetermined standard.
2.4. FLC Implementation
A Mamdani-type FLC is used for the implementation of the MPPT algorithm due to its intuitive structure and wide application in nonlinear systems such as PV systems. The Mamdani fuzzy controller comprises four primary stages: (1) definition of the universe of discourse, (2) fuzzification, (3) fuzzy inference, and (4) defuzzification [22].
Definition of the discourse universe. The input domain is defined in the interval (−10, 10) and represents the range of a power membership triangular function . The output domain is defined in the interval (0, 0.8) and represents the range of a duty cycle .
Fuzzification. At this stage of the study, triangular membership functions have been adopted; these functions are characterized by their ease of application, requiring only three parameters for their design: two minimum values that form the base of the triangle and a maximum value for the apex of the triangle. This contrasts with other shapes, such as the Gaussian or bell curve, for which a greater number of parameters are required to achieve such a level of characterization. Research conducted by Almaged et al. [23] and Passino and Driankov [22,24] supports the utilization of triangular membership functions, as they strike a balance between simplicity and accuracy. Furthermore, fuzzification is defined as the process of converting a precise quantity into a fuzzy one that can be represented by a membership function. The membership functions for the fuzzy controller inputs can be generated from three, five, and seven membership functions, as demonstrated in Table 4. The base edge parameters are given by an with . The membership function has maximum membership degrees at ± b0, ±b1, ±b2, and ±b3.
Table 4.
Rank in discourse for membership functions.
The membership degree is a number in the interval [0, 1] that indicates the importance of a rule within a set of rules.
Fuzzy inference. In the inference stage, the general form of the linguistic rules is as follows. If premise, then consequent. In this study, it is denoted as follows: If E is , then D is
Here, and represent the fuzzy sets corresponding to the input and output membership functions, respectively.
Note that the AND operator is not used since only a single input is required for the membership functions. However, the AND operator is necessary when using two or more inputs to proceed to the next stage: defuzzification. According to Passino et al. [22], this is directly related to the computational load of the software used for the simulations.
Table 5 shows the rules defined for this study. The premises are related to the input variables of the fuzzy controller and are located on the left side of the rules. The consequences are associated with the fuzzy output and are on the right side of the rules. The rule base includes operations that enable the fuzzy system to generate a single output by connecting the sets of fuzzy inputs and outputs. The rule base is applied to the membership function obtained according to Mamdani inference.
Table 5.
Fuzzy associative memory (FAM) matrix and linguistic rules for the MPPT controller.
For each control rule, a corresponding fuzzy output set is generated to determine the variation in the DC-DC converter duty cycle.
Figure 8 defines the input membership functions, which partition the input universe of discourse into seven distinct linguistic terms. Concurrently, Figure 9 illustrates the output membership function profiles that dictate the control action.
Figure 8.
Membership function profiles over the input discourse function for the fuzzy logic controller.
Figure 9.
Graphical representation of an output to the fuzzy controller.
Defuzzification. This study uses the centroid method due to its widespread use and simplicity, allowing for the calculation of a precise numerical value to adjust the duty cycle. This centroid method is expressed by Equation (17):
Assuming that is the actual output value from the fuzzy system, represents the center of the fuzzy output set area, and is the membership function associated with each rule.
The centroid method was strategically chosen to trigger a smooth and continuous response, crucial for MPPT applications where oscillations around the MPP must be minimized. The Mamdani fuzzy controller dynamically adjusts the converter’s duty cycle, ensuring efficient tracking of the MPP despite variations in irradiance and temperature.
2.5. Simulation Setup
The protocol for conducting the simulation comprised the following steps:
- All simulations were performed in MATLAB/Simulink (R2025b).
- A fixed-step “Runge–Kutta” solver (ODE4) was used to accurately capture the nonlinear dynamics of the PV system and the DC-DC converter.
- The maximum time step was set to s.
- The total simulation duration was 2 s to comprehensively capture and analyze the transient response and steady-state conditions of the system.
- The fuzzy logic controller was implemented in discrete time with a sampling period of s. This sampling frequency was selected to ensure adequate resolution of the converter’s switching dynamics while maintaining numerical stability.
- The PV system consisted of one module connected in series and one in parallel, with a nominal power of 330 W under standard test conditions (1000 W/m2, 25 °C). Key electrical parameters, such as open circuit voltage and short circuit current, were obtained from the manufacturer’s datasheet, as shown in Table 2.
- At the onset of the simulation, the capacitor voltage and inductor current were set to 0 V and 0 A, respectively. The initial duty cycle of the DC-DC converter was set to a frequency of 5 kHz to ensure a smooth system startup.
- The membership functions of the FLC were defined using triangular functions. The membership sets for the input (error) and output (PWM) variables were determined based on the expected operating range of the system.
The tuning process relied on heuristic optimization to minimize steady-state oscillations around the MPP while maintaining a fast transient response and system stability, following the guidelines outlined in the relevant literature.
In this study, validation at the simulation level allows for a systematic evaluation of the MPPT performance and the battery charging strategy while ensuring a safe assessment of the protection logic and operational limits. Additionally, it is important to note that the models used in the simulation environment included real parameters of physically available components. In particular, the PV panel modeled in Simulink corresponds to the same commercial panel model available in the laboratory, and its electrical parameters are from the manufacturer’s specifications according to Table 2. Similarly, the battery model employs the same nominal parameters as the physical storage system, which ensures that the resulting empirical data reflect realistic operational characteristics. On the other hand, simulation-based validation increases confidence and assurance in the operation of the controller and the PV system before experimental implementation, and it remains a widely accepted step in the controller design process. However, fully carrying out the experiment—including building the DC–DC converter hardware, setting up the measurement instruments, and running the algorithm on an embedded platform—is planned as a subsequent phase of this work. The primary constraint in the present work for experimental validation is associated with high hardware implementation costs and the specialized infrastructure required for high-power electronics testing. Therefore, this study establishes a foundation focusing on rigorous validation at the simulation level.
2.6. Performance Evaluation Based on Integral of Error
Evaluation criteria (error metrics): One metric to quantify system performance is the ISE criterion, expressed in Equation (18). This performance index severely penalizes pronounced dynamic deviations while remaining insensitive to minor inaccuracies.
The system is optimal if the value is the minimum of this integral. The IAE criterion evaluates cumulative performance as defined in Equation (19).
2.7. Membership Function Tuning Based on Performance Indices
As illustrated in Figure 10, the membership functions are adjusted by slightly expanding or shifting them. This procedure highlights the rules that contributed significantly to the fuzzy result and those that contributed less.
Figure 10.
Parametric tuning of the input and output membership function bandwidths.
Although adjusting the contribution weights of the rules can move the central control region of a fuzzy controller in response to changes in the input, changing the weights alone is insufficient for rapid multidimensional adaptation.
Therefore, the proposed changes to the simulations involve assigning different values to the parameters of the membership functions to demonstrate their effects on the evaluation criteria and . A low value for the evaluation criteria indicates a reduction in error over time. Table 6 illustrates this effect and presents the three tuning configurations across separate evaluations using three, five, and seven power error triangular membership functions for the power tracking error.
Table 6.
Parametric tuning configurations and linguistic fuzzy partitions for the experimental evaluations.
For visual clarity, Figure 11, Figure 12 and Figure 13 delineate only the positive membership functions starting with (CZ). However, the symmetric negative fuzzy sets, specifically Small Negative (SN), Medium Negative (MN), and High Negative (HN), remain integral to the control law, as illustrated in Figure 8 and detailed in Table 6.
Figure 11.
Structural profiles of the positive fuzzy input sets evaluated under the first adjustment configuration.
Figure 12.
Three membership functions with positive input values.
Figure 13.
Structural profiles of the four positive fuzzy input sets evaluated under the second adjustment configuration.
Simulation test 1 was conducted with adjustments 1, 2, and 3 according to Table 6 and its graphical representation in Figure 11. The positive universe of the domain for the tracking error defines the Center Zero (CZ) and Small Positive (SP) membership functions.
3. Results
This section reports the MATLAB/Simulink simulation results for the 330 W polycrystalline PV system based on the “EPL33024” module and employing the MPPT with the proposed hybrid controller, as depicted in Figure 2. The simulations are carried out using the PV system parameters listed in Table 2, along with the R, L, C, and D parameters calculated for the DC-DC converter.
To provide a comprehensive evaluation, the performance analysis was structured into four sequential phases.
- The optimal fit for the membership functions was determined across three different tests. It also shows that the performance indices and of the fuzzy controller were minimized, indicating the time response of the MPPT power for each selected adjustment.
- The operational efficiency of the MPPT system was methodically calculated according to the three settings selected in the previous point.
- The systemic robustness of the energy generated by the MPPT, together with the two-stage charging strategy for the lead acid battery, was validated by selecting the configuration that minimizes and , thereby attaining the highest efficiency under varying environmental conditions. Changes in environmental conditions include increases or decreases in solar irradiation (1000, 500, and 100 W/m2) and temperature changes (25 °C and 45 °C).
3.1. Obtaining the and Indices
Table 7 shows the results obtained for the ISE and IAE performance indices according to Equations (18) and (19). and were used as decision criteria to select the adjustment that minimized them in each of the three configurations. Note that the m-MF configuration uses m membership functions, with m = 3, 5, and 7 membership functions.
Table 7.
Quantitative performance evaluation: Comparative analysis of ISE and IAE criteria for the MPPT algorithms.
3.2. Adjustment Selection for Membership Functions
According to the quantitative evaluation presented in Table 7, adjustment 2 minimizes the performance indices and for the 3-MF configuration, yielding = 0.1373 and = . Similarly, adjustment 3 for the 5-MF configuration yields = 0.1255 and = , and adjustment 3, again, for the 7-MF configuration, yields = 0.1155 and = . These adjustments provide the lowest values for and , indicating that they perform best of all the evaluated cases.
Figure 14 illustrates the dynamic transient and steady state response of the MPPT output power under standard test conditions (1000 W/m2 and 25 °C) utilizing the optimal 3-MF configuration (Adjustment 2). The simulation waveform demonstrates that the controller successfully follows the 330 W nominal power reference and reaches a steady state at approximately 0.008 s. During the transient phase, significant disturbances occur between 0.0045 s and 0.006 s. The system experiences pronounced ripples, and a minimum power value of approximately 60 W is recorded before it stabilizes.
Figure 14.
MPPT controller tracking response for the 3-MF configuration under Adjustment 2.
Figure 15 shows the dynamic behavior of the MPPT output power (5-MF, adjustment 3) under an irradiance of 1000 W/m2 and a temperature of 25 °C. The system reaches a reference power of approximately 330 W after 0.008 s. During the transient stage, an initial maximum overshoot occurs at 0.003 s, followed by moderate ripple oscillations between 0.004 s and 0.006 s. The minimum power value does not fall below 195 W during this time. Finally, the system enters a steady state with moderate ripple.
Figure 15.
MPPT controller tracking response for the 5-MF configuration under Adjustment 3.
Figure 16 displays the MPPT output power trajectory (7-MF, Adjustment 3) under uniform irradiance (1000 W/m2) and constant temperature (25 °C). The system exhibits an initial overshoot, reaching the 330 W reference at 0.003 s. This is followed by an adjustment stage with a controlled power drop to 210 W at 0.0048 s. Minimal transient ripple, less than that observed in the 3-MF and 5-MF configurations, is seen from 0.004 s to 0.0075 s. The system then stabilizes definitively at the 330 W reference value from 0.008 s onward.
Figure 16.
MPPT controller tracking response for the 7-MF configuration under Adjustment 3.
It is important to note that the amplitude of the oscillations shown in Figure 14, Figure 15 and Figure 16 exhibits a decrease as the number of membership functions is increased and subsequently optimized. Specifically, Figure 16 indicates that the 7-MF configuration displays markedly reduced fluctuations and achieves a smoother convergence compared with the other configurations.
3.3. MPPT Efficiency Calculation
Table 8 presents the MPPT efficiency, which was determined using Equation (20) with 1000 W/m2 and 25 °C.
Table 8.
Conversion efficiency indices across the optimal controller configurations.
At this point, it is appropriate to compare the best-performing solution, the 7-MF controller, with a classical IC-based controller. Table 9 indicates that the proposed hybrid FLC-based controller clearly outperforms the classical IC-based controller, which was likewise implemented and tested in MATLAB/Simulink. Note that the proposed controller results in smaller error indices, with a reduction in ISE (from 0.2184 to 0.1155) and IAE (from to ), while also improving the MPPT efficiency (from 96.4% to 99.7%). These findings validate that the proposed controller enhances both tracking accuracy and energy conversion efficiency relative to a conventional IC-based controller.
Table 9.
Comparison of the performance of the classical IC-based controller and the proposed hybrid fuzzy-logic controller under identical simulation conditions.
3.4. Response to Variations in Irradiance and Temperature
According to Table 7 and Table 8, the adjustment that minimizes = 0.1155, = , and presents the highest efficiency of 99.7% is the 7-MF adjustment 3. The response to this adjustment is evaluated with stepped changes in irradiance: (1) upward with three stepped increases of 100, 500, and 1000 W/m2 and (2) downward with three stepped decreases of 1000, 500, and 100 W/m2. These changes simulate environmental conditions such as the sun rising and reaching maximum irradiance in the morning, then decreasing to minimal irradiance in the afternoon as the sun sets, or the passage of clouds or clearing skies.
Figure 17 shows the output power of the MPPT as irradiance increases. The MPPT provides 28.82 W at 100 W/m2, 164.77 W at 500 W/m2, and 329.01 W at 1000 W/m2, which is consistent with the graphs provided by the panel manufacturer in Figure 4.
Figure 17.
Dynamic tracking response of MPPT output power under step-up variations utilizing the 7-MF configuration with Adjustment 3.
Figure 18 shows the output power of the MPPT as irradiance decreases. The MPPT provides 329.01 W at 1000 W/m2, 164.77 W at 500 W/m2, and 28.82 W at 100 W/m2.
Figure 18.
MPPT tracking response under decreasing operational variations for the 7-MF configuration with Adjustment 3.
In addition, the adjustment that minimizes and was subjected to temperature changes ranging from 25 °C (producing 329.01 W) to 45 °C (producing 306.81 W), with a fixed irradiance of 1000 W/m2, as shown in Figure 19, according to the panel manufacturer in Figure 3.
Figure 19.
MPPT tracking response under operational temperature variations for the 7-MF configuration with Adjustment 3.
3.5. Battery Performance with a Two-Stage Charging Strategy
To validate the two-stage charging strategy for the lead acid battery described in Section 2, this section presents the simulation results of the battery voltage and charging current using the 7-MF configuration, as it minimizes the and indices while offering high efficiency. In this scenario, the battery is initialized at 90%. Figure 20 illustrates the evolution of the battery voltage and charging current, clearly showing the transition between Region 1 (initial charge) and Region 3 (float charge) at approximately 0.1 s, which corresponds to the moment when the battery reaches full charge ( = 100%). Note that Region 2 is not considered; this has been mentioned in Section 2. At this point, the protection logic described in Section 2 is activated to prevent battery overcharging, forcing the transition to the floating stage. During Region 1, the battery voltage increases progressively to approximately 14.8 V, with an average charging current of 22.3 A. Upon transitioning to Region 3, the voltage is regulated at approximately 13.2 V, while the charging current exponentially decays to an average value of 6 A. Variations in the initial primarily affect the temporal duration of Region 1. Crucially, the predetermined voltage regulation levels, steady-state current levels, and charging logic remain stable and unchanged.
Figure 20.
Dynamic battery current and voltage profiles across two distinct operational regions under the 7-MF controller.
3.6. Improved Analysis of Results
This subsection presents a more detailed evaluation of the proposed MPPT strategy, intending to provide a more comprehensive and quantitative assessment of its performance. In addition to the comparative analysis already discussed, it examines the improvement through the percentage increase in performance, statistical consistency under multiple operating conditions, and the impact of variations in battery parameters. This analysis contributes to a deeper understanding of the robustness and reliability of the controller proposed in this study.
- Percentage improvement based on the performance indices. A quantitative performance comparison was conducted using integral error indices to evaluate the effect of the membership function structure and tuning strategy. The baseline configuration, corresponding to three membership functions with adjustment 1, was compared against the optimal configuration employing seven membership functions with Adjustment 3. Results show that the proposed optimal configuration achieves a reduction of approximately 16.3% in the ISE and 15.5% in the IAE, demonstrating a clear improvement in tracking accuracy and dynamic response. These results confirm that increasing the number of membership functions combined with an appropriate tuning strategy significantly enhances the MPPT performance while reducing cumulative tracking errors. Equation (21) illustrates how to obtain percentage improvement based on the performance indices ISE and IAE.Therefore, (reference case: 3-MF configuration with Adjustment 1) and (best case: 7-MF configuration with Adjustment 3). A similar evaluation approach based on integral performance indices (ISE and IAE) was adopted by Nivedha et al. [10], to compare different MPPT control strategies under identical system conditions. However, a direct numerical comparison with previously reported values is not appropriate in this study due to differences in PV system rated power, operating conditions, irradiance profiles, and controller implementation. Thus, relative percentage improvements are reported instead, allowing a fair and consistent assessment of performance gains independent of absolute system scale.
- Benchmarking using relative indicators. Relative performance metrics were introduced to facilitate comparison between different controller configurations. These metrics quantify the performance gains obtained by increasing the complexity of the fuzzy system, as defined in Equation (21). According to Table 8, the 7-MF controller represents the best option, while the 3-MF controller is the least favorable. Consistently, Table 10 indicates that the 7-MF controller substantially decreases the error relative to the 3-MF configuration, with improvements of 15.88% and 14.20% in the ISE and IAE performance indices, respectively. In addition, an enhancement in MPPT efficiency is obtained, increasing by 0.81%. Note in Table 10 that ↓ indicates a decrease in the metric when the 7-MF controller is compared to the 3-MF controller, while ↑ indicates an increase.
- Statistical analysis. To evaluate the robustness and repeatability of the proposed optimal configuration (seven membership functions with adjustment 3), a statistical analysis was conducted by performing ten independent simulations under different initial battery operating conditions. The initial SoC varied in 5% increments within the range of 50% to 95% while keeping the control structure unchanged. For each simulation, the integral performance indices ISE () and IAE () were calculated. The results show that the controller maintains consistent performance across all tested conditions, yielding a mean value of 0.1202 with a standard deviation of 0.00475 for the ISE and with a standard deviation of for the IAE. The relatively low dispersion of the indices confirms that the improved MPPT performance is not limited to a specific battery operating point but is consistently maintained under different initial SoC levels, demonstrating the robustness of the proposed strategy.
- Impact of changes in battery parameters. To evaluate the influence of battery operating conditions on the proposed MPPT strategy, the impact of variations in battery parameters was investigated by modifying SoC. Ten independent simulations were executed utilizing the optimal configuration (7-MF configuration with Adjustment 3), considering initial SoC values ranging from 50% to 95%, while maintaining the same controller structure and control parameters. The integral performance indices ISE () and IAE () were computed for each SoC condition. The results indicate that variations in the initial SoC produce only limited changes in the error indices, with mean values of 0.1202 for ISE and for IAE, and relatively low dispersion across all tested cases. This behavior confirms that the proposed MPPT strategy is not sensitive to changes in the initial battery operating point and maintains stable performance under different battery conditions, demonstrating robustness with respect to battery parameter variations.
Table 10.
Quantitative evaluation of absolute and relative performance indicators under standard conditions (1000 W/m2, 25°C).
3.7. Robustness and Stability
Within the same Matlab/Simulink simulation, the “Robust Control Toolbox” was used to evaluate the robustness of the controller according to Da-Wei Gu et al. [25]. Specifically, this toolbox allows for obtaining the maximum sensitivity parameter (), in this case, = 1.2835, which indicates acceptable robustness since 2.0 is considered adequate for a robust system, while 2.0 suggests a poor fit of the controller. Maximum sensitivity is directly related to the inverse of the shortest distance between the Nyquist plot and the critical point (−1, 0). This provides an overall measure of the system’s robustness.
The minimum distance from the critical point is a metric that indicates the minimum separation that the Nyquist plot maintains. In this case, this distance was 0.7791, assuming that the critical point is (−1, 0). This confirms that the system remains within an acceptable range of robustness and stability.
Finally, the phase margin is a metric that reflects the system’s ability to tolerate delays and unmodeled dynamics in practical applications. In this case, the phase margin obtained was 77.39°, suggesting a low tendency toward oscillations and a well-damped transient response. Generally, phase margin values around 60° are indicative of acceptable stability [25]. Table 11 summarizes the parameters obtained for the stability and robustness analysis of the system.
Table 11.
Quantitative performance metrics for robustness validation and asymptotic stability criteria.
A robustness and stability analysis was conducted to evaluate the performance of the IC-Fuzzy hybrid controller applied to a DC-DC converter designed to charge a lead acid battery in a stand-alone photovoltaic system. The considered uncertainty reproduced realistic variations in photovoltaic voltage associated with changes in irradiance and temperature. This adequately represented the expected operating conditions in real-world applications, including measurement errors, errors from the analog-to-digital converter, control delays, changes in battery parameters, and degradation of the photovoltaic panel.
4. Discussion
4.1. Comparative Analysis of MPPT Techniques
This subsection compares the proposed IC-FLC hybrid controller with classical, control-based, and intelligent MPPT techniques reported in recent studies (2023–2026). The evaluation considers key performance metrics, including settling time, overshoot, ripple, efficiency, computational cost, and memory usage.
Classical PO methods offer very low computational costs but exhibit slow convergence, high overshoot, and significant steady-state oscillations. Standard IC techniques improve convergence speed and reduce ripple; however, their performance remains sensitive to noise and parameter tuning. PI-based controllers enhance system stability but increase implementation complexity. Intelligent MPPT approaches, such as artificial neural networks (ANN), particle swarm optimization (PSO), and genetic algorithms (GA), achieve superior dynamic performance with fast response, low overshoot, and high efficiency. Nevertheless, these methods require higher computational resources, increased memory usage, and, in some cases, training or optimization processes, which limit their suitability for real-time embedded applications. Adaptive fuzzy MPPT techniques provide a balance between performance and robustness. However, many implementations rely on multi-input fuzzy structures with large rule bases, which significantly increase computational costs and memory demands [11,15,17,18,20]. In contrast, the proposed IC–FLC hybrid controller employs a simplified single-input fuzzy structure driven by the IC-based error signal. This design reduces the number of rules and eliminates logical conjunction operations, resulting in a lower computational cost while maintaining high performance. As summarized in Table 12, the proposed approach achieves a fast settling time (30–60 ms), low overshoot (2–5%), reduced ripple (3–15 W), high efficiency (98–99.5%), low computational cost, and low memory usage, demonstrating a favorable trade-off between dynamic performance and computational efficiency.
Table 12.
Comprehensive benchmarking: Quantitative comparative analysis of the proposed MPPT technique against state-of-the-art methods reported in the literature.
4.2. Computational Complexity Analysis
This work proposes a hybrid FLC–IC controller (Controller 4) based on a single-input, single-output structure with three, five, or seven membership functions. To evaluate computational resource consumption, it is compared with three recent multi-input FLC-based controllers reported in the literature [10,11,13].
Controller 4 consumes the fewest computational resources of the four mentioned. Within FLC systems, the numerical relationship between membership functions assigned to a variable not only dictates computational complexity but also the structural arrangement and rule-based synthesis governing their actions. Table 13 summarizes the main structural differences affecting computational complexity.
Table 13.
Comparison of computational complexity based on the algorithms used and the FLC configuration between the proposed work and recent literature.
According to Passino et al. [22], the technical reasons for low consumption in controller 4 are as follows:
- Exponential growth of rules: The cardinality of the fuzzy rule base is determined using the formula , where M is the number of membership functions and n is the number of inputs. Transitioning from a single-input to a dual-input configuration increases the number of rules from 5 to 25 when comparing controller 4 with the 5-MF configuration to controller 2. This increases the computational overhead fivefold during the fuzzy inference process.
- Conjunction cost (antecedents):
- In controller 4, the strength of the rule is simply the value of the input.
- For each rule in controllers 1, 2, and 3, the processor must perform an intersection operation (usually a minimum). For controller 1, this requires performing at least 49 additional logical comparisons per execution cycle.
- Inference and defuzzification: The inference method requires calculating the area of the union of all truncated output functions.
- Controller 4 must only overlay and average up to 3, 5, or 7 areas.
- Controller 1 must process the overlap of up to 49 potential areas, resulting in an extremely costly calculation of the centroid in terms of clock cycles and memory usage.
From a computational perspective, the number of operations required by the fuzzy inference system is directly related to the number of rules and logical evaluations. In multi-input controllers, each rule requires at least one logical conjunction (AND operation), resulting in a proportional increase in comparison and aggregation operations. In contrast, the proposed single-input structure eliminates conjunction operations and significantly reduces the total number of rule evaluations, leading to a lower number of arithmetic and logical operations per control cycle.
Similarly, Table 13 provides a detailed overview of the mathematical operations required for the simulation of the fuzzy inference system in terms of computational complexity. This analysis is based on Kim and Lewis’s [26] classical formulation of computational complexity for fuzzy controllers, where the number of operations is directly related to the number of membership functions, rules, and input variables. This primarily involves addition, subtraction, multiplication, and logical comparisons. Fuzzy rules are evaluated using minimum or product operators, whose complexity depends on the total number of rules and increases nonlinearly as the system grows [26]. A script developed in Matlab was implemented to obtain the number of mathematical operations required by each controller, allowing for the precise quantification of the total number of arithmetic operations required by the controller. Note that, relative to Controller 2, Controller 4 requires significantly fewer arithmetic operations. The number of operations for addition and subtraction decreases from 20 to 6, 10, and 14, while for division it decreases from 10 to 3, 5, and 7. Likewise, the number of operations for comparison decreases from 45 to 6, 10, and 14. This reduction is mainly due to the simplification of the fuzzy system’s structure and the elimination of mathematical operations related to the defuzzification stage. In Controller 2, this stage is performed using the centroid method, which introduces a considerable number of additional operations. This approach aligns with recent work aimed at optimizing and efficiently implementing fuzzy systems in hardware, where reducing computational cost is critical for applications in embedded systems [27].
At this point, it is important to evaluate the trade-off between accuracy and complexity. In this context, and based on Table 8 and Table 13, Figure 21 depicts the balance between MPPT efficiency and computational complexity as a function of the number of membership functions. It can be seen that raising the number of membership functions gradually enhances MPPT efficiency (from 98.9% to 99.7%), but also considerably increases the required operations (from 15 to 35). Note that the arithmetic operation count shown in Figure 21 comprises division, addition/subtraction, and comparison. This demonstrates a clear trade-off between accuracy and implementation cost, enabling the selection of an appropriate balance between performance and complexity. Note in Figure 21 that, for every controller configuration, the brown bars represent the MPPT efficiency, while the red bars represent the number of operations.
Figure 21.
Trade-off between MPPT efficiency and number of operations for varying the number of membership functions.
4.3. Simulation-Level Computational Cost Under Different Fuzzy Input Granularities
To complement the theoretical complexity analysis, a simulation-level computational assessment was conducted using an automated MATLAB script to compare the computational effort associated with different fuzzy input granularities in the proposed single-input MPPT structure.
The script reported wall-clock execution time, CPU processing time, and incremental memory usage. Since all configurations were evaluated under identical conditions, the results provide a consistent comparative indication of computational cost.
For the 7-MF controller, the execution time was 18.75 s, CPU time 15.12 s, and memory usage +37.61 MB. Table 14 summarizes the results for all evaluated configurations.
Table 14.
Computational cost indicators at the simulation level for different levels of granularity in the fuzzy system (single-input structure).
A reduction in the number of membership functions leads to a consistent decrease in execution time and memory usage due to the lower number of rules and inference operations. Although these results correspond to a single-input structure, multi-input fuzzy controllers are expected to exhibit higher computational costs due to the expansion of the rule base. This highlights the advantage of low-dimensional fuzzy structures for real-time MPPT applications.
While reducing granularity improves computational efficiency, it may introduce a trade-off with control sensitivity. Therefore, the selected configuration represents a balance between computational cost and tracking performance.
These results in Table 14 indicate that the proposed controller exhibits computational requirements compatible with real-time embedded implementations. The reduced number of rules, the absence of logical conjunction operations, and a moderate memory footprint make the controller suitable for execution on microcontrollers and platforms based on digital signal processing (DSP) commonly used in photovoltaic applications. Compared to FPGA-based implementations reported in the literature, which typically emphasize parallel processing and high-speed execution at the expense of increased hardware complexity and resource utilization, the proposed controller targets low-cost embedded platforms with limited computational resources. While FPGA-based MPPT controllers can achieve fast response times, they usually require significantly higher logic resources and development effort. Similarly, DSP-based implementations offer efficient numerical computation but may still be affected by increased algorithmic complexity when multi-input fuzzy structures are used. In this context, the simplified structure of the proposed controller offers a balanced alternative, achieving competitive dynamic performance while reducing implementation overhead.
4.4. Limitations of the Simulation
In accordance with the established control systems design methodologies for the development of controllers, validation is systematically executed in three successive stages: analytical or mathematical modeling, simulation-based verification, and experimental or closed-loop hardware implementation. Simulation plays a fundamental role in verifying control logic, safety mechanisms, and the dynamic behavior of the system, considering a wide range of operating conditions before hardware implementation; however, it might imply high potential costs [22].
Although physical validation is ultimately essential, this study is restricted to simulation-based verification; implementing the proposed approach in practice and experimentally validating it remains a central goal for future work. Numerical simulation offers a high-fidelity approximation of the system’s dynamic behavior; however, it also entails intrinsic constraints that need to be taken into account. It should be noted that purely simulated models cannot fully reproduce hardware and instrumentation imperfections, including noise in current and voltage measurements, switching delays in the DC-DC converter, variations in the battery’s internal resistance, and inaccuracies in estimation, among other factors.
5. Future Work
Based on the findings of this study and the limitations inherent in simulation-based validation, the following areas have been identified for future research to further enhance and validate the proposed MPPT controller.
5.1. FPGA-Based Implementation
The progress demonstrated in this study lays the groundwork for implementing the proposed controller on FPGA-based platforms. FPGAs support parallel computation and high-speed execution, making them particularly suitable for running sophisticated control algorithms with very low latency. Migrating to an FPGA architecture would enable rigorous testing of the controller’s high-frequency switching regulation performance in the DC-DC converter while preserving the low computational burden achieved in this study.
5.2. DSP-Based Implementation
As with FPGA implementation, DSP-based implementation represents another domain that warrants systematic exploration. DSPs are known for delivering high computational speed and accurate numerical handling, which makes them highly suitable for energy systems requiring rapid dynamic response. Since the architecture of the proposed controller removes complex logical conjunction operations and substantially lowers arithmetic demands, it is especially well-matched to efficient deployment on DSP platforms with limited resources.
5.3. Experimental Studies
While this study offers a high-fidelity validation based on simulations, conducting experiments remains a key goal for future work. Upcoming experimental efforts should focus on implementing an actual DC–DC converter stage, including measurement sensors, switching devices, and the necessary battery storage. Such an experimental platform is vital for assessing the MPPT controller’s performance under realistic operating conditions, explicitly capturing hardware non-idealities, sensor noise, switching delays, and SoC estimation inaccuracies that cannot be fully replicated in simulation-only investigations.
5.4. Adaptive Membership Functions
A promising direction is the development of adaptive fuzzy logic controllers in which membership functions, rules, and scaling factors are adjusted dynamically according to operating conditions. This approach can improve convergence to the MPP and enhance robustness under uncertainties such as irradiance variations, temperature fluctuations, and measurement noise, reducing the need for manual tuning. This strategy can also contribute to improving the robustness and flexibility of the system. Consequently, future research should focus on developing adaptive fuzzy logic controllers. These controllers would enable real-time modification of membership functions, rule sets, and scaling parameters to reflect changing environmental and operating conditions. By minimizing the need for manual tuning, such adaptive schemes are anticipated to enhance convergence to the MPP and increase the overall robustness of the system.
5.5. Artificial Intelligence and Deep Learning Integration
In future research, AI could be investigated as an extension of the proposed method, especially to improve adaptability and predictive performance. Nonetheless, incorporating AI also brings challenges, including substantial computational demands and the necessity for sufficiently representative training datasets. Consequently, its use should be assessed with particular care in resource-constrained environments. Deep learning (DL) methods can be investigated to improve or supplement fuzzy-based MPPT approaches, especially for capturing nonlinear system dynamics and enhancing predictive capability under complex operating conditions. Nonetheless, these methods entail substantial computational costs and require large, well-prepared training datasets, factors that must be carefully evaluated prior to real-world deployment.
6. Conclusions
This study introduced a structurally optimized hybrid MPPT controller that combines the IC method with FLC for PV systems equipped with battery storage. It further addressed how changes in the number and configuration of membership functions impact tracking performance and computational burden in a single-input fuzzy MPPT scheme. To assess scalability, configurations featuring three-, five-, and seven-level triangular membership functions were systematically analyzed based on integral performance indices (ISE and IAE), energy efficiency, and computational cost. Simulation results showed that increasing the number of membership functions improved the controller’s ability to model the nonlinear behavior of the PV system. Based on system balance, the proposal with the highest probability of practical success would be the 5-MF configuration. While the 7-MF configuration achieved the fewest errors indices (ISE = 0.1155, IAE = ) and the highest efficiency (99.7%), the 5-MF configuration offers the best compromise between tracking accuracy and computational complexity, making it the best option. This makes it the most robust and attractive option for implementation in real-world embedded systems with limited resources and memory. These findings confirm that both the controller design and the granularity of the membership functions are key factors in achieving reliable and efficient MPPT performance. The proposed IC–FLC hybrid MPPT controller is particularly appropriate for off-grid or battery-supported PV systems that use DC-DC converters and operate under fluctuating irradiance and temperature. It is most effective in low- to medium-power PV installations where precise voltage and current sensing are available and where maintaining a trade-off between dynamic response and computational efficiency is essential. The single-input fuzzy structure makes the controller especially well-suited for real-time embedded platforms with limited processing capabilities. From an industrial perspective, the proposed approach can be applied to the design of intelligent solar charge controllers, stand-alone PV systems with battery storage, and DC microgrids. The reduced computational load achieved through structural optimization makes it feasible to run the algorithm on microcontrollers, DSPs, or other cost-effective embedded devices commonly used in commercial PV inverters. Furthermore, the systematic tuning strategy guided by performance indices assists engineers in developing robust MPPT controllers tailored to specific PV modules and battery chemistries. Despite these promising results, the work shares several constraints typical of simulation-only validation. First, the proposed controller was exclusively evaluated in MATLAB/Simulink, using idealized DC-DC converter models and neglecting switching and conduction losses. Second, sensor noise, time delays, parameter variations, and hardware non-idealities—such as semiconductor losses, parasitic effects, and inaccuracies in SoC estimation—were not explicitly incorporated into the models. Even though the PV panel and battery models were based on commercial devices, these simplifications may affect the absolute efficiency values that can be achieved in practical hardware implementations. Given that the findings of this study are derived solely from simulations, it is essential to emphasize the main limitations identified. One limitation lies in the absence of experimental validation and hardware implementation of the proposed controller. Another drawback is the limited in-depth analysis of photovoltaic panel and battery degradation. Moreover, the study focuses on just one specific photovoltaic system configuration, which could limit how broadly the results can be applied. These limitations highlight clear paths for future research in this area.
Author Contributions
Conceptualization: E.R.-C., O.J.-R. and D.G.-R.; methodology: E.R.-C. and O.J.-R.; software: E.R.-C. and D.G.-R.; validation: O.J.-R. and R.V.-M.; formal analysis: D.A.-T. and R.V.-M.; investigation: E.R.-C. and D.G.-R.; resources: O.J.-R. and R.V.-M.; data curation: E.R.-C., D.G.-R., R.V.-M. and D.A.-T.; writing—original draft preparation: E.R.-C., D.G.-R. and O.J.-R.; writing—review and editing: R.V.-M., D.G.-R., O.J.-R. and D.A.-T.; visualization: O.J.-R. and R.V.-M.; supervision: O.J.-R. and R.V.-M.; project administration, O.J.-R. and R.V.-M.; funding acquisition, O.J.-R. and R.V.-M. All authors have read and agreed to the published version of the manuscript.
Funding
This research received financial support from the Instituto Politécnico Nacional through grant MULTI-2026-0038.
Institutional Review Board Statement
Not applicable.
Informed Consent Statement
Not applicable.
Data Availability Statement
Data will be made available upon request.
Acknowledgments
Ezequiel Rincon-Canalizo (CVU-2063199), Daniel Aguilar-Torres (CVU-829790) and David Gutiérrez-Rosales (CVU-1269306) are grateful for the grant provided by Secretaría de Ciencia, Humanidades, Tecnología e Innovación (SECIHTI, Mexico). The authors would like to thank Ismael Araujo-Vargas for his valuable technical guidance and expertise in Power Electronics, particularly regarding the design and optimization of the DC-DC converter stage used in this study.
Conflicts of Interest
The authors declare no conflicts of interest.
Nomenclature
| Symbol | Description |
| Efficiency | |
| Membership degree | |
| AI | Artificial intelligence |
| ANN | Artificial neural networks |
| CCM | Continuous control mode |
| D | Duty cycle |
| DL | Deep learning |
| DC-DC | Direct current-direct current |
| FLC | Fuzzy logic control |
| FSCC | Fuzzy fractional short-circuit control |
| GA | Genetic algorithms |
| IAE | Integral absolute error |
| IC | Incremental conductance |
| ITAE | Integral time absolute error |
| ISE | Integral squared error |
| LSTM | Long short-term memory |
| MPP | Maximum power point |
| MPPT | Maximum power point tracking |
| PO | Perturb and observe |
| PSO | Particle swarm optimization |
| PV | Photovoltaic |
| PWM | Pulse width modulation |
| RMS | Root mean square |
| RMSE | Root mean square error |
| SoC | State of charge |
References
- Green, M.A.; Dunlop, E.D.; Yoshita, M.; Kopidakis, N.; Bothe, K.; Siefer, G.; Hao, X.; Jiang, J.Y. Solar cell efficiency tables (version 66). Prog. Photovolt. Res. Appl. 2025, 33, 795–810. [Google Scholar] [CrossRef] [Scilit]
- Desconzi, M.; Beltrame, R.; Rech, C.; Schuch, L.; Hey, H. Photovoltaic stand alone power generation system with multilevel inverter. In Proceedings of the International Conference on Renewable Energies and Power Quality (ICREPQ), Las Palmas, Spain, 13–15 April 2011. [Google Scholar]
- Taghvaee, M.; Radzi, M.; Moosavain, S.; Hashim, H.; Hamiruce, M. A current and future study on non-isolated DC–DC converters for photovoltaic applications. Renew. Sustain. Energy Rev. 2013, 17, 216–227. [Google Scholar] [CrossRef] [Scilit]
- Kislovski, A. Dynamic behavior of a constant frequency buck converter power cell in a photovoltaic battery charger with a maximum power tracker. In Proceedings of the Fifth Annual Applied Power Electronics Conference and Exposition; IEEE: New York, NY, USA, 1990; pp. 212–220. [Google Scholar] [CrossRef] [Scilit]
- Artal-Sevil, J.S.; Coronado-Mendoza, A.; Haro-Falcón, N.; Domínguez-Navarro, J.A. High-Efficiency Partial-Power Converter with Dual-Loop PI-Sliding Mode Control for PV Systems. Electronics 2025, 14, 3622. [Google Scholar] [CrossRef] [Scilit]
- Koutroulis, E.; Kalaitzakis, K. Novel battery charging regulation system for photovoltaic applications. IET Electr. Power Appl. 2011, 151, 191–197. [Google Scholar] [CrossRef] [Scilit]
- Huang, C.C.; Kuo, P.K. Implementation of a stand-alone photovoltaic lighting system with MPPT, battery charger and high brightness LEDs. In Proceedings of the 2005 International Conference on Power Electronics and Drives Systems; IEEE: New York, NY, USA, 2005; Volume 2, pp. 1601–1605. [Google Scholar] [CrossRef] [Scilit]
- Enslin, J.H.; Wolf, M.S.; Snyman, D.B.; Swiegers, W.J. Integrated photovoltaic maximum power point tracking converter. IEEE Trans. Ind. Electron. 1997, 44, 769–773. [Google Scholar] [CrossRef] [Scilit]
- Samuel, A.; Torrico-Bascope, R.; Antunes, F.; Mineiro, E. Stand-alone photovoltaic system using an UPS inverter and a microcontrolled battery charger based on a boost converter with a 3 state-commutation cell. In Proceedings of the 32nd Annual Conference on IEEE Industrial Electronics; IEEE: New York, NY, USA, 2006; pp. 4381–4386. [Google Scholar] [CrossRef] [Scilit]
- Nivedha, S.; Vijayalaxmi, M. Performance Analysis of Fuzzy based Hybrid MPPT Algorithm for Photovoltaic system. In Proceedings of the 2021 International Conference on Communication, Control and Information Sciences (ICCISc), Idukki, India, 16–18 June 2021. [Google Scholar] [CrossRef] [Scilit]
- Çakmak, F.; Aydoğmuş, Z.; Tür, M.R. Analyses of PO-Based Fuzzy Logic-Controlled MPPT and Incremental Conductance MPPT Algorithms in PV Systems. Energies 2025, 18, 233. [Google Scholar] [CrossRef] [Scilit]
- Hirech, K.; Melhaoui, M.; Yaden, F.; Baghaz, E.; Kassmi, K. Design and realization of an autonomous system equipped with a charge/discharge regulator and digital MPPT command. Energy Procedia 2013, 42, 503–512. [Google Scholar] [CrossRef] [Scilit]
- Melhaoui, M.; Rhiat, M.; Oukili, M.; Atmane, I.; Hirech, K.; Bossoufi, B.; Almalki, M.M.; Alghamdi, T.A.; Alenezi, M. Hybrid fuzzy logic approach for enhanced MPPT control in PV systems. Sci. Rep. 2025, 15, 19235. [Google Scholar] [CrossRef] [Scilit] [PubMed]
- Nataraj, G.; Karthikeyan, G.; Jaya, B.; Shankar, D. Comparative analysis of direct coupling and MPPT control in standalone PV systems for solar energy optimization to meet sustainable building energy demands. Sci. Rep. 2024, 14, 22924. [Google Scholar] [CrossRef] [Scilit] [PubMed]
- Zemmit, A.; Abdelouadoud, L.; Khaled, B.; Yahya, Z.A.; Muhannad, A.; Prabhu, P.; Sherif, G. GWO and WOA variable step MPPT algorithms-based PV system output power optimization. Sci. Rep. 2025, 15, 7810. [Google Scholar] [CrossRef] [Scilit] [PubMed]
- Wandhare, R.; Agarwal, V. Novel integration of a PV-wind energy system with enhanced efficiency. IEEE Trans. Power Electron. 2015, 30, 3638–3649. [Google Scholar] [CrossRef] [Scilit]
- Ibrahim, N.F.; Mahmoud, M.M.; Alnami, H.; Mbadjoun Wapet, D.E.; Ardjoun, S.A.E.M.; Mosaad, M.I. A New Adaptive MPPT Technique Using an Improved Incremental Conductance Algorithm Supported by Fuzzy Self-Tuning Controller. PLoS ONE 2023, 18, e0293613. [Google Scholar] [CrossRef] [Scilit] [PubMed]
- Patel, R.; Sharma, A.; Mehta, B. Comparative Performance Analysis of Incremental Conductance and Fuzzy Logic Based MPPT Techniques for Photovoltaic Systems. Int. J. Renew. Energy Res. 2024, 14, 456–465. [Google Scholar] [CrossRef] [Scilit]
- Tsafack, P.; Fru, S.E.; Nghemachi, A.V.; Tanyi, E. Impact of High Constant Charging Current Rates on the Charge/Discharge Efficiency in Lead-Acid Batteries for Residential Photovoltaic System Applications. J. Energy Storage 2023, 63, 107013. [Google Scholar] [CrossRef] [Scilit]
- Roy, B.; Adhikari, S.; Datta, S.; Devi, K.J.; Devi, A.D.; Ustun, T.S. Harnessing Deep Learning for Enhanced MPPT in Solar PV Systems: An LSTM Approach Using Real-World Data. Electricity 2024, 5, 843–860. [Google Scholar] [CrossRef] [Scilit]
- Al-Hussein, A.B.A.; Tahir, F.R.; Pham, V.T. FPGA Implementation of Synergetic Controller-Based MPPT Algorithm for a Standalone PV System. Computation 2025, 13, 64. [Google Scholar] [CrossRef] [Scilit]
- Passino, K.M.; Yurkovich, S. Fuzzy Control; Addison-Wesley: Reading, MA, USA, 1998; Volume 42. [Google Scholar]
- Almaged, M.; Mahmood, A.; Alnema, Y.H.S. Design of an Integral Fuzzy Logic Controller for a Variable-Speed Wind Turbine Model. J. Robot. Control (JRC) 2023, 4, 762–768. [Google Scholar] [CrossRef] [Scilit]
- Driankov, D. An Introduction to Fuzzy Control; Springer: Berlin/Heidelberg, Germany, 1993. [Google Scholar] [CrossRef] [Scilit]
- Gu, D.W.; Petkov, P.H.; Konstantinov, M.M. Robust Control Design with MATLAB®, 2nd ed.; Springer: London, UK, 2013. [Google Scholar] [CrossRef] [Scilit]
- Kim, Y.H.; Lewis, F.L. Computational Complexity of General Fuzzy Logic Control and Its Simplification for a Loop Controller. Fuzzy Sets Syst. 2000, 111, 215–224. [Google Scholar] [CrossRef] [Scilit]
- Gorgin, S.; Mohammadi, A.H.; Meybodi, M.R. A Hardware Realization Framework for Fuzzy Inference System Optimization. Electronics 2024, 13, 690. [Google Scholar] [CrossRef] [Scilit]
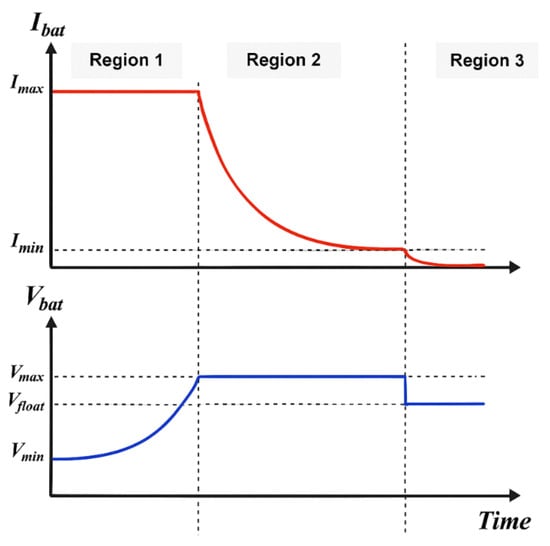
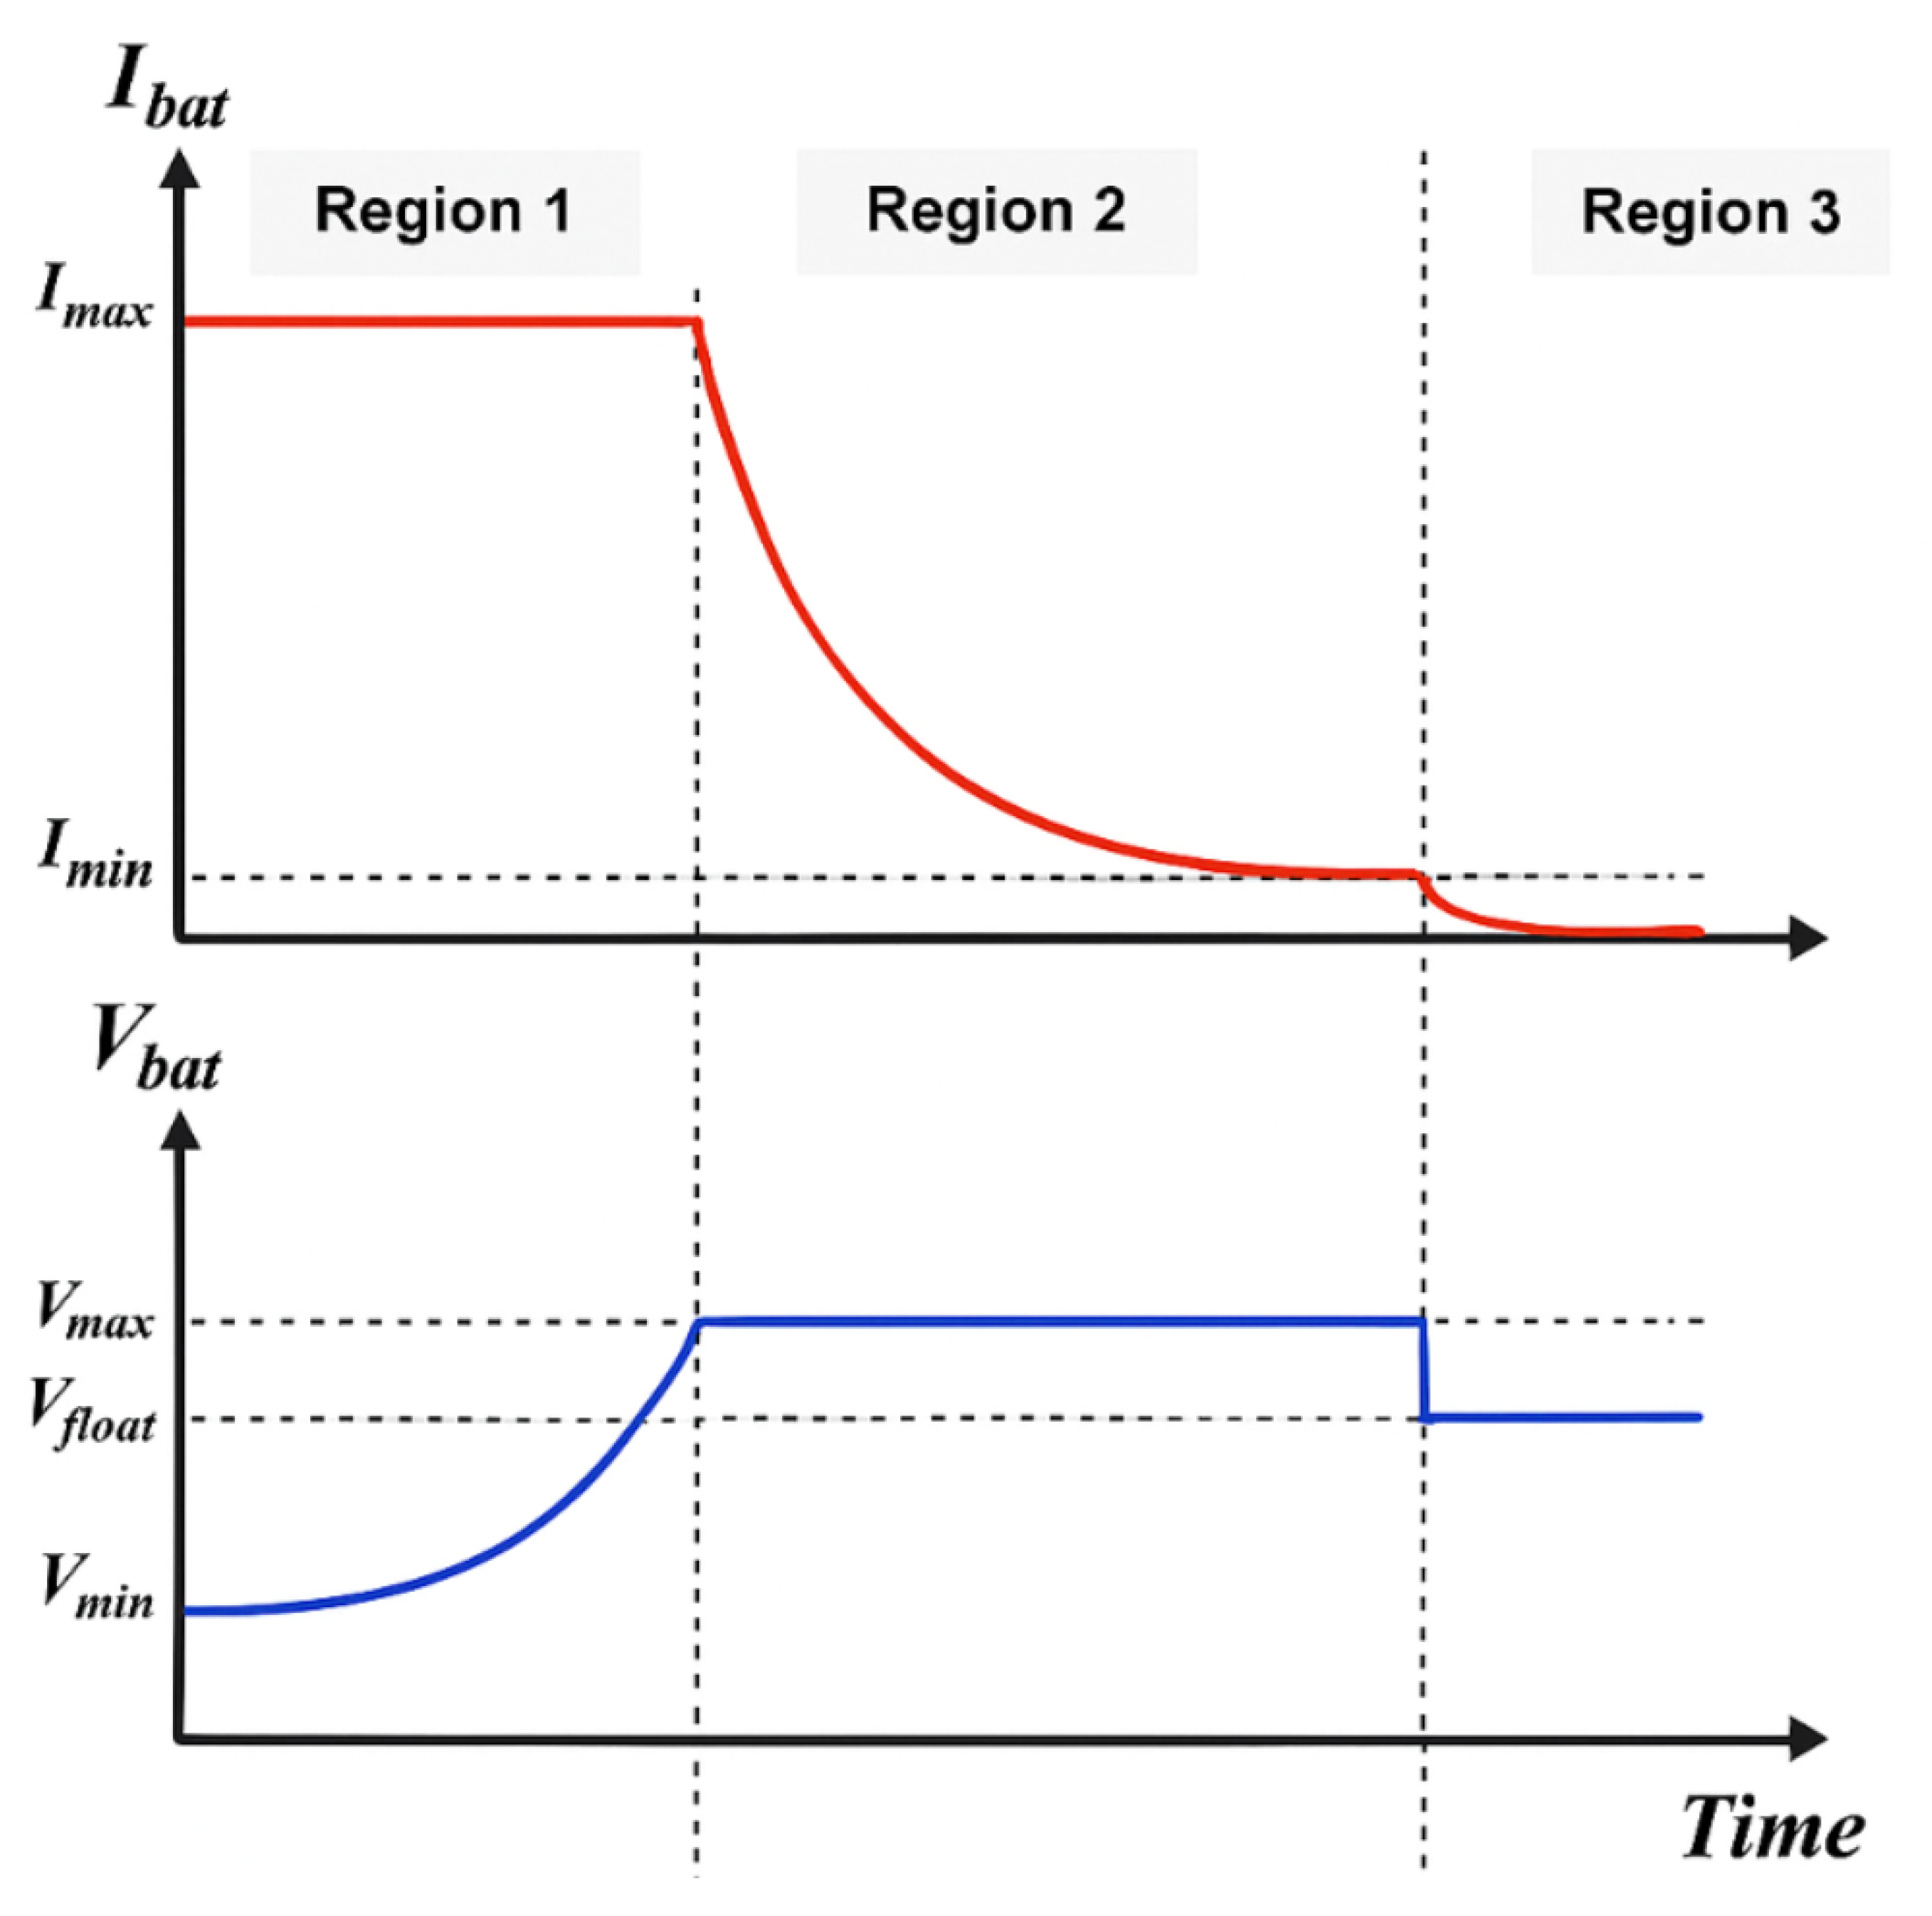
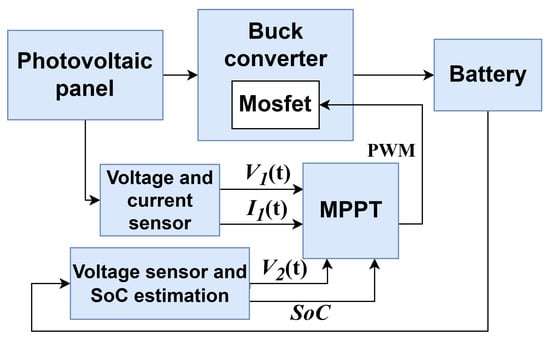
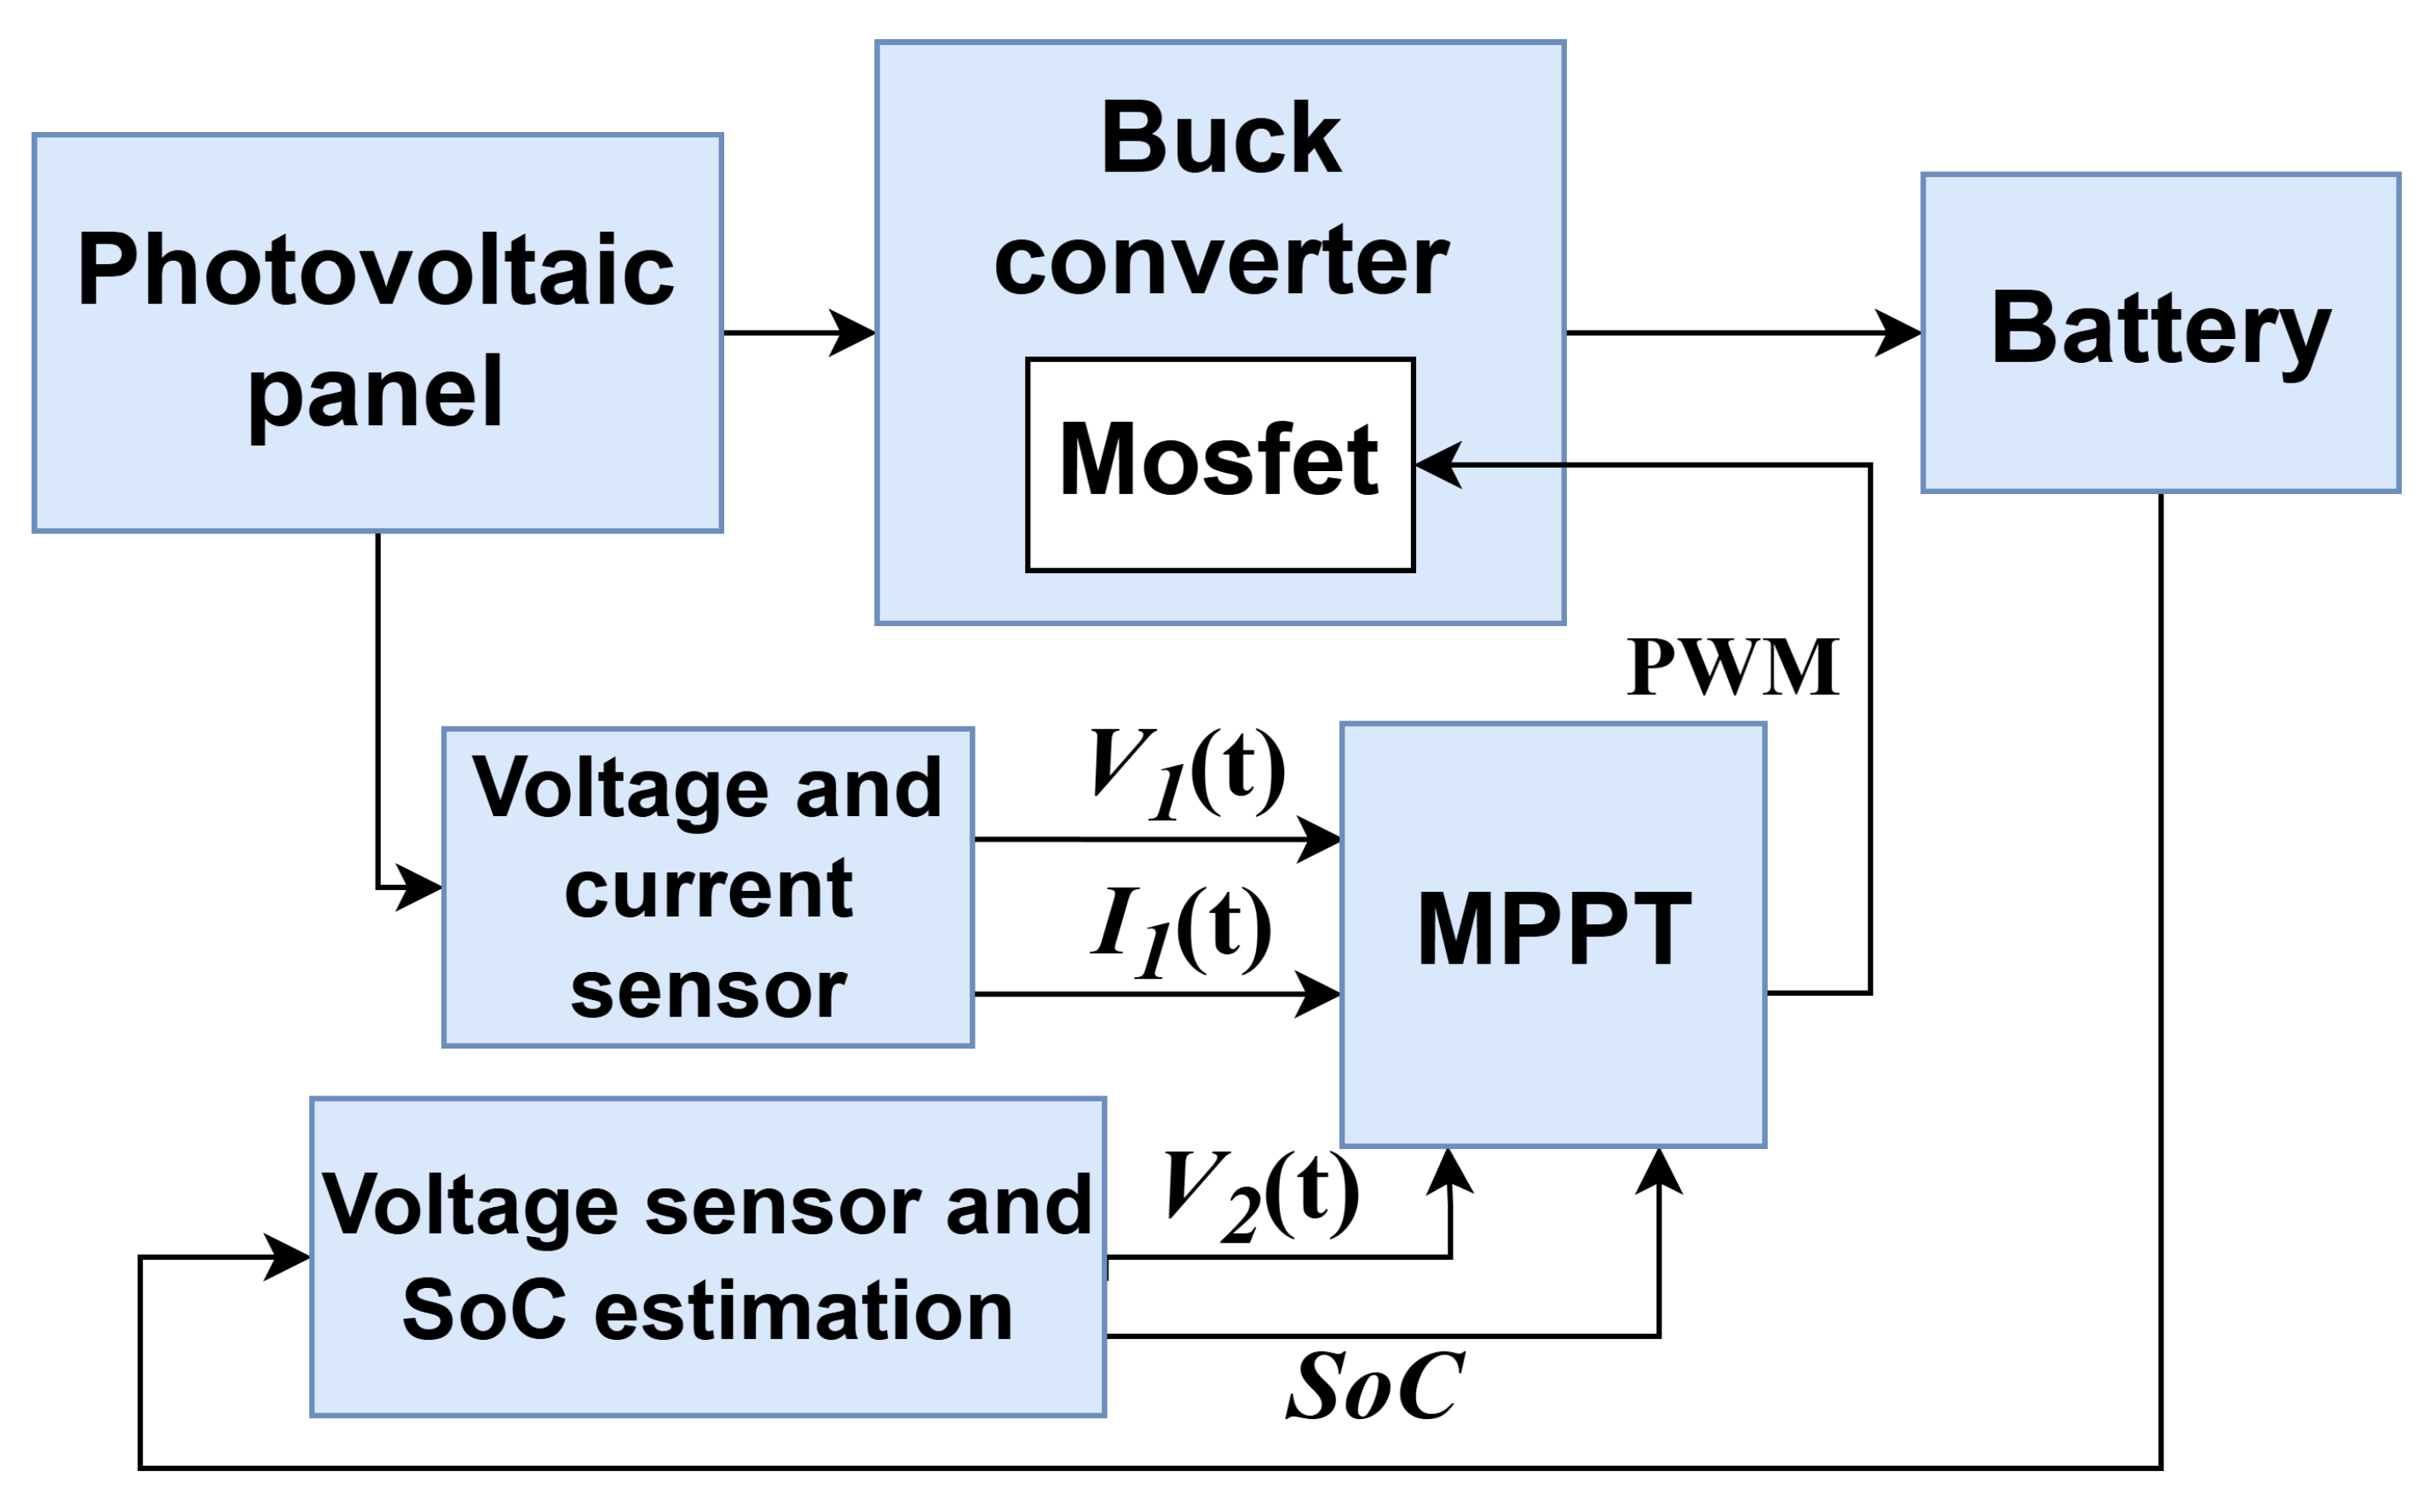
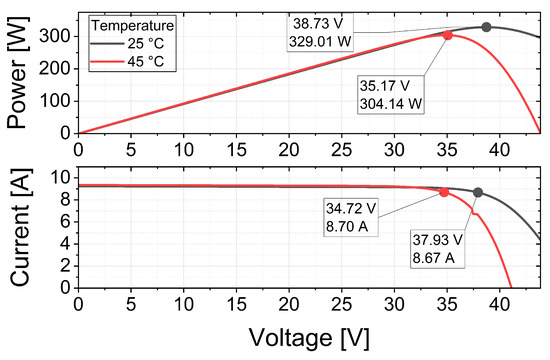
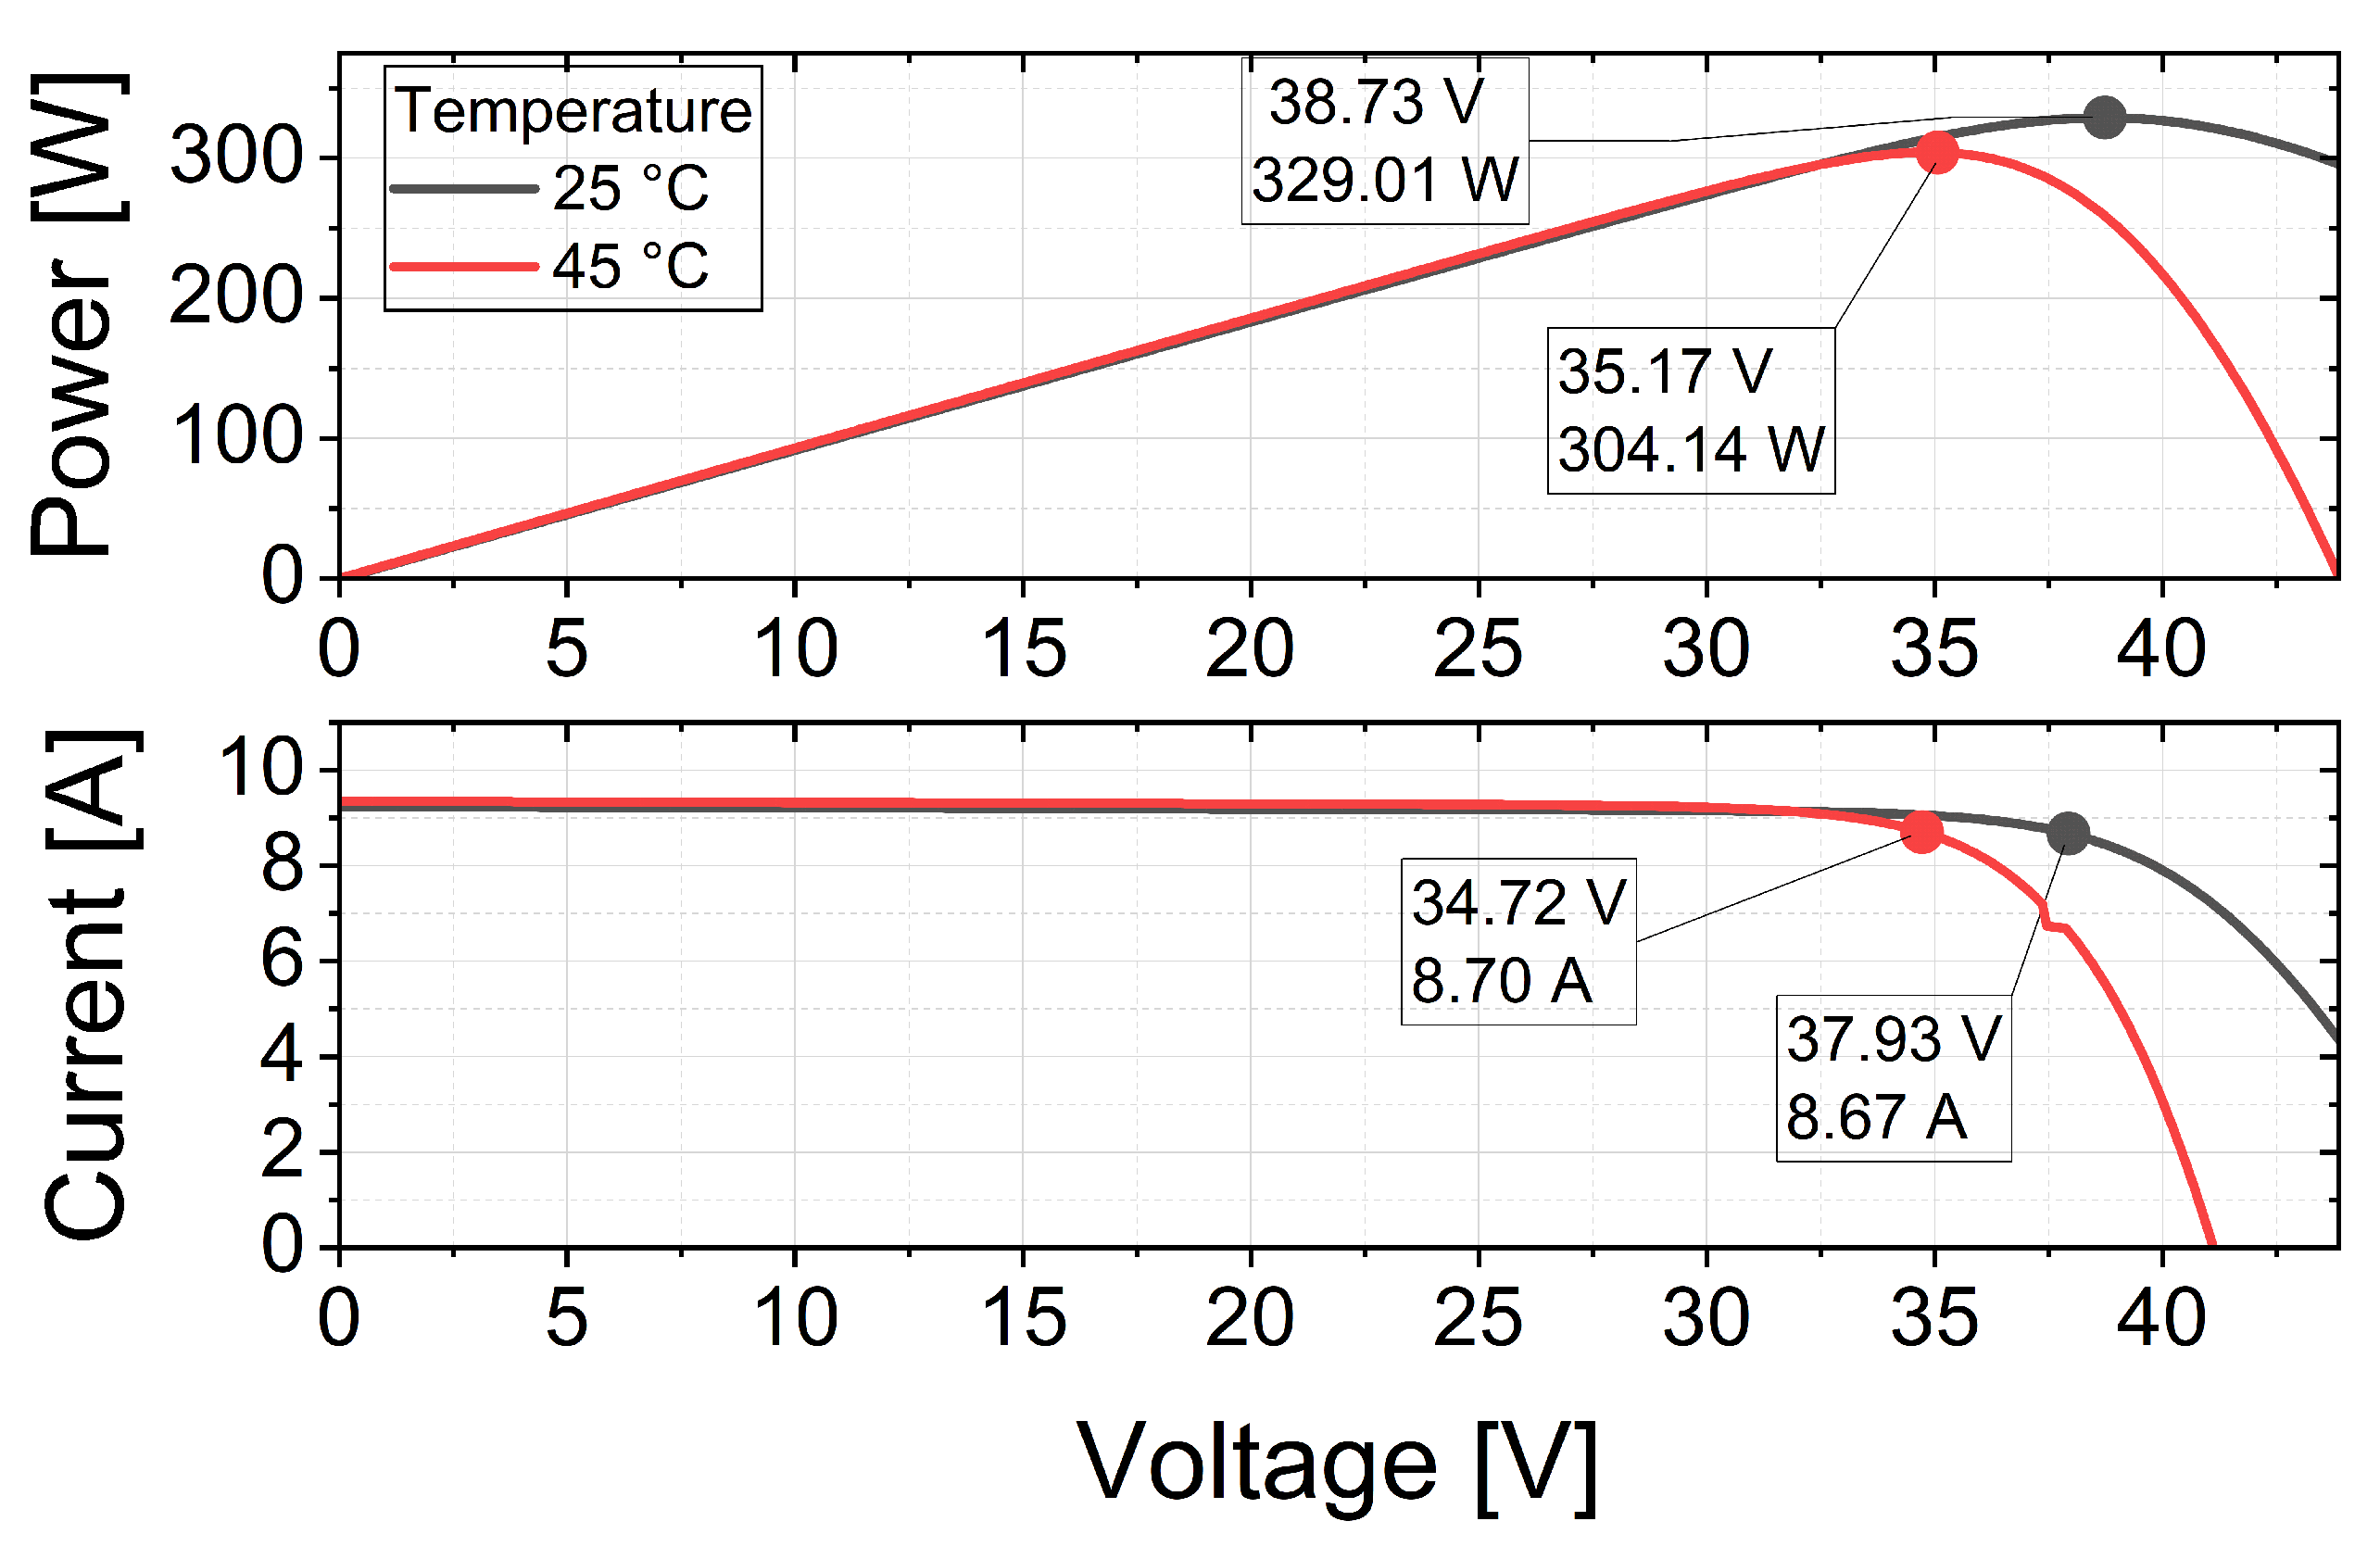
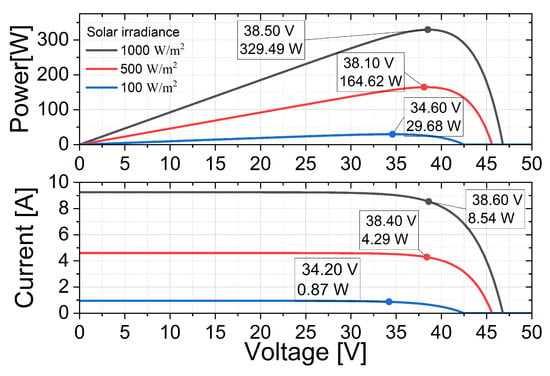
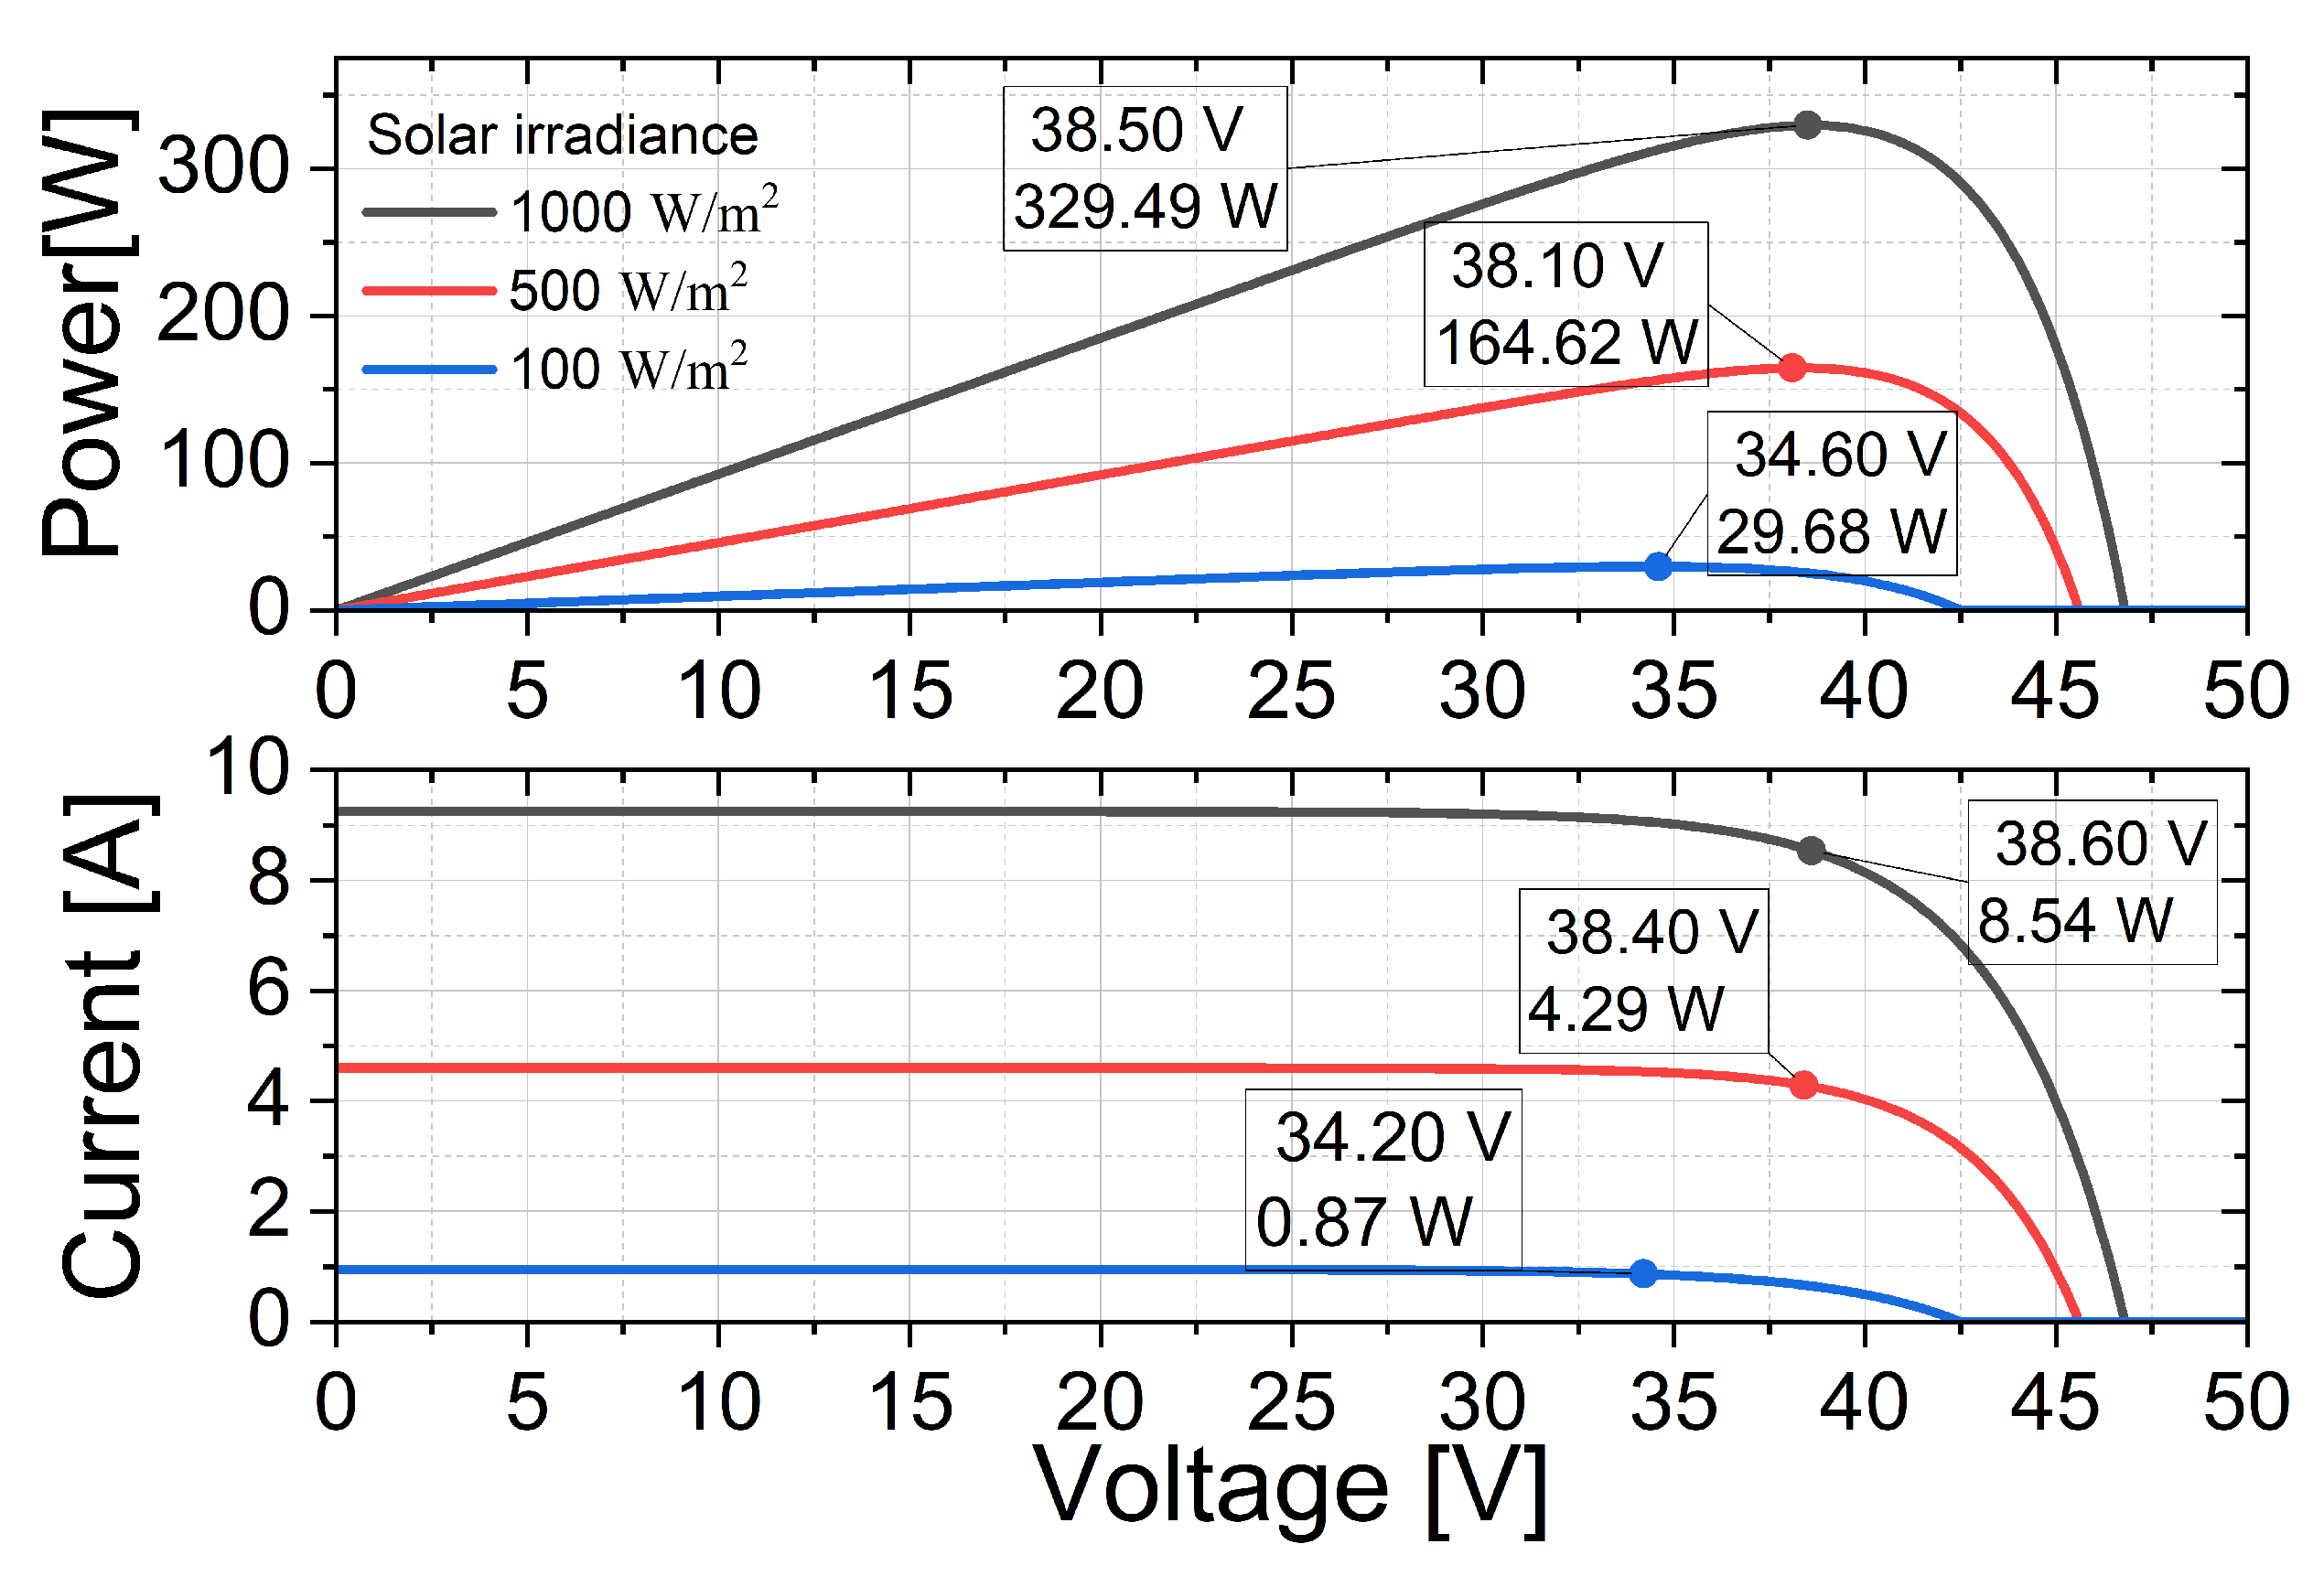
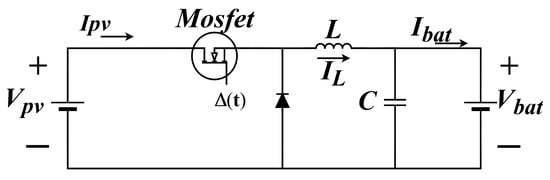
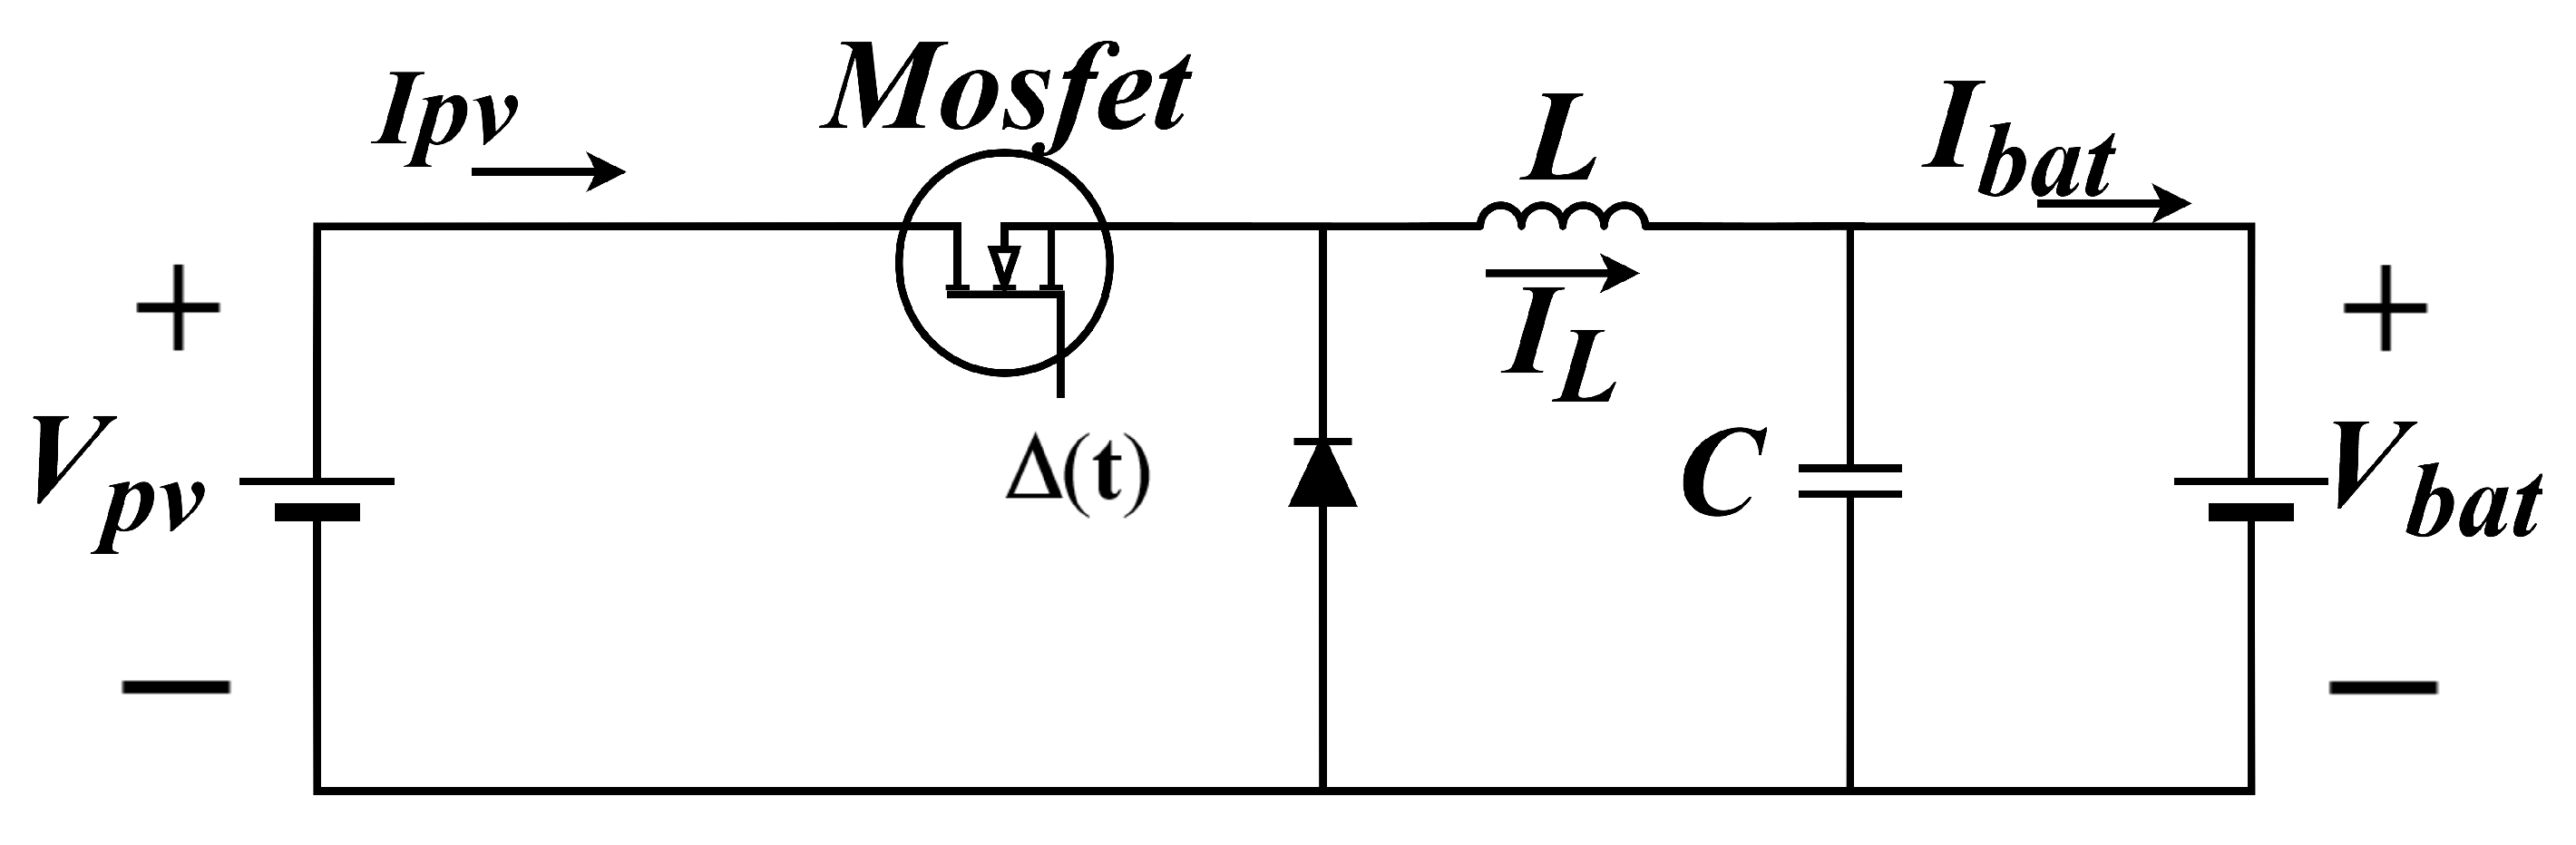
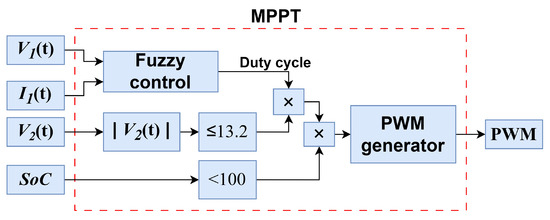
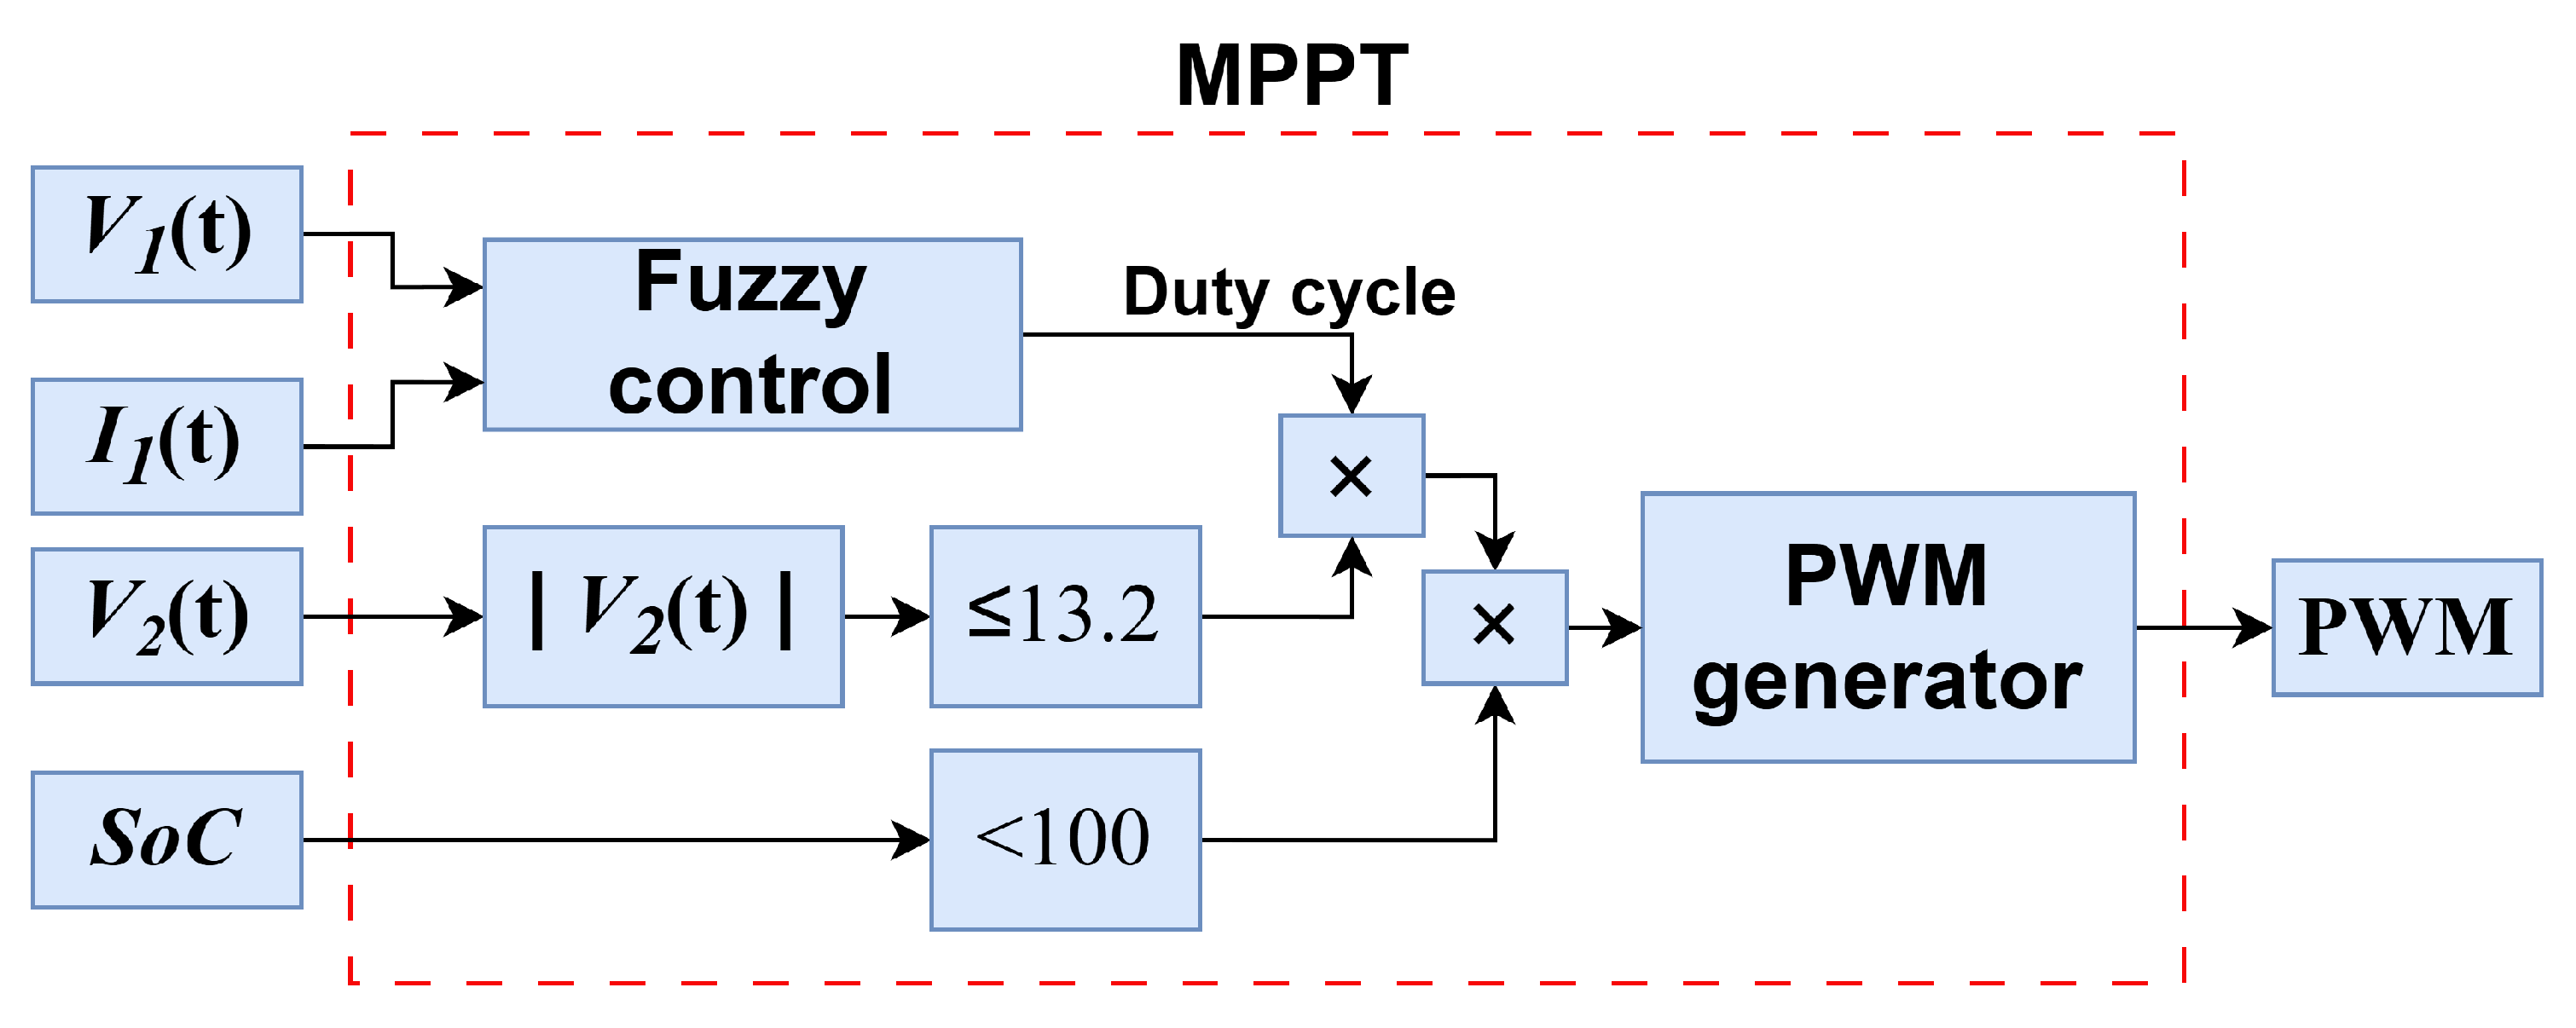
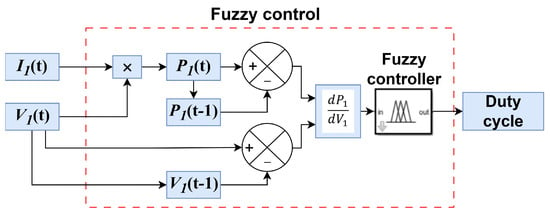
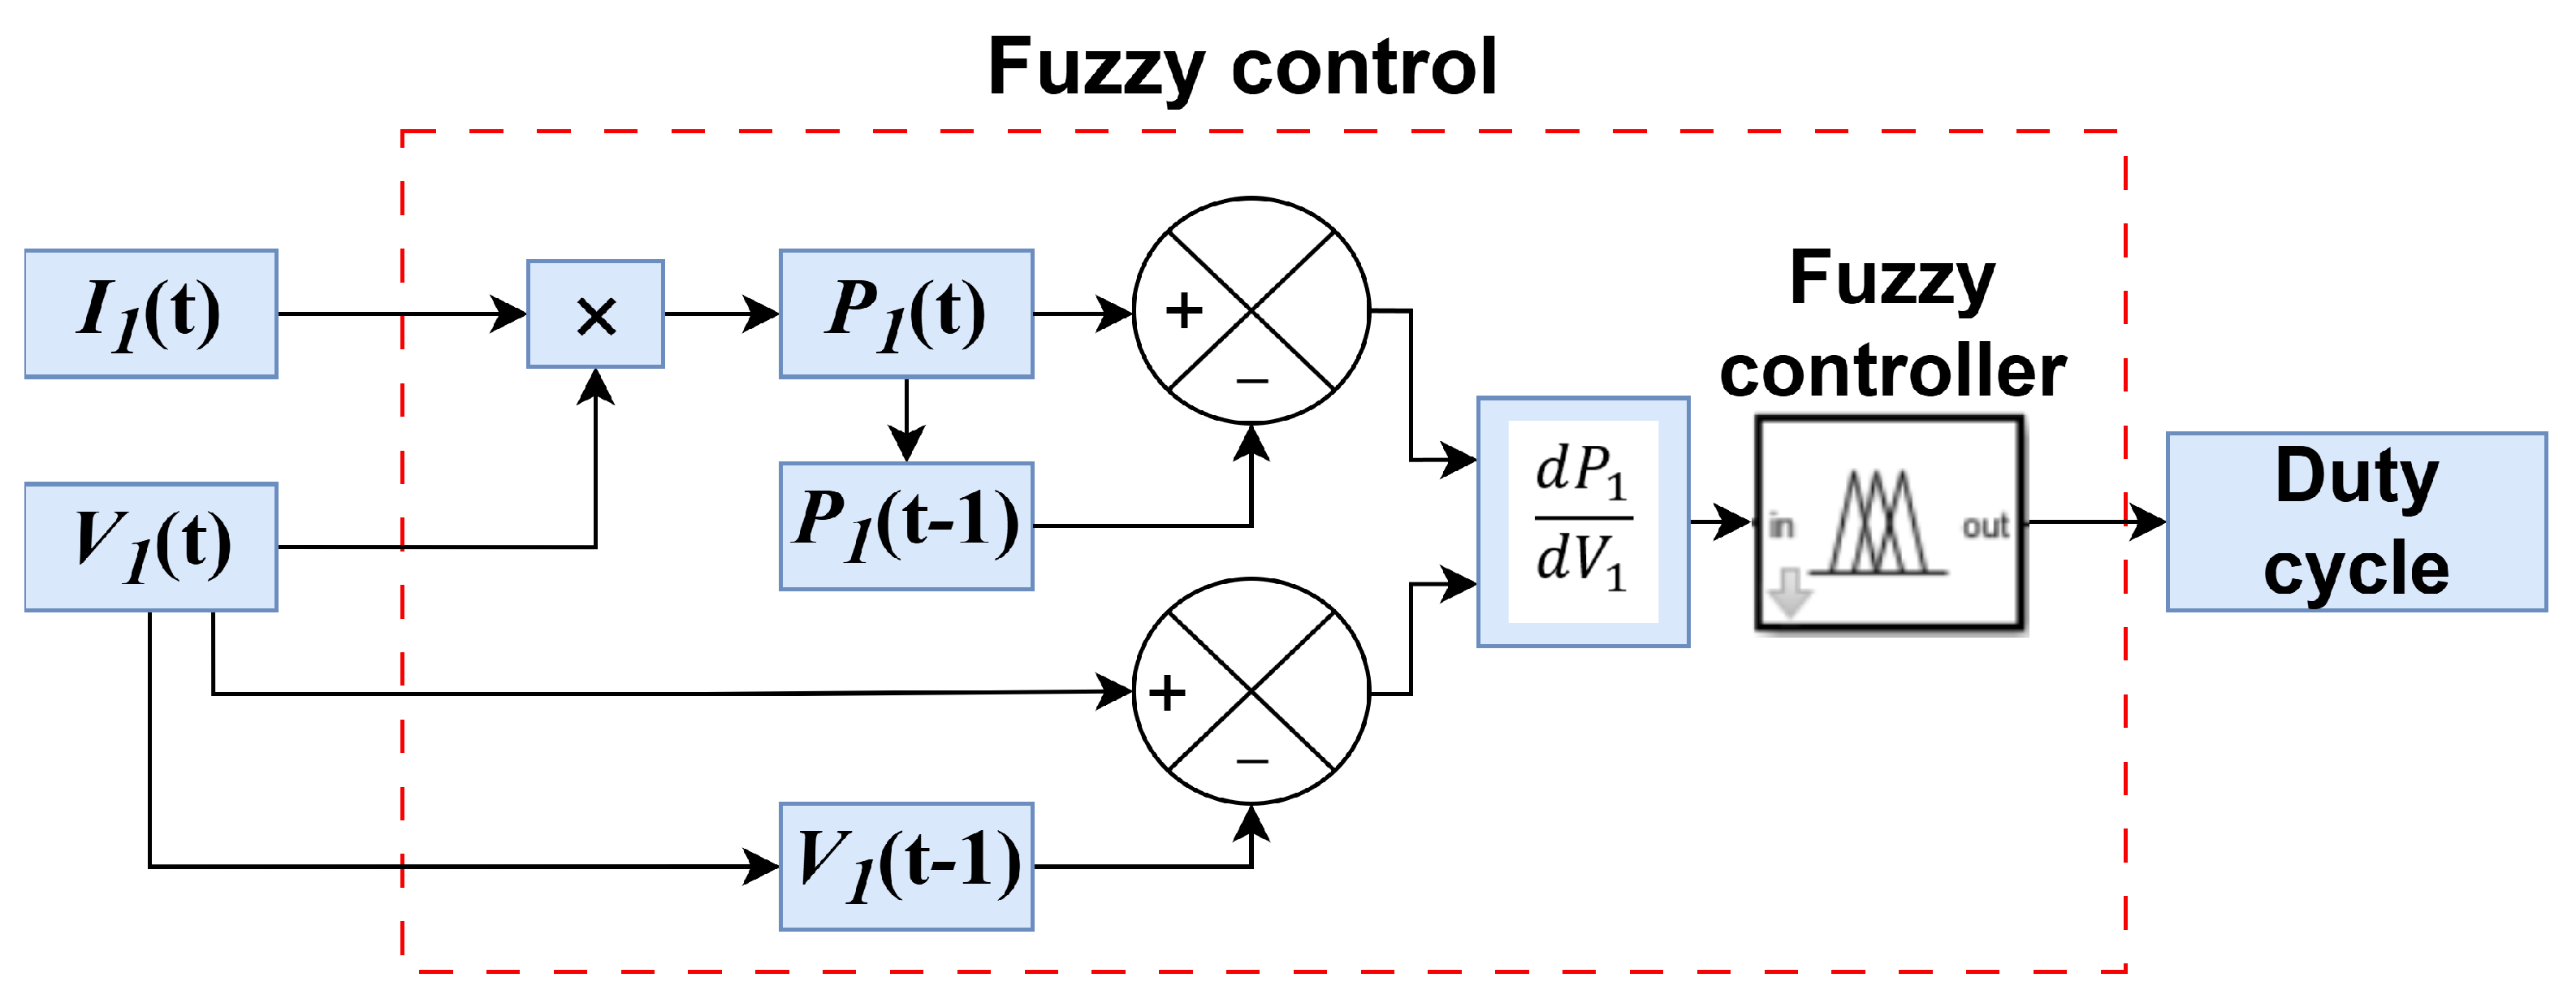
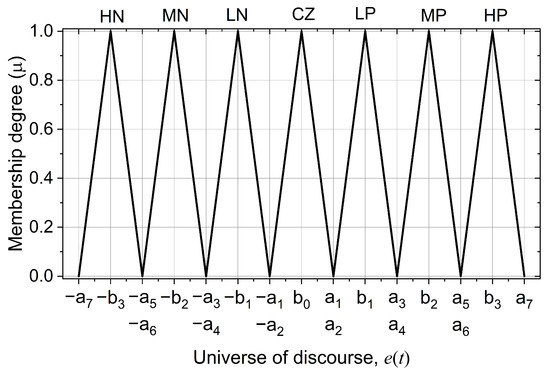
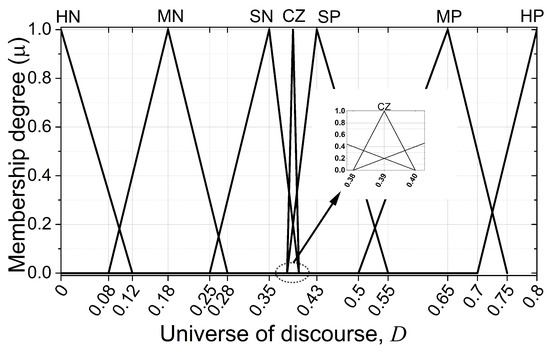
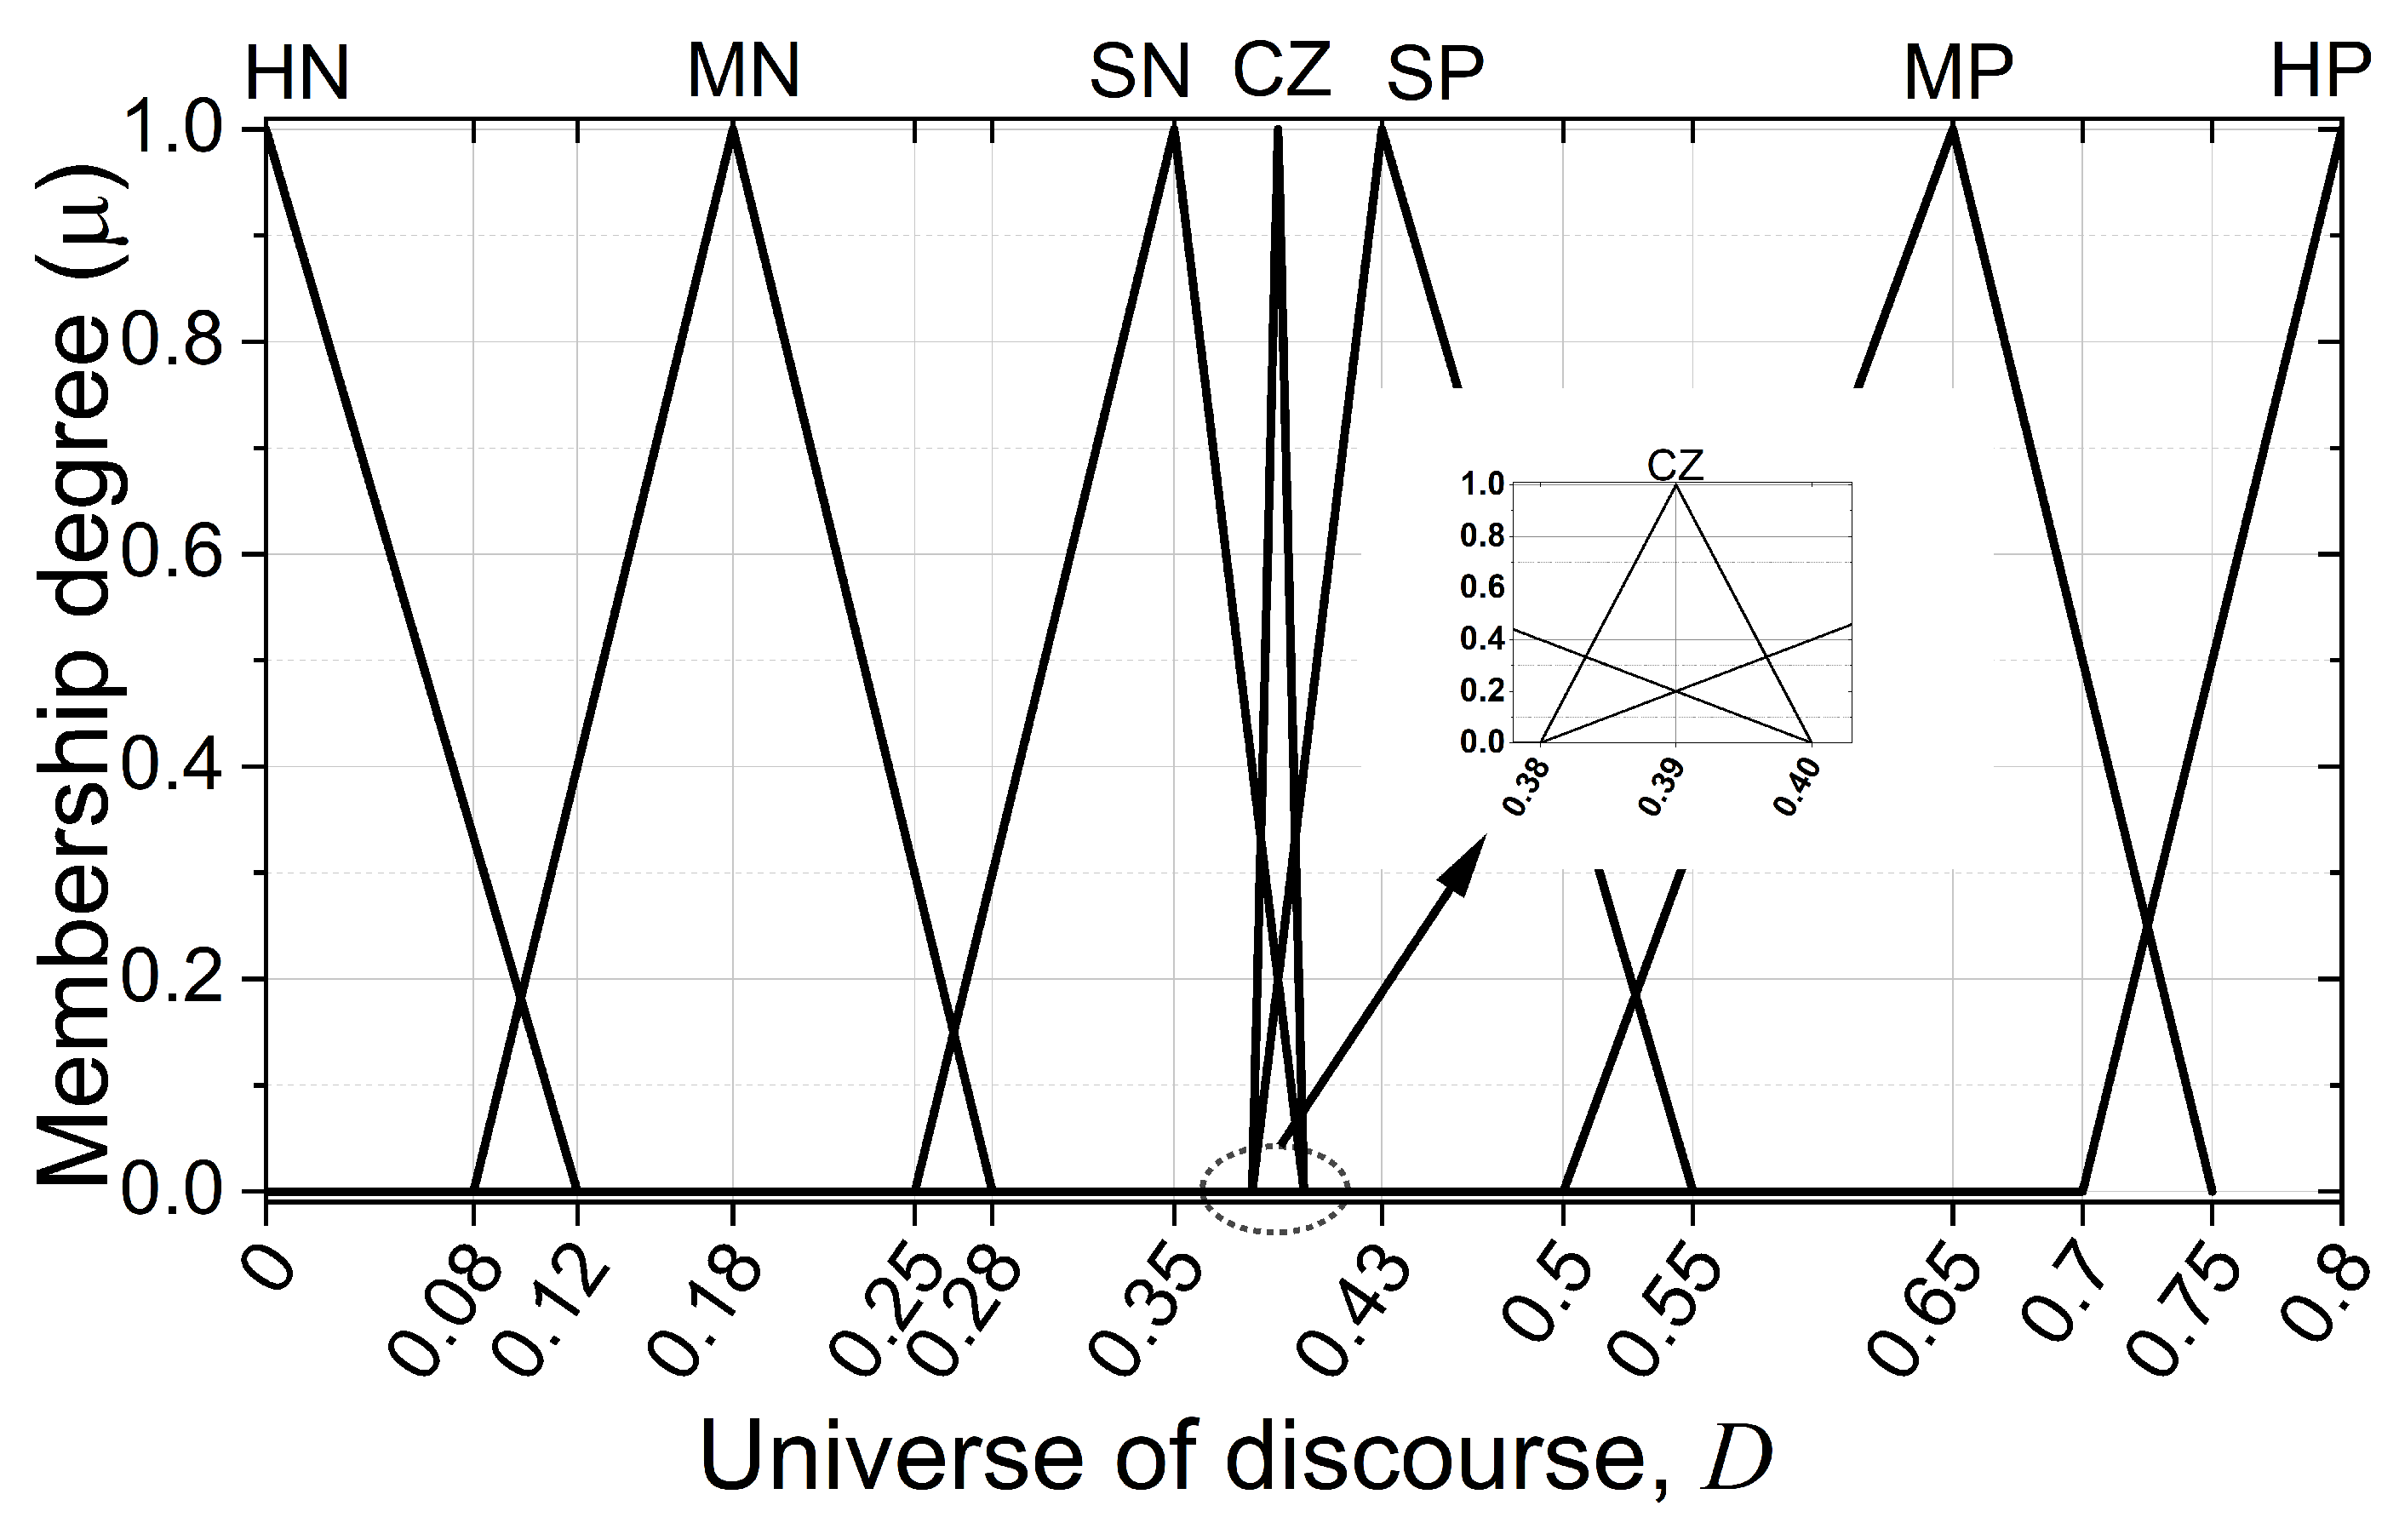
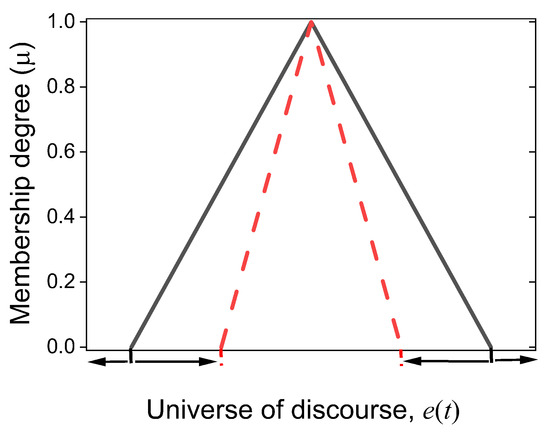
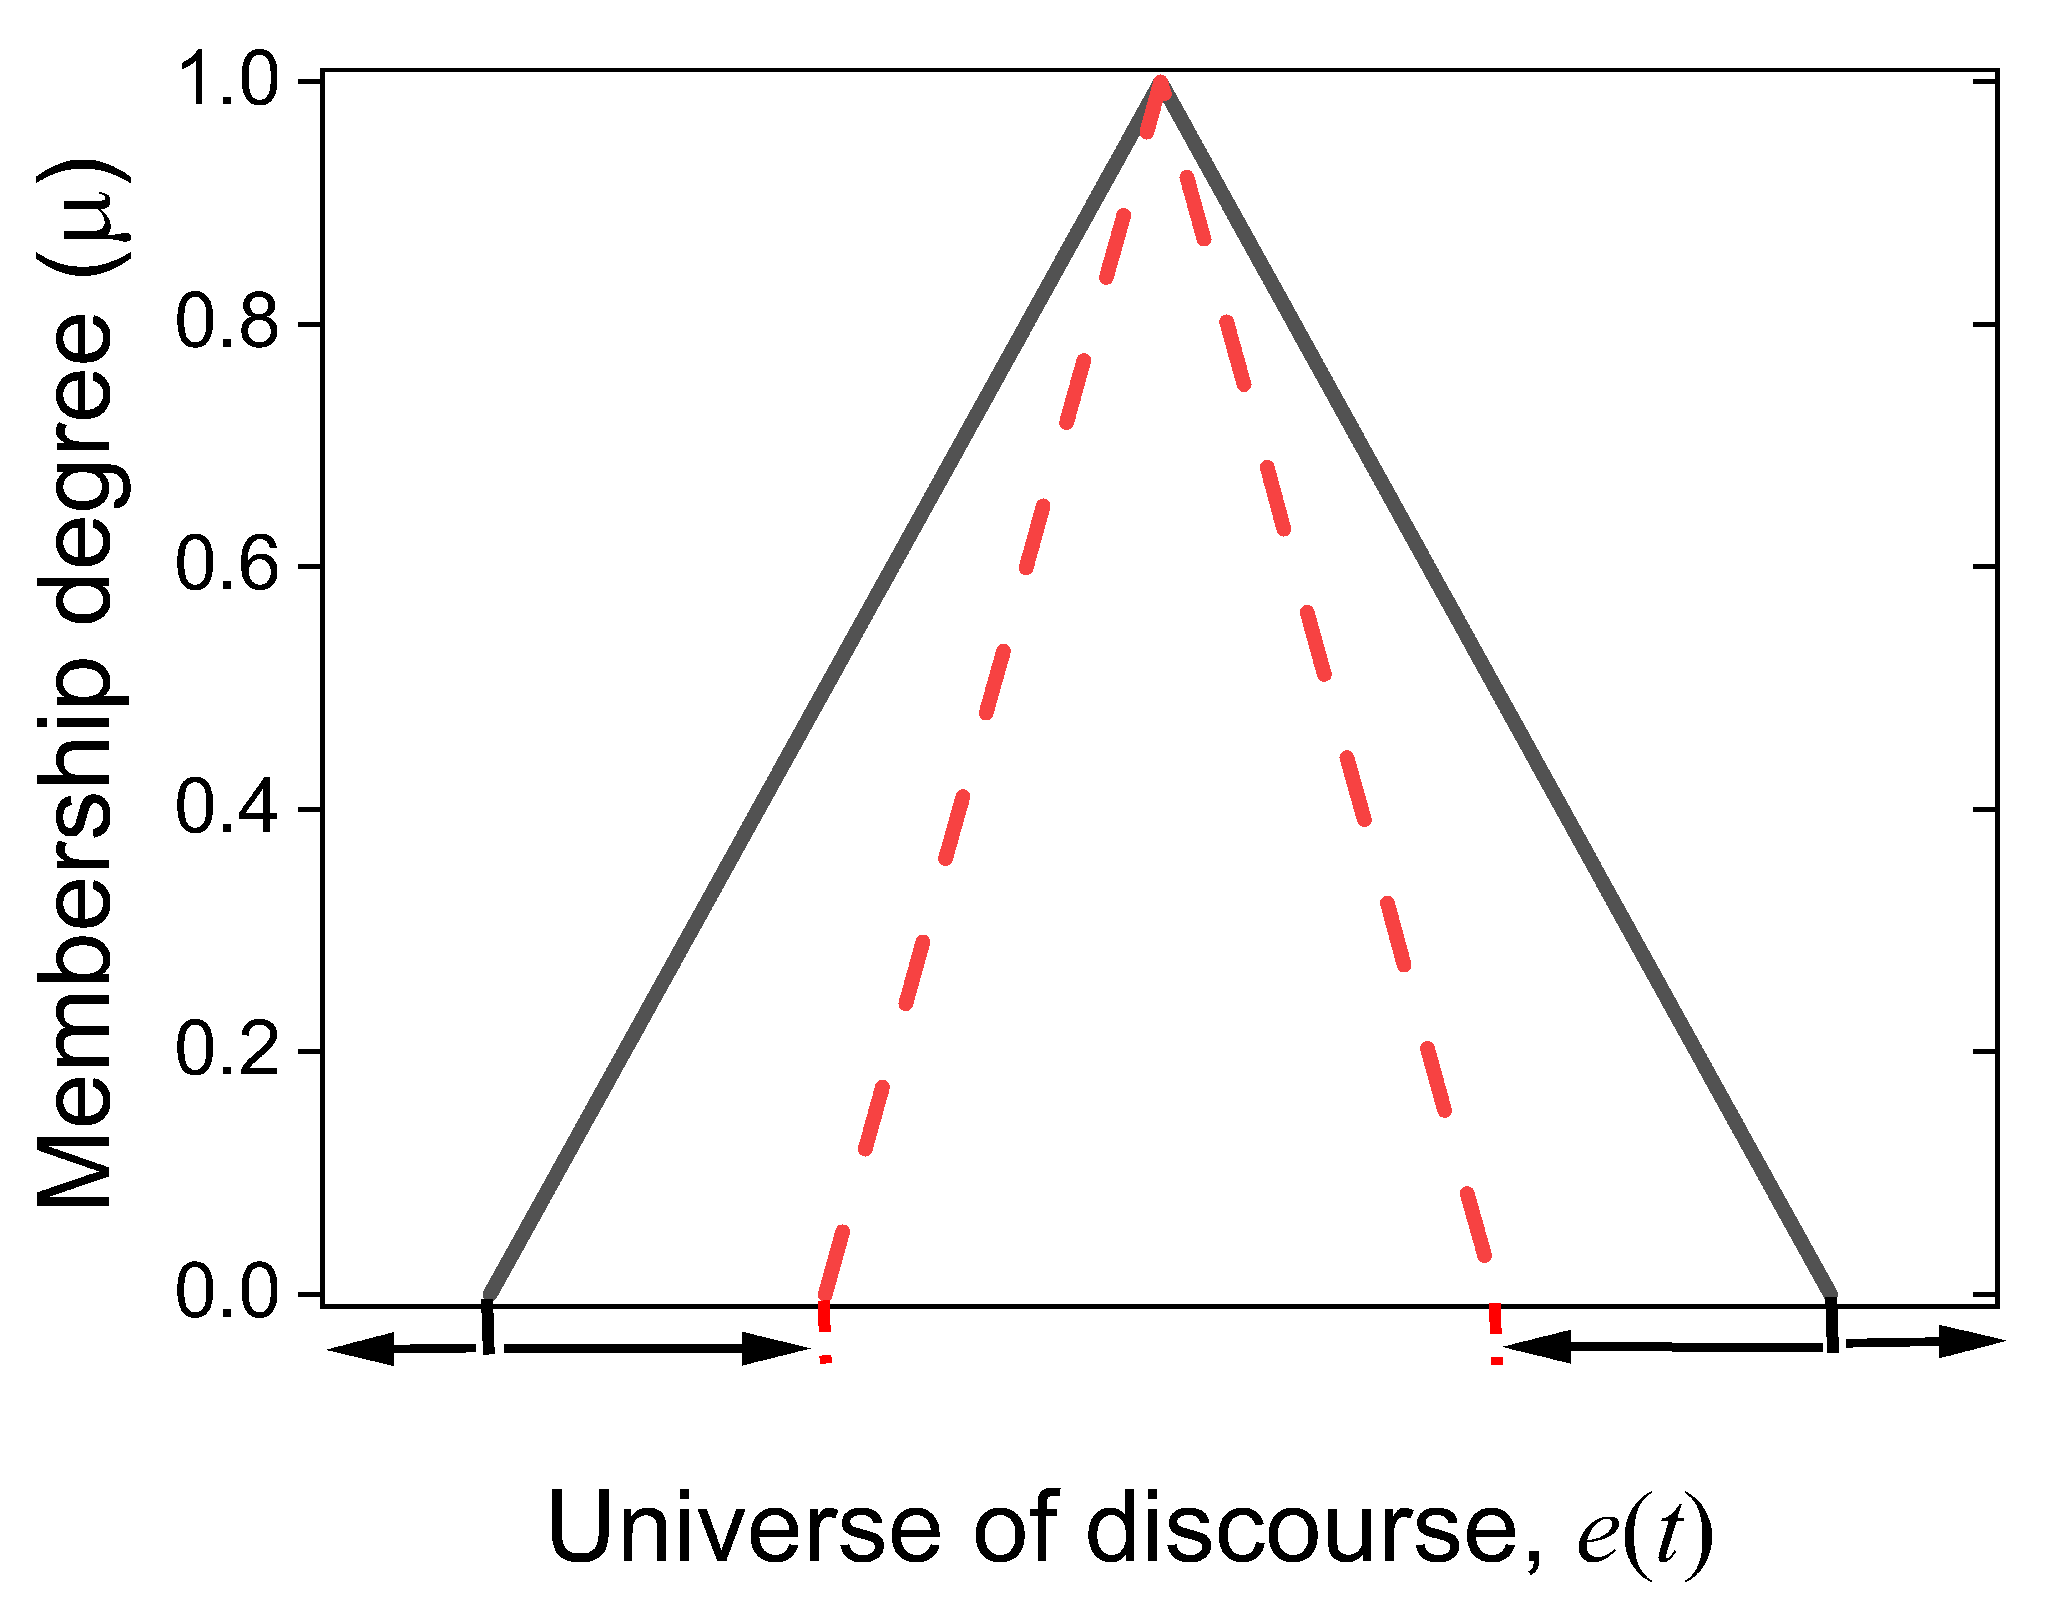
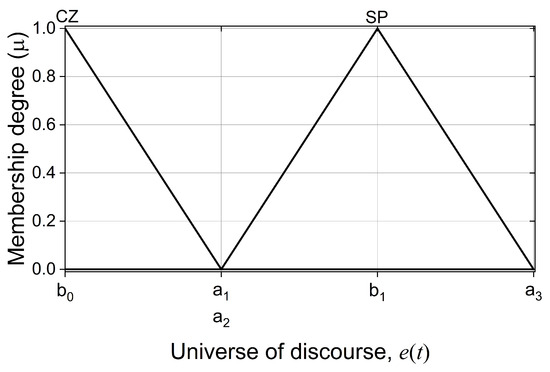
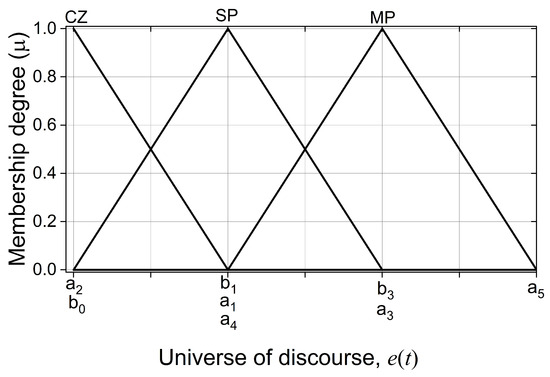
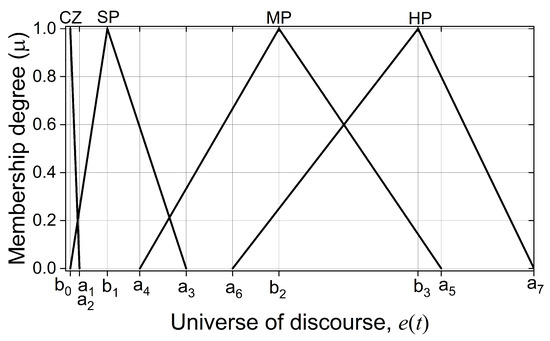
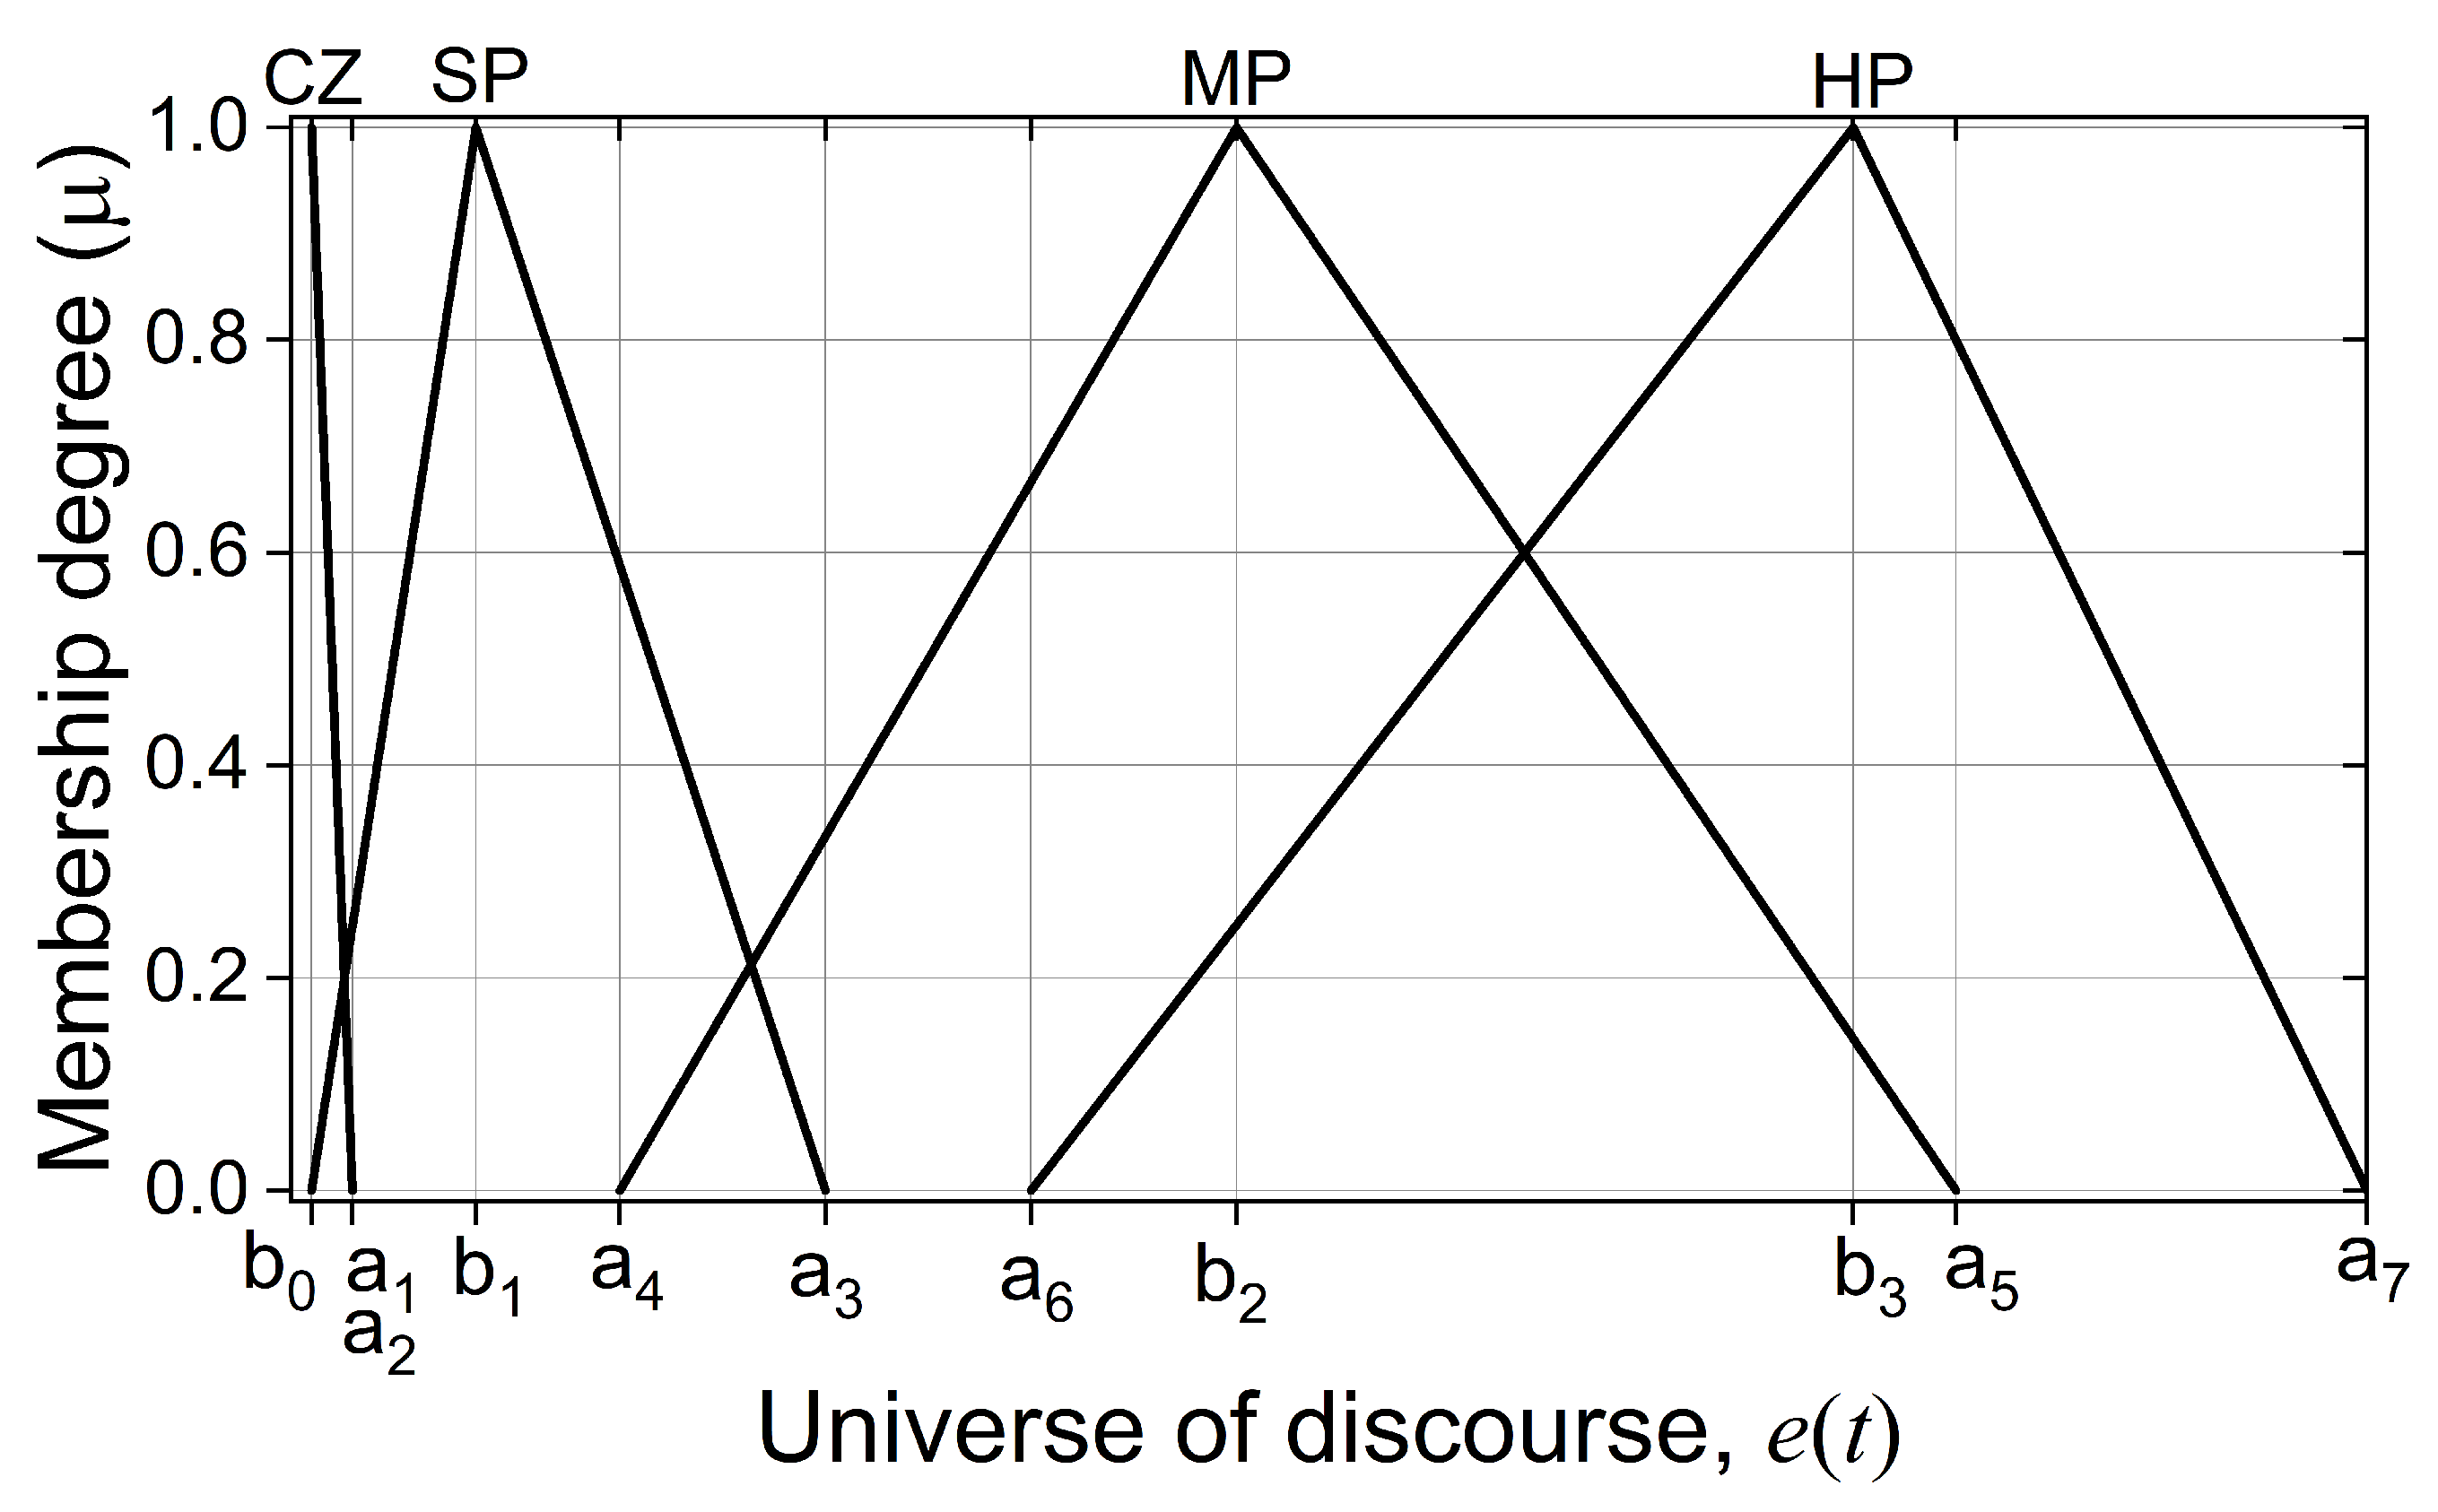
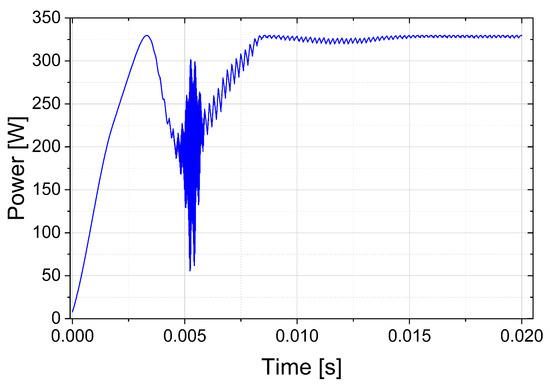
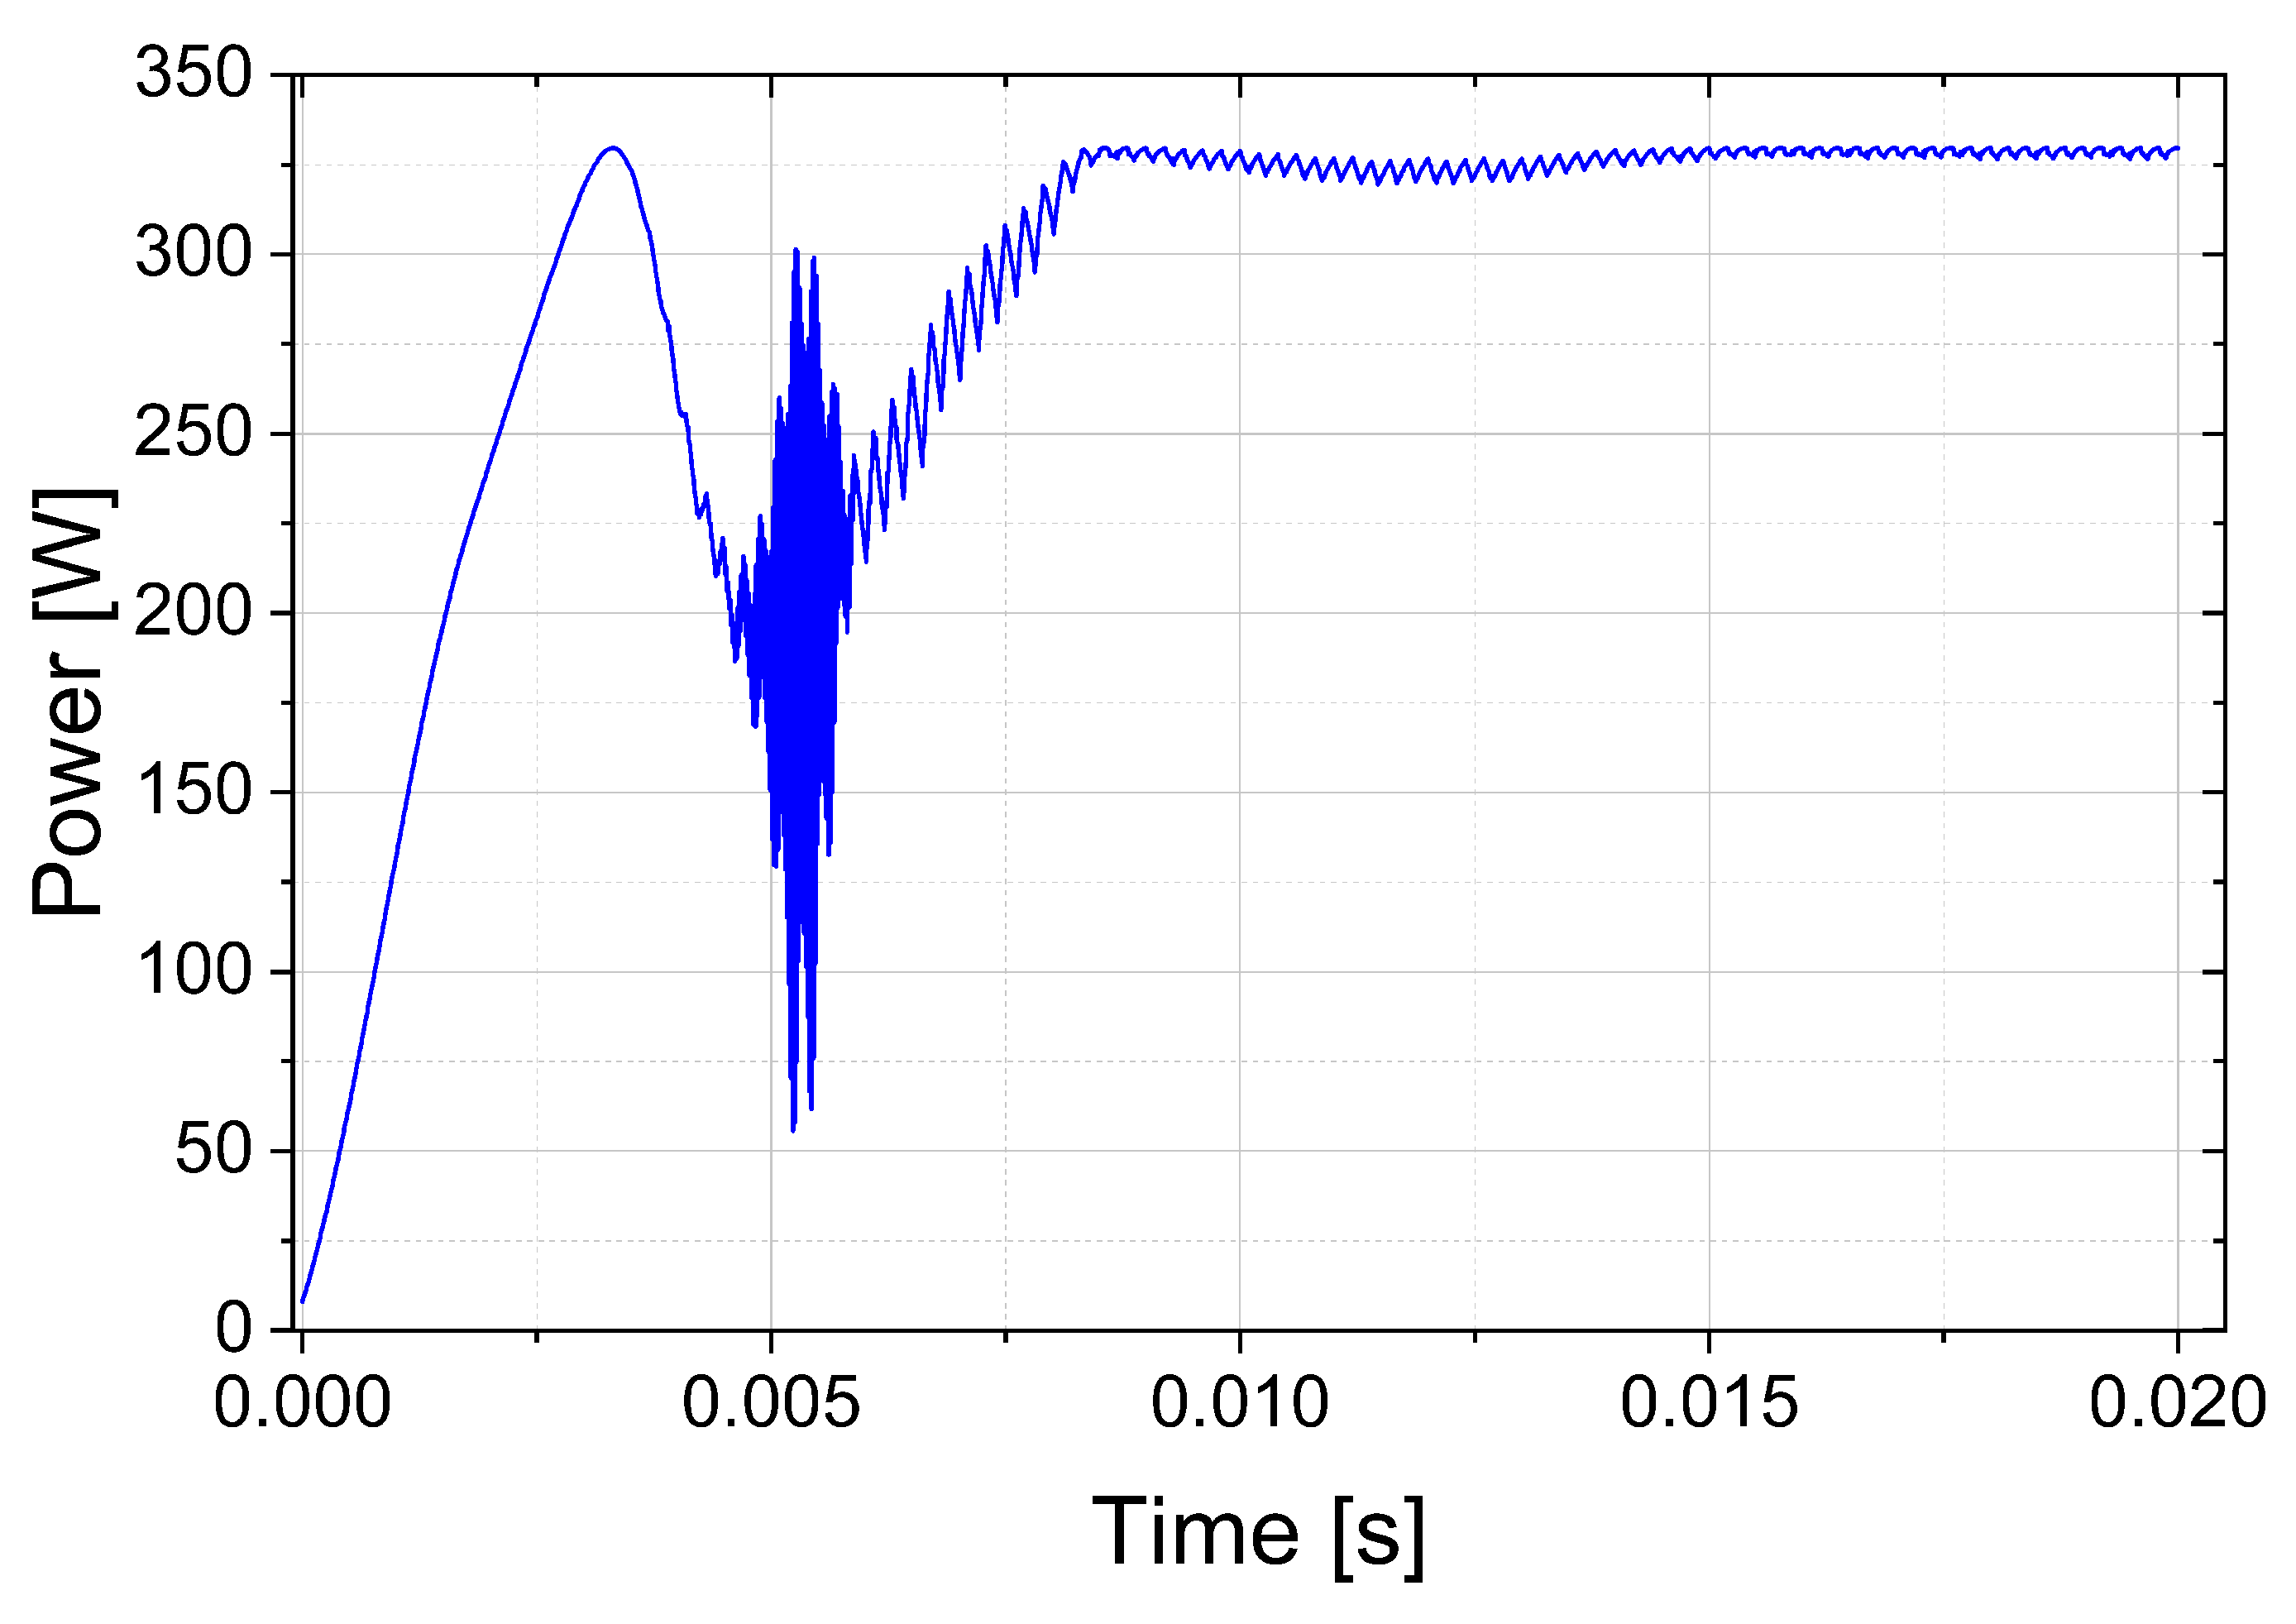
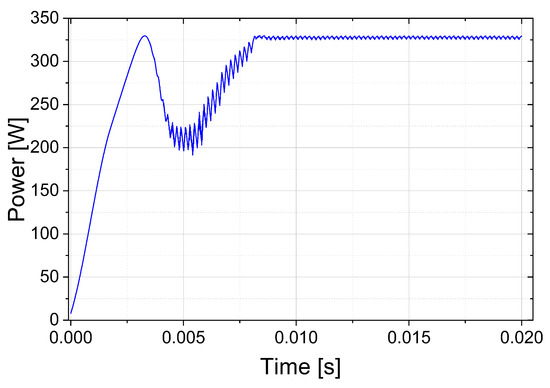
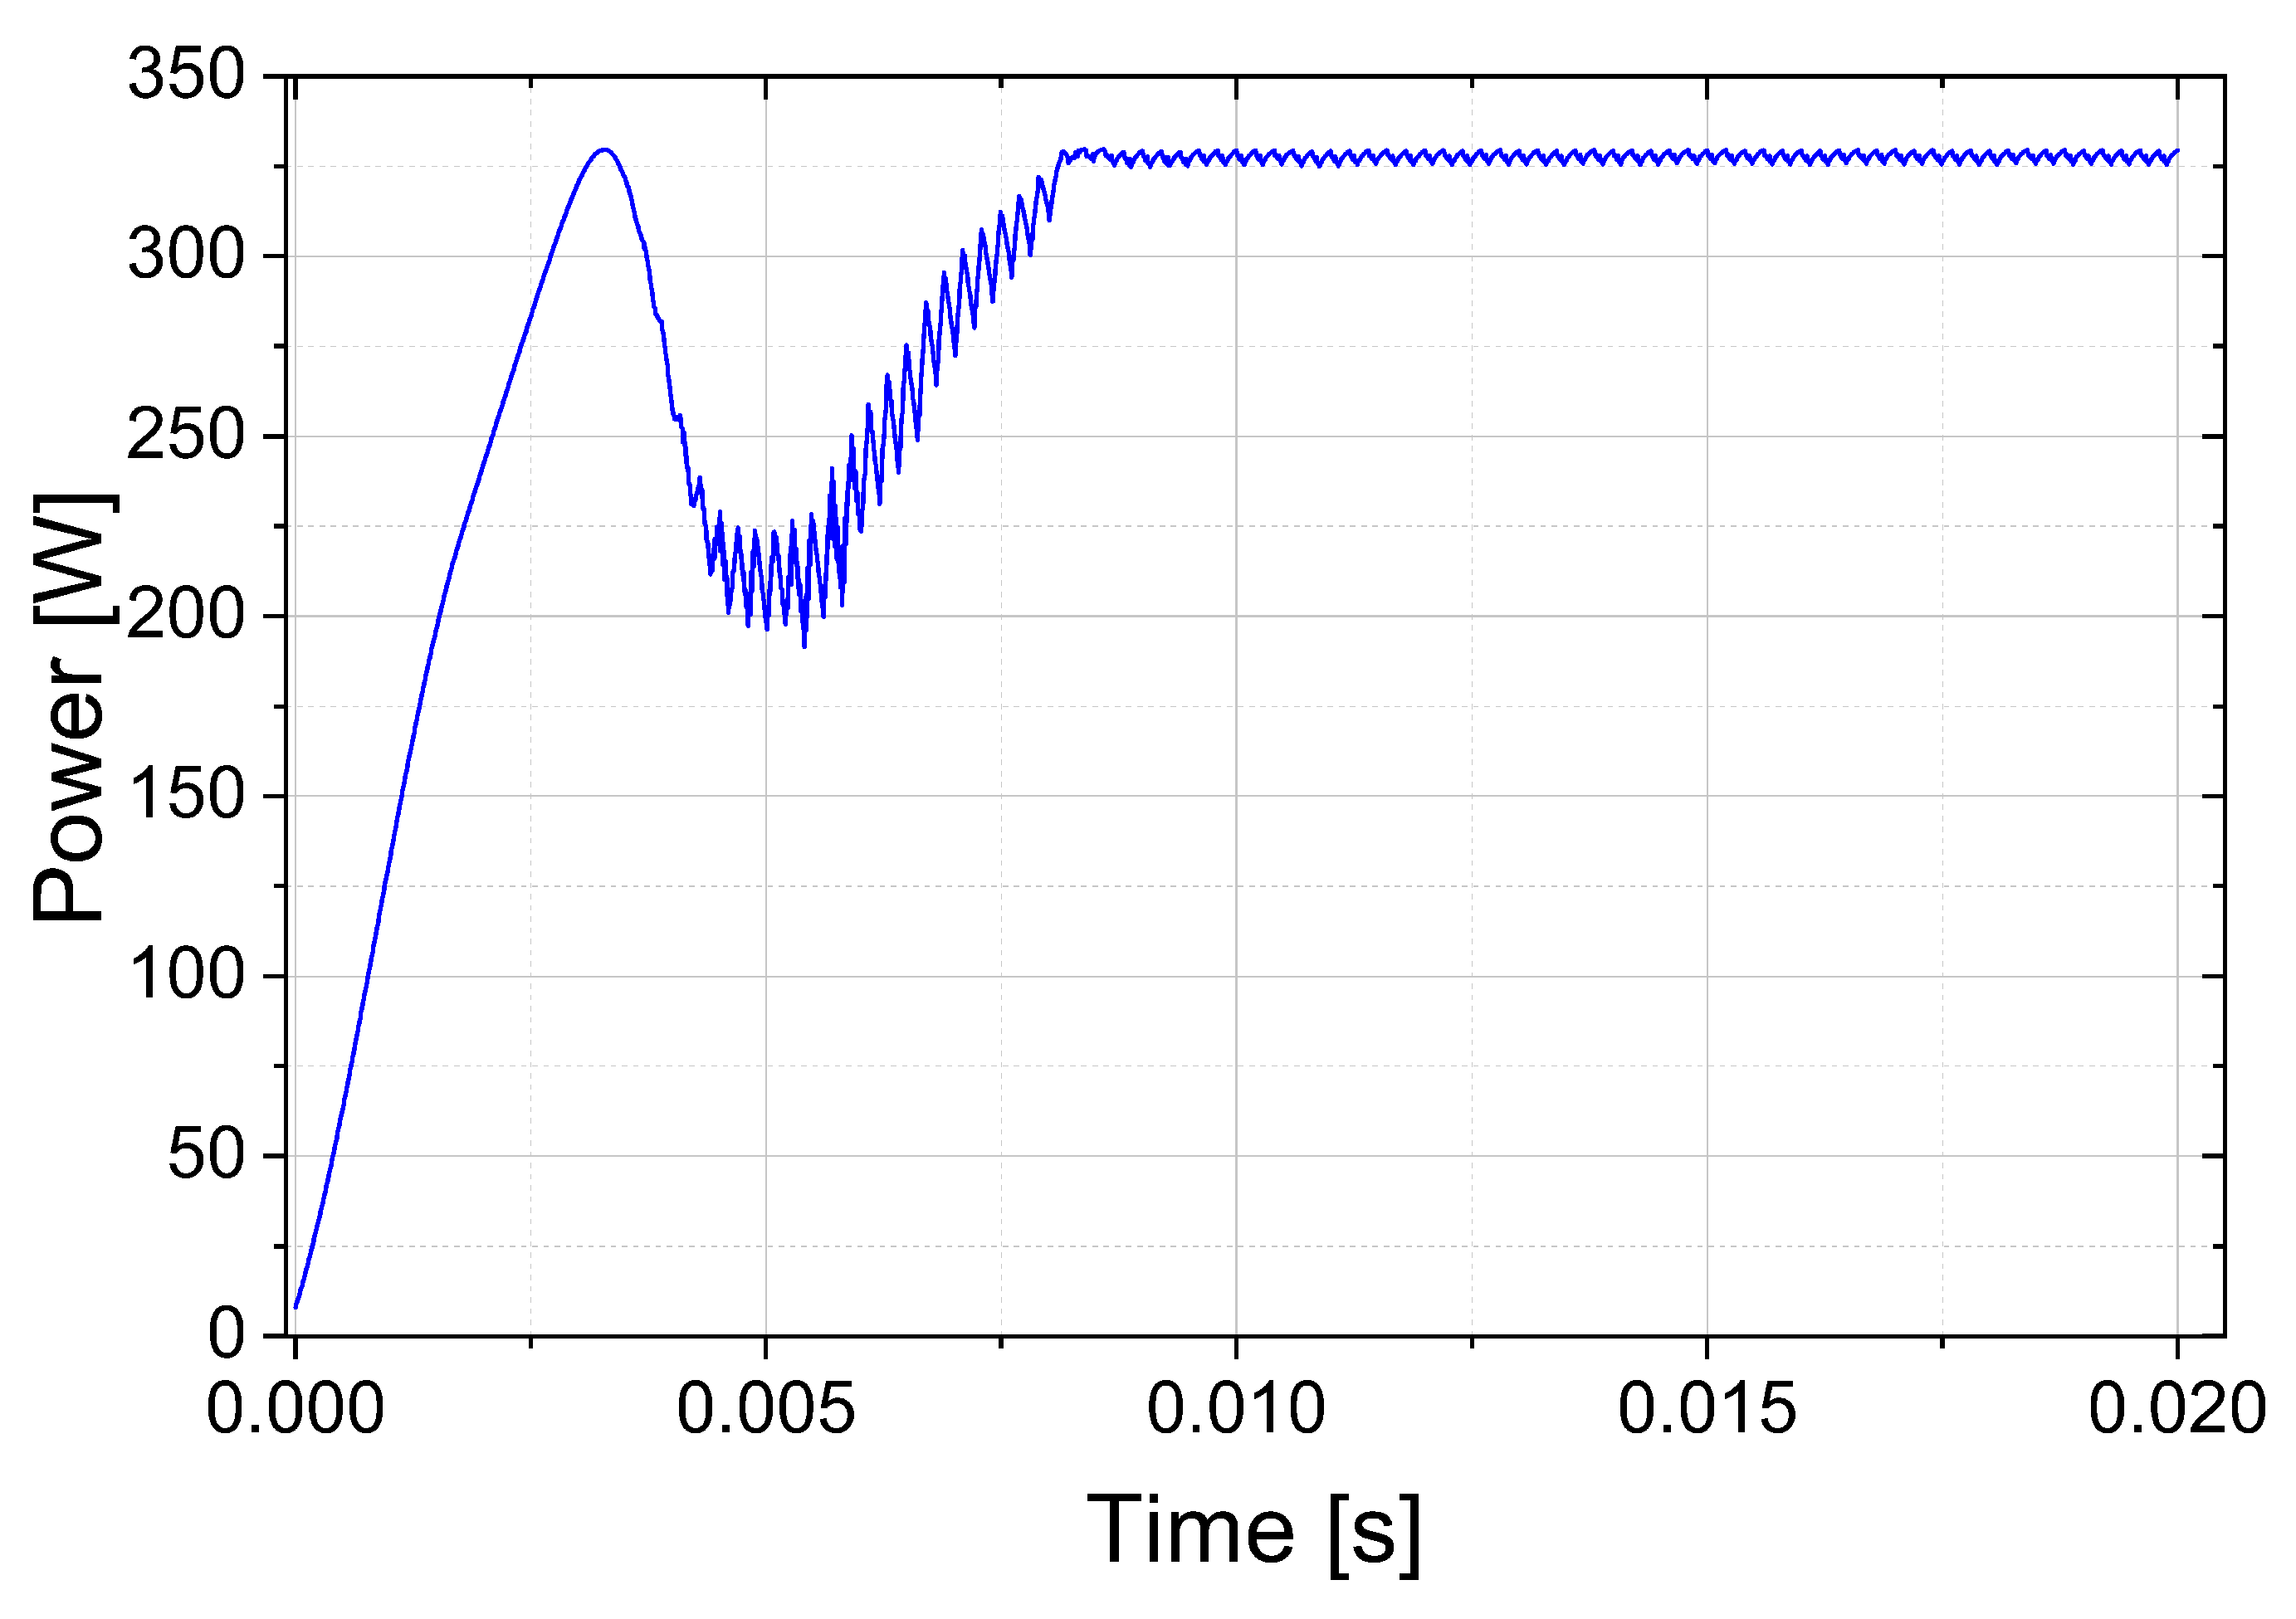
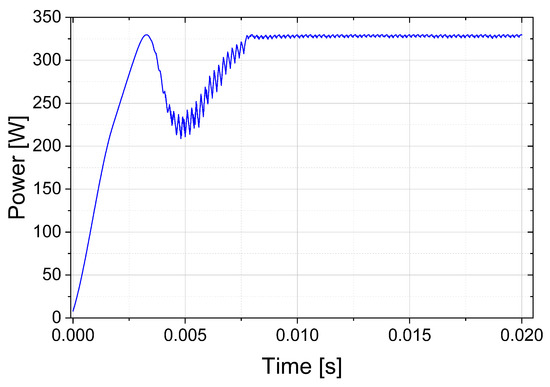
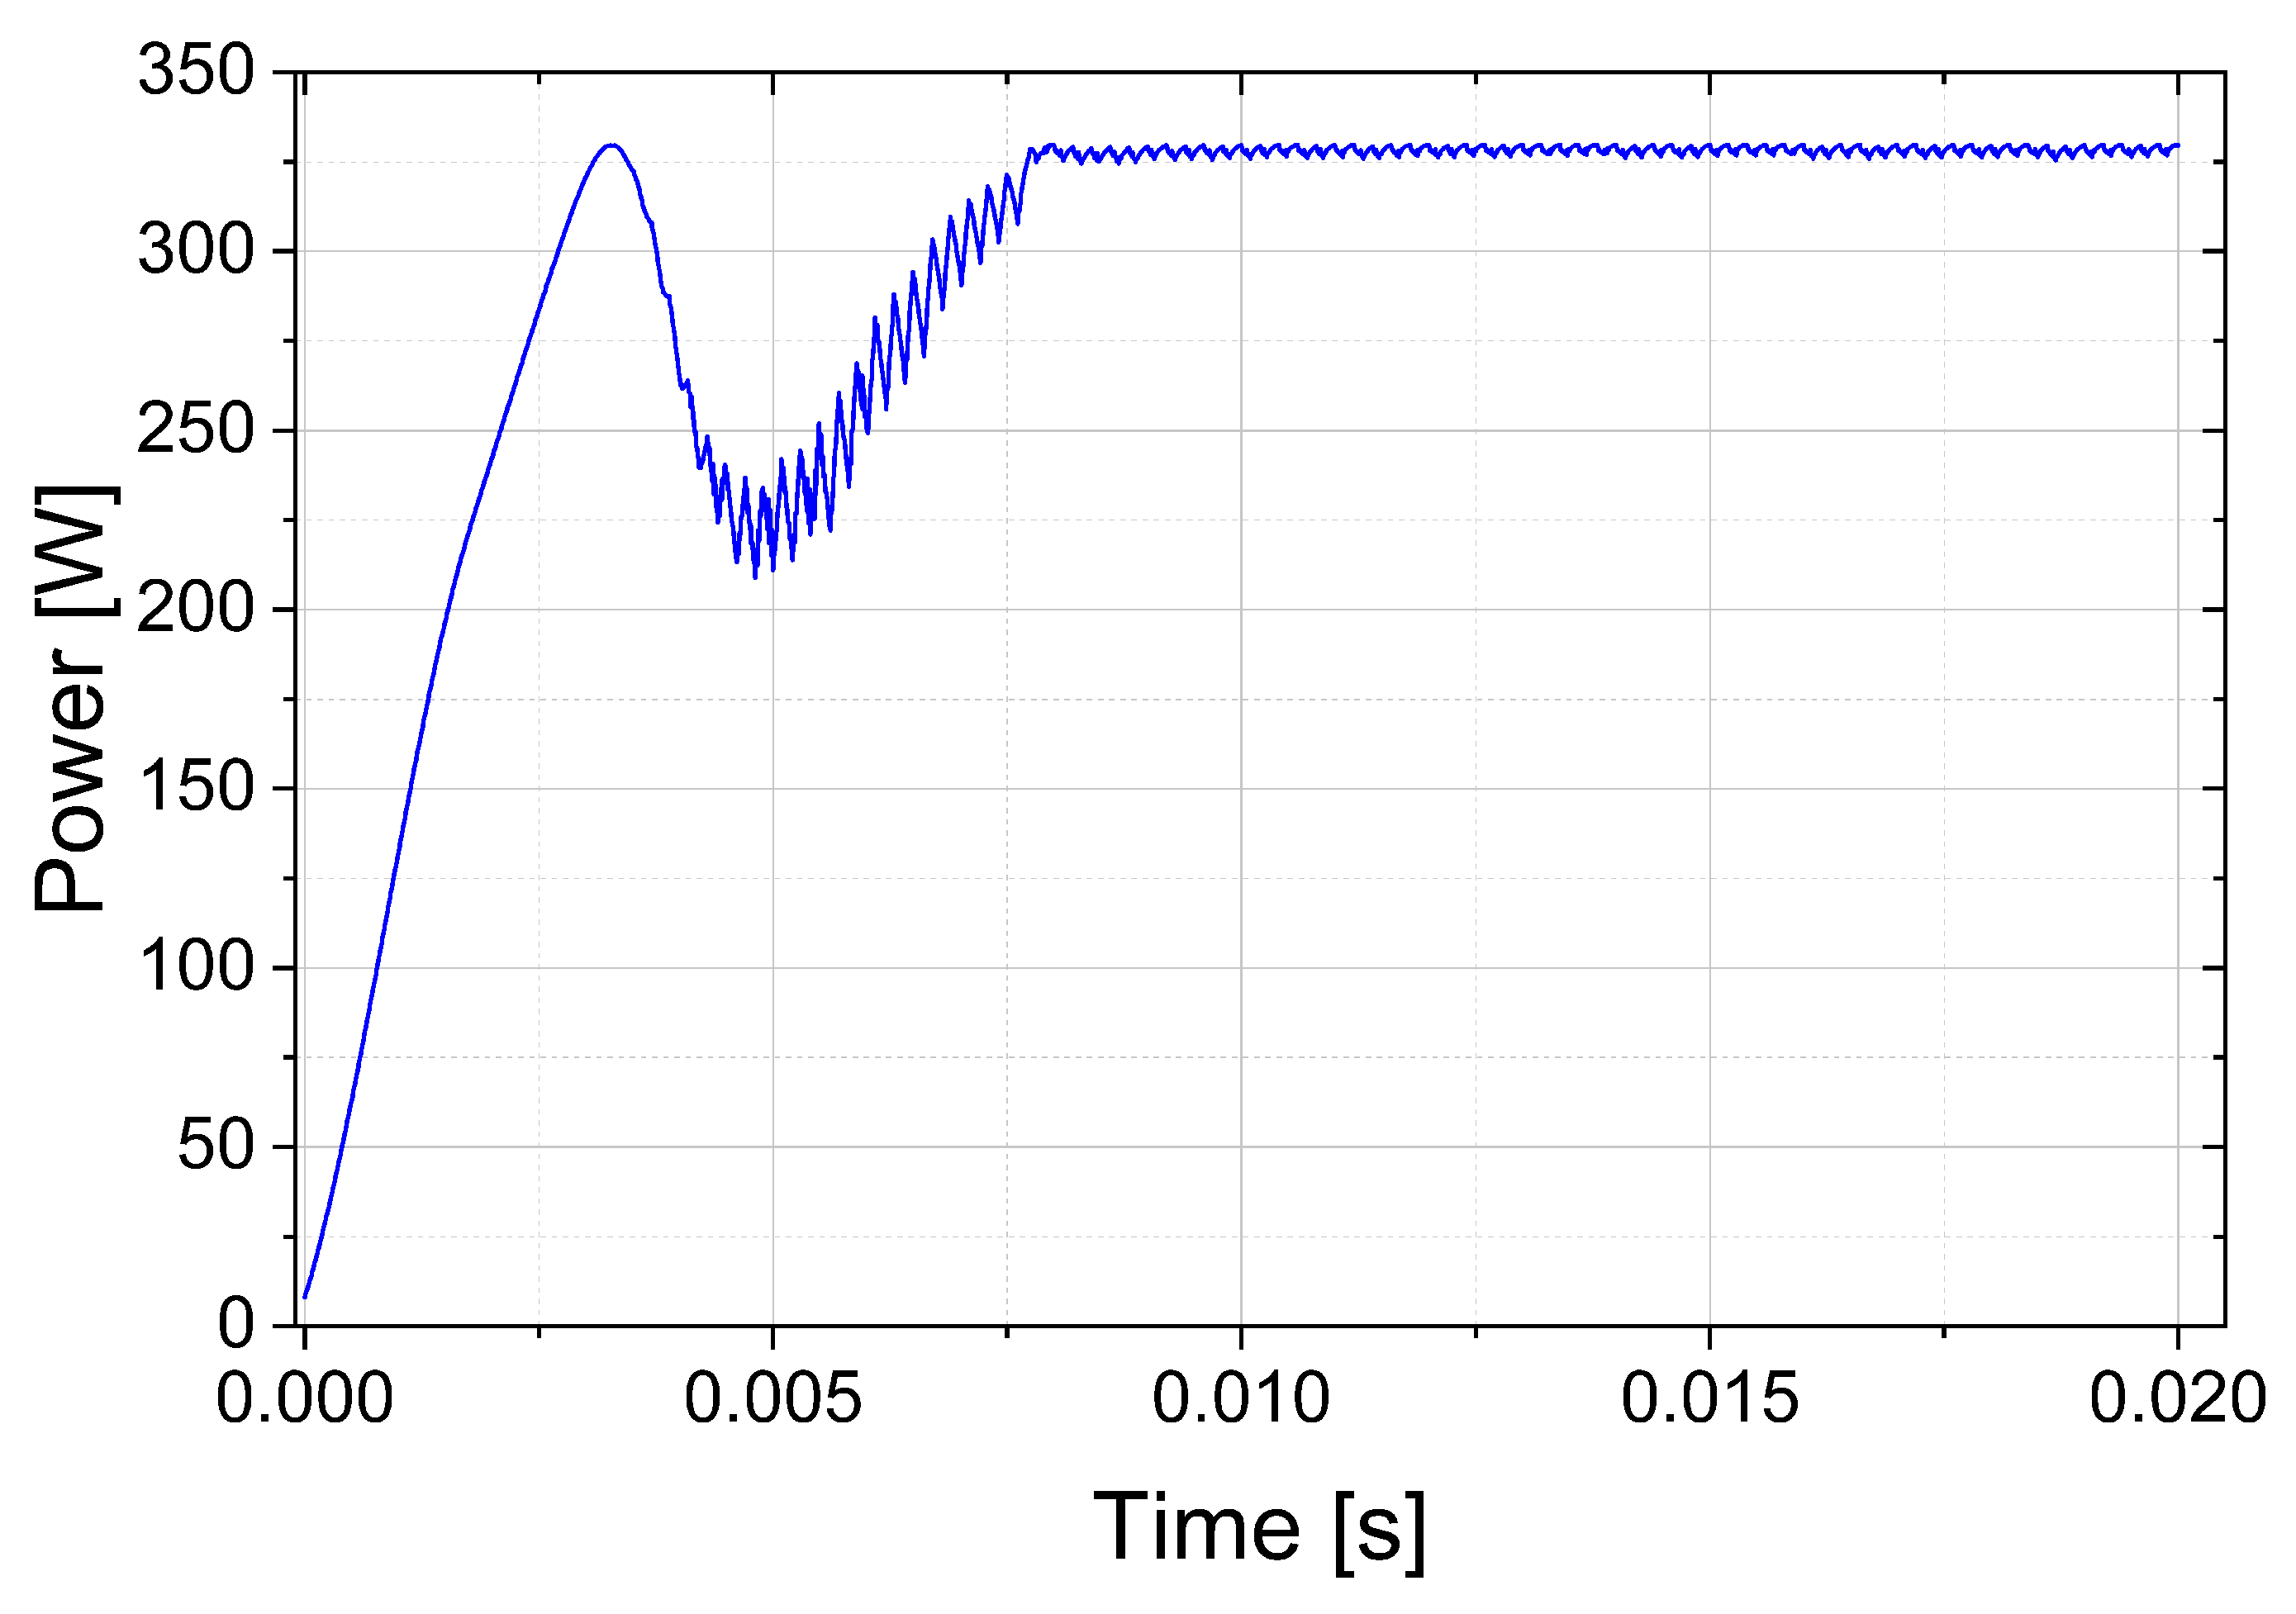
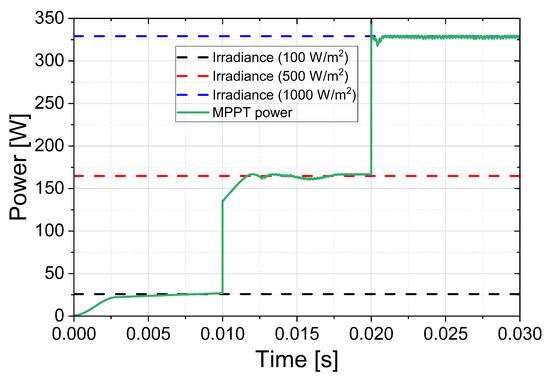
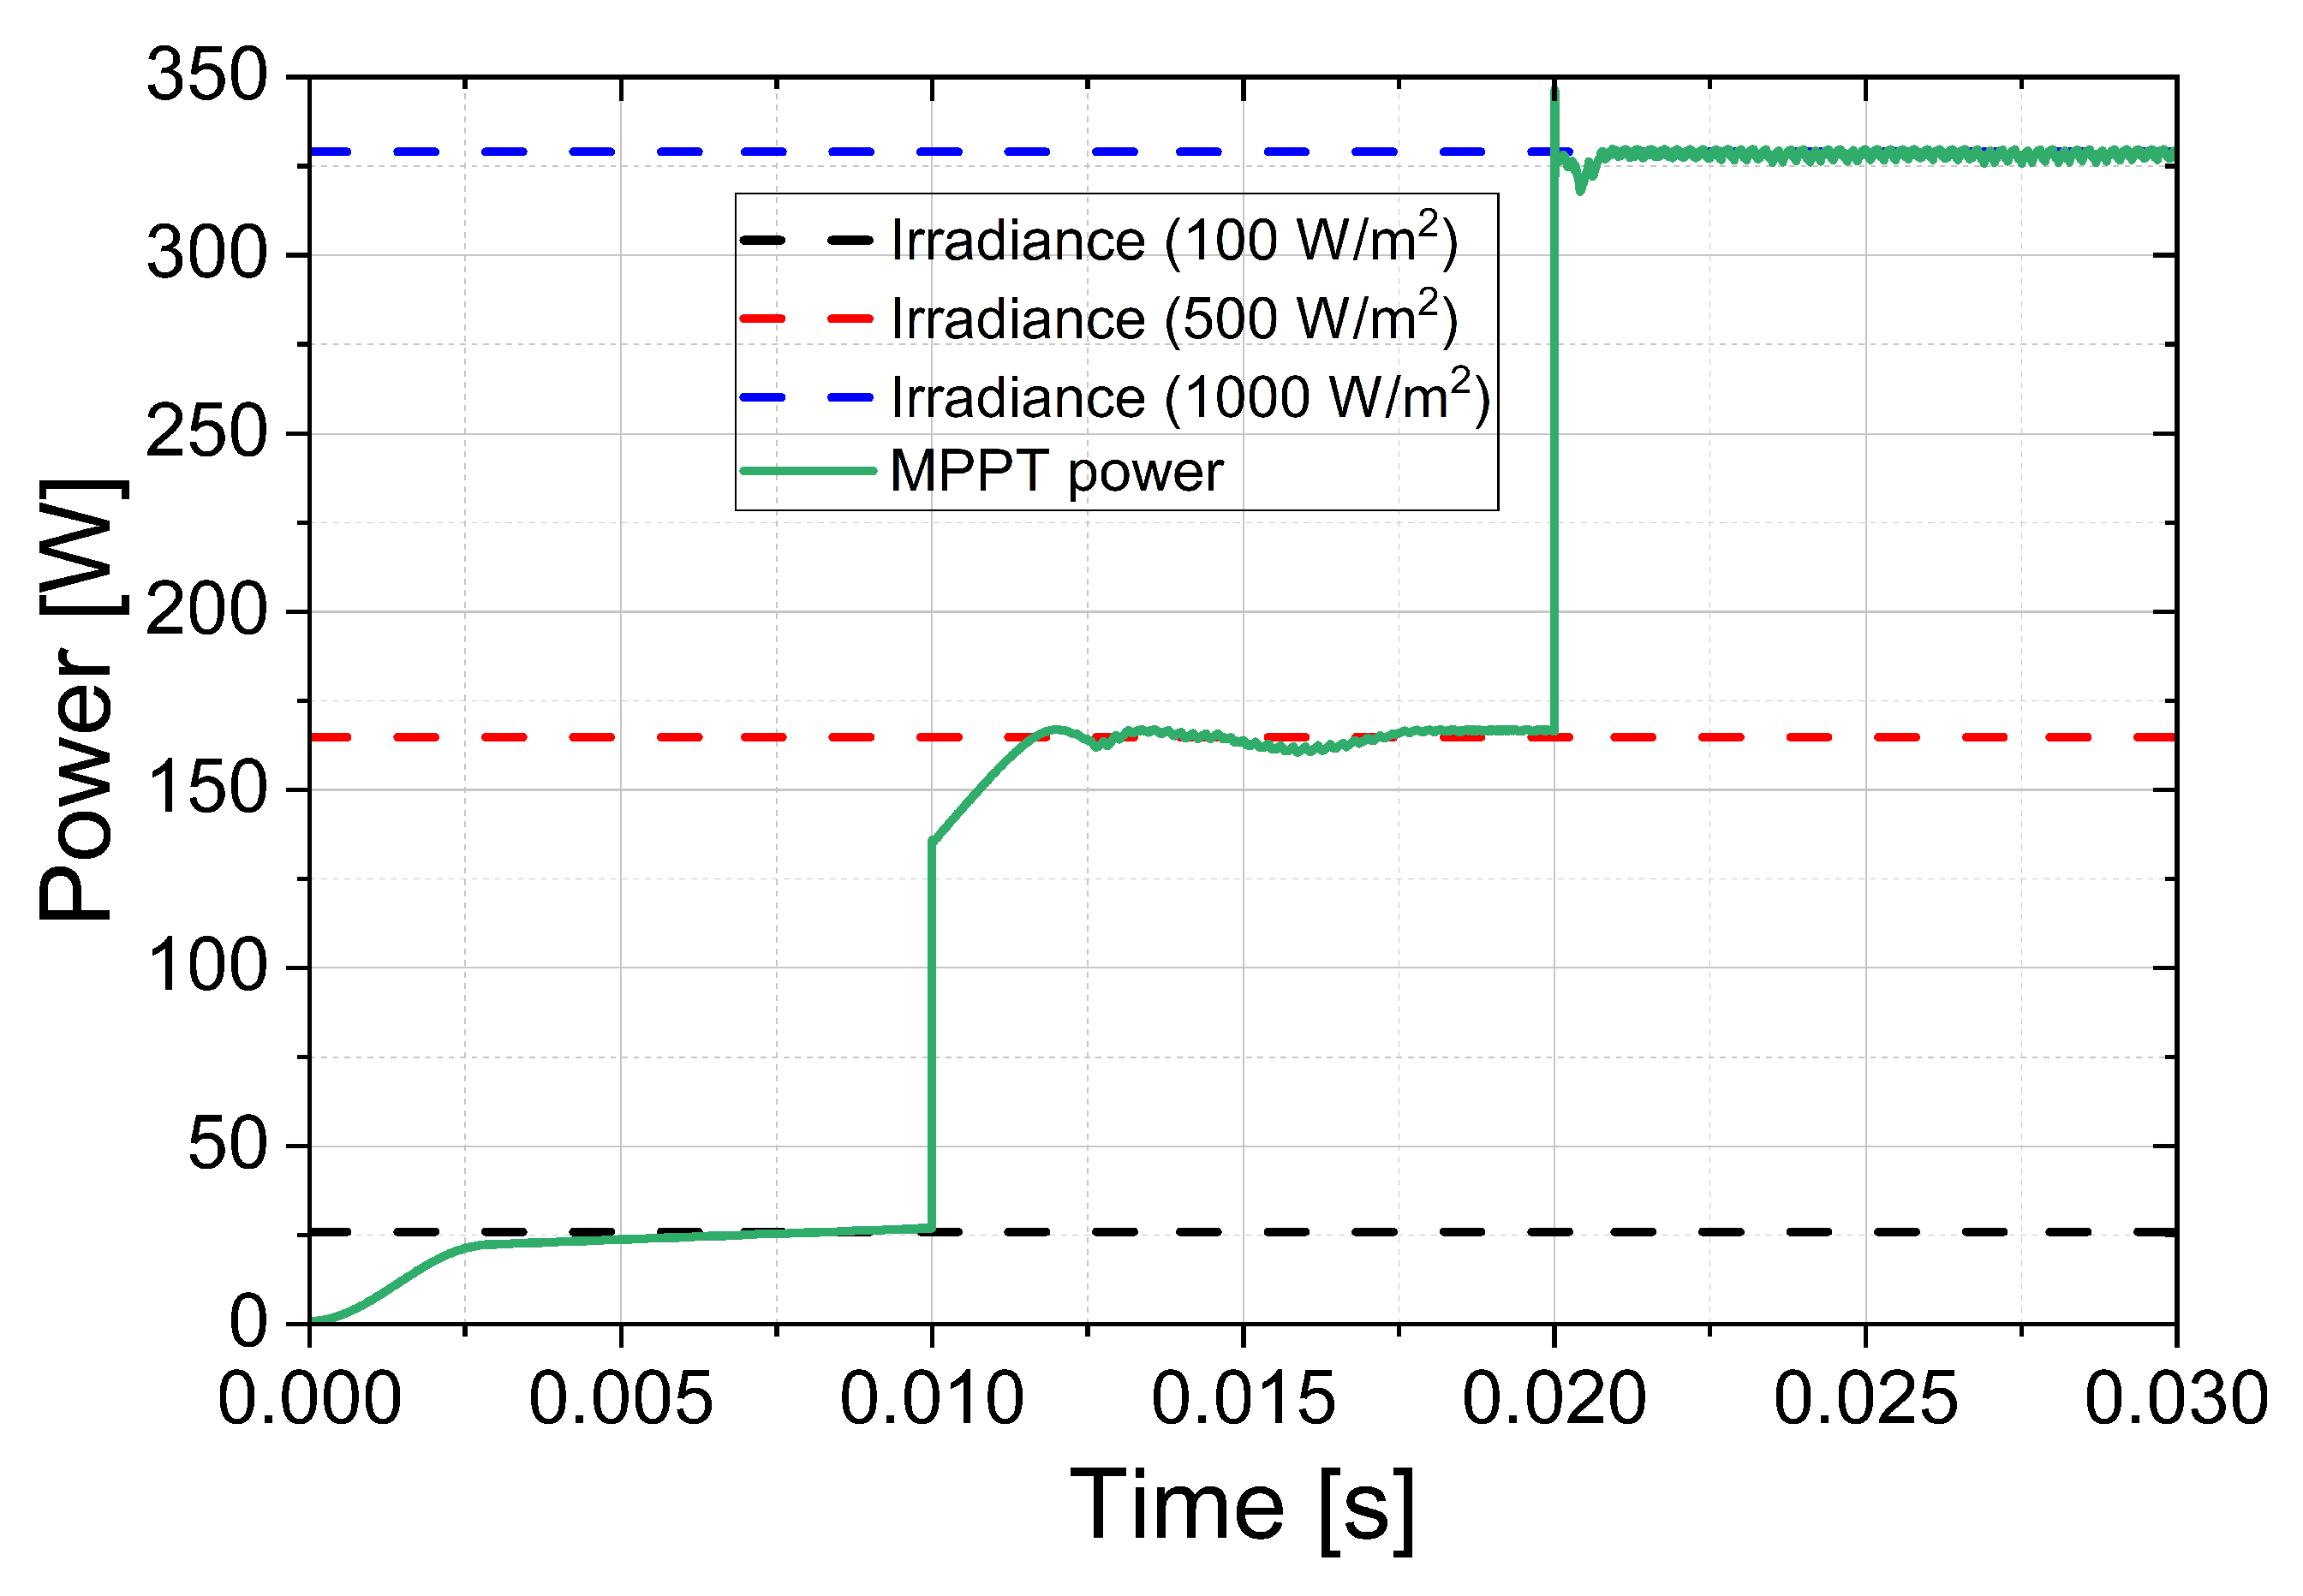
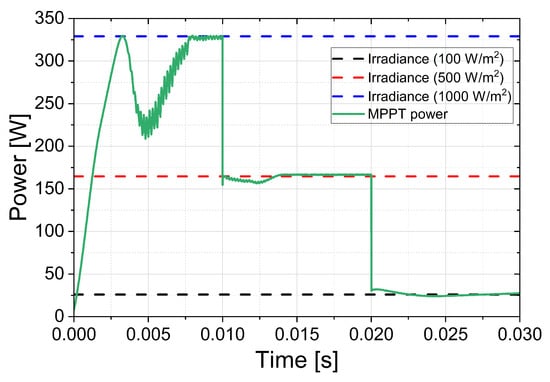
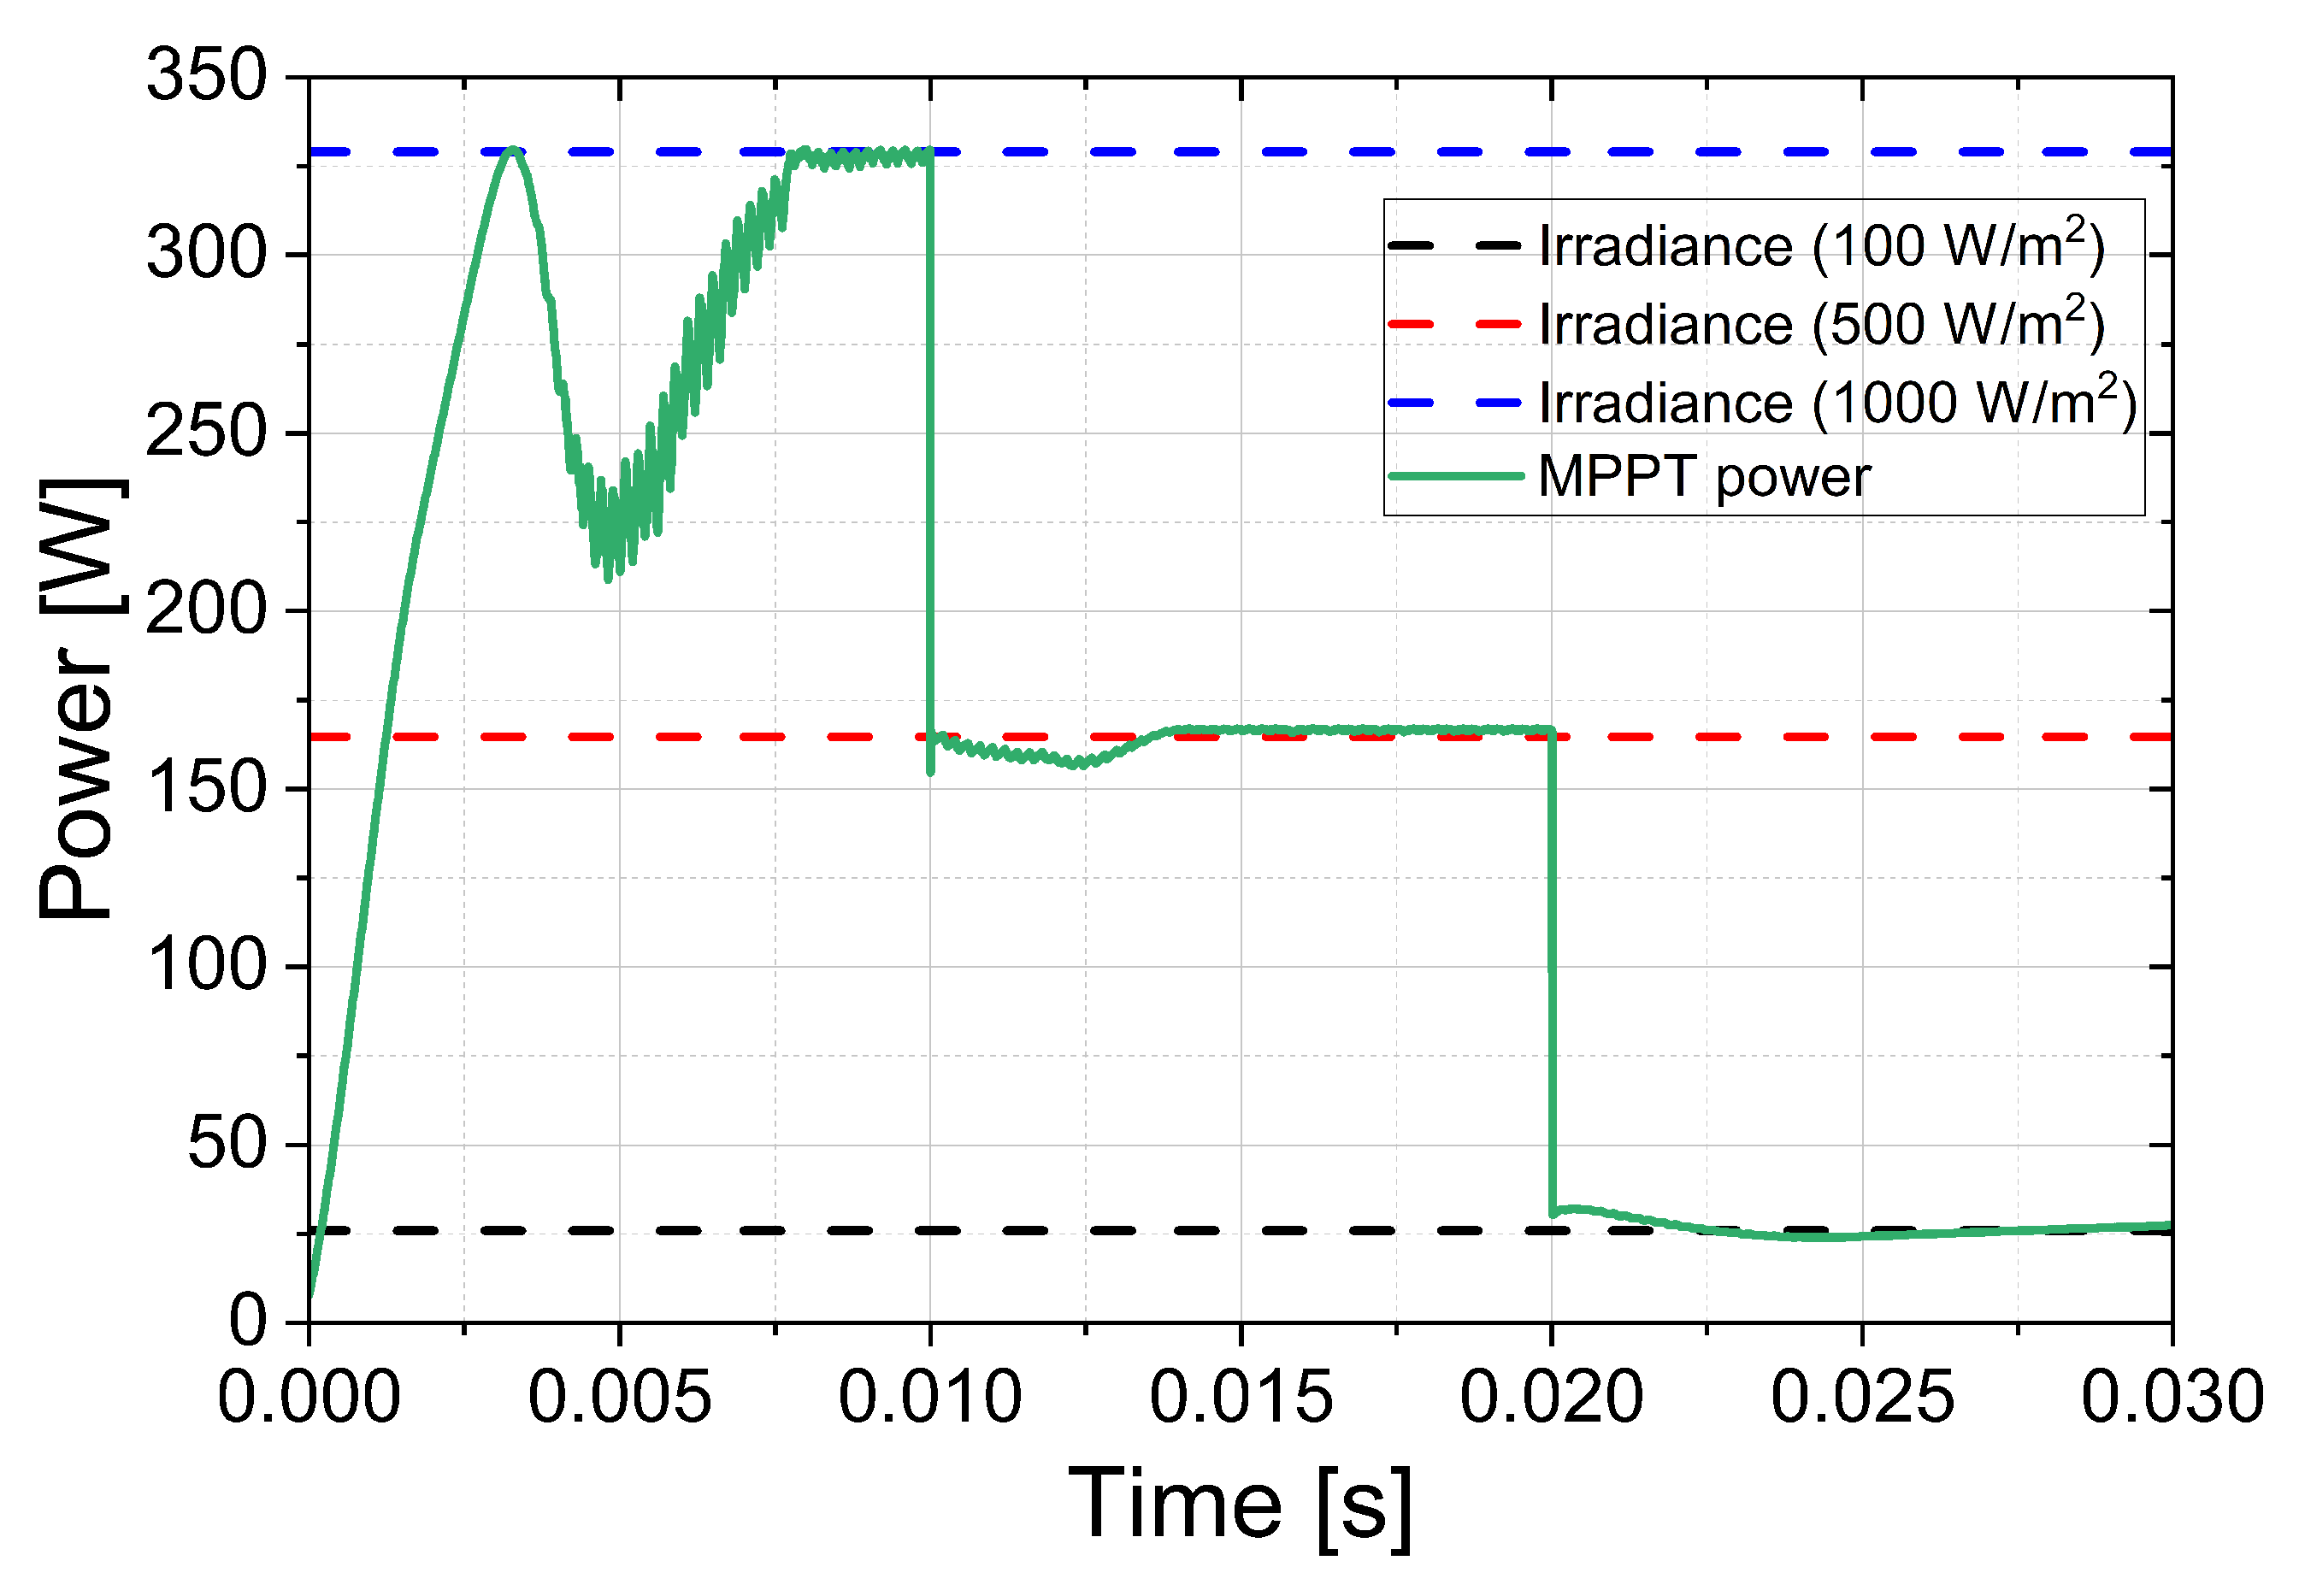
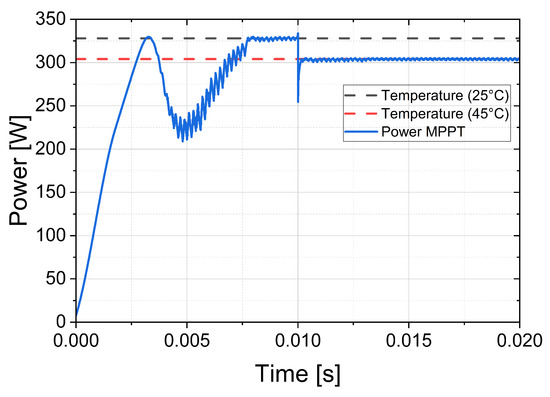
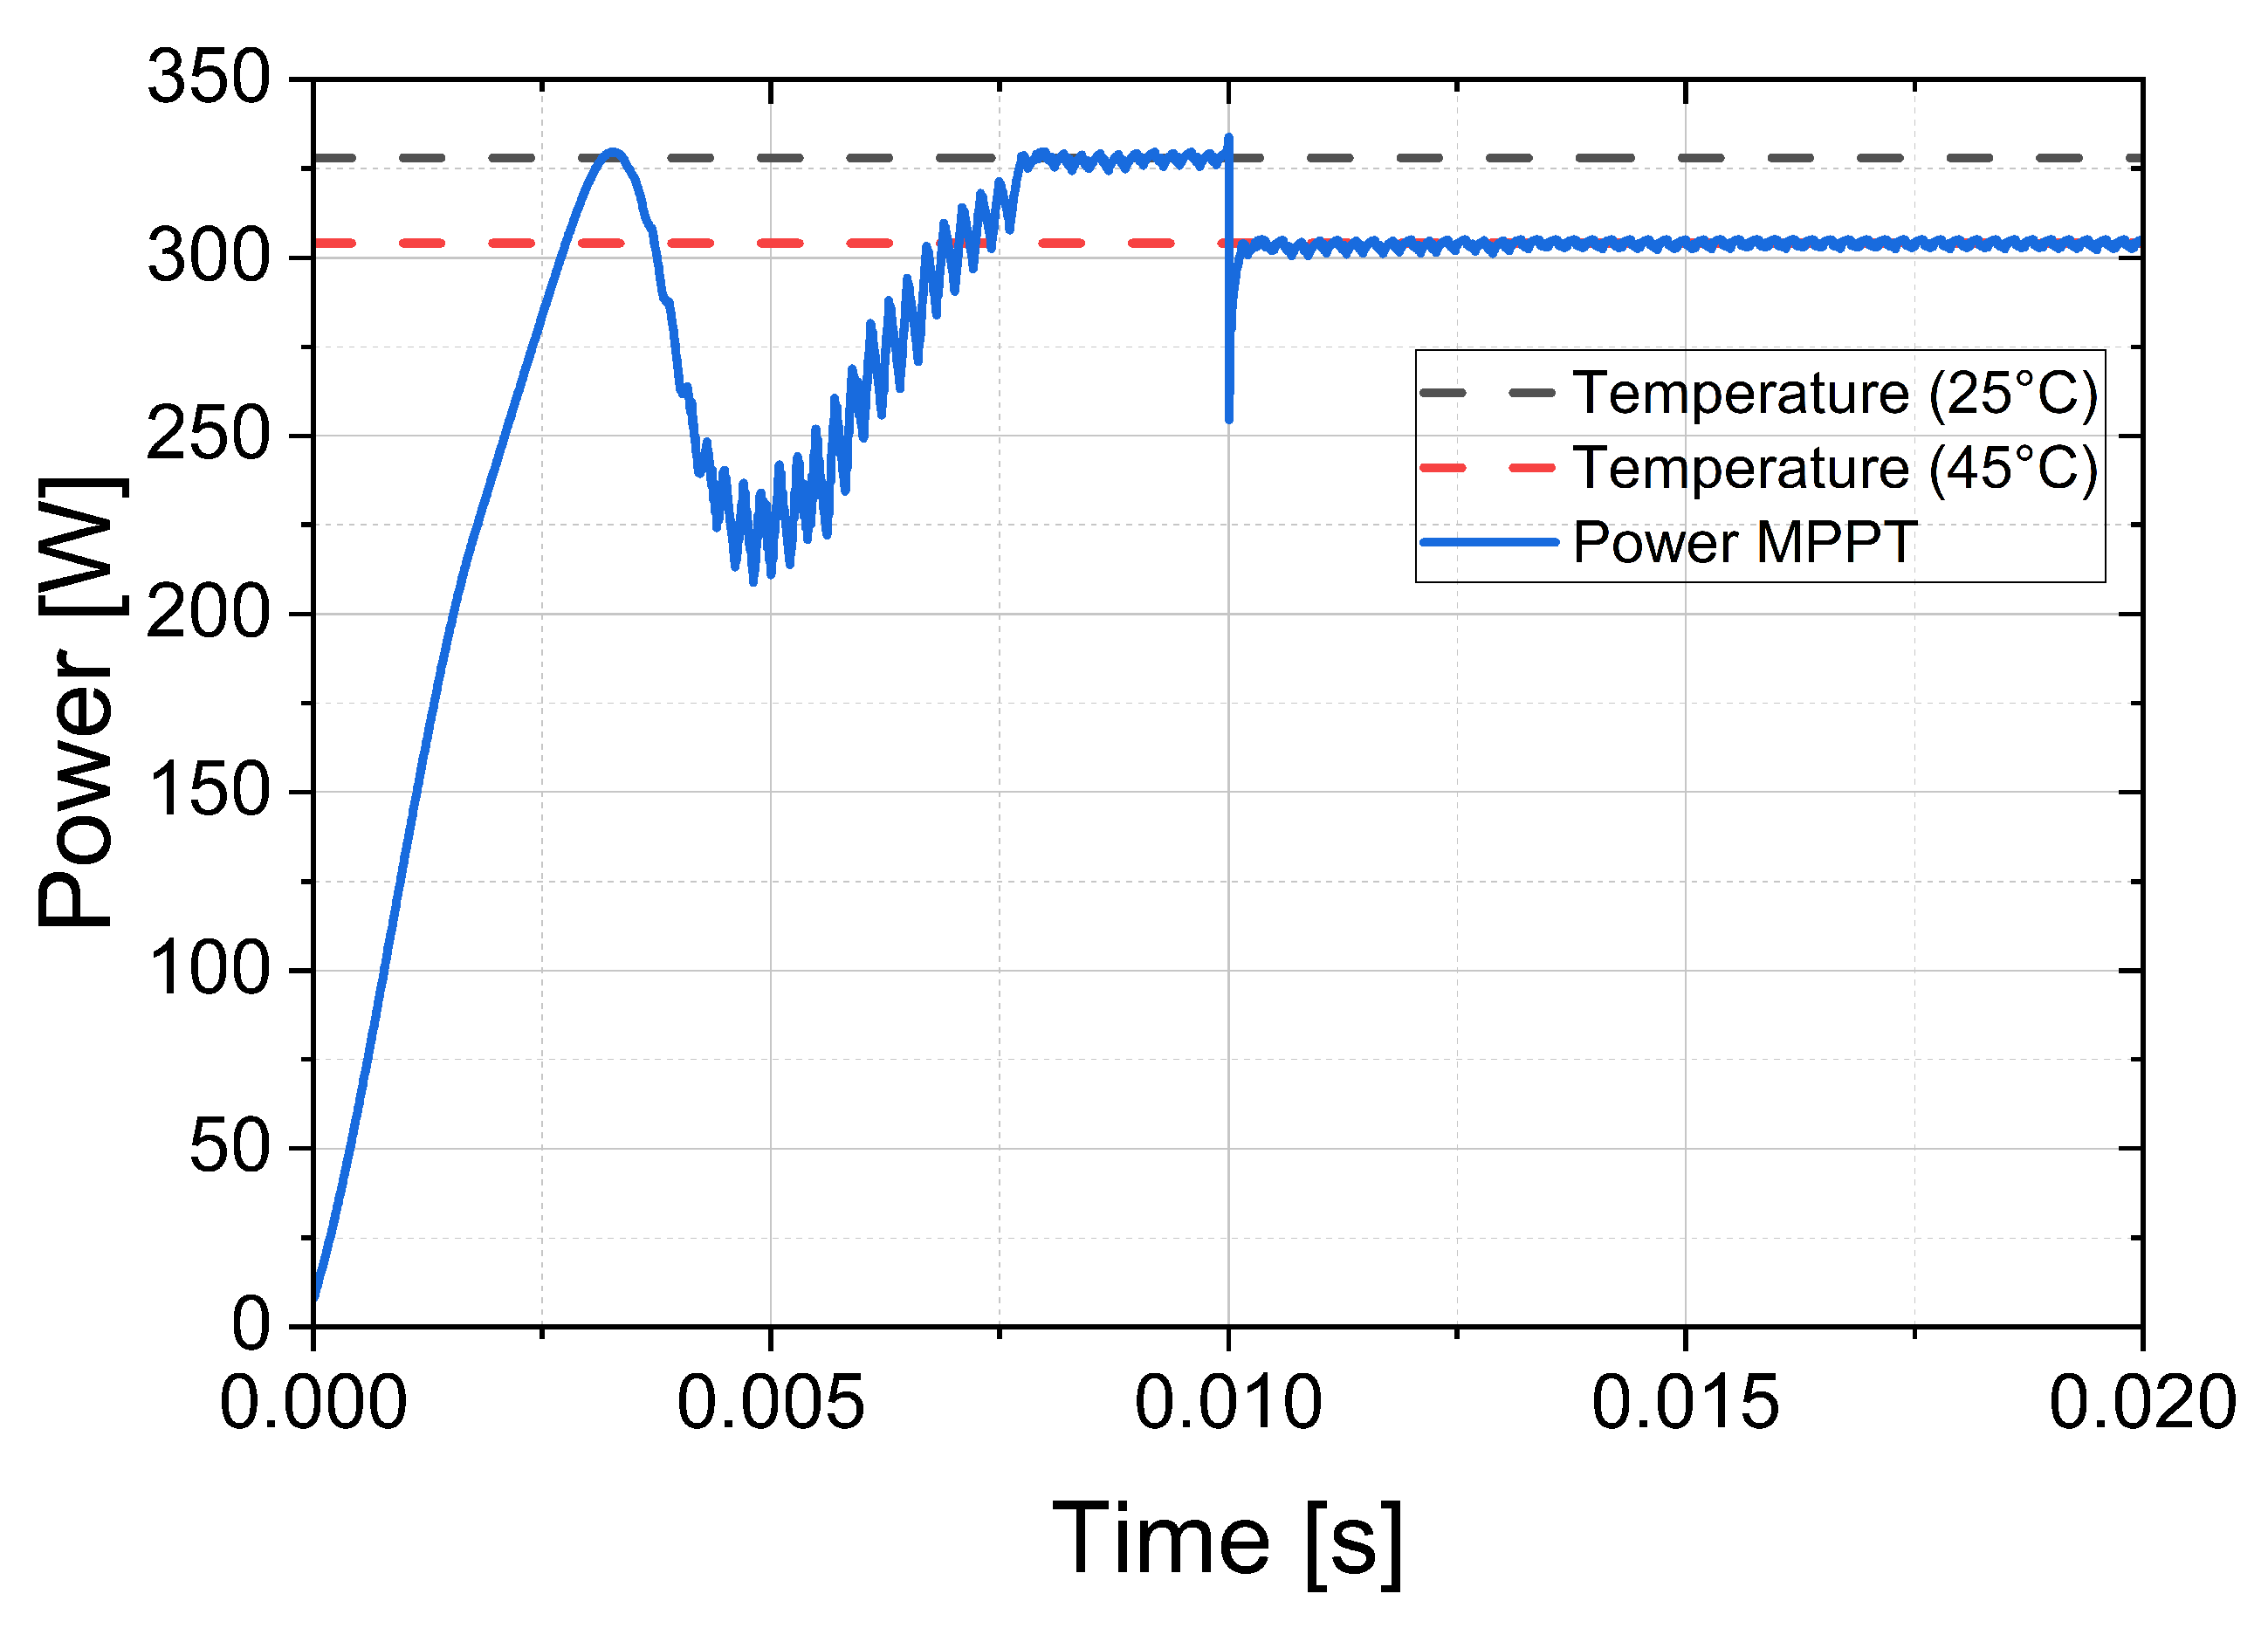
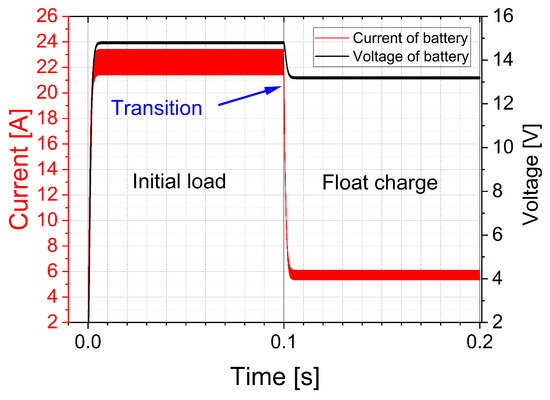
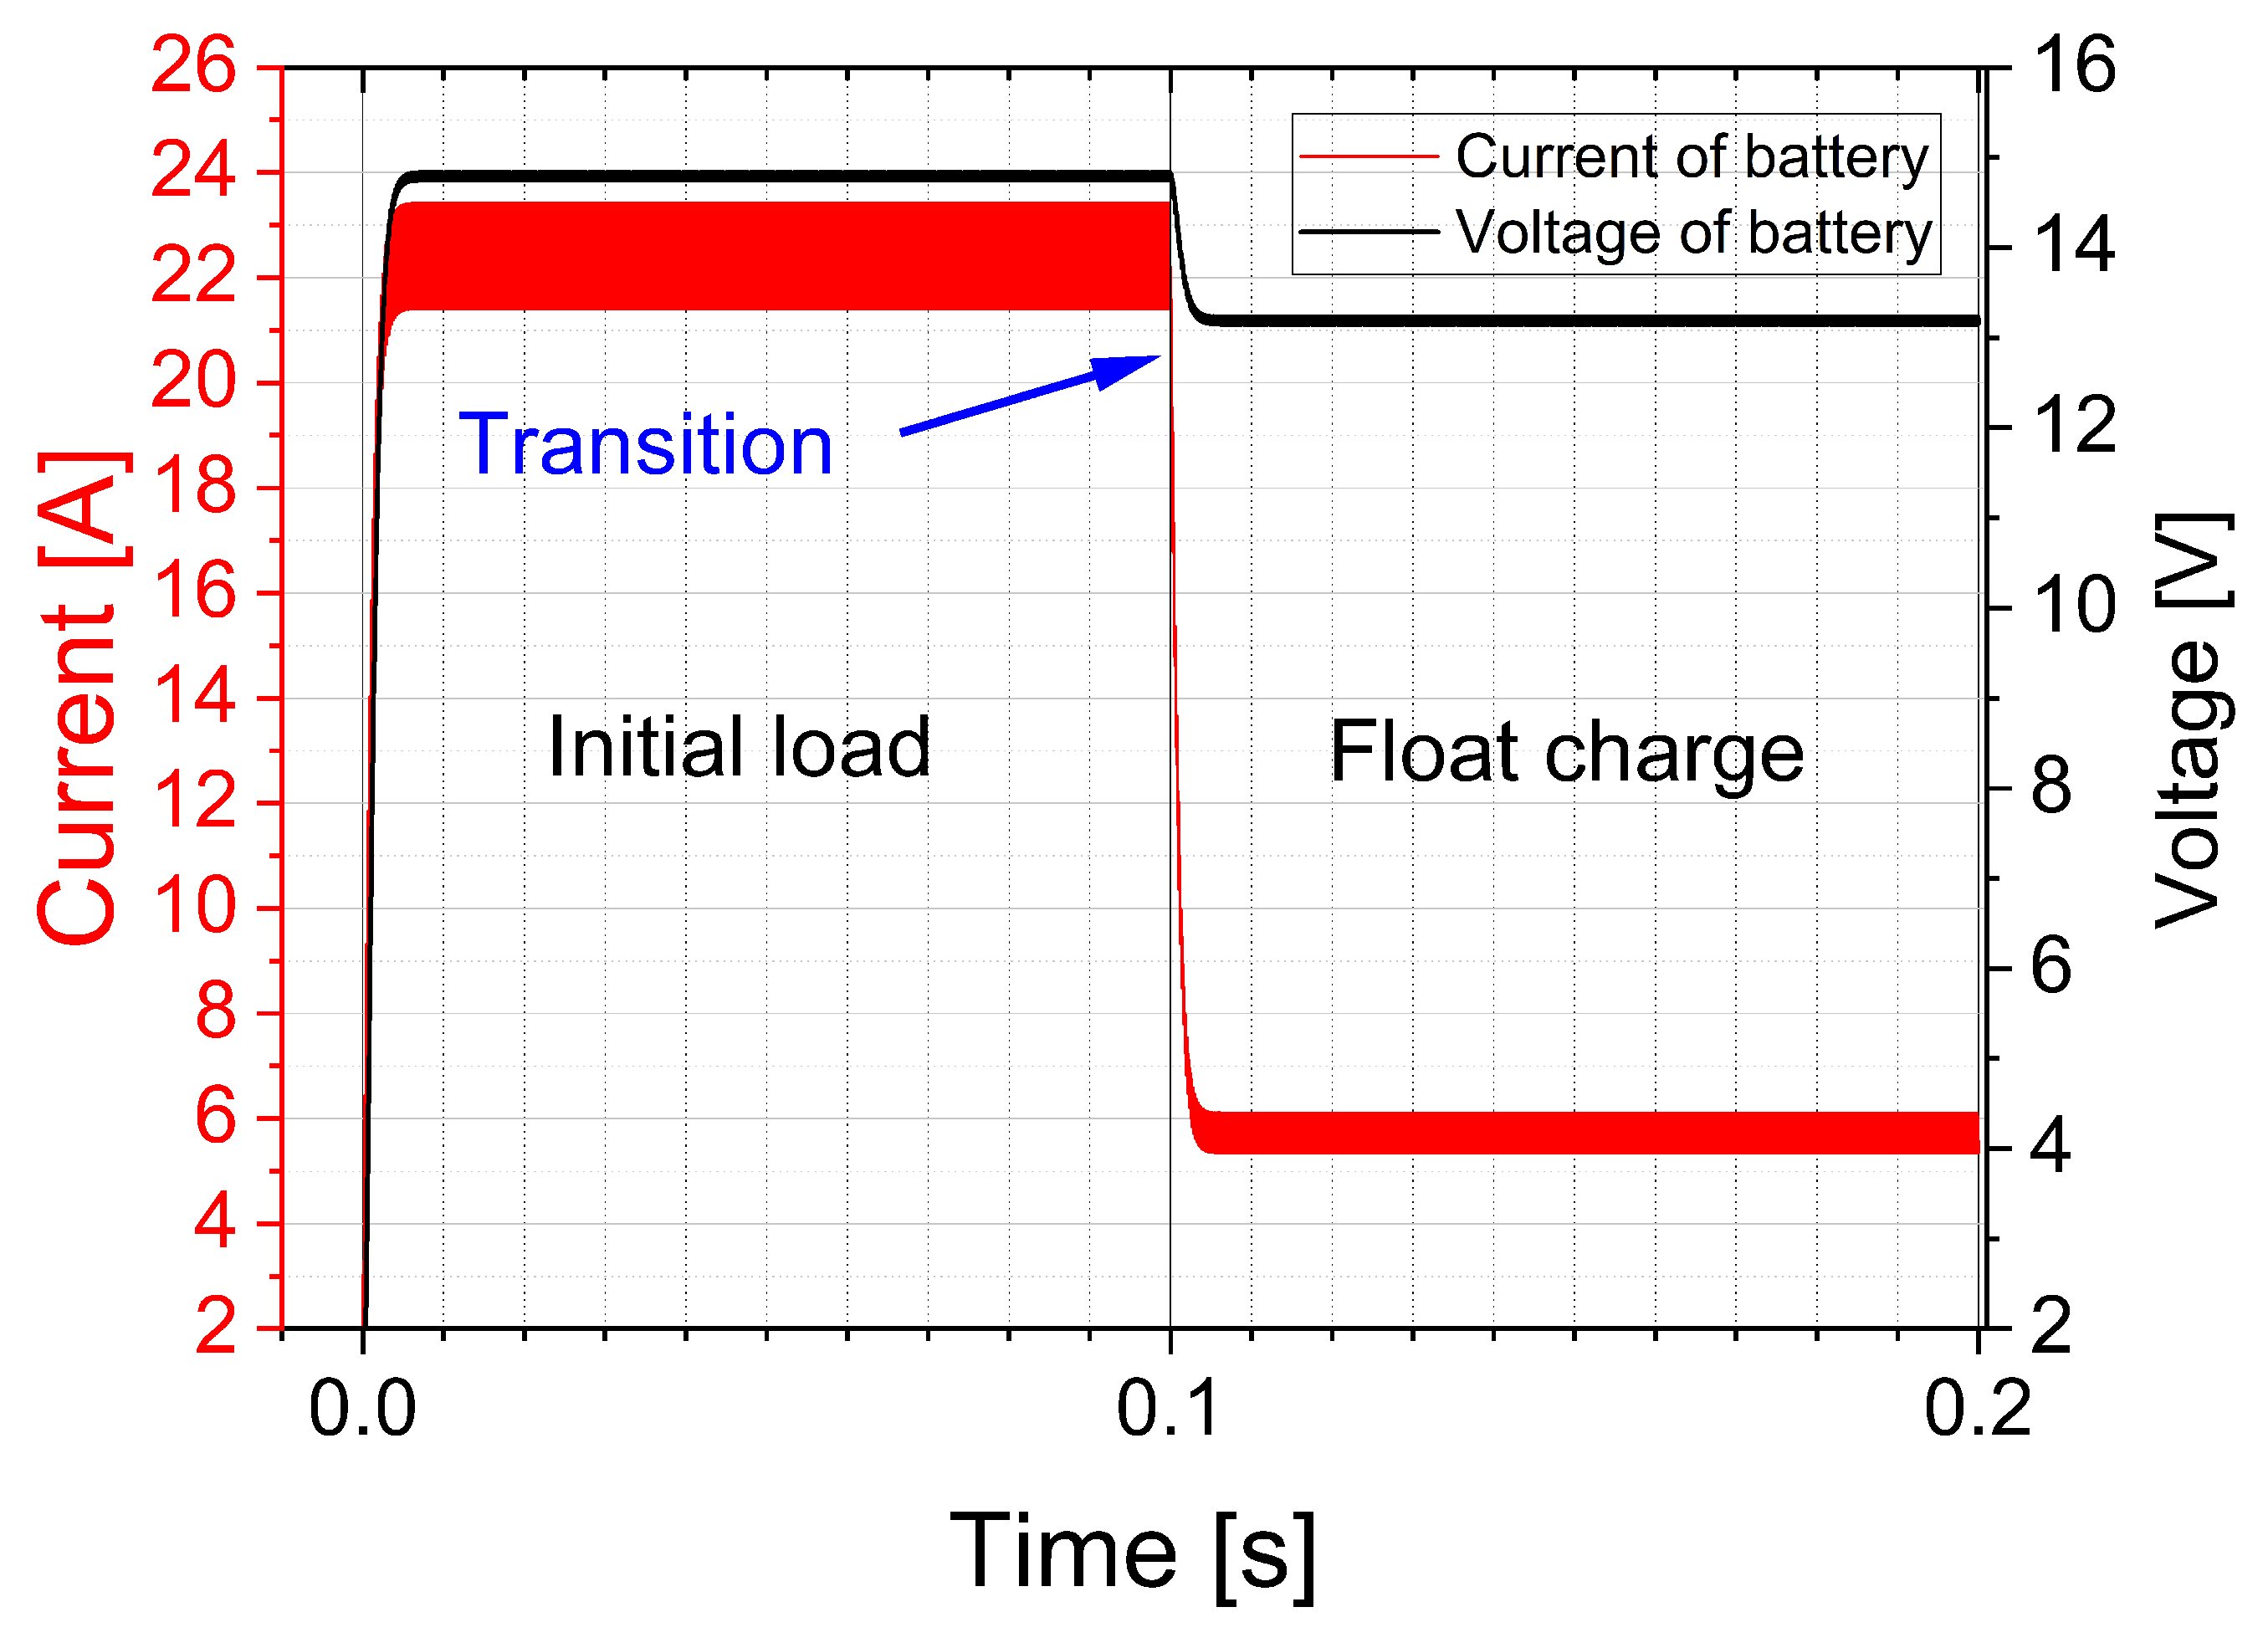
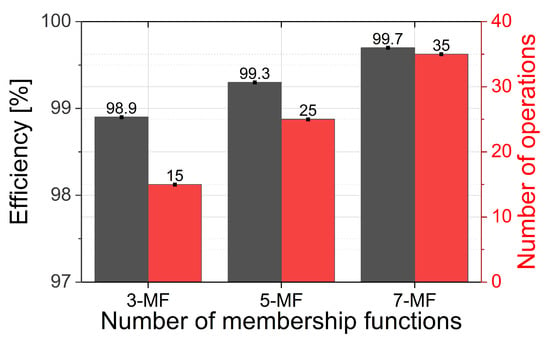
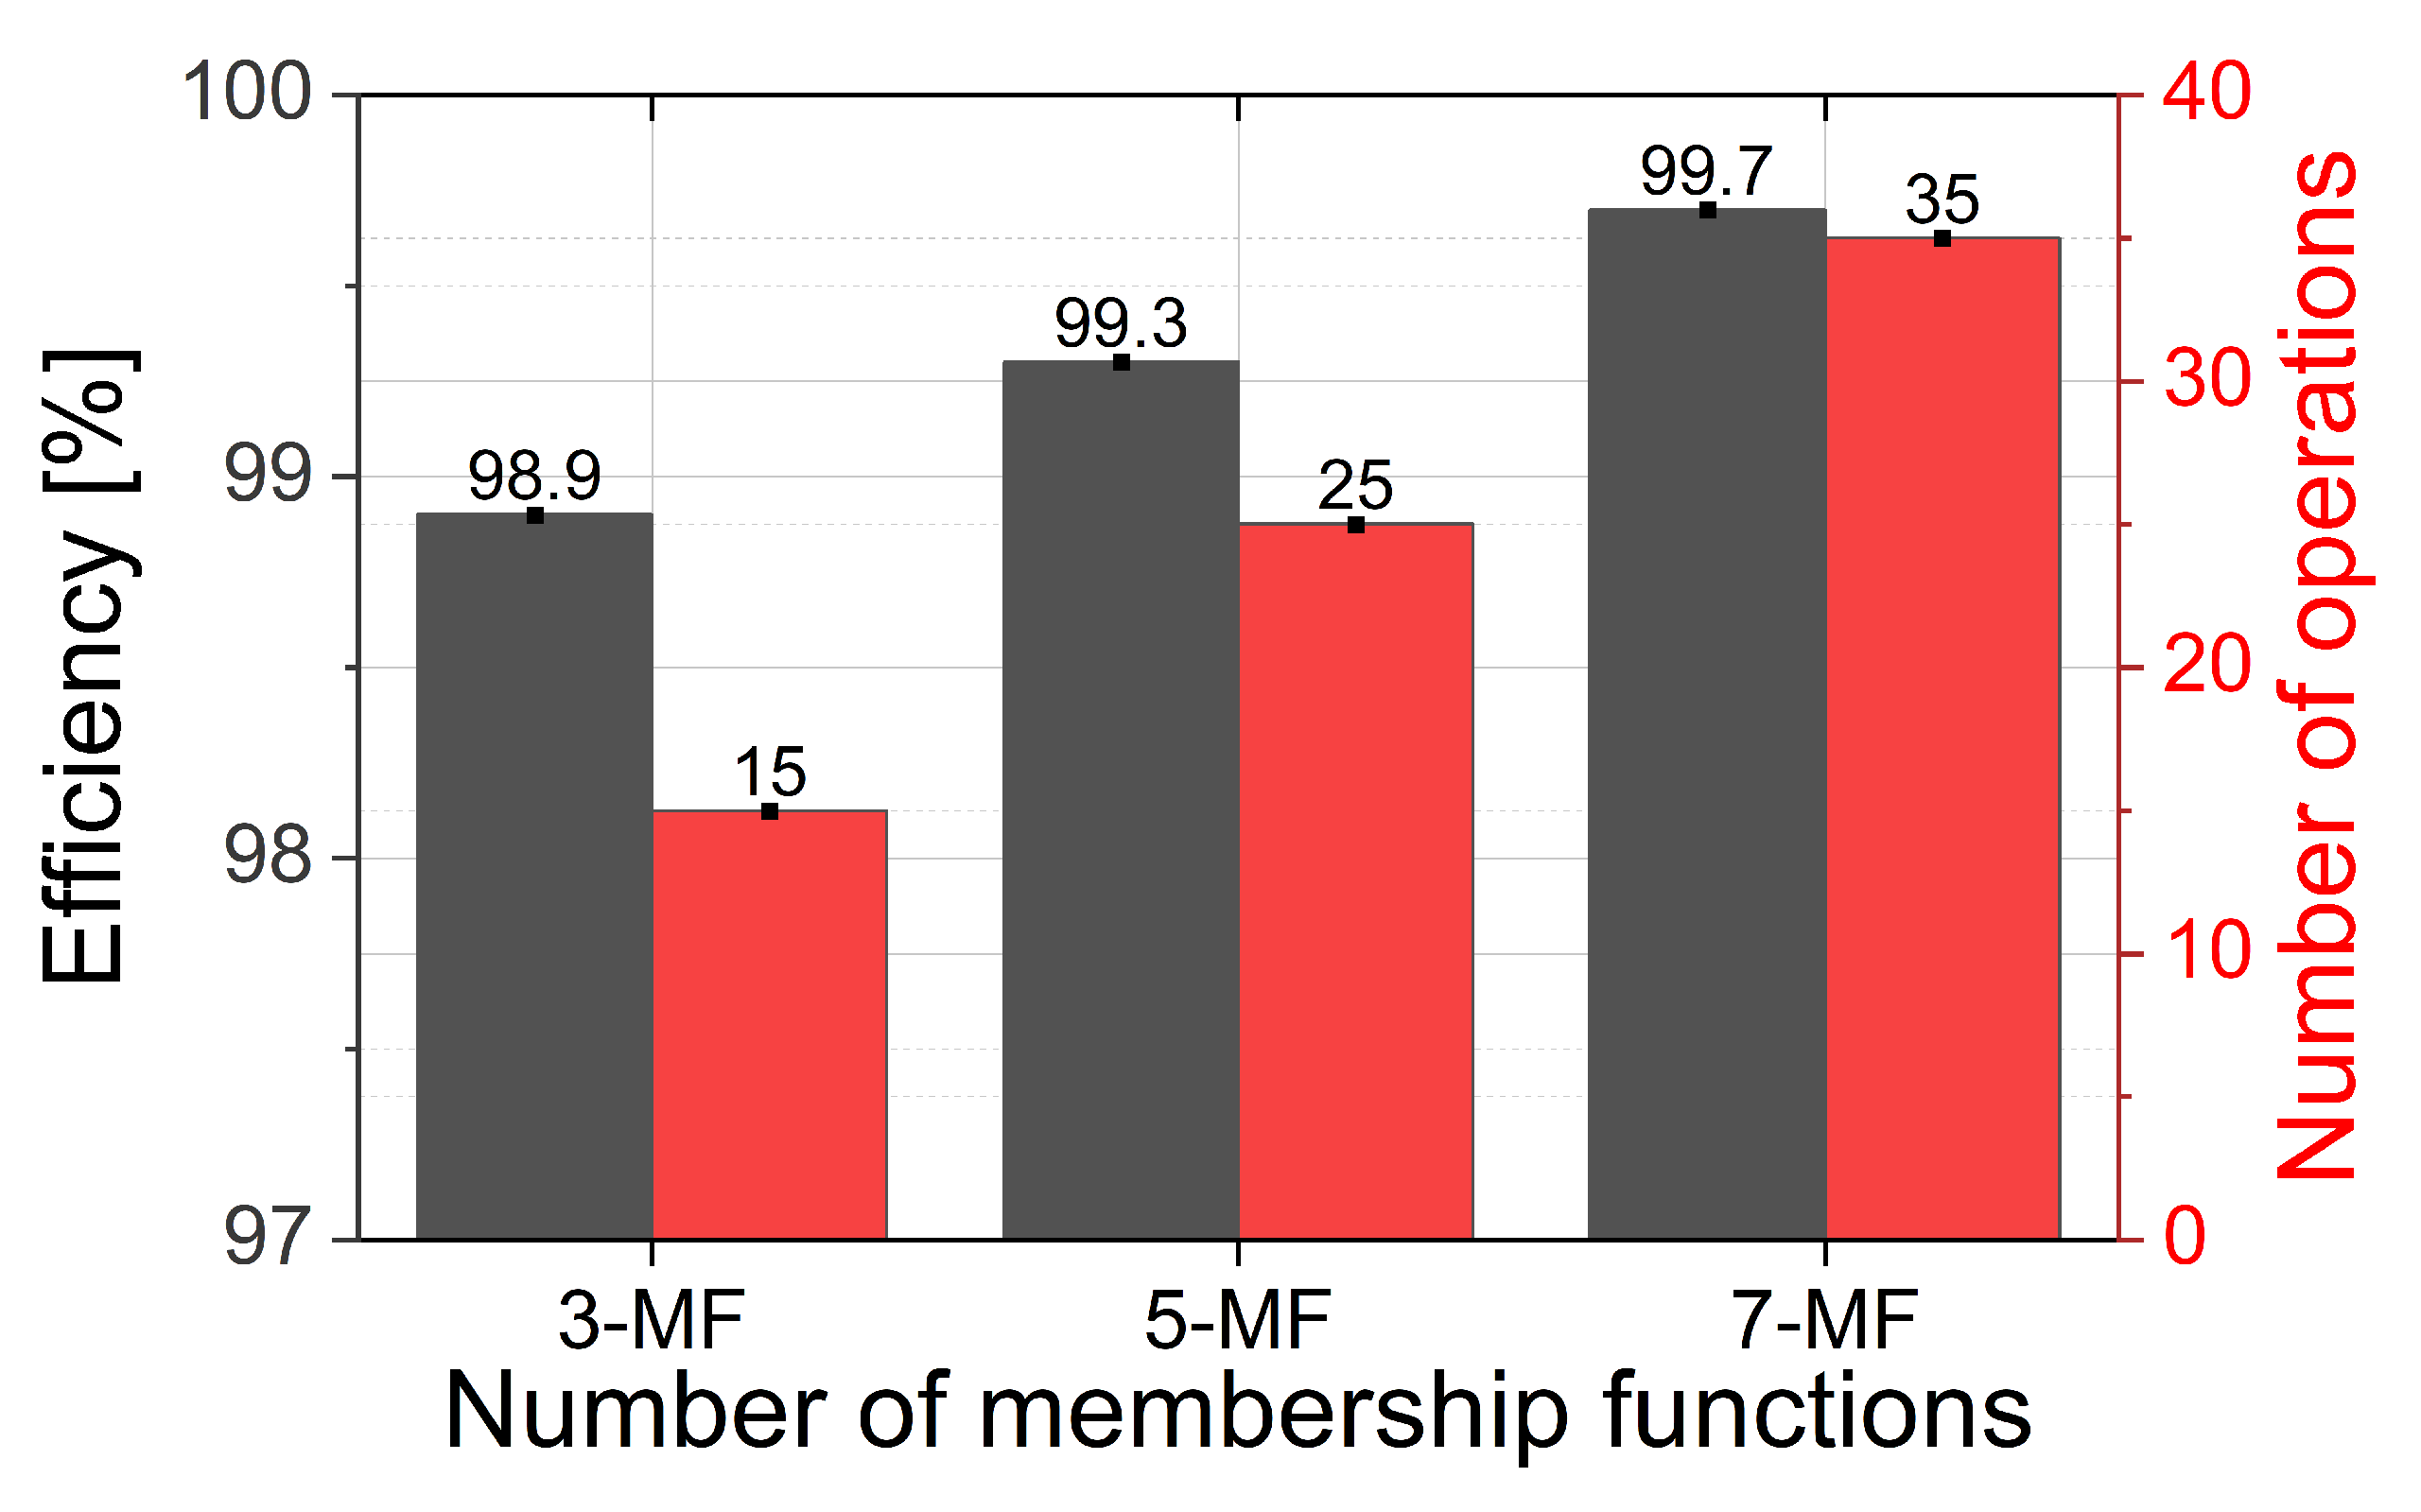

Disclaimer/Publisher’s Note: The statements, opinions and data contained in all publications are solely those of the individual author(s) and contributor(s) and not of MDPI and/or the editor(s). MDPI and/or the editor(s) disclaim responsibility for any injury to people or property resulting from any ideas, methods, instructions or products referred to in the content. |
© 2026 by the authors. Licensee MDPI, Basel, Switzerland. This article is an open access article distributed under the terms and conditions of the Creative Commons Attribution (CC BY) license.