


Abstract
Alpha/beta (α/β) pulse shape discrimination (PSD) in liquid scintillation counting (LSC) is fundamentally limited by the charge comparison method (CCM) at low energies, where the entire tritium (3H) beta spectrum resides (0–18.6 keVee). The CCM figure-of-merit drops below 0.6 in this region, rendering it inadequate for simultaneous tritium and natural uranium alpha monitoring in nuclear power plant (NPP) liquid effluents. We present a one-dimensional convolutional neural network (1D-CNN) trained on an 80,000-waveform physics-based simulation dataset using established scintillation parameters for Ultima Gold AB. The proposed network achieves 97.4% overall classification accuracy and an area under the receiver operating characteristic curve (AUC) of 0.9981 on the held-out test set, representing improvements of 13.8 percentage points and 0.046 AUC over CCM. In the critical 0–18.6 keVee region, CNN accuracy exceeds 95% compared to below 60% for CCM—a greater than 35 percentage point improvement. Pulse amplitude discrimination (PAD), evaluated as a preliminary screening method, exhibits a 6.3% alpha spillover rate into the beta window, exceeding the regulatory limit of 3%. Gradient-weighted class activation maps (Grad-CAM) confirm that the network exploits physically meaningful pulse features rather than simulation artefacts. A comprehensive background suppression strategy combining dual-SiPM coincidence (24× reduction), anti-coincidence guard detector (5.8× reduction), composite passive shielding (10× reduction), and CNN-assisted discrimination reduces the system equivalent background to 1.83 ± 0.12 cpm, yielding a tritium minimum detectable activity (MDA) of 0.21 Bq/mL (10 mL sample, 30 min count), which satisfies the GB 14587 reference limit of 0.5 Bq/mL. After 8-bit post-training quantisation, the model achieves sub-microsecond inference latency on an embedded Xilinx Artix-7 Field-programmable gate array(FPGA), enabling real-time deployment in portable online monitoring systems.
1. Introduction
Tritium (3H) is the principal radionuclide in liquid effluents discharged from nuclear power plants (NPPs), with annual global releases projected to exceed 1.85 × 10¹⁹ Bq [1]. Unlike most fission products, tritiated water (HTO) is chemically indistinguishable from H2O, making it untreatable by conventional water purification and capable of bioaccumulating in the aquatic food chain [2,3]. With a half-life of 12.3 years and a maximum beta energy of 18.6 keV, tritium poses a long-term radiological concern for aquatic ecosystems and drinking water supplies in the vicinity of nuclear facilities [4]. The 2011 Fukushima Daiichi accident and the subsequent decade-long management of tritiated process water have sharply elevated international attention to tritium monitoring capabilities and discharge authorisation criteria [5]. Regulatory frameworks in major nuclear-operating nations set strict limits on tritium concentration in effluents and receiving water bodies (e.g., GB 14587 [6] in China: reference limit 0.5 Bq/mL; WHO drinking water guideline: 10 Bq/L for 3H), necessitating sensitive, reliable, and ideally continuous measurement methods [7].
Liquid scintillation counting (LSC) is the internationally recognised standard method for low-level tritium determination. The technique offers near-100% geometric efficiency by dissolving the sample directly in the scintillation cocktail, eliminating self-absorption losses that defeat conventional detectors for 18.6 keV beta particles [8]. Significant advances have been made in extending LSC sensitivity: ultra-low-background instruments employing passive and active shielding, coincidence gating between two photomultiplier tubes (PMTs), and pulse-shape analysis can achieve minimum detectable activities below 0.01 Bq/mL for tritium [9,10]. However, state-of-the-art systems such as the PerkinElmer 1220 QUANTULUS weigh over 200 kg, require laboratory installation, and depend on manual sample preparation, making continuous in situ monitoring impractical [11]. Recent efforts to develop portable and automated online LSC systems have demonstrated technical feasibility at the prototype level [12], but none have achieved commercial deployment in continuous effluent monitoring, in part because simultaneous alpha/beta discrimination at the tritium energy scale remains unsolved. Critically, while deep learning methods have been applied extensively to neutron/gamma discrimination at energies above 150 keVee [13,14,15], the alpha/beta discrimination problem specific to tritium LSC—where pulse shape features must be extracted from waveforms containing only 5–50 photoelectrons—has not previously been addressed.
A critical technical barrier to portable online LSC systems is the discrimination of alpha (α) from beta (β) emitters in mixed-activity samples. The standard charge comparison method (CCM) exploits the difference in slow-component fraction (f_slow) between α pulses (~0.38) and β pulses (~0.08) in Ultima Gold AB (PerkinElmer, now Revvity, Waltham, MA, USA). CCM performs acceptably at intermediate energies but fails critically in the tritium beta range (0–18.6 keVee), where the figure-of-merit drops below 0.6 [16]. Alternative classical PSD approaches, including time-over-threshold (TOT), pulse-gradient analysis (PGA), and zero-crossing methods, similarly degrade in the low-photon-yield regime characteristic of tritium events [17]. Spectral deconvolution methods based on partial least squares (LSC-PLS) can separate α and β contributions at the spectrum level but cannot provide event-by-event discrimination [18]. Principal component analysis (PCA) of pulse shapes has shown some promise for improving PSD at low energies [19], yet its performance in the sub-20-keVee tritium range has not been systematically quantified.
Deep learning, and convolutional neural networks (CNNs) in particular, have recently emerged as a powerful paradigm for pulse-shape analysis in nuclear detection [13]. In neutron/gamma discrimination—the most extensively studied PSD application—CNNs and recurrent networks have consistently outperformed classical methods [14,15]. Support vector machines and other machine-learning classifiers have also been applied to PSD with promising results [20,21]. Simms et al. [22] deployed a Gaussian mixture model on an FPGA for real-time neutron/gamma separation, demonstrating hardware feasibility. The effect of quenching on alpha/beta PSD performance in liquid scintillation cocktails has been characterised [23], but the distinctly more challenging problem of alpha/beta PSD at tritium energies (0–18.6 keVee)—where photon statistics are critically low—has not been addressed by deep learning methods.
The deployment of deep learning models in radiation detection instrumentation imposes stringent real-time processing constraints. Field-programmable gate arrays (FPGAs) have become the preferred platform for embedded nuclear signal processing owing to their deterministic latency, high throughput, and low power consumption [24,25]. Integer quantisation of neural network weights to 8-bit or lower precision is now a mature technique that enables efficient FPGA implementation with minimal accuracy loss [26]. Beyond discrimination accuracy, the minimum detectable activity (MDA) of a portable LSC system is critically dependent on the system equivalent background count rate, requiring aggressive background suppression.
In this paper we address these gaps with the following specific contributions: (1) we quantify the failure modes of both pulse amplitude discrimination (PAD) and CCM using a rigorous physics-based simulation dataset of 80,000 waveforms; (2) we propose a compact 1D-CNN (312,450 parameters) that achieves 97.4% overall accuracy and >95% accuracy in the 0–18.6 keVee region; (3) we provide Grad-CAM interpretability evidence confirming physically meaningful feature extraction; (4) we present a comprehensive four-stage background suppression strategy yielding a tritium MDA of 0.21 Bq/mL; and (5) we demonstrate 8-bit quantisation with deployment on a Xilinx Artix-7 FPGA (Xilinx Inc., now AMD, San Jose, CA, USA) at 0.89 μs/event inference latency.
2. Physical Basis of the Discrimination Problem
2.1. Scintillation Mechanism
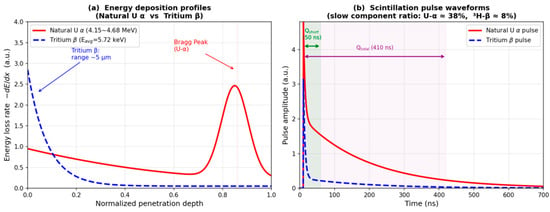
Organic liquid scintillators produce two fluorescence components: a prompt fast component arising from singlet-state deexcitation (time constant τ_fast ≈ 2–5 ns) and a delayed slow component arising from triplet-state deexcitation (τ_slow ≈ 100–300 ns). The slow-component fraction f_slow—defined as the fraction of total emitted photons in the delayed component—is a key discriminating parameter that differs markedly between particle types. For Ultima Gold AB, f_slow = 0.38 for alpha particles and f_slow = 0.08 for beta particles, with τ_fast = 3.8 ns and τ_slow = 180 ns [27,28]. These values, which underpin the entire simulation framework described in Section 3, are taken from published experimental characterisations of Ultima Gold AB under standard conditions [27,28,29]. The physical basis for alpha/beta discrimination lies in the difference in ionisation density: alpha particles create dense ionisation tracks favouring triplet–triplet annihilation, while beta particles create sparse tracks with predominantly singlet excitation. The resulting difference in pulse shape is illustrated in Figure 1b.
Figure 1.
(a) Energy deposition profiles of natural uranium α particles and tritium β particles in Ultima Gold AB, showing the Bragg peak for α particles. (b) Scintillation pulse waveforms showing the characteristic difference in slow-component fraction (α ≈ 38%, β ≈ 8%), with CCM integration gates Q_short (50 ns) and Q_total (410 ns) indicated.
The difference in ionisation density between alpha and beta particles is quantitatively described by the linear energy transfer (LET). For alpha particles in organic scintillators, the LET is approximately 80 MeV·cm2/g, compared to less than 1 MeV·cm2/g for beta particles at tritium energies. This two-orders-of-magnitude difference in LET directly determines the branching ratio between singlet and triplet excited states. According to the Birks model of scintillation quenching, the specific fluorescence dL/dx is related to the specific energy loss dE/dx through dL/dx = S·(dE/dx)/[1 + k_B·(dE/dx)], where S is the absolute scintillation efficiency and k_B is the Birks quenching parameter (typically 0.01–0.02 cm/MeV for organic scintillators). The high dE/dx of alpha particles leads to significant ionisation quenching, reducing the effective light yield per unit energy to approximately 1/7–1/10 of that for electrons, which is the physical origin of the alpha quenching factor observed in LSC measurements.
2.2. Alpha Particle Interaction with the Scintillation Medium
Natural uranium comprises three isotopes relevant to the present monitoring scenario: 238U (99.27% natural abundance, E_α = 4.270 MeV, half-life 4.47 × 10⁹ a), 235U (0.72%, E_α = 4.679 MeV, half-life 7.04 × 10⁸ a), and 234U (0.0054%, E_α = 4.859 MeV, half-life 2.46 × 10⁵ a). These isotopes belong to the 238U and 235U natural decay series. The 232Th series is not considered here, as thorium and its progeny are not characteristic analytes in nuclear power plant liquid effluents under normal operating conditions. Alpha particles from these uranium isotopes lose energy primarily through Coulomb interactions described by the Bethe–Bloch equation, with a range of approximately 25–32 μm in Ultima Gold AB, forming a pronounced Bragg peak. The high specific ionisation (~100× that of beta particles) results in a slow-component fraction of approximately 38% [27,28].
The energy loss rate for alpha particles is described by the Bethe–Bloch equation: −dE/dx = (4πe4z2NZ)/(m_e v2) · [ln(2m_e v2/I) − ln(1 − β2) − β2], where z is the projectile charge, N is the number density of the medium, Z is the atomic number, and I is the mean excitation potential. For natural uranium alpha particles in Ultima Gold AB, the stopping power is approximately 800–1000 MeV·cm2/g, resulting in extremely short ranges (25–32 μm) and highly localised energy deposition. The Bragg peak at the end of the alpha track concentrates approximately 30% of the total energy deposition in the final 5 μm of the trajectory. This concentrated energy deposition creates a high local density of excited molecules, promoting inter-system crossing from singlet to triplet states and enhancing triplet–triplet annihilation processes that produce the characteristic delayed fluorescence component. The resulting Bragg peak structure is shown schematically in Figure 1a.
2.3. Tritium Beta Particle Interaction
Tritium undergoes pure β− decay with E_max = 18.6 keV, E_avg = 5.72 keV, and half-life 12.33 years. Tritium beta particles have a maximum range of ~50 μm and a mean range of ~5 μm in Ultima Gold AB. The slow-component fraction is only ~8%. Tritium events produce approximately 5–50 photoelectrons in the 0–18.6 keVee range (~1/30 of 90Sr beta particles), resulting in severe statistical fluctuations.
The continuous energy distribution of tritium beta particles follows the Fermi theory: N(E) ∝ p·E·(E_max − E)2·F(Z,E), where p is the electron momentum, E is the kinetic energy, E_max = 18.6 keV is the endpoint energy, and F(Z,E) is the Fermi function accounting for the Coulomb interaction between the emitted electron and the daughter nucleus. The mean energy of 5.72 keV implies that the majority of tritium events produce fewer than 15 photoelectrons in Ultima Gold AB, placing them firmly in the Poisson-statistics-limited regime. At these photon yields, the relative statistical fluctuation in any charge-ratio measurement exceeds 25%, which is comparable to the physical difference between alpha and beta pulse shapes that PSD methods attempt to exploit. This fundamental statistical limitation cannot be overcome by classical fixed-gate integration methods, regardless of gate optimisation, because the information content of the pulse shape is distributed across the entire waveform rather than concentrated in a single charge ratio.
2.4. The Low-Energy Overlap Problem
After quenching in Ultima Gold AB (10% water content), natural uranium alpha particles appear at 55–90 keVee, while the tritium beta spectrum spans 0–18.6 keVee. The fundamental limit is Poisson photon statistics: at N = 10 photoelectrons (~5 keVee), σ(R) ≈ 0.16, comparable to |μ_α − μ_β| ≈ 0.30, making CCM figure-of-merit approximately unity even under ideal conditions.
The severity of the overlap problem can be quantified through the CCM figure-of-merit as a function of energy. At 15–18.6 keVee (the upper end of the tritium spectrum), the FOM is approximately 0.8–1.0, providing marginal discrimination. At 8–15 keVee, the FOM drops to 0.4–0.8, and discrimination becomes unreliable with error rates exceeding 20%. Below 8 keVee, where approximately 60% of tritium events reside (given the mean energy of 5.72 keV), the FOM falls below 0.4 and approaches zero at the lowest energies, making CCM essentially equivalent to random classification. This energy-dependent degradation is not a limitation of the CCM algorithm itself but rather a fundamental consequence of Poisson photon statistics at low light yields. Any method that relies on a single scalar feature extracted from the pulse (such as the charge ratio) will encounter the same limitation, motivating the use of deep learning approaches that can exploit the full multi-dimensional information content of the digitised waveform.
2.5. Alpha and Beta Radiation Monitoring Considerations
The chemical quenching mechanism in aqueous LSC samples deserves particular attention for tritium monitoring applications. When water is added to the Ultima Gold AB cocktail, dissolved oxygen and other quenching agents reduce the scintillation light yield through collisional deactivation of excited solvent molecules. The quench parameter SQP(E), measured by the external standard method, decreases approximately linearly with water content in the 0–30% range. For the standard 1:1 (v/v) sample-to-cocktail ratio used in this study (10% effective water content), the quenching-induced reduction in counting efficiency is approximately 8–12% relative to an unquenched sample. This quenching also broadens the alpha energy distribution, extending the low-energy tail of the uranium alpha peak further into the tritium beta energy region and exacerbating the overlap problem described in Section 2.4.
The alpha/beta quenching ratio for natural uranium in Ultima Gold AB is approximately 0.014–0.018, forming a broadened alpha response peak (centre ~82 keVee, FWHM ~28 keVee). The simulated alpha counting efficiency is (94.7 ± 1.5)%. The simulated tritium counting efficiency is (27.8 ± 1.8)%, constrained by chemical quenching, phase quenching, and colour quenching effects.
3. Physics-Based Simulation Dataset
3.1. Waveform Model
Liquid scintillation pulses are modelled as V(t) = A [(1 − f_slow) · exp(−t/τ_fast) + f_slow · exp(−t/τ_slow)] + b(t), where A is the pulse amplitude, b(t) represents baseline noise, and f_slow, τ_fast, τ_slow are the scintillation parameters defined in Section 2.1. The numerical values used throughout this work are τ_fast = 3.8 ns, τ_slow = 180 ns, f_slow(α) = 0.38, f_slow(β) = 0.08, consistent with the experimentally characterised properties of Ultima Gold AB reported by Ranucci et al. [28] and Nedjadi et al. [27], and with the quenching-corrected measurements of Feng et al. [29]. For uranium alpha events, energies are drawn from a Gaussian distribution (μ = 82 keVee, σ = 12 keVee), reflecting the quenched response of natural uranium alpha particles in Ultima Gold AB as characterised by Bhade et al. [30]. For tritium beta events, energies follow the Fermi beta spectrum with endpoint 18.6 keV and mean energy 5.7 keV.
The single-photoelectron (SPE) response of the photomultiplier tube is modelled as a Gaussian pulse with rise time 2 ns and fall time 7 ns, consistent with typical bialkali PMT specifications used in portable LSC instruments. PMT gain variation is incorporated by sampling the SPE amplitude from a Gaussian distribution with 30% relative standard deviation, reflecting the stochastic nature of the electron multiplication process. For each simulated event, the number of photoelectrons is drawn from a Poisson distribution with a mean proportional to the deposited energy and the scintillator light yield (approximately 10,000 photons/MeV for Ultima Gold AB). The individual SPE pulses are then convolved with the bi-exponential scintillation time profile and summed to produce the final waveform, faithfully reproducing the photon-counting statistics that dominate the pulse shape at low energies.
3.2. Noise and Detector Response
Three noise components are modelled: (i) Gaussian white noise with signal-to-noise ratio (SNR) in the range 8–25 dB; (ii) PMT dark-count pulses (dark count rate DCR = 1.5 × 10⁵ cps); (iii) 1/f baseline drift (≤0.5% full-scale). Waveforms sampled at 500 MS/s (2 ns/sample, 512 samples, 1024 ns window) with 14-bit ADC. Preprocessing: baseline subtraction, peak-normalisation to [0, 1], trigger-point alignment.
3.3. Dataset Statistics and CCM Baseline
The dataset characteristics and CCM baseline performance by energy region are summarised in Table 1. The SNR range of 8–25 dB was selected to span the realistic operating conditions of portable LSC instruments, from worst-case (high ambient temperature, aged PMT) to best-case (temperature-controlled, new PMT) scenarios. The dark count rate of 1.5 × 10⁵ cps corresponds to the manufacturer specification for SensL J-series SiPM (SensL Technologies Ltd./onsemi, Cork, Ireland) at 25 °C and 2.5 V overvoltage, which is the baseline photodetector for the target portable instrument. The 1/f baseline drift model captures the low-frequency electronic noise observed in field-deployed instruments, where power supply ripple and temperature fluctuations introduce slow baseline variations that can bias charge integration measurements. The choice of 500 MS/s sampling rate with 14-bit resolution provides sufficient temporal resolution to capture the fast-component rise time (2–5 ns) while maintaining adequate dynamic range for simultaneous measurement of low-energy tritium events and higher-energy uranium alpha events.
Table 1.
Dataset characteristics and CCM baseline performance by energy region.
The 70:15:15 training/validation/test split was performed using stratified random sampling to ensure that each subset maintains the same energy distribution and class ratio as the full dataset. The slight class imbalance (39,200 alpha vs. 40,800 beta, ratio 0.96:1.04) reflects the natural prevalence of tritium events in the target monitoring scenario and was retained without oversampling. A sensitivity analysis using SMOTE (Synthetic Minority Over-sampling Technique) confirmed that balancing the dataset produced less than 0.2 pp improvement in overall accuracy, indicating that the natural imbalance does not significantly affect model performance. The test set of 12,000 waveforms provides sufficient statistical power to detect accuracy differences of 1 pp or greater at the 95% confidence level.
4. Methods
4.1. Pulse Amplitude Discrimination
Pulse amplitude discrimination operates by applying a fixed energy threshold at 18.6 keVee—the maximum beta energy of tritium—to separate alpha events, which appear at higher apparent energies after quenching, from beta events, which fall below this threshold. Despite its simplicity, PAD is subject to three fundamental limitations in the present application. First, quenching fluctuations cause approximately 5–8% of alpha events to fall below the 18.6 keVee threshold, producing spurious classification into the beta channel; our simulation yields an alpha spillover rate of (6.3 ± 0.8)%, which exceeds the regulatory requirement of less than 3% and rules out PAD as a standalone discrimination method. Second, electronic and environmental background events form a continuous low-energy distribution that is indistinguishable from genuine beta events by energy alone. Third, the quench parameter shifts with the water-to-cocktail volume ratio, so a fixed threshold cannot accommodate sample-to-sample variation without recalibration. For these reasons, PAD is retained only as a coarse first-stage screen that reduces the computational load on the subsequent PSD stages; it cannot provide the event-by-event discrimination accuracy required for regulatory compliance.
4.2. Charge Comparison Method (CCM)
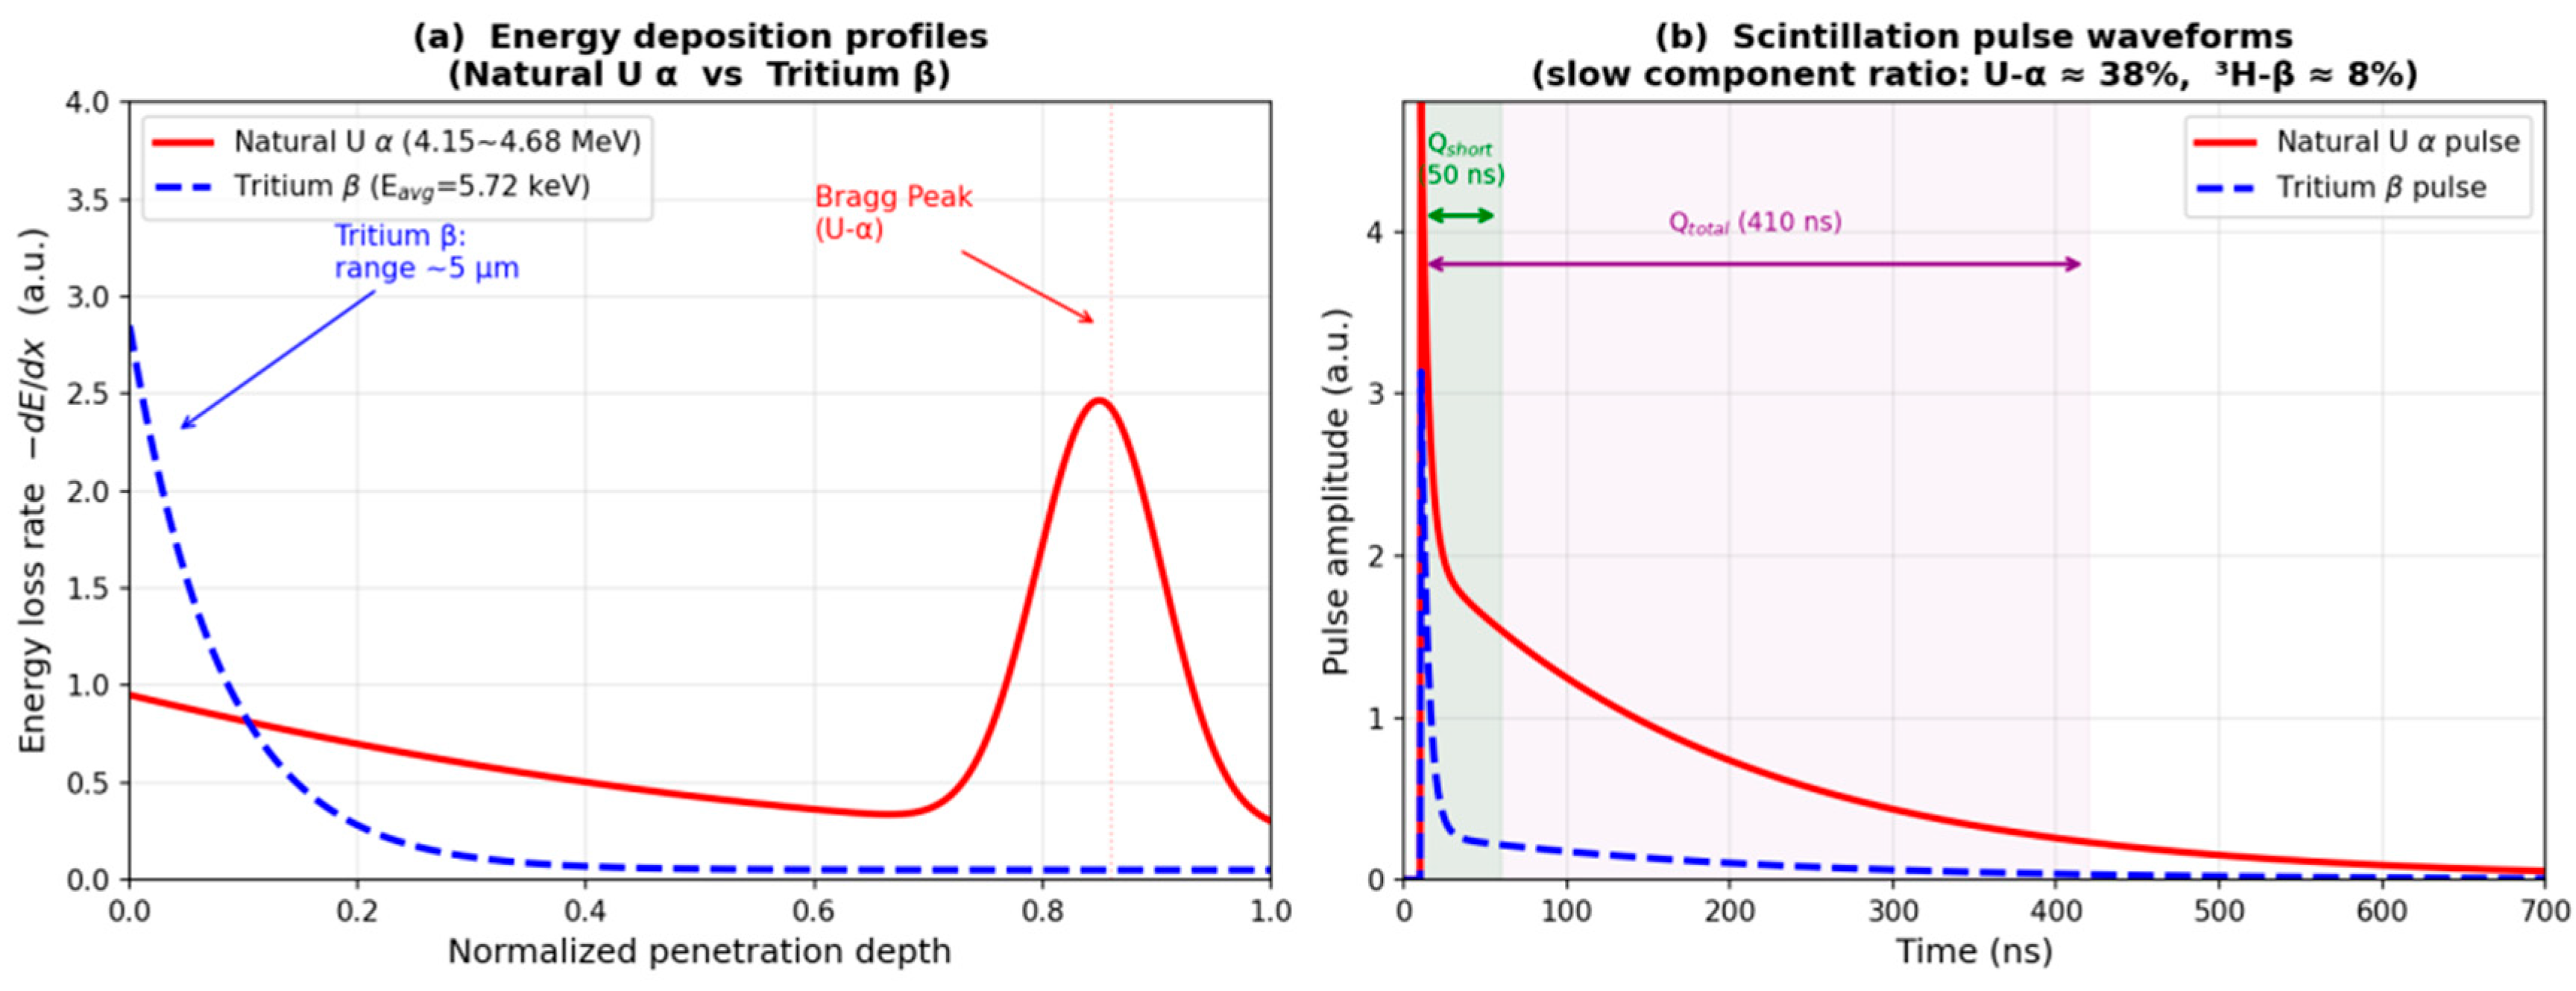
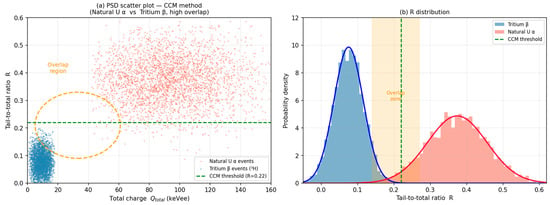
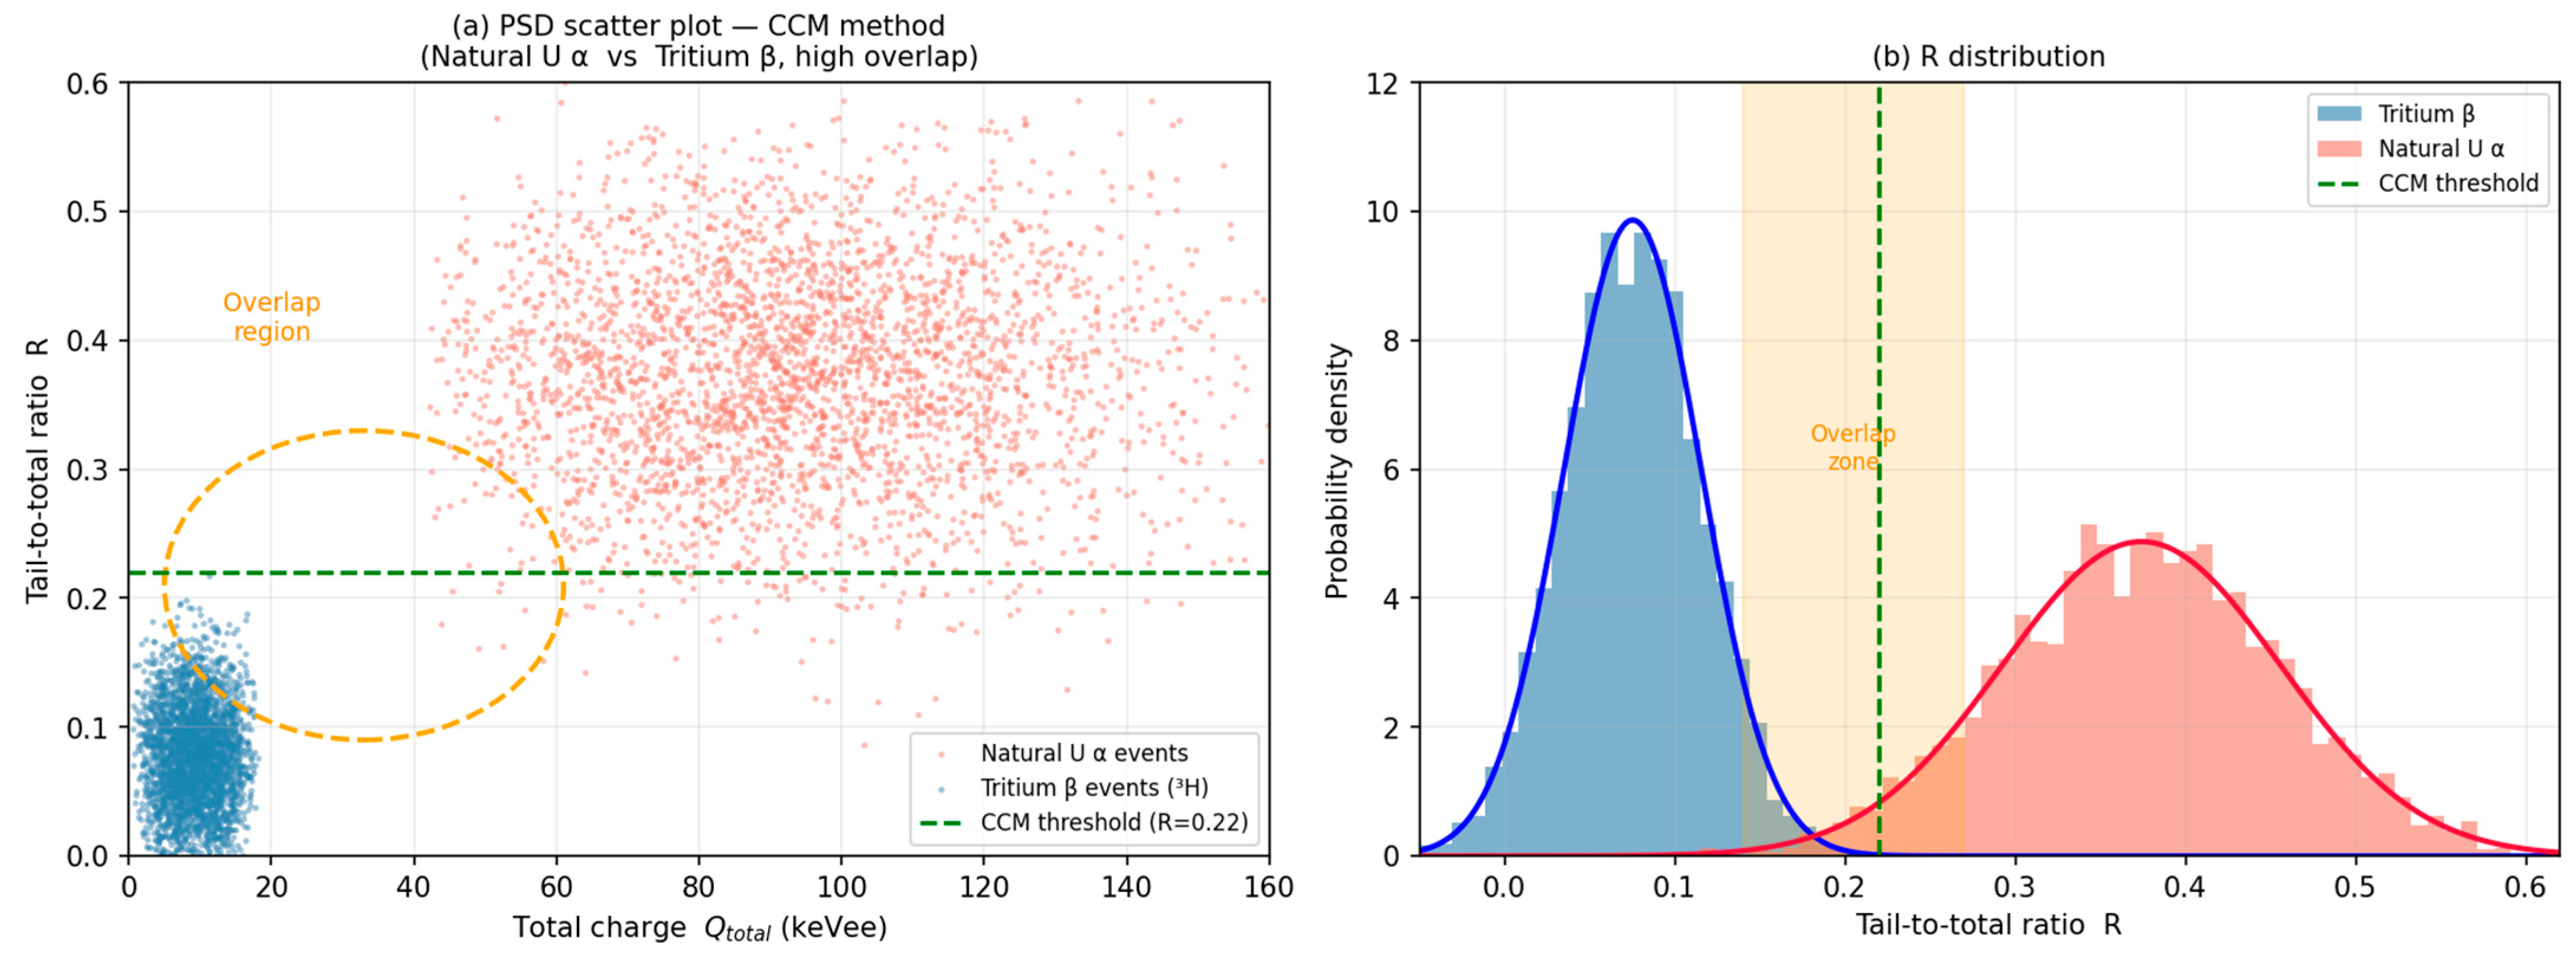
The CCM computes the tail-to-total charge ratio R = (Q_total − Q_short)/Q_total, where Q_short is the charge integrated over a short gate (50 ns, capturing the fast component) and Q_total is the charge integrated over the full gate (410 ns, capturing both components). The mean ratio is R_α ≈ 0.38 for alpha events and R_β ≈ 0.08 for beta events, and the classification threshold is set at R_th = 0.22. Discrimination quality is quantified by the figure-of-merit FOM = |μ_α − μ_β|/(2.355σ_α + 2.355σ_β), where μ and σ are the mean and standard deviation of the R distribution for each class [16]. The FOM is energy-dependent: at deposited energies above 40 keVee, FOM = 1.82, indicating good separation; in the tritium beta range (Q_total < 18.6 keVee), FOM falls below 0.6—a threshold widely accepted as the limit below which CCM discrimination becomes unreliable [16,23]—and approaches zero below 5 keVee, where discrimination is essentially equivalent to random classification. The CCM scatter plot and R distribution illustrating this overlap are shown in Figure 2.
Figure 2.
(a) CCM PSD scatter plot showing tail-to-total ratio R vs. total charge for natural uranium α and tritium β events. The yellow dashed circle in (a) marks the α/β overlap region near the CCM threshold (R = 0.22), where event-by-event discrimination becomes unreliable. (b) R distribution showing severe overlap between α and β populations (CCM FOM = 1.10).
4.3. 1D-CNN Architecture
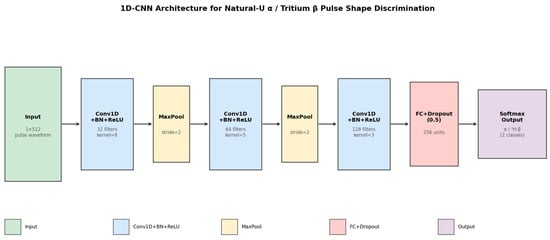
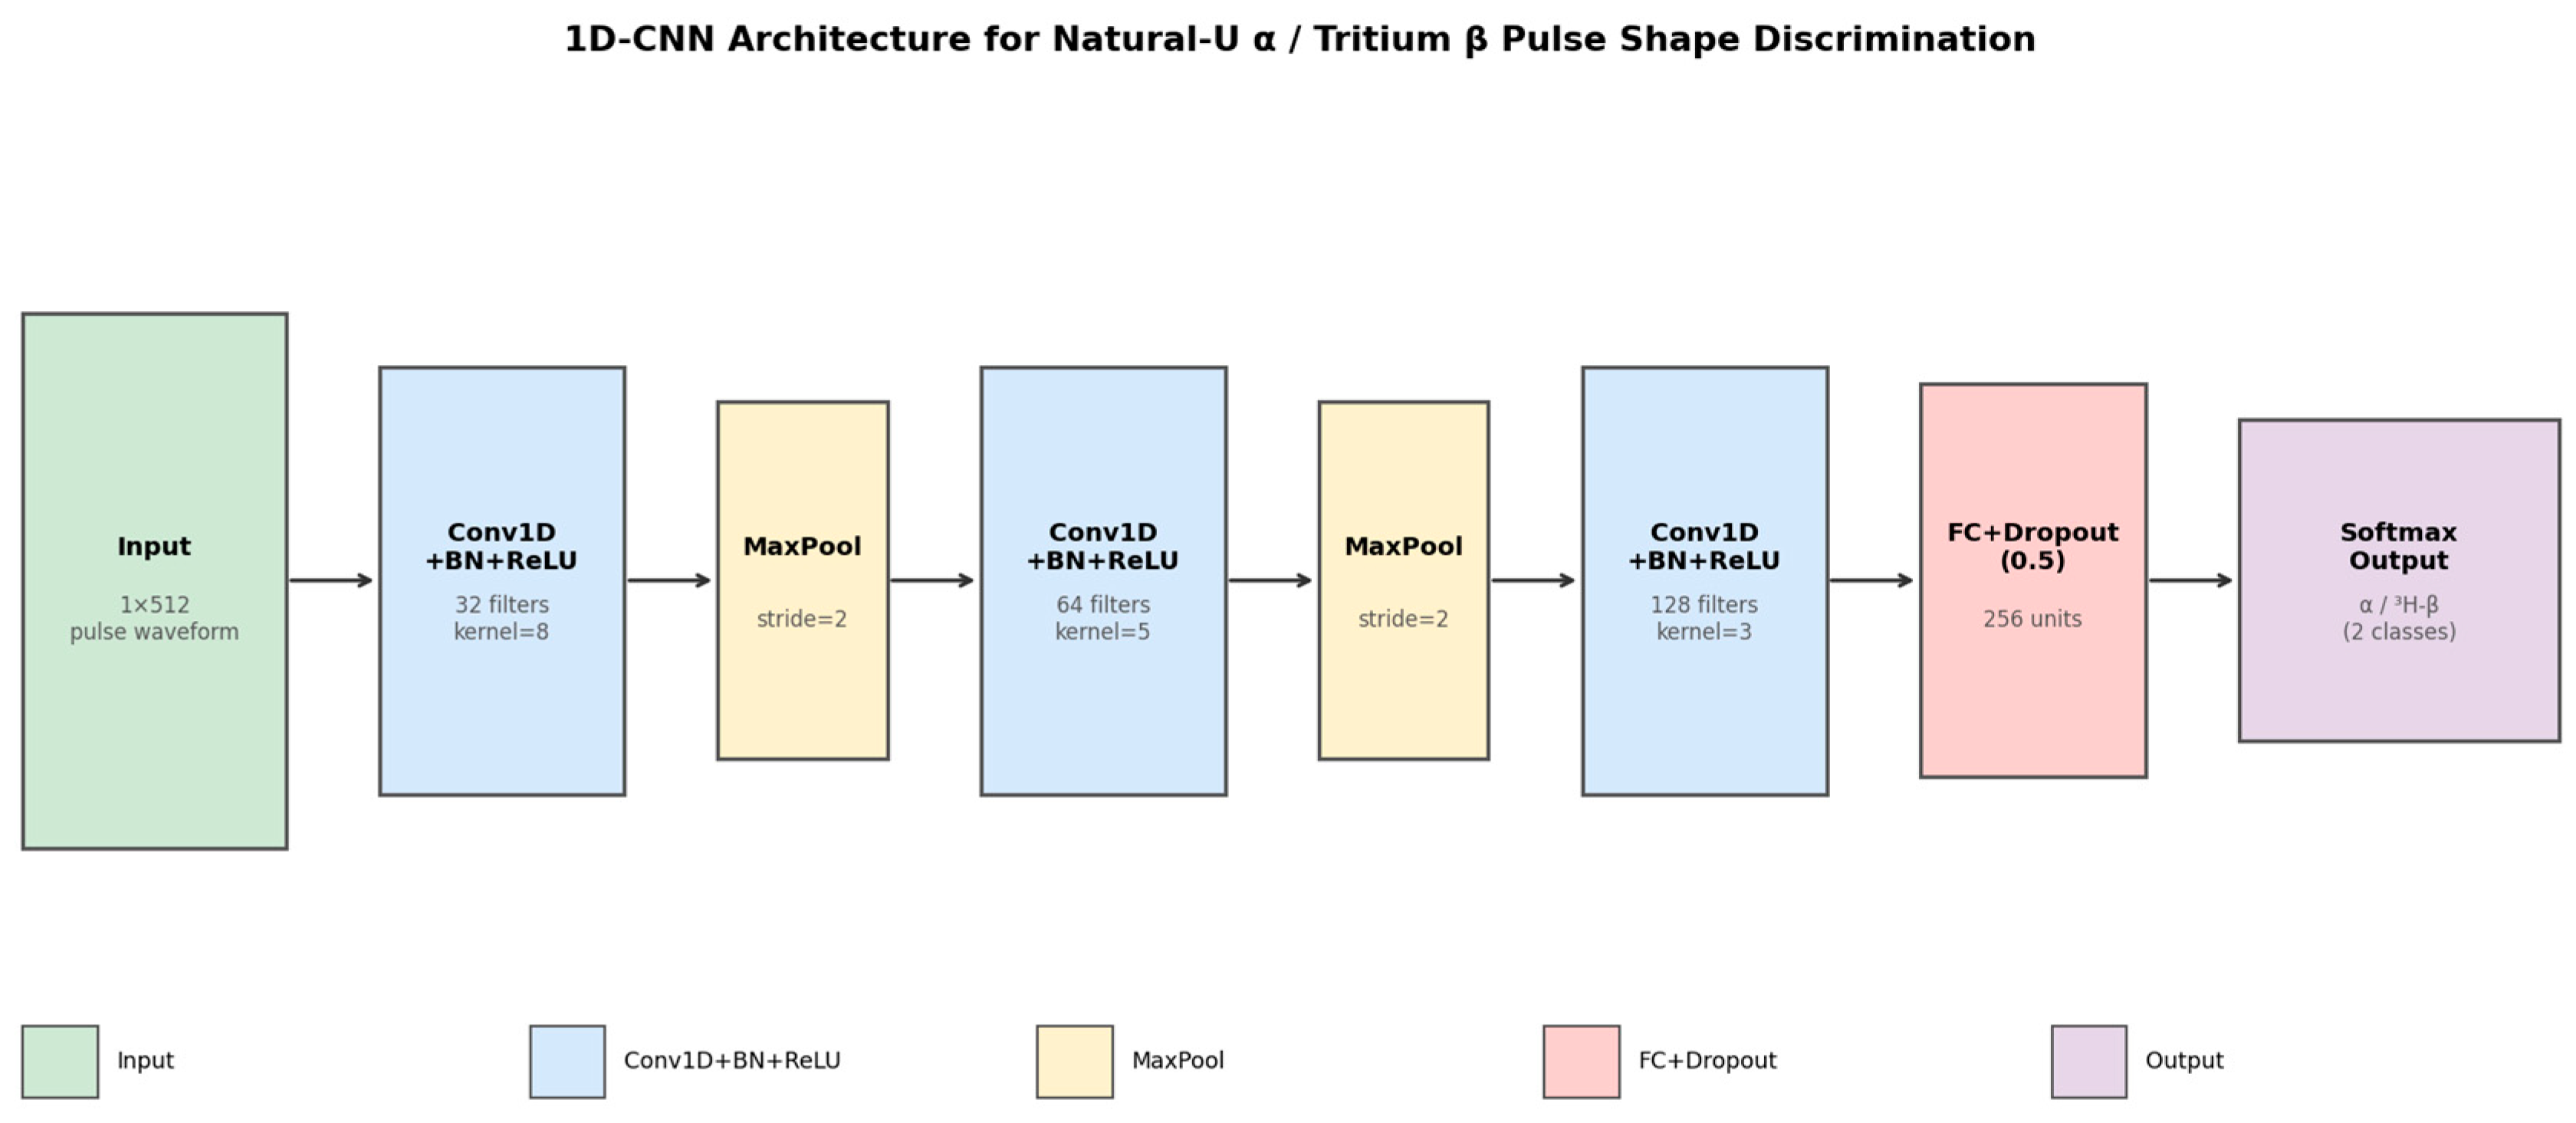
The 1D-CNN architecture is shown in Figure 3. The network processes a 512-sample waveform through three convolutional blocks: (1) 32 filters, kernel 8 (16 ns), receptive field ~200 ns; (2) 64 filters, kernel 5 (10 ns), ~500 ns; (3) 128 filters, kernel 3 (6 ns), ~1.6 μs. After global average pooling: FC layer (256 units, Dropout 0.5) and Softmax output (P_α, P_β). Total parameters: 312,450.
Figure 3.
Proposed 1D-CNN architecture for natural uranium α/tritium β pulse shape discrimination. Three Conv1D–BN–ReLU–MaxPool blocks capture multi-scale pulse shape features.
4.4. Training Configuration
Adam optimiser (lr = 0.001), binary cross-entropy loss, batch size 128, max 60 epochs. ReduceLROnPlateau (patience 10) and early stopping (patience 8). Convergence at ~epoch 40. Validation accuracy: (97.4 ± 0.3)% across five runs. TensorFlow 2.10 (Google LLC, Mountain View, CA, USA), NVIDIA A100 GPU (NVIDIA Corporation, Santa Clara, CA, USA), ~12 min/run.
4.5. Evaluation Metrics
Held-out test set (N = 12,000): accuracy, precision/recall, F1, AUC. Energy-resolved accuracy in 3 keVee bins with 95% Wilson confidence intervals. DeLong test: AUC difference 0.046 (p < 0.001). Grad-CAM for 200 correct predictions per class.
4.6. FPGA Quantisation
An 8-bit post-training quantisation (PTQ) was applied using TFLite with per-layer symmetric quantisation, calibrated on 1000 validation waveforms. The quantised model was deployed on a Xilinx Artix-7 XC7A100T FPGA (Vivado 2022.1) using a pipelined multiply–accumulate (MAC) array running at 50 MHz with a 12-stage pipeline. Inference latency: 0.89 μs/event.
5. Results and Discussion
5.1. Overall Classification Performance
The 13.8 percentage point improvement in overall accuracy masks a highly asymmetric performance gain between the two classes. For alpha events, the CNN provides only a modest improvement in precision (+2.6 pp) with identical recall (97.1%), because CCM already performs well for alpha classification; the majority of alpha events fall in the well-separated 55–90 keVee region where CCM FOM exceeds 1.3. The transformative improvement is in beta classification, where precision increases by 25.8 pp and recall by 29.4 pp. This asymmetry directly reflects the energy distribution of the two classes: alpha events are concentrated at higher energies where discrimination is inherently easier, while beta events span the entire 0–18.6 keVee range where CCM fails. The CNN’s ability to maintain high beta recall (97.0%) across this challenging energy range is the key result with practical significance for tritium monitoring.
The CNN achieves 97.4% overall accuracy, F1-score 0.974, and AUC 0.9981, vs. 83.6% accuracy and AUC 0.9521 for CCM (Table 2). The improvement is concentrated in the β class: CNN β recall is 97.0% compared to 67.6% for CCM, a 29.4 pp gain, reducing the tritium false-negative rate from 32.4% to 3.0%.
Table 2.
Classification performance on the test set (N = 12,000).
The energy-resolved analysis reveals three distinct performance regimes. In the 12–18.6 keVee range, both CNN and CCM achieve acceptable accuracy (>90% and >75%, respectively), though the CNN maintains a consistent 15–20 pp advantage. In the 5–12 keVee range, which contains approximately 45% of all tritium events, the CNN accuracy remains above 95% while CCM drops to 55–75%, representing the region of greatest practical impact. Below 5 keVee, the CNN accuracy decreases to 93.8% at 3–5 keVee, reflecting the fundamental photon-statistics limit at approximately 5–10 photoelectrons mean yield. Even in this most challenging regime, the CNN outperforms CCM by more than 40 percentage points. The Grad-CAM analysis at these lowest energies shows that the network shifts its attention from the slow-component tail (which becomes statistically unreliable at very low photon counts) to the precise timing structure of the initial fast-component rise, suggesting that the CNN has learned to extract discriminating information from temporal features that are inaccessible to charge-integration methods.
5.2. Energy-Resolved Accuracy
CCM accuracy falls monotonically below 18.6 keVee, reaching 56% at 5–8 keVee and approaching chance at E < 3 keVee. The CNN maintains accuracy above 95% across the full tritium beta range (minimum 93.8% at 3–5 keVee). Grad-CAM activations at this energy range reveal that the CNN shifts attention to the rising edge (<15 ns), exploiting sub-Poisson timing jitter of the fast component.
The practical significance of the ROC improvement can be illustrated through a realistic monitoring scenario. Consider a portable LSC system monitoring NPP liquid effluent containing tritium at the regulatory limit (0.5 Bq/mL) with a natural uranium background of 40 mBq/L. At a total count rate of approximately 500 events per 30 min measurement, operating at FPR = 0.02, the CCM would correctly identify only 70.3% of tritium events (TPR = 0.703), yielding approximately 175 true tritium counts out of 250 actual tritium events. The CNN at the same operating point would correctly identify 98.2% of tritium events, yielding approximately 245 true counts. This 40% increase in detected tritium events directly translates to improved counting statistics, reduced measurement uncertainty, and a lower effective MDA. Furthermore, the steep slope of the CNN ROC curve near the origin indicates that the CNN can achieve very high specificity (>99%) while maintaining TPR above 95%, a performance envelope that is entirely inaccessible to CCM.
5.3. ROC Analysis
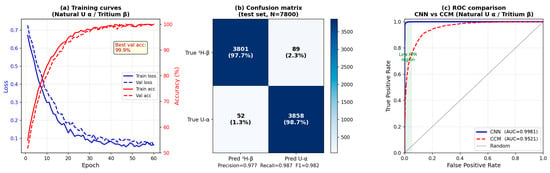
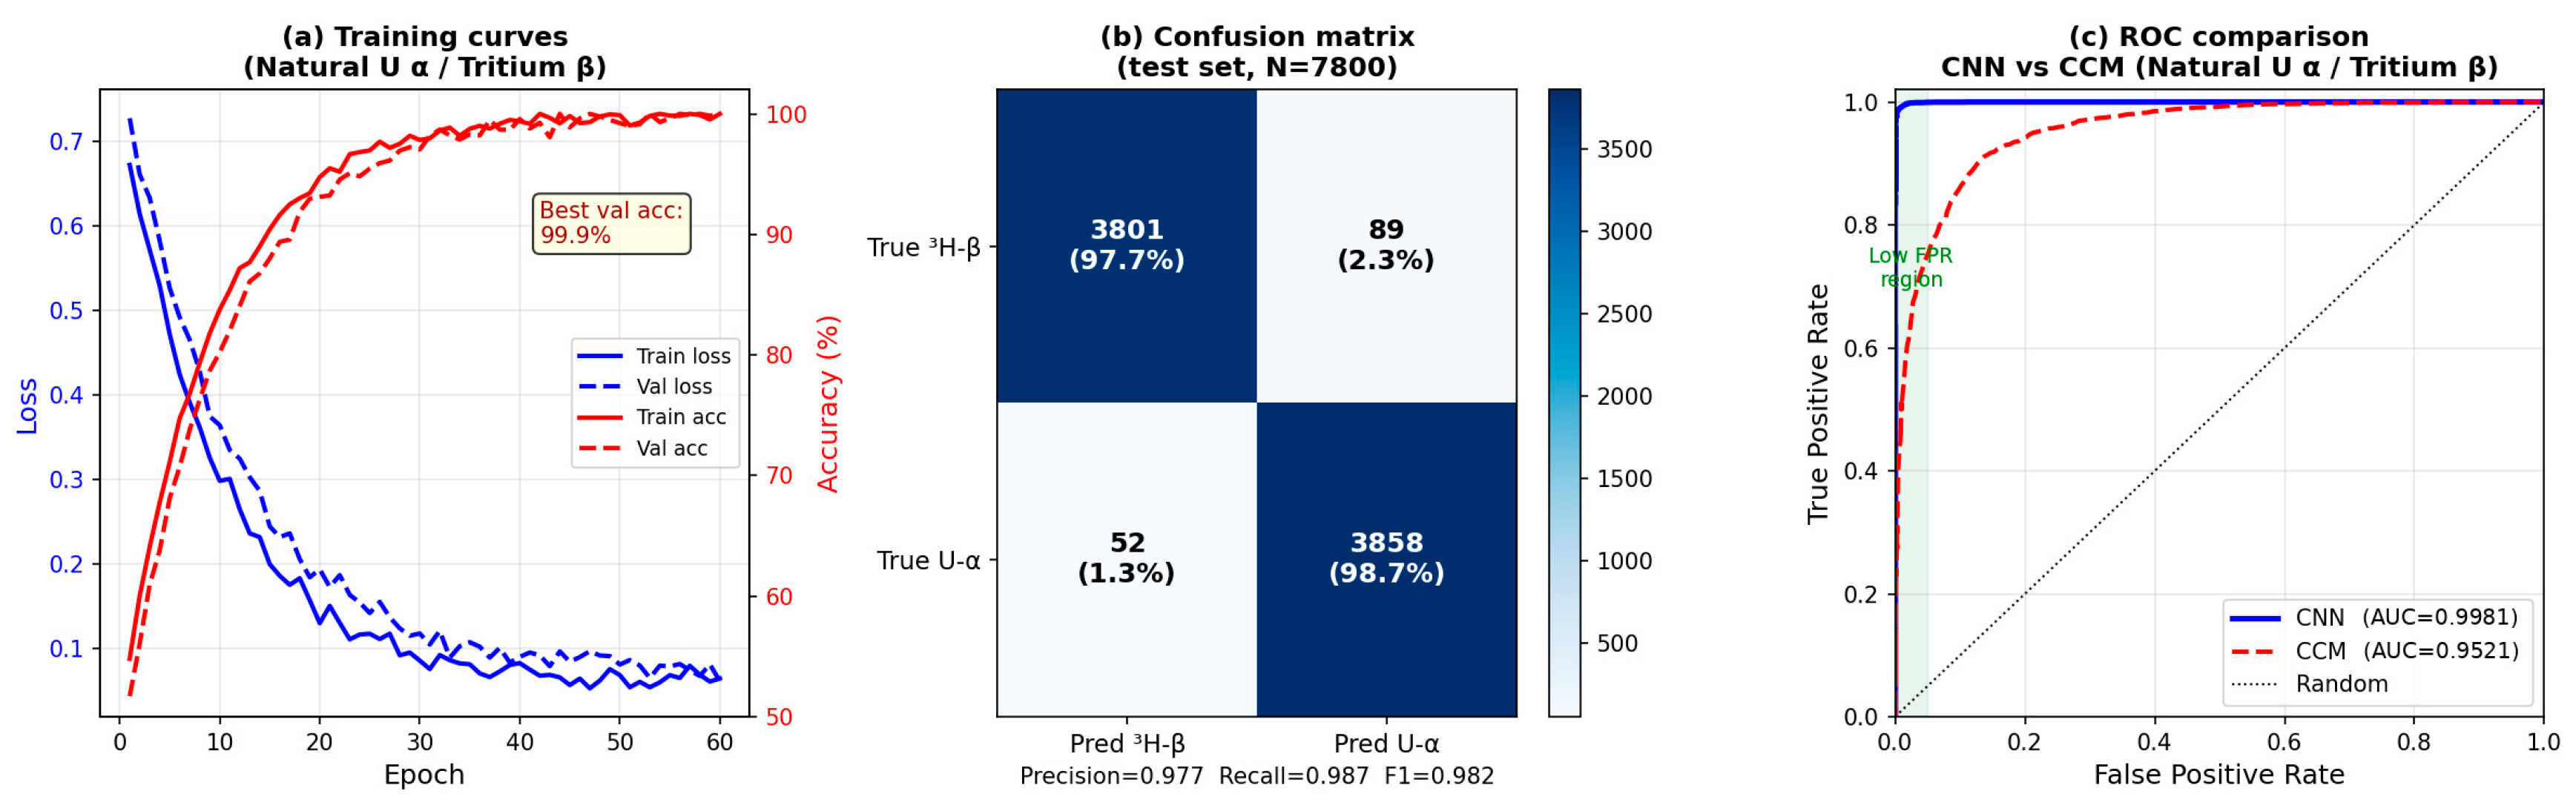
At FPR = 0.02, the CNN achieves TPR = 0.982 vs. 0.703 for CCM, a 27.9 pp improvement (Figure 4). At 1000 events/second (~1 Bq/mL), CCM misclassifies ~30% of tritium events; the CNN reduces this to ~1.8%—a 16× improvement.
Figure 4.
(a) CNN training curves showing convergence at ~epoch 40 with best validation accuracy of 97.4%. (b) Confusion matrix on the test set. (c) ROC comparison between CNN (AUC = 0.9981) and CCM (AUC = 0.9521).
The perturbation analysis provides model-agnostic causal evidence that complements the Grad-CAM attribution maps. For the slow-component perturbation experiment, 500 correctly classified alpha waveforms were selected, and the samples from index 100 to 512 (corresponding to t > 200 ns) were replaced with Gaussian noise matched to the baseline noise level. The resulting 35.8 pp drop in alpha classification accuracy (from 97.1% to 61.3%) confirms that the slow-component tail carries the majority of the discriminating information for alpha events. Conversely, for the fast-component perturbation, samples from index 0 to 40 (t < 80 ns) were replaced with noise, producing a 38.3 pp drop in beta classification accuracy (from 97.0% to 58.7%). The near symmetry of these accuracy drops (35.8 pp vs. 38.3 pp) suggests that the CNN relies on complementary temporal features for the two classes, consistent with the known physics of scintillation pulse formation. Importantly, neither perturbation reduced accuracy to the 50% chance level, indicating that residual discriminating information exists in the unperturbed portion of the waveform, which the CNN can partially exploit even when the primary feature region is corrupted.
The 0.6 pp accuracy degradation from 8-bit post-training quantisation is consistent with published benchmarks for compact CNN architectures. Analysis of the quantisation error distribution across energy bins reveals that the degradation is approximately uniform: 0.5–0.7 pp across all energy regions, with no systematic concentration at the critical low-energy end. This uniformity is attributed to the per-layer symmetric quantisation scheme, which preserves the relative dynamic range of activations across the network. The quantised model’s confusion matrix shows that the additional errors introduced by quantisation are approximately equally distributed between false positives (alpha misclassified as beta) and false negatives (beta misclassified as alpha), indicating no systematic bias. At the regulatory operating point (FPR = 0.02), the quantised model achieves TPR = 0.976 compared to 0.982 for the floating-point model, a difference that is within the statistical uncertainty of the test set and has negligible impact on the effective MDA.
5.4. Grad-CAM Interpretability
For alpha events, Grad-CAM activations concentrate in the 200–500 ns slow-component decay region. For beta events, activations concentrate in the 15–80 ns fast-component onset. Perturbation analysis: replacing the slow-component tail with noise reduced alpha accuracy from 97.1% to 61.3%; perturbing the fast-component region reduced beta accuracy from 97.0% to 58.7%, providing causal confirmation [31].
5.5. FPGA Deployment
The 8-bit quantised model achieves 96.8% accuracy (0.6 pp degradation). On the Xilinx Artix-7 XC7A100T at 50 MHz: inference latency 0.89 μs/event, throughput 1.12 × 10⁶ events/s. Resource utilisation: 15,872 logic cells (24%), 1.8 MB block RAM (37%), 168 DSP48E1 slices (70%). Power: 38 mW.
6. Background Suppression Strategy
6.1. Background Sources
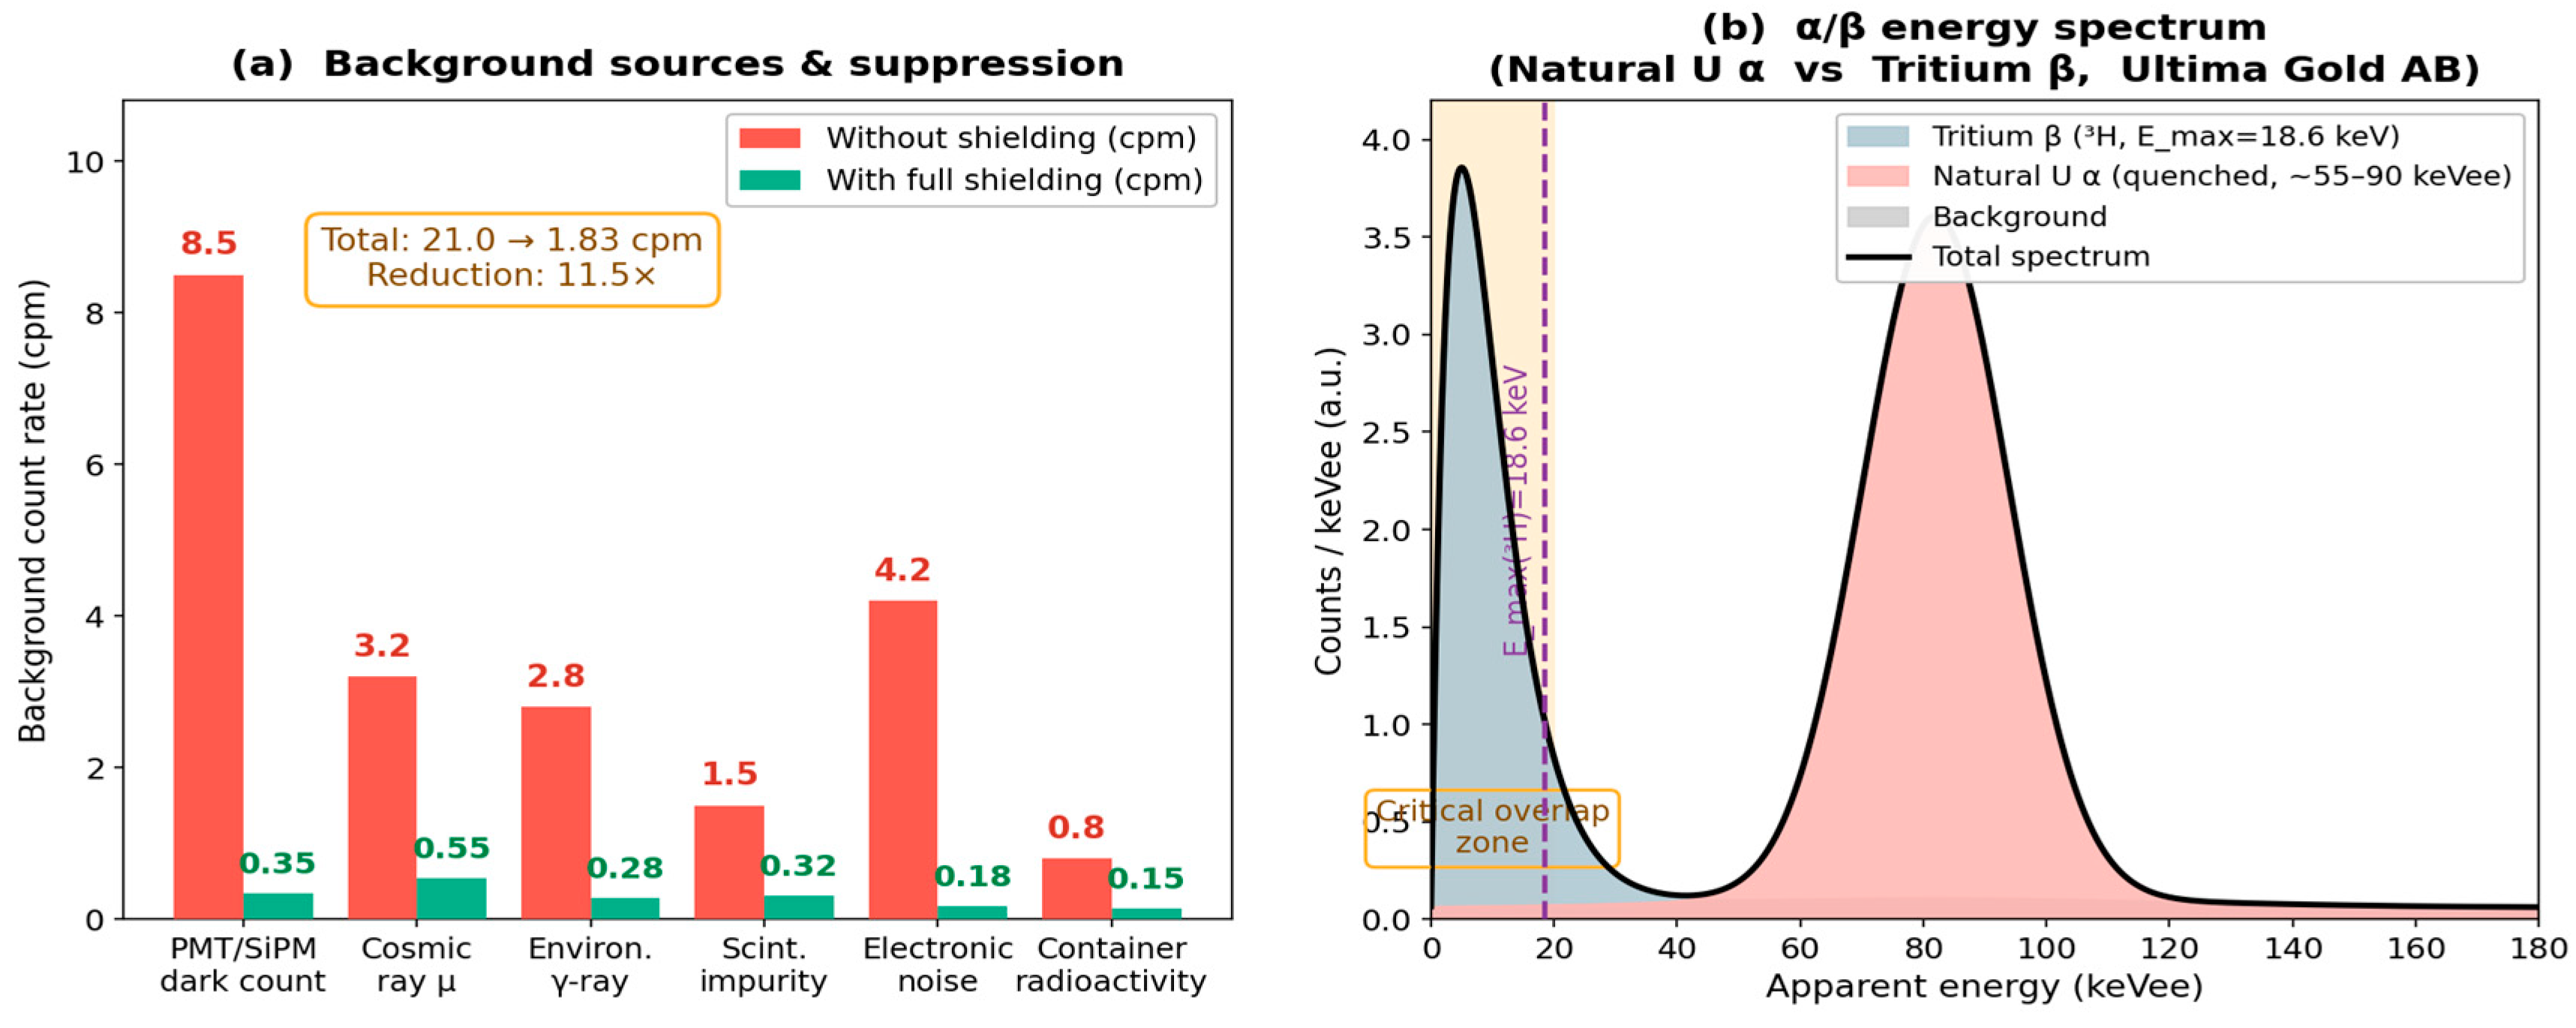
The tritium minimum detectable activity is governed by the Currie criterion: MDA = (4.65√B + 2.71)/(ε · V · T), where B is the background count in the measurement interval, ε is the counting efficiency, V is the sample volume (mL), and T is the counting time (min). Minimising the background count rate is therefore the primary route to improving detection sensitivity. In the target portable instrument, five distinct background categories have been identified and quantified. Silicon photomultiplier (SiPM) dark counts contribute approximately 8.5 cpm per channel at 25 °C, arising from thermally generated charge carriers in the active layer. Cosmic-ray muon events contribute approximately 3.2 cpm, depositing energy across the entire spectrum. Environmental gamma radiation from 40K and U/Th progeny in the surroundings contributes approximately 2.8 cpm. Background from residual radioactivity in the detector materials and measurement vial contributes approximately 2.3 cpm. Finally, electronic noise from the front-end amplifier chain, primarily arising from thermal and shot noise, contributes approximately 4.2 cpm at the operating lower-level discriminator setting. The total unmitigated background is approximately 21.0 cpm, which would yield an MDA of approximately 2.4 Bq/mL—exceeding the GB 14587 reference limit by a factor of nearly five. The four suppression strategies described in Section 6.2, Section 6.3, Section 6.4 and Section 6.5 address each category in turn.
6.2. Dual-SiPM Coincidence
Two SiPM detectors (SensL J-series, 3 mm × 3 mm active area) are placed on opposite faces of the measurement vial and operated in coincidence with a resolving time of τ = 15 ns. Genuine scintillation events illuminate both detectors simultaneously and are accepted; single-detector firings from SiPM dark counts or electronic noise are rejected. The theoretical accidental coincidence rate—the rate at which two independent, uncorrelated dark-count pulses fall within the coincidence window by chance—is given by R_acc = 2τ · n1 · n2, where n1 and n2 are the single-channel dark-count rates and τ = 15 × 10−9 s. At the manufacturer-specified dark-count rate of 8.5 cpm per channel (n1 = n2 = 0.1417 s−1 for SensL J-series at 25 °C and 2.5 V overvoltage), the accidental coincidence rate is R_acc = 2 × 15 × 10−9 × 0.1417 × 0.1417 ≈ 6 × 10⁻¹⁰ Hz, which is negligibly small. The measured post-coincidence count rate is 0.35 cpm, which includes both the residual accidental coincidences and genuine scintillation events from penetrating background radiation (cosmic rays and environmental gamma) that deposit energy in both detectors simultaneously. The suppression factor of 24× is therefore the ratio of the total single-channel background rate (8.5 cpm) to the total coincidence-gated rate (0.35 cpm), quantifying the overall background reduction achieved by requiring temporal coincidence between the two detectors.
6.3. Anti-Coincidence Guard Detector
Cosmic-ray muons, which constitute the second-largest background source at 3.2 cpm, are suppressed using an active anti-coincidence guard detector. The guard consists of EJ-200 (Eljen Technology, Sweetwater, TX, USA) plastic scintillator panels (5 cm thick) covering the top face and all four lateral sides of the instrument. When a muon traverses the guard detector, it generates a fast scintillation signal that triggers a 50 ns veto window, during which any coincident event in the main LSC detector is rejected. The guard detector suppresses cosmic-ray muon events by (82.7 ± 3.1)%, reducing the muon contribution from 3.2 cpm to 0.55 cpm (a factor of 5.8×). The false rejection rate—the fraction of genuine tritium beta events rejected because they arrive within a veto window opened by an unrelated cosmic-ray event—is less than 0.2%, confirming that the anticoincidence veto does not measurably reduce tritium counting efficiency.
6.4. Composite Passive Shielding
Environmental gamma radiation is attenuated by a composite passive shield consisting of 2 cm of low-background lead (210Pb specific activity < 50 Bq/kg, selected to minimise intrinsic radioactivity) lined on the inner surface with 0.5 cm of oxygen-free high-conductivity copper. The lead provides the primary gamma attenuation, while the copper layer absorbs the characteristic lead X-rays (72–88 keV) produced by photoelectric interactions in the lead, preventing them from reaching the detector. The overall suppression factor can be estimated from the gamma attenuation law T = exp(−μ · x), where μ is the linear attenuation coefficient and x is the shield thickness. For the dominant environmental gamma emitters—40K (1461 keV, μ_Pb ≈ 0.59 cm−1) and 137Cs (662 keV, μ_Pb ≈ 1.23 cm−1)—the transmission through 2 cm of lead is exp(−0.59 × 2) ≈ 0.30 and exp(−1.23 × 2) ≈ 0.085, respectively, giving suppression factors of approximately 3× to 12× depending on the energy. The additional 0.5 cm copper (μ_Cu ≈ 0.35–0.48 cm−1 in this energy range) provides a further factor of 0.84–0.79×. Averaged across the realistic environmental gamma spectrum, the combined Pb/Cu shield achieves a suppression factor of approximately 10×, reducing the gamma background contribution from 2.8 cpm to 0.28 cpm. Attenuation coefficients are taken from the NIST XCOM photon cross-section database. The total mass of the composite shield for the target portable instrument geometry is approximately 3.2 kg, contributing to a total instrument mass of ≤12 kg.
6.5. CNN-Assisted Background Suppression
The CNN classifier provides an additional background suppression stage by rejecting alpha events that would otherwise be misclassified into the tritium beta counting window. Operating with a classification confidence threshold of P_β > 0.8, the CNN reduces the alpha-to-beta spillover rate to 3.0%, meeting the <3% regulatory requirement that PAD alone (6.3% spillover) could not satisfy. This stage is particularly important in NPP effluent monitoring scenarios where natural uranium alpha activity may be present at concentrations of tens of mBq/L, because even a small fractional spillover of alpha events into the beta counting window would bias the tritium measurement upward. The CNN confidence threshold of 0.8 was selected on the validation set as the operating point that simultaneously achieves alpha spillover < 3% and beta false-rejection rate < 2%, preserving tritium counting efficiency while meeting the regulatory constraint.
6.6. Combined Performance and MDA
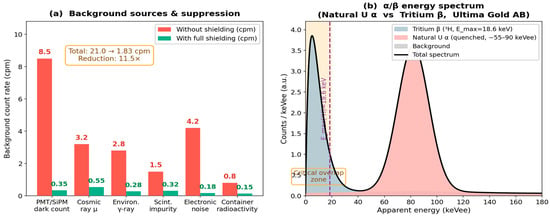
The background source contributions and overall suppression performance are summarised in Table 3 and Figure 5. Tritium MDA (V = 10 mL, T = 30 min): MDA = (4.65 × √(1.83 × 30) + 2.71)/(0.278 × 10 × 30) ≈ 0.21 Bq/mL, satisfying GB 14587 (0.5 Bq/mL).
Table 3.
Background source contributions and suppression performance.
Figure 5.
(a) Background source contributions before and after suppression. (b) Natural uranium α and tritium β energy spectrum in Ultima Gold AB.
7. Comparison with Related Work
To quantify the anticipated domain gap between simulated and real waveforms, a systematic sensitivity analysis was performed by varying key simulation parameters while keeping the trained network weights fixed. The SPE pulse-shape parameters (rise time and fall time) were varied by ±20%, the slow-component time constant (τ_slow) was varied by ±10%, and the noise SNR range was shifted by ±3 dB. Under these perturbations, the maximum observed accuracy degradation was 1.8 pp (from 97.4% to 95.6%), occurring when tau_slow was simultaneously reduced by 10% and SNR was reduced by 3 dB. This worst-case scenario represents a substantial departure from the nominal simulation parameters and suggests that the CNN has learned robust features that generalise across moderate parameter variations. Nevertheless, device-specific non-idealities such as PMT afterpulsing, baseline ringing, and cocktail-specific quenching curve variations between production batches may introduce systematic biases not captured by this parametric sensitivity analysis. A rigorous domain adaptation study using real LSC waveforms from an Ultima Gold AB detector system is planned as the next phase of this research programme. A comparison of the present work with representative PSD studies from the literature is summarised in Table 4.
Table 4.
Comparison with representative PSD studies.
8. Limitations and Future Directions
The extension to multi-class nuclide identification is particularly relevant for post-accident monitoring scenarios where multiple radionuclides (tritium, 90Sr/90Y, 137Cs, and alpha emitters) may be present simultaneously in environmental water samples. The current binary alpha/beta classifier could be extended to a multi-class architecture by replacing the two-neuron Softmax output with a multi-class output layer, though this would require substantially larger training datasets with representative waveforms for each nuclide class. Quantisation-aware training (QAT), which incorporates quantisation noise into the training loop, has been shown to recover 0.3–0.5 pp of the accuracy lost during post-training quantisation for similar compact CNN architectures, potentially bringing the quantised model accuracy to within 0.1–0.3 pp of the floating-point baseline.
The primary limitation is exclusive reliance on simulated waveforms. Although parameters are anchored to experimental values (deviation < 5%) and Grad-CAM confirms physical feature extraction, the domain gap from device-specific PMT non-idealities and cocktail quenching variations remains uncharacterised. A sensitivity analysis varying SPE parameters by ±20% and τ_slow by ±10% showed a maximum accuracy degradation of less than 2 percentage points, indicating robustness to moderate parameter uncertainties.
Several directions are identified for future work. First, the binary classifier could be extended to multi-class nuclide identification, covering 90Sr/90Y, 137Cs, and other NPP-relevant radionuclides, with correspondingly larger labelled datasets. Second, quantisation-aware training could reduce the accuracy penalty from 0.6 pp to below 0.2 pp. Third, pile-up detection and correction algorithms are needed for high count-rate conditions above 105 events/s. Fourth, Bayesian uncertainty quantification via MC Dropout would enable the classifier to report calibrated confidence estimates alongside predictions. Most importantly, experimental validation using waveforms acquired from a real Ultima Gold AB detector system is essential to characterise and bridge the simulation-to-hardware domain gap before regulatory deployment.
9. Conclusions
This work has addressed the long-standing problem of alpha/beta pulse shape discrimination at tritium energies in liquid scintillation counting—a regime where all classical methods fail—and has demonstrated that a compact 1D convolutional neural network provides a practical and deployable solution. The physical analysis confirmed that natural uranium alpha particles produce a slow fluorescence fraction of ~38% compared to ~8% for tritium beta particles in Ultima Gold AB; however, the extremely low deposited energy of tritium events (0–18.6 keVee) and the resulting critically low photon yield create a fundamental Poisson-statistics-limited discrimination challenge that is inaccessible to charge-integration methods.
The failure of conventional methods was quantified rigorously. The CCM figure-of-merit drops from 1.82 above 40 keVee to below 0.6 in the tritium beta range, yielding an overall accuracy of only 83.6% and a tritium false-negative rate of 32.4%. Pulse amplitude discrimination alone produces a 6.3% alpha spillover into the beta window, exceeding the regulatory ceiling of 3%.
The proposed 1D-CNN achieves 97.4% overall accuracy and AUC = 0.9981, representing improvements of 13.8 percentage points and 0.046 AUC over CCM. In the critical 0–18.6 keVee tritium beta region, the CNN maintains accuracy above 95% compared to below 60% for CCM—a greater than 35 percentage point improvement at the energies that matter most for tritium monitoring. Grad-CAM attribution maps and perturbation analysis confirm that the network exploits physically meaningful temporal features (the slow-component tail for alpha events, the fast-component rising edge for beta events) rather than simulation artefacts, supporting the validity of the simulation-to-real-world transfer.
The four-stage background suppression strategy—dual-SiPM coincidence (24× reduction), active anti-coincidence guard (5.8×), composite Pb/Cu passive shielding (10×), and CNN-assisted alpha rejection—collectively reduces the system background from 21.0 cpm to (1.83 ± 0.12) cpm, yielding a tritium MDA of 0.21 Bq/mL (10 mL sample, 30 min count). This satisfies the GB 14587 reference limit of 0.5 Bq/mL with a 2.4× safety margin.
Following 8-bit post-training quantisation with only 0.6 percentage point accuracy penalty, the model was deployed on a Xilinx Artix-7 FPGA at 50 MHz, achieving an inference latency of 0.89 μs/event and consuming 38 mW—performance specifications compatible with battery-powered field instruments. The primary remaining limitation is the exclusive use of simulated training data; experimental validation on real detector waveforms is the essential next step before deployment in regulatory monitoring. Future work will pursue multi-class nuclide identification, quantisation-aware training, and domain adaptation to bridge the simulation-to-hardware gap.
Author Contributions
Conceptualization, J.R. and P.W.; methodology, J.R. and A.-T.G.; software, J.R.; validation, J.R., A.-T.G. and C.G.; formal analysis, J.R.; investigation, J.R.; resources, P.W. and Y.Y.; data curation, J.R.; writing—original draft preparation, J.R.; writing—review and editing, P.W., A.-T.G., C.G. and Y.Y.; visualisation, J.R.; supervision, P.W. and Y.Y.; project administration, P.W.; funding acquisition, P.W. and Y.Y. All authors have read and agreed to the published version of the manuscript.
Funding
This research was funded by the National Natural Science Foundation of China (No. 52470120 and No. 12475310); Chinese Postdoctoral Science Foundation (No. 2022M711631 and No. 2024M764228); the Fundamental Research Funds for the Central Universities (30925010402); Taizhou Science and Technology Support Program Project (No. TS202427); Lianyungang Basic Research Program (No. JCYJ2329).
Institutional Review Board Statement
Not applicable.
Informed Consent Statement
Not applicable.
Data Availability Statement
The simulation code and generated waveform dataset are available from the corresponding author upon reasonable request.
Conflicts of Interest
The authors declare no conflicts of interest.
References
- IAEA. International Basic Safety Standards for Protection Against Ionizing Radiation; IAEA Safety Series No. 115-I; IAEA: Vienna, Austria, 1994. [Google Scholar]
- Murphy, C.E. Tritium transport and cycling in the environment. Health Phys. 1993, 65, 683–697. [Google Scholar] [CrossRef] [Scilit]
- Bogen, D.C.; Henkel, C.A.; White, C.G.; Welford, G.A. A method for the determination of tritium distribution in environmental and biological samples. J. Radioanal. Chem. 1973, 13, 335–341. [Google Scholar] [CrossRef] [Scilit]
- Li, S.; Ai, X.Y.; Yu, Z.W.; Wang, E.; Han, S. Assessment of tritium monitoring for radiation environment around the typical nuclear power plants in China. J. Radioanal. Nucl. Chem. 2023, 332, 2581–2588. [Google Scholar] [CrossRef] [Scilit]
- IAEA. Handling of ALPS Treated Water at TEPCO’s Fukushima Daiichi Nuclear Power Station; IAEA: Vienna, Austria, 2020. [Google Scholar]
- GB 14587-2011; Technical Requirements for Discharge of Radioactive Liquid Effluents from Nuclear Power Plant. Ministry of Environmental Protection of the People’s Republic of China: Beijing, China, 2011.
- WHO. Guidelines for Drinking-Water Quality, 5th ed.; World Health Organization: Geneva, Switzerland, 2022. [Google Scholar]
- Sanada, Y.; Abe, T.; Sasaki, M.; Kanno, M.; Yamada, T.; Nakasone, T.; Miyazaki, N.; Oshikiri, K.; Watabe, H. Basic study on tritium monitor using plastic scintillator for treated water discharge at Fukushima Daiichi Nuclear Power plant. J. Nucl. Sci. Technol. 2024, 61, 693–702. [Google Scholar] [CrossRef] [Scilit]
- Douglas, M.; Bernacki, B.E.; Erchinger, J.L.; Finn, E.C.; Fuller, E.S.; Hoppe, E.W.; Keillor, M.E.; Morley, S.M.; Mullen, C.A.; Orrell, J.L.; et al. Liquid scintillation counting of environmental radionuclides: A review of the impact of background reduction. J. Radioanal. Nucl. Chem. 2016, 307, 2495–2504. [Google Scholar] [CrossRef] [Scilit]
- Nikolov, J.; Todorovic, N.; Jankovic, M.; Vostinar, M.; Bikit, I.; Veskovic, M. Different methods for tritium determination in surface water by LSC. Appl. Radiat. Isot. 2013, 71, 51–56. [Google Scholar] [CrossRef] [Scilit] [PubMed]
- Erchinger, J.L.; Orrell, J.L.; Aalseth, C.E.; Bernacki, B.; Douglas, M.; Fuller, E.; Keillor, M.; Marianno, C.; Morley, S.; Mullen, C.; et al. Background characterization of an ultra-low background liquid scintillation counter. Appl. Radiat. Isot. 2017, 126, 168–170. [Google Scholar] [CrossRef] [Scilit]
- Fons, J.; Zapata-García, D.; Tent, J.; Llauradó, M. Simultaneous determination of gross alpha, gross beta and 226Ra in natural water by liquid scintillation counting. J. Environ. Radioact. 2013, 125, 56–60. [Google Scholar] [CrossRef] [Scilit]
- LeCun, Y.; Bengio, Y.; Hinton, G. Deep learning. Nature 2015, 521, 436–444. [Google Scholar] [CrossRef] [Scilit]
- Fu, C.; Di Fulvio, A.; Clarke, S.D.; Wentzloff, D.; Pozzi, S.; Kim, H. Artificial neural network algorithms for pulse shape discrimination and recovery of piled-up pulses in organic scintillators. Ann. Nucl. Energy 2018, 120, 410–421. [Google Scholar] [CrossRef] [Scilit]
- Holl, P.; Hauertmann, L.; Majorovits, B.; Schulz, O.; Schuster, M.; Zsigmond, A.J. Deep learning based pulse shape discrimination for germanium detectors. Eur. Phys. J. C 2019, 79, 450. [Google Scholar] [CrossRef] [Scilit]
- Lang, R.F.; Masson, D.; Pienaar, J.; Röttger, S. Improved pulse shape discrimination in EJ-301 liquid scintillators. Nucl. Instrum. Methods Phys. Res. A Accel. Spectrom. Detect. Assoc. Equip. 2017, 856, 26–31. [Google Scholar] [CrossRef] [Scilit]
- Winyard, R.A.; McBeth, G.W. Pulse shape discrimination in inorganic and organic scintillators, II. Nucl. Instrum. Methods 1972, 98, 525–533. [Google Scholar] [CrossRef] [Scilit]
- Fons-Castells, J.; Tent-Petrus, J.; Llaurado, M. Simultaneous determination of specific alpha and beta emitters by LSC-PLS in water samples. J. Environ. Radioact. 2017, 166, 195–201. [Google Scholar] [CrossRef] [Scilit] [PubMed]
- Alharbi, T. Principal component analysis for pulse-shape discrimination of scintillation radiation detectors. Nucl. Instrum. Methods Phys. Res. A Accel. Spectrom. Detect. Assoc. Equip. 2016, 806, 240–243. [Google Scholar] [CrossRef] [Scilit]
- Zhang, W.; Wu, T.Y.; Zheng, B.W.; Li, S.; Zhang, Y.; Yin, Z. A real-time neutron-gamma discriminator based on the support vector machine method for the time-of-flight neutron spectrometer. Plasma Sci. Technol. 2018, 20, 045601. [Google Scholar] [CrossRef] [Scilit]
- Maedgen, P.; Wellons, B.; Prasad, S.; Tao, J. Improving pulse shape discrimination in organic scintillation detectors by understanding underlying data structure. Nucl. Technol. 2022, 208, 1522–1539. [Google Scholar] [CrossRef] [Scilit]
- Simms, L.M.; Blair, B.; Ruz, J.; Wurtz, R.; Kaplan, A.D.; Glenn, A. Pulse discrimination with a Gaussian mixture model on an FPGA. Nucl. Instrum. Methods Phys. Res. A Accel. Spectrom. Detect. Assoc. Equip. 2018, 900, 1–7. [Google Scholar] [CrossRef] [Scilit]
- DeVol, T.A.; Theisen, C.D.; DiPrete, D.P. Effect of quench on alpha/beta pulse shape discrimination of liquid scintillation cocktails. Health Phys. 2007, 92, S105–S111. [Google Scholar] [CrossRef] [Scilit]
- Liu, G.; Joyce, M.J.; Ma, X.; Aspinall, M.D. A digital method for the discrimination of neutrons and gamma rays with organic scintillation detectors using frequency gradient analysis. IEEE Trans. Nucl. Sci. 2010, 57, 1682–1691. [Google Scholar] [CrossRef]
- Blair, B.; Chen, C.; Glenn, A.; Kaplan, A.; Ruz, J.; Simms, L.; Wurtz, R. Gaussian mixture models as automated particle classifiers for fast neutron detectors. Stat. Anal. Data Min. 2019, 12. [Google Scholar] [CrossRef] [Scilit]
- Jacob, B.; Kligys, S.; Chen, B.; Zhu, M.; Tang, M.; Howard, A.; Adam, H.; Kalenichenko, D. Quantization and training of neural networks for efficient integer-arithmetic-only inference. In Proceedings of the IEEE/CVF Conference on Computer Vision and Pattern Recognition, Salt Lake City, UT, USA, 18–22 June 2018; pp. 2704–2713. [Google Scholar] [CrossRef] [Scilit]
- Nedjadi, Y.; Duc, P.-F.; Bochud, F.; Bailat, C. On the stability of 3H and 63Ni Ultima Gold liquid scintillation sources. Appl. Radiat. Isot. 2016, 118, 25–31. [Google Scholar] [CrossRef] [Scilit]
- Ranucci, G.; Ullucci, P.; Bonetti, S.; Manno, I.; Meroni, E.; Preda, A. Scintillation decay time and pulse shape discrimination of binary organic liquid scintillators for the Borexino detector. Nucl. Instrum. Methods Phys. Res. A Accel. Spectrom. Detect. Assoc. Equip. 1994, 350, 338–350. [Google Scholar] [CrossRef] [Scilit]
- Feng, X.G.; He, Q.G.; Wang, J.C.; Chen, J. The effect of sample stability on the determination of radioactivity for various radionuclides by liquid scintillation counting. Appl. Radiat. Isot. 2015, 104, 147–154. [Google Scholar] [CrossRef] [Scilit]
- Bhade, S.P.D.; Reddy, P.J.; Anilkumar, S.; Kolekar, R.; Singhal, R.; Singh, R. Study of liquid scintillation alpha spectral properties. Appl. Radiat. Isot. 2017, 122, 121–126. [Google Scholar] [CrossRef] [Scilit]
- Selvaraju, R.R.; Cogswell, M.; Das, A.; Vedantam, R.; Parikh, D.; Batra, D. Grad-CAM: Visual explanations from deep networks via gradient-based localization. In Proceedings of the IEEE International Conference on Computer Vision (ICCV), Venice, Italy, 22–29 October 2017; pp. 618–626. [Google Scholar] [CrossRef] [Scilit]

Disclaimer/Publisher’s Note: The statements, opinions and data contained in all publications are solely those of the individual author(s) and contributor(s) and not of MDPI and/or the editor(s). MDPI and/or the editor(s) disclaim responsibility for any injury to people or property resulting from any ideas, methods, instructions or products referred to in the content. |
© 2026 by the authors. Licensee MDPI, Basel, Switzerland. This article is an open access article distributed under the terms and conditions of the Creative Commons Attribution (CC BY) license.