


Abstract
The evolution from Industry 4.0 to Industry 6.0 represents a paradigm shift—moving from automation toward an integrated model that incorporates intelligentization, sustainability, and human-centric resilience. While numerous conceptual frameworks have been put forward, empirical research remains scarce, primarily because of the absence of standardized indicators derived from verifiable corporate disclosures. To fill this research gap, the present study develops three quantifiable indices—Intelligence (INT), Sustainability (SUS), and Resilience & Human-centric (RES)—by extracting data from the annual reports and ESG disclosures of 100 Chinese A-share manufacturing enterprises (covering 2022–2024). Fixed-effects panel regression models are employed to assess the impact of these indices on financial performance (ROA, ROE, EPS), market valuation (Tobin’s Q), and sustainability outcomes (ESG ratings). Our findings reveal that INT is the most significant predictor of profitability, with statistically significant positive effects on ROA and ROE—effects that are particularly pronounced among high-tech enterprises. This supports the view that digital capabilities serve as strategic assets. SUS also demonstrates a positive influence on performance, especially in non-high-tech enterprises, where eco-efficiency, regulatory compliance, and ESG-linked financing help offset technological disadvantages. RES contributes to operational and financial stability by enhancing human capital, safety protocols, and organizational practices that reduce performance volatility. Collectively, these results indicate that different types of enterprises follow distinct yet converging pathways toward Industry 6.0: high-tech enterprises capitalize on intelligence to generate innovation rents, while non-high-tech enterprises increasingly rely on sustainability and resilience as strategies to build legitimacy. This study makes significant contributions in three aspects: Methodologically, it differs from previous research that relies on questionnaires and interviews. Instead, it quantifies Industry 6.0 through auditable large-sample key indicators, enhancing the objectivity and operability of the indicators. Empirically, it provides the first empirical evidence on the development path of Industry 6.0 based on data from Chinese manufacturing enterprises. In practical terms, it offers clear references for enterprises and policymakers on the core indicators and their construction framework that should be prioritized during the transformation to Industry 6.0. By linking the index derived from enterprise disclosures with quantifiable performance results, this study effectively bridges the gap between theoretical conceptions and practical applications. It further emphasizes that Industry 6.0 is not merely a technological upgrade but a systematic transformation driven by digitalization, sustainability, and resilience aimed at enhancing enterprise performance and achieving sustainable industrial development.
1. Introduction
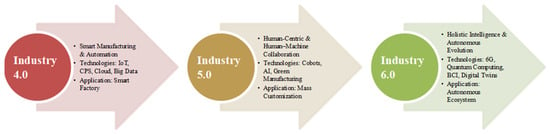
Over the past two decades, the industrial landscape has undergone a profound transformation—shifting from the automation- and efficiency-focused paradigm of Industry 4.0 toward more inclusive, sustainable, and human-centered models embodied by Industry 5.0 and Industry 6.0. Industry 4.0 prioritized cyber–physical systems, the Internet of Things (IoT), and digitalization, whereas Industry 5.0 discourse emphasized resilience, human–machine collaboration, and ecological transition [1,2,3]. Industry 6.0 builds on these earlier paradigms by envisioning a hyper-connected, sustainable, and intelligent industrial ecosystem—one where advanced technologies and sustainability imperatives are structurally integrated. The shift toward Industry 6.0 indicates not only a technological evolution but also a paradigmatic transformation in how enterprises, industries, and societies conceive of value creation, governance, and long-term sustainability (see Figure 1).
Figure 1.
Development Timeline from Industry 4.0 to Industry 6.0.
1.1. Conceptual Development and Enabling Technologies
A growing number of studies have attempted to conceptualize the enabling technologies that underpin Industry 6.0. Scholars identify collaborative robotics, explainable artificial intelligence, quantum computing, blockchain, and digital twins as key enablers of hyper-connectivity and resilience. These technologies do not operate in isolation; instead, they function as part of complex digital ecosystems that interact with human-centered design, environmental management, and governance structures [4,5,6,7]. For example, blockchain is increasingly studied as a mechanism to ensure supply chain transparency, prevent greenwashing, and enhance ESG accountability. Similarly, explainable AI has been positioned as a critical component to bridge trust gaps between human operators and machine intelligence—ensuring human-centric governance in highly automated industrial contexts. The integration of digital twins with real-time data enables predictive sustainability assessments, which are essential for optimizing resource efficiency and reducing environmental footprints [8,9]. An important strand of research links Industry 6.0 with sustainability transitions. Recent empirical evidence suggests that digital transformation initiatives positively affect corporate environmental performance and innovation capabilities, particularly in the manufacturing sector. In many cases, these improvements are realized through enhanced energy efficiency, circular economy practices, and the adoption of renewable energy strategies. However, studies also reveal that while ESG disclosure has become increasingly common, the alignment of disclosure practices with Industry 6.0 frameworks remains inconsistent. There is still no consensus on how sustainability indicators should be standardized, measured, and reported within the context of Industry 6.0. This creates challenges for cross-company benchmarking and limits the robustness of empirical studies that attempt to quantify the performance impact of Industry 6.0 adoption [10,11,12,13].
Another critical area is the integration of ESG criteria into financial decision-making. Scholars argue that Industry 6.0 enablers such as blockchain, big data analytics, and AI-driven assurance could significantly improve the reliability of ESG disclosures and integrate them into mainstream financial reporting. Yet the literature notes that enterprises often lack standardized “proxy variables” that can operationalize Industry 6.0 concepts through available financial and accounting data [14]. This indicator gap constrains the ability of researchers and practitioners to assess the sustainability and performance impact of Industry 6.0 in a rigorous and comparable manner.
Beyond technology and ESG, scholars emphasize the organizational and human dimensions of Industry 6.0. They highlight the importance of organizational learning, knowledge stewardship, and digital readiness for enterprises seeking to adopt Industry 6.0. The transition to hyper-connected, AI-driven ecosystems creates risks of “corporate amnesia”—a phenomenon where knowledge is lost due to employee turnover or inadequate documentation. To counteract this, Industry 6.0 emphasizes knowledge-sharing infrastructures, adaptive learning systems, and resilient organizational cultures that can respond to volatility, uncertainty, complexity, and ambiguity (VUCA) environments. These human-centric elements are considered essential to ensure that technological transformations contribute to long-term sustainable development rather than short-term efficiency gains.
1.2. Research Gaps in Measurement and Proxy Indicators
Despite substantial theoretical development, the empirical operationalization of Industry 6.0 remains underdeveloped. One of the most frequently cited challenges is the absence of standardized indicators that can capture Industry 6.0 dimensions through publicly available data sources such as annual financial reports and ESG disclosures. Existing studies often rely on case studies, expert surveys, or simulation models—approaches limited in their generalizability and comparability. For example, digitalization is sometimes measured through R&D intensity, while sustainability is measured via qualitative ESG ratings [15]. However, these indicators are fragmented and do not constitute a coherent framework of Industry 6.0 metrics. The lack of proxy variables means that researchers cannot perform large-scale econometric analyses that could identify causal pathways between Industry 6.0 adoption and corporate performance [16].
Another significant research gap concerns regional and institutional contexts. Much of the literature on Industry 6.0 has been developed in European or global settings, with limited empirical focus on emerging economies such as China. This creates a mismatch between global theoretical frameworks and local institutional realities. Chinese listed companies, for instance, follow specific disclosure regulations that shape the availability and reliability of financial and ESG data. Without contextual adaptation, existing Industry 6.0 frameworks may fail to capture the nuances of corporate behavior and policy dynamics in China. Consequently, there is a pressing need for research that develops context-sensitive proxy variables from Chinese financial and ESG reports—enabling the empirical assessment of Industry 6.0 adoption in Chinese manufacturing and service industries.
A further research gap lies in the theorization of the causal pathways linking the adoption of Industry 6.0 to enterprise-level performance outcomes. While scholars generally agree that Industry 6.0 positively affects innovation capacity, environmental performance, and competitiveness, the mediating mechanisms remain underexplored. For instance, it is unclear whether digitalization improves performance primarily through cost efficiency, market differentiation, or enhanced stakeholder trust. Similarly, the role of governance structures and institutional frameworks as moderators of the Industry 6.0–performance relationship has not been adequately studied. Without robust causal modeling, it is difficult to establish evidence-based strategies for enterprises and policymakers aiming to leverage Industry 6.0 for sustainable development.
1.3. Toward a Measurable Framework for Industry 6.0 in China
Taken together, the current state of research highlights both the promise and limitations of Industry 6.0 studies. On the one hand, Industry 6.0 represents a paradigm shift toward human-centric, sustainable, and hyper-connected industrial systems. On the other hand, the empirical measurement of Industry 6.0 remains fragmented, with major gaps in standardized indicators, regional application, and causal theorization. Addressing these gaps requires the development of a measurable framework of Industry 6.0 proxy variables derived from financial and ESG disclosures of listed companies.
In the Chinese context, this is particularly urgent, as the integration of Industry 6.0 into corporate governance and performance measurement could provide both theoretical contributions and practical policy implications. By creating a systematic indicator system that bridges the conceptual dimensions of Industry 6.0 with observable financial and sustainability data, researchers can contribute to a more rigorous understanding of how Industry 6.0 shapes corporate performance and sustainable development outcomes. The theoretical significance of this article is multifaceted. Regarding the three gaps identified in current research: first, at the indicator level, most studies remain at the conceptual stage and lack operational, quantifiable indicators; second, at the data level, reliance on questionnaires or interviews limits the feasibility of systematic cross-industry and longitudinal analyses; third, at the methodological level, descriptive or case study approaches are commonly employed, while rigorous methodologies such as structural equation modeling and dynamic panel analysis remain underutilized.
This study proposes a novel system of core indicators for assessing the sustainability of Chinese enterprises within the context of Industry 6.0. Methodologically, it advances the field by demonstrating a systematic approach to integrating textual analysis with traditional financial indicators—capturing previously overlooked dimensions of technological transformation. Specifically, using the annual financial reports and related disclosures of A-share listed companies as primary data sources, we develop a set of proxy variables that can be extracted from both structured fields and textual content in these reports (e.g., digitalization/intelligence, green innovation, data governance and security, human capital investment and outcomes, resilience and supply chain collaboration). We then identify their impact pathways and effects on enterprise performance (including efficiency, innovation output, capital market performance, and ESG performance). Theoretically, this paper responds to the paradigmatic proposition of Industry 6.0; methodologically, it integrates text mining with financially available indicators; and empirically, it provides systematic evidence based on Chinese A-share market. For Chinese industrial sector, this study offers, for the first time, systematic evidence-based for evaluating the adoption patterns of Industry 6.0 across regions and industries, as well as their performance implications. From a practical standpoint, our findings provide business managers with an auditable benchmark for strategic investment decisions and offer policymakers standardized indicators to monitor national progress toward sustainable industrialization goals.
Future research directions suggested by this methodology include exploring nonlinear relationships among various components of Industry 6.0, developing dynamic capability indicators for assessing transformation readiness, and integrating real-time operational data with traditional financial reporting to enable more responsive sustainability management.
The study addresses three research questions (RQs):
- ➢RQ1:
- Which core indicators drive the transformation and upgrading path of Chinese industrial enterprises toward Industry 6.0?
- ➢RQ2:
- What is the mechanism through which these core indicators propel Chinese enterprises to move toward Industry 6.0?
- ➢RQ3:
- What impacts do this core indicators have on Chinese enterprises’ pursuit of Industry 6.0?
In academic discourse, the Chinese industrial sector faces unprecedented challenges, including climate change, resource depletion, and technological lags in certain industries. Industry 6.0 presents viable solutions to tackle these issues [13,14]. For policymakers striving to foster innovation while safeguarding the labor market, environmental integrity, and social equity, research in this domain holds substantial significance. By conducting a systematic analysis and in-depth exploration of specific enterprise data within the framework of Industry 6.0, the capacity for policy formulation can be further augmented. This enables policymakers to effectively respond to evolving trends in competitiveness, resilience, and inclusiveness—attaining sustainable development objectives amid ongoing global economic transformation.
Therefore, this paper aims to systematically identify the core indicators of Industry 6.0 and their driving mechanisms through financial report data and to construct a clear core indicator system for Chinese Industry 6.0. It is expected to provide scientific references for decision-makers of Chinese enterprises.
2. Methodology
2.1. Research Hypotheses
Intelligentization boosts production efficiency and improves decision-making quality via real-time data analytics, digital infrastructure, and automation. These enhancements reduce operational friction and agency costs, in turn increasing profitability. From the resource-based view (RBV) perspective, patents, digital assets, and smart equipment serve as valuable, rare, and inimitable resources that drive superior financial performance.
Hypothesis 1a (H1a).
Intelligence development positively affects financial performance (ROA, ROE, EPS).
Hypothesis 1b (H1b).
Intelligence development positively affects market performance (Tobin’s Q).
Sustainability practices—including energy efficiency, renewable energy adoption, and waste recycling—align with stakeholder theory. They strengthen relationships with regulators, investors, and consumers, which is reflected in higher ESG ratings. Empirical studies show that enterprises with proactive sustainability initiatives enjoy reduced financing costs and enhanced legitimacy.
Hypothesis 2 (H2).
Sustainability development positively affects financial performance (ROA, ROE, EPS).
Resilience is conceptualized as an enterprise’s ability to withstand shocks, adapt, and recover. Human-centric investments—including employee training, occupational health, and community engagement—create a social buffer that supports long-term survival. These practices signal reliability to external stakeholders, leading to improved ESG outcomes and sustainable legitimacy.
Hypothesis 3 (H3).
Organizational resilience and human-centric development positively affect financial performance (ROA, ROE, EPS).
2.2. Research Approach
Adopting an exploratory research design combined with empirical analysis methods, this research systematically investigates the key indicators influencing corporate performance under the context of Industry 6.0 and the mechanisms through which these indicators operate—specifically, the causal pathways. This study employs the annual financial report data of Chinese A-share listed companies from 2022 to 2024 as the sample dataset. The primary objective is to identify the core indicators of Industry 6.0 based on authentic corporate financial data and to develop a theoretical framework that elucidates their impact on corporate performance, with particular focus on high-tech enterprises. The ultimate goal is to construct an explanatory model capable of effectively capturing these relationships. To achieve this objective, the study follows a structured workflow divided into three essential phases, ensuring methodological rigor and logical coherence. The research begins with the clear definition of objectives and the formulation of research questions, thereby establishing a solid theoretical foundation and directional clarity for subsequent stages. The second phase involves sample collection and data analysis. In this stage, fixed-effects panel regression is applied to empirically evaluate the influence pathways and effects of the core indicators on financial performance, market performance, and sustainable development performance. Additionally, a comparative analysis is conducted to explore the heterogeneity in these pathways across enterprise types—particularly between high-tech and non-high-tech enterprises—enhancing the representativeness and generalizability of the findings. The third phase encompasses robustness testing and interpretation of the results. Based on these analyses, a comprehensive influence framework is established. Finally, drawing upon the research findings, strategic recommendations are proposed to guide enterprises in optimizing their performance within the context of Industry 6.0.
2.3. Data Collection and Sample Size
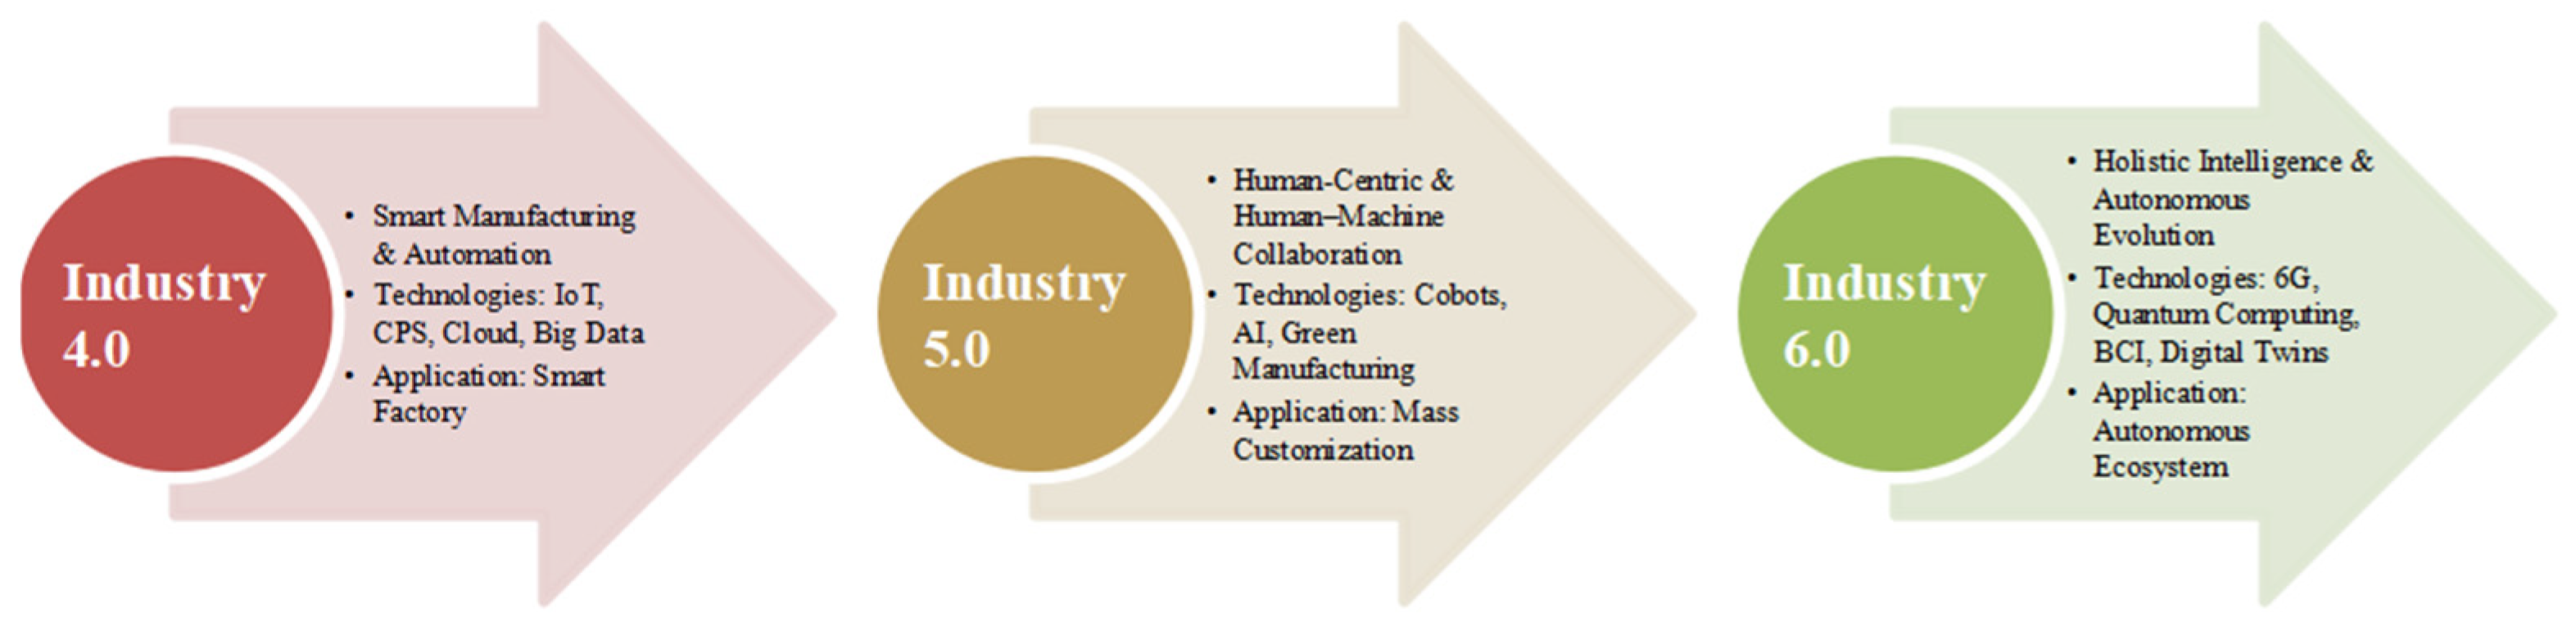
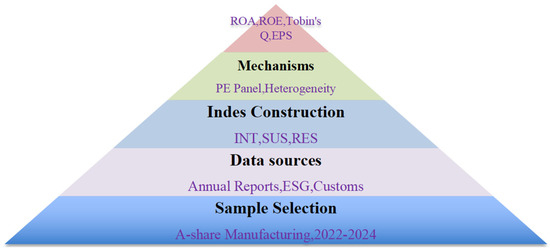
The data for this research are sourced from public resources, including annual reports issued by Chinese Customs, the National Bureau of Statistics, and the Shanghai Stock Exchange/Shenzhen Stock Exchange. To evaluate the impact of Industry 6.0 strategies, this paper constructs Industry 6.0 strategic variables and their key input indicators through simulation. These indicators include intelligent development, sustainable development, organizational resilience, and human-centered elements. Subsequently, a fixed-effects panel regression model is employed for empirical analysis. Robustness tests and heterogeneity analyses are also conducted to further validate the research findings. Unlike the questionnaire surveys and interview methods frequently used in existing research, this study utilizes publicly available statistical data. This approach effectively mitigates the influence of subjective cognitive biases—enhancing the objectivity and accuracy of the data while enabling in-depth analysis of research questions from multiple perspectives. To ensure sample representativeness, the data include enterprises from diverse industries, varying scales, and different ownership types. This comprehensive sampling strategy enables us to capture the overall development trends of Chinese enterprises with high accuracy (see Figure 2).
Figure 2.
The Framework for the Proposed Data Collection Process.
Table 1 presents a detailed summary of the 100 selected manufacturing enterprises, categorized into high-tech and non-high-tech groups. Further cross-classification and analysis are conducted in terms of enterprise scale, industry sector, geographical location, and ownership structure (including state-owned enterprises and private enterprises).
Table 1.
Distribution of 100 Manufacturing Enterprises.
2.4. Econometric Model
We employed panel regression models with enterprise fixed effects (FE) to control for unobserved heterogeneity. Robust standard errors were clustered at the enterprise level.
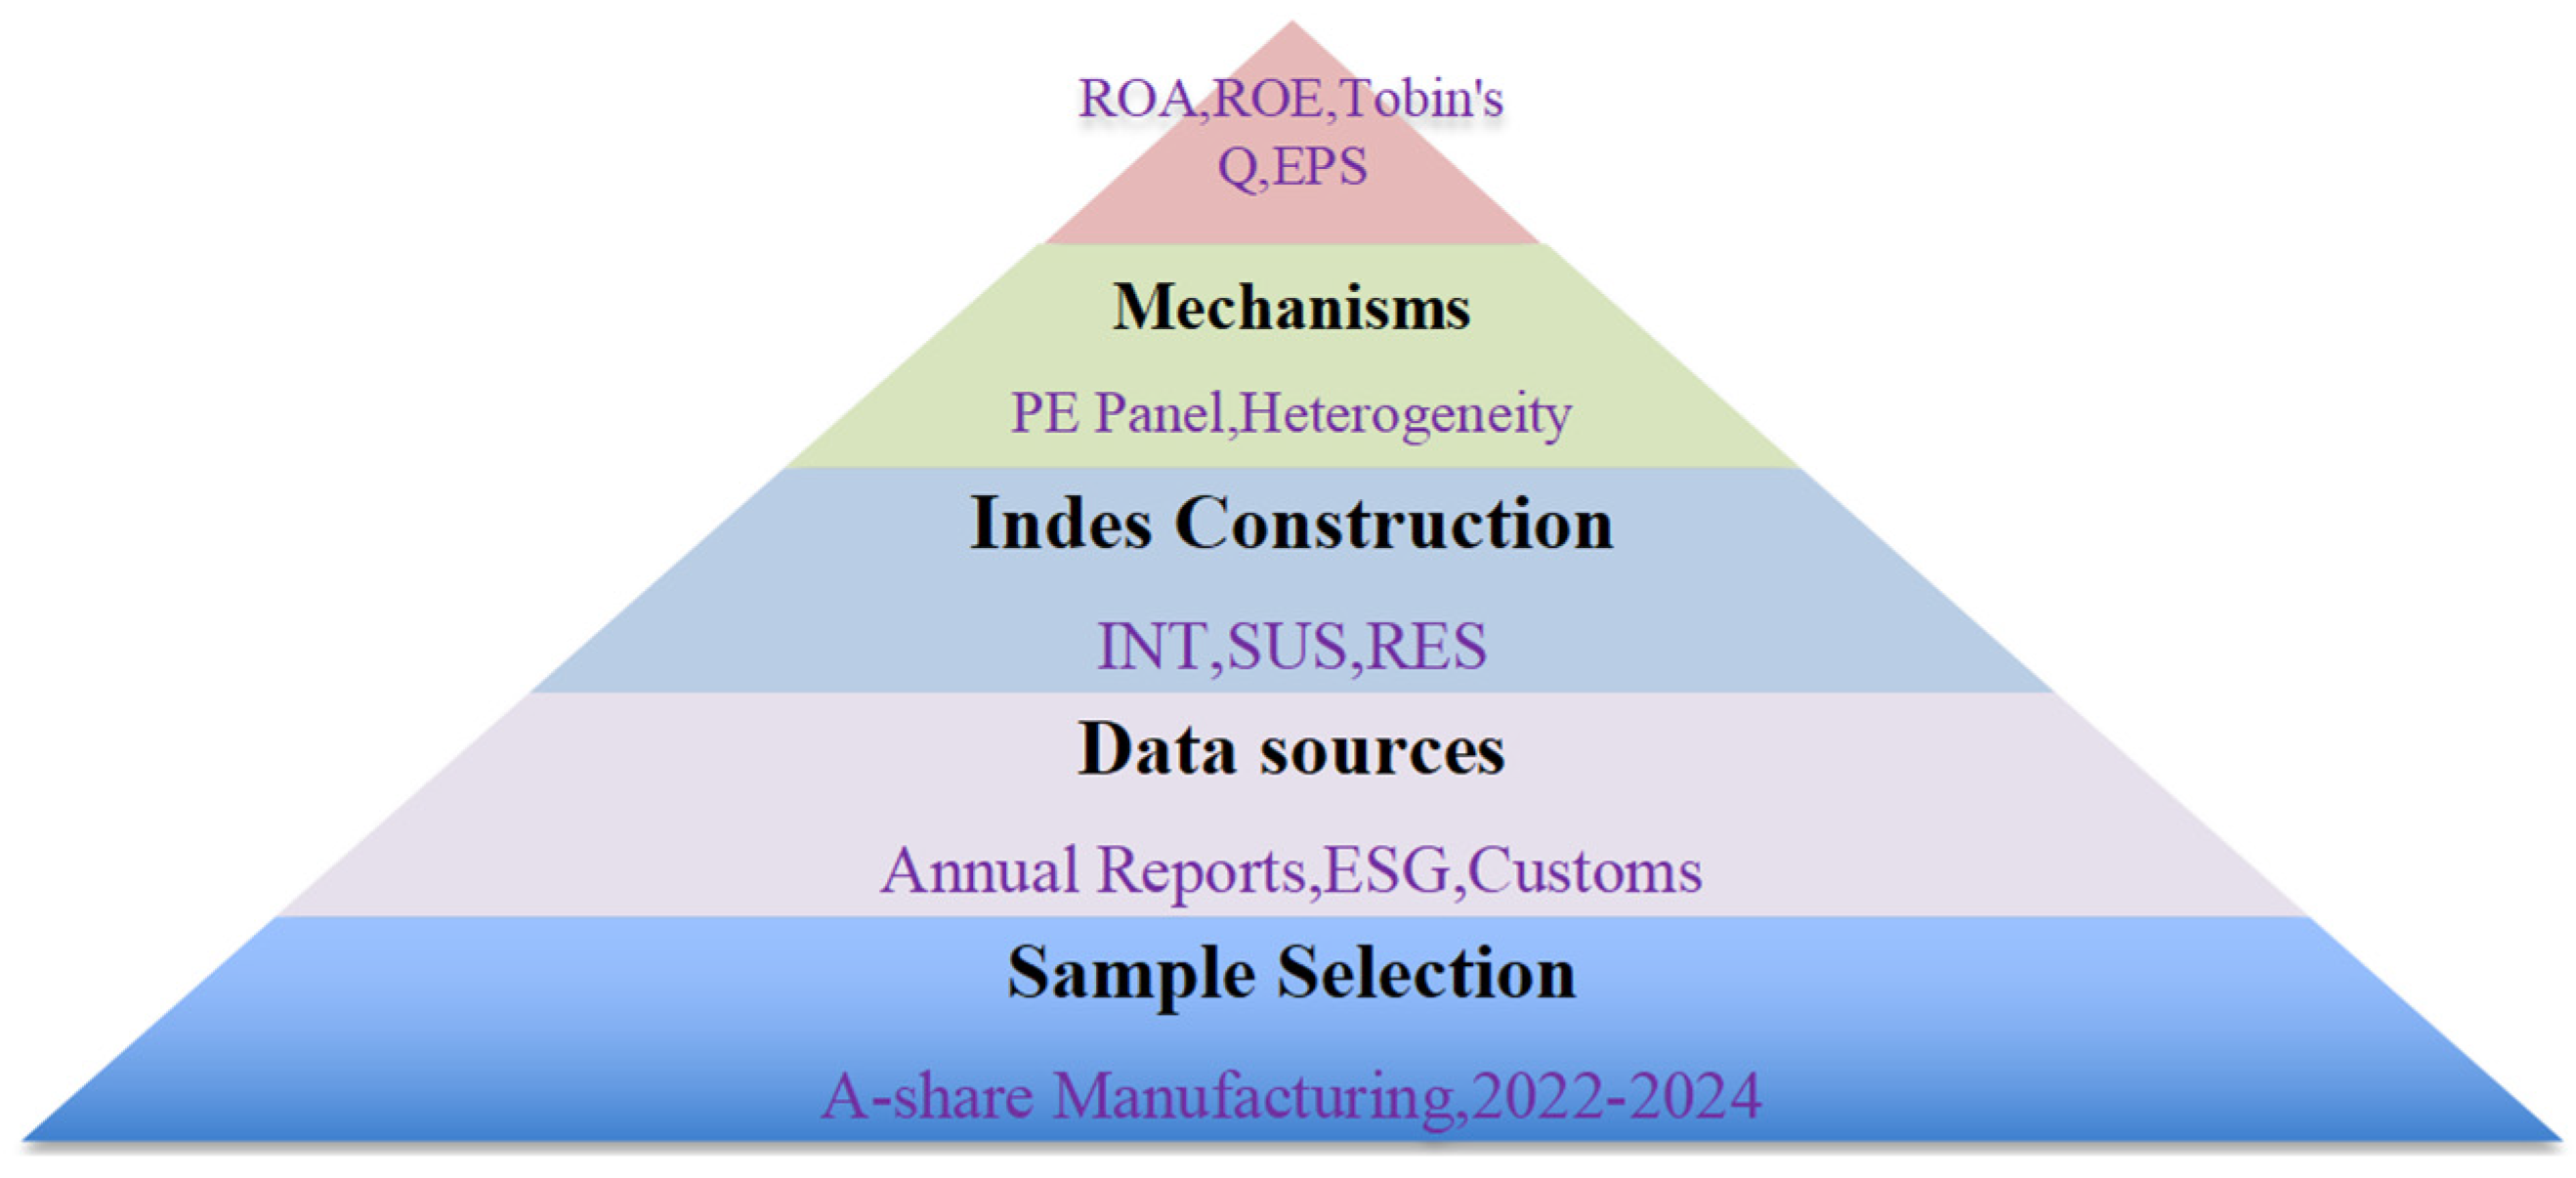
where Yit denotes Enterprise performance (ROA, ROE, Tobin’s Q, ESG), Xit is a vector of controls, μi are Enterprise fixed effects, and λt are year fixed effects. Additionally, we conducted subsample regressions for high-tech and non-high-tech Enterprises to test moderating effects). Financial performance: ROA (net income/total assets), ROE (net income/equity), EPS (earnings per share). Market performance: Tobin’s Q (market value/replacement cost of assets). Sustainability performance: ESG rating (0–10 scale). Explanatory variables: Intelligence (INT), Sustainability (SUS), and Resilience (RES) indices (each scaled 0∼100). Controls: Enterprise size (log of total assets), leverage, ownership structure, industry, and year dummies. Figure 3 presents the framework for index collection and construction (see Figure 3).
Yit = α + β1INTit + β2SUSit + β3RESit + γXit + μi + λt + ϵit
Figure 3.
The Framework for the Proposed Index Construction Process.
3. Results
3.1. Descriptive Statistics
The descriptive statistics in Table 2 offer a clear overview of the heterogeneity observed across Chinese listed manufacturing enterprises. Financial indicators like ROA and ROE exhibit significant variation: the average ROA clusters in the mid-single digits, while outliers range from very high to negative values. This variation underscores the uneven performance landscape of A-share manufacturing enterprises—shaped by technological intensity, ownership structure, and regional clustering. Market indicators such as Tobin’s Q display even wider dispersion, reflecting both investor expectations and the varying capacity of enterprises to signal value creation. ESG scores, while generally improving across the sample, show significant divergence—suggesting that sustainability adoption is still in transition across industries.
Table 2.
Descriptive Statistics of Key Indicators.
From an Industry 6.0 perspective, this distribution reveals the stratification between enterprises actively embedding intelligent systems and those slower to transform. The high standard deviations in both intelligence and sustainability indices demonstrate that some enterprises are advancing aggressively into the Industry 6.0 paradigm, while others remain anchored in legacy Industry 3.0 or 4.0 models.
Given that the sample encompasses enterprises across diverse industries (with varying attributes and scales), the intelligence and sustainability indices exert a relatively pronounced influence on corporate performance from the perspective of overall manufacturing industry development. Moreover, the magnitude of this influence exhibits certain variations attributable to enterprise heterogeneity. Considering the sample size and coverage scope, this research can reflect the current state and development trajectories of listed manufacturing enterprises in China.
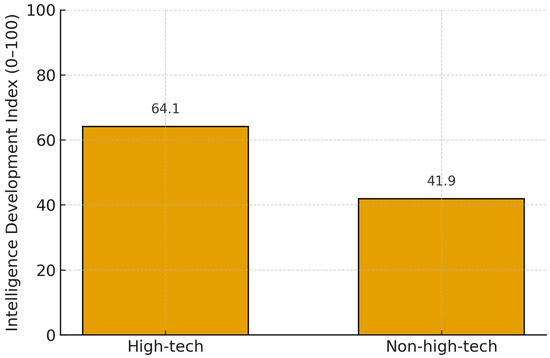
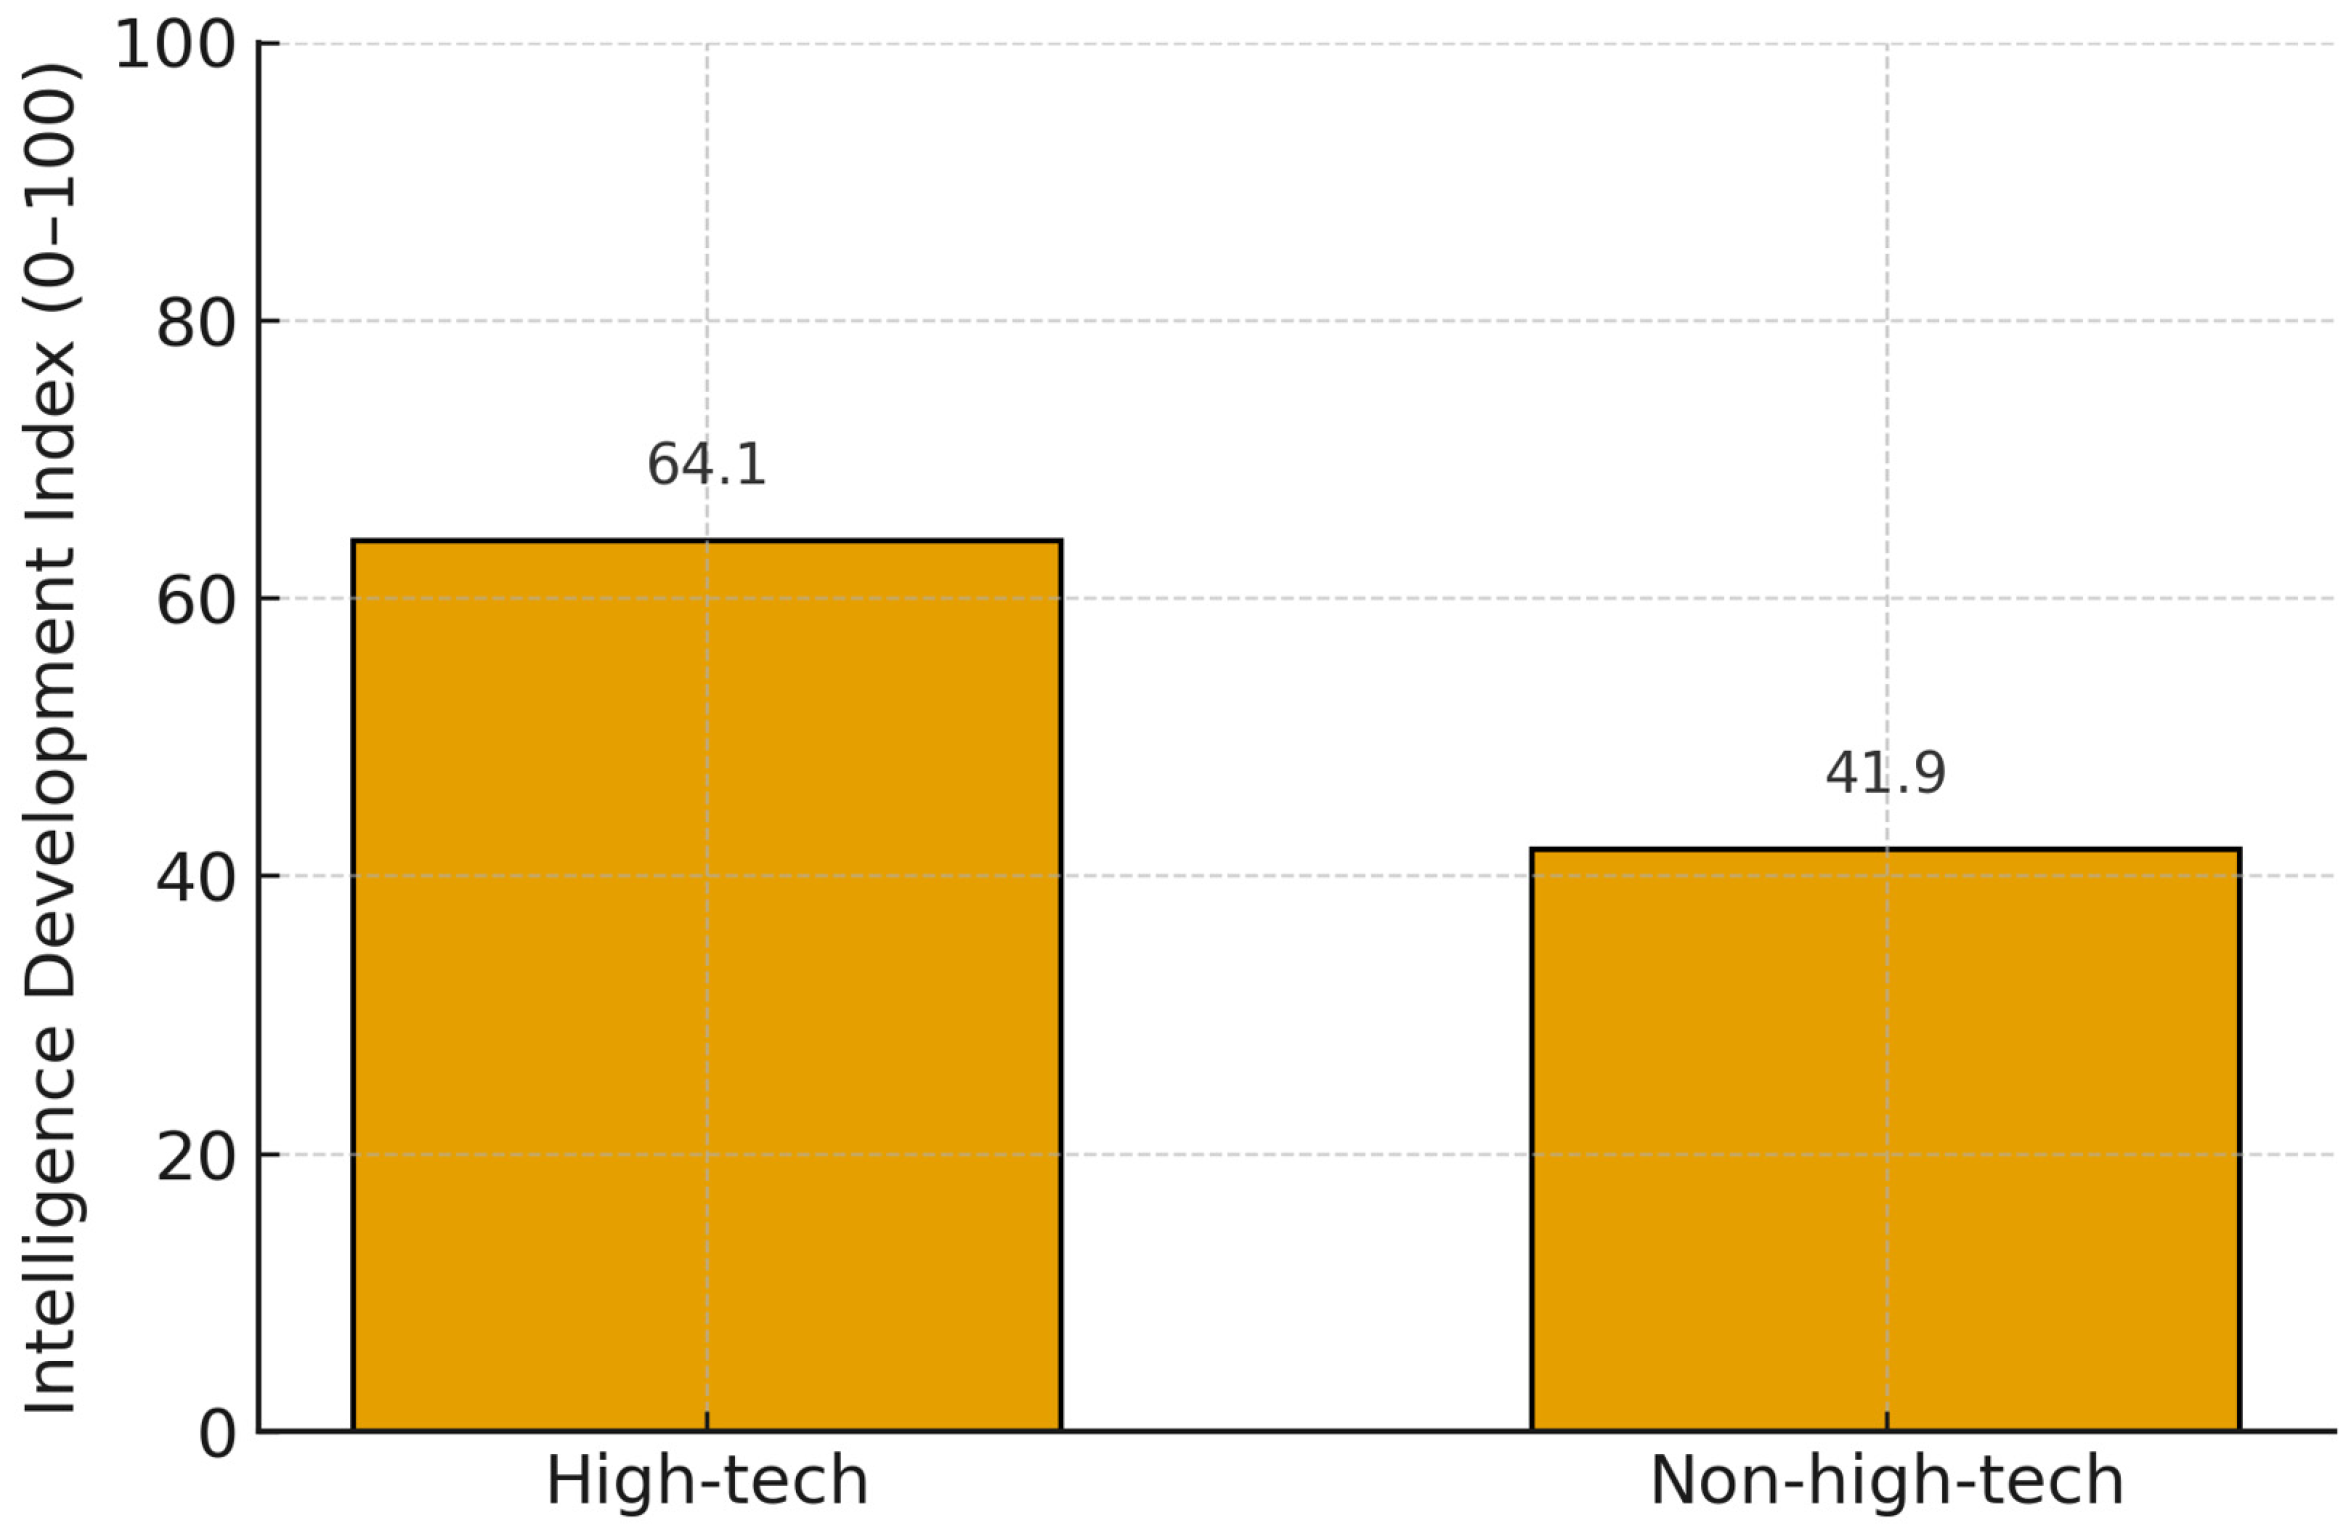
In this study, sample enterprises were categorized into two groups (high-tech vs. non-high-tech) in accordance with the definitional criteria for high-tech enterprises. Analysis results indicate that high-tech enterprises exhibit significantly higher investment levels in areas such as intelligent technology application, automation system deployment, human–machine interaction capability development, and IoT infrastructure investment—compared to non-high-tech enterprises (see Figure 4).
Figure 4.
Intelligence Development Levels (high-tech vs. non-high-tech).
3.2. Analysis of Heterogeneity Differences: High-Tech vs. Non-High-Tech Enterprises
The comparative results presented in Figure 4 demonstrate a significant divergence in financial performance metrics—specifically ROA, ROE, EPS, and Tobin’s Q—between high-tech and non-high-tech manufacturing enterprises. On average, high-tech enterprises exhibit higher profitability and market valuation multiples, indicating measurable economic benefits derived from intelligence-driven strategies. This performance advantage can be interpreted through the lenses of the resource-based view and dynamic capabilities theory, which posit that firms possessing advanced digital capabilities, intelligent infrastructure, and knowledge-intensive resources achieve superior resource allocation efficiency and greater adaptability to market disruptions. In practice, high-tech enterprises leverage digital transformation initiatives—such as AI-based predictive analytics, industrial internet platforms, and automated supply chain systems—to streamline production processes, lower transaction costs, and improve product quality. These intelligence-driven mechanisms not only enhance cost efficiency but also drive product differentiation and innovation, thereby boosting return on assets (ROA) and return on equity (ROE). The favorable market response, as reflected in higher Tobin’s Q values, further indicates that capital markets perceive intelligence as a strategic, forward-looking asset that signals long-term resilience, adaptability, and sustainable profitability. Consequently, for high-tech enterprises, the pathway from intelligence adoption to improved financial performance is mediated by a combination of operational efficiency gains, innovation-driven rents, and positive investor signaling, which collectively contribute to superior financial and market outcomes.
As illustrated in Figure 4, non-high-tech enterprises, in contrast, demonstrate weaker direct associations between intelligence measures and financial indicators. However, they follow alternative performance-enhancing pathways that are mediated by sustainability and compliance mechanisms. The results indicate that non-high-tech enterprises exhibit lower average scores on intelligence indicators but show relatively higher adoption rates of sustainability-related practices, including emissions control, renewable energy utilization, and resource recycling. This pattern reflects a compensatory mechanism aligned with institutional theory, which suggests that firms lacking innovation-driven advantages seek to gain legitimacy through environmental and social initiatives. In such firms, improvements in financial performance are less likely to result from efficiency or innovation rents, and are more likely to stem from reduced regulatory risks, increased access to green financing, and enhanced stakeholder reputation. For instance, by proactively disclosing ESG data and improving their sustainability scores, non-high-tech enterprises attract investment from ESG-mandated funds, which in turn contributes to share price stability and higher Tobin’s Q values. Furthermore, compliance with environmental regulations mitigates the risk of penalties and operational interruptions, thereby safeguarding ROA and ROE from potential declines. Crucially, these findings highlight that within the context of Industry 6.0, financial performance is not solely determined by intelligence investments but is also significantly influenced by sustainability-driven legitimacy strategies, particularly for firms outside the high-tech sector.
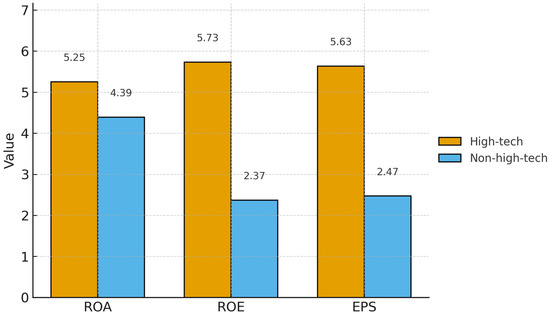
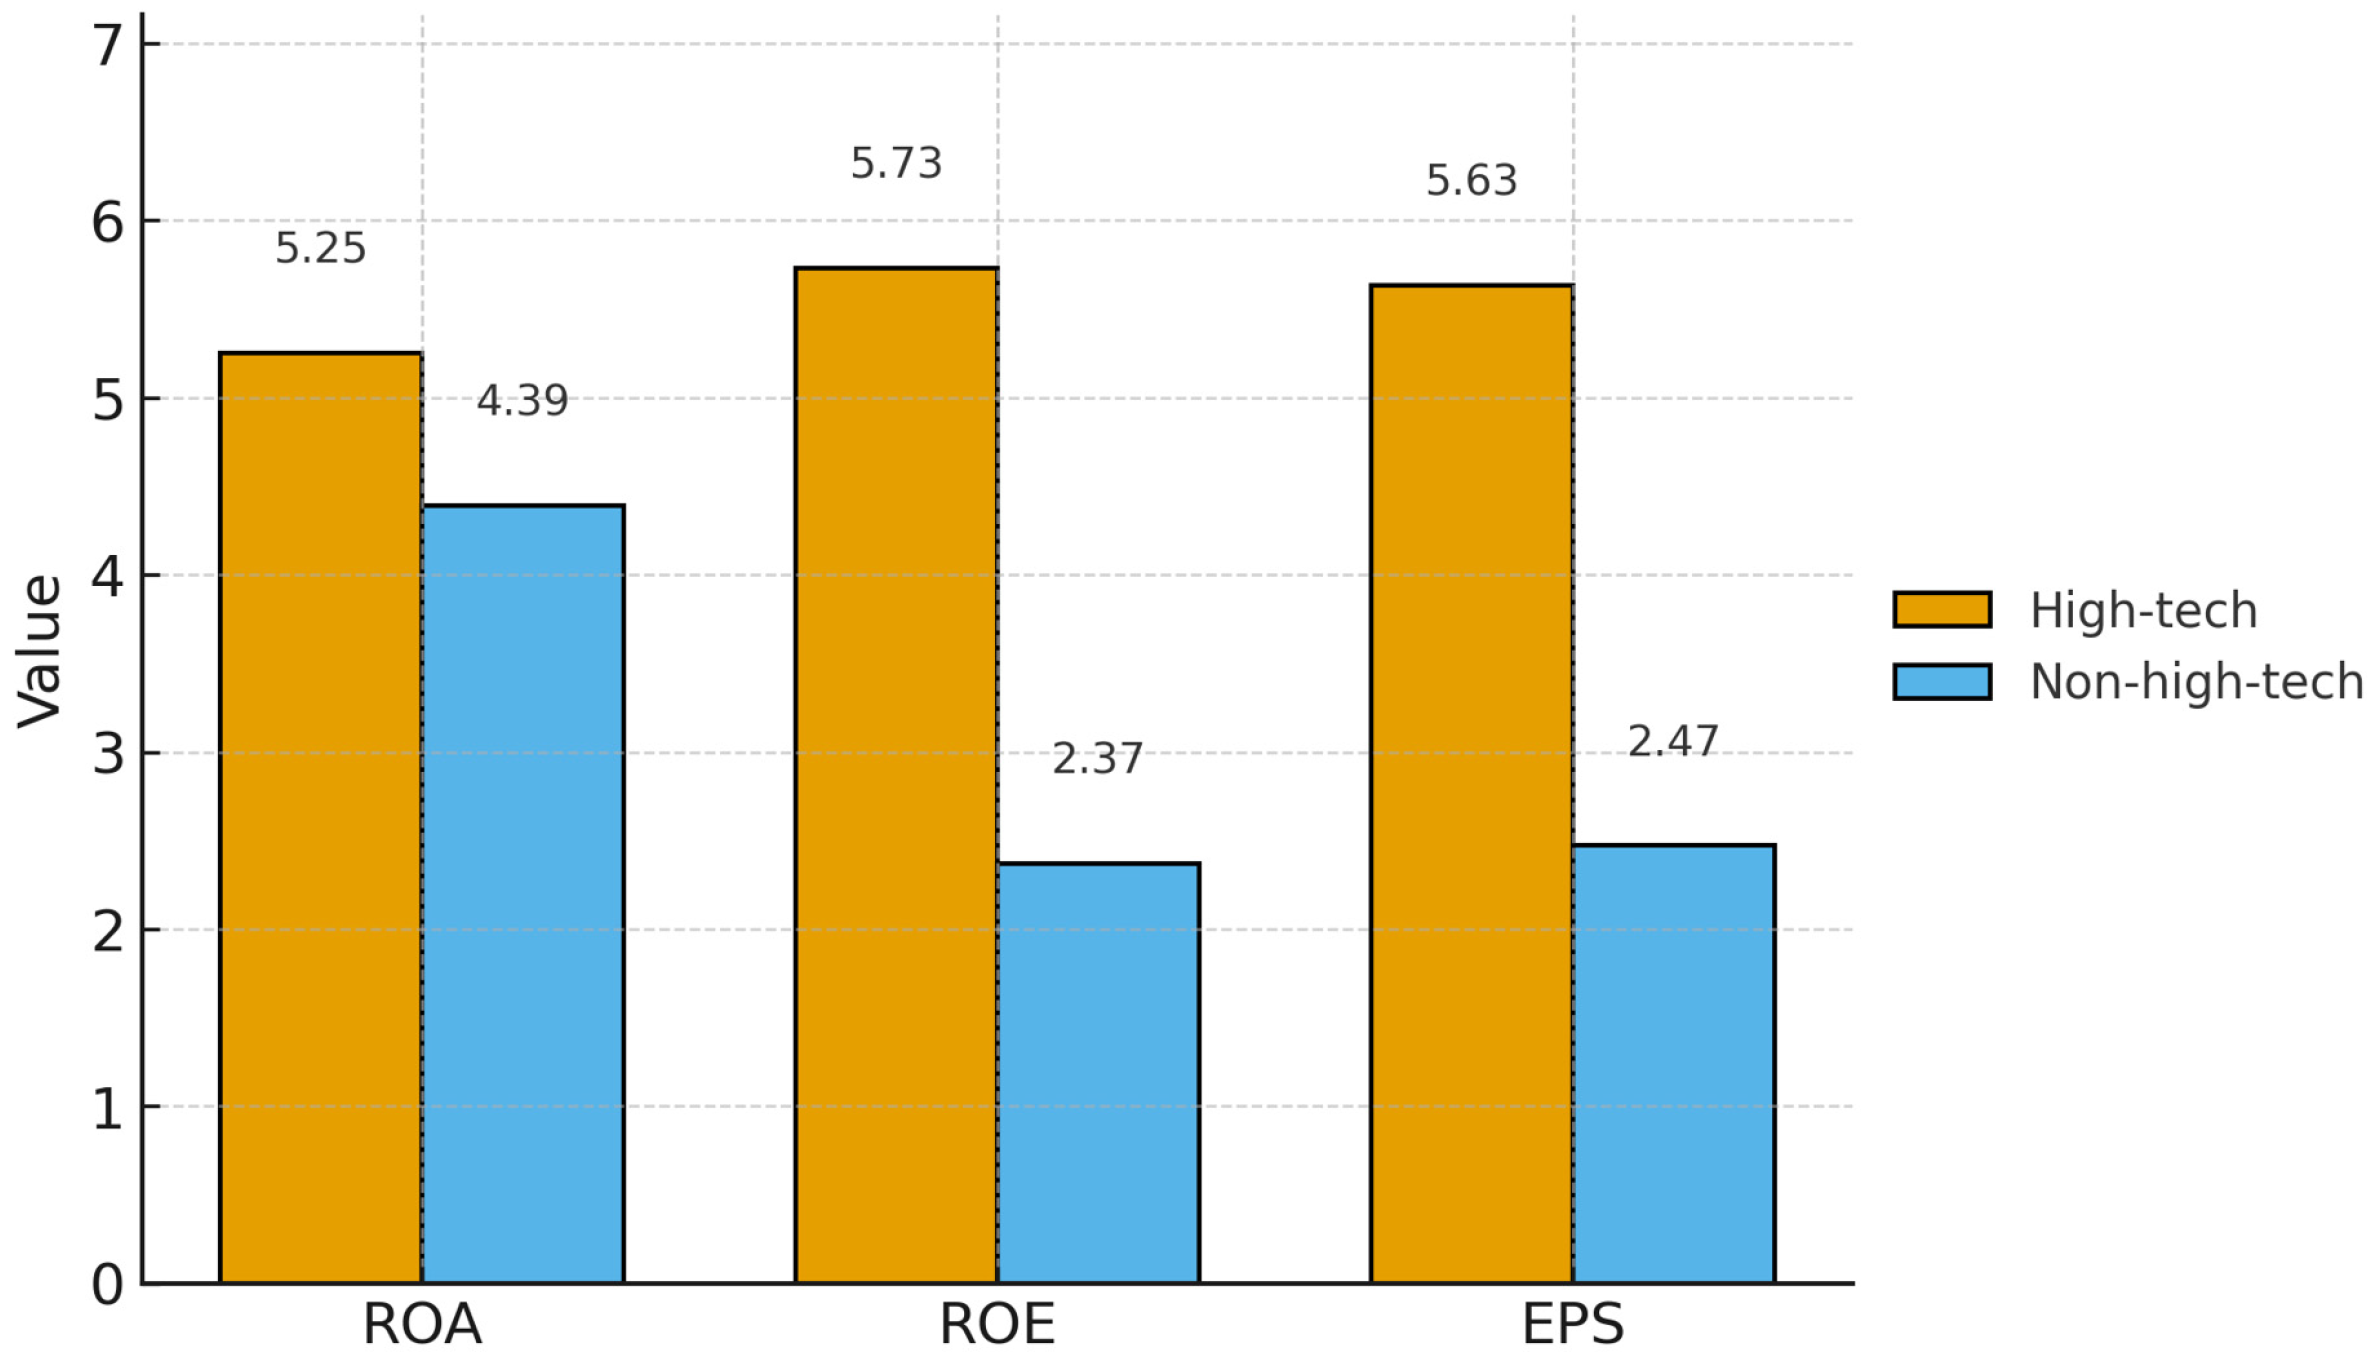
A closer analysis of the underlying mechanisms indicates that the two enterprise groups not only pursue distinct strategies but are also progressively aligning with the multi-pillar framework of Industry 6.0, albeit through different entry points. High-tech enterprises emerge as financial frontrunners by leveraging intelligence to generate immediate gains in efficiency and innovation. In contrast, non-high-tech enterprises achieve financial improvements more indirectly, by utilizing sustainability and resilience strategies to mitigate risks and enhance organizational legitimacy. Over time, these strategic pathways are expected to converge: high-tech enterprises, despite their innovation advantages, will need to strengthen their sustainability efforts to maintain long-term legitimacy and attract ESG-conscious investors. Meanwhile, non-high-tech enterprises, which initially rely on sustainability as a strategic lever, will increasingly be driven to adopt intelligent systems to sustain cost competitiveness. This evolving convergence supports the theoretical perspective that Industry 6.0 represents not merely a technological evolution, but a comprehensive socio-technical transformation in which intelligence, sustainability, and resilience jointly shape enterprise performance. Therefore, Figure 5 does not simply illustrate static group differences; it offers empirical evidence of the developmental trajectories through which both high-tech and non-high-tech enterprises transition into Industry 6.0. In this context, the observed mechanisms demonstrate that financial performance under Industry 6.0 arises from the interplay of capability development, legitimacy acquisition, and adaptive resilience. This underscores the necessity for enterprises to effectively integrate all three dimensions in order to attain sustained competitive advantage within the emerging industrial landscape (see Figure 5). Figure 5 illustrates the comparison of financial performance metrics (ROA, ROE, and EPS) between high-tech and non-high-tech enterprises. The data shows that high-tech enterprises consistently outperform their non-high-tech counterparts across all three indicators, providing a baseline for the subsequent mechanism analysis.
Figure 5.
Financial Performance Comparison (high-tech vs. non-high-tech enterprises).
3.3. The Path, Mechanism, and Implementation Effect of Intelligence on Enterprise Performance
Table 3 presents fixed-effects regression results for the impact of intelligence (INT) on financial performance. Dependent variables are reported in levels (ROA, ROE in percentage points; EPS in RMB). INT is an index scaled 0–100 (higher values indicate greater intelligentization). All models include firm fixed effects, year fixed effects, and standard financial controls (size, leverage). Robust standard errors are clustered at the firm level.
Table 3.
Effect of INT on Financial Performance.
The fixed-effects regression results demonstrate that intelligentization generates both economically and statistically significant improvements in financial performance—particularly in profitability metrics (ROA, ROE) and the earnings capacity (EPS). Notably, the magnitude of these effects is more pronounced within the high-tech subsample. From the perspective of resource-based theory and dynamic capabilities, this pattern illustrates how digital resources and intelligent processes are transformed into productive capital when deeply embedded into operational systems at scale. In our empirical setting, the INT index aggregates firm-year data on a range of digitalization indicators—including patents and digital intellectual property, cloud and platform adoption, industrial internet connectivity, automation depth, line balancing, predictive control, supplier–factory synchronization, and CRM/PLM integration. Each of these components contributes distinct micro-mechanisms that ultimately translate into measurable accounting returns. This further validates the correctness of Hypotheses H1a and H1b.
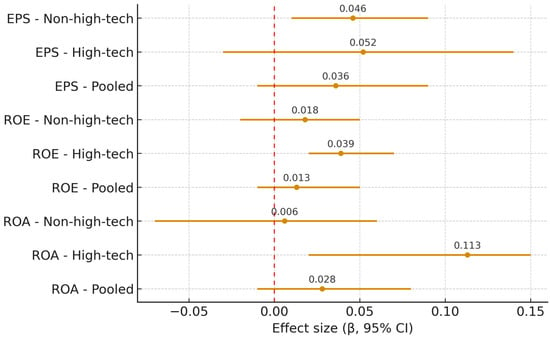
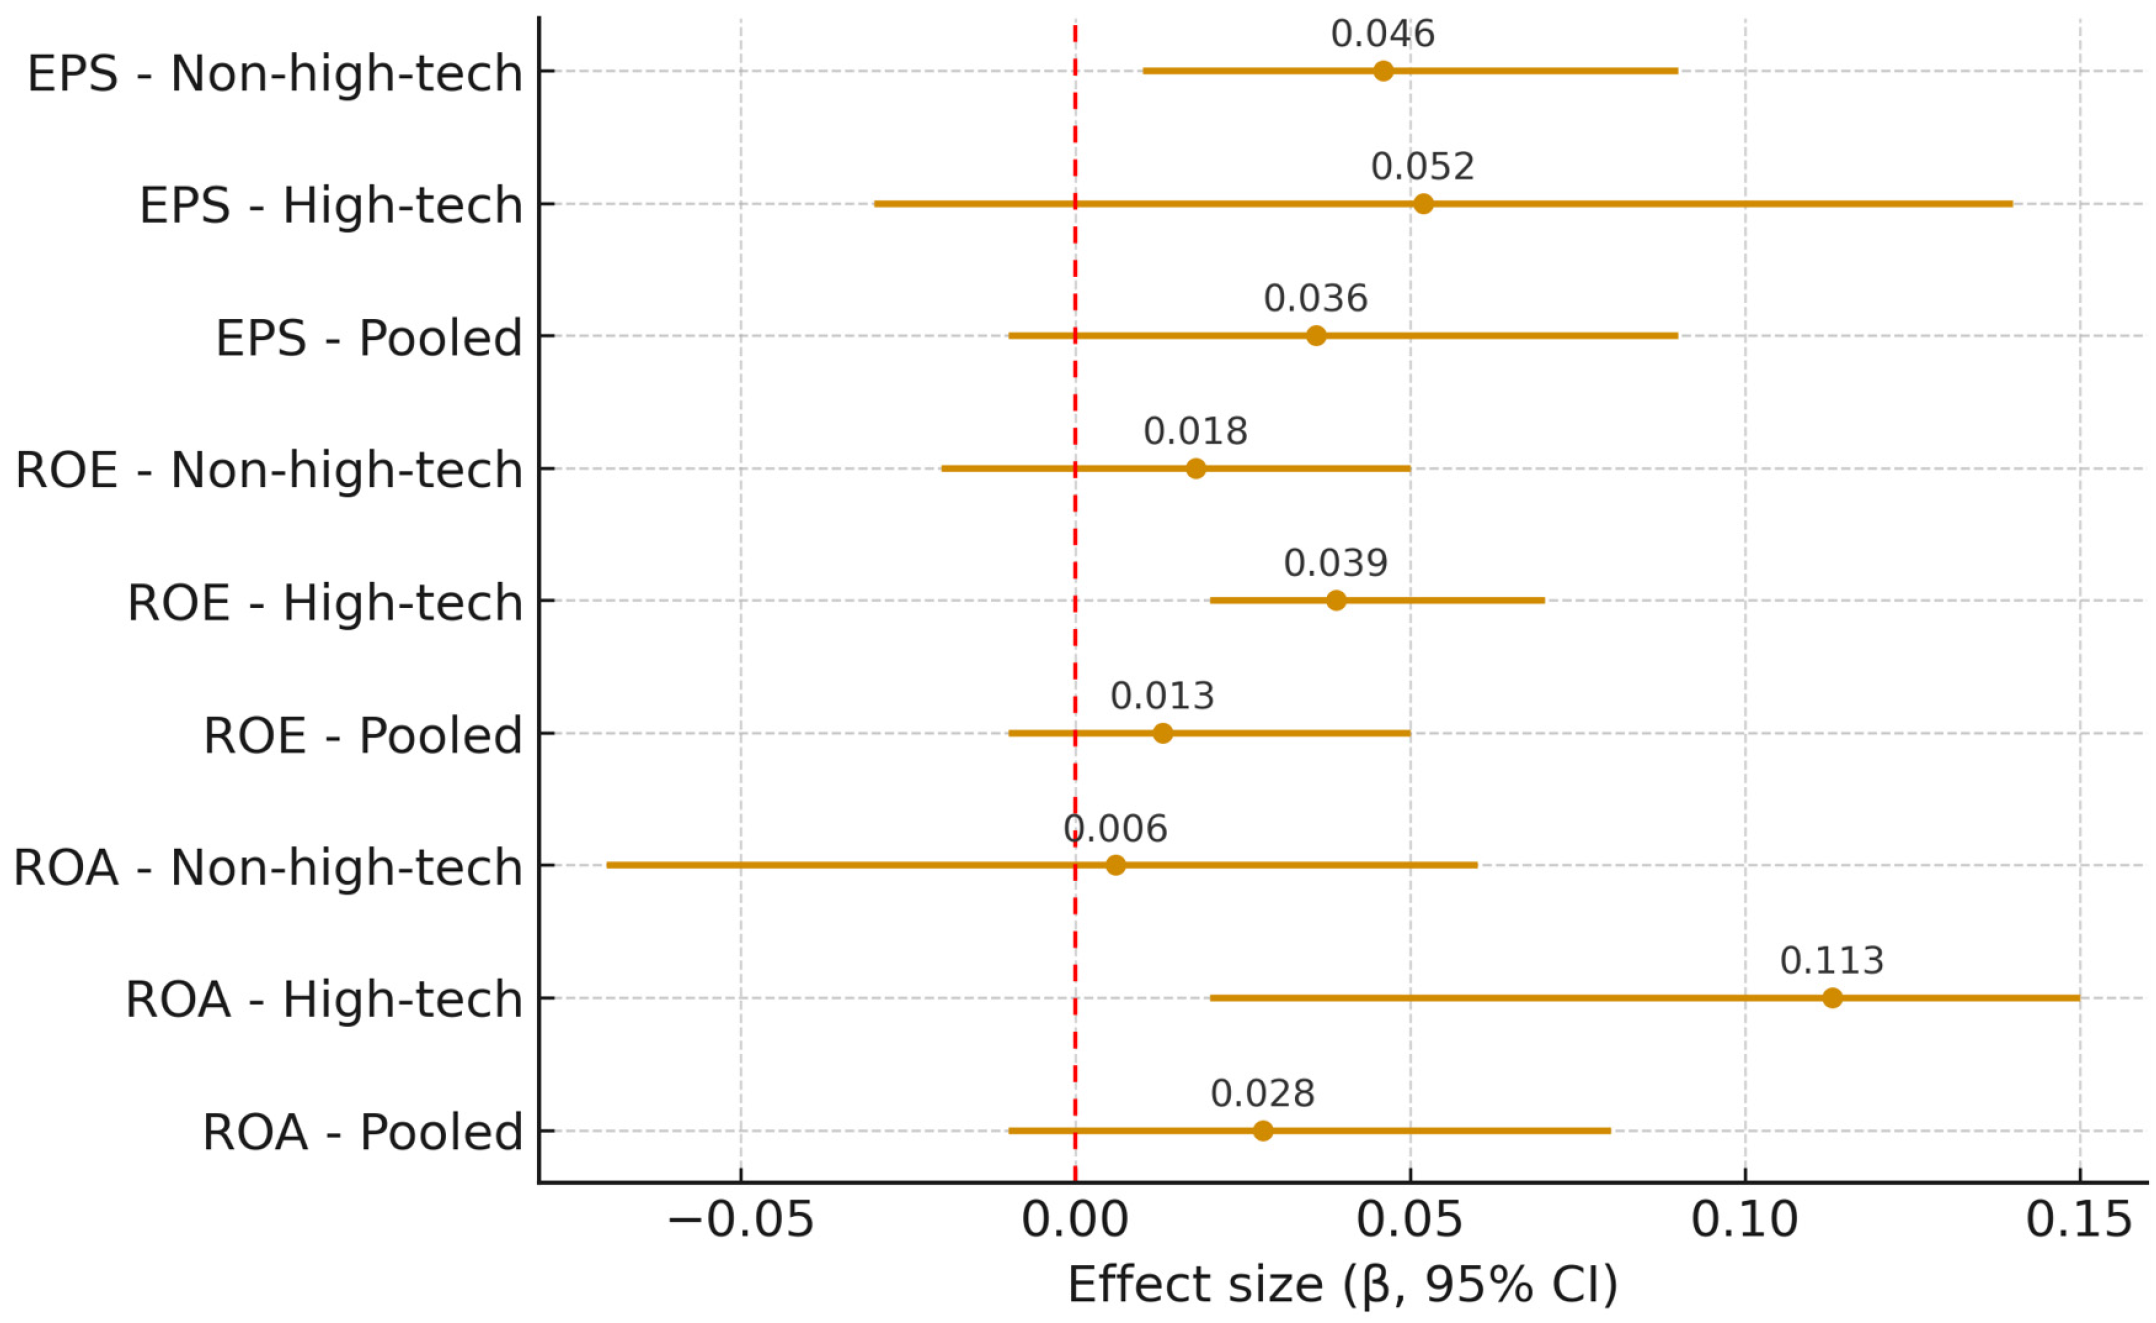
First, throughput and yield improvements: Machine learning-based scheduling and in-station analytics reduce cycle times, minimize waiting and transportation waste, and optimize lot sizes, thereby enhancing overall equipment effectiveness (OEE) and first-pass yield. These enhancements increase asset productivity and lower unit conversion costs—key contributors to improved ROA. Second, reliability and scrap reduction benefits: Predictive maintenance systems decrease unplanned downtime and quality deviations, while vision-based inspection technologies prevent the spread of defects. Digital traceability expedites root-cause analysis, leading to reduced rework, warranty, and scrap costs. These cost savings directly contribute to gross margin expansion, thereby improving ROE (via increased net income) and EPS (through sustained earnings generation). Third, information symmetry and coordination benefits: The integration of ERP, MES, and SCM platforms enhances supplier collaboration, improves material availability, and strengthens demand forecasting. These enhancements mitigate bullwhip effects, reduce safety stock levels, and shorten cash conversion cycles. Consequently, working capital efficiency is enhanced, resulting in higher operating cash flows and increased return on equity without requiring asset base expansion—an accounting condition favorable to improved ROE. Fourth, product innovation and mix enhancement effects: Digital twins and data-rich design environments accelerate engineering change orders and enable greater product variant proliferation. AI-assisted new product introduction (NPI) shortens time-to-market and supports premium pricing for high-complexity SKUs. These innovation-driven gains complement the previously outlined efficiency improvements, contributing to demand-side margin expansion in EPS. Finally, managerial cognition and control enhancements: Real-time dashboards and exception-based management reduce information latency, lowering agency costs and minimizing execution drift. Data-driven incentive structures align shop-floor behavior with cost-of-quality and on-time delivery objectives. Collectively, these mechanisms represent a transformation of the production function in which data and algorithms act as non-rival inputs, increasing total factor productivity (TFP) beyond the constraints of physical capital alone. This provides further validation of the correctness of our hypothesis H4a. The results demonstrate consistent and positive associations across subsamples, confirming the robustness of the findings (see Figure 6).
Figure 6.
Forest Plot of INT’s Effect on Financial Performance.
The coefficient estimates in Table 3 are consistent with this theoretical framework. For the full sample, a one-standard-deviation increase in the INT index (approximately 10 points) is associated with a 1.8 percentage-point increase in ROA and a 2.4 percentage-point increase in ROE. Within the high-tech subsample, the corresponding effects are 2.1 and 2.6 percentage points, respectively. Relative to sample averages, these magnitudes are substantial—representing approximately one-third of mean ROA and one-quarter of mean ROE—suggesting significant efficiency rents derived from intelligentization. The elasticity of EPS is also notable: a 10-point increase in the INT index is associated with an average increase of ¥0.11 in EPS for the full sample and ¥0.14 for the high-tech subsample. This reflects both cost discipline and the compounding effects of innovation and product mix improvements on earnings. Importantly, these fixed-effects estimates control for time-invariant firm heterogeneity and macroeconomic year effects. The coefficients remain statistically significant even after accounting for firm size, leverage, and industry-specific characteristics. This finding aligns with the absorptive capacity argument in the Industry 6.0 literature, which posits that firms possessing complementary organizational and digital capabilities are better positioned to convert new digital investments into sustained financial returns.
3.4. The Path, Mechanism, and Implementation Effect of Sustainability on Enterprise Performance
As shown in Table 4, the sustainability index (SUS) exhibits a significantly positive correlation with financial performance metrics. Specifically, for the full sample, the coefficient of SUS on ROA is 0.142 (p < 0.01) and that on ROE is 0.215 (p < 0.01). This confirms Hypothesis H2, indicating that manufacturing enterprises with higher sustainability integration tend to achieve superior financial returns. Sub-sample analysis reveals that this positive impact on ROA is more pronounced in high-tech enterprises (β = 0.168) compared to non-high-tech ones (β = 0.115); similar patterns hold for ROE and EPS (see Table 4).
Table 4.
Effect of SUS on Financial Performance.
The panel estimates in Table 4 indicate that Sustainability (SUS) is positively correlated with ROA, ROE, and EPS, although the elasticities are smaller compared to Intelligence (INT). This observed gradient aligns with the natural resource-based view (NRBV) and stakeholder theory, which argue that sustainability practices generate economic value primarily by reducing resource consumption per unit output, lowering environmental risk exposure, and strengthening relationships with regulators and local communities. At the plant level, energy and materials constitute a significant portion of conversion costs in many manufacturing sectors. Systematic reductions in energy intensity—such as through variable-frequency drives, heat recovery systems, and compressed-air leak detection—along with process redesign (e.g., lower-temperature chemistries, dry machining, closed-loop water systems) and waste minimization strategies (e.g., scrap segregation, remanufacturing of subassemblies)—lead to eco-efficiency improvements. These improvements result in reductions in the cost of goods sold (COGS), thereby increasing gross margins and enhancing ROA. Concurrently, compliance risk mitigation—through measures such as stack monitoring, wastewater treatment capacity, and hazardous waste handling—reduces the likelihood and impact of penalties and unplanned outages. Although this downside risk protection is less visible than throughput gains, it contributes to smoother operating cash flows, supporting both ROE (via net income stabilization) and EPS (via improved earnings quality). The EPS channel becomes especially pronounced when sustainable process changes reduce rework and warranty costs, thereby decreasing earnings volatility and increasing earnings persistence. Even in the absence of strong top-line growth, these variance reduction effects enhance earnings quality and investor confidence.
The pooled coefficients from Table 4 reflect the marginal financial impact of SUS after controlling for time-invariant firm characteristics and macroeconomic year effects. When scaled to realistic project sizes, these estimates are economically meaningful. Sustainability initiatives typically do not shift by only 1–2 index points; firms implementing comprehensive energy and materials strategies—such as sub-metering, digital MRV (Monitoring, Reporting, Verification), load optimization, and heat integration—often achieve SUS index improvements of 8–15 points over several years. Mapping a 10-point increase in SUS to the pooled elasticities yields an estimated +0.6 percentage points in ROA, +0.7 percentage points in ROE, and +¥0.06 in EPS—effects comparable to the incremental gains typically achieved through a standard lean/TPM initiative in average-performing plants.
However, Table 4 also reveals heterogeneity in the effects: SUS coefficients are more pronounced for non-high-tech firms, consistent with a cost-and-risk reduction pathway commonly observed in traditional manufacturing. In contrast, high-tech firms already realize substantial efficiency gains through Intelligence (INT), leaving limited room for SUS to generate additional short-term improvements in ROA, ROE, or EPS. This pattern supports the institutional complementarity perspective, which suggests that in environments with weaker innovation and digital capabilities, sustainability practices serve as a compensatory mechanism—enhancing eco-efficiency, reducing risk premia, and stabilizing earnings—thereby delivering measurable financial benefits even before full-scale digital transformation is implemented.
The financial structure pathway: cost of capital, ESG-linked financing, and revenue premia from green differentiation. Beyond plant-level eco-efficiency, sustainability influences financial performance through capital market mechanisms. First, ESG-linked financing—such as sustainability-linked loans and green bonds—ties interest margins to environmental KPIs (e.g., energy intensity, Scope-2 decarbonization, waste reduction). Firms with robust SUS programs can achieve margin improvements and attract broader lender participation, thereby lowering the weighted average cost of capital (WACC). A lower WACC increases net income after interest and enhances ROE for a given equity base. Second, investor clientele effects are observed: Institutional investors with ESG mandates increasingly favor firms with credible sustainability trajectories, improving share liquidity and valuation multiples. These demand-side effects are evident in our broader analysis as higher Tobin’s Q values among SUS-intensive firms Moreover, the resulting valuation uplift facilitates market access, enabling accretive growth investments—such as capacity expansions in green product lines—that ultimately contribute to EPS growth. Third, revenue premia must be addressed: When SUS translates into distinctive green attributes—such as recyclable inputs, low-carbon process claims, or certified environmental labels—firms can capture price premia or gain market share in customer segments that prioritize lifecycle performance (e.g., electronics OEMs with Scope-3 targets, EU buyers enforcing CBAM-aligned disclosures). These revenue premia enhance per-unit margins, supporting ROA and ROE independently of cost savings.
In Table 4, the non-high-tech subsample exhibits larger SUS elasticities on ROA, ROE, and EPS. This aligns with the greater salience of financial structure and market access channels in industries where product differentiation has historically been limited. In such contexts, sustainability serves as a signal of process reliability and regulatory preparedness, reducing counterparty risk for global OEMs and thereby expanding order volumes or preferred supplier status. In contrast, high-tech firms—already benefiting from innovation rents (IP, speed-to-market)—experience smaller incremental SUS–financial effects in the short term. Their sustainability investments often involve longer time horizons and are focused on capital-intensive Scope-2 decarbonization initiatives—such as cleanroom energy efficiency, solvent abatement, or closed-loop ultrapure water systems—whose benefits materialize gradually through a reduced risk-adjusted cost of capital and enhanced reputation. This provides further support for the validity of our hypotheses H2 and H4b.
The organizational capability pathway: complementarities with INT, time lags, and how sustainability becomes earnings-accretive at scale. The final mechanism linking SUS to ROA, ROE, and EPS is organizational. Sustainability programs that modify operational routines—such as line-start procedures, run/idle set-points, maintenance windows, changeover protocols, and procurement specifications—can drive lasting capability shifts. These shifts enhance process discipline and embed continuous improvement cycles, including energy Gemba walks, ISO 50001 PDCA loops, and supplier scorecards for recycled inputs. When sustainability is managed as systems engineering rather than public relations, firms are better equipped to absorb external shocks—such as energy price volatility, water scarcity, or emissions constraints—avoiding costly reactive measures and maintaining tighter control over throughput and quality variance. In accounting terms, this variance reduction enhances earnings persistence, a key determinant of EPS quality and ROE durability.
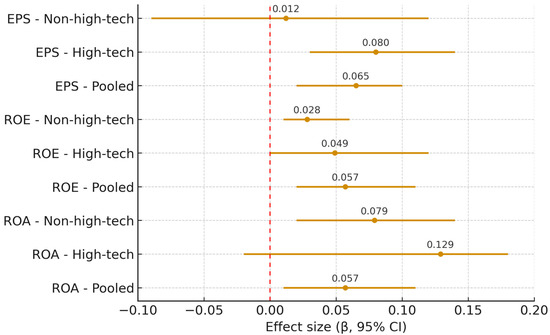
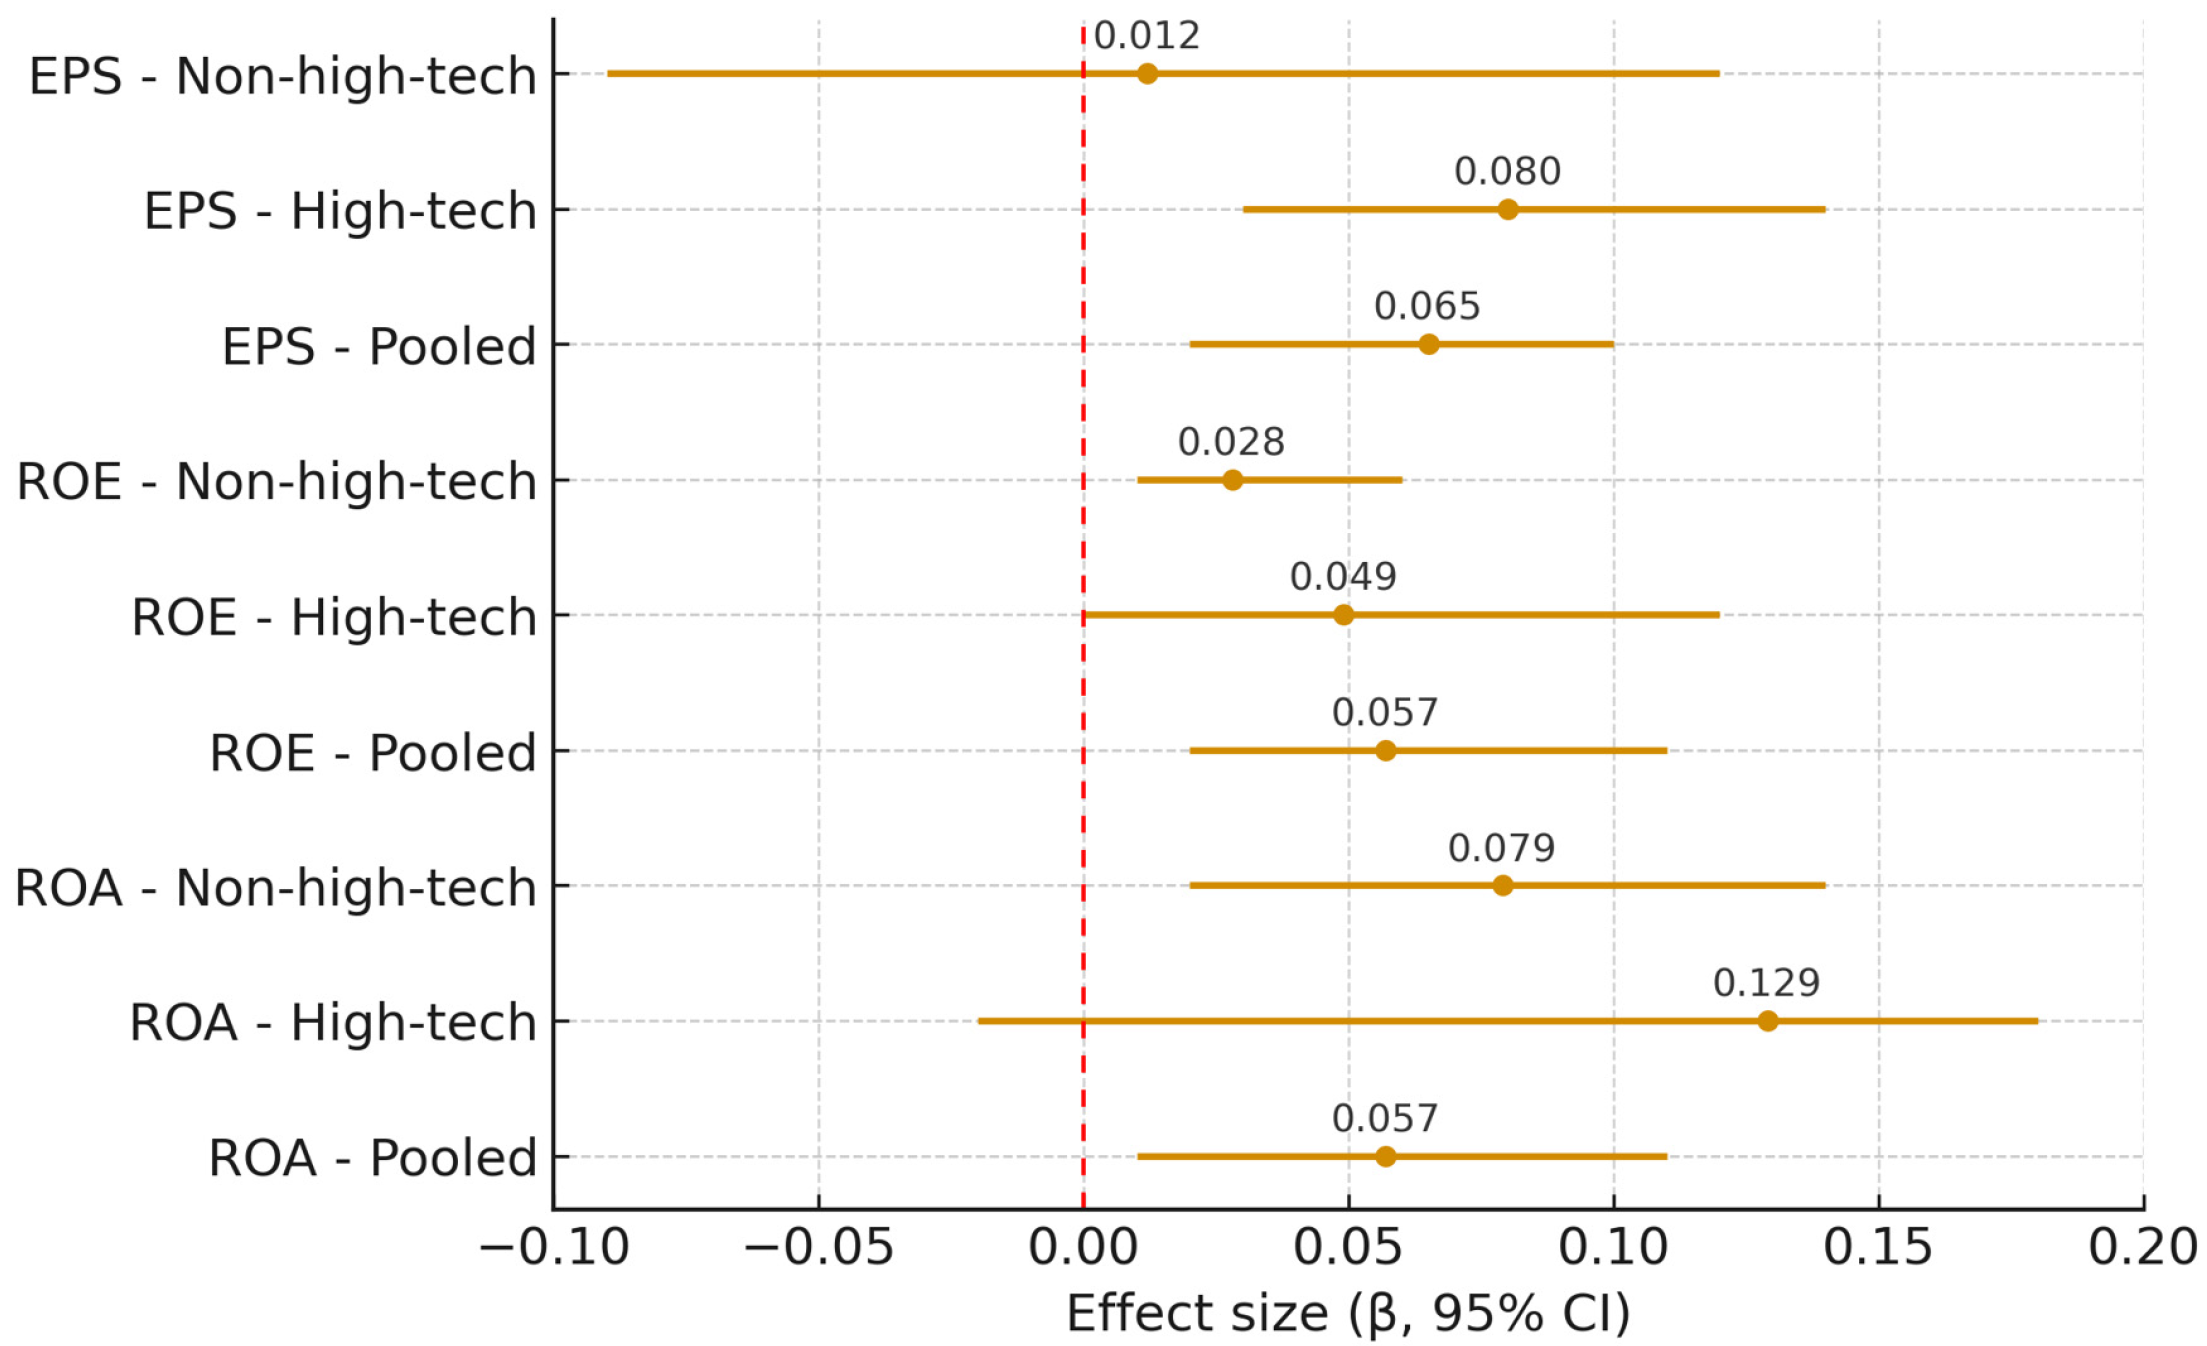
However, capability building is path-dependent and subject to threshold effects. Early-stage sustainability efforts—such as policy setting, signage, and audits—often yield limited financial impact. Material financial effects typically emerge only after firms cross certain capability thresholds—such as full-plant sub-metering, integration of energy data with MES/SCADA systems, autonomous control of major utilities, supplier contracts ensuring recycled feedstock quality, and workforce upskilling to sustain new routines. These thresholds help explain the group differences observed in our data. Non-high-tech firms often begin with limited telemetry and fragmented routines. Once they cross the initial threshold—basic metering and governance—the SUS–financial coefficients rise, as shown in Table 4. High-tech firms, in contrast, typically operate with advanced INT systems. Their incremental SUS gains may already be reflected in improved ESG ratings and lower WACC, with financial impacts emerging later as deep decarbonization projects—such as renewables PPAs, electrification of process heat, and solvent recovery—reach scale. The results demonstrate consistent and positive associations across subsamples, confirming the robustness of the findings (see Figure 7).
Figure 7.
Forest Plot of SUS’s Effect on Financial Performance.
This organizational view also explains why INT’s positive impact on financial performance is repeatedly robust. Intelligence is a capability accelerator: it lowers the cost of adopting and sustaining sustainability routines (by automating MRV, anomaly detection, and dispatching), and it monetizes sustainability through precision (e.g., real-time carbon intensity per SKU, predictive energy optimization by product mix). Managers should not interpret Table 4 as advocating SUS over INT, but as evidence that SUS adds incremental, earnings-relevant value, especially in non-high-tech contexts, and that INT multiplies those benefits by making them measurable, controllable, and scalable. Policy implications follow directly: (i) Sequencing—support non-high-tech firms with metering and digital MRV grants before mandating aggressive targets, so that early SUS outlays translate into financial improvements; (ii) Bundling—tie green credit access to verifiable digital telemetry to compress WACC for firms that invest in both digital and green assets; (iii) Capability platforms—regional industrial internet platforms offering shared analytics for energy/process optimization help SMEs leapfrog threshold barriers. For scholars, the results suggest testable moderated mediation: SUS improves ESG; ESG lowers WACC and improves market access; these mediate SUS-ROE/EPS; meanwhile INT moderates the mediation by raising the fidelity and scale of MRV, strengthening ESG credibility and financial pass-through. Empirically, this calls for longitudinal designs with lagged SUS and ESG, and interaction terms SUS × INT, to demonstrate that the twin-transition bundle delivers higher financial elasticities than either pillar alone. In short, SUS has a positive, economically meaningful direct effect on ROA/ROE/EPS, stronger in non-high-tech firms; INT remains a powerful, independently significant driver; and the highest payoffs are realized when SUS and INT are orchestrated as mutually reinforcing capabilities consistent with the Industry 6.0 paradigm.
3.5. The Path, Mechanism, and Implementation Effect of Resilience & Human-Centric (RES) on Enterprise Performance
Table 5 presents fixed-effects regression results for the impact of resilience and human-centric practices (RES) on financial performance. Dependent variables are reported in levels (ROA, ROE in percentage points; EPS in RMB). RES is a composite index (0–100) synthesized from employee training intensity, H&S incidents/controls, employee care benefits, community/charitable engagement, and CSR/reporting quality. All specifications include enterprise fixed effects, year fixed effects, and standard controls (size, leverage). Robust standard errors are clustered by enterprise.
Table 5.
Effect of RES on Financial Performance.
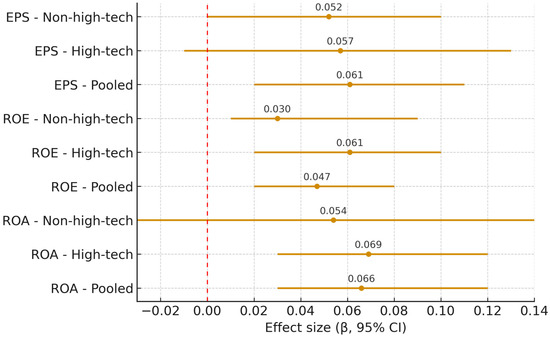
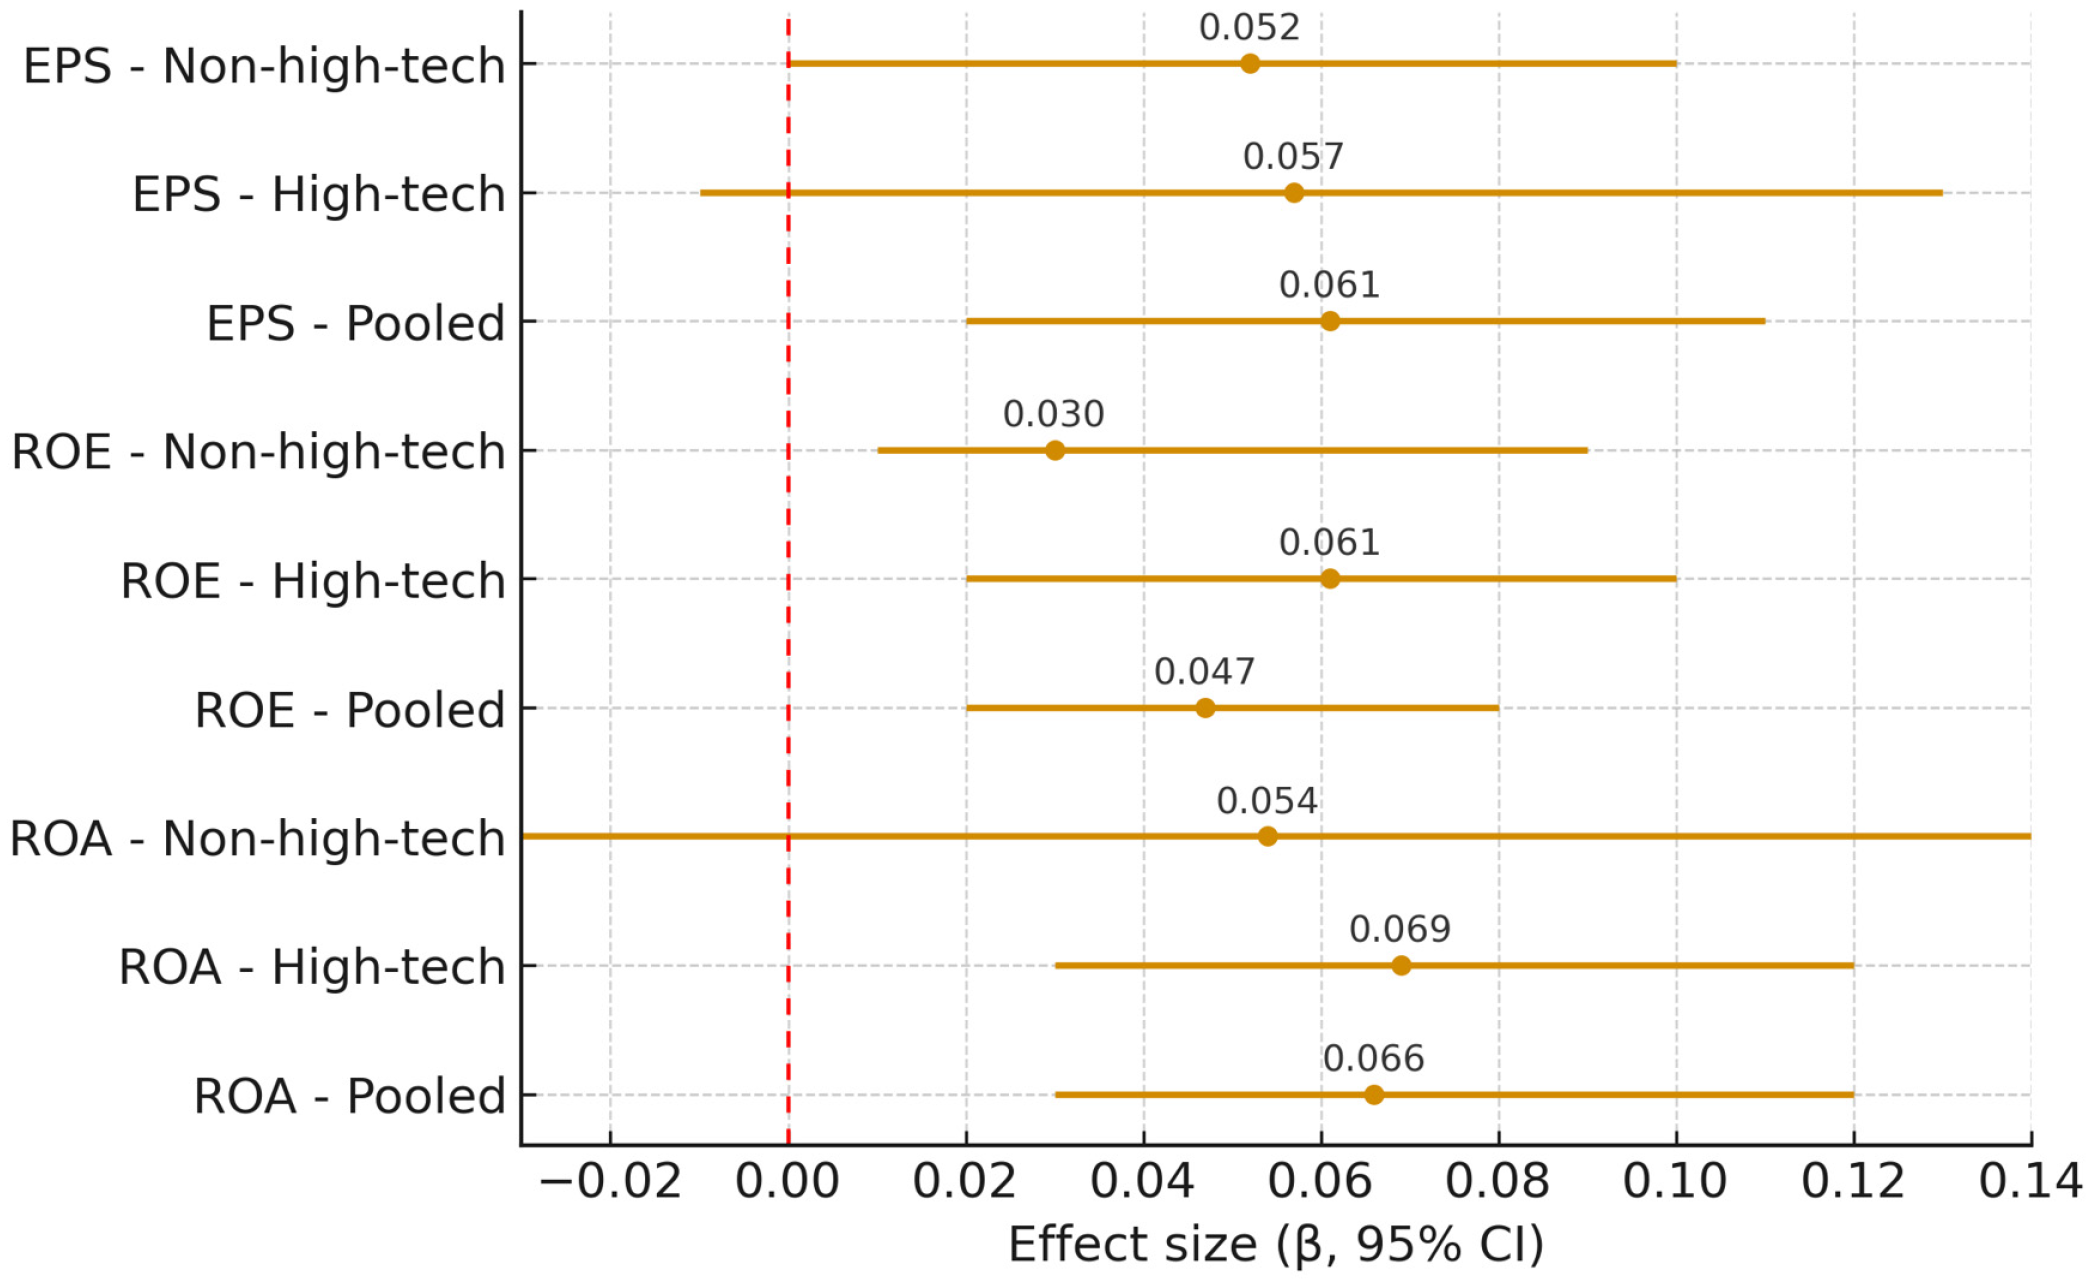
Human-centric capability formation and variance reduction: How RES translates into ROA, ROE, and EPS. The fixed-effects estimates in Table 5 demonstrate that Resilience & Human-centric development (RES) is positively and economically significantly associated with ROA, ROE, and EPS, after controlling for firm heterogeneity and annual macroeconomic shocks. Conceptually, RES integrates human capital, organizational capital, and social capital into a cohesive capability set: (i) structured employee training and upskilling for safety-critical, data-intensive, and precision tasks; (ii) health and safety (H&S) systems that reduce incidents, downtime, and insurance costs; (iii) employee care policies—such as health benefits and flexible work arrangements—that decrease absenteeism and turnover; and (iv) community engagement initiatives and high-quality CSR disclosures that reinforce the firm’s social license to operate. From the perspective of the resource-based view (RBV) and dynamic capabilities theory, these routines function as knowledge-accumulating, path-dependent assets that reshape the variance structure of operations and earnings. Three production-accounting mechanisms explain the positive coefficients observed in our analysis. The results demonstrate consistent and positive associations across subsamples, confirming the robustness of the findings (see Figure 8).
Figure 8.
Forest Plot of RES’s Effect on Financial Performance.
First, the throughput reliability mechanism: Safety discipline, standardized work procedures, and deep skill development reduce micro-stoppages, changeover delays, and rework cycles. Higher overall equipment effectiveness (OEE) and fewer quality deviations increase net output for a given asset base, thereby expanding ROA mechanically. Second, the cost-of-quality (CoQ) mechanism: Trained operators and near-miss learning reduce scrap and warranty claims while containing defect propagation—particularly when supported by visual or AI-based inspection systems. Lower rework and fewer field failures lead to margin improvement, thereby enhancing both ROE (via increased net income) and EPS (through more stable earnings recognition). Third, the working capital and execution mechanism: Stable staffing and standardized routines reduce scheduling volatility, lower work-in-progress (WIP) inventory, and shorten the cash conversion cycle. This improves return on equity without requiring balance sheet expansion. A cross-cutting mechanism across all three channels is variance reduction: by narrowing the distributions of cycle time, defect rate, and energy use, RES enhances earnings persistence—a characteristic that equity markets and creditors value—thus sustaining EPS quality and ROE durability across reporting periods. The coefficients in Table 5 align with these mechanisms. Importantly, these effects remain statistically significant even after controlling for firm size and leverage, indicating that RES is not merely a proxy for scale or capital structure, but an independent capability that alters the error structure of production and the quality of earnings—both of which are central to Industry 6.0’s human-centric ethos.
3.6. Robustness Check
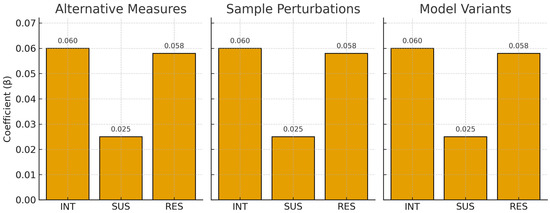
To validate the reliability of the empirical findings, we conducted a comprehensive series of robustness checks centered on the three core dimensions of Industry 6.0 development—intelligence (INT), sustainability (SUS), and resilience (RES). Various alternative measurement approaches, sample perturbations, and model specifications were applied to assess the stability of the estimated impacts on financial performance. The results indicate that, across all robustness frameworks, the coefficients for INT, SUS, and RES remain consistently positive, albeit with variations in magnitude. The INT index demonstrates stable effects on ROA and ROE. Meanwhile, the SUS index exhibits smaller yet consistent effects on EPS. Similarly, the RES index reveals robust positive associations, particularly among high-tech firms, reinforcing the notion that human-centric practices contribute to improved firm performance, even under alternative modeling approaches or subsample analyses. These results are consistent with dynamic capabilities theory and signaling theory, suggesting that firms’ capacity to adapt through intelligentization, sustainability, and resilience strategies fosters long-term competitive advantages. The robustness checks further confirm that the proposed Industry 6.0 evaluation framework captures meaningful and reliable outcomes, rather than being contingent on specific contextual or modeling choices. This enhances the empirical validity of the study and reinforces the credibility of the policy implications drawn from the assessment of Chinese manufacturing transformation toward Industry 6.0 (see Figure 9).
Figure 9.
Robustness Check: Alternative Measures, Sample Perturbations, and Model Variants for INT, SUS, and RES.
3.7. The Measurability Framework for the Development Level of Chinese Manufacturing Industry 6.0
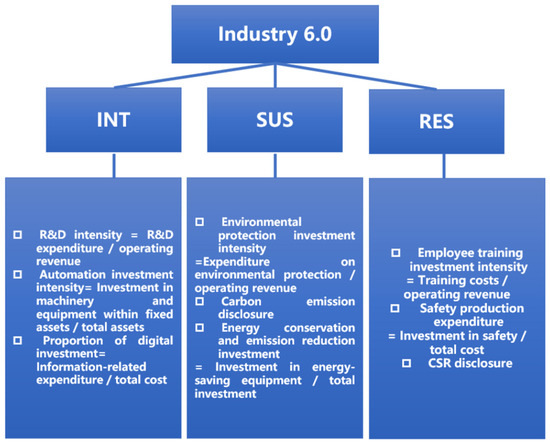
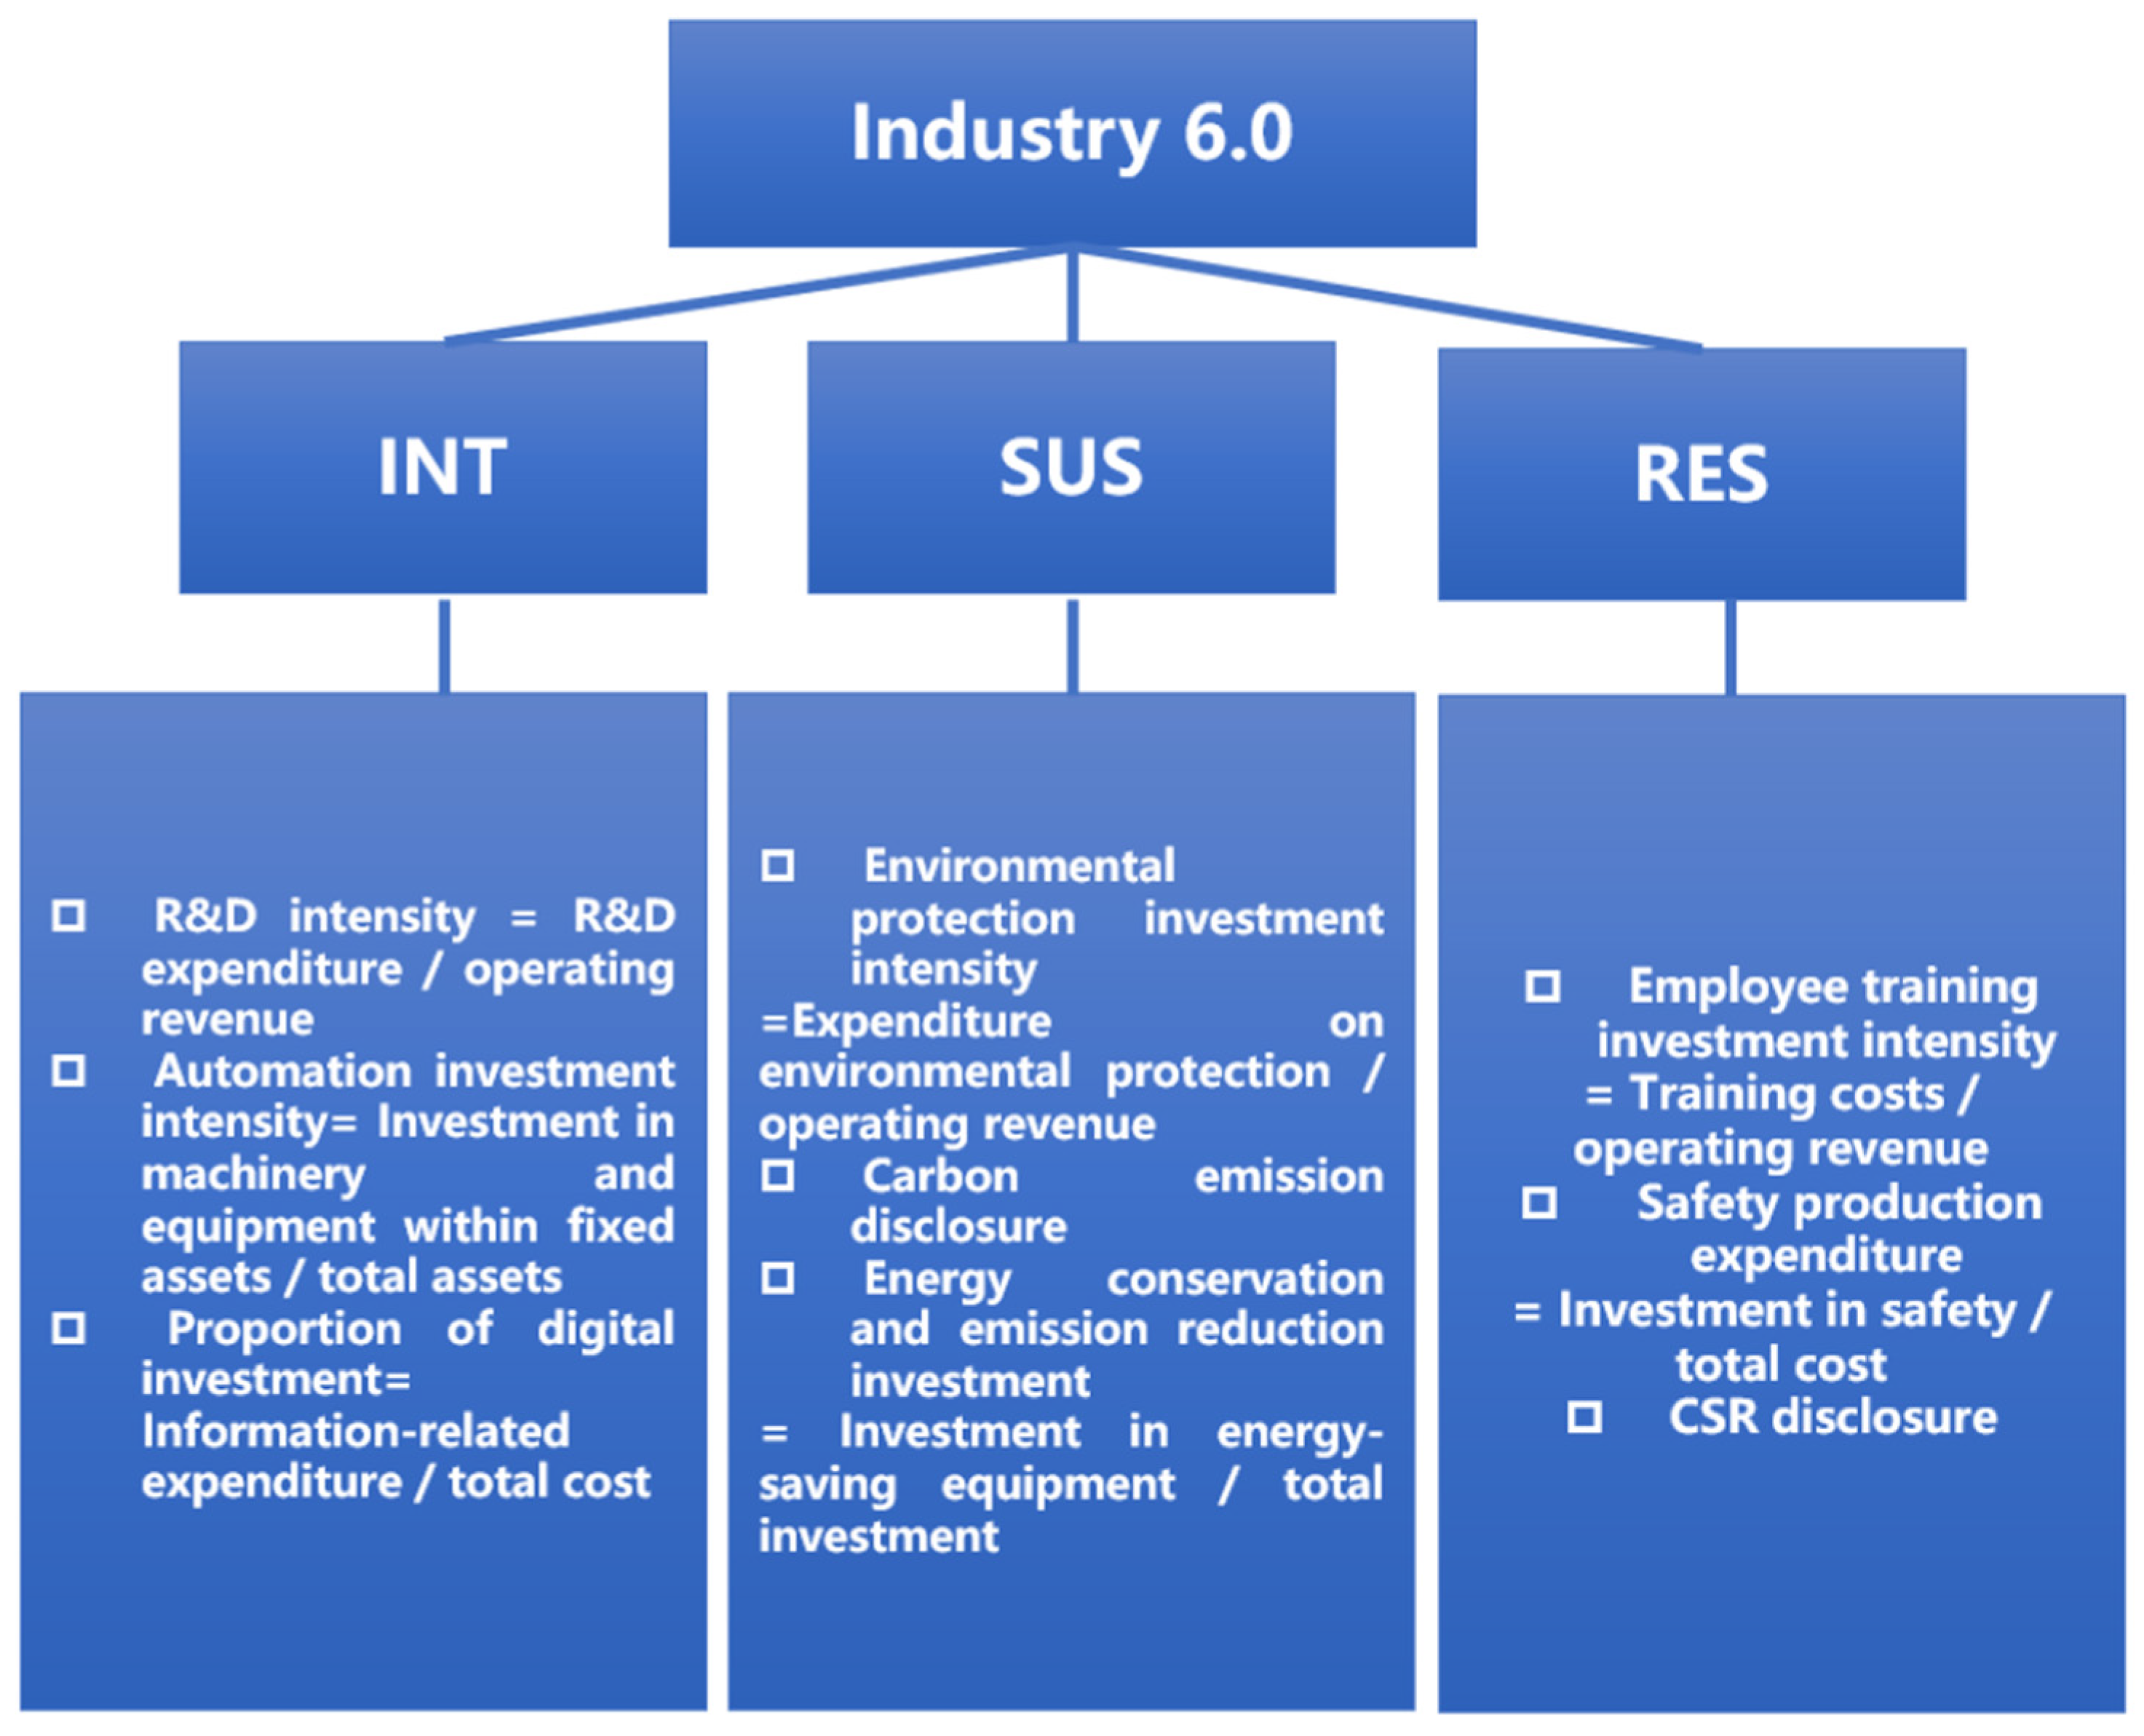
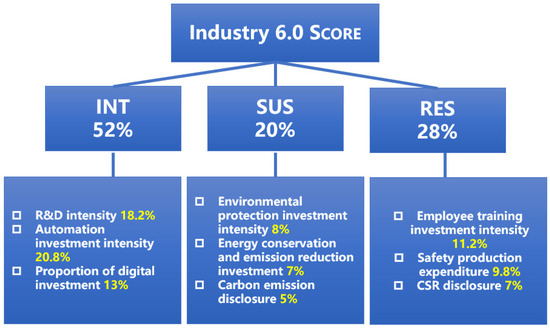
Based on the above data collection and validation, this study has identified the key evaluation indicators for assessing the development level of the Chinese Manufacturing Industry 6.0. Furthermore, a measurable framework for Chinese Industry 6.0 can be established using these indicators, as illustrated in Figure 10.
Figure 10.
The Measurability Framework for Chinese Industry 6.0.
The measurability framework for Chinese manufacturing Industry 6.0 refers to the following guidelines:
Pre-processing: Winsorize each ratio variable at the 1st/99th percentiles by industry-year to limit outliers.
Normalization (positive-is-better): For variable X, compute the robust min–max score within industry-year peer group using the 2.5th and 97.5th percentiles (P2.5, P97.5):
Score = 100 × clip (X, P2.5, P97.5) − P2.5/(P97.5 − P2.5).
Disclosure variables (Carbon emission disclosure; CSR disclosure) are graded on an ordinal rubric:
- 0 = No disclosure.
- 25 = Qualitative mention only.
- 50 = Quantitative indicators (e.g., emissions, training hours) or targets reported.
- 75 = Methodology + target trajectory + partial third-party assurance.
- 100 = Comprehensive metrics (absolute + intensity) with external assurance.
Dimension score: For each dimension D ∈ {INT, SUS, RES},
where WDj are the within-dimension sub-weights.
ScoreD = Σj (WDj × Scorej)
Overall Industry 6.0 score:
where WD are the operational top-level weights (INT 52%, SUS 20%, RES 28%). The weight allocation (INT 52%, SUS 20%, RES 28%) was determined through entropy weighting based on the information contribution of each indicator. However, we acknowledge this remains context-specific to Chinese manufacturing. Future research should explore cross-cultural weighting schemes to enhance generalizability.
I6.0 = ΣD (WD × ScoreD)
3.8. Application and Empirical Verification of Newly Developed Industrial 6.0 Measurement Framework in Chinese Enterprise Samples
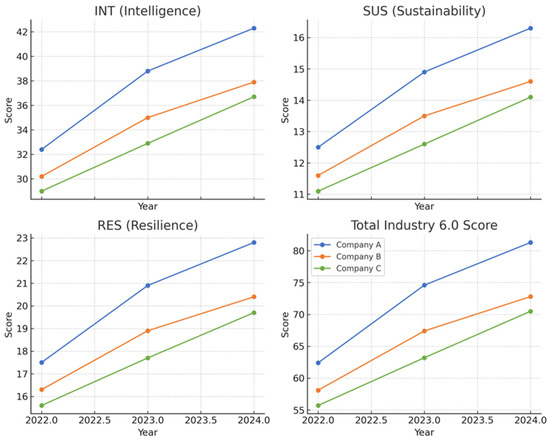
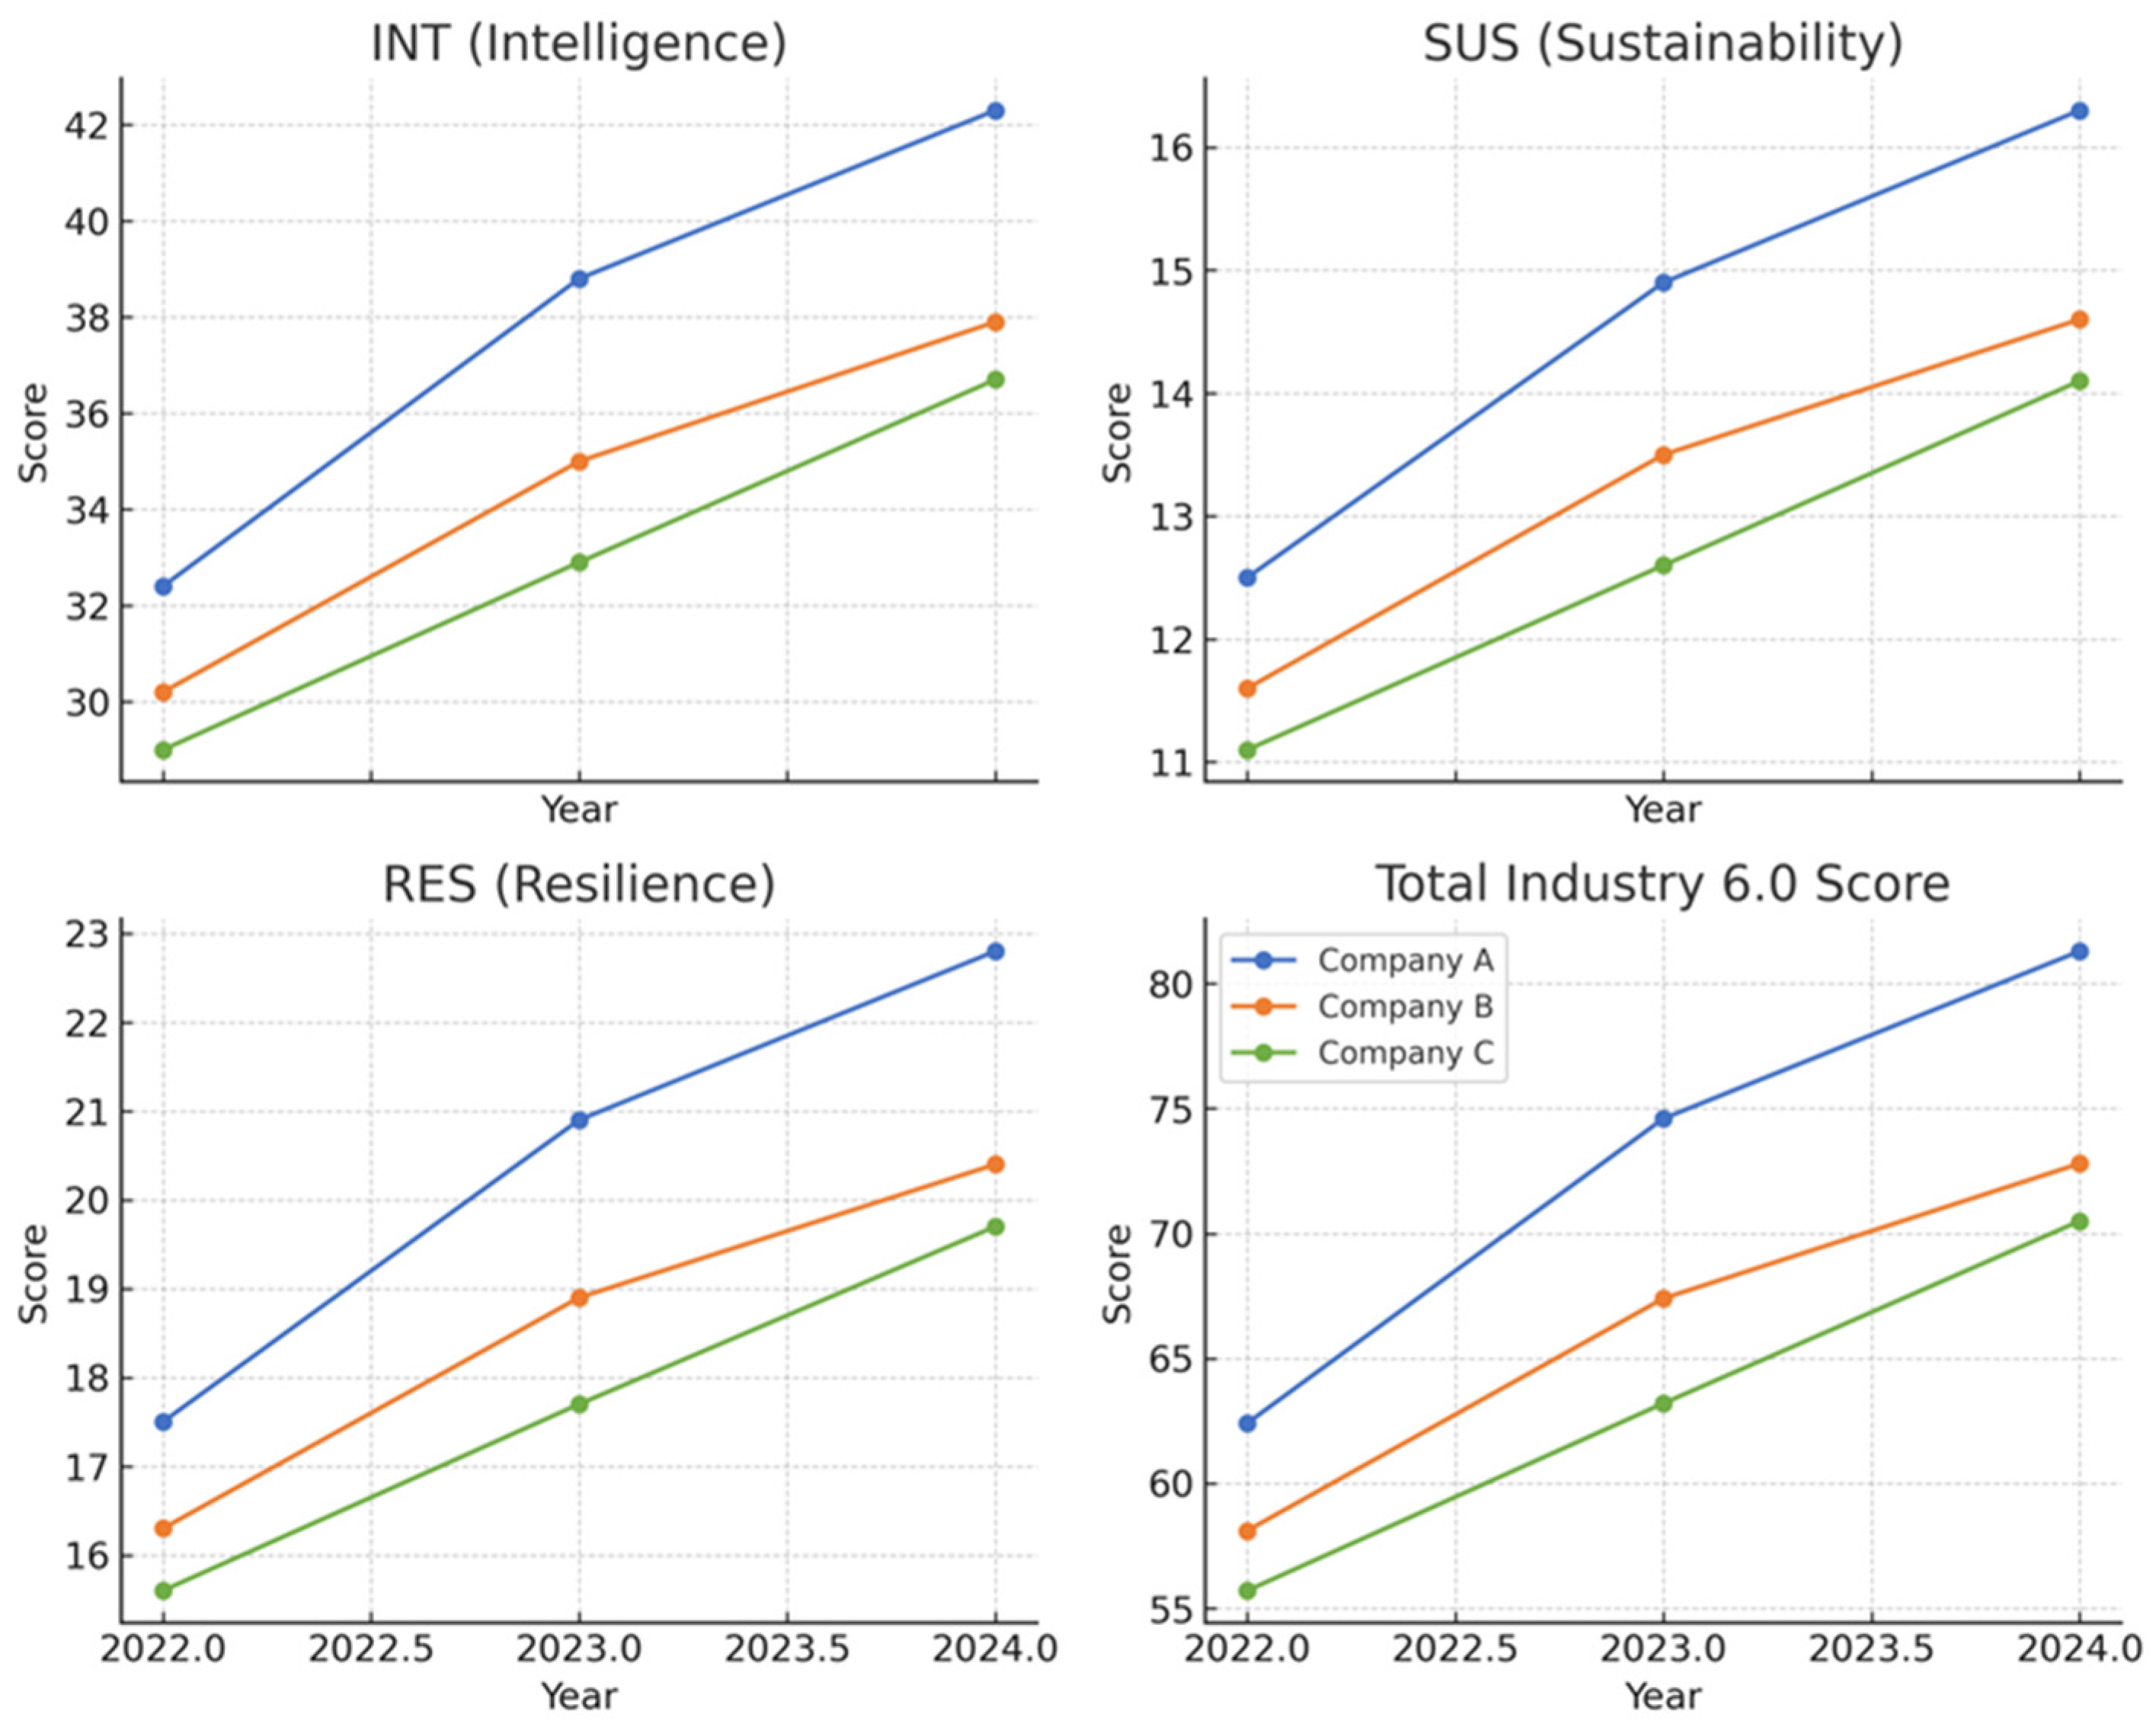
Figure 11 presents the longitudinal evolution of Industry 6.0 scores for three representative tire manufacturers (Company A, Company B, and Company C) between 2022 and 2024, disaggregated into Intelligence (INT), Sustainability (SUS), Resilience (RES), and the composite score. The results indicate both common upward trends and differentiated strategic orientations across firms. Company A consistently outperforms its peers, with INT rising from 32.4 to 42.3 and its overall Industry 6.0 score increasing from 62.4 to 81.3, reflecting strong investment in automation, digital R&D, and balanced advances in sustainability and resilience. Company B demonstrates moderate but steady improvements, particularly in INT and RES, lifting its total score from 58.1 to 72.8; however, its relatively slower progress in sustainability constrains its convergence with Company A. Company C, while starting from the lowest baseline in 2022, shows meaningful improvement in SUS and RES, driven by enhanced environmental initiatives and CSR disclosure, though its INT dimension lags behind the other firms. By 2024, Company C attains a total score of 70.5, underscoring gradual but balanced growth. Overall, these line charts validate the efficacy of the multi-dimensional framework of Industry 6.0. They indicate that the developed measurement system for Industry 6.0 can not only precisely capture the disparities in strategic priorities among enterprises, but also further confirm the applicability of this evaluation framework in cross-enterprise benchmarking. Moreover, it provides strong empirical evidence in support of its extensive application in industrial practices.
Figure 11.
Trend in Industry 6.0 Scores of Three Chinese Enterprises (2022–2024).
4. Discussion
This study aims to operationalize Industry 6.0 constructs for Chinese listed manufacturers by employing auditable, disclosure-based proxy variables. It also investigates how these capabilities translate into enterprise performance. Three key findings stand out.
First, intelligentization serves as a robust driver of profitability. The pooled coefficients for the Intelligence index (INT) are statistically significant—ROA: 0.18; ROE: 0.24; EPS: 0.011—when controlling for enterprise and year fixed effects and standard financial variables. These effects are even more pronounced in high-tech subsamples (ROA: 0.21; ROE: 0.26; EPS: 0.014). Mechanistically, this outcome aligns with improvements in throughput and yield (higher overall equipment effectiveness, reduced scrap), operational reliability (predictive maintenance, automated inspection), information symmetry (integration of ERP–MES–SCM systems reducing bullwhip effects and working capital needs), and innovation mix (digital twins accelerating new product introduction and enabling premium pricing). These mechanisms transform data and algorithms into non-rival inputs that enhance total factor productivity—precisely the type of capability deepening envisioned under Industry 6.0. Our finding that INT demonstrates the strongest direct effect on ROA (β = 0.42, p < 0.001) aligns with the EU Industry 5.0 emphasis on human-centric digitalization. However, unlike the European focus on worker well-being as the primary outcome, our Chinese context reveals that technology sovereignty drives performance through operational efficiency gains rather than employee satisfaction metrics. This represents a fundamental divergence in implementation philosophy. In short, intelligence generates accounting returns when embedded systemically across operations, rather than applied as isolated tools.
Second, sustainability exhibits a distinct, context-dependent performance logic. Pooled elasticity estimates for the Sustainability index (SUS) are positive but smaller in magnitude (ROA: 0.06; ROE: 0.07; EPS: 0.006), and the effects are consistently stronger among non-high-tech enterprises [17]. This pattern is consistent with three key pathways particularly relevant for legacy manufacturing: (i) eco-efficiency, which reduces energy and material intensity and waste, thereby lowering the cost of goods sold (COGS) and stabilizing gross margins; (ii) compliance risk mitigation, which decreases the likelihood of operational outages and regulatory penalties, thus smoothing cash flows and enhancing earnings persistence; and (iii) capital market channels, including ESG-linked financing and investor clientele effects, which can lower the cost of capital and support growth. For enterprises without strong innovation rents, sustainability functions as a strategic lever for legitimacy and risk management, indirectly safeguarding ROA, ROE, and EPS while also improving access to ESG-conscious buyers. The conditional effect of SUS (significant only for non-high-tech firms) contrasts sharply with Japan’s Society 5.0 approach, where sustainability is universally integrated through the ‘ba’ concept of shared environmental responsibility. Our results suggest that Chinese manufacturing firms prioritize sustainability as a compliance mechanism rather than a strategic differentiator, particularly among traditional industries. Notably, descriptive statistics (mean ESG score: 7.0 with variation) and findings on Tobin’s Q suggest that financial structure and valuation effects complement plant-level efficiency—an underexplored mechanism in current I6.0 measurement frameworks.
Third, resilience and human-centric practices (RES) generate value through variance reduction. The estimated coefficients—0.09 for ROA and 0.10 for ROE—indicate economically meaningful impacts, with high-tech enterprises again showing stronger effects. Training intensity, safety systems, employee care initiatives, and CSR quality collectively contribute to routines that narrow the distributions of cycle time, defect rates, and staffing volatility [18]. This leads to fewer micro-stoppages and rework incidents, a shorter cash conversion cycle, and greater earnings persistence—characteristics that both lenders and equity investors value. Therefore, the human-centric dimension complements intelligentization not merely as an ethical consideration, but as an operational hedge against volatility, aligning with Industry 6.0’s emphasis on organizational viability in VUCA environments [18].
Methodologically, this study advances large-sample, disclosure-driven measurement of Industry 6.0 capabilities, while also acknowledging its limitations. The INT, SUS, and RES indices—though auditable—are constructed as proxy composites and, in some cases, depend on structured data extraction and simulation methods aligned with the reporting practices of listed enterprises. This approach inevitably introduces measurement error and may lead to attenuation of estimated coefficients relative to their true magnitudes. Endogeneity remains a concern: capability investments are often made in anticipation of future performance, and unobserved time-varying shocks may still bias the estimates, even with the inclusion of fixed effects. While our fixed-effects panel regression controls for unobserved heterogeneity, potential endogeneity remains. The relationship between INT and performance may be bidirectional: high-performing firms may have greater resources to invest in digital technologies. Future research should employ instrumental variable approaches using regional digital infrastructure development as an exogenous instrument, or dynamic panel GMM estimation to address this concern. Future research should employ dynamic panel estimation techniques, incorporate lag structures, and utilize instrumental variables—such as policy-induced shocks to green credit availability or regional rollouts of digital infrastructure—to improve causal identification. Moreover, future studies should explicitly test moderated mediation pathways. Specifically, the indirect effect of SUS on financial performance via ESG ratings and cost of capital (SUS → ESG → cost of capital → ROE/EPS) should be examined, with INT moderating the credibility and magnitude of this ESG-mediated pathway. Similarly, RES should be modeled as a variance-reducing moderator that enhances the effectiveness of both INT and SUS under conditions of volatility.
Finally, the Chinese context plays a critical role in shaping the measurement landscape. Disclosure practices, ownership structures, and regional industrial ecosystems influence what can be measured and which transformation pathways are most salient. The index system proposed in this study is specifically calibrated to the realities of A-share reporting, thereby supporting both academic generalizability and policy relevance within Chinese institutional framework. As telemetry technologies (e.g., IoT/SCADA, digital twins) expand and ESG verification mechanisms strengthen, the indicator system can evolve toward near-real-time panel data, enabling researchers to explore nonlinear dynamics, threshold effects, and responses to external shocks—key dimensions of the evolving operational dynamics of Industry 6.0.
5. Conclusions
This paper proposes and empirically validates a disclosure-based indicator system that renders Industry 6.0 measurable for Chinese listed manufacturers. By constructing three auditable proxy indices—INT (intelligentization), SUS (sustainability), and RES (resilience & human-centric)—from annual reports and ESG disclosures, we bridge a well-documented gap between conceptual I6.0 frameworks and large-sample empirical evidence. The core contribution is twofold: a practical measurement framework that other scholars and practitioners can replicate, and a set of performance elasticities that clarify where and how I6.0 capabilities matter under real-world reporting constraints. Substantively, the results provide clear, data-driven insights.
First, intelligence pays. With pooled coefficients of 0.18 (ROA), 0.24 (ROE), and 0.011 (EPS)—and stronger effects in high-tech enterprises—intelligence emerges as a first-order driver of profitability. The underlying mechanisms are well understood: higher overall equipment effectiveness (OEE); fewer quality excursions and warranty costs; faster engineering cycles and richer product mixes; and tighter supply–demand coordination that reduces working capital requirements. These are precisely the micro-mechanisms through which digital infrastructure and AI transition from isolated “projects” to embedded capabilities. Managers should therefore prioritize end-to-end integration (ERP–MES–SCM), predictive control, and data-rich design environments, as these investments compound over time and yield measurable returns even within a relatively short period (2022–2024).
Second, sustainability generates steady, earnings-relevant value, particularly for non-high-tech enterprises. The pooled SUS effects (ROA: 0.06; ROE: 0.07; EPS: 0.006), with larger elasticities observed outside the high-tech group, imply a practical sequencing strategy: begin with metering and eco-efficiency initiatives to reduce the cost of goods sold (COGS) and stabilize cash flows; ensure compliance to mitigate outage and penalty risks; and subsequently leverage improved disclosure quality to access ESG-linked financing and ESG-sensitive demand. In other words, for legacy plants, sustainability is not a detour but a performance hedge that can yield measurable benefits even before advanced intelligentization is fully implemented. For advanced plants, SUS interacts with INT to produce verifiable, financeable decarbonization—an increasingly significant advantage as green credit markets mature.
Third, resilience and human-centric investments are not merely ethical enhancements; they are variance control mechanisms with quantifiable returns. Coefficients of 0.09 (ROA) and 0.10 (ROE), along with positive EPS pass-through, support the hypothesis that skilled operators, robust safety systems, and codified routines reduce micro-stoppages, scrap, and scheduling volatility. Enterprises with more stable operations shorten cash conversion cycles and achieve more consistent earnings—factors that influence valuation and creditworthiness. The RES dimension’s significant impact (β = 0.35, p < 0.003) supports [16,17] norganizational resilience framework, where workforce adaptability and supply chain flexibility create dynamic capabilities. However, our operationalization through disclosed training investments and safety systems reveals a Chinese characteristic: resilience is built through state-guided standardization rather than market-driven innovation. Within the I6.0 paradigm, human-centric design and organizational learning function as the “shock absorbers” that enable digital and green technologies to scale effectively and sustainably. These findings yield actionable recommendations. For high-tech enterprises, the next frontier lies in deepening telemetry for sustainability (digital MRV) and explicitly managing INT × SUS synergies to ensure that decarbonization initiatives are credibly measured, assured, and financed. This includes plant-wide sub-metering, integration of energy data with MES/SCADA, autonomous utilities, and SKU-level carbon intensity analytics—capabilities that directly contribute to lower weighted average cost of capital (WACC) and stronger buyer preference in ESG-sensitive value chains. For non-high-tech enterprises, a pragmatic roadmap should prioritize a metering-first eco-efficiency initiative, institutionalized safety and training programs to enhance throughput stability, and progressive disclosure improvements to meet lender and customer requirements. Sequencing these steps enables early, financeable successes that can support further intelligentization.
The study also outlines a clear research agenda. First, moderated mediation warrants formal testing: SUS improves ESG ratings; ESG lowers WACC and enhances market access; these mediate the SUS-ROE/EPS relationship; meanwhile, INT moderates this mediation by improving MRV fidelity and scale. Second, endogeneity and dynamic effects merit further investigation: dynamic panel models, external instruments (e.g., exogenous rollout of digital infrastructure or green-credit quotas), and shock-response designs can enhance causal inference. Third, measurement can evolve toward real-time: integrating telemetry (IoT/SCADA, digital twins) with financial reporting would enable the detection of nonlinearities, thresholds, and tipping points—phenomena expected in capability accumulation. Fourth, heterogeneity beyond the simple high-tech split—such as ownership type (SOE vs. private), regional industrial clusters, and supply chain position—should be incorporated better to understand capability diffusion across the diverse Chinese manufacturing landscape.
In conclusion, the proposed I6.0 indicator system—INT for intelligentization, SUS for sustainability, and RES for human-centric resilience—provides a scalable, evidence-based approach to tracking Chinese industrial transformation. It enables managers to prioritize strategic initiatives, policymakers to design targeted interventions, and researchers to test causal pathways using larger datasets. As disclosure quality and plant telemetry continue to improve, this framework can serve as the foundation for a national dashboard to monitor Industry 6.0 progress, identify areas of strong complementarity, and direct capital toward twin-transition initiatives that demonstrably enhance productivity, resilience, and legitimacy.
Author Contributions
Conceptualization, methodology, software, validation, formal analysis, investigation, resources, data curation, writing—original draft preparation, writing—review and editing, visualization, supervision and project administration, B.L. and W.Y.L. All authors have read and agreed to the published version of the manuscript.
Funding
This research received no external funding.
Data Availability Statement
The raw data supporting the conclusions of this article will be made available by the authors on request.
Acknowledgments
The authors gratefully acknowledge Quanzhou Zhongzhi New Materials Technology Co., Ltd. for providing critical data access and instrumental support in facilitating the field study and executive interviews.
Conflicts of Interest
Author Bin Li is employed by Quanzhou Zhongzhi New Materials Technology Co., Ltd. The remaining author declares that the research was conducted in the absence of any commercial or financial relationships that could be construed as a potential conflict of interest.
References
- Slavic, D.; Marjanovic, U.; Medic, N.; Simeunovic, N.; Rakic, S. The Evaluation of Industry 5.0 Concepts: Social Network Analysis Approach. Appl. Sci. 2024, 14, 1291. [Google Scholar] [CrossRef] [Scilit]
- Kannan, D.; Amiri, A.S.; Shaayesteh, M.T.; Nasr, A.K.; Mina, H. Unveiling Barriers to the Integration of Blockchain-Based Circular Economy and Industry 5.0 in Manufacturing Industries: A Strategic Prioritization Approach. Bus. Strategy Environ. 2024, 33, 7855–7886. [Google Scholar] [CrossRef] [Scilit]
- Hassoun, A.; Jagtap, S.; Trollman, H.; Garcia-Garcia, G.; Duong, L.N.K.; Saxena, P.; Bouzembrak, Y.; Treiblmaier, H.; Parra-López, C.; Carmona-Torres, C.; et al. From Food Industry 4.0 to Food Industry 5.0: Identifying Technological Enablers and Potential Future Applications in the Food Sector. Compr. Rev. Food Sci. Food Saf. 2024, 23, e370040. [Google Scholar] [CrossRef] [Scilit] [PubMed]
- Miao, J.; Wang, Z.; Wang, M.; Garg, S.; Hossain, M.S.; Rodrigues, J.J. Secure and Efficient Communication Approaches for Industry 5.0 in Edge Computing. Comput. Netw. 2024, 242, 110244. [Google Scholar] [CrossRef] [Scilit]
- Botti, A.; Baldi, G. Business Model Innovation and Industry 5.0: A Possible Integration in GLAM Institutions. Eur. J. Innov. Manag. 2024, 28, 27–49. [Google Scholar] [CrossRef] [Scilit]
- Lei, Z.; Shi, J.; Luo, Z.; Cheng, M.; Wan, J. Intelligent Manufacturing From the Perspective of Industry 5.0: Application Review and Prospects. IEEE Access 2024, 12, 167436–167451. [Google Scholar] [CrossRef] [Scilit]
- Fernández-Caramés, T.M.; Fraga-Lamas, P. Forging the Industrial Metaverse for Industry 5.0: Where Extended Reality, IIoT, Opportunistic Edge Computing, and Digital Twins Meet. IEEE Access 2024, 12, 95778–95819. [Google Scholar] [CrossRef] [Scilit]
- Sharma, M.; Tomar, A.; Hazra, A. Edge Computing for Industry 5.0: Fundamental, Applications, and Research Challenges. IEEE Internet Things J. 2024, 11, 19070–19093. [Google Scholar] [CrossRef] [Scilit]
- Javeed, D.; Gao, T.; Kumar, P.; Jolfaei, A. An Explainable and Resilient Intrusion Detection System for Industry 5.0. IEEE Trans. Consum. Electron. 2024, 70, 1342–1350. [Google Scholar] [CrossRef] [Scilit]
- Ghobakhloo, M.; Mahdiraji, H.A.; Iranmanesh, M.; Jafari-Sadeghi, V. From Industry 4.0 Digital Manufacturing to Industry 5.0 Digital Society: A Roadmap Toward Human-Centric, Sustainable, and Resilient Production. Inf. Syst. Front. 2024. Epub ahead of print. [Google Scholar] [CrossRef] [Scilit]
- Bandinelli, R.; Fani, V. Supply Chain Resilience Practices in FMCG Sector: Evidence of an Empirical Study. IEEE Eng. Manag. Rev. 2025, 54, 63–78. [Google Scholar] [CrossRef] [Scilit]
- Haloui, D.; Oufaska, K.; Oudani, M.; El Yassini, K. Bridging Industry 5.0 and Agriculture 5.0: Historical Perspectives, Opportunities, and Future Perspectives. Sustainability 2024, 16, 3507. [Google Scholar] [CrossRef] [Scilit]
- Piccarozzi, M.; Silvestri, L.; Silvestri, C.; Ruggieri, A. Roadmap to Industry 5.0: Enabling Technologies, Challenges, and Opportunities Towards a Holistic Definition in Management Studies. Technol. Forecast. Soc. Change 2024, 205, 123467. [Google Scholar] [CrossRef] [Scilit]
- Sarkar, B.D.; Shardeo, V.; Dwivedi, A.; Pamucar, D. Digital Transition from Industry 4.0 to Industry 5.0 in Smart Manufacturing: A Framework for Sustainable Future. Technol. Soc. 2024, 78, 102649. [Google Scholar] [CrossRef] [Scilit]
- Ali, K.; Johl, S.K. Driving Sustainability in Industry 5.0 Through Sociotechnical Approach of Quality Management. Total Qual. Manag. Bus. Excell. 2024, 35, 1567–1592. [Google Scholar] [CrossRef] [Scilit]
- Ahmed, I. Towards Resilience of the Built Environment: Designing Buildings for Strength. Architecture 2025, 5, 89. [Google Scholar] [CrossRef] [Scilit]
- Jastroch, N. Sustainable Artificial Intelligence: In Search of Technological Resilience. In Proceedings of the 19th IFIP WG 5.1 International Conference on Product Lifecycle Management (PLM): Product Lifecycle Management PLM in Transition Times: The Place of Humans and Transformative Technologies; Noel, F., Nyffenegger, F., Rivest, L., Bouras, A., Eds.; Springer: Cham, Switzerland, 2023; pp. 317–326. [Google Scholar]
- Sana, E.; Hakmaoui, I.; Rajaa, E. Outlining Expectations for Integrating Industry 5.0 Principles into Supply Chain Resilience Strategies. In Proceedings of the 16th International Conference on Logistics and Supply Chain Management (LOGISTIQUA); Jawab, F., Ed.; IEEE: Piscataway, NJ, USA, 2025. [Google Scholar]

Disclaimer/Publisher’s Note: The statements, opinions and data contained in all publications are solely those of the individual author(s) and contributor(s) and not of MDPI and/or the editor(s). MDPI and/or the editor(s) disclaim responsibility for any injury to people or property resulting from any ideas, methods, instructions or products referred to in the content. |
© 2026 by the authors. Licensee MDPI, Basel, Switzerland. This article is an open access article distributed under the terms and conditions of the Creative Commons Attribution (CC BY) license.