


Abstract
Stingless bee colonies are vulnerable to predators of widely varying sizes, and repeated intrusions can cause stress, reduce productivity, and trigger colony absconding. Existing automated surveillance systems detect only a limited range of predators and often struggle with multi-scale object detection in high-resolution images. This study proposes a real-time predator monitoring system that integrates a Multi-Scale Attention module into the YOLOv11-nano architecture (MSYOLO11) to enhance detection performance across both small and large predators. The proposed model combines convolutional features with an attention mechanism to improve global–local feature fusion. Experimental evaluation shows that MSYOLO11 increases overall Recall from 0.830 to 0.853 compared to YOLOv11-nano, with substantial improvements for small-object classes such as ants (+0.096), humans (+0.083), and H. itama (+0.026), while maintaining comparable Precision (0.868 vs 0.842) and mAP50 (0.898 vs 0.896) at a nearly identical computational cost (6.3 GFLOPs). The system operates at 5 FPS on a Jetson Orin Nano, with an end-to-end latency of 181 ms. A Firebase-integrated mobile application delivers instant push notifications, displays detected predators with bounding boxes, and provides real-time data synchronization. The results demonstrate that MSYOLO11 offers a practical and efficient solution for multi-scale predator detection, supporting continuous hive surveillance and timely beekeeper intervention.
1. Introduction
Precision Beekeeping (PB) or Precision Apiculture, which generally comes under Precision Agriculture, is a management strategy to enhance the production efficiency of bee products whilst optimizing resource utilization and improving colony welfare [1]. Beekeepers are typically required to manually inspect hives regularly to ensure good conditions; PB reduces their workload by providing continuous monitoring of one or more key hive parameters, such as temperature, humidity, and sound around the hives, and directing necessary actions at the right time only. This includes the identification of the optimal time to harvest or split the hive and performing intervening actions in the confirmed presence of an intruder. By minimizing disturbances to the hive to only when necessary, PB is able to reduce colony stress, an important factor affecting honey production and increasing the likelihood of the bees from absconding.
Colony absconding represents one of biggest problems facing beekeepers, as the complete abscondment of a hive results in significant losses of both time and investment [2]. Continuous attacks by predators are one of the most common reasons for colony abscondment, with such attacks increasing colony stress, weakening its defensive capability, and eventually forcing the colony to flee. Several natural hive protection mechanisms exist for predator protection. This includes the closing and narrowing of the hive entrance, the development of a complex hive entrance, coating the inner layer of the hive entrance with fresh resin or mud, and guarding of the hive by guard bees. These, however, only reduce the risk and severity of attacks, rather than eliminating them completely. For stingless bees, small predators such as mites, ants, spiders and resin bees may still be able to enter the hive [3]. Additionally, other common stingless bee predators, such as frogs, lizards, geckos, and certain bird species, prey on stingless bees by staying near the hive entrance and consuming the stingless bees as they go out of the hive, thereby reducing the number of worker bees, increasing colony stress and causing honey collection to suffer.
These mechanisms are also ineffective against larger vertebrate predators such as monkeys and humans. Although stingless bees have natural defense mechanisms, such as biting, harassment, caustic chemicals, alarm pheromones, and hovering guards, they are stingless due to their largely vestigial stinger, unlike honeybees. It is also common for stingless bees to suffer many deaths during an attack. A single attack from a mammal may bring significant damage to a colony, whilst invasion by smaller predators, such as ants and spiders, often goes unnoticed in the initial phase, silently weakening the hive. These challenges highlight the importance of having an effective surveillance system capable of early detection of predators and thereby protecting the stingless bees [4]. In recent years, numerous researchers have conducted research on developing computer-vision-based surveillance systems for this purpose [5].
Reference [6] utilized a KEYENCE IV-HG300CA machine vision sensor camera to capture images at a specialized gate designed to fit the entrance of honeybee hives to protect against the Varroa mite. The images from the sensor camera were analyzed at an average processing time of 0.1 s using template filtering, with alerts provided to beekeepers via a mobile application in the case of Varao mite attacks. On the other hand, Wachowicz et al. [7] and Voudiotis et al. [8] placed cameras inside the hive for monitoring and used deep learning algorithms, CNN-based DetectNet and Faster R-CNN, respectively, for the detection of Varroa mites, with the deep-learning approaches shown to provide higher accuracies compared to traditional image-processing methods.
Ntawuzumunsi et al. [9] used a digital camera to detect birds or moths attempting to enter bee hives, with beekeepers receiving mobile alerts via Wi-Fi in the case of an intrusion. Similarly, Jeon et al. [10] also developed a mobile-phone-based alert system for Asian hornets, a major predator of honeybees. Their system utilized an NVIDIA Jetson Xavier with a camera that captures three images per second outside the hive, with a YOLOv5 model trained to detect Asian hornets deployed directly on the Jetson device. One of the main drawbacks of these systems, however, is that they are designed only to detect a limited set of predators. This limitation is partly due to challenges in multi-scale object detection. Predator sizes can vary significantly, from small insects, such as ants and spiders, to large vertebrates, such as monkeys and humans, and it is difficult to have a system that can reliably differentiate between these varying sizes of predators. This is compounded with the need for real-time detection.
YOLOv11 [11], the latest model in the Ultralytics’ YOLO family, offers a promising solution for real-time object detection. Building upon previous YOLO versions, YOLOv11 incorporates significant optimizations in architectural design and training methodologies that enhance accuracy, speed, and efficiency, making it suitable for diverse computer vision tasks [12]. YOLO-based models have previously shown good performance in general object detection tasks. However, current convolution-based detection models, such as YOLO, still face challenges when detecting small objects within high-resolution images, especially when there are multi-scale objects in the images. This is because deeper convolution layers naturally reduce the resolution of all features, which affects small objects more, thereby making their detection more challenging [13]. As highlighted in various studies [14,15], there is still plenty of room to improve YOLO-based models to better detect multi-scale objects in high-resolution settings.
Despite the great success of CNNs in computer vision, further major breakthroughs are limited by their inherent inductive bias [16,17]. This bias, which represents the set of assumptions using a learning algorithm to generalize beyond observed training data, restricts each convolutional kernel to focus on only a sub-region of the image. Specifically, the translational equivariance (the idea that shifting the input shifts the output) and locality (the focus on local regions) of the convolutional operation led to a loss of global context and an inability to capture long-range dependencies [18]. To address the restricted receptive field, researchers have employed various strategies to enhance context modeling, such as the use of atrous convolution with adjustable expansion rates [19,20], large kernels to capture global context [21], and aggregation multi-scale information via pyramid pooling [22]. However, these methods offer only incremental improvements without fundamentally solving the core issue of the limited receptive field.
A more radical solution emerged with the Transformer model [23,24], originally developed for Natural Language Processing (NLP) [25], but has recently been used in computer vision [26,27,28]. The Transformer architecture replaces the convolution operation with a self-attention mechanism, allowing for a more complete modeling of global context within an image. Dosovitskiy et al. [29] used the Vision Transformer (ViT) model, and demonstrated that the Transformer-based model is capable of giving results comparable or superior to top CNN-based models on extensive datasets. However, although Transformers are able to capture global context, they struggle to extract intricate local details and characteristics due to the inherent nature of the self-attention mechanism, which assigns equal weight to every image token regardless of its spatial location.
The limitations of both CNNs and pure Transformers highlight the importance of integrating both global and local information for enhancing visual perception across various tasks. Models must not only capture the overall global context of an image but also give due attention to the finer details and local features within it. Consequently, many researchers have recently proposed hybrid architectures that combine the spatial feature extraction capabilities of CNNs with the long-range dependency modeling of Transformers [30]. A dual-branch approach is often adopted, where one branch utilizes CNNs (to take care of local details) and the other branch utilizes Transformer (to take care of the global context), followed by feature fusion using methods such as concatenating or convolution [30,31,32].
However, a major drawback of the conventional Transformer architecture is that the self-attention mechanism is computationally expensive, scaling quadratically with the spatial dimensions of the input image ()) for an image of size (). When dealing with the high-resolution images necessary for detecting fine details, this cost becomes prohibitive. To mitigate this issue, researchers have explored various efficiency enhancements. One approach manages to significantly reduce the processing power () by calculating attention over only a local square region, incorporating positional information through position encoding [33]. Furthermore, specialized attention mechanisms, such as the axial-based attention mechanism [34,35,36], have been proposed and utilized to improve feature extraction performance, though these are often applied to smaller images.
Therefore, this research aims to address the gap in the literature by focusing on the identification of multi-scale bee predators in high-resolution images. This is accomplished by developing a hybrid approach that integrates an attention mechanism with the YOLOv11 architecture. The proposed system is subsequently deployed on an edge device to enable continuous monitoring of beehives for predator detection.
2. Materials and Methods
2.1. System Overview
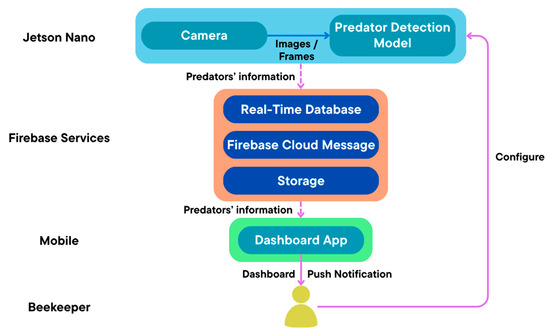
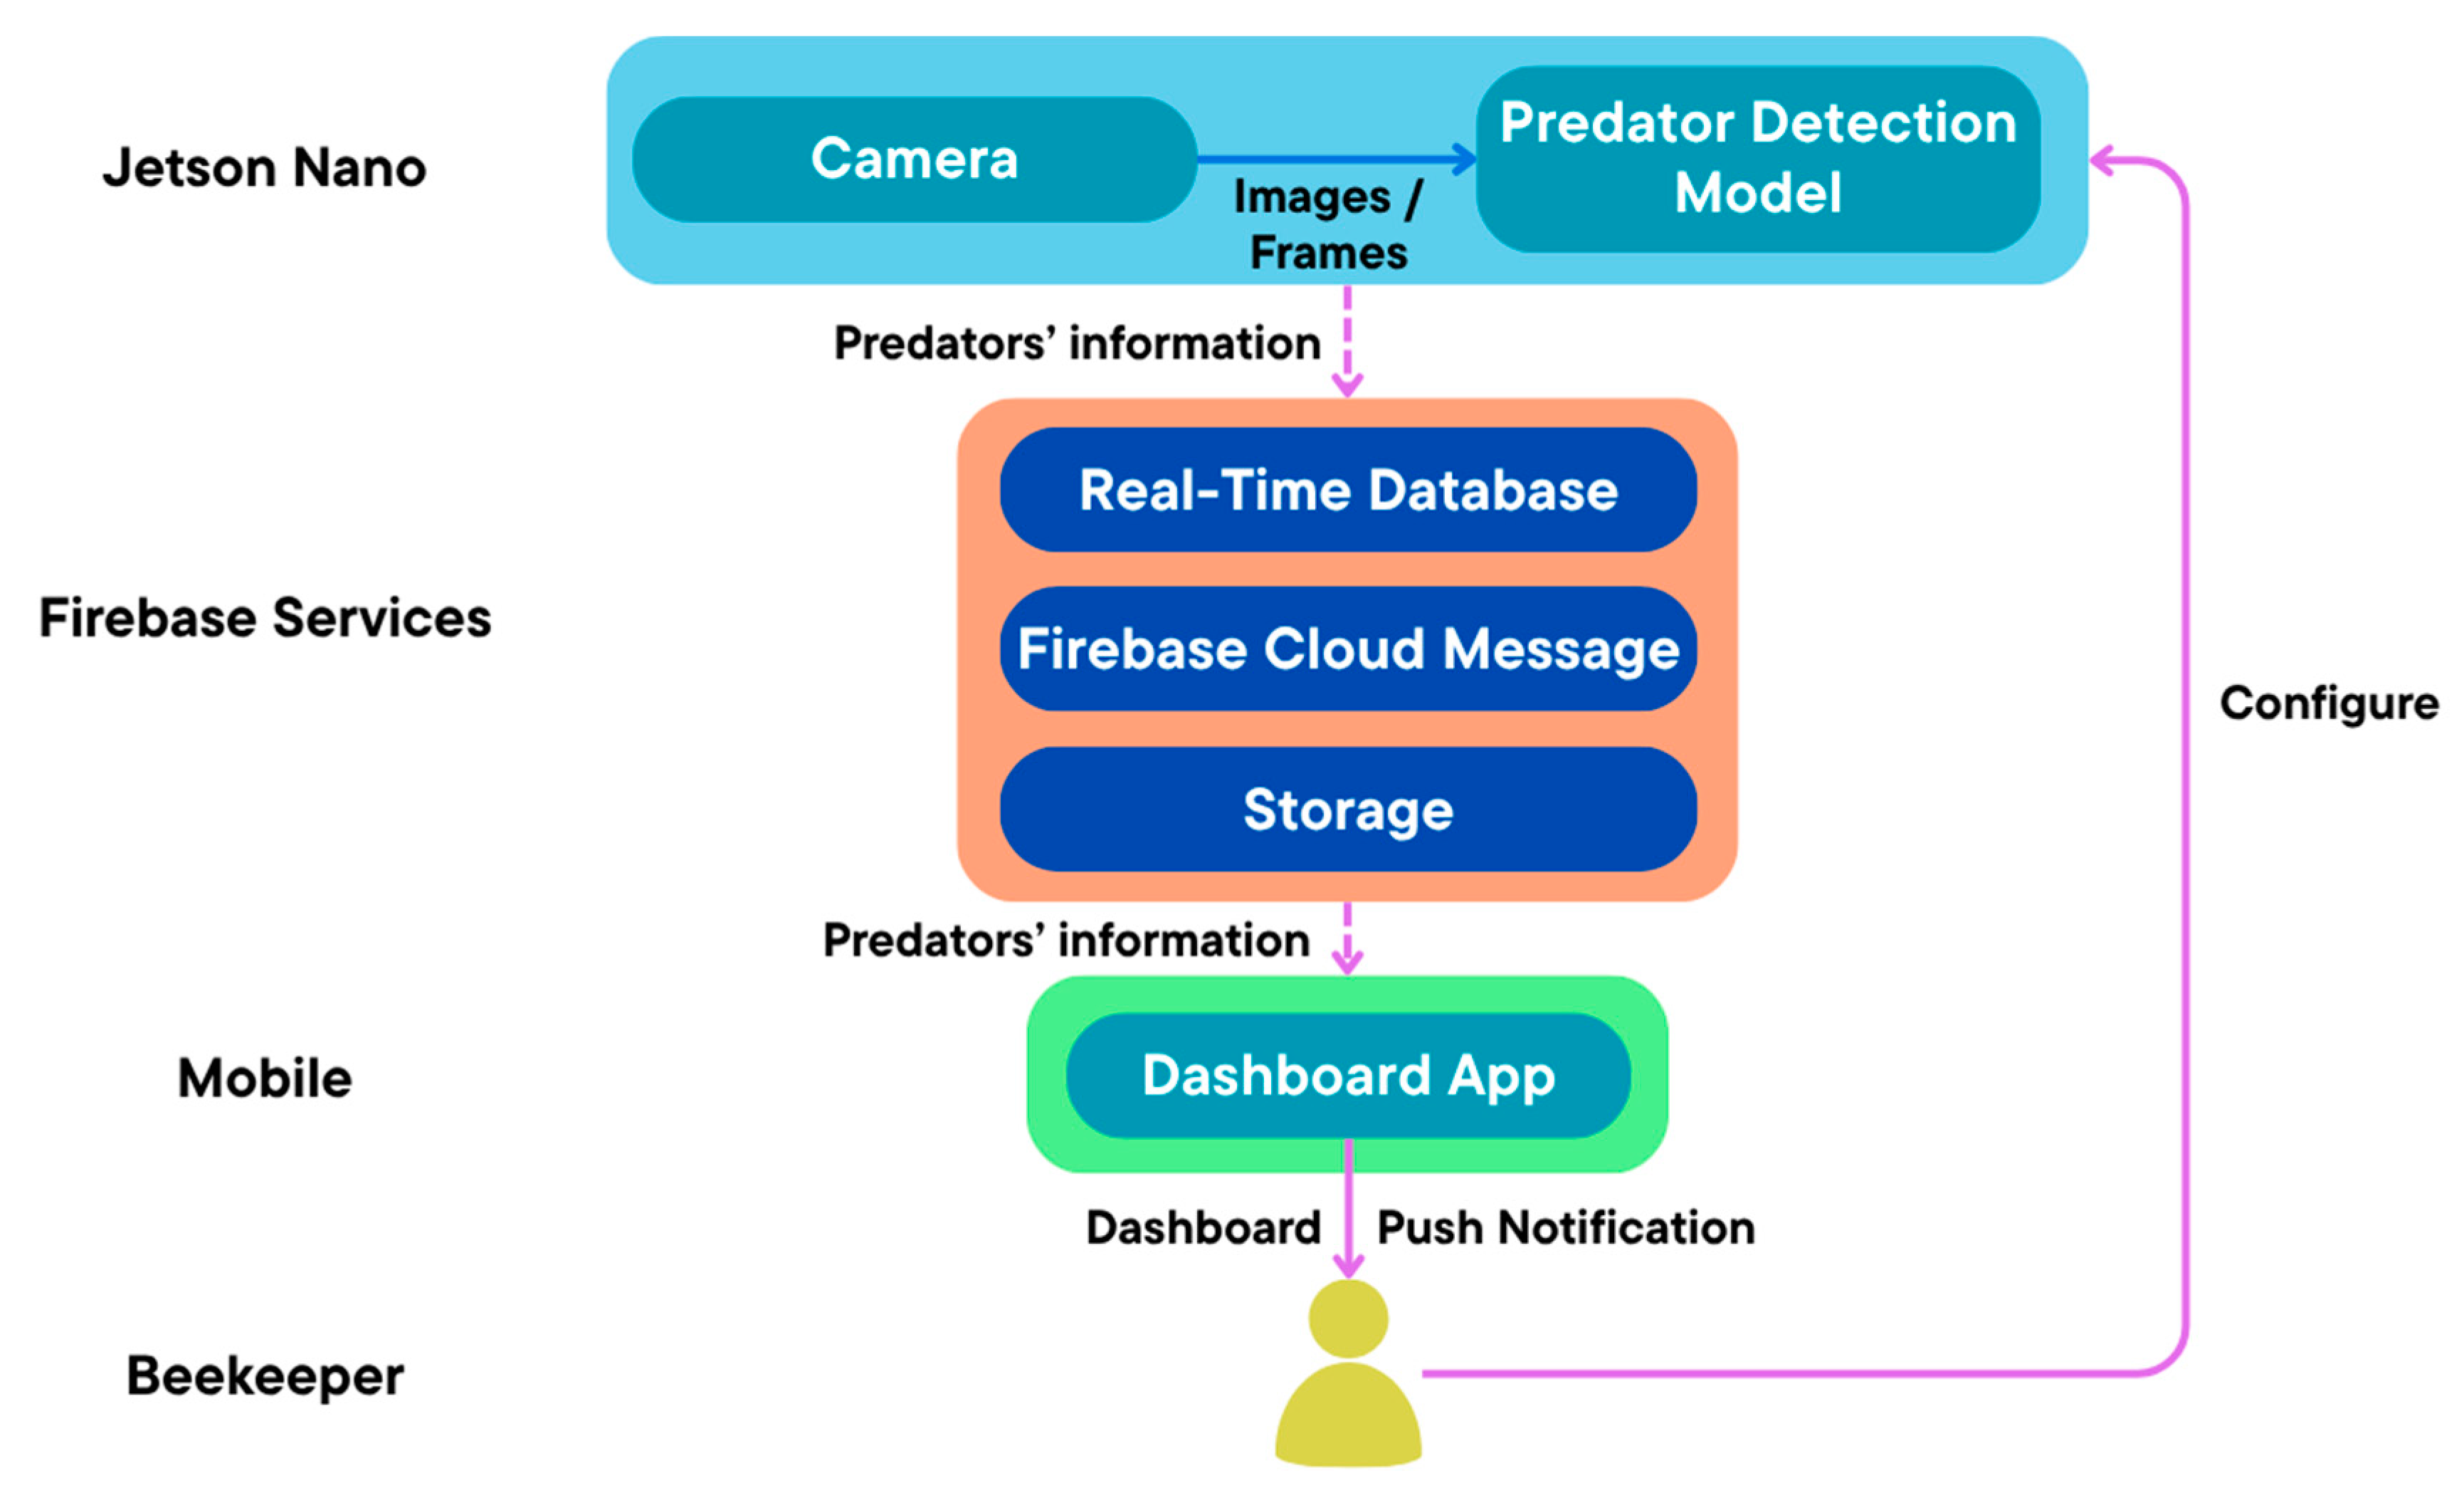
The proposed beehive monitoring system integrates edge computing and mobile technologies to provide real-time predator detection and alert capabilities for beekeepers, as illustrated in Figure 1. It employs the Jetson Orin Nano 8 GB module as its processing unit, as this choice offers superior memory and computational capability for real-time deployment of deep learning models, while also providing the scalability for future integration of additional models and sensors. A camera module is used for continuous monitoring of the beehive. Captured video frames from the camera module are processed locally on the Jetson, using a trained YOLOv11-based deep learning model capable of identifying the presence of predators in real time. In the case of predator detection, the system leverages Google Firebase services, particularly the Realtime Database for data storage, and pushes notifications to a dedicated mobile application, which serves as a comprehensive dashboard. This allows beekeepers to receive immediate alerts in the presence of predators around the hives and give access to detailed relevant information as necessary.
Figure 1.
Overview of the proposed beehive monitoring system.
2.2. Hardware Setup
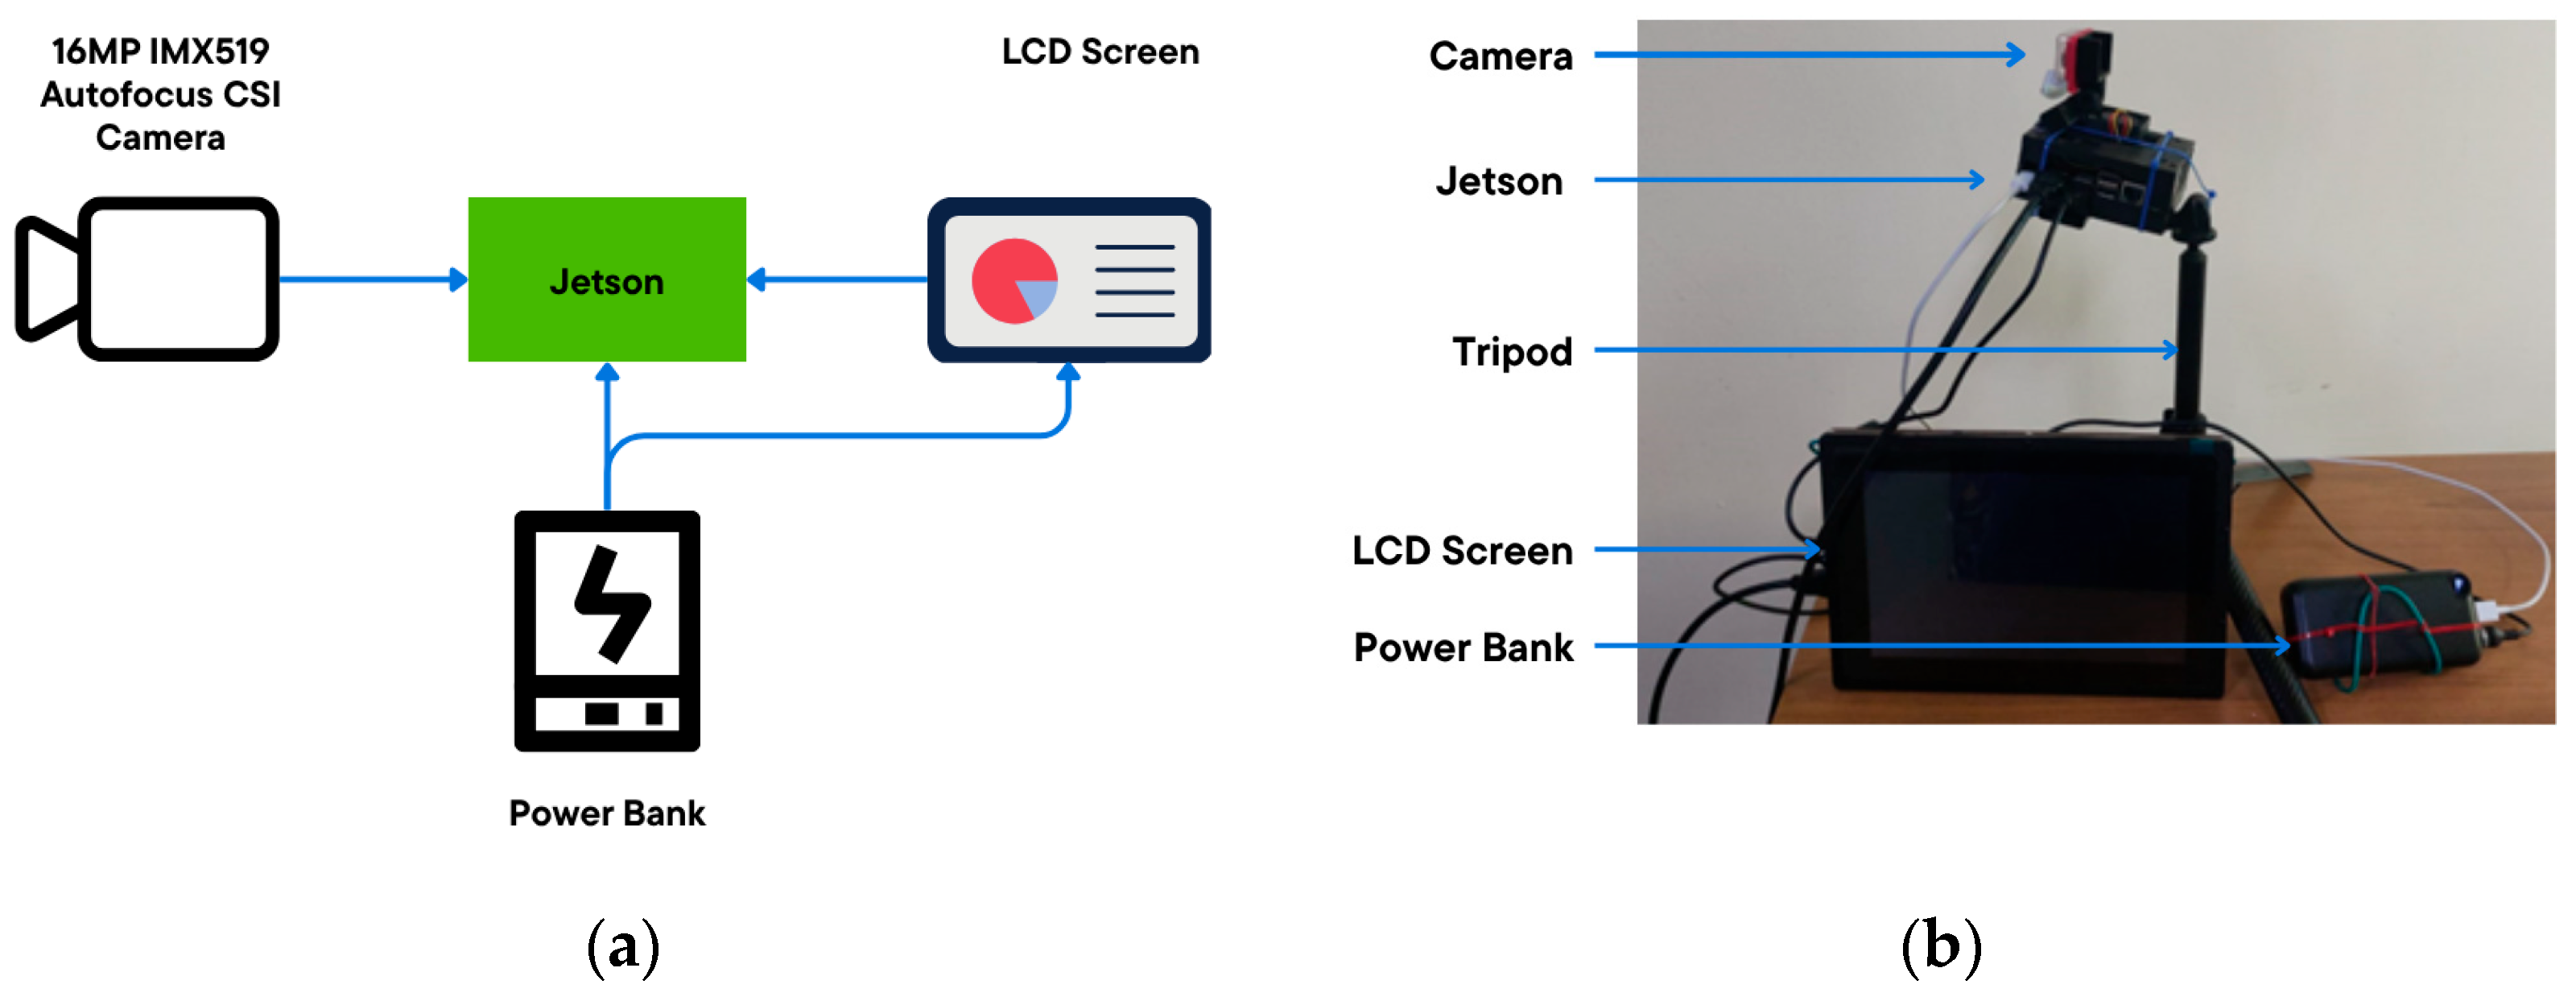
Figure 2a,b show the schematic diagram and actual hardware setup of the proposed beehive monitoring system, respectively. It comprises several key components, including the Jetson Orin Nano (NVIDIA, Santa Clara, CA, USA), the 16 MP IMX519 CSI autofocus camera module (Arducam, Nanjing, China), an optional 10.1″ touch LCD screen, and a power bank. The core processing unit utilizes a Jetson Orin Nano connected to the camera module, which captures high-resolution images of the beehive at 1280 × 1280 resolution. Images captured are processed locally on the Jetson. In the case of predator detection, network connectivity is established via an integrated Wi-Fi module to facilitate real-time data transmission to the mobile application dashboard. The optional LCD screen provides a user interface for local configuration of the system, allowing beekeepers or system integrators to conveniently set up and customize the system on-site according to their requirements. The system can be powered either directly from the mains or by a portable power bank solution, with the latter being the preferable option to ensure that the system can operate autonomously in remote apiary locations. To enhance practical deployment, the entire hardware assembly is mounted on a tripod stand.
Figure 2.
(a) Schematic diagram and (b) actual system setup of the proposed beehive monitoring System.
2.3. Data Collection
Data were collected from multiple sources to train the detection model, as summarized in Table 1. Labeled datasets were utilized for monkeys, spiders, ants and frogs ([37,38,39]), while additional images of endemic monkey species (Nasalis larvatus and Macaca fascicularis) were obtained from iNaturalist ([40,41,42] and manually labeled using the labelImg (v. 1.8.6) software. Collecting images from crowdsourced datasets such as iNaturalist, where data are uploaded by multiple contributors, helps create a diverse image dataset with variations in camera type, camera position, lighting, and background conditions. In addition, images of H. itama were collected from four hives at the Universiti Brunei Darussalam (UBD) premises. This resident species was included in the training set as a negative class to enable the model to distinguish between normal hive activity and actual threats, thereby reducing false-positive detections arising from non-predatory hive behavior. These images were acquired under natural lighting conditions across different days and from multiple camera angles, with the hive entrance and bees appearing at varying orientations. Furthermore, humans were included as a detection class to account for external human intervention (e.g., hive inspection or honey harvesting), which is relevant for monitoring hive access and practical system deployment. Consequently, this approach results in a dynamic and diverse dataset, which is beneficial for achieving better performance on unseen data.
Table 1.
Sources of the data used for training the model.
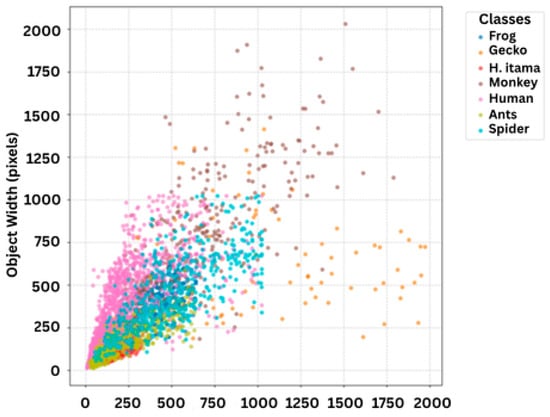
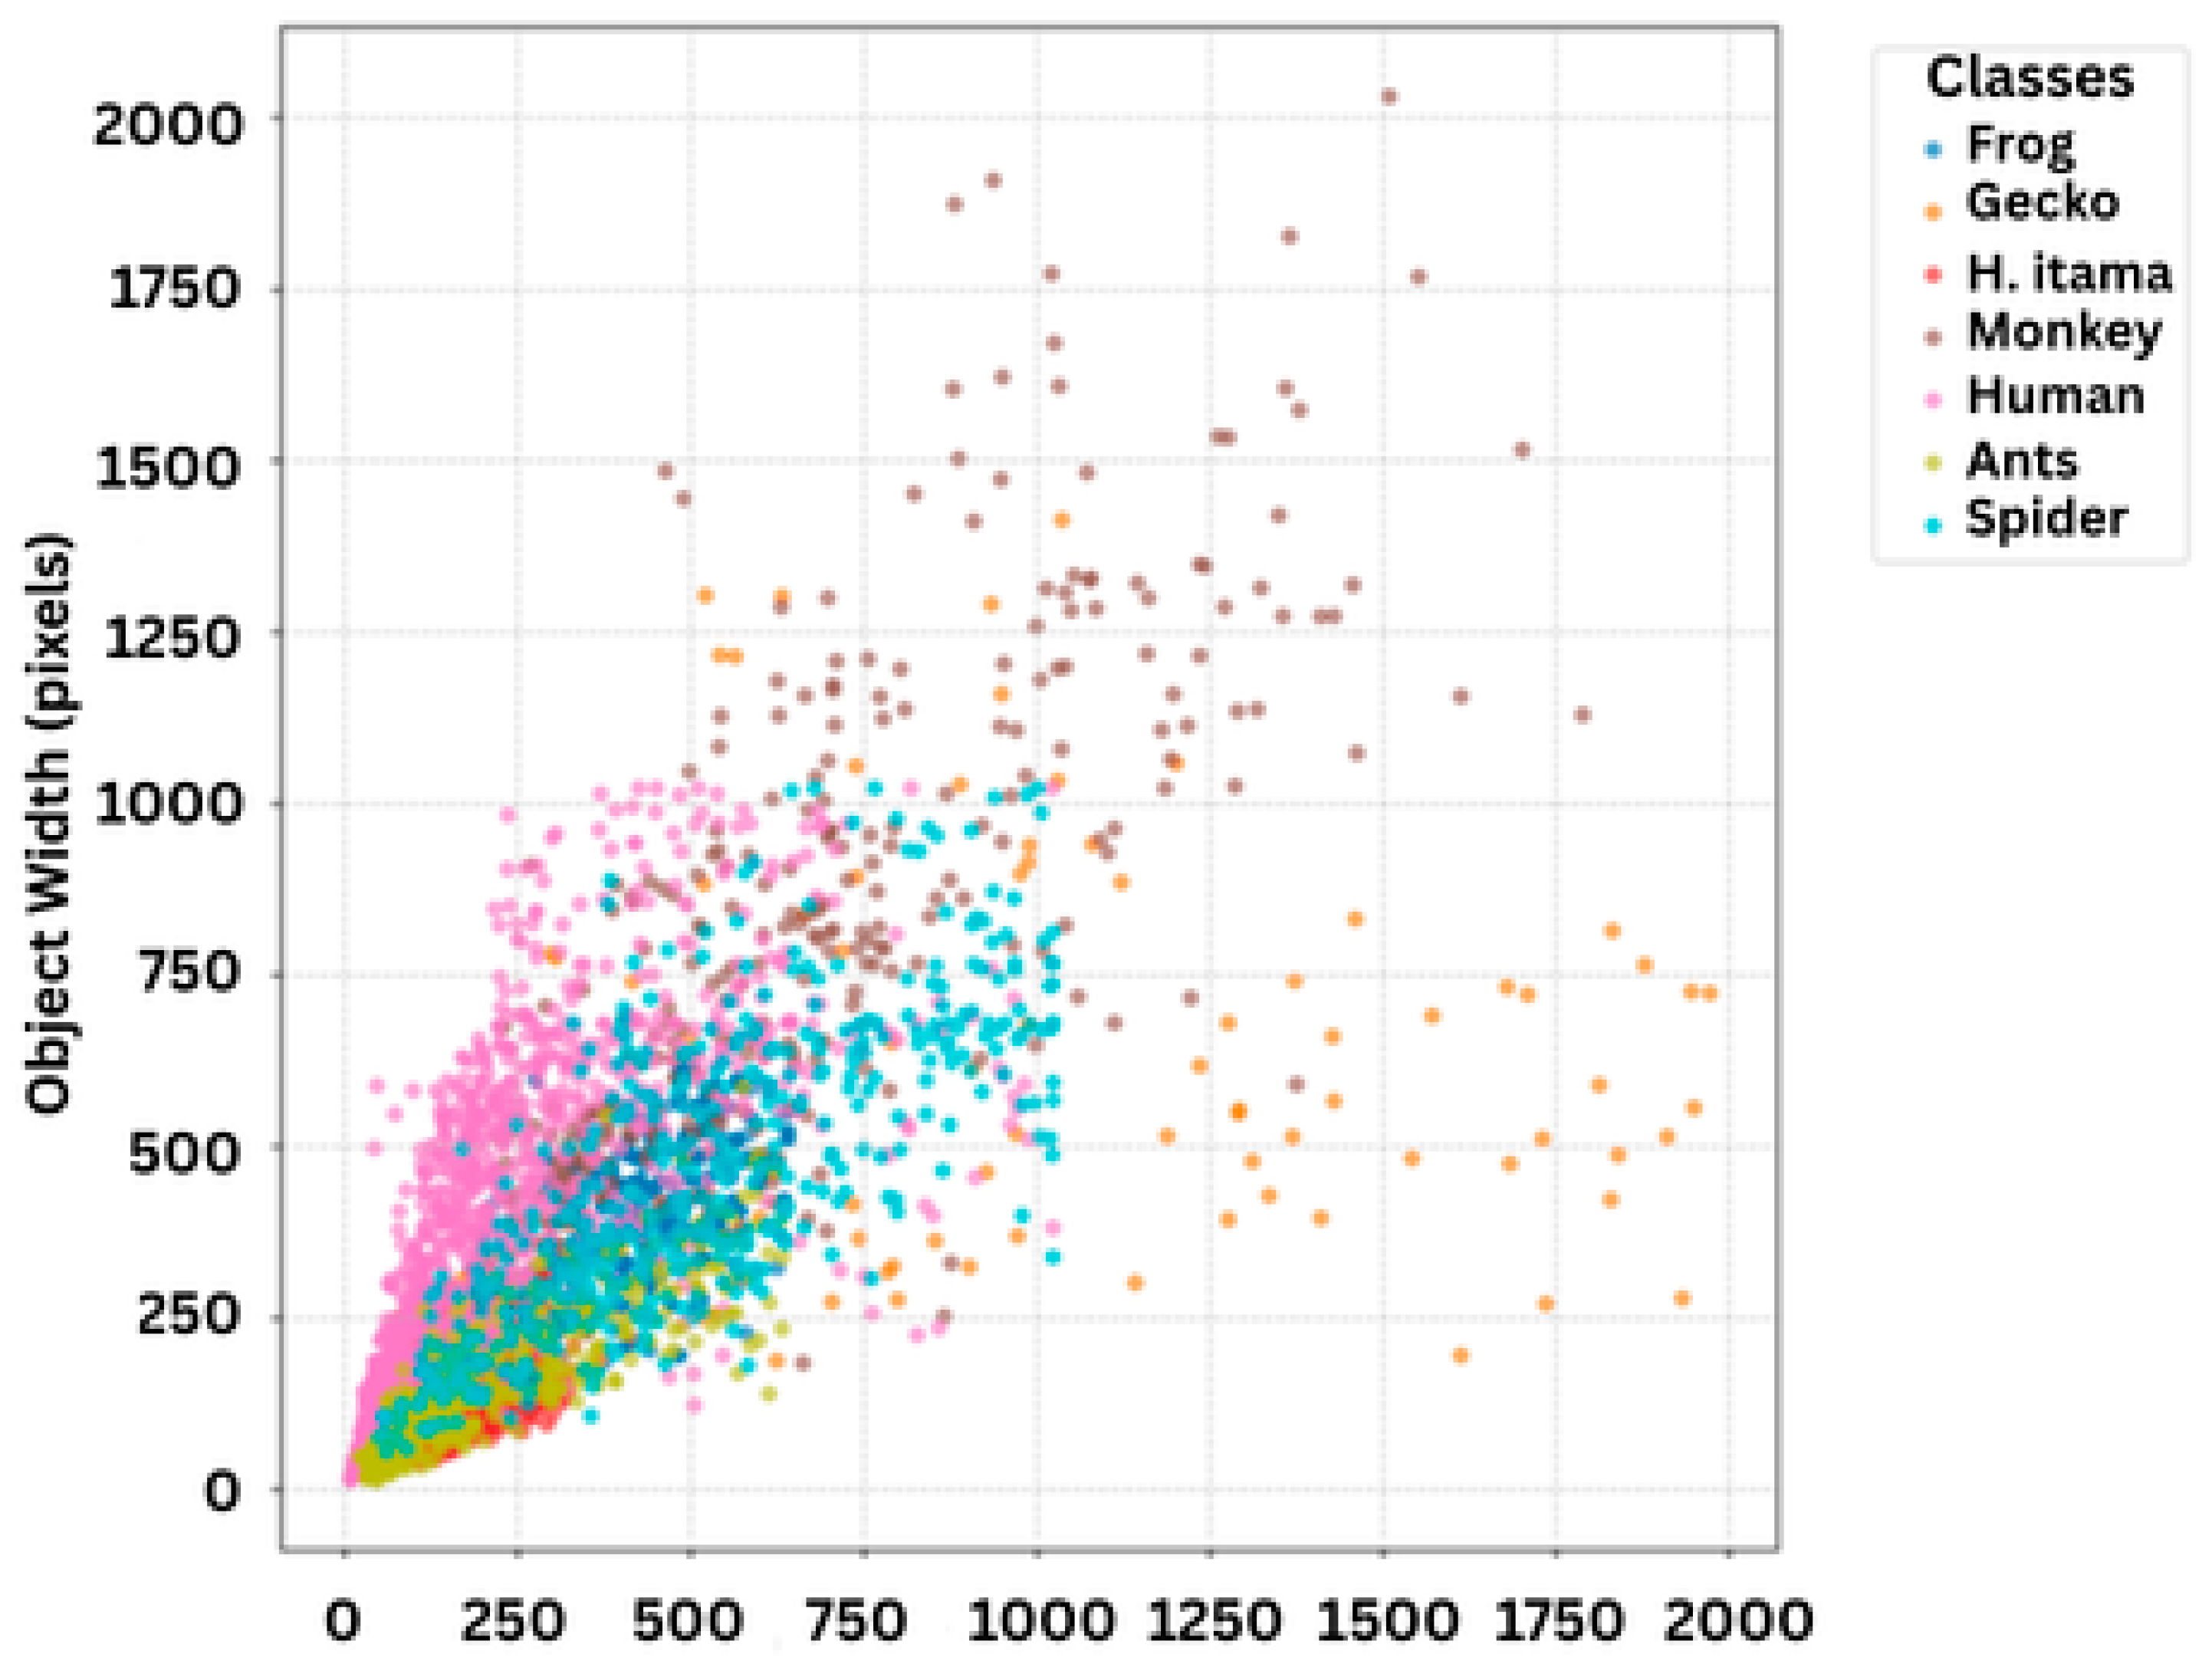
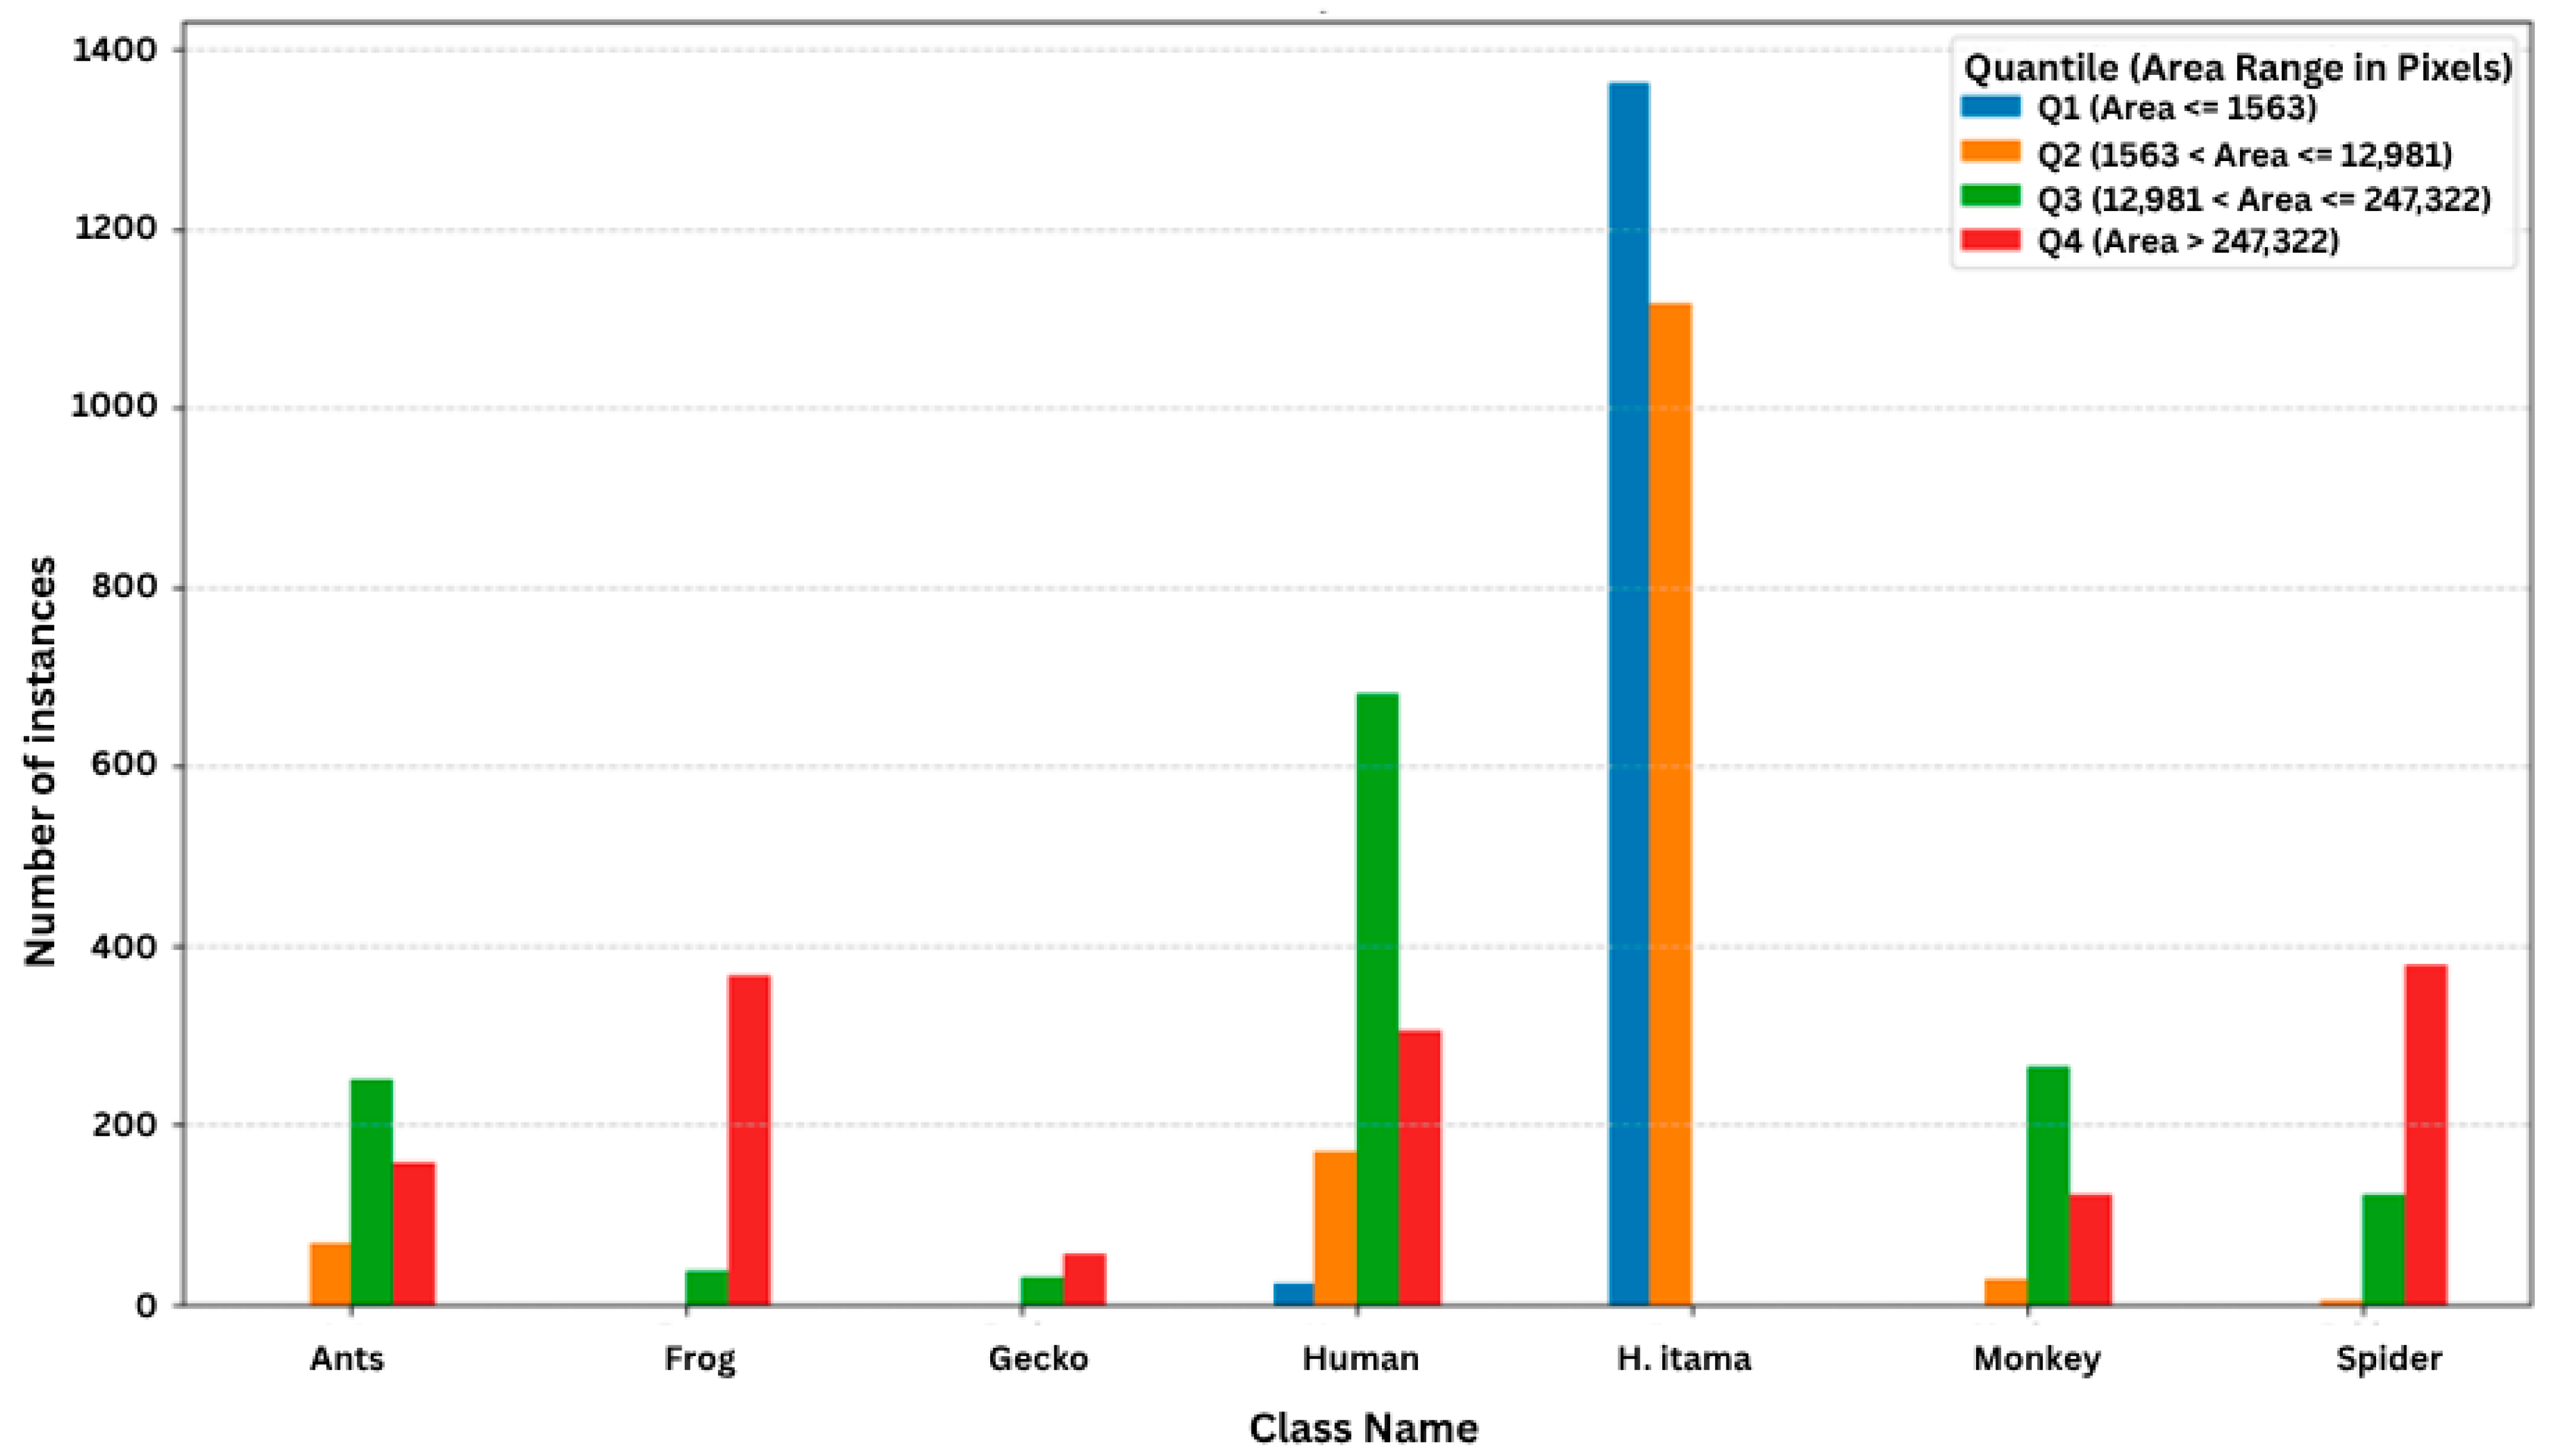
The collected dataset consists of diverse object sizes, with the size diversity depicted in Figure 3, emphasizing the need to consider multi-scale object detection in detecting predators of the H. itama.
Figure 3.
Object size appears in the image.
The initial image dataset underwent a process of random stratification to ensure a representative distribution across the resulting sub-datasets: training, validation, and test. A standard split ratio was applied, allocating 80% of the data to the training set and 10% each to the validation and test sets.
The training set is utilized to iteratively learn the model’s parameters (weights and biases). The validation set is employed to monitor performance during training and to systematically optimize the model’s hyperparameters (e.g., learning rate and number of layers) to prevent overfitting. The test set is kept entirely separate and is used only once, after all training and fine-tuning are complete, to provide an unbiased evaluation of the final model’s generalization capability.
Moreover, data augmentation techniques were applied to datasets to increase the dataset size, improve generalization, reduce overfitting and enhance overall model performance. The default YOLOv11 augmentation pipeline was used, incorporating both geometric transformations (e.g., translation and scaling), color space adjustments, and Mosaic Augmentation (combining multiple training images into a single composite image, thereby allowing the model to learn object detection across different scales and in different surrounding contexts). The specific training configuration, framework version (v8.3.66), and hyperparameter settings including the 1280-pixel input resolution and AdamW optimizer parameters are consolidated and reported in Table 2.
Table 2.
Configurations and hyperparameters.
The dataset was assembled from multiple heterogeneous sources, including publicly available repositories and manually collected field data, resulting in moderate class imbalance. Specifically, certain classes such as frog, human and H. itama have a larger number of samples compared to underrepresented classes such as gecko and ant, and to mitigate the impact of this imbalance, data augmentation techniques were applied to improve representation learning for minority classes.
The use of multiple heterogeneous data sources introduces variability in image quality, lighting conditions, background complexity, and viewing angles, which may lead to domain bias. While such diversity can improve the robustness of the model by exposing it to both controlled and real-world conditions, its potential impact on model performance should be acknowledged. Additionally, the inclusion of field-collected data also supports the relevance of the model to the intended deployment environment.
2.4. Deployed Models
To detect intruders around the hive, a YOLOv11 architecture was selected. There are multiple models in the YOLOv11 family designed to address different use cases and computational requirements, with the models ranging from nano (YOLOv11-nano) to extra-large (YOLOv11x), allowing deployment on a variety of devices from resource-constrained edge devices to powerful cloud servers. Each model variant balances speed, accuracy, and size differently to meet the needs of specific applications (segmentation, pose estimation, oriented object detection, and classification tasks). Since the trained model needs to be run on the edge devices, YOLOv11-nano and YOLOv11-small models were utilized in this paper as benchmark models, considering their requirement of the least processing power compared to the other models. The YOLOv11-nano model is the smallest in the YOLOv11 family, with about 2.6 million parameters, making it very lightweight and efficient, suitable for edge or resource-constrained devices. YOLOv11-small, being the next step up, contains more parameters than YOLO11n to achieve better accuracy but still remains optimized for efficient computation [45,46]. Although YOLOv11-nano and YOLOv11-small share the same fundamental architecture design, their difference in the number of parameters arises from variations in model scale configurations such as the number of channels and layers. Both models use the same architecture blocks as the C3k2 and C2PSA, but with YOLOv11-small employing more channels and potentially more repeated blocks, increasing its capacity and parameter count to improve accuracy. YOLOv11-nano is optimized for minimal size and speed, using fewer channels and layers to keep the model lightweight, which reduces parameters significantly compared to YOLOv11-small [45,47,48].
Since the size of potential predators varies significantly, multi-scale object detection is a necessity. This study proposes enhancing the initial feature extraction by combining both convolutional and attention-based representations from the image to allow the model to capture both local and global features effectively.
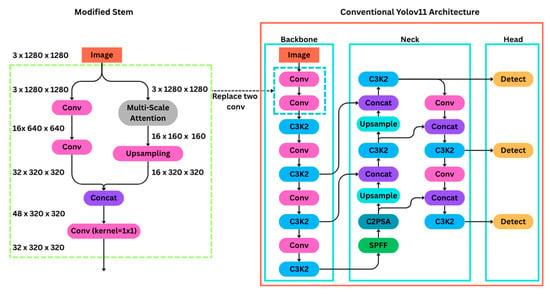
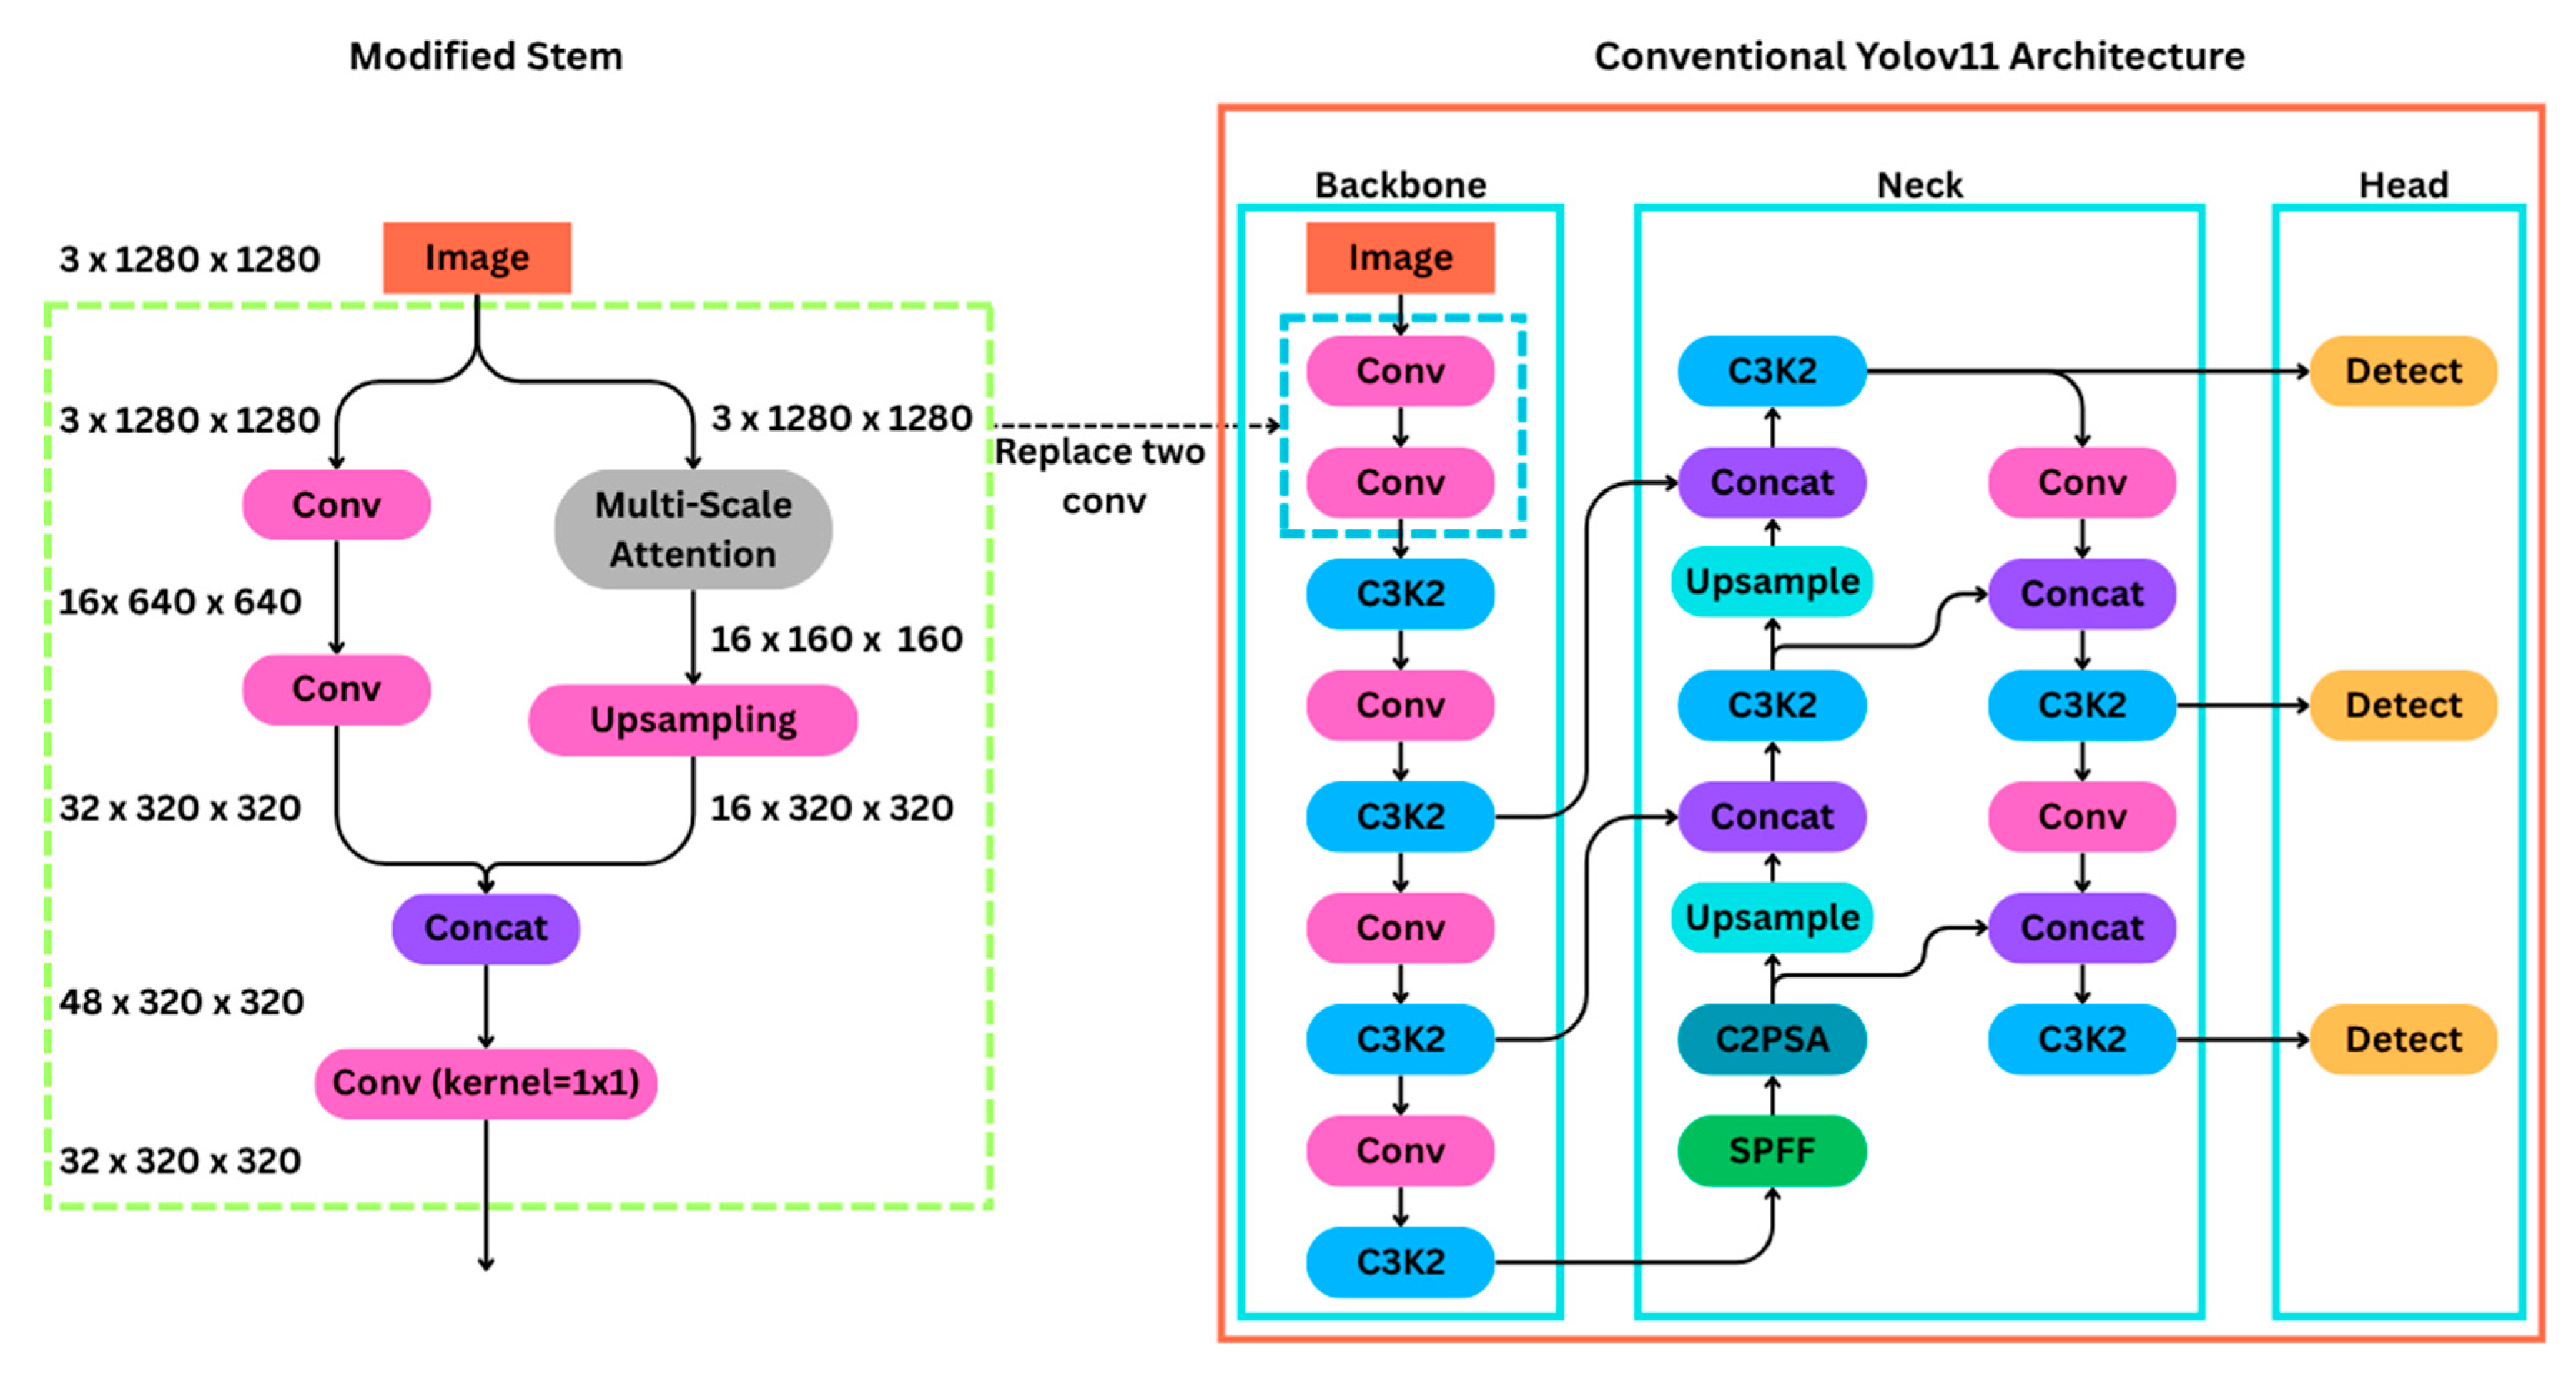
The YOLOv11-nano architecture was modified as illustrated in Figure 4, referred to henceforth as the multi-scale YOLOv11 model (MSYOLO11). Specifically, the two Conv blocks inside the blue dotted box are replaced with a new structure shown in the green dotted box. In this design, the original Conv block is retained, and their output is concatenated with the output from a proposed Multi-Scale Attention (MSA) layer along the channel dimension. This combined representation is then passed through a Conv block that reduces dimensionality and filters redundant information. The Conv block consists of a 2D convolution layer, a batch normalization layer, and an SiLU activation function. The processed output is then passed to the original C3K2 block in YOLOv11-nano, allowing the rest of the architecture to operate as usual.
Figure 4.
Architecture of the proposed MSYOLO11 model.
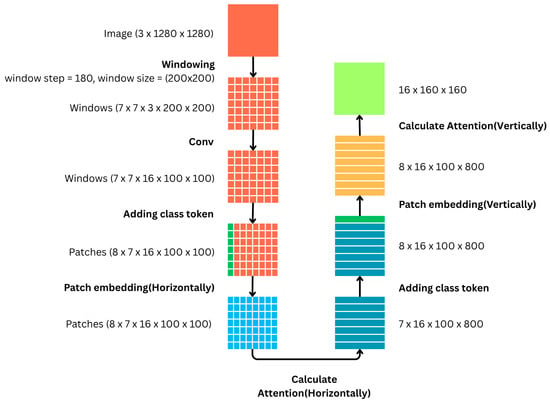
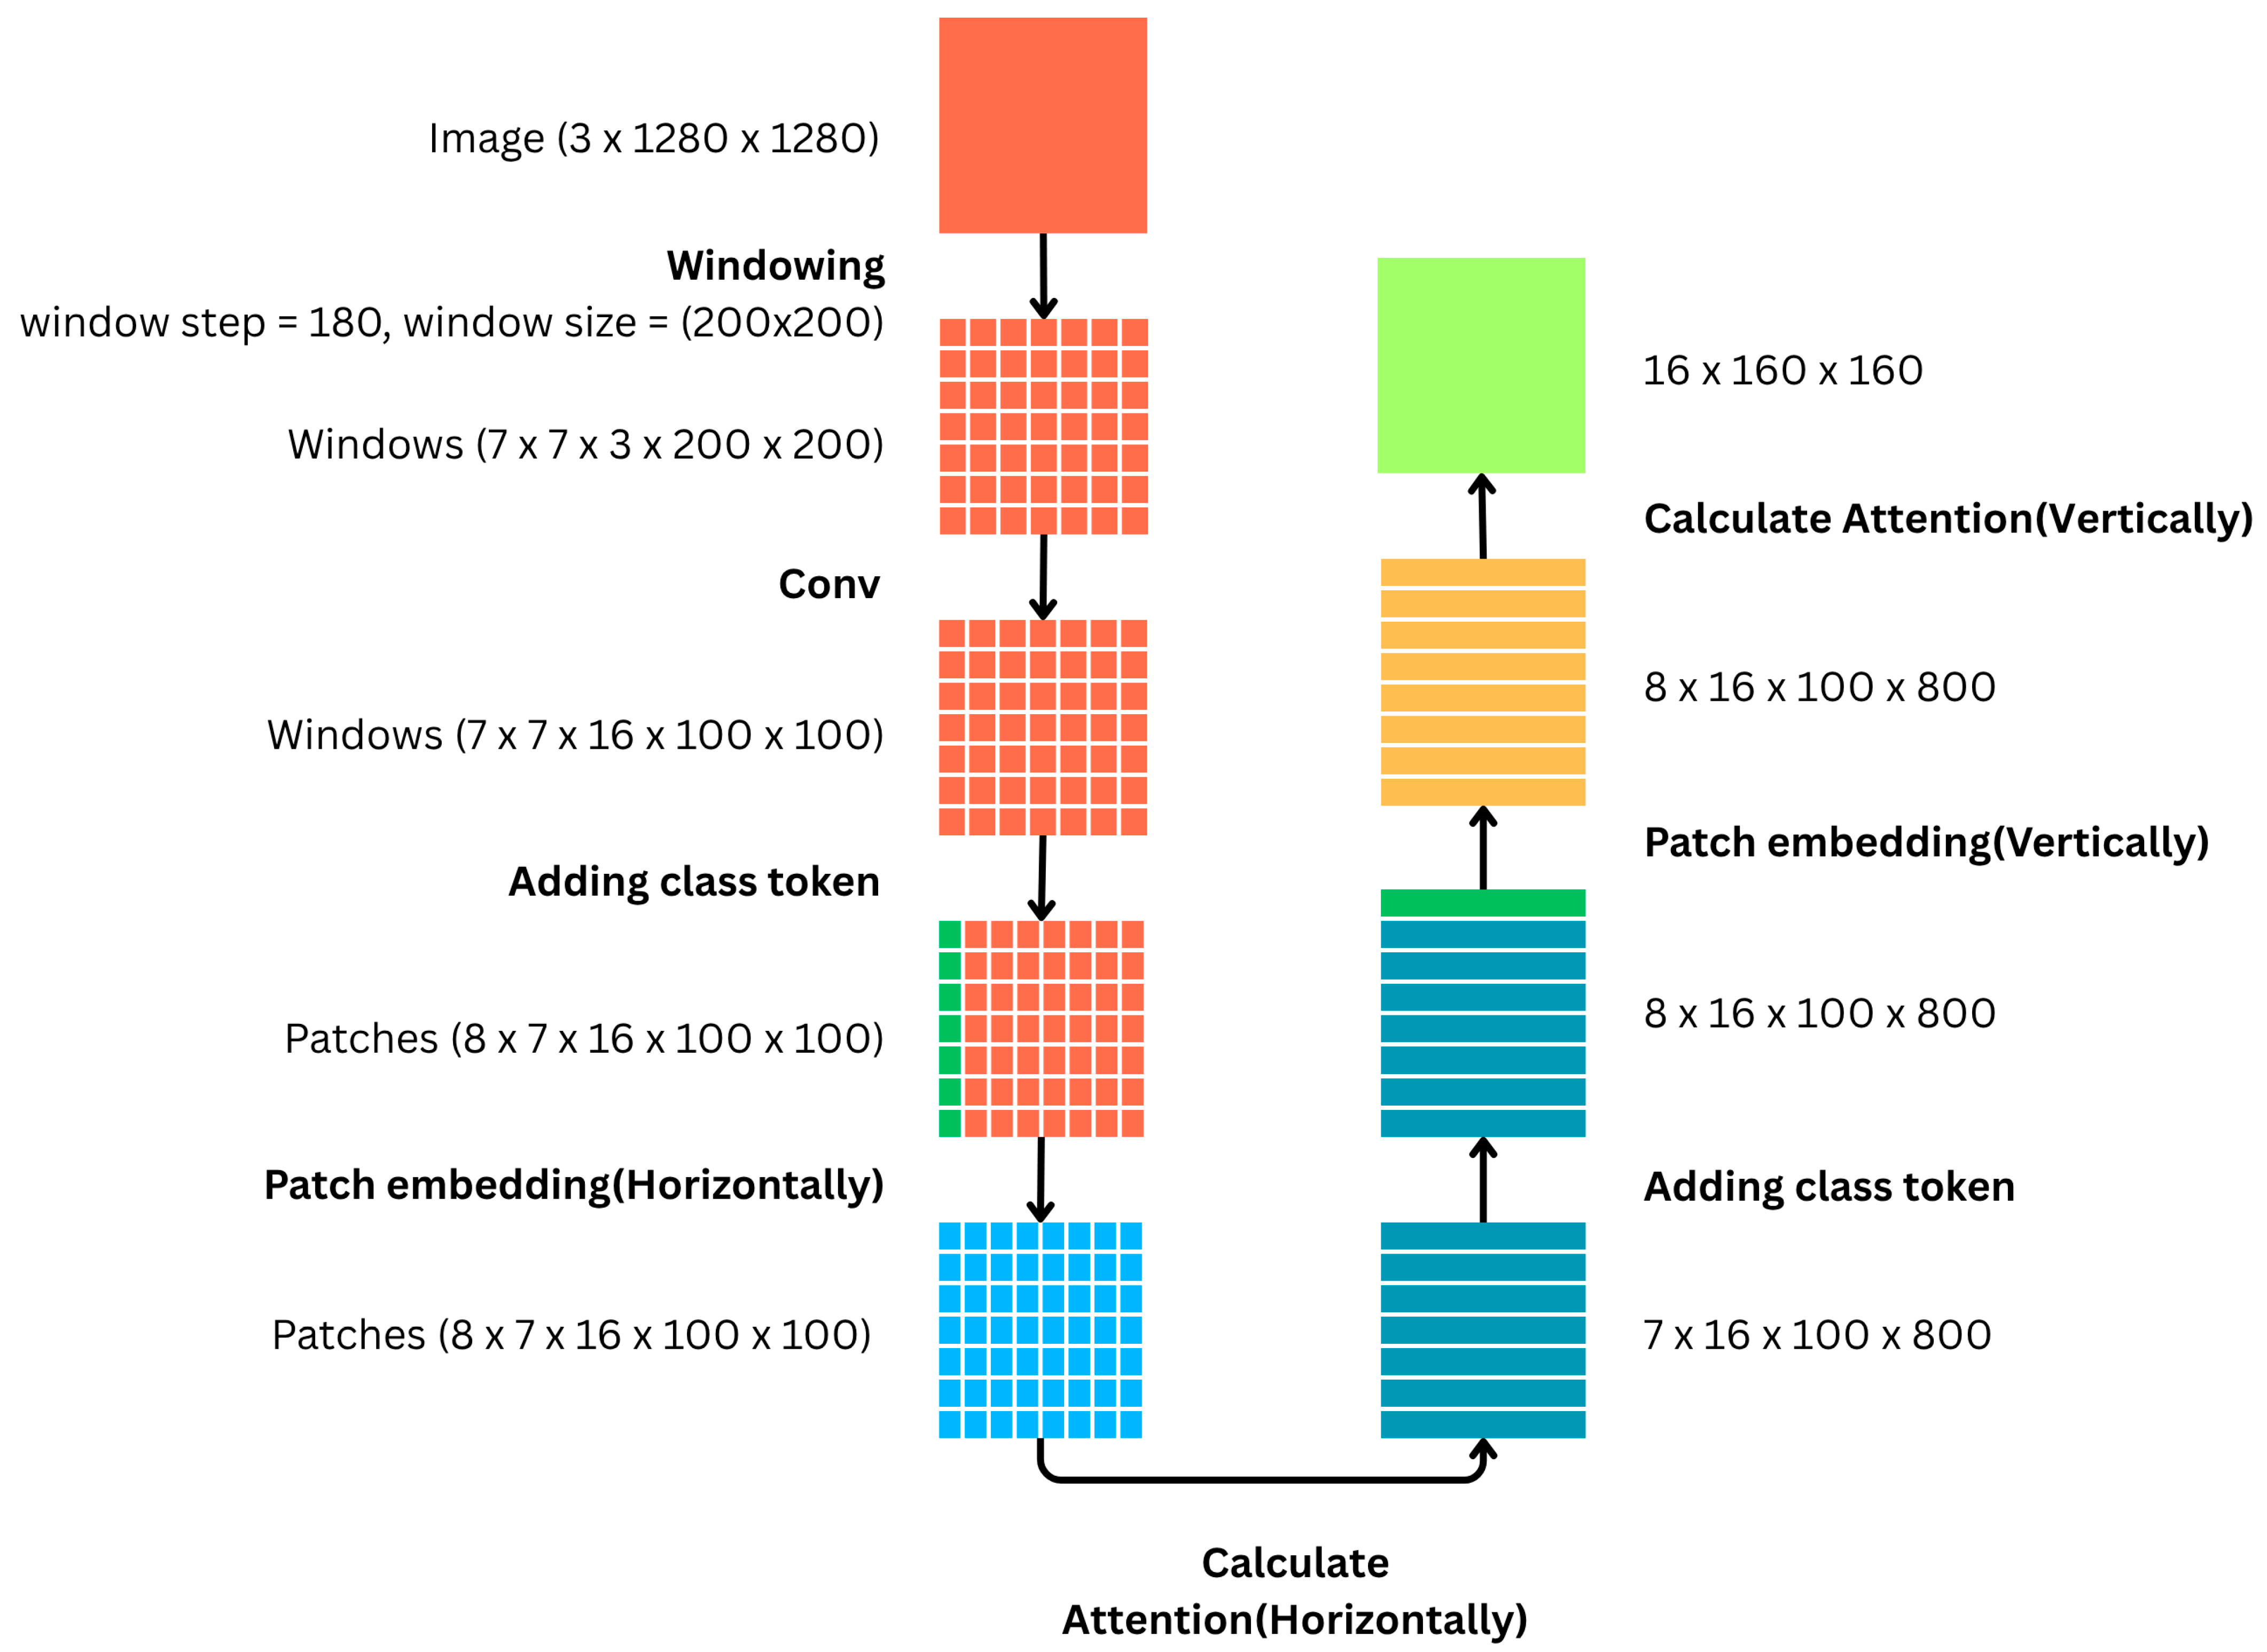
The proposed MSA layer (Figure 5) is designed to extract spatial features from image patches using convolution-enhanced attention. It is inspired by the self-attention mechanism in Transformers but is adapted to preserve spatial locality via convolutional operations. The design of the MSA module was carefully developed to address the challenges of detecting both small and large predators in a dynamically changing hive environment. Instead of conventional self-attention mechanisms, which incur high computational complexity, a bidirectional (horizontal and vertical) attention scheme was adopted to reduce computational cost while preserving the ability to capture long-range spatial dependencies. This design is particularly suited for edge deployment, where computational resources are limited, while still enabling the modeling of directional motion patterns commonly observed in aerial predators. To further enhance feature representation, overlapping windows were introduced to mitigate boundary information loss in patch-based processing, thereby preserving fine-grained morphological features that may occupy only a few pixels. In addition, class tokens were incorporated to provide a lightweight global context representation, improving stability in multi-scale detection within the YOLOv11 backbone [29,49,50].
Figure 5.
Architecture of Multi-Scale Attention module.
Initially, the image undergoes an overlapping windowing operation to divide it into spatial patches. Conv blocks are applied to each patch to extract initial features. These feature maps are then grouped as horizontal sequences, and a learnable class token is prepended to each row as presented in Equation (1) and produces .
where
- N: The number of horizontal patches;
- : The jth patch in the ith row;
- : The height of the patch;
- W: The width of the patch;
- C: The number of channels;
- : The class token of the ith row and consists of learnable parameters.
Positional embeddings are added to encode spatial information by adding learnable embedding for each patch in each row (calculation of positional embedding of the jth patch in the ith row as Equation (2)). These embeddings ensure that the attention mechanism is aware of each patch’s position within the row.
To compute attention, the updated tensor is passed through a convolutional layer that outputs three times the number of channels, which are then split equally into Query (Q), Key (K), and Value (V) tensors:
where H′ and W′ are reduced spatial dimensions due to convolution stride. The attention output is computed using scaled dot-product attention (A):
The model was initially trained on the COCO dataset [51] for general object detection and then fine-tuned on a custom dataset tailored for detecting intruders around beehives.
2.5. System Integration
The models were trained on a computer, with the trained models saved as a PyTorch (v 3.12.0) model and copied to the Jetson Orin Nano. Cuda-enabled OpenCV was also installed to Jetson Orin for better performance. Images captured from the camera were processed locally on the Jetson device and passed to the trained models for object detection.
Timely notification of predator presence is essential to protect hives from the predators. Push notifications are delivered to beekeepers through Firebase Cloud Messaging. When an alert is received, the beekeepers can tap on the notification to access the mobile application, which shows the image of the current environment with the identified predators and their locations. Beekeepers can configure which predators should trigger push notifications based on their potential impact. On the other hand, all detection results are stored in the Firebase Realtime Database, which synchronizes data in real time across all connected applications. The mobile application then serves as a dashboard, allowing beekeepers to review up-to-date information on the latest predator detection and monitor activities around their hives.
2.6. Performance Evaluation
This study uses YOLOv11-nano and YOLOv11-small models as benchmarks to compare the improvements obtained from the proposed MSYOLO11 model. To evaluate the performance of the models, mean Average Precision (mAP), Precision (P), Recall (R), and F1 score (F1) were utilized. Precision measures the proportion of correctly predicted positive detections out of all positive predictions made by the model, reflecting how accurate the model is when it predicts the presence of an object. On the other hand, Recall measures the proportion of actual positive cases (true positives) that were correctly identified by a model out of all actual positive cases in the dataset. Given a total of L = 7 classes (Labels) or intruders considered in this research, Precision and Recall of class i = {1, 2,…, 7} can be determined.
where true positives () and true negatives () of class i are the number of RoIs correctly predicted as belonging to class i and correctly predicted as not belonging to class i, respectively, i.e., predictions matching the ground truth. Contrariwise, false positives () and false negatives () of class i are the number of RoIs incorrectly predicted as belonging to and not belonging to the particular class i, respectively.
F1 score is the harmonic mean of Precision and Recall, providing a balance between the two. It is useful when seeking a trade-off between Precision and Recall.
mAP is the standard metric for evaluating object detection models like YOLO. It is the mean of the Average Precision () scores for all object classes. is computed as the area under the Precision–Recall curve for a given class i.
The computation of Average Precision (AP) uses the overlap of predicted bounding boxes with ground truth boxes, the Intersection over Union (IoU). The most widespread measure mAP @ 0.5 computes the mean Average Precision at a single IoU threshold of 0.5, i.e., a detection that has an IoU greater than or equal to 0.5 is correct.
To consider it more strictly, mAP:0.5:0.95 is utilized in this paper, with AP calculated at various IoU values in the range of 0.5 to 0.95 in steps of 0.05 (0.50, 0.55, and so on to 0.95). The outcome of all thresholds is averaged to give a measure that is more representative of detection accuracy as well as accurate localization. Hence, mAP 0.5 (more lax, optimistic) and mAP 0.5:0.95 (less liberal, stronger) are used as evaluation measures.
3. Results and Discussion
3.1. Performance Analysis of the Proposed MSYOLO11 Model
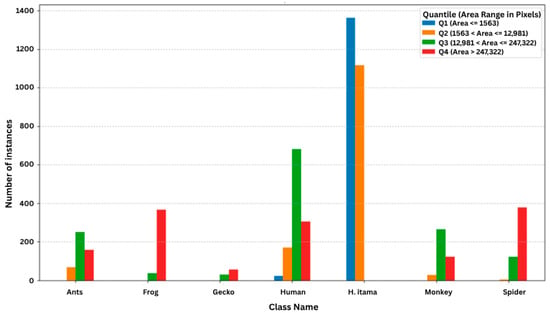
The dataset was first pre-processed, with all images resized to a uniform 1280 × 1280 pixels. An analysis of the object bounding-box dimensions was then made to understand the distribution of object instance sizes across various classes within the dataset, with results shown in Figure 6. The H. itama class (stingless bee species under observation) has the highest representation in the dataset and is notably skewed towards the smaller size quartiles (Q1 and Q2), indicating a prevalence of smaller-object instances of H. itama within the dataset. In contrast, frog and spider are skewed towards the largest quartile (Q4), indicating that these objects occupy a larger portion of their respective images. Overall, the figure highlights the significant variations in object size representation across the classes, with classes with the least total instances, including ants, gecko, and monkey, having a less pronounced size bias compared to classes with larger instance counts. Notably, the human class has very wide size variations, albeit a majority of them being on the larger quartiles. The significant variation in object size across the various classes represents a potential challenge for object detection models, as performance may degrade considerably for objects that fall outside the typical training size range. An object detection model trained on a dataset primarily consisting of large-object instances may underperform when used to detect smaller-object instances, and vice versa. This highlights the need for a multi-scale object detection model.
Figure 6.
Number of instances per class in each rectangular object area quartile.
To improve environmental generalization, the proposed MSYOLO11 model was first pre-trained on the COCO dataset to capture general object features across diverse scenarios and subsequently fine-tuned on the task-specific dataset. This is further enhanced by the MSA module, which uses axial attention to capture both local morphological features and broader contextual patterns. Although the model is optimized for the selected species, the architectural construction and pre-training strategy may support generalization to other bee species and similar apiary environments through transfer learning. Naturally, as the current model was trained on a limited set of species and environmental conditions, its performance may vary when applied to significantly different biological or environmental contexts. Therefore, further validation across diverse species, geographic locations, and apiary conditions is required to fully assess its generalizability.
The pre-processed dataset was then used to train and test the three (3) models: the proposed MSYOLO11 model and the two benchmarks, YOLOv11-small and YOLOv11-nano. Table 3 shows the performance of the three models, together with computational cost for their deployment. In the current context of surveillance of H. itama hives on a resource-constrained edge device, Recall is the more critical performance metric [15,16,17,52,53,54]. Missing a predator event poses a greater risk than generating occasional false positives, as the setup allows human operators to re-examine flagged events via the mobile application. Thus, a high-Recall model is crucial to minimize the likelihood of undetected intrusions.
Table 3.
Performance of the models on the dataset, together with their computational complexity.
Despite having significantly more parameters (9.4 million) and higher GFLOPs (21.5) than the other models, the YOLOv11-small model surprisingly exhibited the lowest Recall of 0.816. While its F1 score (0.848) and mAP50-95 (0.603) are marginally higher than those of the other two models, these small performance gains do not justify the considerable increase in computational complexity (more than 2.35× and 3.4× in terms of number of parameters and flops against the proposed MSYOLO11 model, respectively), especially for deployment on resource-constrained edge devices. The proposed MSYOLO11 model achieves the highest Recall of 0.853, with a comparatively lower parameter count (4.0 million) and FLOPs (6.3 GFLOPs) and with Precision, F1 score, mAP50 and mAP50-95 values of 0.868, 0.845, 0.896 and 0.556, respectively. On the other hand, the lightest YOLOv11 variant achieves Precision, Recall, F1 score, mAP50 and mAP50-95 values of 0.842, 0.830, 0.847, 0.898 and 0.573, respectively, requiring only 2.5 million parameters with similar FLOPs (6.3 GFLOPs) as the proposed MSYOLO11 model. The balance of high Recall and low resource requirement of the proposed MSYOLO11 model makes it suitable for the current system setup on the resource-constrained Jetson Orin Nano edge device.
Table 4 compares the performance of the proposed MSYOLO11 model against the lightest YOLOv11 variant, the YOLOv11-nano, across all classes. The MSYOLO11 model achieves higher Recall for most classes (H. itama, monkey, human, ant, and spider), even though its Precision and mAP values are slightly lower. The introduction of the MSA enhances sensitivity to object presence (increasing Recall), with acceptable slight reductions in Precision, as the hive surveillance context allows for human verification.
Table 4.
Class-level performance of MSYOLO11 over YOLOv11-nano.
Although MSYOLO11 achieves higher Recall, marginal reductions in Precision (0.868 to 0.842) and mAP50-95 (0.573 to 0.556) are observed. This phenomenon can be attributed to the nature of the MSA module, which puts greater emphasis on global contextual cues and object presence, as opposed to pixel-perfect boundary regression, by modeling long-range dependencies and operating with overlapping windows. In the context of small, fast-moving predators such as H. itama, the attention mechanism captures the essential features of the target within complex foliage. This results in increased detection sensitivity (Recall). Nevertheless, the inherent spatial smoothing effect of attention weights can lead to slight degradation in bounding-box localization accuracy at high IoU thresholds, which is reflected in the mAP@50-95 metric.
This represents a deliberate trade-off. In stingless bee surveillance, the cost of a false negative (a missed predator) is significantly higher than that of a false positive or minor localization inaccuracy; thus, higher Recall ensures that potential threats are reliably detected, whilst the slight reduction in localization Precision does not hinder the primary objective of predator detection and timely intervention [55].
Additionally, the dataset is imbalanced; however, the model performance indicates the ability to maintain competitive results for classes with fewer samples. As an example, the gecko class, which has the smallest number of instances, achieved a high Precision of 0.926 and an mAP@50 of 0.913; this suggests that the feature extraction capability of the MSA module is effective in mitigating the typical performance degradation associated with limited training samples. Although these findings indicate a degree of robustness to class imbalance, further validation through statistical analysis will be necessary to more rigorously assess the impact of class distribution on model reliability.
Table 5 further examines the impact of object size on Recall by presenting the average size of each class with Recall improvement of the proposed MSYOLO11 model over the YOLOv11-nano model. MSYOLO11 provides the strongest improvements for small-object categories. The stingless bee species H. itama, which has the smallest average bounding-box size in the dataset, shows the third-highest Recall improvement of 0.026. Similarly, human and ant, which have the second- and fourth-smallest-object average bounding-box size, show the largest gains at 0.083 and 0.096, respectively. These indicate that the attention mechanism introduced in the proposed MSYOLO11 is able to capture fine-grained features more effectively than YOLOv11-nano, features which are typically suppressed in deeper convolutional layers. The only two classes of objects (frog and gecko) that show reductions in Recall both have large average object sizes. This suggests that whilst MSYOLO11, through its additional attention-based mechanism, is able to significantly improve the detection of small-object categories, this advantage does not necessarily extend to large-object categories, where convolution-based detection models such as the YOLOv11-nano model already perform strongly due to their easier visibility and larger spatial footprint.
Table 5.
Class-level performance improvement of MSYOLO11 over YOLOv11-nano.
Table 6 shows the memory consumption and inference time for one image on the NVIDIA T4 GPU in Google Collab. Although MSYOLO11 underperforms in terms of memory and inference time, it is still capable of running at sufficient speed in the Jetson device.
Table 6.
Performance of MSYOLO11 over YOLOv11-nano on NVIDOA T4 GPU with 16 GB VRAM.
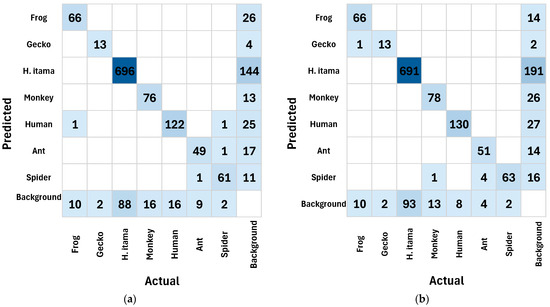
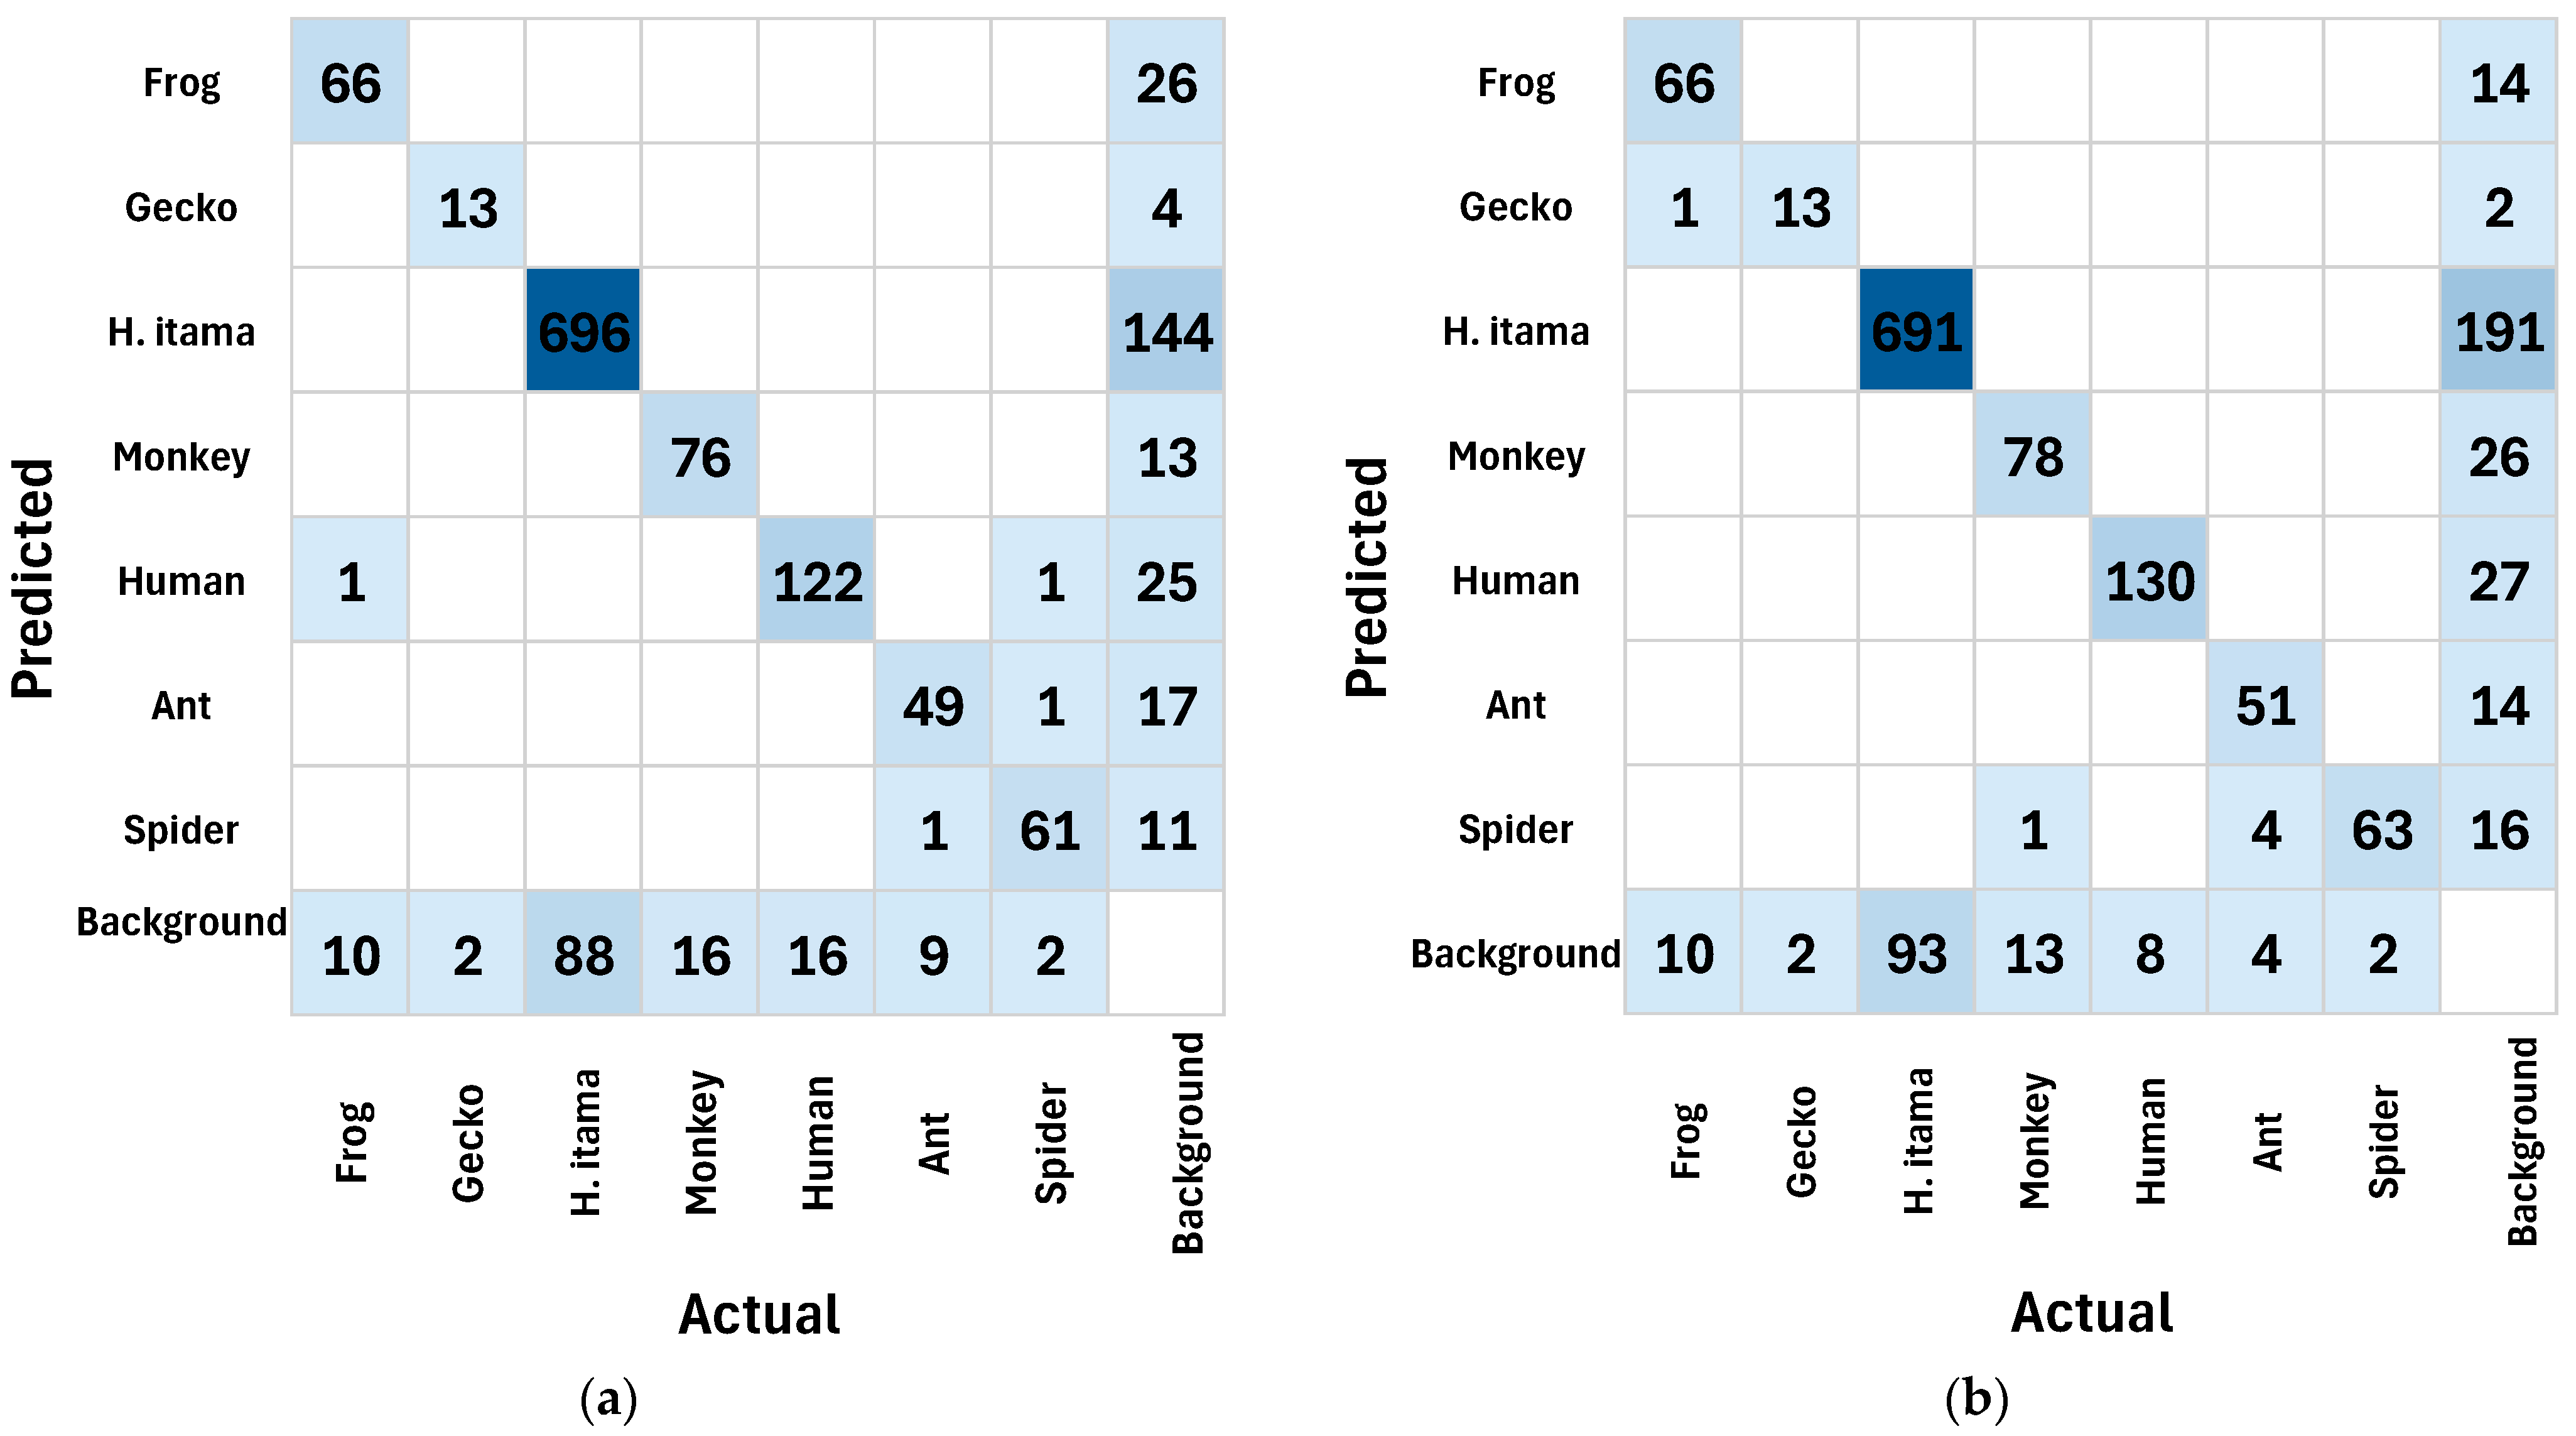
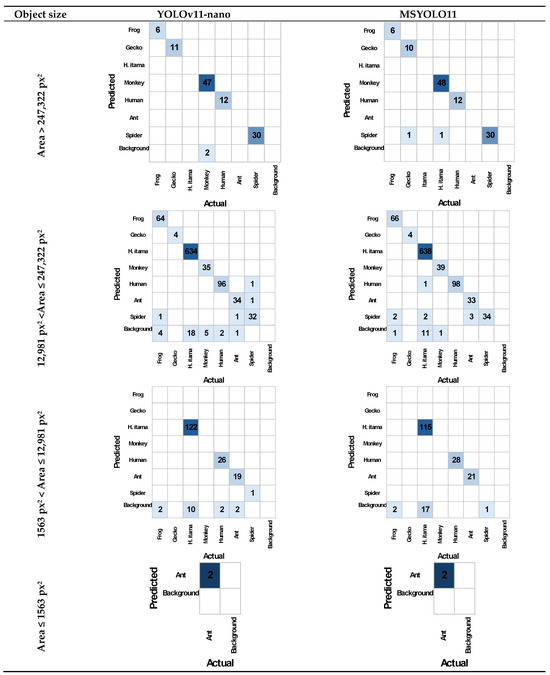
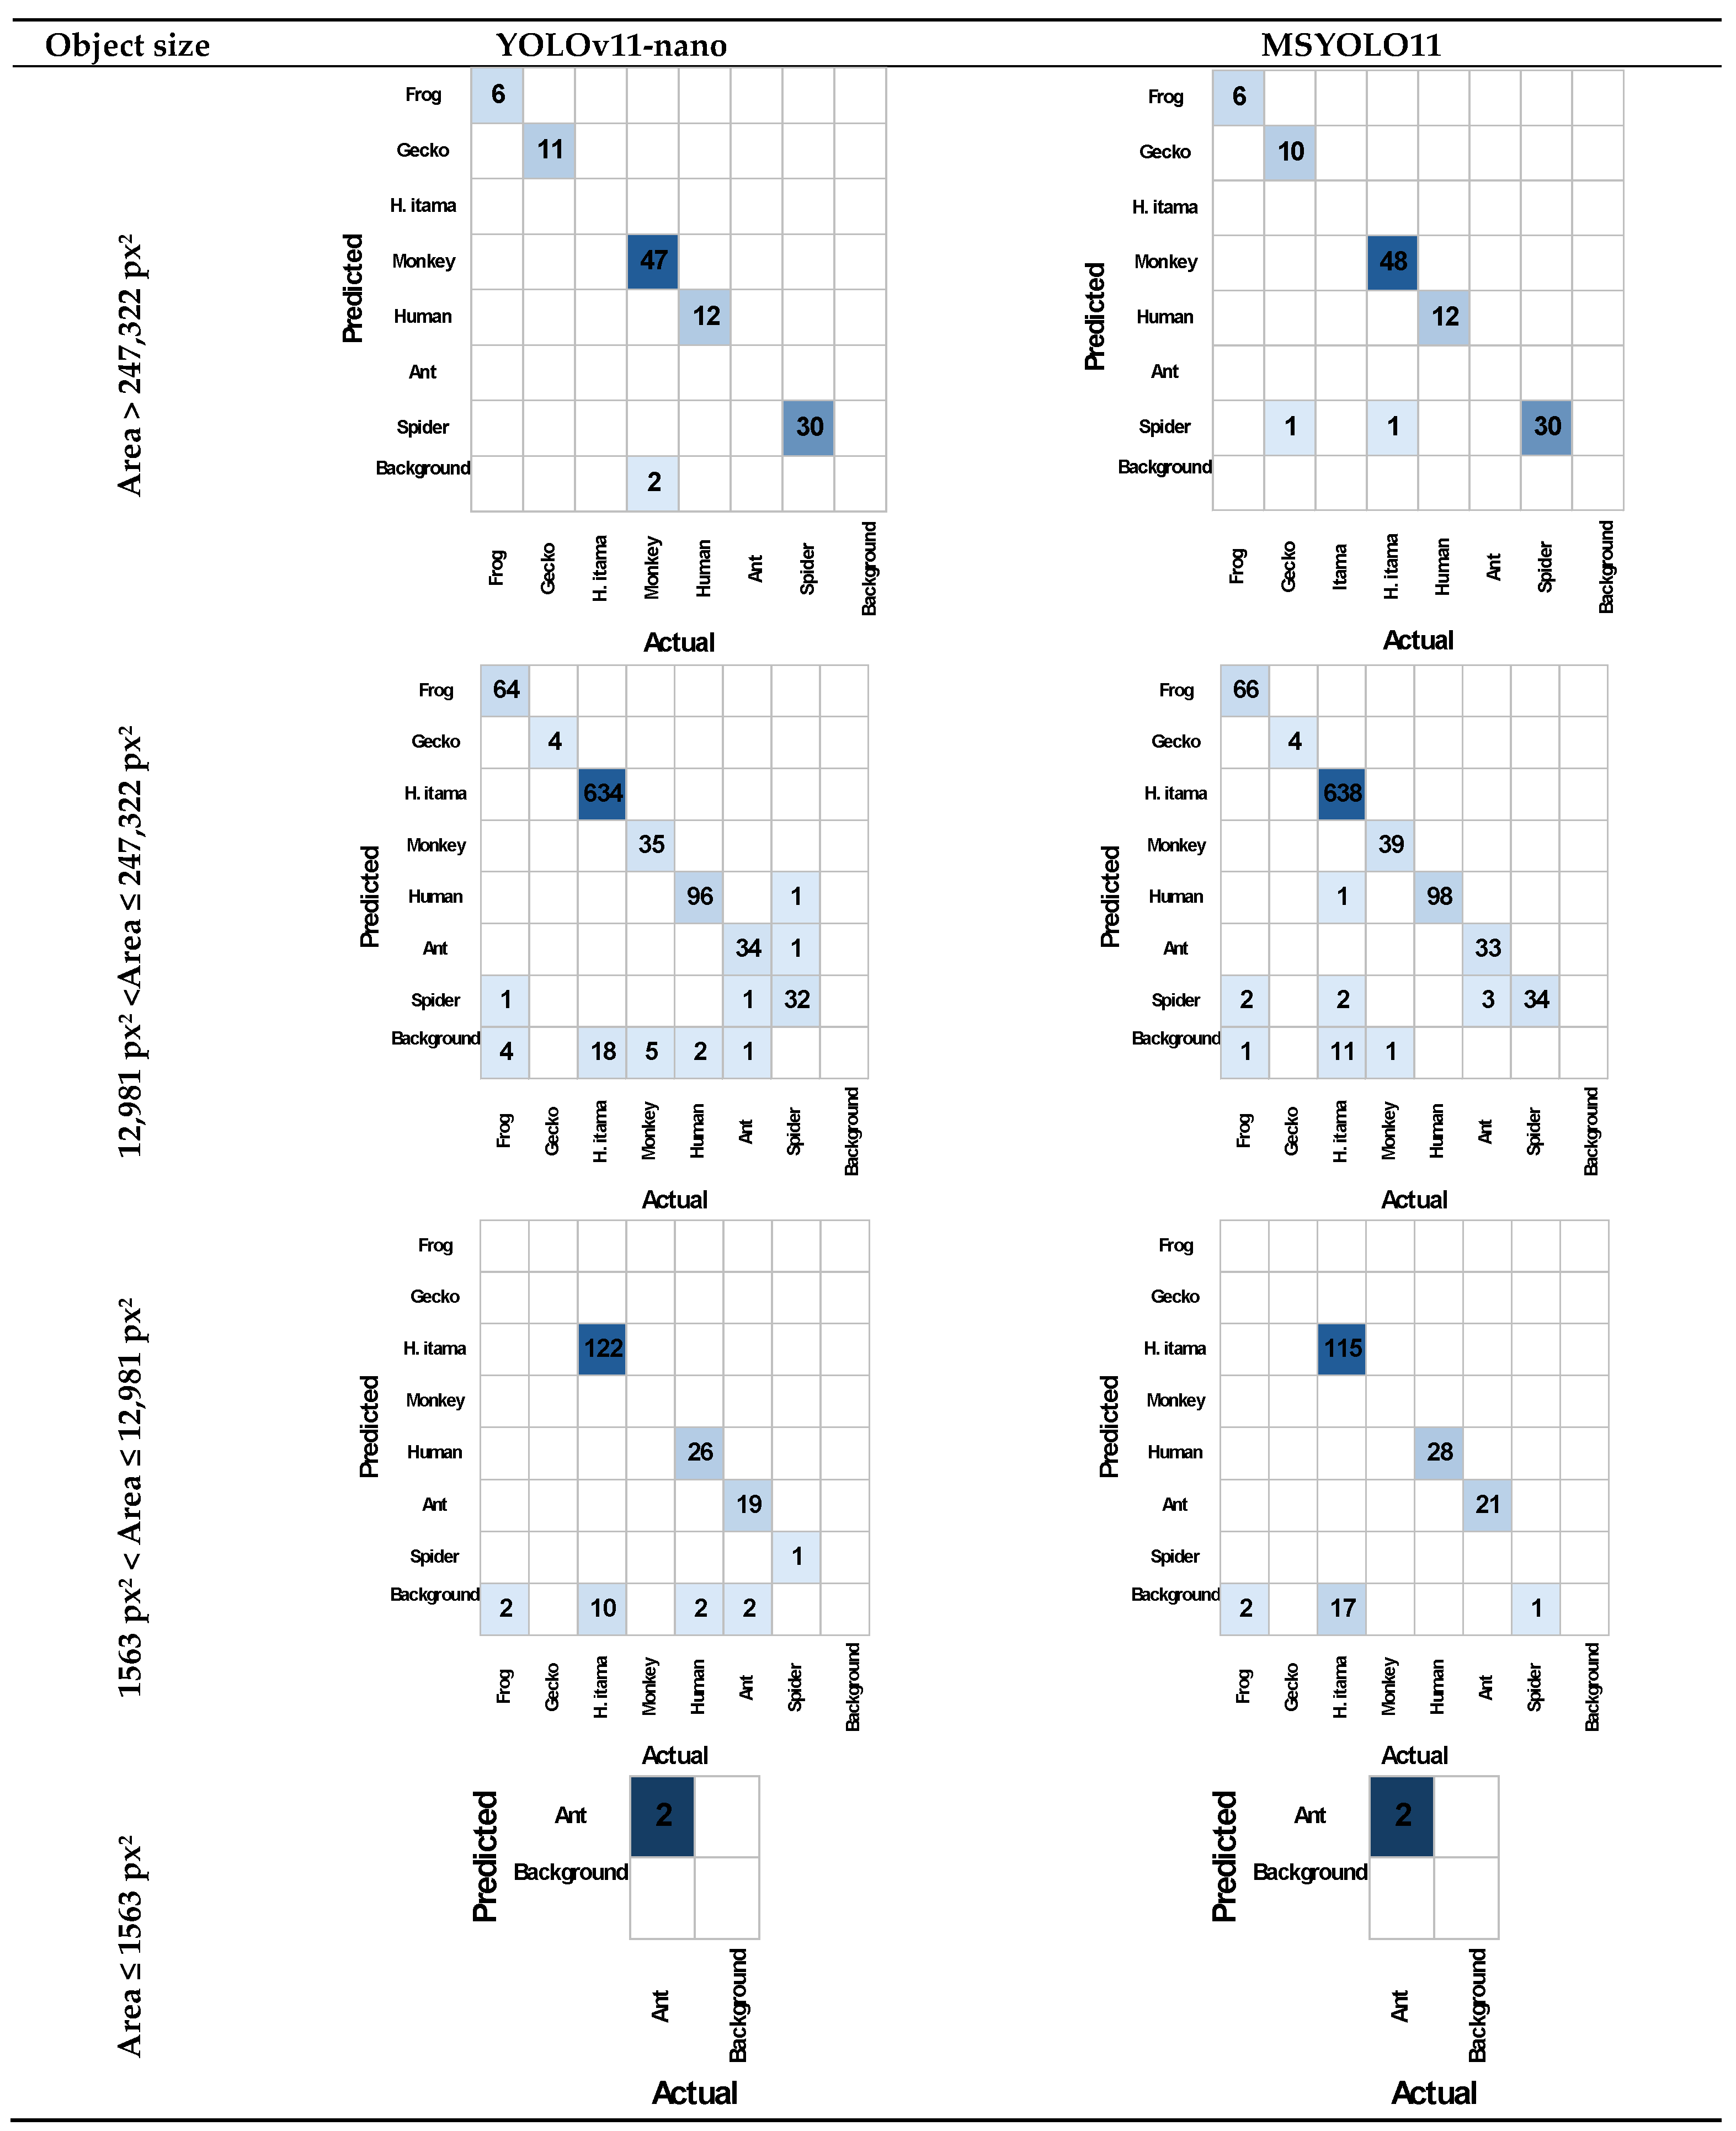
Confusion matrices of the YOLOv11-nano and MSYOLO11 models are given in Figure 7, where any instance from any of the classes that is not detected by the models is considered background in the confusion matrices. The figure shows that the proposed MSYOLO11 model generally exhibits fewer false-negative predictions of predators (i.e., excluding H. itama) as compared to the YOLOv11-nano model, resulting in the higher Recall as given in the previous tables. In the context of predator monitoring applications under consideration, avoiding missed detections of predators is a must. Undetected predator presence may cause severe consequences to the hives, whilst false detection of predator can be manually verified by the beekeepers. Figure 8 expands this analysis further by assessing performance across different image sizes. Similar to the above, any instance from any of the classes that is not detected by the models is considered background. Furthermore, it should be also noted that not all classes appear in every size category, as shown previously in Figure 6. For instance, ant instances never exceed 247,322 pixels in area. As can be seen across most size groups, the proposed MSYOLO11 model generally exhibits better performance as compared to the YOLOv11-nano model by avoiding false negatives in predator detection. For bounding-box ranges of 1,563–12,981 px2 and 12,981–247,322 px2, the MSYOLO11 only missed three and four predator predictions, respectively, in comparison to YOLOv11-nano missing six and 16 predator predictions, respectively. For the smallest- and largest-sized bounding boxes, their performances are identical, missing two and one predator predictions, respectively. Overall, the results reinforce that the proposed MSYOLO11 model is able to provide a more robust multi-scale detection across varying object sizes.
Figure 7.
Confusion matrices of the (a) YOLOv11-nano and (b) MSYOLO11 models.
Figure 8.
Object size confusion matrices of the YOLOv11-nano and proposed MSYOLO11 models.
Table 7 presents performance summaries of the YOLOv11-nano and MSYOLO11 models across the four different image size ranges, with the values calculated from their respective confusion matrices in Figure 8. In the table, the “Object” category represents class-agnostic object detection performance, where any correctly detected instance, regardless of its actual class label, is counted as a true positive, and any missed instance is counted as a false negative. This provides a useful overall indicator of the model’s object-sensitivity across different bounding-box sizes, independent of classification accuracy. Overall, the proposed MSYOLO11 model achieves a higher Recall of 1 and 0.986 in medium (12,981–24,7322 px2 range) and large objects (>12,981 px2), respectively, as compared to YOLO11n, with overall perfect Precision across all size categories. These indicate that its increased sensitivity does not lead to additional false detections at the object level.
At the class level, the proposed MSYOLO11 model generally improves Recall across most predator classes and image size ranges. Notable improvements in Recall are observed for the ant and human classes in the 1563–12,981 px2 range, where Recall increases from 0.905 to 1.000 and from 0.929 to 1.000, respectively, reflecting the capability of the proposed MSYOLO11 model in capturing fine-scale features in medium-sized objects. In contrast, Recall reduces only in specific scenarios involving limited sample sizes or high intra-class variability, such as gecko in the largest size category, ant in the 12,981–247,322 px2 range, and Itama in the 1563–12,981 px2 range (the Recall difference for spider in the 1563–12,981 px2 range may be due to the only single instance of a spider and hence can be ignored). Collectively, these show that the proposed MSYOLO11 model is capable of detecting multi-scale predators, especially those appearing at medium-to-large object scales, an important requirement for reliable real-time hive surveillance.
Table 7.
Object-size-wise performance of the YOLOv11-nano and MSYOLO11 models.
3.2. Qualitative Analysis of Failure Cases
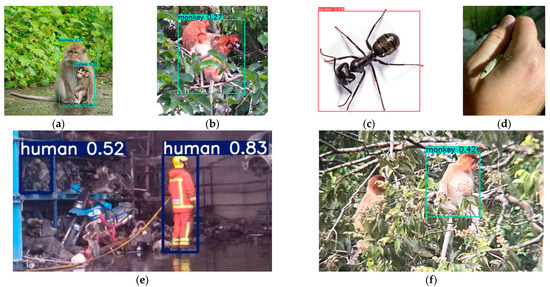
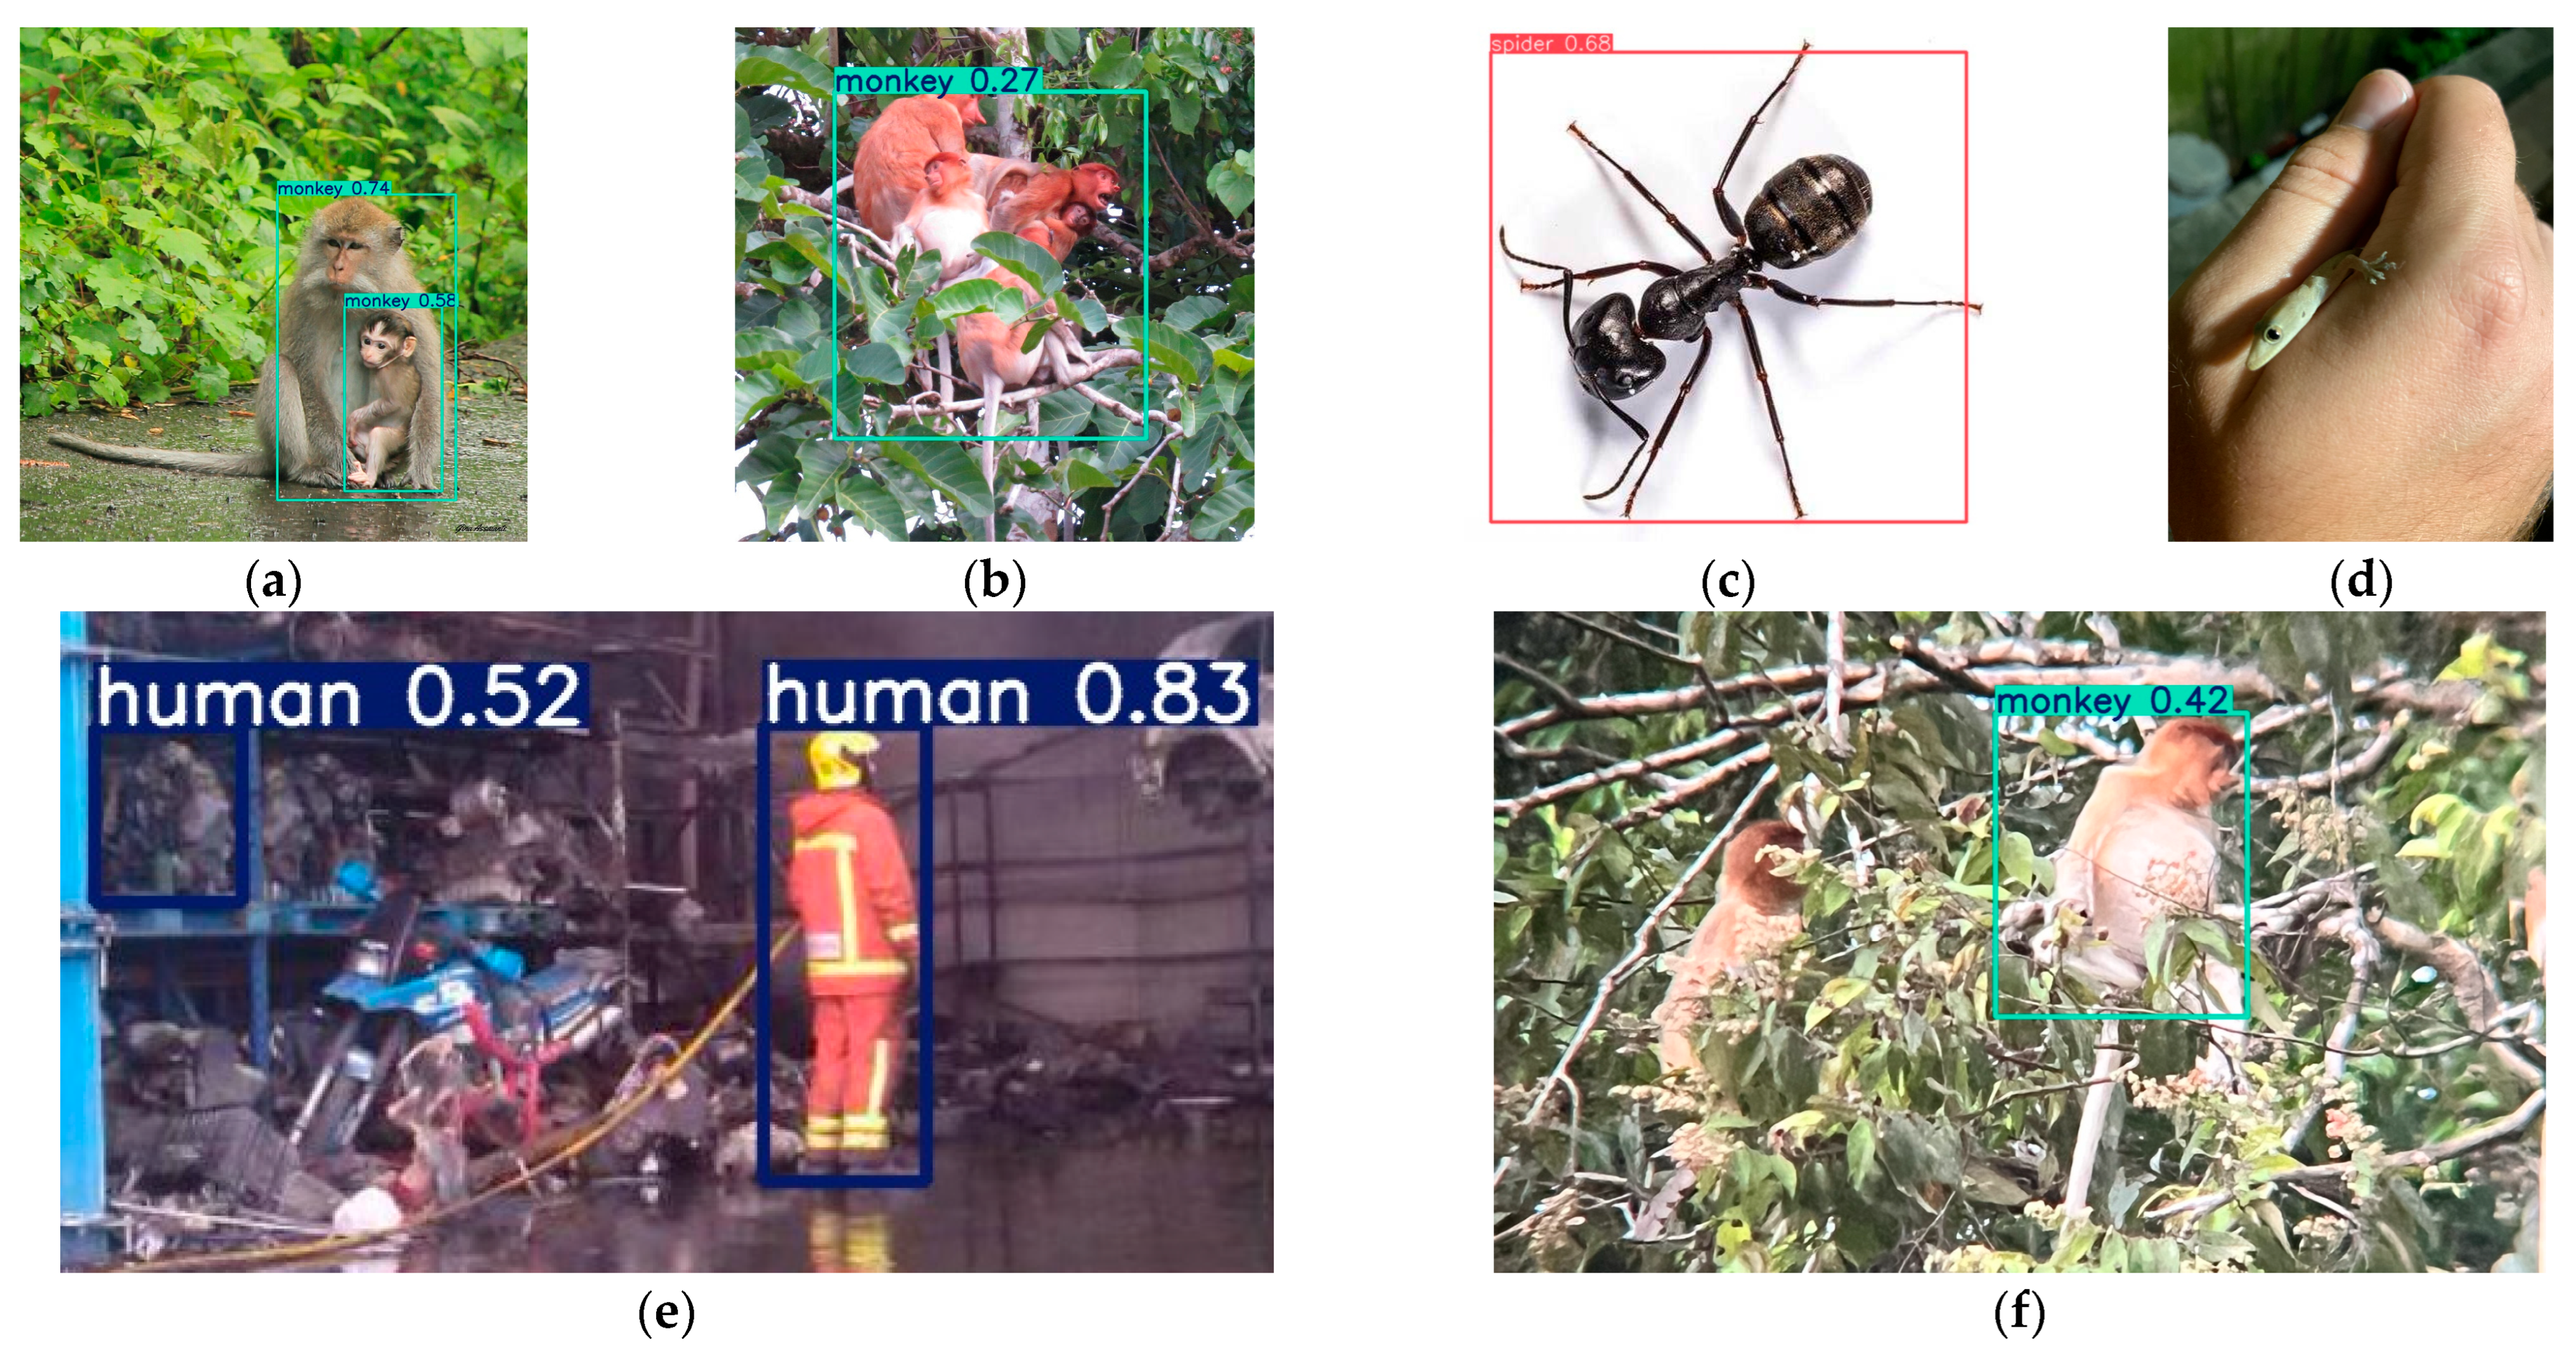
Figure 9 presents a qualitative evaluation of the performance limits of the MSYOLO11 model using representative validation samples. The analysis shows that the model performs reliably in the majority of cases, despite certain environmental and morphological conditions introducing localized challenges. These include false positives caused by inter-species similarity and background clutter, as well as false negatives resulting from severe occlusion in natural environments.
Figure 9.
Qualitative failure analysis and edge-case evaluation of MSYOLO11: (a) successful multi-instance detection, (b) social grouping occlusion, (c) morphological mimicry, (d) concealment and camouflage, (e) background hallucination and (f) foliage occlusion.
Further analysis of misclassifications shows that the main causes of model error are morphological similarity and a complex environment background. For instance, a false positive in the spider class was captured in the top-view images, where the radial symmetry of the legs and dark coloration led to confusion with spider features. Similarly, false positives in the human class may occur when static objects, such as machinery or debris, exhibit vertical structures and color patterns resembling human figures.
In addition, performance limitations are observed under conditions of occlusion. Dense group formations, such as proboscis monkeys in foliage, may lead to missed detections when individuals overlap or key features are obscured. Similar effects are observed for gecko instances under extreme camouflage or partial occlusion. Despite these challenging edge cases, the MSYOLO11 model demonstrates strong robustness across diverse and cluttered environments, with most errors occurring under highly complex visual conditions.
In addition to its particular ecological usage, the MSYOLO11 architecture contributes to the broader field of visual inspection and edge-deployed AI by addressing the trade-off between multi-scale feature representation and computational efficiency. Conventional approaches often rely on computationally intensive architectures, such as feature pyramids or bidirectional feature fusion, to identify objects of varying sizes. In contrast, the proposed MSA module enhances multi-scale feature representation while maintaining a low computational footprint suitable for edge devices. This efficiency is particularly important for on-device inference, where the memories and power bottlenecks are significant, such as in edge devices. As a result, the proposed framework provides a scalable solution to various real-time applications, including industrial quality control and autonomous surveillance, where accurate multi-scale detection must be achieved under hardware limitations [56,57,58,59,60,61].
3.3. Final System Deployment
The proposed MSYOLO11 model was then deployed on a resource-constrained Jetson Orin Nano edge device for the purpose of real-time monitoring of stingless bee hives in the case of predator presence. When a predator is detected in the vicinity of the beehive, the system sends push notifications to the mobile application via Wi-Fi, allowing the beekeepers to immediately view the alert and other relevant details.
On the Jetson device, the processing pipeline requires 12.9 ms for pre-processing, 140.3 ms for inference and 3.7 ms for post-processing, resulting in a total end-to-end latency of 181.07 ms. This enables the system to run at approximately 5 FPS, which is more than sufficient for real-time monitoring without any noticeable lags. In fact, real-time predator monitoring generally requires only 0.1–1 FPS, as beekeepers are generally only concerned with predators that remain near the beehives long enough to cause any stress to the colony.
The deployed MSYOLO11 model can also be further converted into a TensorRT engine to enhance its efficiency in terms of latency and throughput even further, making the system even more suitable for real-time hive monitoring applications. TensorRT supports several optimizations, including
- Precision calibration (FP16, INT8) to reduce computational load;
- Layer fusion to combine multiple operations into a single kernel;
- Dynamic tensor memory management for optimal GPU memory usage;
- Automatic kernel tuning to select the best GPU kernels for each layer.
Once the model is converted into a TensorRT engine, it can then be used directly for inference by replacing the PyTorch model with the generated TensorRT file [62].
With the optional LCD screen, a configuration user interface appears upon launching the system, where beekeepers or system integrators can set up the system, including setting the camera focus and selecting which predators/intruders should trigger notifications to beekeepers. These configuration settings are saved as a text file on the device, allowing the system to automatically load the saved configuration files upon startup.
Figure S1a,b show the operation of the deployed system from both the edge device and mobile application. Figure S1a shows the interface running on the optional LCD screen, with real-time camera feed and detection results displayed for demonstration purposes, whilst Figure S1b shows the mobile application dashboard used by beekeepers to view alerts, detected predators, and historical trends. For illustration purposes, the Jetson device displays two windows showing real-time camera output and detected predators simultaneously, as shown in Figure S1a. Of course, in real-time deployment, these dual windows can be disabled to reduce resource consumption, and in fact, the LCD screen can also be removed. The system takes and processes real-time images of the hive vicinity in real time, and upon detection of any predator by the deployed model, the system performs multiple actions: it updates the real-time database with detection data irrespective of whether a notification is necessary, saves the image on the Jetson device, and sends a push notification to the beekeepers’ mobile phone only when notification-required predators are detected.
At the beekeepers’ end, they can access the mobile application either by tapping on the push notification or by directly opening the mobile application. The mobile application, shown in Figure S1b, provides detailed information about the most recently detected predators and displays the count of predators for each species, as well as a daily trend graph that beekeepers can use to track predators detected throughout the current day. Additional details can be accessed through the various configured buttons; for instance, the “View Detected Predator” button links to the last detected predator image saved on the Jetson device. If the application is open during detection, it automatically receives data updates in real time through the Firebase Realtime Database, with the system allowing beekeepers to view previously synchronized data in offline mode.
The database itself is capable of being scaled across multiple nodes without the need for a dedicated application server. Security and data validation are enforced through Firebase Realtime Database Security Rules, which use expression-based validation [63], hence providing security and peace-of-mind to the beekeepers.
4. Conclusions
Predator attacks pose a serious threat to stingless bee colonies, as repeated disturbances have the potential to not only reduce honey production but also may trigger colony absconding, causing loss of time and investment to the beekeepers. This study addressed the need for continuous and reliable hive surveillance by developing an automated predator detection system capable of identifying a diverse range of intruders of varying sizes and visual characteristics. The main objective was to enhance multi-scale predator detection in high-resolution images and to provide real-time alerts to beekeepers through an accessible mobile-based platform.
A hybrid detection architecture, MSYOLO11, was developed by integrating an attention mechanism with the YOLOv11-nano backbone, thereby combining global feature modeling capabilities of the YOLO family with strong local feature extraction of an attention mechanism in order to improve the detection of objects at different scales. The model was trained and evaluated using a custom dataset containing classes of varying object sizes, and it was subsequently deployed on a resource-constrained Jetson Orin Nano edge device for real-time hive monitoring operation. Experimental results show that the proposed MSYOLO11 model achieves higher Recall across most classes as compared to YOLOv11-nano. Notable improvements were observed for ant (+0.096), human (+0.083) and H. itama (+0.026). Overall Recall increased from 0.830 to 0.853, while Precision (0.868 compared to 0.842) and mAP50 (0.896 compared to 0.898) remained comparable. These improvements were achieved without increasing computational complexity at 6.3 GFLOPs. On the Jetson Orin Nano, the system achieved an end-to-end latency of 181.07 ms, which corresponds to approximately 5 FPS, well above the FPS typically required for real-time predator monitoring in beekeeping applications. The system was further integrated with the Firebase Realtime Database and a mobile application to deliver instant push notifications, real-time data synchronization and offline data viewing, allowing beekeepers to verify intrusions quickly, track daily predator activity and respond rapidly to potential threats. The use of widely available smartphones increases accessibility and reduces the need for additional hardware, making the system practical for both small-scale and commercial beekeeping operations.
In conclusion, the proposed MSYOLO11-based predator monitoring system provides an effective and affordable solution for continuous hive surveillance. It combines improved multi-scale detection performance with real-time mobile-based alerts, helping to safeguard colony health and reduce the workload of beekeepers. Although the system already performs well on edge hardware, future enhancements using expanded datasets may further strengthen detection performance. The contributions of this work support the advancement of intelligent Precision Beekeeping systems that promote colony welfare through timely and automated monitoring.
Despite these encouraging results, several limitations should be acknowledged. While this study reports end-to-end latency, parameter count, and memory usage, detailed layer-wise profiling of the attention and convolutional components was not conducted. A detailed ablation study of the proposed MSA module was not conducted in this study. Such analysis, including parameter-controlled comparisons, would provide deeper insight into the contribution of each design component and will be considered as an important direction for future work. Additionally, although the evaluation dataset incorporates images from multiple sources with variations in object size, lighting, and background conditions, further validation across a broader range of apiaries, environmental conditions, and geographic locations would strengthen generalizability. While the MSYOLO11 demonstrates clear performance gains over the baselines, future studies will incorporate multi-run statistical significance testing to further validate the stability of these improvements across diverse hardware environments. Addressing these limitations forms an important direction for future work. Future work will also include benchmarking the proposed MSYOLO11 model against other lightweight and attention-based object detection architectures to further assess its competitiveness across diverse frameworks. Such comparisons will require careful re-optimization to ensure fair and application-relevant evaluation.
Supplementary Materials
The following supporting information can be downloaded at https://www.mdpi.com/article/10.3390/technologies14050246/s1, Figure S1: Interfaces of software: (a) Jetson Orin Nano edge device as seen from the optional LCD; (b) mobile application of the system.
Author Contributions
Conceptualization, M.S.M., H.Y., A.G.N. and P.E.A.; Methodology, A.M.B.R., M.S.M. and P.E.A.; Software, A.M.B.R.; Validation, A.M.B.R., M.S.M. and P.E.A.; Formal analysis, A.M.B.R.; Investigation, A.M.B.R.; Resources, P.E.A.; Data curation, A.M.B.R.; Writing—original draft, A.M.B.R.; Writing—review & editing, M.S.M., H.Y., A.G.N. and P.E.A.; Visualization, A.M.B.R.; Supervision, H.Y., A.G.N. and P.E.A.; Project administration, H.Y., A.G.N. and P.E.A.; Funding acquisition, P.E.A. All authors have read and agreed to the published version of the manuscript.
Funding
This research was funded by the grant titled “Monitoring System for Bee-colonies” reference number UBD/RSCH/URC/NIG/3.0/2022/002, awarded by the Universiti of Brunei Darussalam.
Institutional Review Board Statement
Not applicable.
Informed Consent Statement
Not applicable.
Data Availability Statement
The original contributions presented in this study are included in the article/Supplementary Material. Further inquiries can be directed to the corresponding author.
Conflicts of Interest
The authors declare no conflict of interest.
References
- Ratnayake, A.M.B.; Yasin, H.M.; Naim, A.G.; Abas, P.E. Buzzing through Data: Advancing Bee Species Identification with Machine Learning. Appl. Syst. Innov. 2024, 7, 62. [Google Scholar] [CrossRef] [Scilit]
- Zacepins, A.; Brusbardis, V.; Meitalovs, J.; Stalidzans, E. Challenges in the Development of Precision Beekeeping. Biosyst. Eng. 2015, 130, 60–71. [Google Scholar] [CrossRef] [Scilit]
- Amala, U.; Shamappa, V.H.; Kandikere, C.; Nanjundaiah, S.A.; Maharudrappa, S.T. Adaptive Defence Strategies of the Stingless Bee, Smith. Against Nest Intruders in a Newly Divided Colony. J. Apic. Sci. 2023, 67, 91–101. [Google Scholar] [CrossRef] [Scilit]
- Ratnayake, A.M.B.; Yasin, H.M.; Naim, A.G.; Sukri, R.S.; Ahmad, N.; Zaini, N.H.; Yu, S.B.; Ruslan, M.A.; Abas, P.E. Machine Learning-Based Acoustic Analysis of Stingless Bee (Heterotrigona Itama) Alarm Signals During Intruder Events. Agriculture 2025, 15, 591. [Google Scholar] [CrossRef] [Scilit]
- Shackleton, K.; Al Toufailia, H.; Balfour, N.J.; Nascimento, F.S.; Alves, D.A.; Ratnieks, F.L.W. Appetite for Self-Destruction: Suicidal Biting as a Nest Defense Strat in Trigona Stingless Bees. Behav. Ecol. Sociobiol. 2015, 69, 273–281. [Google Scholar] [CrossRef] [Scilit]
- Sevin, S.; Tutun, H.; Mutlu, S. Detection of Varroa Mites from Honey Bee Hives by Smart Technology Var-Gor: A Hive Monitoring and Image Processing Device. Turk. J. Vet. Anim. Sci. 2021, 45, 487–491. [Google Scholar] [CrossRef] [Scilit]
- Wachowicz, A.; Pytlik, J.; Małysiak-Mrozek, B.; Tokarz, K.; Mrozek, D. Edge Computing in IoT–Enabled Honeybee Monitoring for the Detection of Varroa Destructor. Int. J. Appl. Math. Comput. Sci. 2022, 32, 355–369. [Google Scholar] [CrossRef] [Scilit]
- Voudiotis, G.; Moraiti, A.; Kontogiannis, S. Deep Learning Beehive Monitoring System for Early Detection of the Var Mite. Signals 2022, 3, 506–523. [Google Scholar] [CrossRef] [Scilit]
- Ntawuzumunsi, E.; Kumaran, S.; Sibomana, L. Self-Powered Smart Beehive Monitoring and Control System (Sbmacs). Sensors 2021, 21, 3522. [Google Scholar] [CrossRef] [Scilit]
- Jeon, M.S.; Jeong, Y.; Lee, J.; Yu, S.H.; Kim, S.B.; Kim, D.; Kim, K.C.; Lee, S.; Lee, C.W.; Choi, I. Deep Learning-Based Portable Image Analysis System for Real-Time Detection of Vespa Velutina. Appl. Sci. 2023, 13, 7414. [Google Scholar] [CrossRef] [Scilit]
- Ultralytics YOLO11-Ultralytics YOLO Docs. Available online: https://docs.ultralytics.com/models/yolo11/ (accessed on 31 March 2026).
- Wang, Z.; Su, Y.; Kang, F.; Wang, L.; Lin, Y.; Wu, Q.; Li, H.; Cai, Z. PC-YOLO11s: A Lightweight and Effective Feature Extraction Method for Small Target Image Detection. Sensors 2025, 25, 348. [Google Scholar] [CrossRef] [Scilit]
- Chen, G.; Wang, H.; Chen, K.; Li, Z.; Song, Z.; Liu, Y.; Chen, W.; Knoll, A. A Survey of the Four Pillars for Small Object Detection: Multiscale Representation, Contextual Information, Super-Resolution, and Region Proposal. IEEE Trans. Syst. Man Cybern. Syst. 2022, 52, 936–953. [Google Scholar] [CrossRef] [Scilit]
- Liu, Q.; Lv, J.; Zhang, C. MAE-YOLOv8-Based Small Object Detection of Green Crisp Plum in Real Co Orchard Environments. Comput. Electron. Agric. 2024, 226, 109458. [Google Scholar] [CrossRef] [Scilit]
- Zhao, J.; Zhang, X.; Yan, J.; Qiu, X.; Yao, X.; Tian, Y.; Zhu, Y.; Cao, W. A Wheat Spike Detection Method in UAV Images Based on Improved YOLOv5. Remote Sens. 2021, 13, 3095. [Google Scholar] [CrossRef] [Scilit]
- Ratnayake, A.; Yasin, H.M.; Naim, A.G.; Abas, P.E. Classification of Subspecies of Honey Bees Using Convolutional Neural Network. In Proceedings of the 2023 6th International Conference on Applied Computational Intelligence in Information Systems (ACIIS), Virtual, 23 October 2023; pp. 1–6. [Google Scholar]
- Goyal, A.; Bengio, Y. Inductive Biases for Deep Learning of Higher-Level Cognition. Proc. R. Soc. A Math. Phys. Enginee Ring Sci. 2022, 478, 20210068. [Google Scholar] [CrossRef] [Scilit]
- Aneja, S.; Aneja, N.; Abas, P.E.; Naim, A.G. Defense against Adversarial Attacks on Deep Convolutional Neural Networks through Nonlocal Denoising. IAES Int. J. Artif. Intell. 2022, 11, 961–968. [Google Scholar] [CrossRef] [Scilit]
- Chen, L.-C.; Zhu, Y.; Papandreou, G.; Schroff, F.; Adam, H. Encoder-Decoder with Atrous Separable Convolution for Semantic Image S. In Computer Vision–ECCV 2018; Ferrari, V., Hebert, M., Sminchisescu, C., Weiss, Y., Eds.; Springer International Publishing: Cham, Switzerland, 2018; Volume 11211, pp. 833–851. ISBN 978-3-030-01233-5. [Google Scholar]
- Yu, F.; Koltun, V. Multi-Scale Context Aggregation by Dilated Convolutions. arXiv 2015, arXiv:1511.07122. [Google Scholar] [CrossRef] [Scilit]
- Peng, C.; Zhang, X.; Yu, G.; Luo, G.; Sun, J. Large Kernel Matters—Improve Semantic Segmentation by Global Convolu Network. In Proceedings of the IEEE Conference on Computer Vision and Pattern Recognition; IEEE: Piscataway, NJ, USA, 2025; pp. 1743–1751. [Google Scholar]
- Zhao, H.; Shi, J.; Qi, X.; Wang, X.; Jia, J. Pyramid Scene Parsing Network. In Proceedings of the IEEE Conference on Computer Vision and Pattern Recognition; IEEE: Piscataway, NJ, USA, 2025; pp. 6230–6239. [Google Scholar]
- Vaswani, A.; Shazeer, N.; Parmar, N.; Uszkoreit, J.; Jones, L.; Gomez, A.N.; Kaiser, Ł.; Polosukhin, I. Attention Is All You Need; Curran Associates, Inc.: Red Hook, NY, USA, 2025; Volume 30. [Google Scholar]
- Humayun, M.A.; Yassin, H.; Shuja, J.; Alourani, A.; Abas, P.E. A Transformer Fine-Tuning Strategy for Text Dialect Identification. Neural Comput. Appl. 2023, 35, 6115–6124. [Google Scholar] [CrossRef] [Scilit]
- Humayun, M.A.; Shuja, J.; Abas, P.E. A Review of Social Background Profiling of Speakers from Speech Accents. PeerJ Comput. Sci. 2024, 10, e1984. [Google Scholar] [CrossRef] [Scilit]
- Touvron, H.; Cord, M.; Douze, M.; Massa, F.; Sablayrolles, A.; Jegou, H. Training Data-Efficient Image Transformers & Distillation through Atte. In Proceedings of the 38th International Conference on Machine Learning, PMLR, Virtual, 18–24 July 2021; pp. 10347–10357. [Google Scholar]
- Arnab, A.; Dehghani, M.; Heigold, G.; Sun, C.; Lucic, M.; Schmid, C. ViViT: A Video Vision Transformer. In Proceedings of the IEEE/CVF International Conference on Computer Vision; IEEE: Piscataway, NJ, USA, 2025; pp. 6816–6826. [Google Scholar]
- Liu, Z.; Ning, J.; Cao, Y.; Wei, Y.; Zhang, Z.; Lin, S.; Hu, H. Video Swin Transformer. In Proceedings of the 2022 IEEE/CVF Conference on Computer Vision and Pattern Recognition (CVPR), New Orleans, LA, USA, 18–24 June 2022; pp. 3192–3201. [Google Scholar]
- Dosovitskiy, A.; Beyer, L.; Kolesnikov, A.; Weissenborn, D.; Zhai, X.; Unterthiner, T.; Dehghani, M.; Minderer, M.; Heigold, G.; Gelly, S.; et al. An Image Is Worth 16x16 Words: Transformers for Image Recognition at Scale. In Proceedings of the ICLR 2021-9th International Conference on Learning Representations, Virtual, 3–7 May 2020. [Google Scholar] [CrossRef] [Scilit]
- Xu, S.; Xiao, D.; Yuan, B.; Liu, Y.; Wang, X.; Li, N.; Shi, L.; Chen, J.; Zhang, J.-X.; Wang, Y.; et al. FAFuse: A Four-Axis Fusion Framework of CNN and Transformer for Medica Image Segmentation. Comput. Biol. Med. 2023, 166, 107567. [Google Scholar] [CrossRef] [Scilit]
- Lin, A.; Xu, J.; Li, J.; Lu, G. ConTrans: Improving Transformer with Convolutional Attention for Medic Al Image Segmentation; Wang, L., Dou, Q., Fletcher, P.T., Speidel, S., Li, S., Eds.; Springer Nature: Cham, Switzerland; pp. 297–307.
- Zhang, Y.; Liu, H.; Hu, Q. TransFuse: Fusing Transformers and CNNs for Medical Image Segmentation. arXiv 2021, arXiv:2102.08005. [Google Scholar] [CrossRef] [Scilit]
- Ramachandran, P.; Parmar, N.; Vaswani, A.; Bello, I.; Levskaya, A.; Shlens, J. Stand-Alone Self-Attention in Vision Models. arXiv 2019, arXiv:1906.05909. [Google Scholar] [CrossRef] [Scilit]
- Wang, H.; Zhu, Y.; Green, B.; Adam, H.; Yuille, A.; Chen, L.-C. Axial-DeepLab: Stand-Alone Axial-Attention for Panoptic Segmentation. In Proceedings of the Computer Vision–ECCV 2020; Vedaldi, A., Bischof, H., Brox, T., Frahm, J.-M., Eds.; Springer International Publishing: Cham, Switzerland, 2020; pp. 108–126. [Google Scholar]
- Huang, Z.; Wang, X.; Huang, L.; Huang, C.; Wei, Y.; Liu, W. CCNet: Criss-Cross Attention for Semantic Segmentation. In Proceedings of the 2019 IEEE/CVF International Conference on Computer Vision (ICCV), Seoul, Republic of Korea, 27 October–2 November 2019; pp. 603–612. [Google Scholar]
- Kim, K.; Wu, B.; Dai, X.; Zhang, P.; Yan, Z.; Vajda, P.; Kim, S.J. Rethinking the Self-Attention in Vision Transformers. In Proceedings of the IEEE/CVF Conference on Computer Vision and Pattern Recognition, Virtual, 19–25 June 2021. [Google Scholar]
- 10 Monkey Species. Available online: https://www.kaggle.com/datasets/slothkong/10-monkey-species (accessed on 31 March 2026).
- Frogs Object Detection Model by Brad Dwyer. Available online: https://universe.roboflow.com/brad-dwyer/frogs-agkpn (accessed on 31 March 2026).
- Download Spider Image Classification Dataset–Free Labeled Images for AI & Computer Vision|Images.Cv. Available online: https://images.cv/dataset/spider-image-classification-dataset (accessed on 31 March 2026).
- Photos of Asian House Gecko (Hemidactylus Frenatus) · INaturalist NZ. Available online: https://www.inaturalist.nz/taxa/51940-Hemidactylus-frenatus/browse_photos (accessed on 31 March 2026).
- Photos of Proboscis Monkey (Nasalis Larvatus) · INaturalist. Available online: https://www.inaturalist.org/taxa/43538-Nasalis-larvatus/browse_photos (accessed on 31 March 2026).
- Photos of Long-Tailed Macaque (Macaca Fascicularis) · INaturalist. Available online: https://www.inaturalist.org/taxa/43459-Macaca-fascicularis/browse_photos?photo_license=cc0 (accessed on 31 March 2026).
- Labeled Image Datasets for AI & Computer Vision Models. Available online: https://images.cv/download/ant/1651 (accessed on 31 March 2026).
- Human Dataset. Available online: https://www.kaggle.com/datasets/fareselmenshawii/human-dataset (accessed on 31 March 2026).
- Khanam, R.; Hussain, M. YOLOv11: An Overview of the Key Architectural Enhancements. arXiv 2024, arXiv:2410.17725. [Google Scholar] [CrossRef] [Scilit]
- Ultralytics YOLO11: Fast & Accurate Vision AI. Available online: https://www.ultralytics.com/blog/all-you-need-to-know-about-ultralytics-yolo11-and-its-applications (accessed on 12 September 2025).
- Murat, A.A.; Kiran, M.S. A Comprehensive Review on YOLO Versions for Object Detection. Eng. Sci. Technol. Int. J. 2025, 70, 102161. [Google Scholar] [CrossRef] [Scilit]
- YOLO Model Comparison: YOLOv11 vs Previous. Available online: https://www.ultralytics.com/blog/comparing-ultralytics-yolo11-vs-previous-yolo-models (accessed on 12 September 2025).
- Liu, Z.; Lin, Y.; Cao, Y.; Hu, H.; Wei, Y.; Zhang, Z.; Lin, S.; Guo, B. Swin Transformer: Hierarchical Vision Transformer Using Shifted Windows. In Proceedings of the IEEE/CVF International Conference on Computer vision; IEEE: Piscataway, NJ, USA, 2021; pp. 9992–10002. [Google Scholar]
- Ho, J.; Kalchbrenner, N.; Weissenborn, D.; Salimans, T. Axial Attention in Multidimensional Transformers. arXiv 2019, arXiv:1912.12180. [Google Scholar] [CrossRef] [Scilit]
- Lin, T.-Y.; Maire, M.; Belongie, S.; Bourdev, L.; Girshick, R.; Hays, J.; Perona, P.; Ramanan, D.; Zitnick, C.L.; Dollár, P. Microsoft COCO: Common Objects in Context. arXiv 2015, arXiv:1405.0312. [Google Scholar] [CrossRef] [Scilit]
- Vyas, N.; Dutt, V. Advancing Precision Agriculture: Leveraging YOLOv8 for Robust Deep Learning Enabled Crop Diseases Detection. In Proceedings of the 2023 International Conference on Integration of Computational Intelligent System, ICICIS 2023, Pune, India, 1–4 November 2023. [Google Scholar] [CrossRef] [Scilit]
- Binghay, N.A.; Quezon, K.A.; Montero, V.J.; Calamba, M.; Empas, P.E. Object Detection Approach for Batch Detection of Cacao Bean Defects. In Proceedings of the 4th International Conference on Electrical, Communication and Computer Engineering, ICECCE 2023, Dubai, United Arab Emirates, 30–31 December 2023. [Google Scholar] [CrossRef] [Scilit]
- Borah, S.S.; Anand, A.; Sundaravadivel, P.; Fletcher, R.; Reddy, K.N. Remote Aerial Vehicle Solutions for Weed Detection in Precision Agriculture. IEEE Access 2025, 13, 101440–101454. [Google Scholar] [CrossRef] [Scilit]
- Park, N.; Kim, S. How Do Vision Transformers Work? In Proceedings of the ICLR 2022-10th International Conference on Learning Representations, Virtual, 25–29 April 2022. [Google Scholar]
- Meng, C.; Sun, Z.; Huo, L.; Li, T.; Chang, S.; Zhang, Z. An Embedded Feature Pyramid Network Enables Bidirectional Information Flow for Object Detection and Instance Segmentation. Neurocomputing 2025, 619, 129196. [Google Scholar] [CrossRef] [Scilit]
- Du, H.; Wu, S.; Kharlamova, A.; Guan, N.; Xue, C.J. FlexInfer: Breaking Memory Constraint via Flexible and Efficient Offloading for On-Device LLM Inference. arXiv 2025, arXiv:2503.03777. [Google Scholar]
- Ahammed, I.; Rakib, M.K.A.; Mawa, J.; Rahman, M.Y.; Obaidah, A. Edge-AI Vision Surveillance Robot: Real-Time Object Detection and IoT-Driven Autonomous Navigation. In Proceedings of the -2025 IEEE 7th Global Power, Energy and Communication Conference, GPECOM, Bochum, Germany, 11–13 June 2025; Volume 2025, pp. 1073–1078. [Google Scholar] [CrossRef] [Scilit]
- Yang, J.; Yue, X.; Wu, L. A Collaborative Multi-Attention Network for Real-Time Small Object Detection in UAV Imagery. Sci. Rep. 2026, 16, 5852. [Google Scholar] [CrossRef] [Scilit]
- Xu, D.; Zhang, H.; Yang, L.; Liu, R.; Huang, G.; Xu, M.; Liu, X. Fast On-Device LLM Inference with NPUs. In Proceedings of the 30th ACM International Conference on Architectural Support for Programming Languages and Operating Systems, Volume 1 (ASPLOS ’25), Rotterdam, The Netherlands, 30 March–3 April 2025. [Google Scholar] [CrossRef] [Scilit]
- Wang, S.; Liu, S.; Jin, M.; Fan, P. Multi-Scale Feature Pyramid Network with Bidirectional Attention for Efficient Mural Image Classification. PLoS ONE 2025, 20, e0328507. [Google Scholar] [CrossRef] [Scilit]
- Ultralytics TensorRT. Available online: https://docs.ultralytics.com/integrations/tensorrt (accessed on 15 September 2025).
- Firebase Realtime Database. Available online: https://firebase.google.com/docs/database (accessed on 3 December 2025).

Disclaimer/Publisher’s Note: The statements, opinions and data contained in all publications are solely those of the individual author(s) and contributor(s) and not of MDPI and/or the editor(s). MDPI and/or the editor(s) disclaim responsibility for any injury to people or property resulting from any ideas, methods, instructions or products referred to in the content. |
© 2026 by the authors. Licensee MDPI, Basel, Switzerland. This article is an open access article distributed under the terms and conditions of the Creative Commons Attribution (CC BY) license.