


Abstract
A substantial number of students with hearing impairments are enrolled in higher education, motivating the development of inclusive assistive technologies that reduce communication barriers. This study developed and evaluated a prototype electronic glove that translates Mexican Sign Language (LSM) signs into Spanish text using machine learning. Eight participants (four deaf and four hearing with LSM proficiency) completed four sessions involving 12 signs; three sessions (S1–S3) were used for model development and one session (T) was held out for evaluation. Models were trained on S1–S3 and tested on T using a session-level split without window mixing across sessions; therefore, results represent a speaker-dependent, inter-session pilot assessment rather than a speaker-independent generalization test. The glove integrates flex sensors and an inertial measurement unit IMU MPU6050 connected to an ESP32-C3 SuperMini microcontroller. These components were selected due to their low cost, availability, and ease of integration, making them suitable for the development of accessible wearable assistive technologies. Under this protocol, the system achieved a window-level overall test accuracy of 97.0% (95% CI computed at the window level: 96.00–97.00), with higher performance for the dynamic subset (98.0%) than for the static subset (95.0%), and an algorithmic decision delay of 1.2 s. Usability and acceptance were evaluated using the System Usability Scale (SUS) and a Technology Acceptance Model (TAM)-based questionnaire. The mean SUS score was 50.6 ± 1.8 (marginal usability), while participants reported positive perceptions across TAM constructs. Overall, findings demonstrate technical feasibility under controlled inter-session conditions and provide a foundation for iterative user-centered refinement, followed by strict speaker-independent validation and classroom deployment studies in future work.
1. Introduction
Hearing loss affects approximately 2.3 million Mexicans, limiting their access to legal, medical, and educational resources [1]. Communication with hearing individuals poses a major challenge to the deaf population, as linguistic differences hinder professional and social relationships, and can delay assistance during emergencies [2].
Sign languages serve as the primary communication method for deaf individuals [3,4,5,6]. Unlike people with other impairments, deaf individuals rely exclusively on visual–gestural modalities, using hand gestures, facial expressions, and body movements to convey information [7,8,9,10]. There are over 300 sign languages worldwide, each with distinct alphabets and gestures that do not transfer across regions [11,12,13].
Mexican Sign Language (LSM), which has been legally recognized since 2005, is used by the deaf community in Mexico [14]. The LSM fingerspelling alphabet consists of 27 signs, 21 of which are static and 6 of which are dynamic. Dynamic signs entail changes in trajectory or direction, whilst static signals retain hand position without movement [15]. Despite this rich language system, communication hurdles continue due to the high expense of human interpreters and the lack of LSM-proficient hearing persons [16,17].
By converting gestures into text or voice, Sign Language Recognition (SLR) systems seek to close this gap. They have applications in intelligent driving, smart homes, and human–machine interactions [18]. These systems can be classified as either wearable (sensorized gloves, IMUs) or non-wearable (vision-based, WiFi-based) [6,19,20,21].
Sensorized gloves that record hand form and movement kinematics with low latency and resilience against occlusions and illumination stand out among these wearable systems based on portable sensors [22,23]. Flex sensors, IMUs, and cutting-edge technologies like triboelectric nanogenerators for ultra-low power operation are frequently integrated into wearables [24,25,26].
Recent glove-based solutions have demonstrated promising results across multiple sign languages [27]. TENG-based smart gloves that detect signals and capture biomechanical energy were suggested by [2]. In the case of [4], authors achieved 94–95% accuracy using IMU arrays with CNNs for Indian Sign Language. While [6,20] investigated static postures and sentence translation for ASL, refs. [16,28] introduced CNN-based architectures for sentence-level recognition. Ref. [17] used MPU6050 sensors with embedded ANNs to achieve 98% accuracy for Moroccan Sign Language. Although it has a larger delay, ref. [29] created a textronic glove for Polish Sign Language.
Vision-based methods, including those that use CNNs and MediaPipe, provide non-invasive collection but are still susceptible to camera angles and illumination [15,30]. In the research [15], authors attained 83.6% accuracy on static handshapes for LSM in particular, indicating viability but emphasizing the need for more reliable, privacy-preserving alternatives.
Recent studies illustrate important trade-offs and limitations. Vision-based systems excel on alphabetic subsets but remain sensitive to capture conditions [15,30]. Wearable systems using gloves, IMUs, or textronic sensors demonstrate promising accuracy on restricted vocabularies; however, they often fail to report on inter-session or signer-independent generalization, rely on complex laboratory setups that hinder classroom use, or omit real-time latency reporting [6,7,16,17,28].
For Mexican Sign Language in higher education, no low-cost, wearable translator has been systematically evaluated under controlled inter-session conditions with transparent session divisions, user-centered usability assessment, and documented real-time performance. The field would benefit from low-cost wearables that preserve user privacy, evaluated in educational contexts.
This work presents a low-cost wearable glove with flex sensors and an inertial measurement unit for recognizing a small subset of LSMs in real-time, emphasizing on-glove sensing, PC-based inference algorithms, inter-session evaluations among participants, and classroom-based feasibility. Compared with earlier research, our prototype (i) focuses on inclusive higher-education use cases, (ii) documents algorithmic latency and user-reported performance alongside accuracy, and (iii) adopts a protocol that explicitly separates training and testing sessions to mitigate temporal leakage—an aspect rarely discussed in many prototypes [4,7,17,23]. Choosing these options complements vision-based methods in that they favor portability and privacy while retaining accuracy within the range of related work. The main contributions of this study are as follows:
- 1.
- A controlled inter-session evaluation protocol designed to reduce temporal data leakage in wearable sign language recognition systems, including latency analysis and user feedback assessment.
- 2.
- The LSM translation glove achieved an overall accuracy of 97.00% (95% CI: 96.00%–97.00%), with better performance with dynamic signals (98.0%) than with static signals (95.0%) and operates with an algorithmic decision horizon of 1.2 s (window length).
- 3.
- The usability (SUS) and technology acceptance (TAM) questionnaires showed high levels of satisfaction and reliability (Cronbach’s between 0.86 and 0.93), demonstrating that users consider the prototype useful and easy to use and intend to use it.
This paper is organized as follows: Section 2 presents the participant’s details, describes the software and hardware of the proposed glove, the ML-based recognition pipeline, and the experimental protocol adopted in the pilot study. Section 3 reports the quantitative results in terms of accuracy, algorithmic latency, usability, and acceptance of technology. Section 4 discusses these findings in the context of inclusive higher education and contrasts them with related work. Also, outlines and directions for future research are presented. Finally, Section 5 presents the main conclusions of the work.
2. Materials and Methods
2.1. Participants
The presented research takes a quantitative approach. Eight students (two men and six women, aged between 19 and 22) from the Instituto Tecnológico Superior de Pánuco, Veracruz, México, and the Facultad de Medicina de Tampico Dr. Alberto Romo Caballero, Universidad Autónoma de Tamaulipas, Tampico, México, participated in the study. Four of them had permanent hearing impairments and communicated using LSM as their first language; the other four were hearing individuals with proficiency in LSM. None of the participants had previously used any electronic assistive devices to communicate.
The small sample size is due to the limited availability of deaf and hearing students with proficiency in LSM at both institutions, so this study should be considered pilot and exploratory in nature.
Table 1 presents the demographic characteristics, years of experience using the LSM, technological experience (assessed using a Likert scale from 1 to 5, where 1 = no or very low experience, 2 = low experience, 3 = moderate experience, 4 = high experience, and 5 = very high or expert experience), dominant hand (generally the hand in which the glove is worn), and the group to which the participants belong. The mean and standard deviation (SD) results for age, years of experience in LSM, and technological experience were 19.88 ± 1.05, 4.25 ± 0.97, and 3.38 ± 1.1, respectively. On average, participants had moderate technological experience with a slight tendency toward high.
Table 1.
Characteristics of the pilot study participants.
2.2. Prototype Description
A sensorized glove with five flex sensors and an IMU connected to an ESP32-C3 SuperMini (Espressif Systems, Shanghai, China) were chosen for their low-cost implementation, accessibility, and simplicity of integration in order to create a portable system for the identification of LSM.
The glove uses resistive flex (strain) sensors whose resistance increases with bend angle. We employed two commercial lengths: 2.2 in elements on the thumb and little finger (nominal flat resistance ; 45– when bent) and 4.5 in elements on the index, middle, and ring fingers (nominal flat ; ≥2× increase when bent toward ∼). Each sensor is read through a voltage divider: the flex element is tied to 3.3 V, a fixed resistor to ground, and the midpoint feeds the ESP32-C3 12-bit SAR ADC. The divider converts bend-dependent resistance into a voltage, see Equation (1); this voltage is sampled at 25 Hz (synchronized with the inertial channels).
Raw counts (0–4095) are normalized and passed through a software smoothing filter (moving/exponential average) prior to feature extraction. No on-board RC filter was used; was chosen to place the expected bend span near the mid-range of the ADC to maximize dynamic range and avoid saturation.
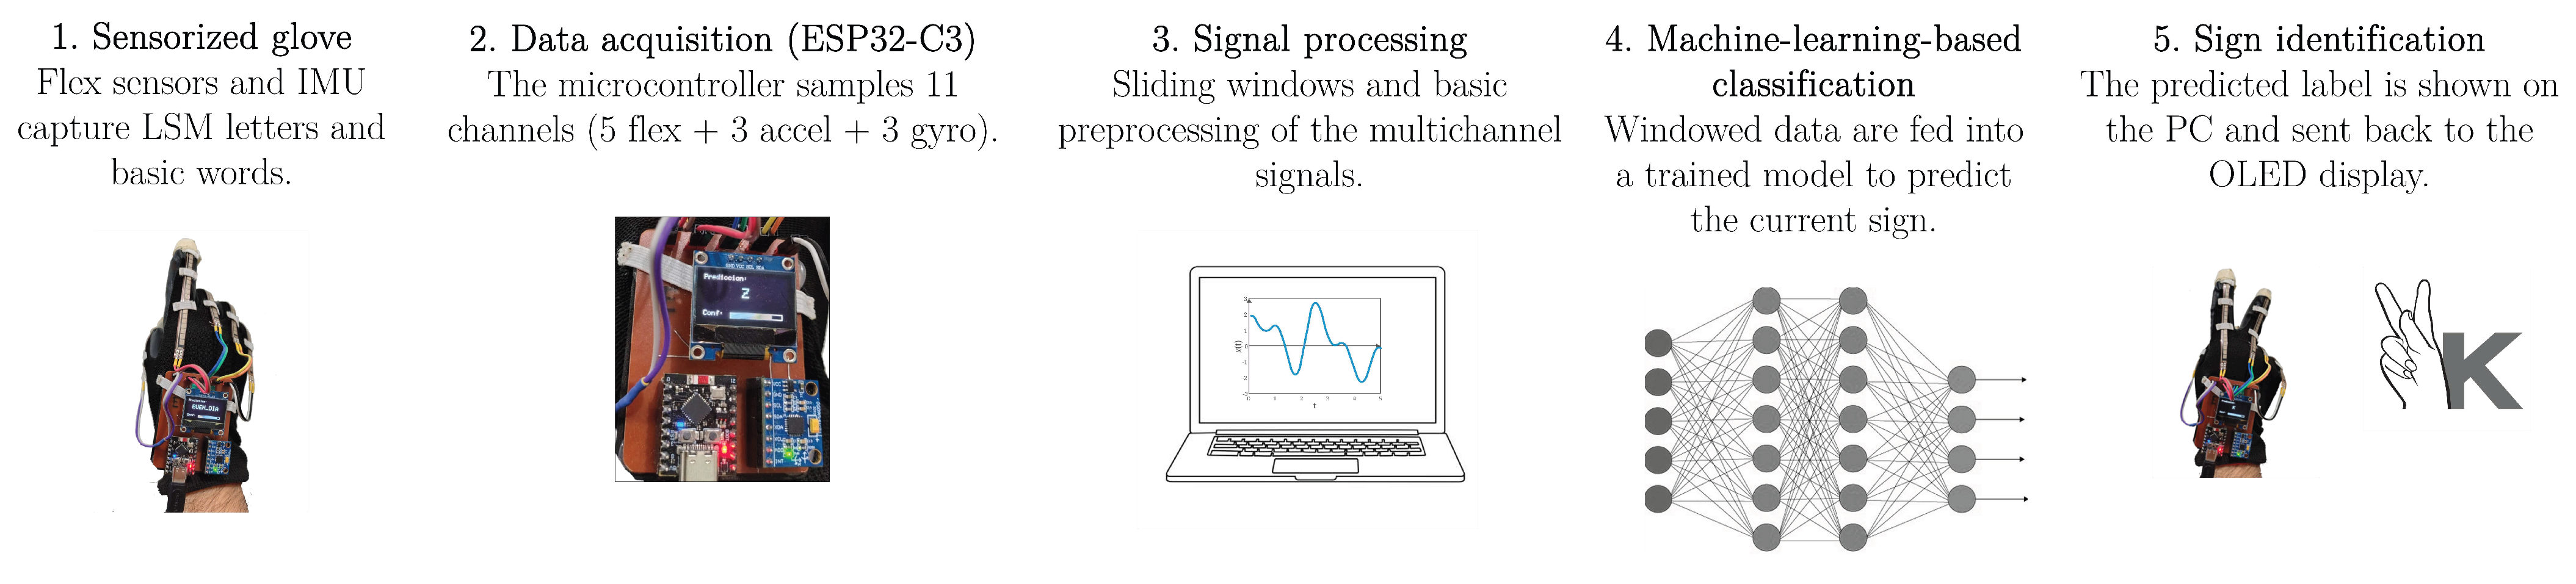
The glove streams an 11-channel vector (5 flex, 3 accelerometer, and 3 gyroscope signals) to a PC, where a ML-model performs classification on sliding windows of the incoming data. The predicted label is displayed on the serial monitor and is also sent back to the microcontroller to be shown on an OLED display mounted on the glove. This five-step pipeline is summarized in the following Figure 1.
Figure 1.
Pipeline illustrating on-glove sensing and PC-hosted inference with training on S1–S3 and testing on T: (1) sensorized glove with flex sensors and IMU, (2) data acquisition with the ESP32-C3 and wireless transmission to the PC, (3) signal processing using sliding windows, (4) ML-based classification, and (5) sign identification and feedback on the glove display.
2.3. Prototype Architecture
An ESP32-C3 microprocessor coupled to an IMU that offers three-axis accelerometer and gyroscope measurements is the basis of the LSM translating glove’s hardware architecture. Additionally, to record finger bending during gesture execution, five flex sensors are positioned on the thumb, index, middle, ring, and little fingers.
Five flex sensor readings plus six inertial signals (three accelerometer and three gyroscope axes) make up the 11-channel data stream that results from the acquisition of sensor signals at about 25 Hz. These signals are sent to a host computer, where the machine learning pipeline collects, preprocesses, and classifies gestures.
Before gesture acquisition starts, an initial calibration step is carried out with the hand at rest for around two seconds to increase measurement stability. This allows for the adjustment of the accelerometer and gyroscope offsets.
The resulting multichannel signal stream forms the basis for the dataset used in the subsequent feature extraction and classification stages.
2.4. Feature Extraction and Data Representation
2.4.1. Data Acquisition and Signal Structure
The wearable glove integrates five flex sensors and a 6-axis inertial measurement unit (IMU) comprising a three-axis accelerometer and a three-axis gyroscope. Signals were sampled at 25 Hz and transmitted via Bluetooth to a host computer for processing.
Each gesture was segmented using a sliding window approach with a window length of 1.2 s and a hop size of 0.25 s, yielding approximately 30 samples per window. This configuration ensures temporal stability while maintaining responsiveness suitable for real-time applications. The main parameters are summarized in Table 2.
Table 2.
Data acquisition parameters.
2.4.2. Feature Vector Construction
Feature extraction was performed independently for each sliding window. For each of the 11 signal channels, five statistical descriptors were computed:
- Mean
- Standard deviation
- Minimum value
- Maximum value
- Linear slope
This resulted in 55 primary features (11 channels × 5 descriptors). To enhance dynamic characterization of inertial data, additional features were computed from accelerometer and gyroscope signals. The complete composition of the feature vector is summarized in Table 3.
Table 3.
Feature vector composition.
The final representation consisted of a 68-dimensional feature vector per window. Before model training, features were standardized to zero mean and unit variance to ensure numerical stability across classifiers.
This structured representation provides a compact yet expressive encoding of both static hand configurations and dynamic motion characteristics.
2.4.3. Classification Models and Hyperparameter Configuration
Four classical machine learning algorithms were evaluated:
- Random Forest (RF)
- Support Vector Machine (SVM)
- K-Nearest Neighbors (KNN)
- Logistic Regression (LR)
Experiments were implemented using the Python library scikit-learn 1.8.0.
To ensure reproducibility, hyperparameters are explicitly reported in Table 4. All experiments were conducted with fixed random seeds to guarantee deterministic splits and model initialization.
Table 4.
Model hyperparameters.
2.4.4. Rationale for Model Selection
Although deep learning architectures have demonstrated strong performance in large-scale gesture recognition datasets, their effectiveness depends heavily on substantial participant diversity and high-volume labeled data.
The present study involves eight participants and a structured 68-dimensional feature space derived from statistical descriptors. Under these conditions, classical ensemble methods—particularly Random Forest—offer several advantages:
- 1.
- Robust generalization on small-to-moderate datasets.
- 2.
- Reduced risk of overparameterization.
- 3.
- Lower computational cost and latency.
- 4.
- Improved interpretability.
- 5.
- Feasibility for deployment on resource-constrained systems.
Given the dataset size and real-time constraints of the prototype, classical machine learning methods provide a more appropriate bias–variance trade-off than deep neural networks.
2.5. Recognition Algorithm
During training, different ML models in Table 4 were evaluated. The best performance was obtained with the RF model, which achieved an accuracy of 0.9655 in the test sessions. SVM-RBF came in a close second with 0.9617, followed by KNN and Logistic Regression, both with 0.9577. They were followed by Decision Tree with an accuracy of 0.9449, while Naive Bayes had the lowest performance with 0.4326.
At the class level, the system exhibited remarkable performance, with F1-scores close to 0.99–1.00 in nearly all categories. The RF provides greater resistance to session fluctuations without requiring prior scaling or assuming a certain distribution of data; the closeness of the SVM-RBF indicates that classes are not linearly divided. RF stands out because it combines non-linearity and resilience by combining multiple trees trained using bootstrap and random variable subspaces, which decreases variance and allows complex interactions between flex sensors and inertial data to be recorded. Furthermore, it requires minimal assumptions, does not need scaling, does not assume Gaussian distributions, and tolerates collinearities and mild outliers. Finally, the majority vote aggregation method of the SESSION split assessment system contributes to improved inter-session generalization by buffering changes in glove positioning and noise.
Good capture practices consider that, for static signs (A, B, NEUTRO), −1.2 s should be used without average acceleration energy, whereas for dynamic signs (Z, HOLA)—1.5 s is combined with an average acceleration energy in the range of approximately 2000–5000. In addition, it is recommended to collect between 100 and 150 windows per class and per session to promote model generalization. Regarding feature extraction, 55 features were computed per channel (), including mean, standard deviation (SD), minimum, maximum, and slope; for the accelerometer, additional features were added for example average acceleration energy, average magnitude of acceleration, variability of magnitude, correlation between axes, and zero crossing rate of the centered magnitude. For the gyroscope, average rotational energy, correlation between axes, zero crossings of the summation, sum of energies per axis.
Live prediction was performed using the corresponding script, which applies sliding windows, vote-based smoothing and probability averaging, a minimum confidence threshold, and optionally an echo to the OLED display. Its output prints the predicted label and its confidence to the console, while the OLED is updated. For operation, a mixed profile for static and dynamic signs is recommended, together with alternative profiles: a fast mode for static signs, a more stable mode for dynamic signs, and an ultra-fast mode. The approximate algorithmic decision delay or algorithmic latency follows and can be reduced by adjusting the sec and smooth parameters. As a proxy value, this parameter represents algorithmic delay; the end-to-end latency (from sign onset to stable OLED update) has not been measured.
The system segments 11 sensor channels (flex, accelerometer, gyroscope) into 1.2 s windows sampled at 25 Hz ( 30 samples/channel), with a 0.25 s hop generating 79% overlap for temporal continuity. From each window, 68 features (statistics, slopes, energies, correlations) feed a Random Forest classifier, whose outputs are smoothed and thresholded at 0.95 confidence before being transmitted for visualization.
Performance varies by gesture type: static signs (“A”, “B”) excel with 1.0–1.2 s windows, while dynamic gestures (“HOLA”, “Z”) require 1.5 s windows and accelerometer correlation features. Although Random Forest runs in real-time, SVM RBF offers the best accuracy-latency trade-off with the same 68 features. This sliding-window approach captures both static poses and motion dynamics across all channels.
The reason for this design is that motions tend to display local stationarity at intervals of 1.2 s, making it easier to discover regular patterns. Furthermore, for dynamic signs, such as the “Z”, the window combines their kinematic signatures (energy and correlation across axes), which is vital for distinguishing them. Finally, windowing offers fixed-size feature vectors, a crucial need for the supervised classification models utilized in the system.
An inter-session assessment technique was utilized with partitioning using Group-ShuffleSplit, where data windows were grouped by session. During a session, a participant completes the entire target sign protocol. Each participant’s data from three sessions—S1, S2, and S3—were used for training, and testing was conducted in a different session T. This prevents windows from the same session from showing in both sets, lowering the danger of overfitting. There were 28,837 windows in the training set and 5770 windows in the test set. This evaluation was performed offline (after training), using previously labeled data and without real-time feedback. The procedure involves turning on the glove and waiting ∼2 s for calibration, closing the serial monitor, and running the prediction script with the recommended parameters, capturing new windows and retraining if any signal fails.
Although inference runs on 1.2 s sliding windows (0.25 s hop) to enable low algorithmic latency operation, reporting is done at the sign level: all window predictions that belong to the same attempt are merged by majority vote with a 0.95 confidence gate and de-duplication of consecutive identical labels, yielding one decision per performed sign. We compute per-participant accuracy (mean ± SD across users) and derive uncertainty from participant/sign aggregates rather than individual windows.
To prevent data leakage, the partitioning was performed at the session level before window extraction, ensuring that windows from the same recording session were not shared across training and test sets. Since the same participants appear in multiple sessions, this setup evaluates robustness across different recording sessions rather than generalization to new users.
2.6. Experimental Design
Each participant completed three training sessions (S1–S3) and one testing session (T) on separate occasions. At the beginning of each session, the basic use of the glove was explained an individualized calibration of the resting point of the flexible sensors on the user’s hand was performed. This was achieved by asking the participant to slowly open and close their hand to capture the minimum and maximum flexion values and thus normalize the reading for each finger without altering the overall thresholds of the algorithm.
Subsequently, sign language exercises were carried out, in which each participant performed a series of 12 predefined signs taken from the alphabet and common vocabulary in LSM, selected in random order.
Table 5 shows the list of the 12 signs evaluated: 9 letters of the Spanish alphabet, 2 common words in LSM, and NEUTRO (hand at rest). These signs comprise two subsets: a static subset (A, B, C, E, L, NEUTRO [NEUTRAL]) and a dynamic subset (BUEN_DÍA [GOOD MORNING], HOLA [HELLO], J, K, Ñ, Z), allowing for comparison of the glove’s performance in both cases. The strategy of starting with a small set of letters or words is based on previous studies, e.g., [4,6,15,17].
Table 5.
Sign language catalog used in the sessions.
In practice, the user wearing the glove generated a letter of the alphabet or a word, which was then compared with the “target” signal that they wanted to recognize. For each sign, true positives (correct answers) and errors (false positives and false negatives) were recorded, from which the accuracy of the system was calculated. After the first session, participants repeated the 12 signs in a second session and finally performed them again in a third session.
With the collected data, quantitative metrics were calculated both per signal and globally (accuracy, recall, F1), as well as averages for static and dynamic signals. In addition, the confusion matrix, the learning curve, and usability questionnaires such as SUS and TAM were generated. The results obtained are presented below with the corresponding interpretation.
2.7. Usability Evaluation (SUS/TAM)
At the end of the glove testing, two standardized questionnaires were administered to all participants: (1) the System Usability Scale (SUS), consisting of 10 5-point Likert items to assess perceived usability, and (2) a questionnaire based on the Technology Acceptance Model (TAM), adapted for this context. The complete questionnaires are provided in Table 6 and Table 7.
Table 6.
System Usability Scale (SUS) items used in the usability evaluation.
Table 7.
Technology Acceptance Model (TAM) items adapted for the sign language translation glove evaluation.
Table 6 presents the individual item references (e.g., SUS9) used in the usability questionnaire. As shown in Table 7, the adapted TAM instrument comprises 14 items distributed across four constructs: Perceived Usefulness (PU1–PU4), Perceived Ease of Use (PEOU1–PEOU4), Attitude Toward Using (ATT1–ATT3), and Behavioral Intention (BI1–BI3). All items were rated on the same 5-point Likert scale. Cronbach’s alpha was calculated for each construct to assess internal consistency.
3. Results
All reported performance metrics correspond to the inter-session evaluation protocol described in Section 2.5.
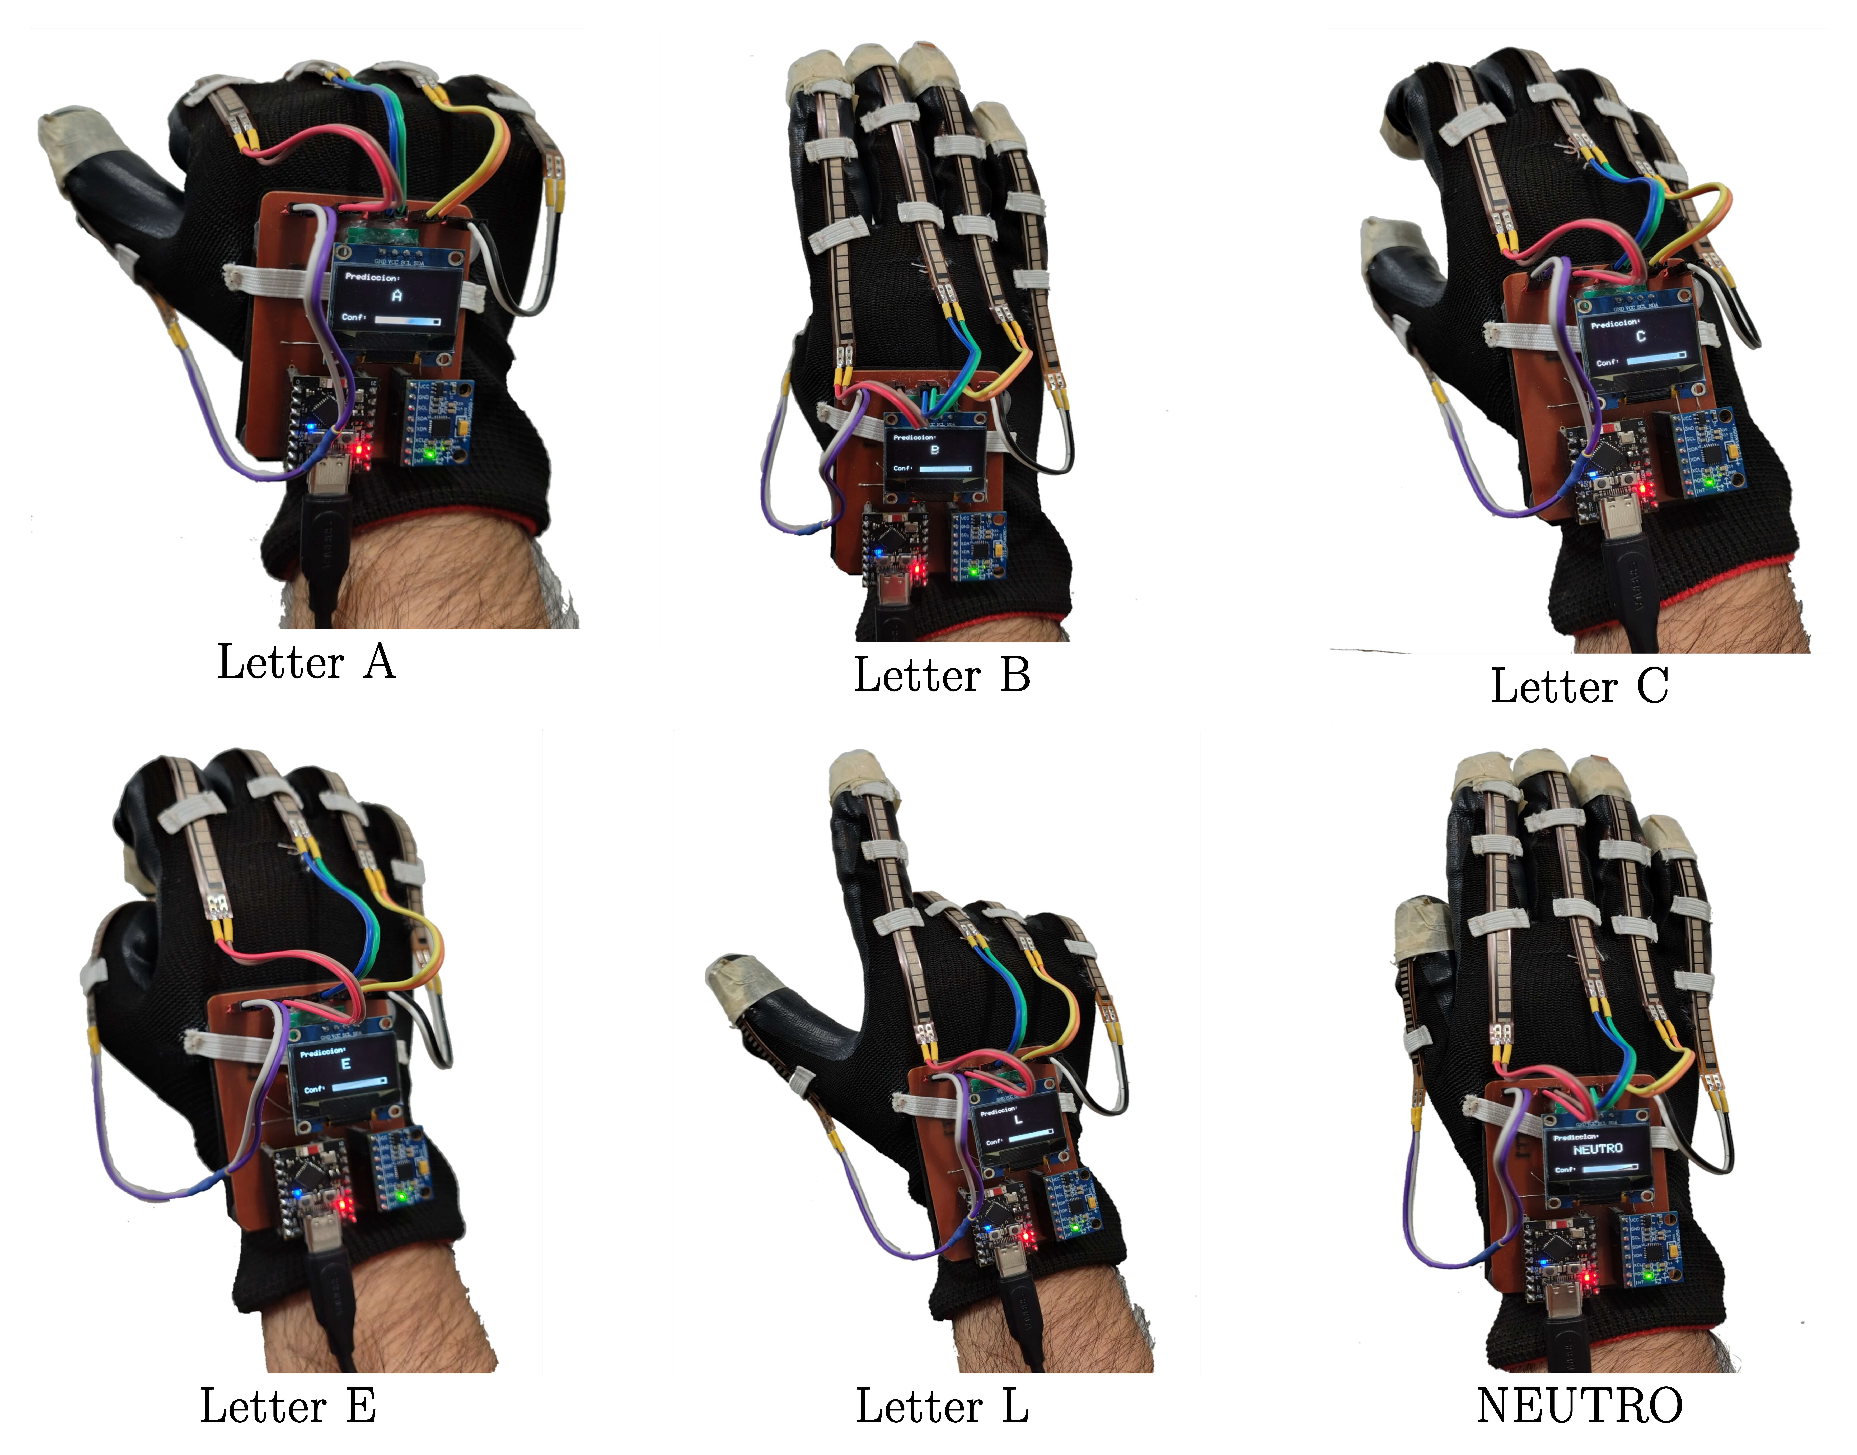
The static subset of signs from the LSM translator prototype is displayed in Figure 2. Five flex sensor, one for each finger as well as an MPU6050 inertial measurement unit coupled to an ESP32−C3 microprocessor are included into the wearable glove. While the IMU provides three-axis acceleration and gyroscope readings that describe hand motion and direction, the flex sensors record finger bending angles, giving information about hand posture. The microcontroller receives and processes these impulses to provide the multichannel data needed for gesture recognition.
Figure 2.
Static subset of the LSM translator glove with letters A, B, C, E, L and NEUTRO (see Supplementary Video S1).
The primary electrical components, including as the microprocessor, IMU, and LCD, are integrated on a phenolic board that also serves as structural support for the glove assembly. The microcontroller’s inbuilt ADC receives the analog signals that the flex sensors produce in response to finger bending. These signals are then processed and sent to the host system.
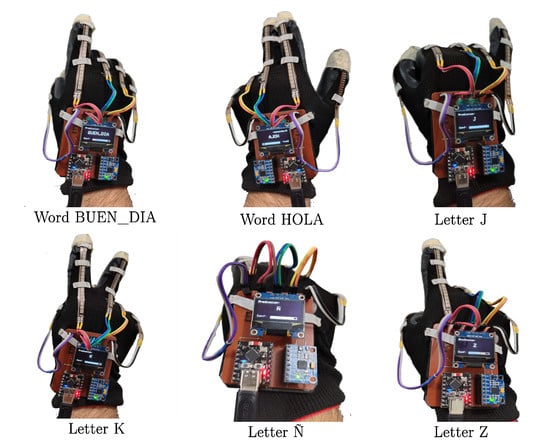
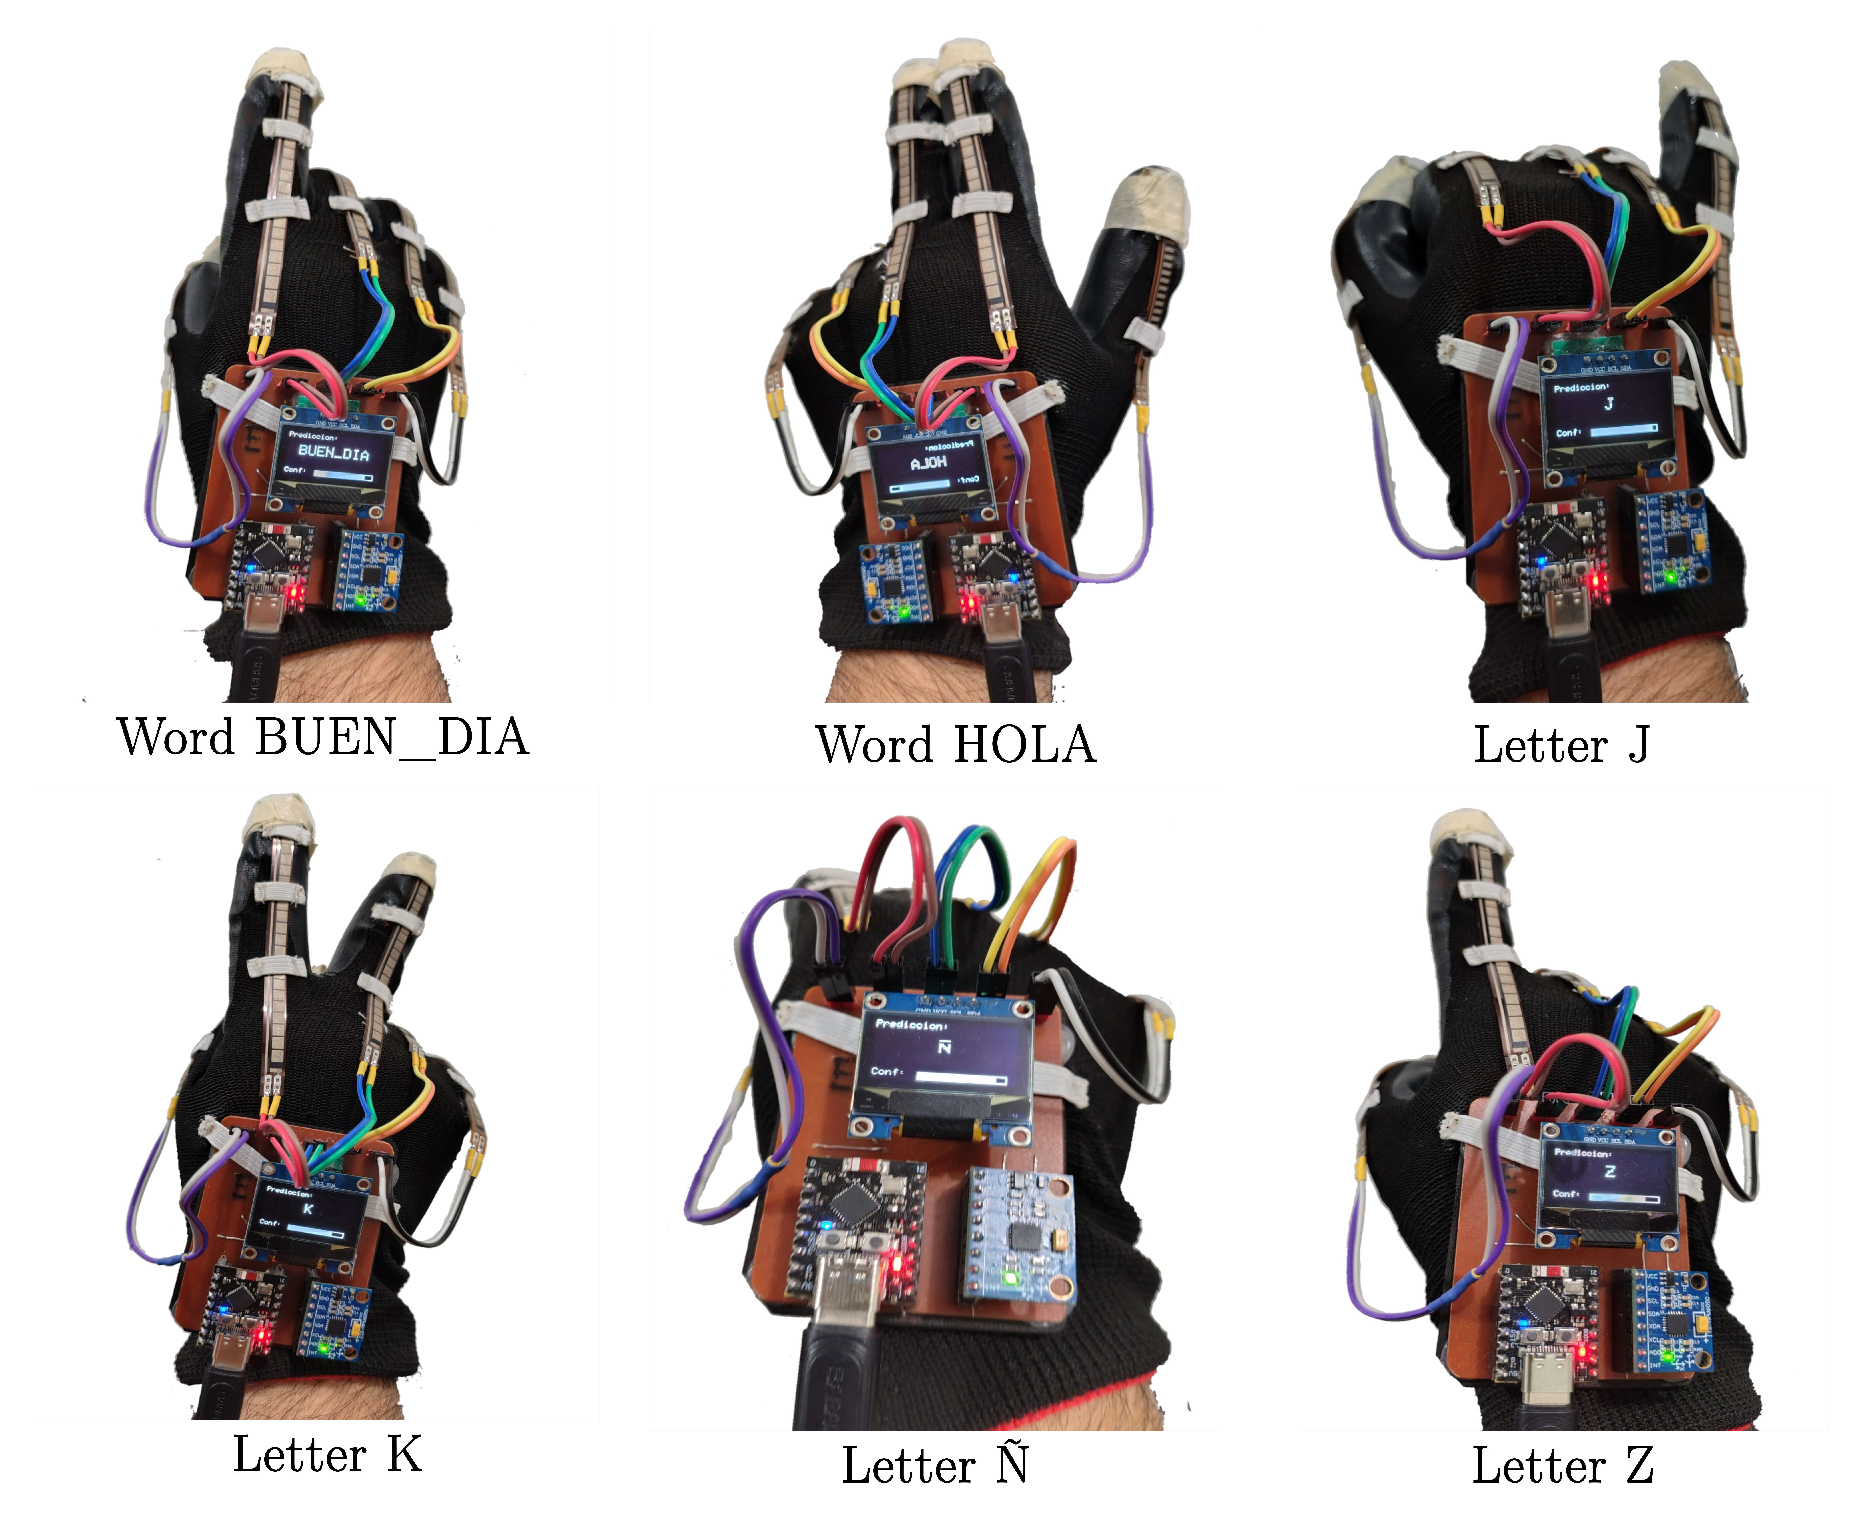
Similarly, Figure 3 shows the dynamic signals from the LSM translation glove.
Figure 3.
Dynamic subset of the LSM translator glove with words BUEN_DIA, HOLA and letters J, K, Ñ, Z. Short clips are provided in Supplementary Videos S2 and S3.
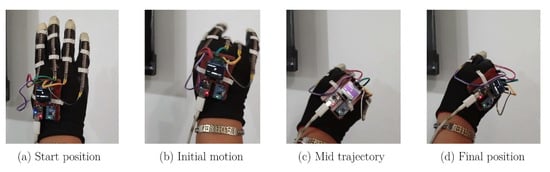
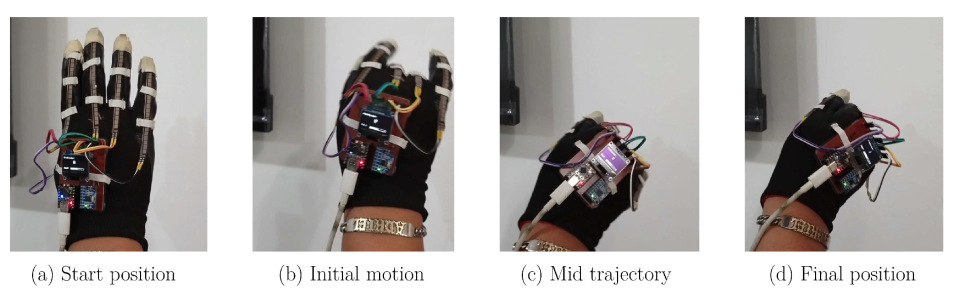
To facilitate visual interpretation of the gesture dynamics described in the sensor data, a representative example of a dynamic LSM sign is presented in Figure 4. The figure shows the sequential stages of the gesture “J” as performed with the instrumented glove, illustrating how the hand configuration and orientation evolve during the articulation of the sign. This visual reference complements the Supplementary Materials Videos and helps relate the physical gesture execution to the motion patterns captured by the sensing system.
Figure 4.
Representative frame sequence illustrating the execution of the dynamic LSM sign “J” using the instrumented glove. (a) Start position, (b) initial motion, (c) mid-trajectory, and (d) final position of the gesture. The sequence highlights the progression of the gesture as captured during articulation, providing a visual reference for the motion patterns later processed by the feature extraction and classification stages of the system.
3.1. Waveforms of Static and Dynamic Raw Signals Captured by the Glove
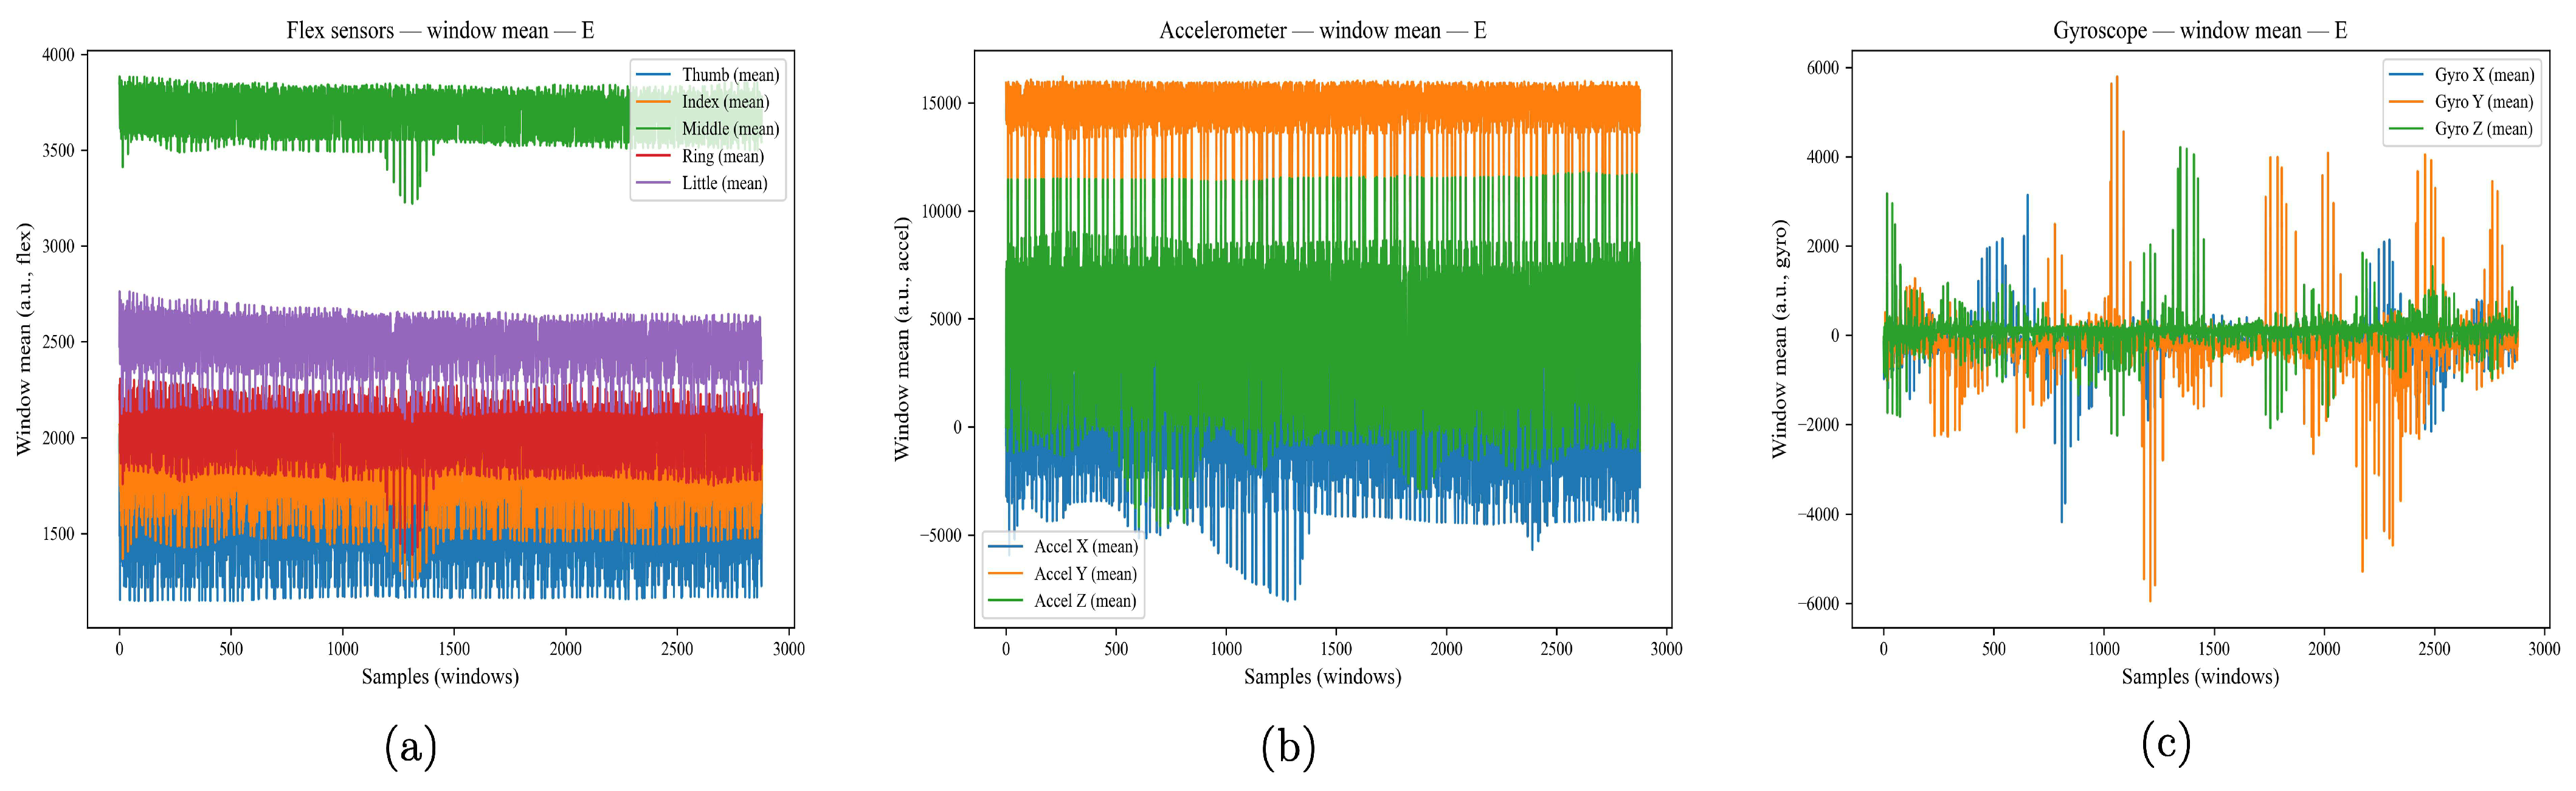
To confirm the quantitative findings, representative raw sensor waveforms obtained by the glove are displayed. The panels summarize the temporal structure used by the classifier by displaying the window means calculated from sliding windows of 1.2 s with a hop of 0.25 s on signals recorded at 25 Hz.
A static LSM sign (“E”) is shown in Figure 5. The five flex traces (thumb, index, middle, ring, and little) in Figure 5a rise to class-specific plateaus following a brief reach; the slight, high-frequency jitter represents sensor noise and micro-adjustments as the hand maintains the posture. The accelerometer window means for the X/Y/Z axes are shown in Figure 5b. There are no prolonged bursts of linear motion, except from a steady drift caused by orientation relative to gravity as the hand settles. The gyroscope window means for X/Y/Z are shown in Figure 5c, and they stay around 0 with just brief micro-movements, indicating that there is little rotational activity during the maintained position. When combined, these waveforms—stable flex plateaus with quiescent inertial signals—define static signs and provide an explanation for why flex characteristics predominate in their identification.
Figure 5.
Raw waveforms for a static LSM sign (“E”) captured by the glove. Each panel plots the window mean computed over 1.2 s sliding windows (hop 0.25 s) from signals sampled at 25 Hz. (a) Flex sensors stabilize at class-specific levels once the hand reaches the posture. (b) Accelerometer means show slow drift due to gravity/orientation but no motion bursts. (c) Gyroscope means stay near zero, confirming the absence of sustained rotation—typical of static signs exploited by the classifier.
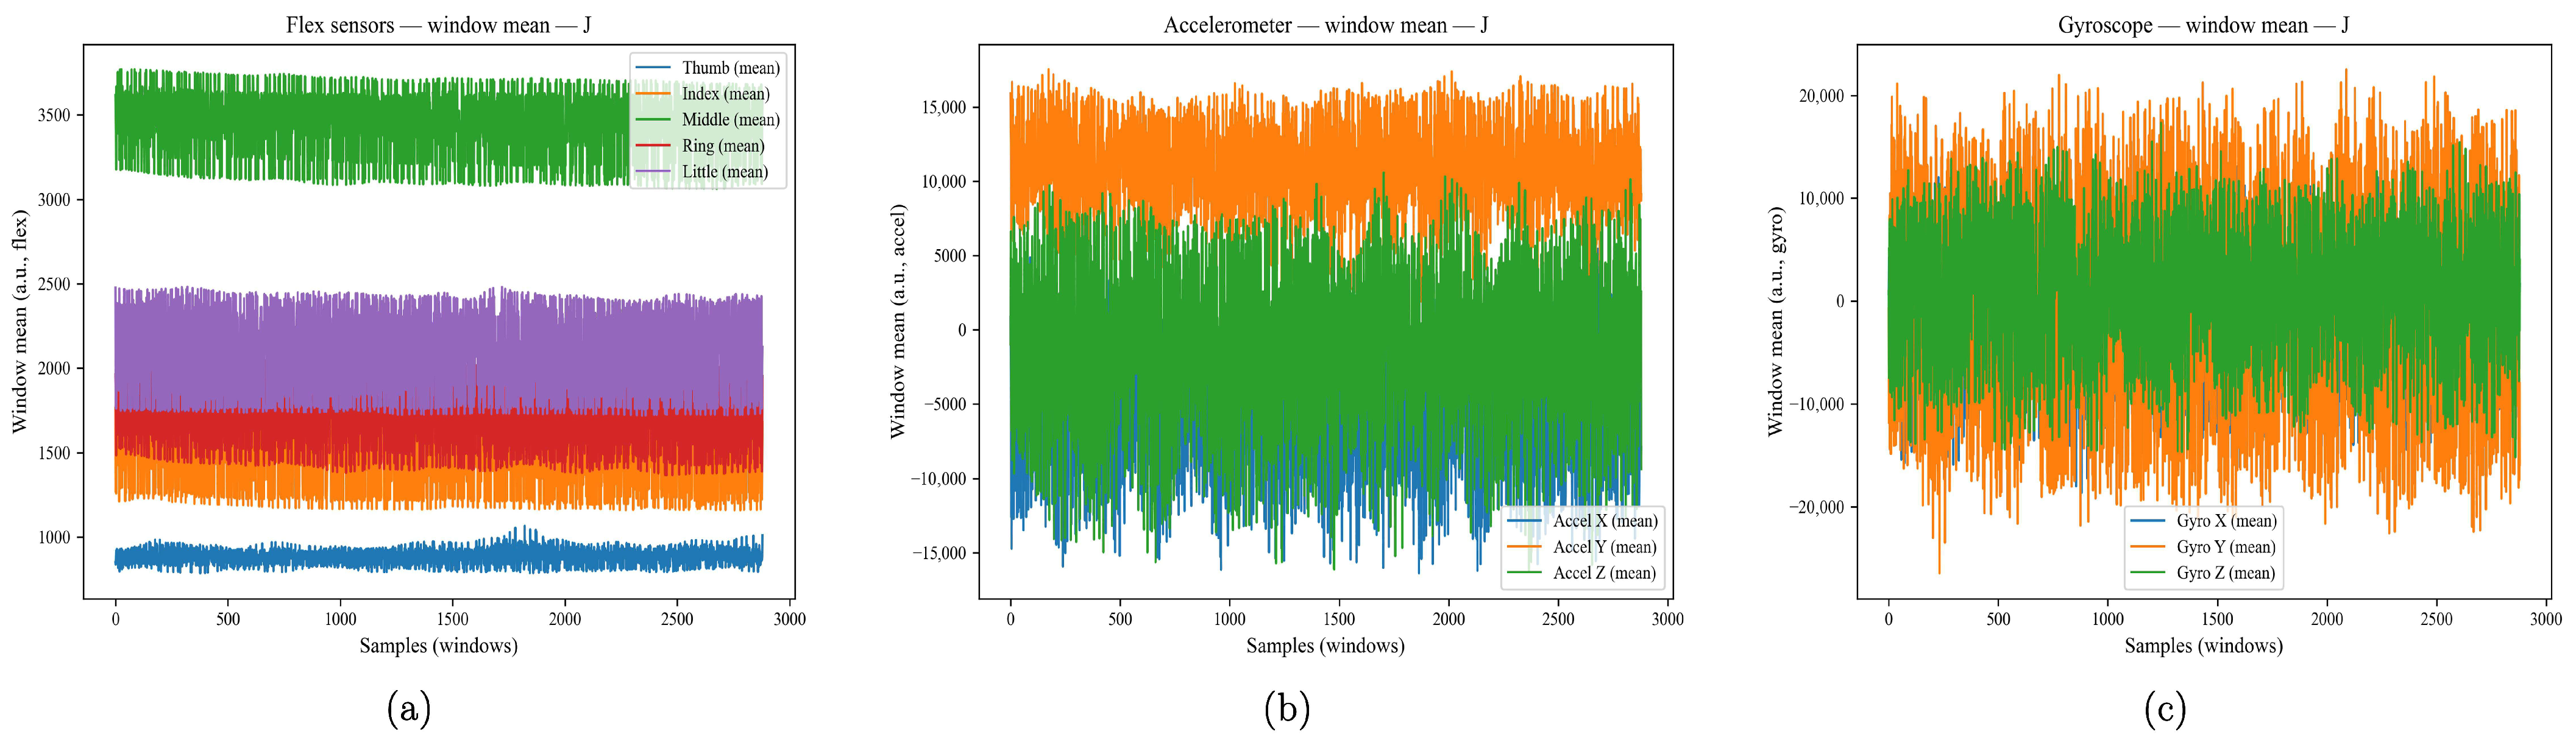
Figure 6 shows typical raw waveforms for a dynamic LSM sign to demonstrate dynamic behavior. Window means calculated from 1.2 s sliding windows with a 0.25 s hop on signals recorded at 25 Hz are displayed in each panel.
Figure 6.
Raw waveforms for a dynamic LSM sign (“J”) captured by the glove. Each panel shows the window mean computed over 1.2 s sliding windows (0.25 s hop) at 25 Hz. (a) Flex sensors (thumb, index, middle, ring, little): small posture adjustments with a larger excursion on the index. (b) Accelerometer X/Y/Z: motion bursts along the stroke. (c) Gyroscope X/Y/Z: alternating peaks capturing wrist rotations and direction changes—hallmarks of dynamic signs. Shaded regions may indicate analysis windows; a dashed line can mark the energy gate when used.
Figure 6 depicts the dynamic sign “J”. Figure 6a, the five flex traces (thumb, index, middle, ring, little) display modest shape changes—most notably a larger excursion on the index—while the remaining fingers stay near their baselines, indicating that handshape varies less than motion during the sign. Figure 6b shows the accelerometer window means (X/Y/Z): clear bursts appear at the onset and along the stroke, separated by short quiescent intervals as the path of the “J” is executed. The gyroscope window means (X/Y/Z) are shown in Figure 6c, with alternating positive and negative peaks that represent wrist rotations and direction changes. These peaks make up the sign’s most recognizable temporal characteristic. When combined, the traces demonstrate that inertial activity predominates in dynamic signs, with flex signals offering a handshape context for disambiguation.
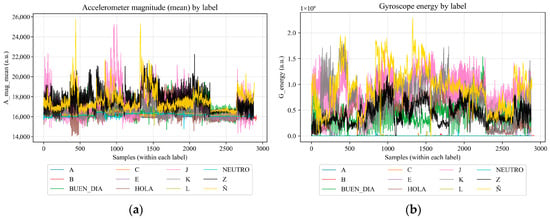
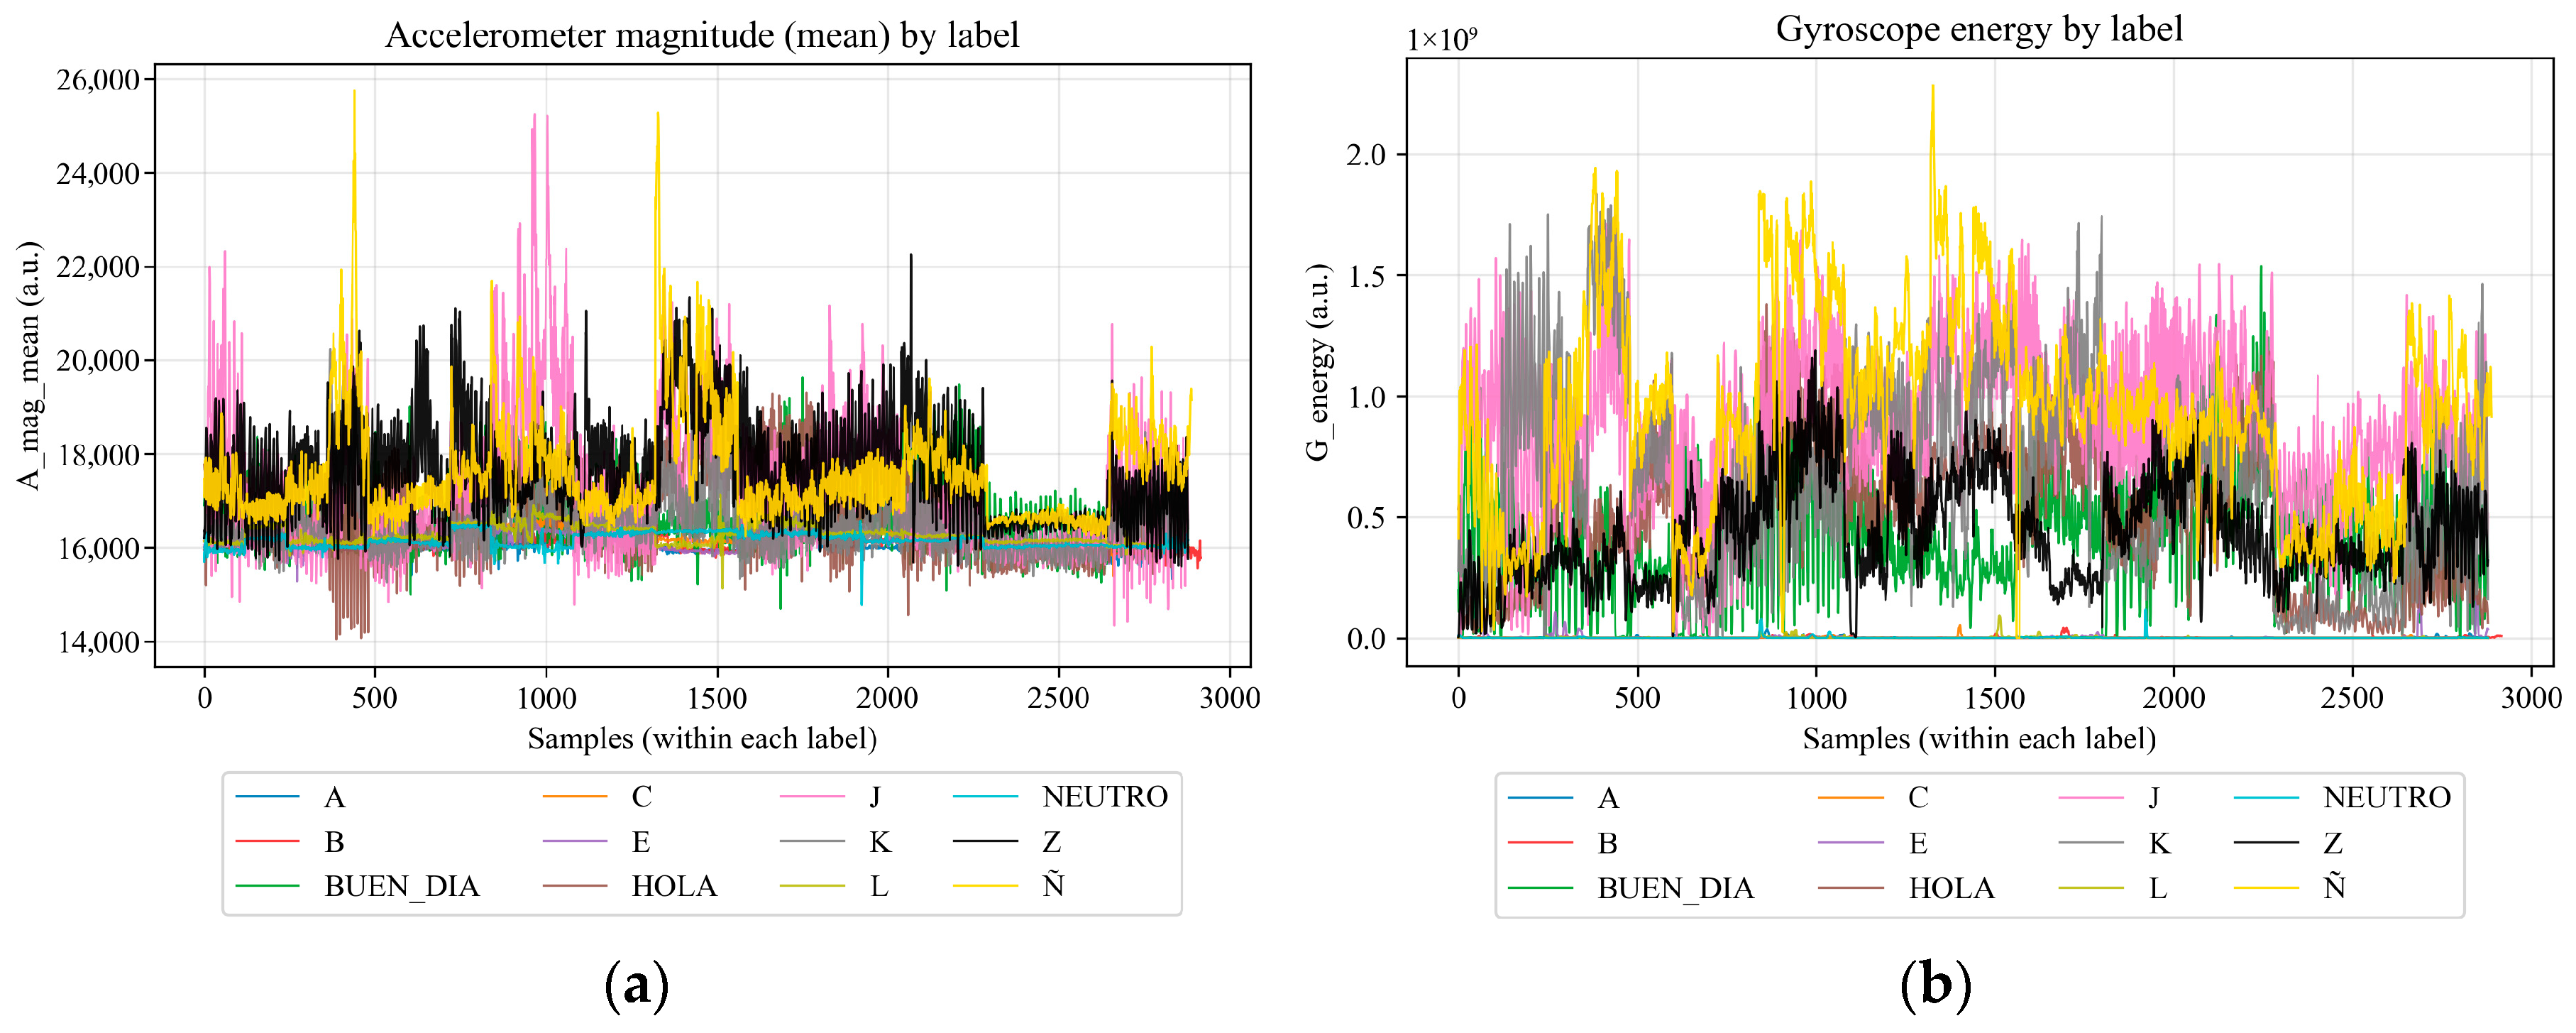
Figure 7 displays typical traces computed across 1.2 s windows with a 0.25 s hop at 25 Hz to summarize class-specific patterns in the window-level features utilized for recognition.
Figure 7.
Two window-level features’ class-wise traces were calculated from glove signals (1.2 s windows, 0.25 s hop, 25 Hz). (a) Accelerometer magnitude mean (A_mag_mean) by label: dynamic signs exhibit recurrent bursts, whereas static signs stay close to stable baselines. (b) Gyroscope total energy (G_energy) by label: static signs remain close to zero with the exception of tiny micro-movements, whereas dynamic signs concentrate the majority of the rotational energy. These patterns show how the classifier uses feature contrast to distinguish between static and dynamic LSM indicators.
The accelerometer magnitude mean (A_mag_mean) concatenated per label is shown in Figure 7a. While dynamic signals (e.g., HOLA, BUEN_DIA, J, K, Ñ, Z) show recurring bursts and higher plateaus that indicate translational motion throughout the stroke, static indications (e.g., E, NEUTRO, and static letters) cluster near relatively stable baselines with minor change. The gyroscope total energy (G_energy), which increases rotational activity, is shown in Figure 7b. Here, the difference is even more noticeable: static signs stay near the floor with the exception of fleeting micro-movements, while dynamic signs display sustained energy spikes and dense activity bands. When combined, these perspectives reveal why A_mag_mean and G_energy are discriminative: static classes have low energy and near baseline patterns, whereas dynamic classes display enormous, burst-like patterns in magnitude and energy.
3.2. Confusion Matrix and Metrics by Signal
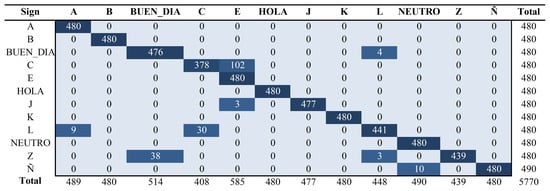
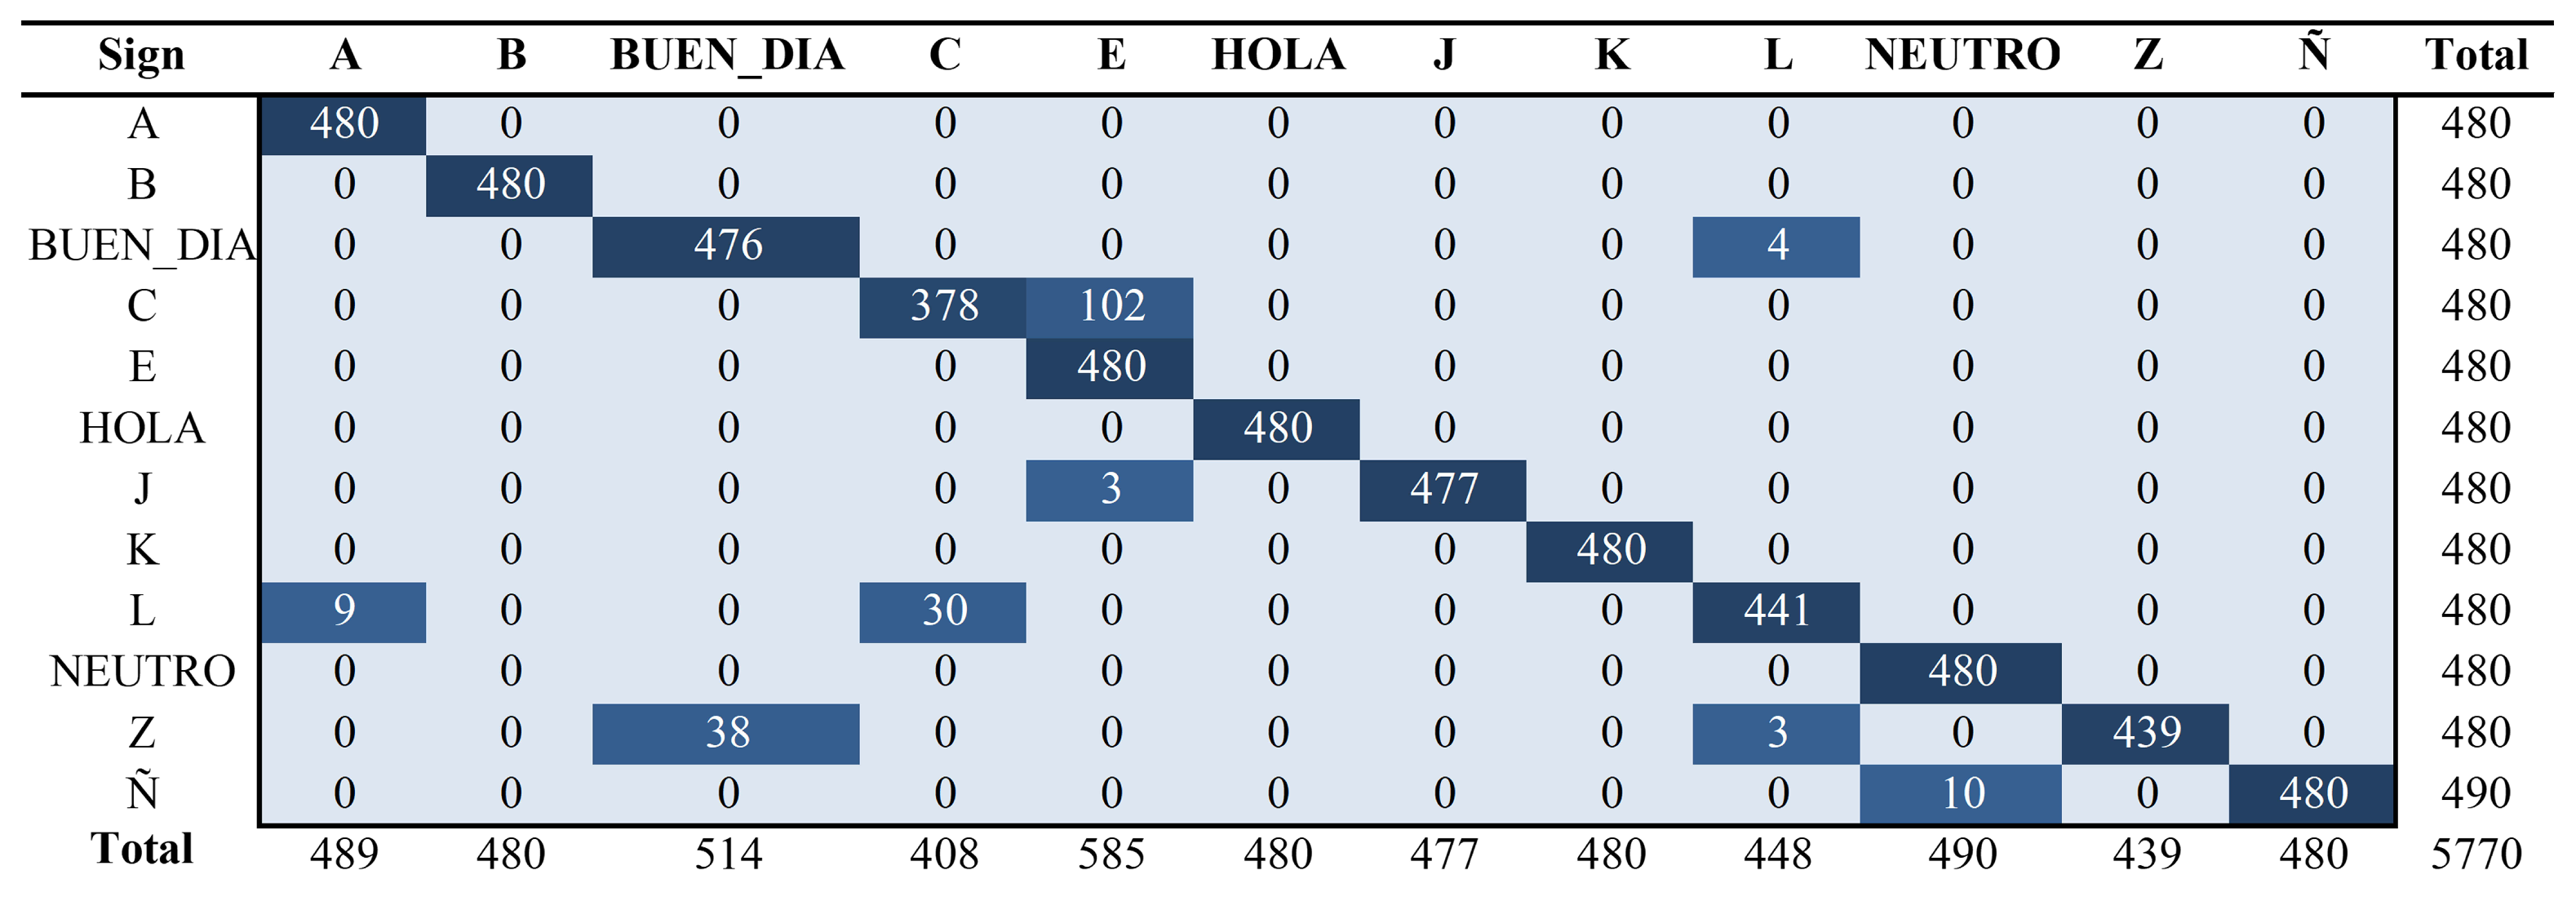
The confusion matrix for the 12 assessed LSM indications is shown in Figure 8. The majority of motions are accurately identified by the classifier, and the sensor characteristics obtained from the flex sensors and the inertial measurement unit effectively separate sign patterns, as seen by the matrix’s significant concentration of values along the main diagonal. The majority of static signs (such as A, B, E, HOLA, and K) exhibit almost flawless categorization with no discernible confusion, indicating that highly discriminative sensor signatures are produced by steady hand positions. A tiny percentage of signals with somewhat identical shapes or motion characteristics are misclassified.
Figure 8.
The 12 Mexican Sign Language signals’ confusion matrix reveals a high concentration along the major diagonal and very few systematic confusions between signs with comparable hand forms or motion patterns.
For example, sign C can sometimes be confused with sign E due to similar finger curvature patterns recorded by the flex sensors. Similarly, there is some misunderstanding between the dynamic sign Z and BUEN_DIA and, to a lesser degree, with L. Variations in motion amplitude or speed between sessions might affect the inertial signatures recorded by the accelerometer since Z relies on a continuous trajectory tracked in the air.
Overall, there are only minimal and understandable confusions between indicators with similar anatomical or kinematic qualities, and the matrix clearly demonstrates diagonal dominance. This behavior supports the efficacy of the suggested sensing and classification pipeline under the controlled assessment settings taken into consideration in this work, as evidenced by the high accuracy, recall, and F1-score values provided in Table 8.
Table 8.
Window-level precision, recall, and F1-score per sign on the test set. Support indicates the number of window samples (1.2 s sliding windows with 0.25 s hop). Performance metrics are computed at the window level. Where indicated, sign-attempt-level precision is obtained by aggregating window predictions via majority vote.
3.3. Window-Level Metrics and Overall Performance
The metrics for precision, sensitivity (recall), and F1-Score for each sign are shown in Table 8. With average values for precision, recall, and F1 equal to 0.97, the table of metrics by class for the LSM translating glove project indicates exceptional overall performance. In this regard, the system has demonstrated excellent consistency and balance when it comes to correctly identifying signals. Most classes demonstrate near-perfect performance, especially in static and well-defined motions, showing a consistent pattern in data acquisition and model generalization.
On their own, many signals are successful or almost effective. Classes B, HOLA, and K receive precision, recall, and F1 ratings of 1.00, indicating error-free classification. Signs A, NEUTRO, and Ñ also show very high metrics, with F1 ranging from 0.99 to 1.00, indicating that the IMU and the flex sensors both accurately capture their unique characteristics. Sign J performs remarkably well, with an F1 of 1.00, and is only marginally affected by three false negatives.
Signs with considerably lower performance still have metrics that are acceptable, but due to their dynamic component or sign similarities, they present some inherent difficulties. BUEN_DIA exhibits several false positives for signs with comparable postures, having an F1 score of 0.96. The L sign’s F1 score of 0.95 is impacted by confusion with gestures using similar finger combinations. The dynamic Z sign, on the other hand, maintains a perfect prediction of almost 1.00, indicating that the model correctly predicts Z; yet, due to variations in the movement’s shape or speed, it obtains a recall of 0.91.
With an F1 score of 0.85 and a large number of false negatives of 102, the only class with significantly inferior performance is C. This indicates that its characteristics overlap with those of other signs, particularly E, because of hand curve similarities. Although this result is within a respectable range, it suggests that it might be enhanced by improving the inertial properties or increasing the variety of the training data.
Overall, the Table 8 shows that the translating glove system is quite successful, with consistent performance across classes, a good balance between recall and precision, and just a few particular areas that may need more data collection or model modifications. These findings validate the efficacy of the models employed to accurately interpret Mexican Sign Language, the resilience of the capture process, and the value of the 68 retrieved characteristics.
3.4. Accuracy of Static vs. Dynamic Signs
Table 9 shows that the prototype translation glove achieves very high overall performance, with a total accuracy of 97%, derived from 5571 correct answers out of 5770 attempts. The 95% Wilson confidence interval remains narrow—between 0.96 and 0.97—confirming the stability and consistency of the system’s overall performance. When comparing the behavior between types of signs, it can be seen that static signs (mainly from the manual alphabet) achieved an accuracy of 95%, with a confidence interval between 0.94 and 0.96, reflecting solid performance despite variations in finger posture. On the other hand, dynamic signs, belonging to the moving vocabulary, achieved an even higher accuracy of 98%, with a confidence interval between 0.97 and 0.98, indicating that the system interprets signs containing kinematic information captured by the IMU with particular effectiveness. Taken together, these results confirm that the prototype offers accurate and reliable interpretation for both static and dynamic signs, with superior performance in those involving movement.
Table 9.
Translation system performance.
3.5. Learning Curve
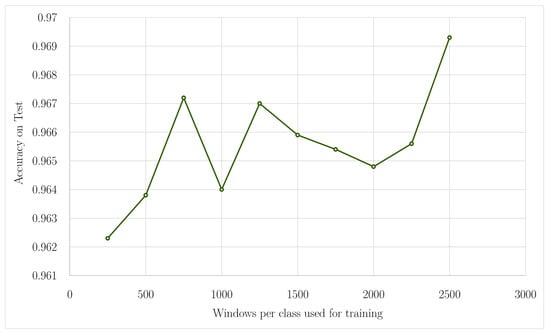
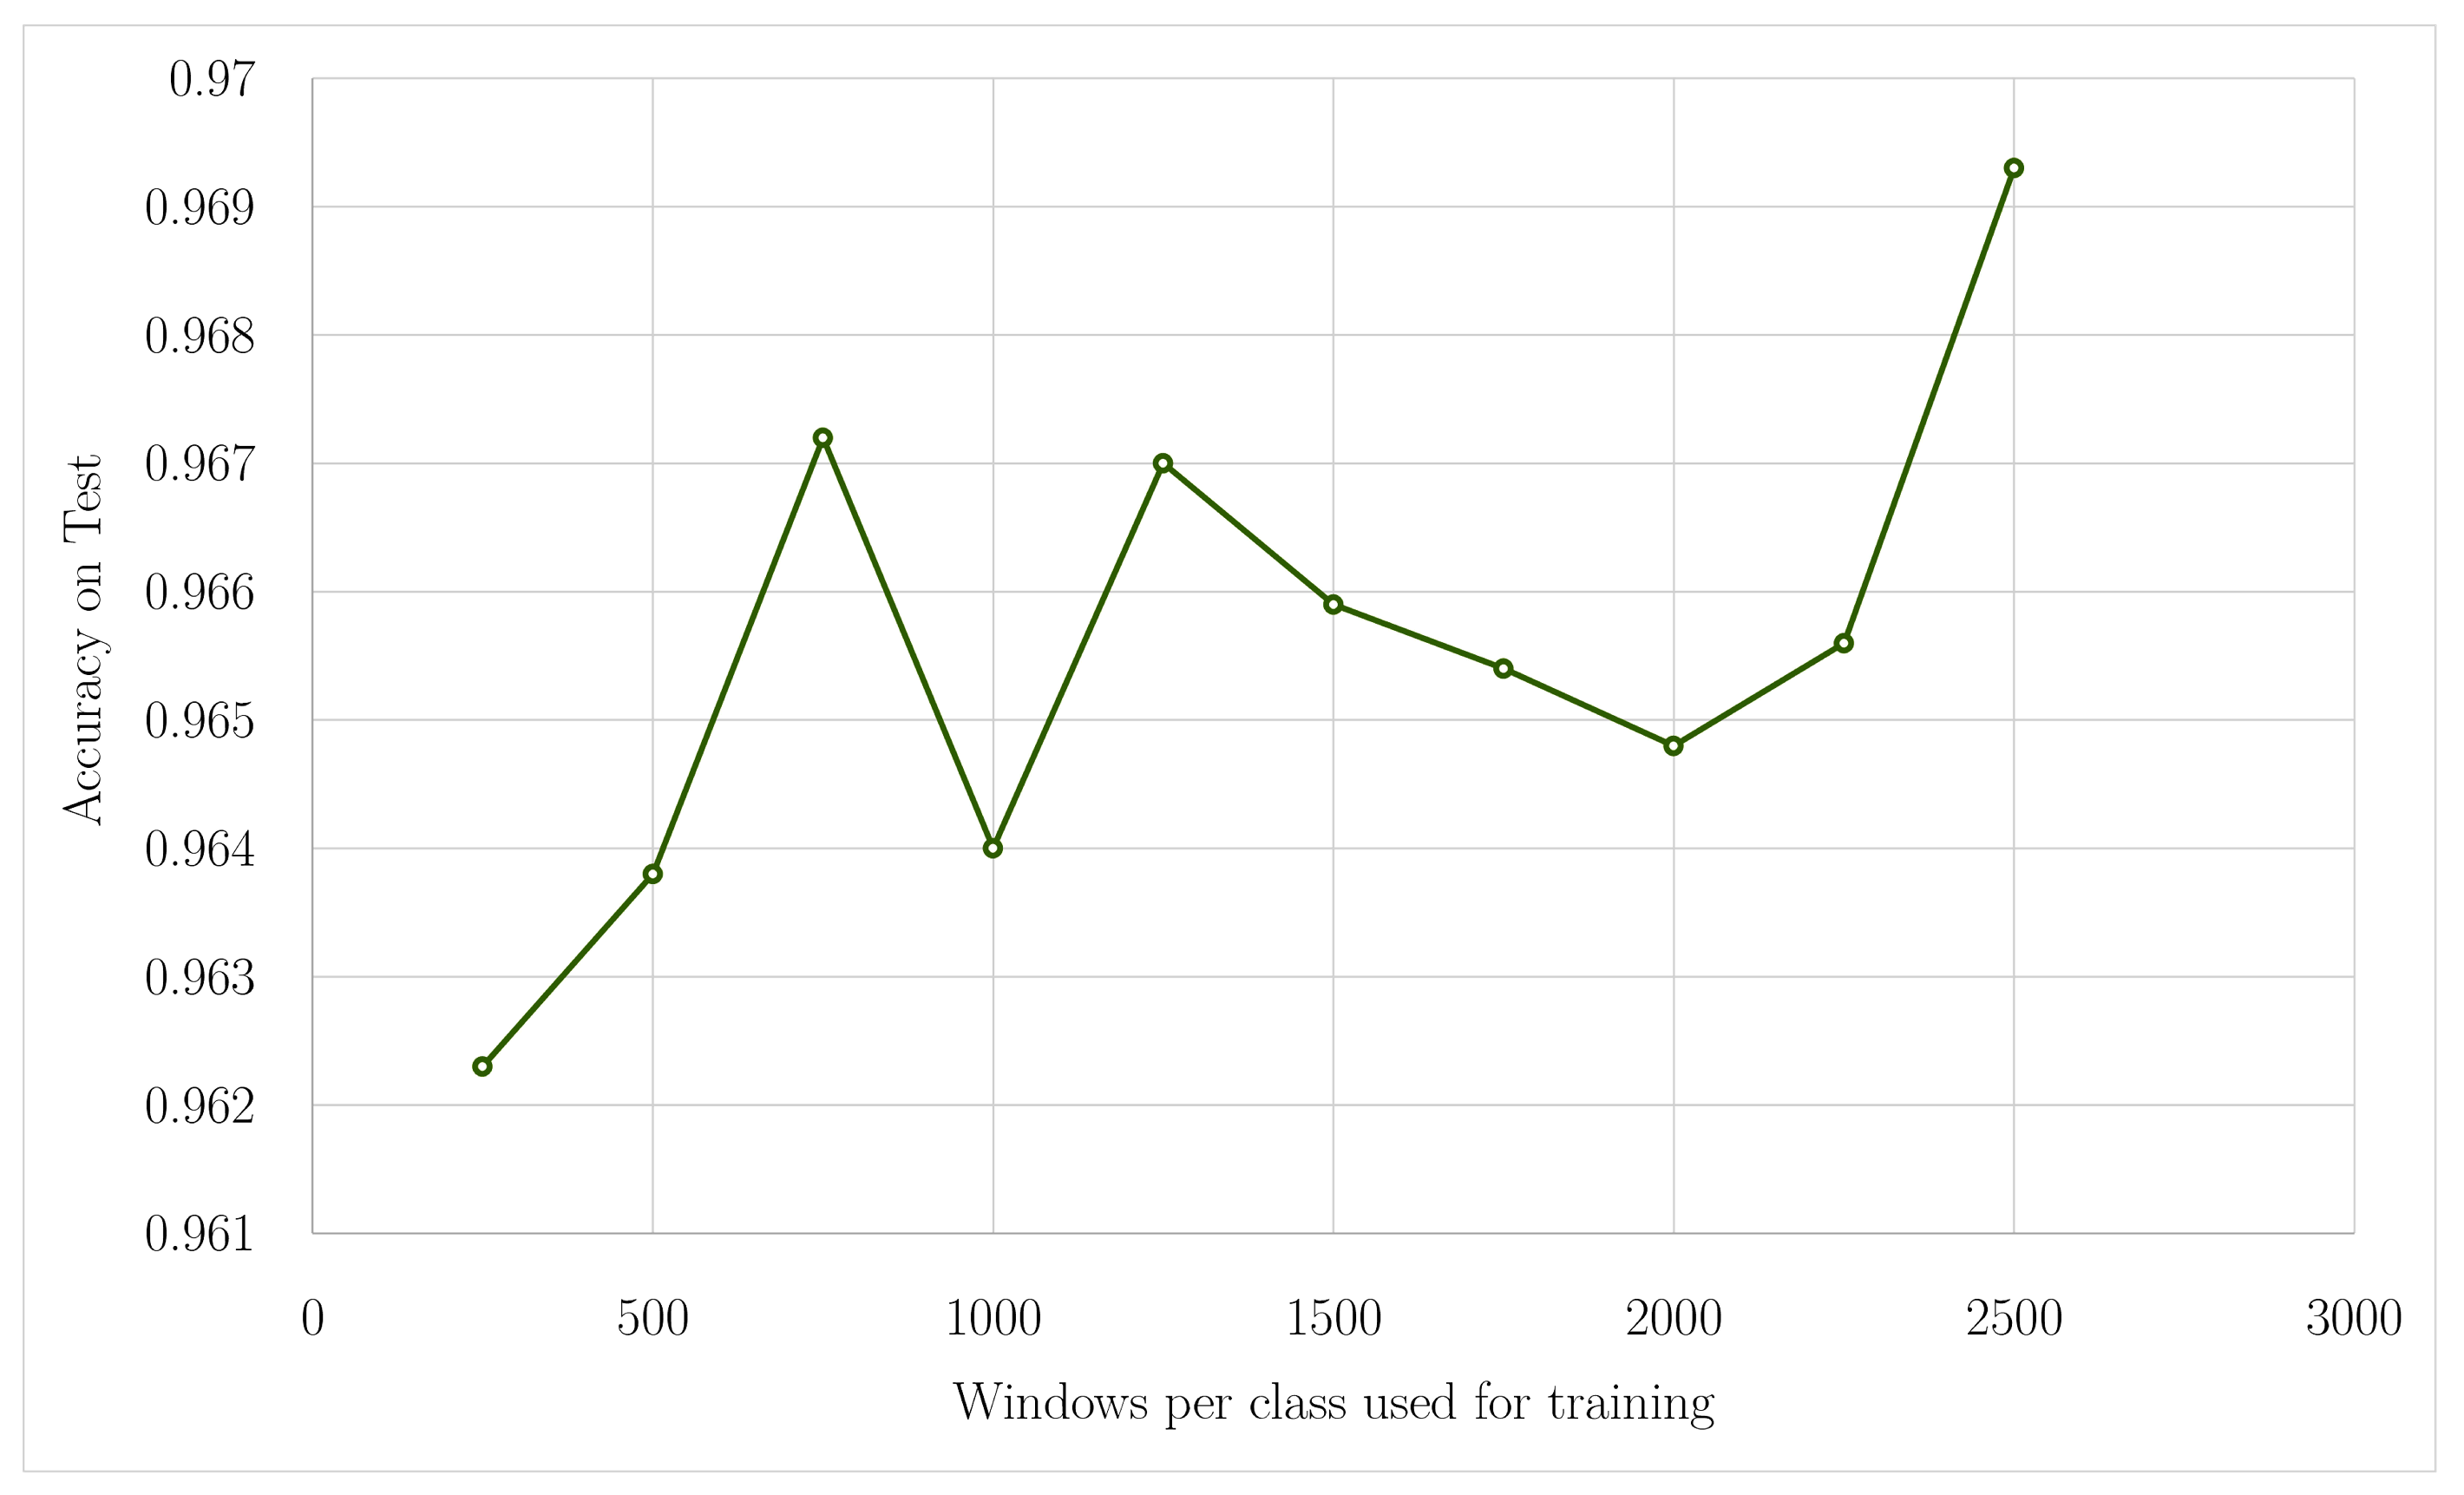
Figure 9 depicts the learning curve of the model as a function of the number of windows per class used during training, and represents how accuracy on the test set changes as the amount of accessible data rises. The model is able to learn strong patterns even with very low quantities of data, as seen by the curve’s generally high and steady accuracy values, which are all above 0.962.
Figure 9.
Test accuracy of the translation model as a function of the number of training windows per class. Increasing the amount of data per sign keeps accuracy consistently above 0.962, with a slight improvement as the training set grows and a peak around 2500 windows per class.
Initially, there was a continuous increase in performance between 250 and 750 windows per class. This performance reaches a maximum close to 0.967, which represents a significant improvement in the model’s ability to generalize. As a consequence, around 1000 windows, there is a temporary decrease in accuracy. This is a common trend in learning curves when the model faces increased variability or complexity in additional data. When the number of windows is increased to approximately 1250, performance rises again to reach a similar peak, confirming that the model benefits from a greater number of representative examples.
From 1500 windows onwards, the curve enters a phase of slight sustained decline until 2000 windows, possibly associated with the incorporation of examples with greater intra-class variability that require more data to consolidate patterns. Finally, after exceeding 2200 windows, accuracy rises sharply again and peaks at around 2500 windows, with a value of 0.970, indicating that the model continues to improve as the training set expands. Overall, the figure shows that the model maintains remarkably high performance throughout all phases of training and that its optimal performance is achieved with larger and more balanced data volumes per class.
In addition, participants’ experience using the prototype was evaluated using standardized questionnaires, the results of which are summarized below.
3.6. SUS Questionnaire Results
At the end of the experimental sessions, participants completed the System Usability Scale (SUS). Responses were scored following the standard SUS procedure: positively worded items (1, 3, 5, 7, and 9) were scored as , and negatively worded items (2, 4, 6, 8, and 10) as . The resulting item scores (0–4) were summed (0–40) and multiplied by 2.5 to obtain the final SUS score on a 0–100 scale [31,32].
As shown in Table 10, individual SUS scores ranged from 50 to 55, with a mean value of 50.6 ± 1.8. According to conventional SUS benchmarks, this result corresponds to a marginal level of usability. Although the standardized SUS score indicates room for improvement, participants consistently assigned high ratings (4–5) on the original Likert scale. This apparent discrepancy can be explained by the structure of the SUS instrument, which alternates positively and negatively worded statements, penalizing uniformly high ratings on negatively worded items, despite a positive subjective experience.
Table 10.
System Usability Scale (SUS) results after standard scoring conversion.
Overall, these results suggest that users perceived the prototype positively and accepted its use, while the SUS highlights specific usability aspects that should be refined in future iterations of the system. Given the pilot nature of the study and the small sample size (N = 8), these findings should be interpreted as preliminary indicators rather than definitive usability estimates.
3.7. TAM Questionnaire Results
According to Table 11, the following results were obtained from the TAM questionnaire, with a Likert scale from 1 to 5 and analyzed with Cronbach’s alpha for internal consistency: In the Perceived Usefulness measure, scores ranged from 16 to 20 points per participant, with little variability across items (0.27–0.29), suggesting fairly uniform responses. Cronbach’s alpha was good (0.87), indicating that the items in the block consistently measure perceived usefulness. Overall, participants considered the device relevant to their reality.
Table 11.
The TAM questionnaire results for participants (P01–P08).
Regarding perceived ease of use, individual scores ranged from 16 to 20, with little dispersion. Cronbach’s alpha coefficient reached a value of 0.93, indicating a high level of consistency in the responses obtained. This demonstrates that participants considered the glove to be intuitive and easy to use.
Regarding Attitude Toward Using, scores ranged from 12 to 15 points, with low variance. Cronbach’s alpha was 0.86, indicating good reliability. This suggests that perceptions of the device were positive and consistent among participants, who showed a willingness to work with the technology.
Finally, regarding behavioral intention, scores ranged from 12 to 15 points, with little variability. A Cronbach’s alpha of 0.87 was obtained, indicating good internal consistency of the instrument. These results indicate that participants not only reacted positively but also expressed an intention to continue using the glove in the future.
The four constructs measured (utility, ease of use, attitude, and intention) have Cronbach’s alpha values between 0.86 and 0.93, indicating acceptable to excellent levels of internal consistency. This means that the scales are reliable and yield consistent responses from the participants. Interpretation: Regarding usability, the device is widely accepted, with ease of use being the highest-rated aspect ( = 0.93).
3.8. Comparison with Similar Devices
The following Table 12 shows a comparison of current technologies reported in the literature with our proposal in terms of sensing modality, target sign language, vocabulary or task, and accuracy.
Table 12.
Comparison with related sign language recognition systems using wearable or vision-based technologies.
Comparing the work summarized in Table 12, the proposed prototype achieves a performance level very close to the best results reported for glove-based and inertial sign language interfaces. While several studies have reported high accuracy for ASL or other sign languages using wearable IMUs and DL models (e.g., sentence recognition with accuracies exceeding 94% in [4,6] and letter-level recognition reaching approximately 98% in [17]. These solutions are tailored to different languages and often rely on more complex configurations or laboratory motion capture systems. Vision-based approaches, such as those combining MediaPipe and CNN for fingerspelling in ASL or LSM for example [15,30], also achieve good results, but they depend on camera placement and environmental conditions, and are more difficult to integrate into classrooms with limitations.
In this context, our prototype excels in three key areas. First, it concentrates on Mexican Sign Language, which is still underrepresented in the literature as compared to ASL or Indian Sign Language, and it does so with a concise vocabulary that blends alphabetic and dynamic signals that are directly relevant to engagement in higher education. Second, the system functions with a modest hardware design (five flexible sensors and a single IMU on an ESP32-C3 board), obtaining an overall accuracy of 97.0% (95% confidence interval: 0.96–0.97), with notably strong performance for dynamic indicators. This puts it in the top range of claimed accuracies for glove-based systems, while having fewer sensing channels and an integrated microprocessor rather than a high-end processing unit. Third, this study systematically assesses the technology’s usability and acceptance with students with and without hearing impairments who are proficient in LSM, obtaining high scores on the SUS and the TAM, and having satisfactory internal consistency, in contrast to many prior studies that only concentrate on recognition accuracy.
Taken together, these differences suggest that the proposed glove is not only technically competitive but also specifically tailored to the requirements of inclusive higher education, bridging the gap between proof-of-concept recognition systems and assistive devices that can be realistically adopted in university classrooms.
4. Discussion
In a controlled inter-session assessment context, this pilot research offers initial proof of the technological viability of a wearable sensor-based glove for LSM detection. In order to evaluate generalization across recording sessions while avoiding temporal data leakage, the experimental approach comprised three training sessions and one held-out assessment session per participant. The system demonstrated consistent classification performance for the limited 12-sign vocabulary examined in this investigation, achieving a window-level accuracy of 97% under these circumstances.
Even though a 3% or error rate suggests that misclassifications could happen, these errors need to be evaluated in the context of the controlled experimental environment and limited vocabulary. Therefore, rather than complete real-world resilience, the results show proof of concept. It has yet to be determined how well students do in educational settings that are both ecologically valid and speaker-independent.
When evaluating these results, a number of restrictions should be taken into account. First, the sample size was small (N = 8), and the participant—rather than the segmented signal window—is the effective unit of generalization. As a result, the reported accuracy need to be regarded as preliminary. Second, the vocabulary was limited to 12 LSM signals, which does not adequately represent the contextual variety, coarticulation, or linguistic complexity of full-scale sign language conversation. More research is needed to determine scalability to bigger lexicons and more complicated sequences.
Bidirectional communication is another restriction. The present prototype does not include a hearing-to-deaf channel and only concentrates on deaf-to-hearing translation. A more all-encompassing inclusive approach might incorporate LSM output systems (such as avatar-based visualization) or speech-to-text modules, allowing for reciprocal participation in classroom settings. These enhancements will be investigated in next system versions.
Increasing the amount of recognized signs, enhancing the ability to distinguish between motions that are kinematically identical, and adding more sensors (such as a second glove for bimanual articulation) are all anticipated technical advancements. To enable extended classroom usage, improvements in hardware integration, power economy, and ergonomics are also required.
Controlled studies are scheduled for the near future to assess the system’s effects on academic performance and communication in actual classroom settings. Incorporating instructor and peer feedback, these studies should evaluate learning results, engagement metrics, and subjective experiences between users and non-users.
From the user-experience perspective, SUS results indicated marginal usability, suggesting that iterative, user-centered refinement is required prior to broader deployment. Importantly, usability and acceptance measures (SUS and TAM) assess perceived interaction quality and technology adoption, and are methodologically independent from the machine learning classification performance metrics reported above. Nevertheless, TAM responses and qualitative feedback indicated perceived usefulness and a willingness among participants to continue using the prototype. Participants reported a perceived increase in communicative autonomy during simulated or controlled interaction scenarios. While these perceptions are encouraging, they should be interpreted as exploratory findings rather than definitive evidence of long-term educational impact.
Overall, the present work demonstrates the feasibility of low-cost wearable architectures for controlled LSM recognition and provides a structured foundation for subsequent speaker-independent validation, vocabulary expansion, and classroom-based impact studies. The results should therefore be understood as an initial step toward the integration of wearable assistive technologies in inclusive higher education settings.
Limitations of the Study and Future Work
The results of this study should be interpreted within the scope of the current experimental design. First, the participant cohort was limited (N = 8), and although the number of segmented windows was substantial, the effective unit of generalization remains the signer rather than the window. Consequently, the reported performance should be considered preliminary and may not fully reflect inter-subject variability present in broader populations.
Second, instead of using a leave-one-subject-out approach, the assessment technique used a session-based data split. This method does not constitute speaker-independent validation, even though it stops temporal leakage between training and testing sessions. As a result, assertions about large-scale deployment must be understood carefully, because model performance for completely unknown users has not yet been proved.
Third, a limited vocabulary of 12 LSM signals was used to assess the categorization system. The grammatical richness and coarticulation complexity of full-scale Mexican Sign Language are not captured by this restricted lexicon, even if it is appropriate for pilot validation. More research is needed to determine scalability to bigger vocabulary and more intricate sign sequences.
Fourth, structured statistical descriptors obtained from flex and inertial signals were used in feature engineering. Although this representation worked well given the size and processing limitations of the current dataset, it limits the investigation of high-capacity deep learning architectures, whose effectiveness usually depends on much bigger and more varied datasets.
The prototype presently emphasizes deaf-to-hearing translation and does not include a bidirectional communication channel. A completely inclusive educational tool would have speech-to-text for instructor communication, as well as an LSM output module (for example, avatar-based rendering), allowing for reciprocal participation.
Finally, it is important to analyze usability results carefully. The mean System Usability Scale (SUS) score suggested minimal usability despite participants’ favorable opinions across all Technology Acceptance Model (TAM) categories. This implies that before wider educational adoption, incremental, user-centered development is required.
Therefore, before claims of broader deployment can be supported, more validation under leave-one-subject-out (LOSO) protocols is necessary, and the provided findings should not be regarded as proof of full speaker-independent generalization.
Future work will focus on improving generalization, robustness, and deployment readiness. The participant cohort and vocabulary will be expanded to enable speaker-independent validation using LOSO protocols and to better reflect real-world educational scenarios. Experiments in uncontrolled classroom and daily-use environments will assess temporal stability and failure modes. In order to maximize the trade-off between algorithmic latency and recognition accuracy, future research will systematically compare window lengths tailored to the dynamics of the signs, such as 1.2 s for static signs and 1.5 s for dynamic signs, even though the current study used a fixed window of 1.2 s for all signs. Whether adaptive or sign-specific windowing techniques may enhance dynamic sign categorization performance without sacrificing real-time responsiveness will be investigated in this investigation.
Robustness analysis will be extended to include macro and class-specific F1 scores, confusion pattern analysis, sensor noise stress testing, occlusion/displacement evaluation, and cross-device generalization.
System optimization efforts will investigate lightweight embedded models and privacy-preserving multimodal fusion strategies to capture non-manual cues, including facial expressions and upper-body posture, while maintaining real-time responsiveness. Future architectural extensions will also address the current restriction to single-hand signs. The present prototype evaluates primarily unilateral gestures; however, full LSM communication frequently involves bimanual articulation as well as non-manual markers such as facial expressions and upper-body posture. Accordingly, future iterations will incorporate a second instrumented glove to enable bimanual sensing and will explore multimodal approaches integrating vision-based analysis of facial and postural cues. These components are important for capturing the grammatical and semantic richness of naturalistic sign language communication.
Finally, the full pipeline will be instrumented to report end-to-end latency (gesture onset to stable display), including median and interquartile range (IQR) measurements under deployment conditions.
5. Conclusions
This study developed and pilot-evaluated a portable system based on a sensorized glove for the real-time translation of a subset of Mexican Sign Language signs in the context of inclusive higher education. The prototype integrates five flex sensors and an IMU connected to a CPU-based embedded platform. In the current deployment, the ESP32-C3 performs sensing and on-glove feedback, while the 11-channel stream is sent to a PC, where features are computed and an ML classifier performs real-time inference; the predicted label is then returned to the glove and shown on the OLED. Accordingly, we describe the system as a wearable with PC-hosted real-time recognition. To ensure inter-session generalization without window leakage, we trained the classifier on three training sessions S1–S3 and assessed it on a different testing session T. With the participation of eight university students (four of whom were deaf and native users of Mexican Sign Language), the system achieved an overall accuracy of 97.0% (95% CI: 0.96–0.97), with slightly better performance on dynamic subset compared to static signs and an average algorithmic decision delay of approximately 1.2 s, confirming the technical feasibility of providing stable, near-real-time feedback under controlled experimental conditions.
Beyond recognition metrics, the study incorporated the user’s perspective through the TAM and SUS questionnaires. Results in TAM showed a Cronbach’s alpha with values between 0.86 and 0.93 supporting the scales’ internal consistency. From the user perspective, the SUS evaluation showed a marginal level of usability, reflecting the need for further refinement of aspects related to ease of use and system consistency. Nevertheless, the positive subjective ratings and the high level of acceptance reported by participants indicate that the prototype is perceived as useful and relevant for deaf and hearing students, particularly in inclusive higher education settings. These results suggest that translation gloves have the potential to support occasional communication between deaf and hearing individuals and may contribute to more active participation.
However, this is an exploratory study with clear limitations. The number of participants is small and from a specific institutional context, and the vocabulary addressed is restricted to 12 signs that combine letters of the alphabet and frequently used basic words. Consequently, the findings should be interpreted as preliminary evidence of feasibility and not as definitive estimates of effectiveness. Future work should expand the sample size and diversity, extend the sign repertoire (particularly dynamic vocabulary and phrases), evaluate performance in actual classroom sessions, and explore strategies to improve the differentiation between anatomically or kinematically similar signs.
Despite these limitations, the evidence obtained shows that a relatively simple and low-cost architecture, based on flex sensors and an IMU on an embedded platform, can achieve performance levels comparable to those reported in the literature for other wearable devices, while also being well-received by its end users. In this sense, the presented prototype represents a concrete step toward the integration of wearable assistive technologies in higher education and opens a promising line of research aimed at reducing communication barriers and moving toward more accessible and inclusive higher education environments.
Supplementary Materials
The following supporting information can be downloaded at: https://www.mdpi.com/article/10.3390/technologies14030189/s1, Video S1: Demonstration of static hand signs A, B, E, and L used in the dataset; Video S2: Demonstration of the dynamic hand sign J, showing temporal motion patterns; Video S3: Demonstration of the dynamic hand sign Z, illustrating sequential hand movement.
Author Contributions
Conceptualization, J.C.R.-V. and G.E.R.-G.; methodology, G.E.R.-G. and M.A.D.-M.; software, G.E.R.-G. and M.J.C.-L.; validation, J.C.R.-V., M.A.G.-G., M.J.C.-L. and G.E.R.-G.; formal analysis, G.E.R.-G.; investigation, J.C.R.-V., M.A.G.-G. and M.J.C.-L.; resources, J.C.R.-V. and M.A.G.-G.; data curation, G.E.R.-G. and M.A.D.-M.; writing—original draft preparation, G.E.R.-G., M.A.C.-N. and M.J.C.-L.; writing—review and editing, G.E.R.-G., J.C.R.-V. and M.A.C.-N.; visualization, G.E.R.-G., M.A.D.-M. and M.A.C.-N.; supervision, J.C.R.-V. and G.E.R.-G.; project administration, G.E.R.-G. All authors have read and agreed to the published version of the manuscript.
Funding
This research received no external funding.
Institutional Review Board Statement
The study was conducted in accordance with the Declaration of Helsinki, and approved by the Institutional Review Board (or Ethics Committee) of Faculty of medicine “Dr. Alberto Romo Caballero” of the Autonomous University of Tamaulipas (protocol code 366-2025; approval date: 14 October 2025), for studies involving humans.
Informed Consent Statement
Informed consent was obtained from all subjects involved in the study. Participation was entirely voluntary, involving interaction with a non-invasive technological prototype, and no sensitive personal data were collected.
Data Availability Statement
The data in this work can be obtained upon request from the corresponding author. The data are not publicly accessible due to the personal information of the data collectors.
Conflicts of Interest
The authors declare no conflicts of interest.
Abbreviations
The following abbreviations are used in this manuscript:
| LSM | Mexican Sign Language |
| ASL | American Sign Language |
| ArSL/MSL | Arabic/Moroccan Sign Language |
| IMU | Inertial Measurement Unit |
| ML | Machine Learning |
| DL | Deep Learning |
| SLR | Sign Language Recognition |
| CNN | Convolutional Neural Network |
| ANN | Artificial Neural Network |
| SVM | Support Vector Machine |
| RF | Random Forest |
| KNN | k-Nearest Neighbors |
| TP | True Positives |
| FP | False Positives |
| FN | False Negatives |
| SD | Standard Deviation |
| SUS | System Usability Scale |
| TAM | Technology Acceptance Model |
References
- Hilario-Acuapan, G.; Ordaz-Hernández, K.; Castelán, M.; López-Juárez, I. Toward a Recognition System for Mexican Sign Language: Arm Movement Detection. Sensors 2025, 25, 3636. [Google Scholar] [CrossRef] [Scilit]
- Kim, H.; Lee, I.; Panda, S.; Hajra, S.; Jeong, B.; Seo, J.; Kaja, K.R.; Belal, M.A.; Vivekananthan, V.; Kim, H.J. Smart Gloves-Based Triboelectric Nanogenerator for Sign Language Detection. Micro Nano Syst. Lett. 2025, 13, 11. [Google Scholar] [CrossRef] [Scilit]
- Rodríguez-Correa, P.A.; Valencia-Arias, A.; Patiño-Toro, O.N.; Oblitas Díaz, Y.; Teodori De la Puente, R. Benefits and Development of Assistive Technologies for Deaf People’s Communication: A Systematic Review. Front. Educ. 2023, 8, 1121597. [Google Scholar] [CrossRef] [Scilit]
- Suri, K.; Gupta, R. Convolutional Neural Network Array for Sign Language Recognition Using Wearable IMUs. arXiv 2020, arXiv:2004.11836. [Google Scholar] [CrossRef] [Scilit]
- Wang, Y.; Jiang, H.; Sun, Y.; Xu, L. A Static Sign Language Recognition Method Enhanced with Self-Attention Mechanisms. Sensors 2024, 24, 6921. [Google Scholar] [CrossRef] [Scilit]
- Gu, Y.; Oku, H.; Todoh, M. American Sign Language Recognition and Translation Using Perception Neuron Wearable Inertial Motion Capture System. Sensors 2024, 24, 453. [Google Scholar] [CrossRef] [Scilit]
- Kim, Y.-H.; Oh, Y.-K. Optimization of Knitted Strain Sensor Structures for a Real-Time Korean Sign Language Translation Glove System. Sensors 2025, 25, 4270. [Google Scholar] [CrossRef] [Scilit]
- Shin, J.; Matsuoka, A.; Hasan, M.A.M.; Srizon, A.Y. American Sign Language Alphabet Recognition by Extracting Feature from Hand Pose Estimation. Sensors 2021, 21, 5856. [Google Scholar] [CrossRef] [Scilit] [PubMed]
- Ji, A.; Wang, Y.; Miao, X.; Fan, T.; Ru, B.; Liu, L.; Nie, R.; Qiu, S. Dataglove for Sign Language Recognition of People with Hearing and Speech Impairment via Wearable Inertial Sensors. Sensors 2023, 23, 6693. [Google Scholar] [CrossRef] [Scilit]
- Harrison, A.; Jester, A.; Mouli, S.; Fratini, A.; Jabran, A. Systematic Evaluation of IMU Sensors for Application in Smart Glove System for Remote Monitoring of Hand Differences. Sensors 2024, 25, 2. [Google Scholar] [CrossRef] [Scilit]
- Lee, C.K.M.; Ng, K.K.H.; Chen, C.-H.; Lau, H.C.W.; Chung, S.Y.; Tsoi, T. American Sign Language Recognition and Training Method with Recurrent Neural Network. Expert Syst. Appl. 2021, 167, 114403. [Google Scholar] [CrossRef] [Scilit]
- Rodriguez, M.; Oubram, O.; Bassam, A.; Lakouari, N.; Tariq, R. Mexican Sign Language Recognition: Dataset Creation and Performance Evaluation Using MediaPipe and Machine Learning Techniques. Electronics 2025, 14, 1423. [Google Scholar] [CrossRef] [Scilit]
- Umut, İ.; Kumdereli, Ü.C. Novel Wearable System to Recognize Sign Language in Real Time. Sensors 2024, 24, 4613. [Google Scholar] [CrossRef] [Scilit]
- Mejía-Peréz, K.; Córdova-Esparza, D.-M.; Terven, J.; Herrera-Navarro, A.-M.; García-Ramírez, T.; Ramírez-Pedraza, A. Automatic Recognition of Mexican Sign Language Using a Depth Camera and Recurrent Neural Networks. Appl. Sci. 2022, 12, 5523. [Google Scholar] [CrossRef] [Scilit]
- Sánchez-Vicinaiz, T.J.; Camacho-Pérez, E.; Castillo-Atoche, A.A.; Cruz-Fernández, M.; García-Martínez, J.R.; Rodríguez-Reséndiz, J. Mediapipe Frame and Convolutional Neural Networks-Based Fingerspelling Detection in Mexican Sign Language. Technologies 2024, 12, 124. [Google Scholar] [CrossRef] [Scilit]
- Chiradeja, P.; Liang, Y.; Jettanasen, C. Sign Language Sentence Recognition Using Hybrid Graph Embedding and Adaptive Convolutional Networks. Appl. Sci. 2025, 15, 2957. [Google Scholar] [CrossRef] [Scilit]
- El Khoukhi, H.; Belatik, A.; El Manaa, I.; Sabri, M.A.; Abouch, Y.; Aarab, A. Moroccan Sign Language Recognition with a Sensory Glove Using Artificial Neural Networks. Digital 2025, 5, 53. [Google Scholar] [CrossRef] [Scilit]
- Chen, K.; Li, L.; Peng, Q.; He, M.; Ma, L.; Li, X.; Lu, Z. A Smart Textile-Based Tactile Sensing System for Multi-Channel Sign Language Recognition. Sensors 2025, 25, 4602. [Google Scholar] [CrossRef] [Scilit]
- Pratap, S.; Narayan, J.; Hatta, Y.; Ito, K.; Hazarika, S.M. Glove-Net: Enhancing Grasp Classification with Multisensory Data and Deep Learning Approach. Sensors 2024, 24, 4378. [Google Scholar] [CrossRef] [Scilit]
- Amin, M.S.; Rizvi, S.T.H.; Mazzei, A.; Anselma, L. Assistive Data Glove for Isolated Static Postures Recognition in American Sign Language Using Neural Network. Electronics 2023, 12, 1904. [Google Scholar] [CrossRef] [Scilit]
- Zhou, Z.; Chen, K.; Li, X.; Zhang, S.; Wu, Y.; Zhou, Y.; Meng, K.; Sun, C.; He, Q.; Fan, W.; et al. Sign-to-speech Translation Using Machine-Learning-Assisted Stretchable Sensor Arrays. Nat. Electron. 2020, 3, 571–578. [Google Scholar] [CrossRef] [Scilit]
- Xue, Q.; Li, X.; Wang, D.; Zhang, W. Deep Forest-Based Monocular Visual Sign Language Recognition. Appl. Sci. 2019, 9, 1945. [Google Scholar] [CrossRef] [Scilit]
- Filipowska, A.; Filipowski, W.; Raif, P.; Pieniążek, M.; Bodak, J.; Ferst, P.; Pilarski, K.; Sieciński, S.; Doniec, R.J.; Mieszczanin, J.; et al. Machine Learning-Based Gesture Recognition Glove: Design and Implementation. Sensors 2024, 24, 6157. [Google Scholar] [CrossRef] [Scilit]
- Sonchan, P.; Ratchatanantakit, N.; O-Larnnithipong, N.; Adjouadi, M.; Barreto, A. Interaction Glove for 3-D Virtual Environments Based on an RGB-D Camera and Magnetic, Angular Rate, and Gravity Micro-Electromechanical System Sensors. Information 2025, 16, 127. [Google Scholar] [CrossRef] [Scilit]
- Lu, C.; Amino, S.; Jing, L. Data Glove with Bending Sensor and Inertial Sensor Based on Weighted DTW Fusion for Sign Language Recognition. Electronics 2023, 12, 613. [Google Scholar] [CrossRef] [Scilit]
- Panopoulos, I.; Topalis, E.; Petrellis, N.; Hadellis, L. Greek Sign Language Detection with Artificial Intelligence. Electronics 2025, 14, 3241. [Google Scholar] [CrossRef] [Scilit]
- Ben Haj Amor, A.; El Ghoul, O.; Jemni, M. Sign Language Recognition Using the Electromyographic Signal: A Systematic Literature Review. Sensors 2023, 23, 8343. [Google Scholar] [CrossRef] [Scilit]
- Liang, Y.; Jettanasen, C.; Chiradeja, P. Progression Learning Convolution Neural Model-Based Sign Language Recognition Using Wearable Glove Devices. Computation 2024, 12, 72. [Google Scholar] [CrossRef] [Scilit]
- Korzeniewska, E.; Kania, M.; Zawiślak, R. Textronic Glove Translating Polish Sign Language. Sensors 2022, 22, 6788. [Google Scholar] [CrossRef] [Scilit]
- Alsharif, B.; Alalwany, E.; Ibrahim, A.; Mahgoub, I.; Ilyas, M. Real-Time American Sign Language Interpretation Using Deep Learning and Keypoint Tracking. Sensors 2025, 25, 2138. [Google Scholar] [CrossRef] [Scilit]
- Brooke, J. SUS: A Quick and Dirty Usability Scale. In Usability Evaluation in Industry; Jordan, P.W., Thomas, B., McClelland, I.L., Weerdmeester, B., Eds.; Taylor & Francis: London, UK, 1996; pp. 189–194. Available online: https://www.taylorfrancis.com/chapters/mono/10.1201/9781498710411-35/sus-quick-dirty-usability-scale-john-brooke (accessed on 14 March 2026).
- Bangor, A.; Kortum, P.; Miller, J. Determining What Individual SUS Scores Mean: Adding an Adjective Rating Scale. J. Usability Stud. 2009, 4, 114–123. Available online: https://uxpajournal.org/determining-what-individual-sus-scores-mean-adding-an-adjective-rating-scale/ (accessed on 14 March 2026).
- Aguilar-Mejía, J.R.; Santillán-Rosas, I.M.; Olais-Govea, J.M.; Reynaga-Peña, C.G. Crafting Inclusion: A Dynamic Multidisciplinary Approach to Engineering Education Using Makerspaces. In Proceedings of the 2023 World Engineering Education Forum–Global Engineering Deans Council (WEEF–GEDC), Monterrey, Mexico, 23–27 October 2023; pp. 1–7. [Google Scholar] [CrossRef] [Scilit]

Disclaimer/Publisher’s Note: The statements, opinions and data contained in all publications are solely those of the individual author(s) and contributor(s) and not of MDPI and/or the editor(s). MDPI and/or the editor(s) disclaim responsibility for any injury to people or property resulting from any ideas, methods, instructions or products referred to in the content. |
© 2026 by the authors. Licensee MDPI, Basel, Switzerland. This article is an open access article distributed under the terms and conditions of the Creative Commons Attribution (CC BY) license.