


Abstract
Sand production in an offshore hydrocarbon wells poses significant operational and integrity challenges, particularly in deviated wells, where complex flow geometries intensify particle transport and erosion risks. The traditional sand-monitoring method utilizes stationary acoustic sensors attached to the production flowline at the surface. However, these sensors provide limited spatial coverage and intermittent measurements, restricting their ability to detect early sanding onset or precisely localize sanding intervals. By combining with vertical seismic profiling (VSP), Distributed Acoustic Sensing (DAS) delivers continuous, high-density data along the entire length of the wellbore and is increasingly recognized as a powerful diagnostic tool for real-time downhole monitoring. This study presents a field application of DAS-VSP for detecting and characterizing sand transport in a deviated offshore production well equipped with 350 distributed fiber-optic channels spanning 0–1983 m true vertical depth (TVD) at 8 m spacing. A multistage workflow was developed, including SEGY ingestion and shot merging, channel and time window selection, trace normalization, and low-pass filtering below 20 Hz. Multi-domain signal analysis, such as RMS energy, spike-based time-domain attributes, FFT, PSD spectral characterization, and time–frequency decomposition, were used to isolate the characteristic im-pulsive low-frequency (<20 Hz) signatures associated with sand impact. An adaptive thresholding and event-clustering scheme was then applied to discriminate sanding bursts from background noise and integrate their acoustic energy over depth. The processed DAS section revealed distinct, depth-localized sand ingress zones within the production interval (1136–1909 m TVD). The derived sand log provided a quantitative measure of sand intensity variations along the deviated wellbore, with normalized RMS amplitudes ranging from 0.039 to 1.000 a.u., a mean value of 0.235 a.u., and 137 analyzed channels within the production interval. These results indicate that sand production is highly clustered within discrete depth intervals, offering new insights into sand–fluid interactions during steady-state flow. Overall, the findings confirm that DAS-VSP enables continuous real-time monitoring of the sanding behavior with a far greater depth resolution than conventional tools. This approach supports proactive sand management strategies, enhances well-integrity decision-making, and underscores the potential of DAS to evolve into a standard surveillance technology for hydrocarbon production wells.
1. Introduction
Sand production and transport remain among the most critical challenges in hydro-carbon extraction, particularly in offshore oil wells, where intervention costs and operational risks are substantially higher than those in onshore environments [1]. Uncontrolled ingress and migration of formation sand can lead to accelerated erosion of downhole and surface equipment, plugging of flowlines, loss of well integrity, and a consequent decrease in hydrocarbon production efficiency [2,3]. These issues not only elevate operational expenditures but also pose environmental and safety risks, prompting the oil and gas industry to seek enhanced surveillance and management techniques for sand-related problems [4]. In addition, reservoir stimulation and rock–fluid interaction processes significantly influence production behavior in subsurface formations. Previous studies have shown that rock failure and fracture propagation during drilling and stimulation operations are strongly affected by stress conditions, impact loading, and reservoir heterogeneities, which in turn control fracture development and production performance [5,6]. These geomechanical processes can also contribute to particle detachment and transport within the wellbore, emphasizing the need for advanced monitoring techniques capable of diagnosing downhole production dynamics.
Distributed Acoustic Sensing (DAS) has emerged as a revolutionary technology for subsurface monitoring, addressing many of these limitations [7]. By utilizing standard op-tical fibers deployed along the wellbore as dense arrays of virtual sensors, DAS continuously monitors acoustic energy and vibrational signatures with high spatial and temporal resolutions [8]. DAS achieves this through Rayleigh backscattering, where laser pulses are injected into the fiber generate backscattered signals that are influenced by dynamic strain and acoustic perturbations along the fiber path. When coupled with Vertical Seismic Pro-filing (VSP), DAS offers enhanced capabilities for detailed spatial imaging and detection of subtle acoustic signals associated with sand particle impacts and multiphase flow dynamics [9].
Recent research and field demonstrations have established DAS-VSP as a powerful modality for real-time sand transport detection in hydrocarbon wells, particularly in off-shore environments where downhole access is limited and early warning systems are critical [1]. Studies have shown that DAS can effectively detect and localize sand ingress, characterize migration patterns, and estimate key parameters, such as sand phase velocity and slip velocity, through advanced signal processing and integration with computation-al fluid dynamics (CFD) models. These capabilities facilitate a better understanding of the sand production mechanisms, enabling operators to optimize completion designs, adjust drawdown schedules, and apply targeted sand control measures [7]. Moreover, industrial deployments of DAS in offshore oil fields have validated its ability to deliver invaluable operational insights while reducing nonproductive time and intervention costs. The continuous, real-time acquisition of distributed acoustic data allows monitoring of complex downhole phenomena, including sand transport, fluid flow variation, and wellbore integrity, under dynamic production conditions. Challenges remain in data interpretation, particularly in distinguishing sanding events from background noise and operational vibration. However, advances in machine learning and analytics continue to enhance signal discrimination [9].
This study focused on the application of DAS-VSP technology for sand production and transport detection in an offshore deviated oil-well setting. Using the acquired DAS-VSP data, this study analyzed the acoustic signatures associated with sand ingress and transport, correlated the findings with production parameters, and discussed the im-plications for sand management in offshore hydrocarbon production. By integrating recent academic research with field data, this study aims to contribute to the evolving under-standing and practical adoption of DAS-based sand-detection techniques that support safer and more efficient oil production operations.
2. Literature Review
The application of DAS in oil and gas operations has evolved rapidly over the last decade, with documented success in leak detection, flow profiling, and seismic monitoring [7]. Early field deployments have demonstrated that the high spatial and temporal resolution of DAS-VSP data supports comprehensive monitoring of downhole events, far surpassing legacy point sensor technologies [8].
Studies have highlighted that DAS-VSP can capture the acoustic energy signatures produced by sand particles impacting well components and migrating with production fluids. Hopkins et al. [7] and other case studies have demonstrated the feasibility of permanently deployed DAS fiber installations for sand ingress and migration monitoring, enabling uninterrupted operation and routine surveys without well intervention. Otchere et al. [10] affirmed the ability of this technology to deliver real-time, continuous data suitable for advanced reservoir characterization and sand detection [7,10].
In terms of sand production mechanisms and monitoring, Rapor [11] reviewed multiple predictive models for sand production, emphasizing the need for direct downhole di-agnostics to validate theoretical risk predictions. The literature collectively identifies that effective sand control relies on the rapid detection of sand events and precise localization within the wellbore, which is a capability that DAS-VSP is uniquely positioned to provide [11,12,13].
2.1. DAS Technology Overview
DAS operates based on the principle of Rayleigh backscattering, wherein a series of laser pulses are introduced into a fiber-optic cable [14,15,16]. The backscattered light was analyzed for subtle variations in phase and intensity caused by vibrations or acoustic activity along the length of the fiber. These signals undergo digital processing to yield spatially continuous profiles of sound and strain, a capability that cannot be achieved using conventional point sensors or periodic logging tools. Such distributed measurements are particularly suited for oil and gas wells, pipelines, and related infrastructure that require continuous and high-resolution monitoring [4,9]. Figure 1 illustrates the fundamental architecture and working principles of a DAS system. Within the Interrogator Unit (IU), a coherent laser source produces a continuous beam that is converted into high-extinction-ratio pulses by an acousto-optic modulator (AOM). These pulses are launched into the sensing optical fiber via an optical circulator (Port 1 to Port 2). As the pulse propagates, intrinsic imperfections in the fiber core cause Rayleigh backscattering to return toward the IU. This backscattered light is routed by the circulator (Port 2 to Port 3) to a high-speed photo detector and subsequently analyzed by a data acquisition and processing unit. External acoustic or vibrational fields perturb the fiber, modulating the phase and intensity of the backscattered signal, which allows for the precise localization and characterization of disturbances along the entire fiber length [17,18].
Figure 1.
Schematic diagram of a DAS system highlighting the internal architecture of the Interrogator Unit. The system comprises a coherent laser source, an acousto-optic modulator for pulse generation, an optical circulator for signal routing, a photodetector for signal reception, and a data acquisition and processing unit. The external sensing fiber illustrates the interaction between the propagating laser pulse and environmental acoustic fields, leading to the return of modulated backscattered light [19,20].
2.2. Evolution and Adoption in Oil and Gas
DAS was originally developed for security and perimeter monitoring using light scattering in optical fibers to detect vibrations and external disturbances [21]. Its transition into the oil and gas industry was driven by the need for distributed, real-time monitoring in harsh well environments, where conventional sensors are limited [22]. The ability of this technology to provide continuous high-resolution data has quickly positioned it as a valuable tool in petroleum engineering and geoscience [9].
Early applications focused on well integrity monitoring, where DAS demonstrated sensitivity to casing deformation, leakage, cement-bond failure, geothermal and water systems [23]. Its versatility has expanded to hydraulic fracturing diagnostics and flow-back analysis, enabling engineers to visualize fracture propagation, track fluid front arrival, and optimize proppant placement [24]. Field trials and industrial partnerships have documented DAS’s capacity of DAS to monitor multiphase flow and detect sand ingress, highlighting its effectiveness in capturing dynamic subsurface processes in real time [25].
As the technology matured, DAS was increasingly integrated with other fiber-optic sensing methods, particularly Distributed Temperature Sensing (DTS) and Distributed Strain Sensing (DSS) [26]. This combination creates a comprehensive surveillance system capable of characterizing reservoir behavior under active production conditions. Together, these modalities provide operators with holistic insights into wellbore and reservoir dynamics, improving operational efficiency, reducing risk, and enhancing hydrocarbon recovery [27]. The extraction of meaningful acoustic information from the raw optical signal follows a multi-stage processing pipeline, as detailed in Figure 2. The raw time-domain intensity traces are first subjected to phase demodulation, converting the modulated light signal into acoustic strain or strain-rate measurements. This signal is then pre-processed using digital band-pass or high-pass filtering to mitigate low-frequency drift and high-frequency noise. Following pre-processing, a Short-Time Fourier Transform (STFT) is applied to transition the signal from the time-domain to the frequency-domain, enabling spectral analysis. From this transformed data, RMS energy features are extracted to characterize the intensity and frequency signatures of detected acoustic events. Finally, the processed results are presented through multidimensional visualizations, specifically distance-time-energy waterfall plots and frequency-depth energy charts, which facilitate the localization and identification of external disturbances [28,29].
Figure 2.
Comprehensive data processing pipeline for DAS signals. The flowchart illustrates the sequential workflow used to transform raw Distributed Acoustic Sensing (DAS) measurements into interpretable analytical outputs. The vertical arrows indicate the step-by-step progression of the processing stages from top to bottom. The workflow begins with raw optical backscatter acquisition in the time domain, followed by phase demodulation to convert optical signals into acoustic strain or strain-rate measurements. Subsequently, pre-processing and noise reduction are applied using digital filtering techniques. The processed signals are then subjected to spectral analysis using the Short-Time Fourier Transform (STFT) to obtain time–frequency representations. In the next stage, feature extraction is performed to calculate RMS energy and identify relevant frequency-band characteristics. Finally, the processed information is visualized as distance–time–energy waterfall plots and frequency–depth energy distributions, which represent the final analytical outputs [12].
Today, DAS has moved far beyond its security origins and has become a cornerstone of modern reservoir engineering. Numerous documented deployments confirm its role in transforming well and reservoir management by delivering spatially continuous, real-time, and actionable subsurface data, an advancement that continues to redefine production monitoring and optimization in the oil and gas industry [21].
2.2.1. Principles of DAS-Based Sand Detection
DAS uses fiber-optic cables installed along the wellbore to detect the acoustic signals generated by sand particles entrained in the production flow [30]. These acoustic signals, usually in specific frequency bands, can be isolated and analyzed to identify sand events, such as sand influx and migration, and even to estimate sand velocity and concentration [31]. DAS operates by measuring disturbances in the backscattered light along the optical fiber, which are correlated with the acoustic emissions and vibrations resulting from sand impacts and movement [32]. The application of DAS for sand detection relies on its sensitivity to high-frequency acoustic signatures produced by sand particles as they collide with wellbore tubulars and flow equipment. Analytical work, such as that by Shetty et al., [13] demonstrated that acoustic signatures from sand can be identified and isolated using spectral analysis and frequency band energy (FBE) visualization, often correlating well with surface sand measurements and computational fluid dynamics (CFD) predictions. Field trials and experimental setups have validated that DAS can detect not only the occurrence but also the zone and relative magnitude of sand transport, offering an early warning of problematic sand influx, screening, or migration events along the full wellbore [30]. Hence, sand transport detection during hydrocarbon production from oil and gas wells can be effectively achieved using DAS technology, which provides real-time, spatially resolved data on sand ingress, migration, and associated wellbore dynamics [1,33,34]. The characteristic features distinguishing sand production signatures from non-sand noise in the DAS well data are summarized in Table 1.
Table 1.
Characteristic features distinguishing sand production signatures from non-sand noise in DAS well data based on laboratory and field studies.
2.2.2. Applications and Advantages
DAS presents substantial benefits in sand management by facilitating the precise identification of sand ingress zones throughout the entire production interval. This spatial granularity equips operators with essential data to implement targeted management strategies, as opposed to relying on generalized wellbore estimates [32]. Moreover, unlike conventional surface-based sensors that may overlook localized events, DAS offers downhole distributed measurements that enable the early detection and continuous monitoring of sand phenomena within the wellbore [9,35]. Beyond simple detection, the integration of DAS with analytical models and computational fluid dynamics (CFD) allows for the estimation of complex slurry parameters, such as sand phase and slip velocities, which are crucial for proactive predictive maintenance and remediation efforts [1]. These capabilities are highly adaptable, as DAS systems can be permanently installed for long-term monitoring or deployed in intervention scenarios to support intricate multizone and multichoke production environments [15,36].
Case Studies and Field Evidence
The practical efficacy of DAS is supported by both experimental research and field data. Experimental studies conducted in flow loops and deep-well environments have demonstrated the reliable detection of sand transport and migration, effectively validating analytical and numerical predictions against real-time DAS results [1]. In mature oil fields, where sand production presents a persistent challenge, field applications have shown that DAS-based monitoring enables operators to optimize production rates while concurrently reducing sanding-related downtime and enhancing overall well integrity [9,34,37]. These advantages extend to offshore environments as well, where deployments have confirmed the suitability of DAS for in-well, platform, and subsea monitoring. In these contexts, the technology provides high-resolution, real-time surveillance across extensive operational areas that were previously challenging to monitor [36].
Technical Implementation
The effective technical implementation of DAS is contingent upon the strategic installation of optical fibers along the wellbore, typically achieved by securing them to the production tubing or embedding them directly into the casing annulus [38]. Following installation, the interpretation of data necessitates advanced spectral and spectrogram analyses to distinguish specific sand signatures from ambient background noise. This is often accomplished through the visualization of energy content within targeted frequency bands to ensure signal clarity [1]. To further enhance these insights, the integration of DAS data with distributed temperature sensing (DTS) and pressure measurements offers a comprehensive multi-sensor approach. This integration facilitates an improved interpretation of complex multiphase flows and sand migration events, thereby enabling more in-formed decision-making in the field [39,40]. The technical installation of the fiber-optic cable (highlighted in yellow) and the associated well components are illustrated in Figure 3. To ensure the long-term reliability and signal stability of the DAS system in the hydrogen-rich downhole environment, several mitigation strategies were implemented to prevent hydrogen darkening (hydrogen-induced attenuation). First, a pure silica-core fiber (PSCF) was selected, as the absence of germanium and phosphorus dopants significantly reduces the formation of interstitial hydroxyl (OH-) absorption peaks that typically lead to signal loss [41,42]. Second, the sensing fiber is housed within a hermetically sealed 316L stainless steel loose tube, which serves as a robust physical barrier to minimize the ingress of molecular hydrogen into the optical core [43]. For additional protection, the fiber is coated with a high-temperature polyimide layer, which has been shown to exhibit a lower hydrogen permeability compared to standard acrylate coatings, thereby slowing the diffusion rate at elevated temperatures [41,44]. Finally, the interstitial spaces within the stainless steel tube are filled with a hydrogen-scavenging thixotropic gel. This gel contains specific chemical additives that actively bind free hydrogen molecules before they can react with the silica glass, effectively neutralizing the threat of darkening even in high-pressure, high-temperature (HPHT) conditions [44,45,46].
Figure 3.
Technical installation of the fiber-optic cable (yellow color in the figure) and the elements of the well adapted from [38].
2.3. Industrial Evidence and Limitations
Field reports suggest that DAS enables continuous and non-intrusive monitoring of sand production and equipment erosion, thereby eliminating the need for mechanical sensors or disruptive well intervention. Beyond sand monitoring, DAS has proven its utility in enhanced recovery operations, well integrity assessment, and geomechanical surveillance. This includes seismic and microseismic monitoring, which provides essential insights into sand migration and reservoir dynamics [35,37].
Despite these advantages, the effective implementation of DAS faces several challenges. Reliable deployment necessitates precise fiber installation to ensure adequate signal coverage and advanced processing techniques to extract meaningful information from extensive acoustic datasets [47]. A primary challenge is distinguishing sanding-related signals from the background flow noise and operational disturbances [48]. Current re-search is addressing these issues through the development of enhanced noise-filtering algorithms, machine learning approaches for signal classification, and integration with complementary sensing modalities [49]. These advancements aim to enhance data reliability and fortify DAS as a comprehensive tool for reservoir management and optimization of production.
2.4. Study Area
2.4.1. Location and Field Description
Field B is situated approximately 45 km offshore from Sarawak, Malaysia, within the West Baram Delta Province of the South China Sea. It is in shallow waters with depths ranging from approximately 67 to 70 m. Geographically, the field is positioned at 4.55° N, 113.624° E on the Malaysian continental shelf within the Baram Delta. Discovered in the 1970s, it represents one of the most significant hydrocarbon accumulations in Baram Delta Province. Field B was discovered in 1972 through exploration drilling activities and is jointly owned by Petronas Carigali Sdn Bhd (60%) and Petroleum Sarawak Exploration & Production (40%), with Petronas Carigali serving as the field operator. The field exhibits the typical geological characteristics of the West Baram Delta Province, which has transitioned from a foreland basin to a shelf margin from the Middle Miocene to the present. The tectonic setting is predominantly influenced by northward-prograding deltaic systems characterized by growth fault structures and syndepositional deformation, which are typical of the Tertiary Baram Delta region [50].
The West Baram Delta Province is a geologically intricate region characterized by the interaction of gravity-induced syndepositional growth faulting, predominantly oriented southwest–northeast, and Late Miocene to Early Pliocene wrench-induced compressional folding with similar axial orientations [51,52]. These geological features are nourished by sediment supply from the south-southeast and the southwest. Hydrocarbon accumulations in this area, such as field B, typically occur at the intersection of these major structures. Specifically, Field B demonstrates a domal uplift with a collapsed crest and a rollover anticline geometry resulting from the underlying growth faulting. It is part of the larger Baronia–Betty–Bokor anticline trend, which reflects the complex tectonic framework of the entire Baram Delta [53].
The Baram Delta Province originated during the Late Eocene epoch, following the orogenic uplift and folding of Cretaceous to Eocene eugeosynclinal sediments. This province is delineated from the more geologically stable Central Luconia Province to the west by a prominent northwest-southeast-trending hinge line, across which sedimentary thicknesses decrease markedly [54]. The principal hydrocarbon deposits in field B are situated within the northern upthrown fault block, which aligns with the regional structural configuration of the Baram Delta [55].
2.4.2. Reservoir and Well Characteristics
Field B exhibits significant reservoir complexity, encompassing approximately 160–165 distinct stacked sandstone reservoirs within a gross hydrocarbon-bearing interval of approximately 6000 ft. These reservoirs are deposited within coastal deltaic environments influenced by tidal and wave processes and consist primarily of unconsolidated sand and silt beds. The reservoir sequences are most prominently developed in Cycles V and VI of the regional stratigraphic frameworks, which can attain thicknesses of up to 10,000 and 6000 ft, respectively, within the broader Baram Delta Province.
The reservoir characteristics of the field exhibit significant vertical variations in fluid properties, with oil gravities ranging from approximately 20° API in the shallower reservoirs to 37° API in the deeper reservoirs. This variation reflects the complex depositional and diagenetic histories of the stacked reservoir systems. Reservoir quality is best developed in laterally continuous shoreline deposits within upper shoreface environments, where wave and storm processes create well-sorted, high-porosity sandstones.
Porosity in the field B reservoirs is generally well-preserved to depths of approximately 10,000–11,000 feet, with typical porosities of 15% retained at these depths. However, the economic floor occurs at shallower depths in the southern part of the field because of the erosion of the thick overburden and increased diagenetic intensity from tectonic activity. The field infrastructure comprises three drilling platforms (BODP-A, BODP-B, and BODP-C) and one satellite platform (BOK-A), with wells typically deviating to access the complex reservoir geometry.
2.4.3. Production History and Sand Production Context
Field B commenced oil production in 1982, approximately 15 years after its discovery, and has maintained continuous production for over four decades. The initial production utilized conventional gas lift systems, which remained the primary artificial lift method throughout the field’s early production history. The field achieved a peak production of approximately 30,000 barrels per day of crude oil and condensate in 1990.
Throughout its production life, field B has faced significant challenges related to sand production and fine migration, particularly from shallower, unconsolidated reservoir intervals. The shallowest reservoirs are especially prone to fine migration and sand production because of their unconsolidated nature and relatively high porosity–permeability characteristics. Sand production has caused substantial operational challenges, including tubing erosion, separator fouling, equipment damage, and loss of production owing to regular cleanout requirements [56].
Repeated sand ingress has caused erosion and plugging in downhole and surface equipment, particularly affecting electrical submersible pumps (ESPs) and requiring frequent workovers, while also prompting the switch from conventional gas lift to specialized artificial lift and sand control technologies [56]. Gravel pack completions have mitigated some sanding issues, but aggressive production draws can still exceed sand screen tolerance, causing episodic sanding that impairs well productivity and elevates maintenance costs [11,56].
Additionally, sand production has historically complicated the implementation of enhanced oil recovery (EOR) techniques in field B, as sand accumulation can reduce the efficiency of injected fluids, plug pore spaces, and diminish the overall sweep of hydro-carbons [55]. Consequently, improved oil recovery efforts in the field are tightly coupled with robust sand prediction, monitoring, and mitigation strategies, including intelligent completions, real-time downhole management, and careful production planning to sustain reservoir output while minimizing the sanding risk [9]. These integrated sand management approaches have proven critical in the redevelopment phases of Field B, enabling incremental improvements in oil recovery but highlighting that unresolved sand production challenges will continue to restrict the field’s maximum possible recovery factor [56].
The field has undergone multiple redevelopment phases to address declining pro-duction and manage sand challenges. Phase 3 redevelopment, implemented in 2020, involved the installation of three new wellhead platforms and drilling of new development wells, including four immiscible water-alternating gas (IWAG) injection wells featuring intelligent completions and polymer-based additives to mitigate fines migration. These interventions successfully increased production to over 10,000 bpd, with improvements attributed to enhanced sweep efficiency, fines migration mitigation, and real-time production optimization.
By 2022, the field’s cumulative production reached 323 million barrels of oil, representing approximately 92% of its estimated ultimate recovery of 350 million barrels. The current remaining recoverable reserves are estimated at 87.83 million barrels, with production expected to continue until the field reaches its economic limit of approximately 2044. Ongoing sand production challenges continue to be a primary concern for reservoir management, driving the implementation of advanced monitoring technologies, including fiber-optic distributed acoustic sensing systems, for real-time sand detection and production optimization. In this study, distributed acoustic sensing (DAS) was applied to address this gap by leveraging the existing fiber-optic infrastructure for downhole sanding monitoring.
3. Methodology
The methodology developed in this study aims to convert raw DAS data into reliable indicators of sand production along a wellbore. The workflow was systematically designed to process large-volume DAS-VSP datasets, enhance their quality through preprocessing, and extract features that encapsulate the acoustic signatures of sanding events. Consequently, this study established a step-by-step framework for generating depth-resolved sand logs that can facilitate downhole monitoring and production optimization.
The workflow commences with data preprocessing, wherein raw SEGY shot gathers are merged, cropped, normalized, and filtered to eliminate production-related noise and enhance the signal-to-noise ratio. Subsequently, signal characterization was conducted in the time, frequency, and time–frequency domains to elucidate the behavior of the DAS response and differentiate between the background flow noise and sanding-related transients. The subsequent phase entails event detection and feature extraction, wherein statistical and spectral attributes are calculated to differentiate sanding events from other acoustic-energy sources. These events are subsequently aggregated to develop sand production logs, which chart the intensity of sanding as a function of both depth and time. Ultimately, validation and quality control procedures were conducted to evaluate the robustness of the results and to assess the influence of the processing parameters.
3.1. Data Description
The datasets utilized in the development of the DAS-based sand production monitoring workflow encompass a DAS-VSP survey conducted in Well-B1, which is equipped with a permanently installed fiber-optic cable positioned behind the production tubing. This dataset includes the receiver geometry, acquisition parameters, and SEGY files containing 55,088 individual shots recorded during approximately 83 h of continuous observation. To facilitate the analysis, the shot gathers were consolidated into batches of 5000 shots per file, resulting in 12 combined SEGY files that formed the basis for all sub-sequent signal characterization and processing. Although surface acoustic sand detector (ASD) readings were not available for this study, the DAS dataset alone provided sufficient temporal and spatial coverage to detect sanding events and develop depth-resolved sand production logs.
3.1.1. DAS Acquisition System
The data used in this study were obtained from Well-B1, a deviated production well equipped with a permanently installed multimode fiber-optic cable strapped behind the production tubing. Initially installed for Distributed Temperature Sensing (DTS), the fiber was interrogated using an OptaSense DAS interrogator, thereby transforming it into a dense array of seismic receivers with a channel spacing of 8 m and comprising 350 active channels. The technical installation of the fiber-optic sensing system and its integration with wellbore components are detailed in Figure 4. As shown in the cross-sectional view (Figure 4B), the sensing cable is engineered for harsh environments, consisting of a central optical fiber housed within a stainless-steel loose tube, reinforced by armor wire strength members, and encapsulated in a ruggedized outer jacket. During the deployment phase, this cable is secured to the external surface of the production tubing using cross-coupling clamping fixtures (Figure 4A). These protectors (Figure 4C) are specifically designed to house the cable within a recessed protective channel, preventing mechanical damage during tubing make-up and deployment into the casing/wellbore. This robust installation ensures a stable mechanical coupling between the fiber and the tubing, which is critical for the high-fidelity transmission of acoustic vibrations from the reservoir to the sensing core.
Figure 4.
Technical details of the downhole fiber-optic cable installation. (A) Schematic representation of the wellbore environment with the sensing cable secured to the exterior of the production tubing using specialized clamping fixtures. (B) Cross-sectional architecture of the sensing cable, featuring a central core fiber, a stainless-steel loose tube, strength members (armor wires), and a high-durability outer protective jacket. (C) Detail of a cross-coupling cable protector (clamping fixture) illustrating the protective channel used to secure and shield the cable at the tubing coupling points.
A DAS survey was conducted concurrently with a three-dimensional ocean-bottom node (OBN) seismic campaign utilizing a dense air-gun source grid comprising 55,088 shots distributed over a 30 km2 area. The survey design facilitated wide-azimuth illumination with maximum offsets exceeding 5 km, thereby enhancing the imaging capabilities beneath the shallow gas-charged overburden. Each shot gather contained 350 channels sampled at 2 ms intervals, with 2501 samples per trace, resulting in a 5 s listen time.
The acquisition was conducted under live production conditions, with inflow control valves (ICV) and gas-lift valves (GLV) operational during the recording process. This setup introduced depth-dependent production noise, characterized by dominant energy peaks at approximately 8 and 14 Hz, necessitating precise filtering during subsequent data processing. A significant advantage of DAS-based acquisition is that production does not need to be halted during the VSP survey, thereby allowing data collection under authentic production conditions. A representative example of the merged DAS-VSP shots under these live production conditions is illustrated in Figure 5, which clearly delineates the vertical positions of the gas-lift valves (GLV), the production zone, and the ICV starting depth at 1909 m TVD.
Figure 5.
Representative DAS-VSP merged shots recorded under live production conditions. The noise observed in the upper section (0 to1136 m TVD) is attributed to the gas-lift valves (GLV), while the noisy data at the bottom corresponds to the inflow control valve (ICV) starting at 1909 m TVD. The production zone (1136 to 1909 m TVD) is clearly delineated between these components, showing the depth-dependent nature of the production-induced noise.
The key acquisition parameters are summarized in Table 2, and the well geometry derived from the first merged SEGY file (Merge1.sgy) is shown in Figure 5, Figure 6 and Figure 7. These figures present the spatial distribution of receivers in the map view, depth-offset space, and profile view, providing an essential reference for channel-to-depth mapping in the analyses.
Table 2.
DAS–VSP Acquisition Parameters for Well-B1.
Figure 6.
Well-B1 DAS-VSP receiver geometry (map view) shows the DAS receiver positions in the plan view along with the representative source location (red star). The well trajectory curves towards the northeast as the depth increases.
Figure 7.
The Well-B1 depth versus offset plot, which illustrates the deviated nature of the well, where the offset from the wellhead increases progressively with depth, reaching more than 1.4 km at the maximum measured depth.
Figure 6, Figure 7 and Figure 8 clarify the spatial configuration of the receivers and their relationship with the source grid, as derived from the initially merged SEGY file (Merge1.sgy). These figures present the well geometry employed in this study, offering a comprehensive spatial understanding of the receiver array concerning the seismic source positions. Figure 6 (map view) shows the DAS receiver positions in a planar view, with the representative source locations indicated by red stars. The well trajectory curves toward the northeast as the depth increases. Figure 7 (depth vs. offset) illustrates the deviated nature of the well, where the offset from the wellhead progressively increases with depth and exceeds 1.4 km at the deepest receiver. Figure 8 (X vs. depth profile) provides a lateral view of the well trajectory, highlighting the gradual build section followed by an extended deviated section approaching horizontal near the total depth of the well. This geometric information serves as a critical reference for subsequent analyses, as it defines the channel-to-depth mapping utilized throughout the sand production monitoring workflow.
Figure 8.
Well-B1 profile view (X vs. depth) displays the well trajectory in profile view, showing the measured trajectory and channel coverage down to 1983 m.
3.1.2. Ground-Truth or Auxiliary Data
In this study, no surface acoustic sand detector (ASD) readings or separator sand sampling records were available. Consequently, the DAS-VSP dataset was used as the primary and exclusive source of information for monitoring and analyzing sand production. This indicates that the detection of sanding events, feature extraction, and construction of sand logs are entirely data-driven, relying on the acoustic responses captured along the fiber-optic array. In addition to the DAS data, basic well completion and production information were available, including the well trajectory, perforation intervals, and general production status (active inflow and gas lift during acquisition). These auxiliary de-tails were employed to guide the channel selection and interpret the sanding intervals, although they were not used for quantitative calibration.
3.2. Workflow
This section delineates the methodology devised for processing, analyzing, and interpreting the DAS-VSP dataset from Well-B1 to detect and localize sand production events. The workflow was precisely designed to systematically convert raw SEGY data into depth-resolved sand production logs, which are instrumental in reservoir monitoring and production optimization. The process begins with data preprocessing, which encompasses channel selection, time cropping, shot merging, and filtering to condition the raw DAS signals and enhance the signal-to-noise ratio. Subsequently, the preprocessed data were characterized in the time, frequency, and time–frequency domains to identify flow-related noise and transient sanding events. Feature extraction and event detection algorithms were employed to isolate sand production signatures, which were accumulated over time and depth to generate sand logs. Figure 9 shows the DAS-VSP sand detection workflow.
Figure 9.
DAS-VSP sand-detection workflow.
3.2.1. Tools and Software Environment
In this study, all data processing and analysis were conducted using Python 3.11, employing a suite of open-source scientific computing library. The primary libraries utilized included ObsPy for SEGY file input/output and seismic data management, segyio for efficient batch processing and shot merging of extensive SEGY datasets, and NumPy and Pandas for numerical operations and data manipulation. Additionally, SciPy was employed for signal processing tasks, such as filtering, spectral analysis, and event energy computation, whereas Matplotlib, in conjunction with Seaborn, was used for visualization and plotting. Due to the substantial volume of data (exceeding 55,000 shots and 184 GB), the processing workflow was executed within a hybrid computing environment. Merging, pre-processing, and signal characterization were performed on a remote Linux workstation accessed via a Remote Desktop Connection, leveraging its high-performance CPU and memory for batch operations. Subsequently, post-processing, visualization, and documentation were conducted locally on a Windows 10 workstation equipped with 64 GB RAM, an Intel i9 processor, and an SSD storage to facilitate rapid file access.
3.2.2. Data Pre-Processing
The raw DAS-VSP dataset comprises 350 distributed channels acquired over approximately 6.95 h of continuous monitoring. While this full dataset captures a wide range of downhole acoustic phenomena, only a subset of the data is relevant for sand detection within the production zone and transport process. Therefore, effective preprocessing is essential to isolate sanding-related signals while suppressing unrelated noise sources and operational artifacts.
The initial inspection of the merged DAS dataset (merge5_5000. sgy) indicated that sand-related acoustic signatures were transient and predominantly concentrated within the early stages of production. Consequently, the dataset was temporally cropped to the first two hours of acquisition, during which the highest density of impulsive sanding events was recorded. This time window captures the onset and early evolution of sand transport while avoiding later periods that are dominated by steady-state background noise. Spatial preprocessing is equally important because of the deviated well configuration and the presence of downhole completion hardware. The shallow section of the well exhibits high acoustic noise associated with gas lift valve operations, whereas deeper sections are influenced by inflow control valve (ICV) activity, both of which can mask or distort sand-impact signatures. To mitigate these effects, the analysis was restricted to the primary production interval corresponding to Channels 200–337, where all perforations were located and fluid–solid interactions were most pronounced.
By focusing on this targeted depth and time window, the preprocessing stage enhances the signal-to-noise ratio of sanding-related events, reduces contamination from completion-induced noise, and ensures that subsequent signal analysis and sand-log generation are physically meaningful and relevant. Figure 10 shows the raw DAS-VSP data of the production zone (channels 200–337) the merged5_5000 file for the first 2 h.
Figure 10.
Raw DAS-VSP data of the production zone (channels 200–337), merged5_5000 file for the first 2 h.
3.2.3. Signal Characterization
Single-Shot Data Characterization
Single-shot DAS data were analyzed to distinguish sand-related acoustic signals from background noise and to guide the selection of appropriate signal-processing parameters. This step is critical in DAS-based sand detection because sand transport signatures are typically transient, low-frequency, and spatially localized along the production interval. Representative single-shot traces were extracted from the production zone, focusing on two channels with contrasting signal characteristics. Channel 325, located within the production zone, exhibited pronounced amplitude fluctuations in the time domain, indicating the presence of a signal superimposed on the background noise (Figure 11a). In contrast, Channel 300, which is also located within the production zone, displayed a low amplitude and was interpreted as predominantly background noise (Figure 11b).
Figure 11.
FFT magnitude spectrum (a) DAS trace for channel 300, (b) FFT magnitude spectrum for channel 300, (c) DAS trace for channel 325, and (d) FFT magnitude spectrum for channel 325.
To delve deeper into the spectral content of these signals, Fast Fourier Transform (FFT) magnitude spectra were calculated for both channels (Figure 11). The FFT of Channel 325 (Figure 11d) revealed a concentration of elevated energy in the low-frequency band, with dominant components below 20 Hz. In contrast, the FFT of Channel 300 (Figure 11b) displays significantly lower spectral amplitudes across the entire frequency range, confirming its classification as background noise. While both channels contained low-frequency energy, the signal-bearing channel exhibited substantially higher spectral magnitudes, particularly at frequencies associated with mechanical and flow-induced vibrations of the sensor.
To isolate the sand-related acoustic component, differential channel subtraction was performed by subtracting the noise-dominated trace of Channel 300 (Figure 12b) from the signal-plus-noise trace of Channel 325 (Figure 12a). The resulting residual trace represents a “clean” signal that suppresses common-mode noise while preserving the localized acoustic energy attributed to the sand transport processes (Figure 12c). This approach assumes that background noise sources, such as system noise and wellbore-wide mechanical vibrations, are spatially coherent over short depth intervals, whereas sand-induced signals are spatially localized to these intervals.
Figure 12.
(a) Signal plus noise for channel 325, (b) background noise for channel 300, and (c) clean signal (channel 325 minus 300).
The FFT magnitude spectra of the signal-plus-noise trace, background noise trace, and clean residual signal were compared (Figure 13). The clean signal spectrum retained strong energy predominantly below 20 Hz, whereas higher-frequency components were largely attenuated. This comparison confirmed that the spectral separation between sand-related signals and background noise was most effective in the low-frequency band.
Figure 13.
FFT magnitude spectra comparing the signal plus noise, background noise, and clean residual signal. (a) Full spectrum up to the Nyquist frequency of 250 Hz. (b) Detailed view of the spectra cropped to 50 Hz for better resolution of low-frequency components.
Based on these observations, a low-pass filter with a cutoff frequency of 20 Hz was selected for the subsequent processing. This choice preserved the dominant sand signal energy while suppressing higher-frequency noise components that did not contribute meaningfully to sand detection. Therefore, the single-shot analysis provides both physical insight into the nature of DAS-recorded sand signatures and a quantitative basis for the filtering strategy adopted in the later stages of the workflow. Figure 13 shows the FFT magnitude spectra comparing the signal-plus-noise, background noise, and clean residual signal: (a) full spectrum up to the Nyquist frequency of 250 Hz, (b) detailed view of the spectra cropped to 50 Hz for better resolution of low-frequency components.
Merged-Shots Data Characterization
While single-shot analysis provides insight into the instantaneous spectral characteristics of sand-related acoustic signals, the robust characterization of sand transport requires analysis over extended time windows to capture sustained and transient energy behaviors. To this end, frequency-domain characterization was performed on the merged-shot DAS data using power spectral density (PSD) analysis.
The merged dataset (merge5_5000. sgy), comprising approximately 6.95 h of continuous DAS recording across 350 channels, was first restricted to the production zone (channels 200–337), which encompasses all perforated intervals along the deviated wellbore. This selection minimizes the influence of nonproduction-related noise sources, including gas-lift valve activity in the upper section of the well and inflow control valve (ICV) effects at greater depths.
To assess the spatial consistency of the frequency content across the production interval, six representative channels (channels 200, 226, 253, 280, 307, and 334) were selected. These channels are evenly distributed throughout the production zone and therefore provide depth-representative sampling of the DAS response. For each selected channel, the power spectral density was estimated using Welch’s method, which improves the spectral stability by segmenting the time series, applying windowing, and averaging individual periodograms. This method is well-suited for long-duration DAS records, where non-stationary behavior may be present.
Figure 14 shows the PSD curves for the six selected channels. Despite their spatial separation along the wellbore, all channels exhibited remarkably consistent spectral behavior. The dominant acoustic energy was concentrated at low frequencies, with a significant portion of the spectral power occurring at approximately 20 Hz. Beyond this frequency, the PSD amplitude decreased rapidly and remained low across the high-frequency band.
Figure 14.
Power spectral density (PSD) of six representative DAS channels (200, 226, 253, 280, 307, and 334) within the production zone, estimated using Welch’s method. All channels showed dominant energy below 20 Hz, with rapidly decreasing power at higher frequencies, supporting the selection of a 20 Hz low-pass filter for sand detection.
The observed low-frequency dominance across all six channels confirmed that the spectral characteristics of the DAS data were spatially coherent within the production zone. Importantly, these results are fully consistent with the single-shot FFT analysis presented in Section Single-Shot Data Characterization, where both the signal-dominated and noise-dominated channels exhibited their strongest spectral content at low frequencies. The agreement between the instantaneous (single-shot) and long-duration (merged-shot) analyses provided a robust basis for the selection of a 20 Hz low-pass filter in subsequent preprocessing. By retaining the frequency band that contains most of the sand-related acoustic energy while suppressing higher-frequency components, the chosen filtering strategy enhances the signal-to-noise ratio and improves the reliability of downstream sand detection, energy integration, and depth-resolved sand log generation.
3.2.4. DAS Sand Event Detection
Following the frequency-domain characterization, a low-pass filter with a cutoff frequency of 20 Hz was applied to the production-zone DAS data. This filtering step was motivated by both the single-shot FFT analysis and merged-shot PSD results, which consistently demonstrated that the dominant acoustic energy associated with sand production and transport was concentrated at low frequencies. High-frequency components, which contribute minimally to sand-related signals, were therefore suppressed to enhance the signal-to-noise ratio and improve visual and quantitative detectability.
After low-pass filtering, the DAS records exhibited a distinct change in the signal character. The background noise becomes relatively smooth and laterally coherent along the depth, whereas sparse, short-duration, high-amplitude spikes emerge intermittently in both time and depth. These transient spikes are spatially localized and temporally intermittent, appearing as isolated high-contrast events against a filtered background. These characteristics are consistent with previously reported DAS observations of sand signatures, where acoustic impulses are generated by sand grain impacts, grain–grain collisions, and sand–fluid interactions within the wellbore.
To detect these sand-related acoustic events, the filtered data were analyzed using time-domain amplitude-based attributes. For each channel, the signal energy was quantified over short time windows using the root-mean-square (RMS) amplitude, which provides a robust measure of transient acoustic intensity while reducing sensitivity to phase variations. The RMS attribute effectively enhances impulsive sand events while suppressing low-level background fluctuations associated with steady-state flows or system noise.
Sand event detection was performed by identifying the RMS amplitudes that exceeded the local background level. Rather than relying on absolute amplitude thresholds, which can vary with depth and coupling conditions, a relative detection strategy was used. RMS amplitudes were normalized on a per-channel basis, enabling consistent comparisons across the production intervals. Events exceeding a statistically defined threshold were classified as sand-related, whereas lower-amplitude responses were treated as background noise.
The resulting detection map highlights discrete sand events distributed unevenly over depth and time. Notably, sand signatures were not continuous but occurred in short bursts, consistent with transient sand transport rather than sustained sanding. This behavior aligns with the operational context of the well, where sand ingress is episodic and driven by localized flow conditions, rather than uniform formation failure.
The detected sand events formed the basis for subsequent energy integration and depth aggregation. By accumulating the detected acoustic energy over the selected time window (0–2 h), a depth-resolved representation of the sand activity was obtained. This process enabled the generation of a DAS-derived sand log, which is described in detail in the following section.
3.2.5. DAS Sand Log Generation
A depth-resolved DAS sand log was generated to quantify the sand-related acoustic activity along the production interval. The sand log construction was based on the integrated low-frequency acoustic energy recorded by the DAS system during the selected monitoring period.
Following sand event enhancement through low-pass filtering at 20 Hz, the analysis focused on the production zone spanning channels 220–337, corresponding to depths of approximately 1136–1909 m TVD. The DAS data were first temporally cropped to the 0–2 h interval, which contained most of the observed transient sanding activity. This temporal focus ensures that the derived sand log represents active sand transport, rather than long-term background noise.
Each DAS trace within the selected depth intervals was processed independently. The cropped traces were filtered using a zero-phase, fourth-order Butterworth low-pass filter to preserve the transient sand signatures while suppressing the higher-frequency noise. For each filtered trace, the root-mean-square (RMS) amplitude was computed over the full 0–2 h time window. The RMS amplitude was selected as the primary metric because it provides a robust measure of cumulative acoustic energy and is less sensitive to instantaneous phase variations than peak amplitude measurements.
To enable a consistent comparison across depths, the RMS amplitudes were normalized by the maximum RMS value observed within the production interval. This normalization removes the absolute amplitude bias related to depth-dependent coupling, fiber response, or geometrical effects and emphasizes the relative variations in sand-related acoustic energy. The normalized RMS profile was subsequently smoothed using a depth-domain Gaussian filter to suppress short-wavelength fluctuations and highlight laterally persistent sand-producing intervals.
The resulting normalized and smoothed RMS amplitudes were scaled to a dimensionless range consistent with published DAS sand logs, allowing for a direct qualitative comparison with existing field studies. The final sand log is expressed as the normalized sand acoustic amplitude versus depth, providing a depth-resolved representation of the relative sand transport intensity.
For quality control and visualization, the sand log was plotted alongside the filtered DAS image over the same depth and time windows. This combined display enables a direct correlation between visually identified sand events in the DAS records and the corresponding amplitude peaks in the sand log.
4. Results and Discussion
4.1. Results
4.1.1. Visualization of Sand Signatures in Filtered DAS Data
Figure 15 displays the low-pass filtered DAS image (≤20 Hz) for the production interval (channels 220–337; 1136–1909 m TVD) during the initial two hours of monitoring. With high-frequency noise suppressed, the DAS records revealed sparse, short-duration, high-amplitude acoustic bursts distributed unevenly along the wellbore. These transient events manifest as localized, vertically confined amplitude spikes, which align with the anticipated acoustic response from sand particle impacts and collisions within the wellbore and completion hardware. Figure 15 highlights the low-frequency (≤20 Hz) filtered DAS image for the production interval (channels 200–337; ~1136–1909 m TVD) over the first two hours of the acquisition. The display accentuates sparse, short-duration, high-amplitude acoustic bursts (red features), interpreted as transient sand transport events. These events are distributed both temporally and spatially along the deviated wellbore, indicating non-uniform sand mobilization across the perforated intervals. Background noise was significantly reduced by band-limited filtering, enhancing the visual distinction of sand-related acoustic energy.
Figure 15.
Filtered DAS response highlighting sand transport signatures in the production zone after applying a ≤20 Hz low-pass filter to the selected channel interval. The filtered DAS section reveals discrete burst-like acoustic events associated with sand transport.
The sand signatures are not continuous over time but occur intermittently, reflecting the transient nature of sand transport during production. This observation supports the interpretation that sanding in this well is episodic rather than steady state, likely driven by fluctuating flow conditions, pressure drawdown, and local formation failures. In contrast, background acoustic energy exhibits a more laterally continuous and temporally persistent character, allowing for clear discrimination between sand-related events and ambient operational noise.
Depth-wise, the sand signatures were concentrated within discrete intervals of the production zone, whereas other sections remained comparatively quiet. This spatial variability indicates a non-uniform sand contribution along the perforated interval, emphasizing the value of DAS for depth-resolved sand monitoring in deviated wells, where conventional point sensors provide limited coverage.
4.1.2. Sand Signature Enhancement and Depth Correlation
Figure 16 presents a combination of the filtered DAS image (left) and the corresponding depth-resolved sand log (right). The filtered DAS visualization emphasizes the spatial clustering of sand events, whereas the sand log quantitatively summarizes the cumulative acoustic energy associated with these events as a function of depth. In Figure 16 (left), the low-pass filtered DAS image (≤20 Hz) reveals discrete sand-related acoustic bursts within the production zone during the 0–2 h time window. In Figure 16, the sand signatures appear as isolated, short-lived, and high-amplitude anomalies superimposed on low-energy background noise. On the right, the corresponding depth-resolved sand log was derived from the normalized RMS acoustic amplitude integrated over the same time window. Peaks in the sand log aligned with depth intervals exhibiting persistent sand-related acoustic activity, demonstrating consistency between event-level DAS observations and the aggregated sand intensity profile.
Figure 16.
Production-zone sand signature visualization and derived sand log.
A strong correspondence was observed between the depth intervals exhibiting repeated high-amplitude DAS events and the peaks in the sand log. Depth zones characterized by frequent and intense transient bursts contribute disproportionately to the integrated RMS acoustic amplitude, resulting in pronounced sand-log maxima. Conversely, intervals with sparse or absent sand signatures corresponded to low sand log amplitudes.
This consistency demonstrates that the sand log effectively captures the dominant sand-producing intervals observed in the DAS image, translating complex time-dependent acoustic behavior into an interpretable, one-dimensional diagnostic. Importantly, the sand log preserves relative variations in sand activity rather than absolute amplitude, allowing a direct comparison of sanding intensity between different depth intervals within the production zone.
4.1.3. Sand Log Characteristics and Interpretation
Figure 17 illustrates the final normalized DAS sand log as a function of the depth. The sand log revealed several distinct amplitude peaks, indicating specific depth intervals with heightened sand-related acoustic energy. These peaks suggest localized points of sand ingress or zones of increased sand transport, likely linked to perforation clusters, formation heterogeneity, and completion features. Figure 17 shows the DAS-derived sand log, which displays the normalized RMS acoustic amplitude as a function of depth (TVD) within the production zone. The log represents the cumulative sand-related acoustic energy over the initial 2 h of production, following low-frequency filtering and normalization. Elevated amplitudes indicate zones of intensified sand transport, providing a continuous, high-resolution proxy for sand production intensity along the deviated wellbore.
Figure 17.
Depth-resolved DAS sand log based on normalized RMS acoustic amplitude.
The absence of uniformly elevated amplitudes across the production interval suggests that sand production is unevenly distributed along the wellbore. Instead, sand transport appears to be dominated by a limited number of depth intervals that act as the primary contributors. This behavior is consistent with field observations in sand-prone reservoirs, where sanding is often controlled by localized mechanical failure or stress concentration rather than bulk reservoir properties.
Normalization of the sand log enables qualitative comparison with published DAS sand monitoring studies, in which the normalized acoustic amplitude is commonly used to represent relative sand intensity. Although the sand log does not provide a direct measure of sand mass flow, it offers a reliable proxy for identifying high-risk zones and ranking intervals based on relative sanding activity.
4.1.4. Operational Implications
The findings indicate that DAS-VSP serves as an effective instrument for real-time, depth-resolved sand monitoring in offshore deviated wells. The capability to pinpoint sanding events along the production interval enables operators to identify problematic zones that may necessitate intervention, such as selective shutoff, drawdown adjustment, or targeted sand control measures. Moreover, the episodic nature of the detected sand events underscores the significance of continuous monitoring of these events. Short-lived sanding events may be overlooked by conventional surface or point-based sensors, whereas DAS captures their complete spatial and temporal evolution. The sand log framework developed in this study offers a practical and scalable approach for integrating DAS observations into the operational workflows.
4.2. Discussion
4.2.1. Origin of Low-Frequency Sand Signatures in the Present DAS-VSP Study
Laboratory experiments and field-scale DAS investigations consistently report that sand production signatures are most prominent within the 50–500 Hz frequency band, where grain-tubing or grain-casing impacts generate impulsive, high-frequency acoustic emissions [31,34,36]. These studies form the prevailing basis for sand detection workflows that emphasize mid- to high-frequency signal content. However, the sand signatures identified in the present study were predominantly concentrated below 20 Hz, representing a systematic downward shift in the characteristic frequency range relative to published benchmarks.
Despite this frequency discrepancy, the detected signals in this study exhibited all other defining characteristics of sand production reported in prior studies, namely, discrete high-amplitude spikes, strong spatial localization within the perforated production interval, intermittent burst-like temporal behavior, and clear differentiation from continuous flow-related noise. This consistency strongly suggests that the observed low-frequency signals are not artifacts or flow-induced noise but represent a sand transport regime governed by distinct physical and operational conditions.
4.2.2. Influence of Sand Grain Size and Size Distribution
One primary factor influencing the observed low-frequency dominance is the sand grain size and its distribution. Larger sand grains or agglomerated particles impart greater momentum during collisions with the tubing, casing, or completion components. These impacts excite lower-frequency structural and fluid-coupled vibrations with longer wavelengths and reduced attenuations along the wellbore. In contrast, finer grains generate weaker and higher-frequency emissions that attenuate rapidly and are more readily masked by background noise. The prevalence of low-frequency sand signatures in this study suggests the transport of relatively coarse sand or clustered grain impacts, consistent with transient sanding events rather than sustained fine production.
4.2.3. Role of Flow Velocity and Transport Regime
Flow velocity strongly controls the energy transfer mechanisms between the sand grains and the wellbore infrastructure. Under moderate flow velocities, which are typical of early transient sanding or post-startup conditions, sand grains tend to roll, slide, or intermittently impact completion elements, generating low-frequency, high-energy acoustic responses. At higher velocities, particle impacts become more frequent and energetic, producing broadband and higher-frequency signals. The concentration of sand signatures within the first two hours of production in this study indicates a transient transport regime, in which the initial mobilization of formation sand occurs before flow conditions stabilize, favoring low-frequency acoustic excitation.
4.2.4. Effects of Fluid Composition and Multiphase Flow
Fluid properties also exert a strong influence on the sand-related acoustic signatures. Multiphase flow conditions, particularly gas–liquid mixtures, introduce significant damping of high-frequency acoustic energy through scattering and viscous dissipation. Gas bubbles and phase interfaces preferentially attenuate higher frequencies, allowing low-frequency pressure and structural vibrations to propagate more efficiently along the wellbore and fiber. Given the offshore production environment and the presence of gas lift operations in the well, attenuation of higher-frequency sand impact signals is expected, further shifting the detectable sand signature toward lower frequencies.
4.2.5. Completion Design and Structural Coupling
Completion architecture plays a critical role in determining the frequency of DAS-recorded sand signals. In this deviated well, the presence of perforations, inflow control valves (ICVs), and other completion components creates a mechanically complex system that can resonate at low frequencies when excited by the impact of particles. Therefore, sand-induced forces may couple more efficiently into the low-frequency structural modes of the tubing-completion system rather than producing isolated high-frequency impacts. This effect is particularly pronounced in deviated wells, where gravity-driven particle motion and asymmetric flow enhance the intermittent impact dynamics and low-frequency vibration modes.
4.2.6. Implications for DAS-Based Sand Monitoring
The results of this study demonstrate that although the canonical frequency range for DAS-detected sand production is often cited as 50–500 Hz, sand signatures can manifest at significantly lower frequencies under specific reservoir, flow, and completion conditions. This finding underscores the importance of adaptive, data-driven frequency analysis rather than relying on fixed-band detection thresholds. Low-frequency DAS analysis, when combined with spatial localization and temporal intermittency criteria, provides a robust means of detecting sand production that may otherwise be overlooked by conventional high-frequency focused workflows.
Overall, the observed low-frequency sand signatures in this offshore deviated well are consistent with a transient sanding mechanism involving coarse or clustered grains, moderate flow velocities, multi-phase damping effects, and strong structural coupling within the completion system. These insights expand the operational applicability of DAS-VSP for sand monitoring and highlight its sensitivity to the diverse sand transport regimes encountered in real-field production environments.
5. Conclusions
This study demonstrates the successful implementation of distributed acoustic sensing (DAS) for real-time monitoring and relative quantification of sand ingress in a producing deviated well. By concentrating on the production interval (channels 200–337; approximately 1136–1909 m TVD), the proposed workflow integrated raw DAS visualization, targeted signal conditioning, and depth-resolved amplitude analysis to produce a quantitative sand log. The raw DAS response revealed numerous impulsive acoustic bursts consistent with sand particle impacts on the wellbore and completion components.
The application of detrending, amplitude normalization, and low-pass filtering below 20 Hz significantly enhanced the visibility of sand-induced acoustic signatures while preserving their intrinsic temporal intermittency and spatial localization. Contrary to many published studies that associate sand production with higher-frequency DAS energy, the results indicate that the most diagnostic sand-impact energy in this well was concentrated at low frequencies. This behavior is attributed to a combination of transient sanding, sand grain size and distribution, multiphase flow conditions, and the structural response of the deviated well and completion design. When combined with spatial confinement to perforated intervals and burst-like temporal behavior, these low-frequency signals provide a reliable indicator of sand ingress, rather than flow-related or operational noise.
The sand log, derived from the normalized RMS amplitude, offers a stable and interpretable representation of sand production along the wellbore. Several depth intervals exhibited consistently elevated amplitudes, indicating sustained sand production and non-uniform inflow behavior. These intervals closely correspond to clusters of high-energy events observed in the filtered DAS image, thereby confirming the robustness and internal consistency of the detection methodology. The depth resolution and sensitivity of the resulting sand log were comparable to those reported in previous DAS-based sand monitoring studies, further validating the approach.
The findings substantiate that DAS can effectively detect and characterize sand ingress without the necessity for dedicated downhole sand probes. It is demonstrated that low-frequency (<20 Hz) DAS components may contain the most diagnostic sand-related energy under specific reservoir and completion conditions. Furthermore, normalized root mean square (RMS) amplitude offers a practical and quantitative metric for constructing sand logs. The proposed workflow is well-suited for integration into routine production surveillance, facilitating early sand detection, enhanced choke management, and targeted remedial actions. With further optimization, such as automated event detection, adaptive thresholding, or machine learning-based classification, DAS holds significant potential to become a primary tool for continuous, field-wide sand monitoring in both new and mature producing assets.
6. Challenges and Future Directions
Sand monitoring using DAS is centered on the necessity for high-fidelity data processing and sophisticated analytical methodologies to accurately identify sand events within complex wellbore acoustic environments. The ongoing advancement of integrated fiber-optic sensing technologies, including DAS, distributed temperature sensing (DTS), and strain sensing, is anticipated to substantially enhance sand monitoring, wellbore integrity assessment, and autonomous production optimization. DAS has swiftly become a prominent technology for detecting downhole sand transport in oil and gas wells, fundamentally improving the monitoring, mitigation, and production management strategies in sand-prone reservoirs. Despite these benefits, challenges remain in areas such as data storage, interpretation, and fiber installation quality, particularly in offshore wells. Furthermore, the complexity of the interpretation is exacerbated by multiphase flow noise, downhole vibrations, and variable fiber coupling, necessitating ongoing advancements in signal processing and data analytics. Current research efforts are increasingly directed towards integrating DAS with multiparameter monitoring, autonomous alerting systems, and advanced visualization tools to facilitate real-time operational decision-making for effective sand management in contemporary oil and gas fields.
Author Contributions
D.T.A.: conceptualization, data processing, signal analysis, investigation, methodology, writing—original draft, writing—review and editing; A.H.A.L.: supervision, project administration, funding acquisition, resources, writing—review and editing; H.S.: supervision, writing—review and editing; A.R.M.A.: methodology, writing—review and editing; A.R.: writing—review and editing, validation; I.B.S.Y.: writing—review and editing, software: D.A.O.: writing—review and editing, software: A.M.: review and editing, validation; R.R.D.: investigation, review and editing. All authors have read and agreed to the published version of the manuscript.
Funding
The authors gratefully acknowledge the unwavering support of Universiti Teknologi PETRONAS, particularly the Centre for Subsurface Seismic Imaging and Hydrocarbon Prediction (CSI), for their invaluable contributions to this research. We also extend our sincere appreciation to Total Energies for their financial backing through Grant No. 015MD0-164.
Institutional Review Board Statement
Not applicable.
Informed Consent Statement
Not applicable.
Data Availability Statement
The data supporting the findings of this study were provided by PETRONAS and are subject to confidentiality and commercial restrictions. Therefore, the data is not publicly available.
Acknowledgments
We thank PETRONAS for providing the data for this research.
Conflicts of Interest
The authors declare that they have no known competing financial interests or personal relationships that could have appeared to influence the work reported in this paper.
Abbreviations
The following abbreviations are used in this article.
| AOM | Acousto-optic Modulator |
| ASD | Surface Acoustic Sand Detector |
| Bpd | Barrels per day |
| CFD | Computational Fluid Dynamics |
| DAS | Distributed Acoustic Sensing |
| DTS | Distributed Temperature Sensing |
| ESPs | Electrical Submersible Pumps |
| FBE | Frequency Band Energy |
| FFT | Fast Fourier Transform |
| GLV | Gas-lift Valves |
| HPHT | High-pressure, high-temperature |
| ICV | Inflow Control Valve |
| IU | Interrogator Unit |
| IWAG | Immiscible water-alternating gas |
| OBN | Ocean-Bottom Node |
| OH− | Interstitial Hydroxyl |
| PSCF | Pure silica-core Fiber |
| RMS | Root Mean Square |
| STFT | Short-Time Fourier Transform |
| VSP | Vertical Seismic Profiling |
References
- Shetty, R. Detecting Sand Ingress and Migration Using Fiber Optic Distributed Acoustic Sensing Technology and Computational Fluid Dynamics During Oil and Gas Production. Ph.D. Thesis, Louisiana State University, Baton Rouge, LA USA, 2024. [Google Scholar]
- Gietz, H.; Sharma, J.; Tyagi, M. Machine Learning for Automated Sand Transport Monitoring in a Pipeline Using Distributed Acoustic Sensor Data. IEEE Sens. J. 2024, 24, 22444–22457. [Google Scholar] [CrossRef] [Scilit]
- Oladipupo, A.D.; Johnson, I.F.; Adebayo, O.O.; Fashanu, T.A.; Abhulimen, K.E. Leveraging Data-driven Approach for Sand Production Prediction and Management in Oil and Gas Wells. Pet. Sci. Eng. 2025, 9, 67–83. [Google Scholar] [CrossRef] [Scilit]
- Carpenter, C. Study Reviews Two Decades of Surveillance Using Distributed Acoustic Sensing. J. Pet. Technol. 2023, 75, 54–57. [Google Scholar] [CrossRef] [Scilit]
- Tahir, M.U.; Guo, S. Preliminary Investigation of Fracture Behavior during Carbon Dioxide Fracturing of Natural Hydrogen Reservoir with Hard-Core Imperfections. Reserv. Sci. 2026, 2, 34–51. [Google Scholar] [CrossRef] [Scilit]
- Yang, Y.; Huang, F.; Kang, S. Mechanism of Penetration Rate Improvement in Hot Dry Rock Under the Coupling of Impact Load and Confining Pressure Release. Reserv. Sci. 2026, 2, 52–64. [Google Scholar] [CrossRef] [Scilit]
- Hopkins, J.; Mateeva, A.; Harvey, S.; Kiyashchenko, D.; Duan, Y. Maturing DAS VSP as an Onshore CCUS monitoring technology at the Quest CCS Facility. In Proceedings of the Geoconvention, Online, 13–15 September 2021; pp. 1–5. Available online: https://geoconvention.com/wp-content/uploads/abstracts/2021/67259-maturing-das-vsp-as-an-onshore-ccus-monitoring-tec.pdf (accessed on 6 February 2026).
- Li, Y.; Karrenbach, M.; Ajo-Franklin, J.B. A Literature Review: Distributed Acoustic Sensing (DAS) Geophysical Applications over the Past 20 Year; AGU: Washington, DC, USA, 2021. [Google Scholar] [CrossRef] [Scilit]
- Rasool, M.H.; Ridha, S.; Halim, A.; Latif, A.; Krishna, S. Industrial Adoption of Distributed Acoustic Sensing (DAS) in Petroleum Engineering and Geosciences: Real-World Evidence. J. Pet. Chem. Eng. 2025, 1, 22–29. [Google Scholar]
- Otchere, D.A.; Latiff, A.H.; Tackie-Otoo, B.N. Distributed acoustic sensing in subsurface applications—Review and potential integration with artificial intelligence for an intelligent CO2 storage monitoring system. Geoenergy Sci. Eng. 2024, 237, 212818. [Google Scholar] [CrossRef] [Scilit]
- Rapor, N.M. A Critical Review on Sand Production Prediction Methods and Mitigation for Chemical Enhanced Oil Recovery (CEOR) Wells. Bachelor’s Thesis, Universiti Teknologi PETRONAS, Seri Iskandar, Malaysia, 2015. [Google Scholar]
- Asfha, D.T.; Latiff, A.H.A.; Otchere, D.A.; Tackie-Otoo, B.N.; Babikir, I.; Rafi, M.; Riyadi, Z.A.; Putra, A.D.; Adeniyi, B.A. Mechanisms of sand production, prediction–A review and the potential for fiber optic technology and machine learning in monitoring. J. Pet. Explor. Prod. Technol. 2024, 14, 2577–2616. [Google Scholar] [CrossRef] [Scilit]
- Shetty, R.; Sharma, J.; Tyagi, M. Experimental Study on Sand Detection and Monitoring Using Distributed Acoustic Sensing for Multiphase Flow in Horizontal Pipes. SPE J. 2024, 29, 1045–1060. [Google Scholar] [CrossRef] [Scilit]
- Palmieri, L.; Schenato, L.; Santagiustina, M.; Galtarossa, A. Rayleigh-Based Distributed Optical Fiber Sensing. Sensors 2022, 22, 6811. [Google Scholar] [CrossRef] [Scilit]
- Rafi, M.; Noh, K.A.M.; Latiff, A.H.A.; Otchere, D.A.; Tackie-Otoo, B.N.; Putra, A.D.; Riyadi, Z.A.; Asfha, D.T. Application of Distributed Acoustic Sensing in Geophysics Exploration: Comparative Review of Single-Mode and Multi-Mode Fiber Optic Cables. Appl. Sci. 2024, 14, 5560. [Google Scholar] [CrossRef] [Scilit]
- Adeniyi, B.A.; Latiff, A.H.A.; Adedeji, Z.O.; Arshad, A.R.M.; Asfha, D.T. Directional sensitivity of fibre optic cables for surface seismic reflection distributed acoustic sensing: A review and potential solutions for enhanced sensitivity. Géoméch. Geophys. Geo-Energy Geo-Resour. 2025, 11, 60. [Google Scholar] [CrossRef] [Scilit]
- Bao, X.; Chen, L. Recent Progress in Distributed Fiber Optic Sensors. Sensors 2012, 12, 8601–8639. [Google Scholar] [CrossRef] [Scilit]
- Gorshkov, B.G.; Yüksel, K.; Fotiadi, A.A.; Wuilpart, M.; Korobko, D.A.; Zhirnov, A.A.; Stepanov, K.V.; Turov, A.T.; Konstantinov, Y.A.; Lobach, I.A. Scientific Applications of Distributed Acoustic Sensing: State-of-the-Art Review and Perspective. Sensors 2022, 22, 1033. [Google Scholar] [CrossRef] [Scilit] [PubMed]
- Majdi, A.; Rashid, A.; Latiff, A.A.; Rafi, M.; Asfha, D.; Adeniyi, B.; Putra, A.; Ibrahim, M. Comparative Analysis of Interrogator Unit Performance in Surface Seismic DAS: Case Study in a Campus Area. In 5th EAGE Workshop on Fiber Optic Sensing for Energy Applications; European Association of Geoscientists & Engineers: AJ Bunnik, The Netherlands, 2025; Volume 2025, pp. 1–5. [Google Scholar] [CrossRef] [Scilit]
- Rashid, A.; Tackie-Otoo, B.N.; Abdul Latiff, A.H.; Otchere, D.A.; Jamaludin, S.N.F.; Asfha, D.T. Research Advances on Distributed Acoustic Sensing Technology for Seismology. Photonics 2025, 12, 196. [Google Scholar] [CrossRef] [Scilit]
- Vikram, A.; Patel, S.K.; Chaturvedi, A.; Alsalman, O.; Parmar, J. Detecting accurate parametric intrusions using optical fiber sensors for long-distance data communication system. Opt. Fiber Technol. 2023, 80, 103453. [Google Scholar] [CrossRef] [Scilit]
- Kimbell, J.F. History and Analysis of Distributed Acoustic Sensing (DAS) for Oilfield Applications. Master’s Thesis, Texas A&M University, College Station, TX, USA, 2013. [Google Scholar]
- Rashid, A.; Latiff, A.A.; Putra, A.; Rafi, M.; Arshad, A.M.; Babikir, I.; Majdi, A.; Adeniyi, B. Comparative Study of Distributed Acoustic Sensing (DAS) and Geophone Response in Geothermal and Groundwater Systems. In 5th EAGE Workshop on Fiber Optic Sensing for Energy Applications; European Association of Geoscientists & Engineers: AJ Bunnik, The Netherlands, 2025; Volume 2025, pp. 1–4. [Google Scholar] [CrossRef] [Scilit]
- Li, X.; Zeng, Y.; Muchiri, N.D.; Yan, W.; Feng, Y. The use of distributed acoustic sensing (DAS) in monitoring the integrity of cement-casing system. J. Pet. Sci. Eng. 2021, 208, 109690. [Google Scholar] [CrossRef] [Scilit]
- Molenaar, M.M.; Hill, D.J.; Webster, P.; Fidan, E.; Birch, B. First Downhole Application of Distributed Acoustic Sensing for Hydraulic-Fracturing Monitoring and Diagnostics. SPE Drill. Complet. 2012, 27, 32–38. [Google Scholar] [CrossRef] [Scilit]
- Russell, S.J.; Hill, D.J. Distributed acoustic sensing (DAS) a real-world perspective, requirements, applications, and techniques. In Proceedings of the 29th International Conference on Optical Fiber Sensors, Porto, Portugal, 22 May 2025; Volume 39639, p. 1363904. [Google Scholar]
- Sun, Y.; Liu, J.; Xue, Z.; Li, Q.; Fan, C.; Zhang, X. A critical review of distributed fiber optic sensing for real-time monitoring geologic CO2 sequestration. J. Nat. Gas Sci. Eng. 2021, 88, 103751. [Google Scholar] [CrossRef] [Scilit]
- Parker, T.; Shatalin, S.; Farhadiroushan, M. Distributed Acoustic Sensing—A new tool for seismic applications. First Break. 2014, 32, 61–69. [Google Scholar] [CrossRef] [Scilit]
- Jabidin, H.Z.; Ibrahim, S.A.; Zan, M.S.; Musa, S.M.; Mansoor, A.; Ngo, H.Y.; Aziz, N.A.; Choo, K.Y.; Bakar, A.A.; Mokhtar, M.R.; et al. Review on Digital Signal Processing (DSP) Algorithm for Distributed Acoustic Sensing (DAS) for Ground Disturbance Detection. Int. J. Integr. Eng. 2024, 16, 102–113. [Google Scholar] [CrossRef]
- Ning, I.L.C.; Barnum, B.; Min, X.; Valjak, M.; Arias, B.; Zhang, Y.; Sun, K.; Isabu, O. Eavesdrop during sand cleanout well intervention with distributed acoustic sensing. In Proceedings of the SEG/AAPG International Meeting for Applied Geoscience & EnergyInternational, Houston, TX, USA, 26–29 August 2024; pp. 493–497. [Google Scholar]
- Thiruvenkatanathan, P.; Langnes, T.; Beaumont, P.; White, D.; Webster, M. Downhole Sand Ingress Detection Using Fibre-Optic Distributed Acoustic Sensors. In Proceedings of the Abu Dhabi International Petroleum Exhibition & Conference, Abu Dhabi, United Arab Emirates, 7–10 November 2016; pp. 1–9. [Google Scholar]
- Gaston, G.B.; Drakeley, B. Monitoring Using Distributed Acoustic Sensing (das) Technology. Google Patents WO2012054635A2, 26 April 2012. Available online: https://patents.google.com/patent/WO2012054635A2/en (accessed on 6 February 2026).
- Muhammad, M.; Rasol, A.A.A. Advances and challenges of sand production and control in oilfields: A review. Results Eng. 2025, 25, 104596. [Google Scholar] [CrossRef] [Scilit]
- Sadigov, T.; Thiruvenkatanathan, P.; Sheydayev, A. Application of Distributed Acoustic Sensing DAS Technology in Identification and Remediation of Sand Producing Zones in OHGP Completion. In Proceedings of the SPE Annual Caspian Technical Conference and Exhibition, Baku, Azerbaijan, 1–3 November 2017; pp. 1–16. [Google Scholar]
- Soroush, M.; Mohammadtabar, M.; Roostaei, M.; Hosseini, S.A.; Fattahpour, V.; Mahmoudi, M.; Keough, D.; Tywoniuk, M.; Mosavat, N.; Cheng, L.; et al. Downhole Monitoring Using Distributed Acoustic Sensing: Fundamentals and Two Decades Deployment in Oil and Gas Industries. In Proceedings of the SPE Conference at Oman Petroleum & Energy Show, Muscat, Oman, 21–23 March 2022. [Google Scholar]
- Bale, D.S.; Satti, R.P.; Failla, R.; Harper, J.; Raggio, J. Recent Advances in Downhole Fiber Optics Modeling & Analytics: Case Studies. In Proceedings of the SPE Western Regional Meeting, Virtual, 20–22 April 2021; pp. 1–16. [Google Scholar]
- Networks, A.S. Offshore Oil and Gas DAS Applications–Alcatel Submarine Networks. Available online: https://www.asn.com/offshore-oil-and-gas-das-applications/ (accessed on 7 February 2026).
- Lellouch, A.; Biondi, B.L. Seismic Applications of Downhole DAS. Sensors 2021, 21, 2897. [Google Scholar] [CrossRef] [Scilit]
- Soroush, M.; Roostaei, M.; Fattahpour, V.; Mahmoudi, M.; Keough, D.; Cheng, L.; Moez, K. Prognostics Thermal Well Management: A Review on Wellbore Monitoring and the Application of Distributed Acoustic Sensing DAS for Steam Breakthrough Detection. In Proceedings of the SPE Thermal Well Integrity and Design Symposium, Banff, AB, Canada, 19–21 November 2019; pp. 1–20. [Google Scholar]
- Sharma, J.; Santos, O.; Ogunsanwo, O.; Ekechukwu, G.K.; Cuny, T.; Almeida, M.; Chen, Y. Fiber-Optic DAS and DTS for monitoring riser gas migration. J. Pet. Sci. Eng. 2023, 220, 111157. [Google Scholar] [CrossRef] [Scilit]
- Palit, H.X.S.; Challener, W.; Lopez, J.; Mandal, S. A multi-modality fiber optic sensing cable for monitoring enhanced geothermal systems. In Proceedings of the PROCEEDINGS, Thirty-Seventh Work, Stanford, CA, USA, 30 January–1 February 2012; p. SGP-TR-194. [Google Scholar]
- Ramos, R.T.; Hawthorne, W.D. Survivability of Optical Fiber for Harsh Environments. In Proceedings of the SPE Annual Technical Conference and Exhibition, Denver, CO, USA, 21–24 September 2008; Volume 5, pp. 3031–3040. [Google Scholar]
- Huang, J.-Y.; Van Roosbroeck, J.; Vlekken, J.; Kinet, D.; Martinez, A.B.; Geernaert, T.; Berghmans, F.; Van Hoe, B.; Lindner, E.; Caucheteur, C. Effect of hydrogen gas on FBG-based optical fiber sensors for downhole pressure and temperature monitoring. Opt. Express 2019, 27, 5487–5501. [Google Scholar] [CrossRef] [Scilit]
- Fenta, M.C.; Potter, D.K.; Szanyi, J. Fibre Optic Methods of Prospecting: A Comprehensive and Modern Branch of Geophysics. Surv. Geophys. 2021, 42, 551–584. [Google Scholar] [CrossRef] [Scilit]
- Gillooly, A.; Hankey, J.; Hill, M.; Cooper, L.; Bergonzo, A. Design and performance of a high temperature/high pressure, hydrogen tolerant, bend insensitive single-mode fiber for downhole seismic systems and applications. In Proceedings of the SPIE Sensing Technology + Applications, Baltimore, MD, USA, 18 June 2014; Volume 9098, pp. 33–39. [Google Scholar]
- Adeniyi, B.; Latiff, A.H.A.; Adedeji, Z.; Majdi, A.; Rashid, A. Impact of Cable Materials and Soil Properties on the Sensitivity of Shaped Fibres for DAS. In 5th EAGE Workshop on Fiber Optic Sensing for Energy Applications; European Association of Geoscientists & Engineers: AJ Bunnik, The Netherlands, 2025; Volume 2025, pp. 1–5. [Google Scholar] [CrossRef] [Scilit]
- Optics, N.F. 8 Benefits of Distributed Acoustic Sensing (DAS) in the Oil & Gas Industry. Available online: https://www.nbg.tech/8-benefits-of-das-for-oilgas/ (accessed on 7 February 2026).
- Wang, K.; Liu, G.; Li, Y.; Wang, J.; Wang, G.; Qin, M.; Yi, L. An investigation of the detection of acoustic sand signals from the flow of solid particles in pipelines. Chem. Eng. Res. Des. 2019, 144, 272–284. [Google Scholar] [CrossRef] [Scilit]
- Ram, K.S.; Hoon, P.J.; Yeon, H.J. A Hybrid Noise Reduction And Normalization Framework For Improving Multimodal Sensor Data Quality In Real-Time Systems. J. Technol. Inform. Eng. 2025, 4, 350–368. [Google Scholar] [CrossRef] [Scilit]
- Morley, C.K.; Tingay, M.; Hillis, R.; King, R. Relationship between structural style, overpressures, and modern stress, Baram Delta Province, northwest Borneo. J. Geophys. Res. 2008, 113, 1–23. [Google Scholar] [CrossRef] [Scilit]
- Asfha, D.T.; Gebretsadik, H.T.; Latiff, A.H.A.; Rahmani, O. Predictive pore pressure modeling using well-log data in the West Baram Delta, offshore Sarawak Basin, Malaysia. Géoméch. Geophys. Geo-Energy Geo-Resour. 2024, 10, 196. [Google Scholar] [CrossRef] [Scilit]
- Asfha, D.T.; Gebretsadik, H.T.; Yusoff, W.I.W. Pore Pressure Prediction using Well-Logging Data in the West Baram Delta, Offshore Sarawak Basin, Malaysia. Int. J. Recent Technol. Eng. 2019, 8, 9172–9178. [Google Scholar] [CrossRef] [Scilit]
- Asfha, D.T. Pore Pressure Prediction and Modeling Using Well-Log Data in West Baram Delta, Offshore Sarawak Basin, Malaysia. Master’s Thesis, Universiti Teknologi PETRONAS, Seri Iskandar, Malaysia, 2020. [Google Scholar]
- Bello, A.; Jamaludin, S.N.F.B.; Salisu, M.H.; Bello, S. Seismic and Geomechanical characterisation of seals in the deep carbonate reservoir of the KX field, offshore sarawak: Implications for CO2 storage. J. Pet. Explor. Prod. Technol. 2025, 15, 195. [Google Scholar] [CrossRef] [Scilit]
- Rijks, E.; Berhad, L.S.S. Baram Delta geology and hydrocarbon occurrence. Bull. Geol. Soc. Malays. 1981, 14, 1–18. [Google Scholar] [CrossRef] [Scilit]
- Kasim, A.; Wijnands, F.M.; Subbiah, S.K. Bokor—A New Look at Sand Production in a Mature Field. SPE Drill. Complet. 2008, 23, 415–423. [Google Scholar] [CrossRef] [Scilit]
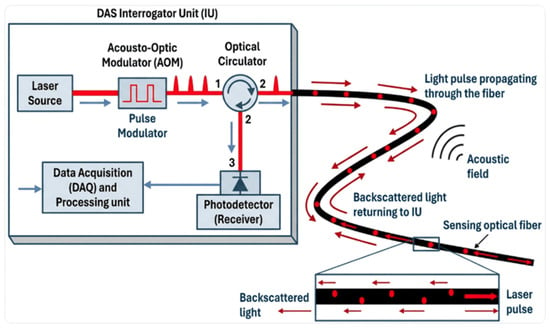
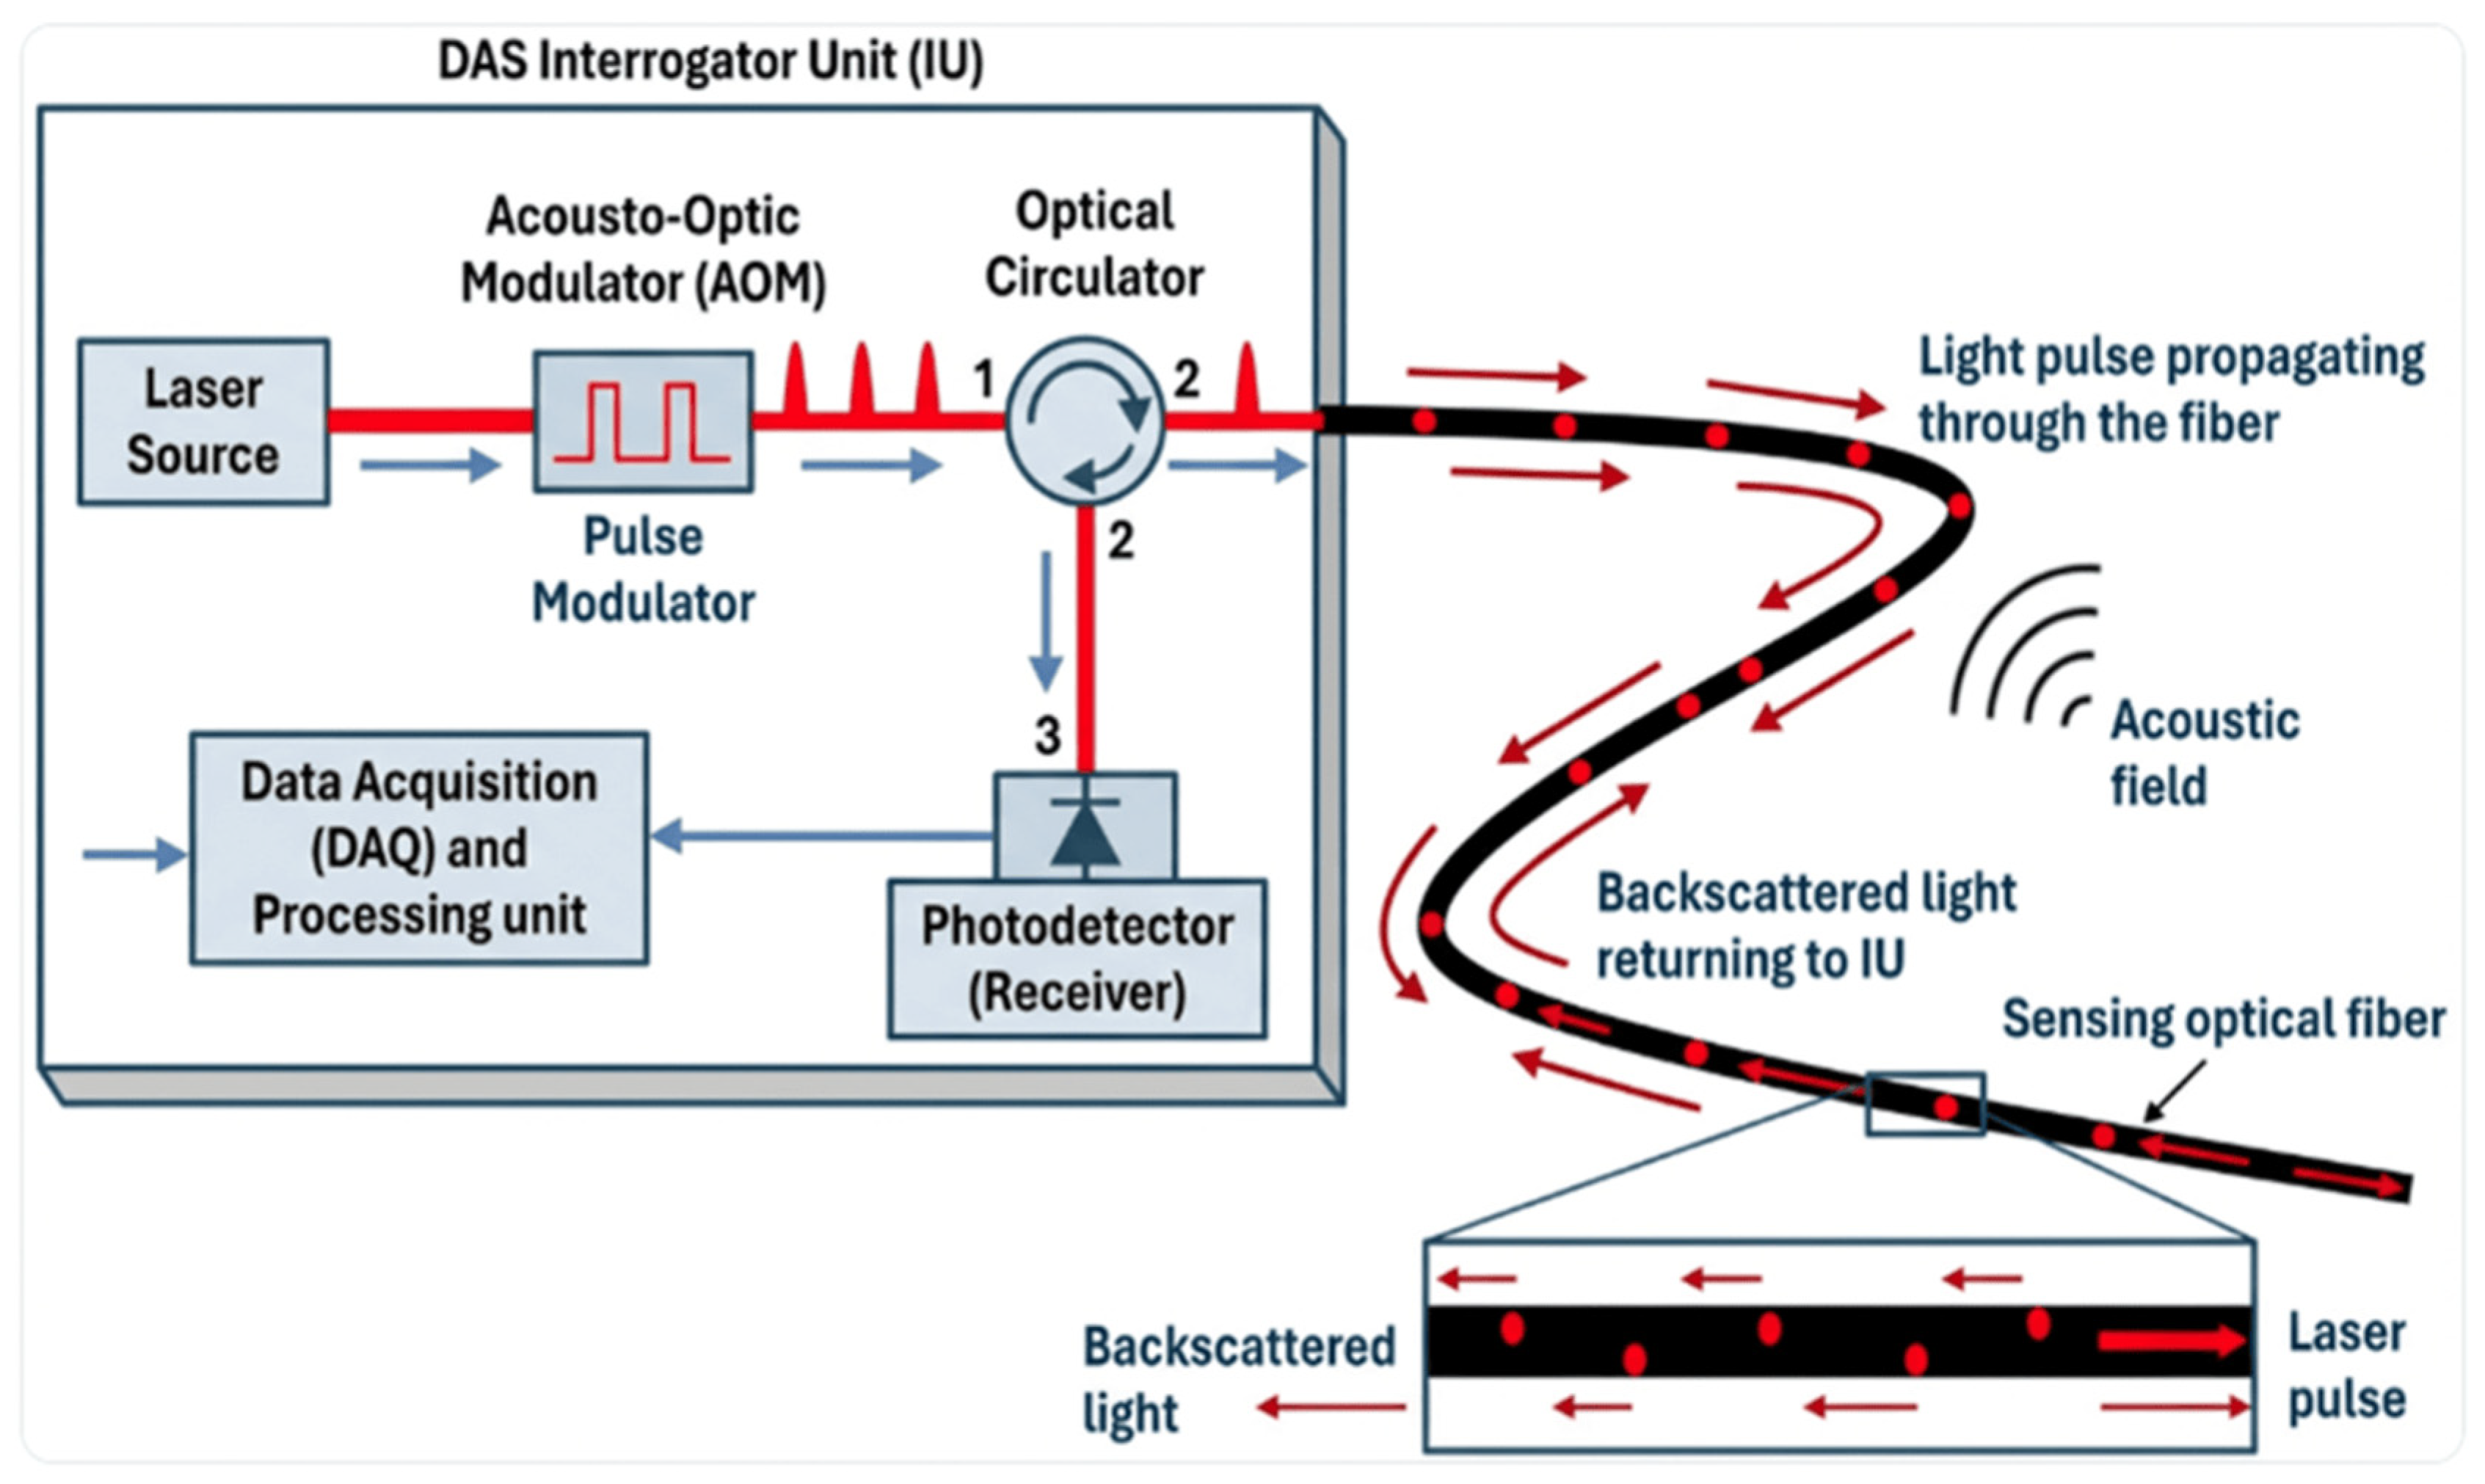
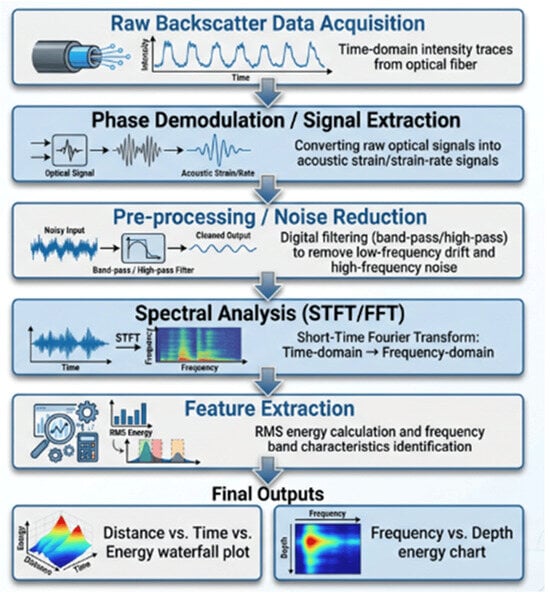
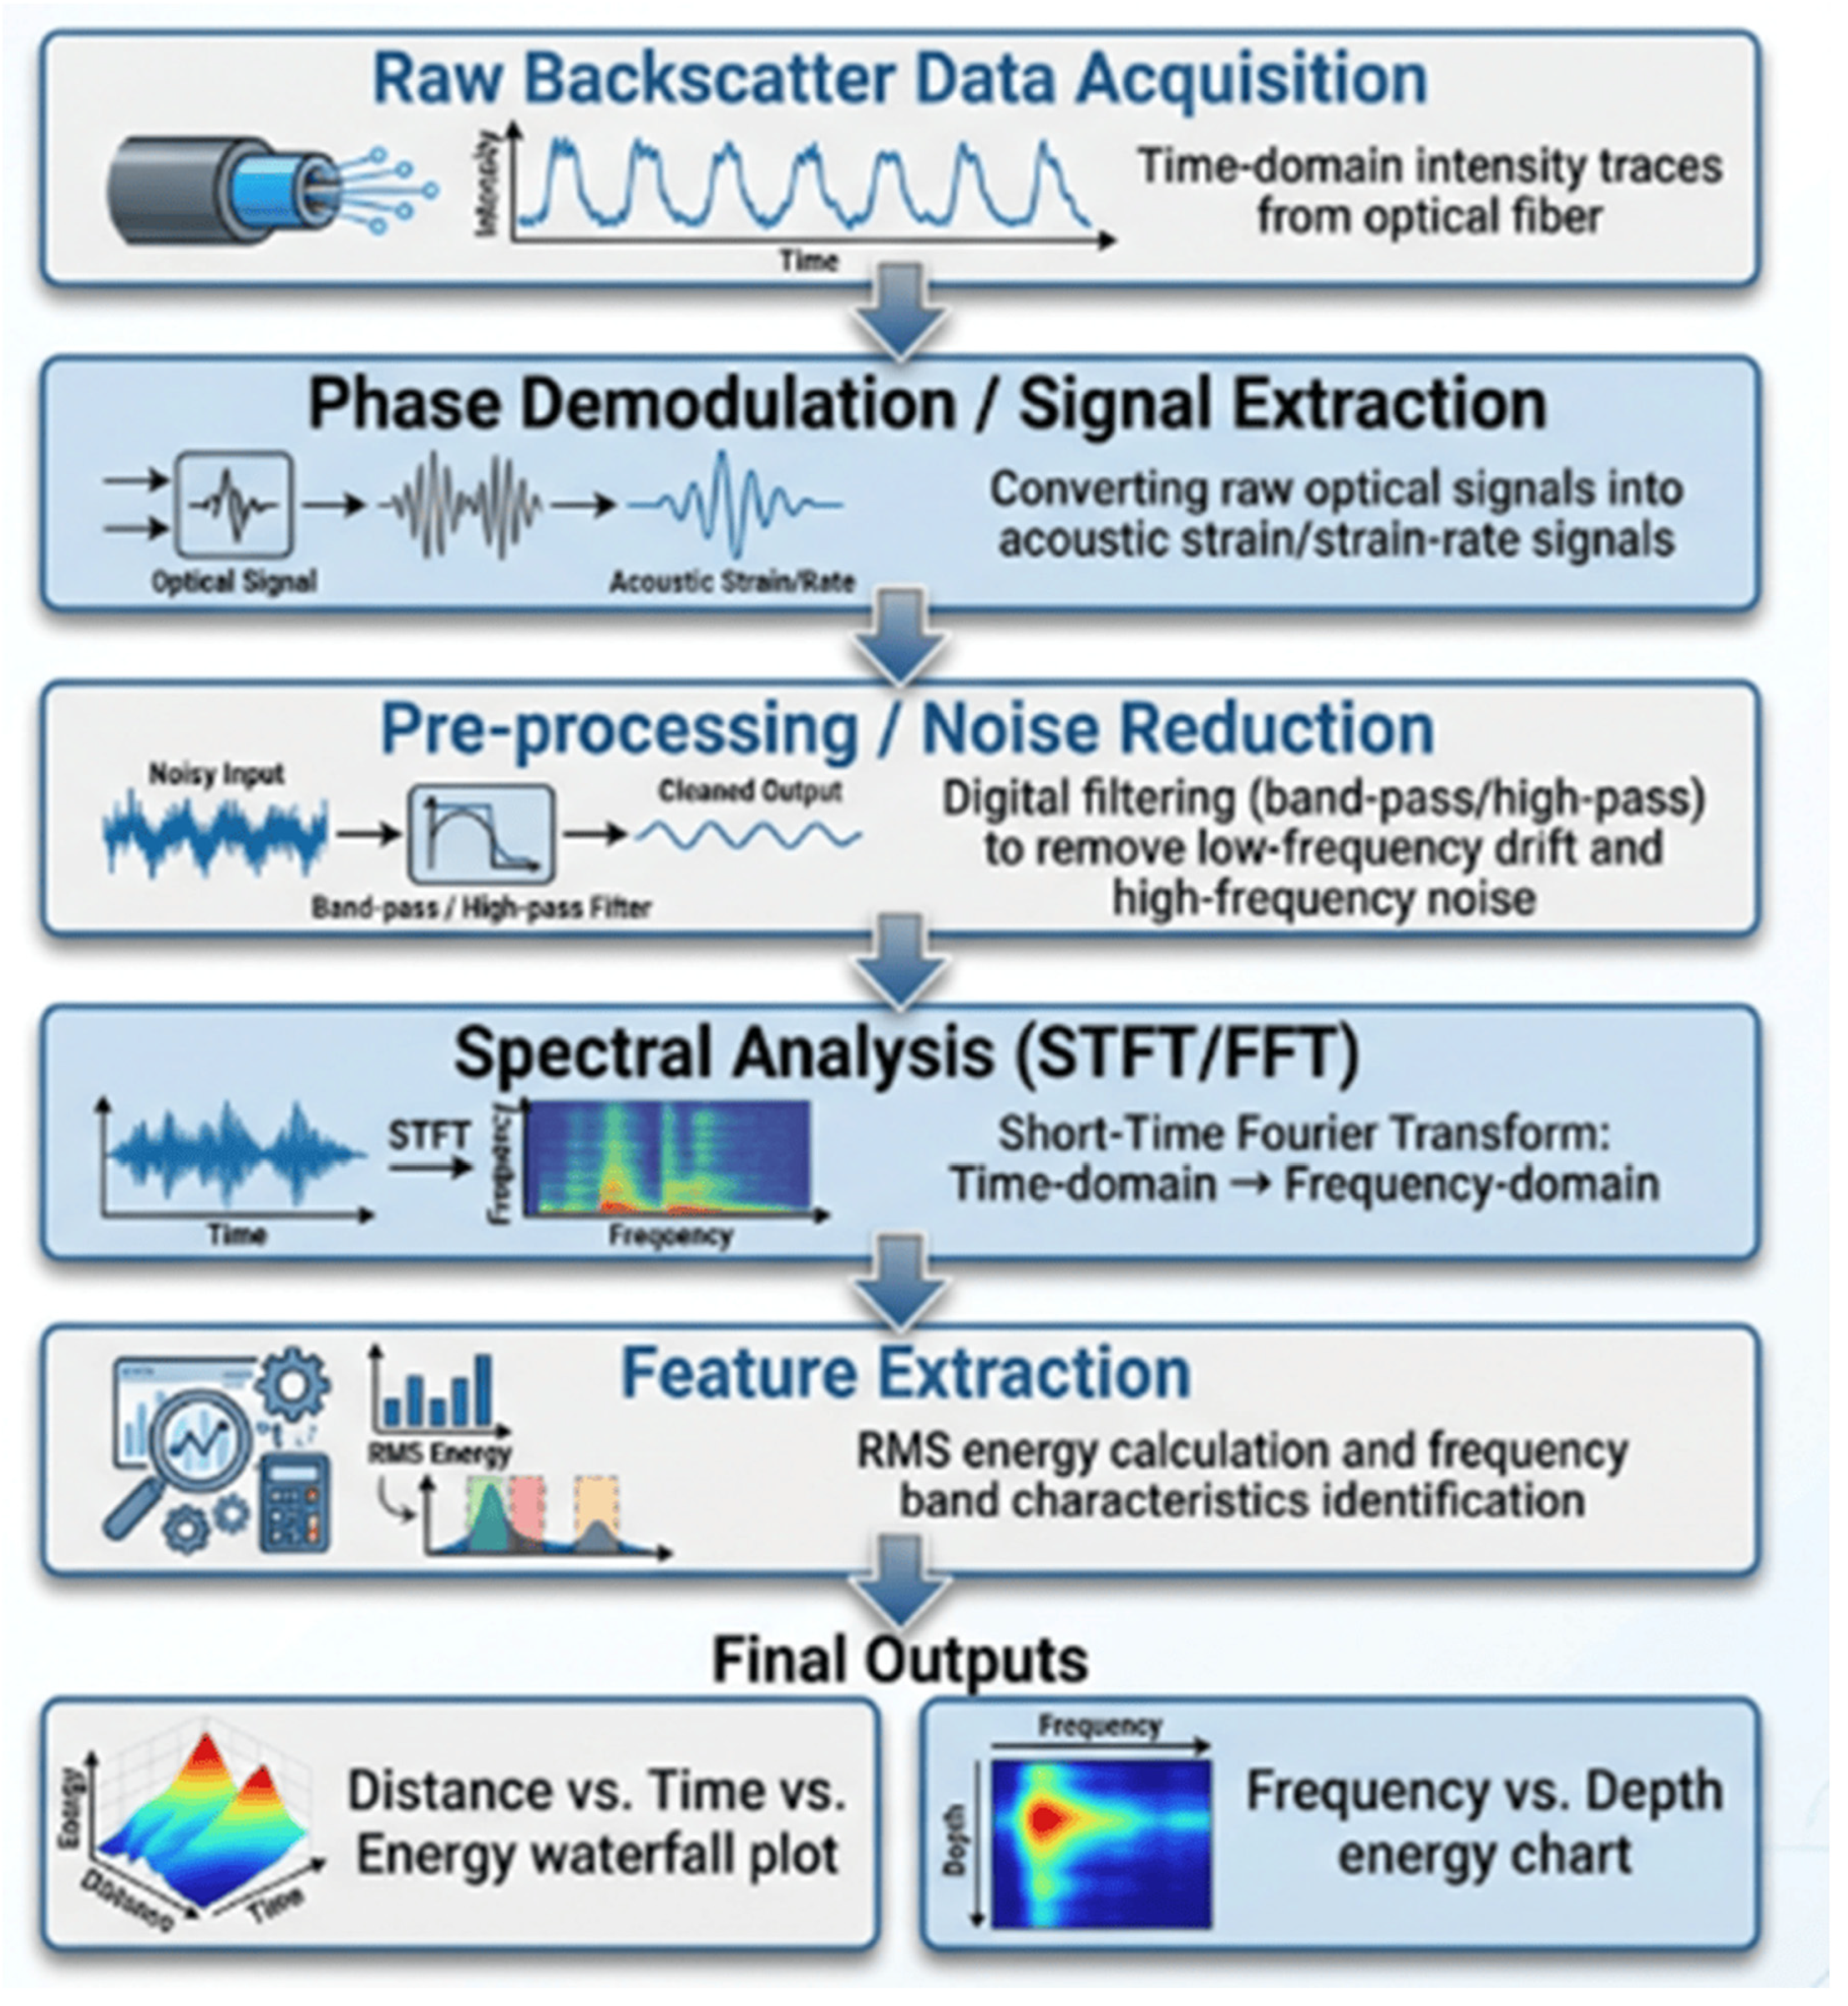
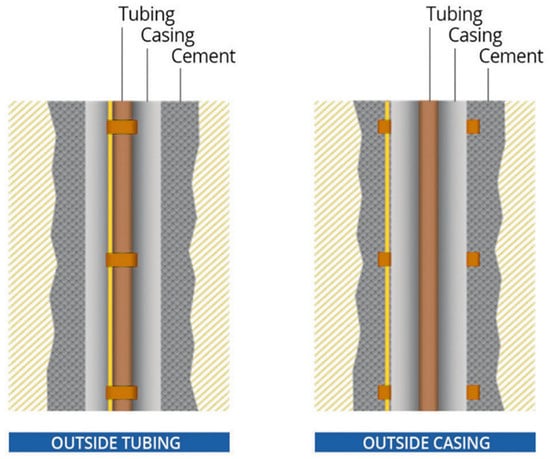
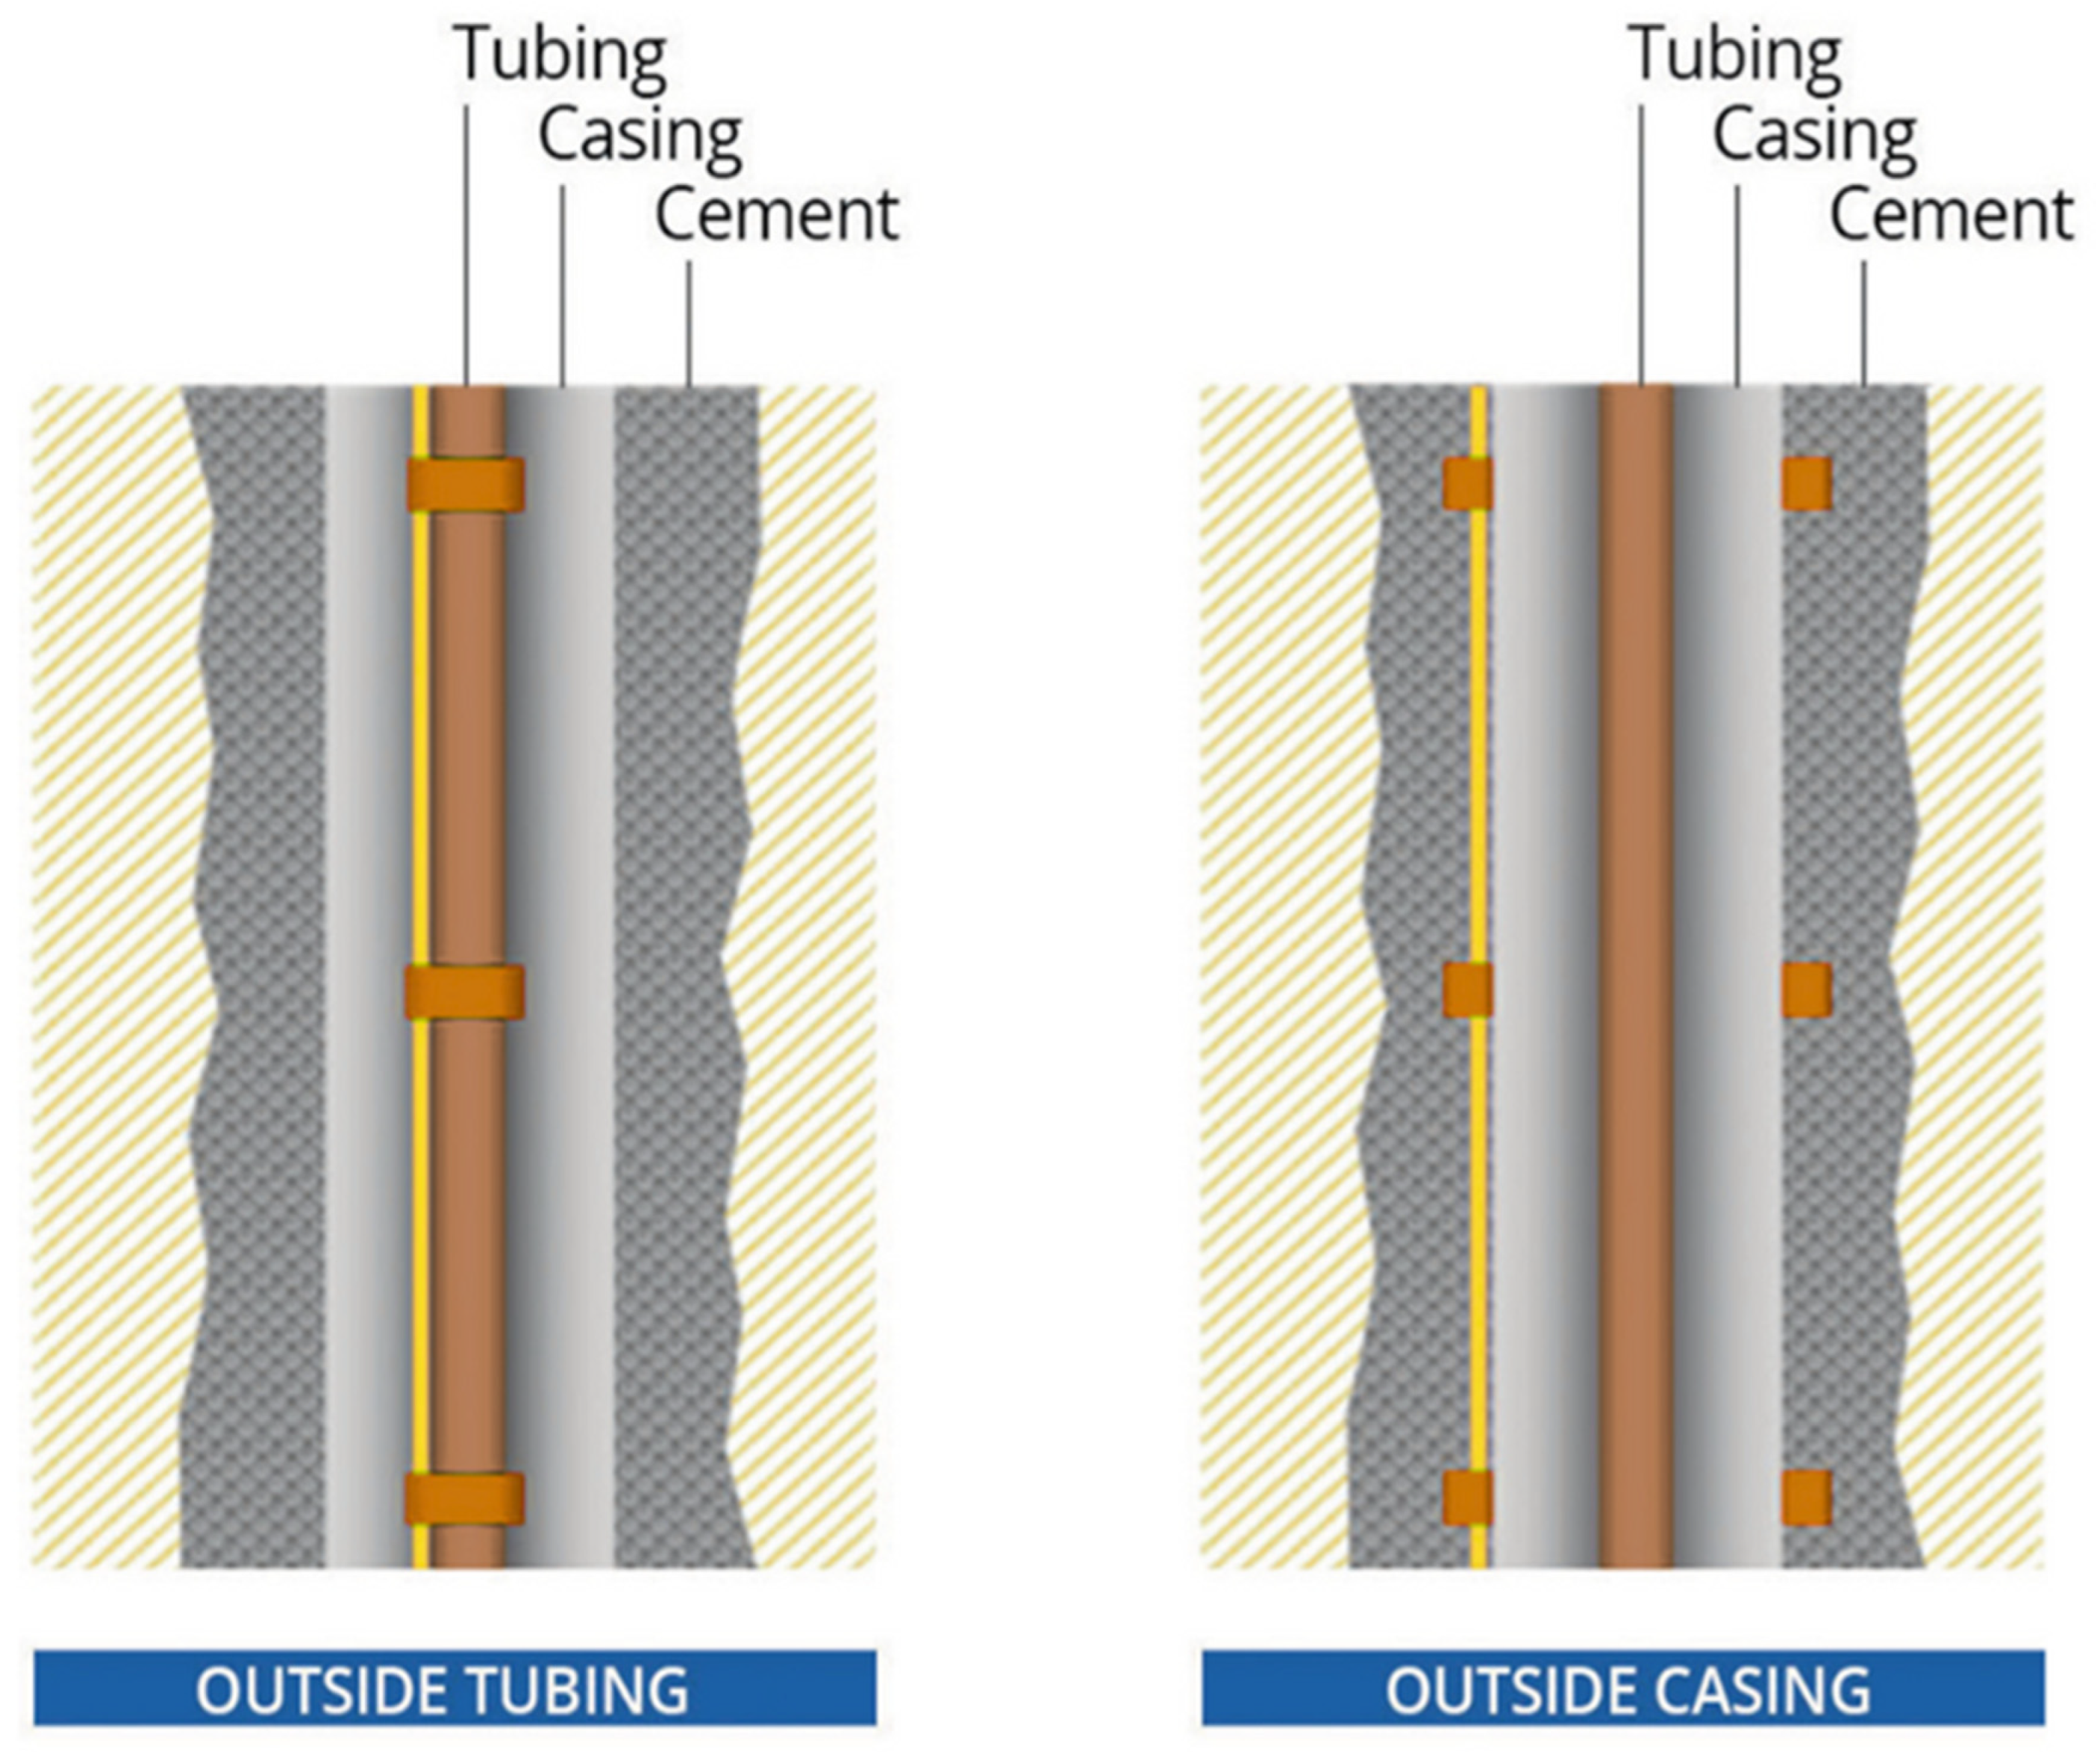
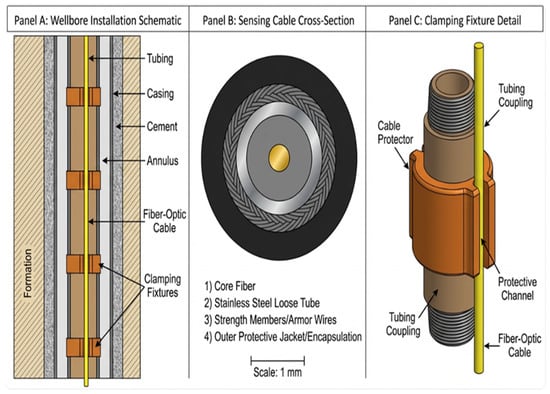
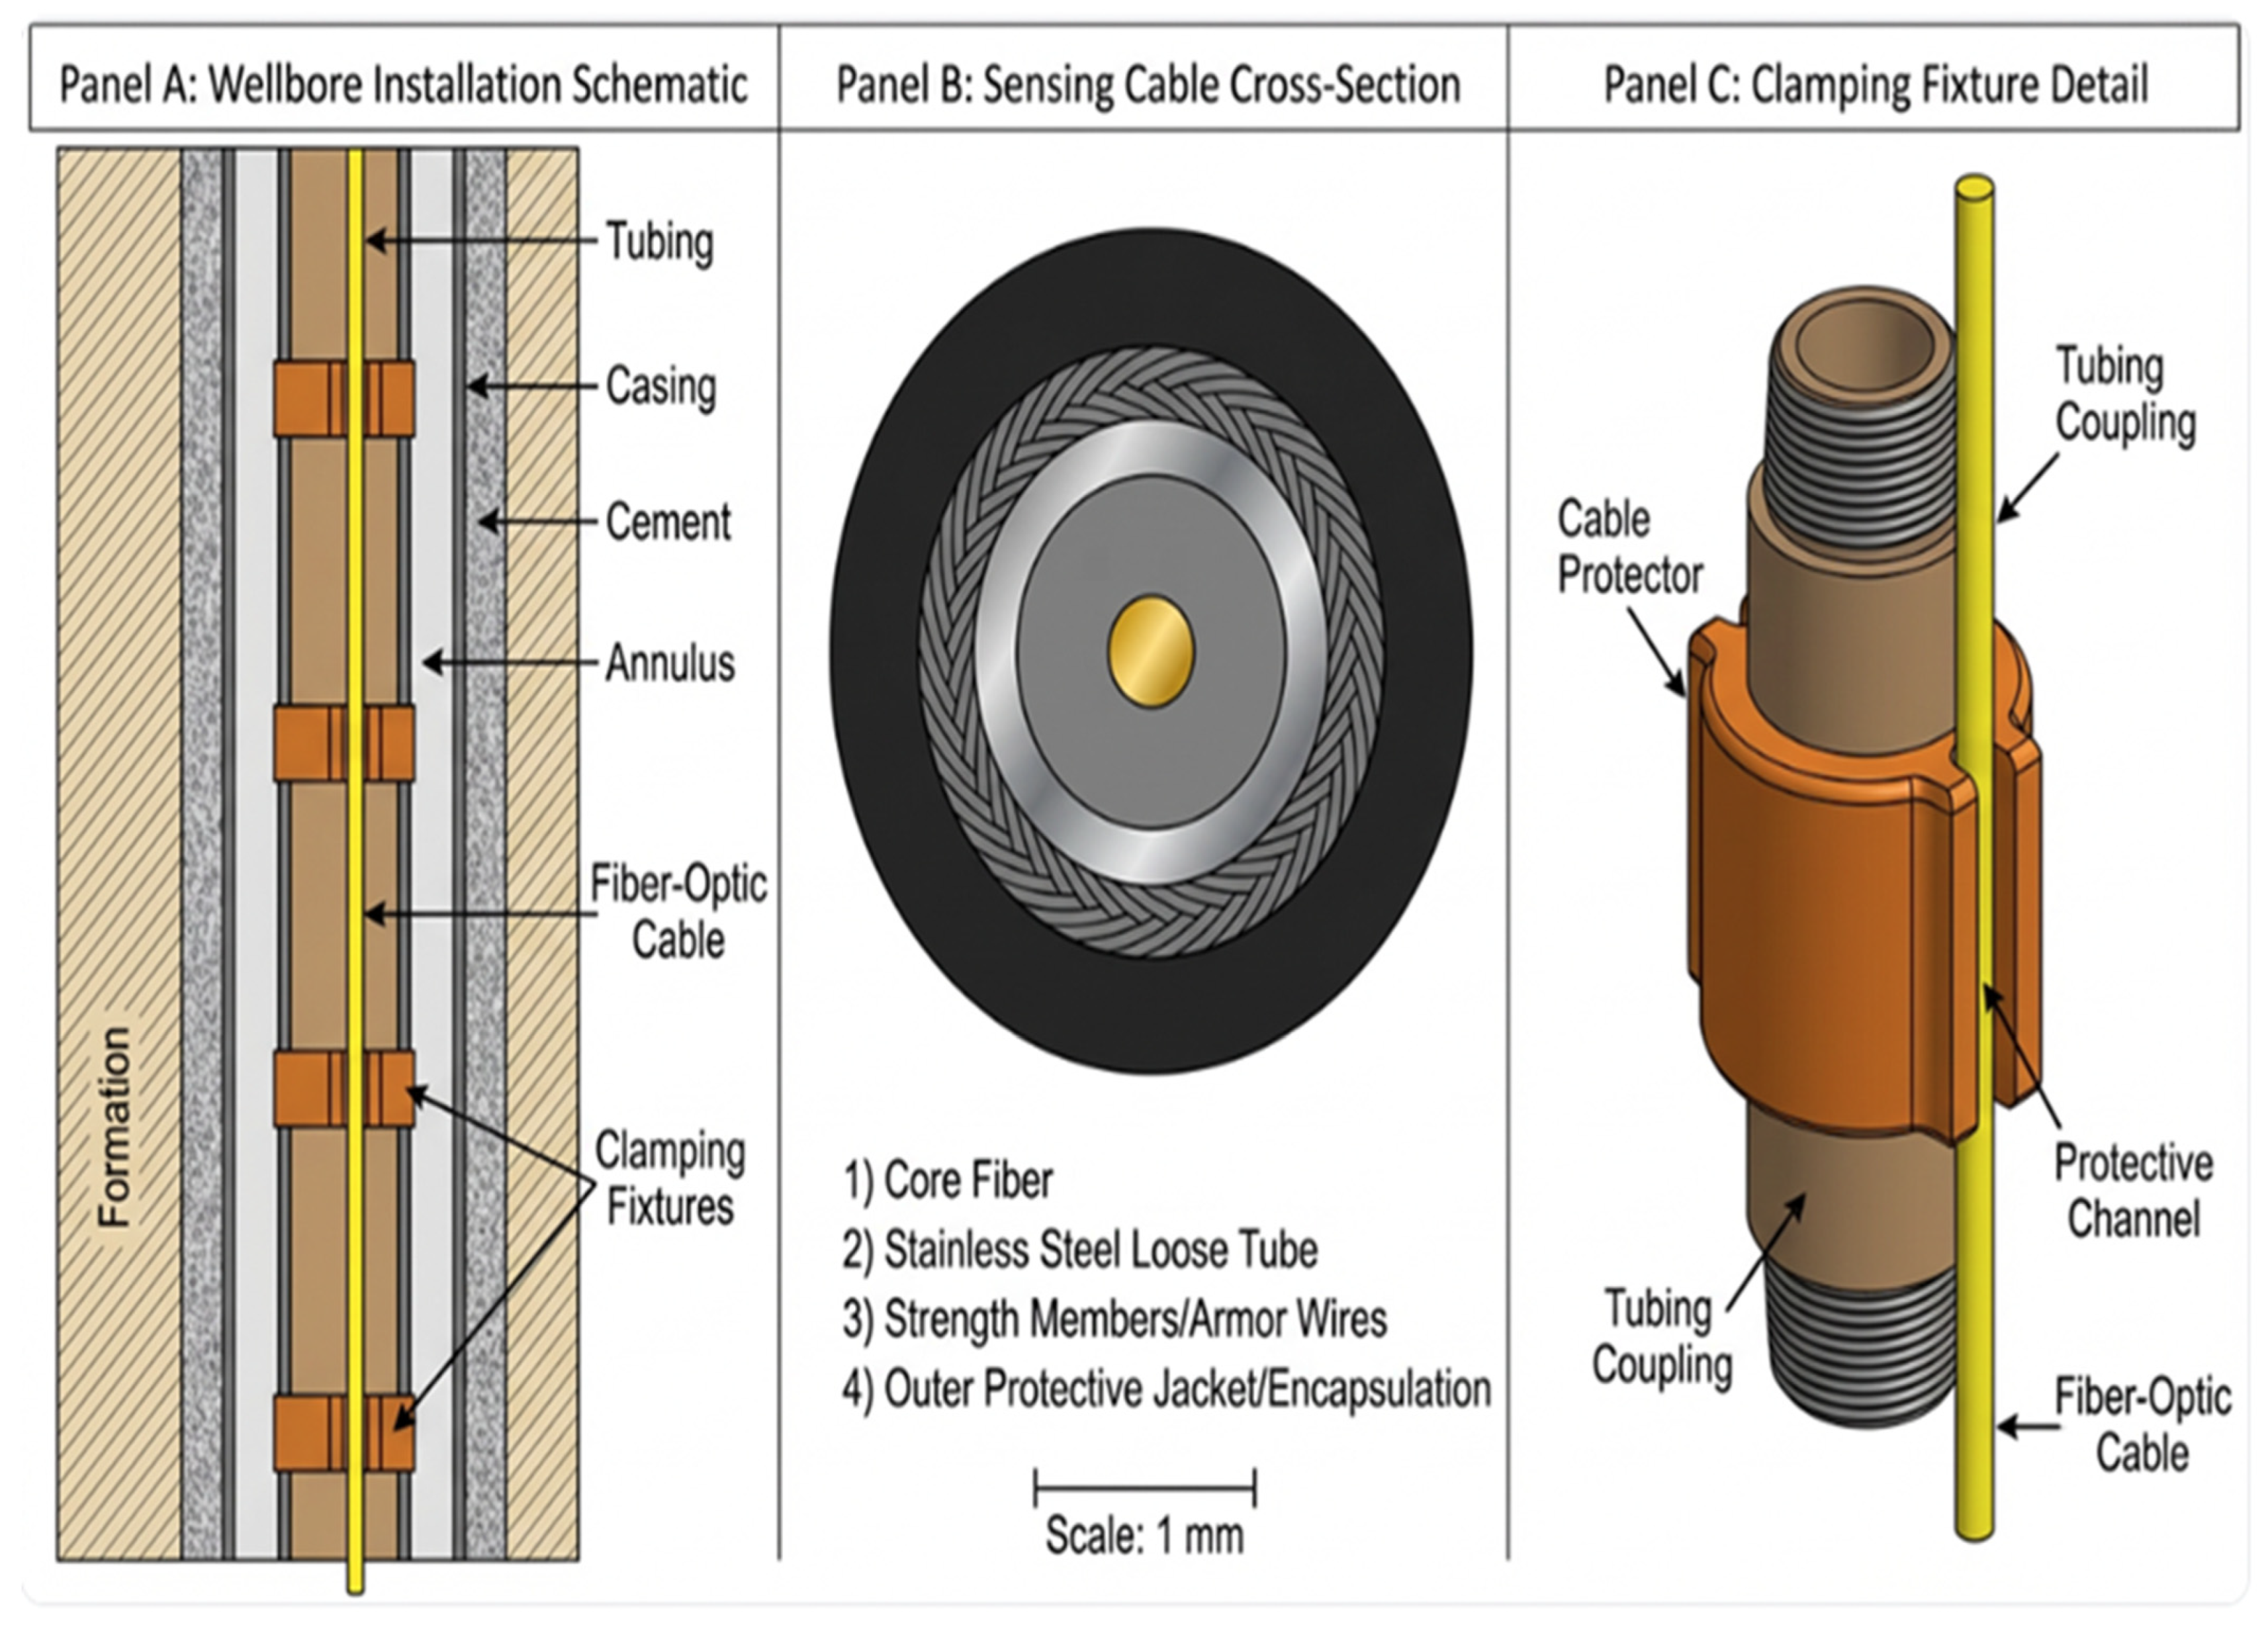
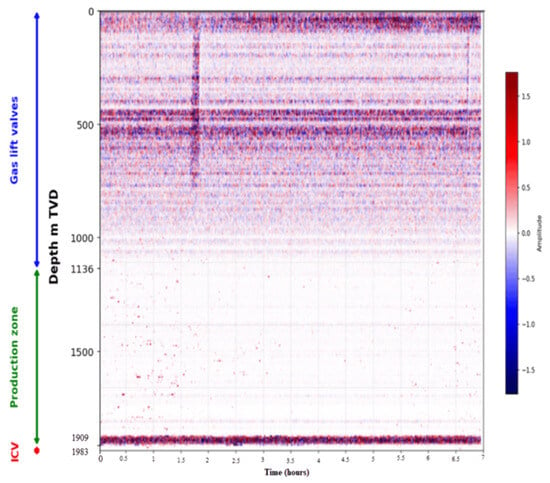
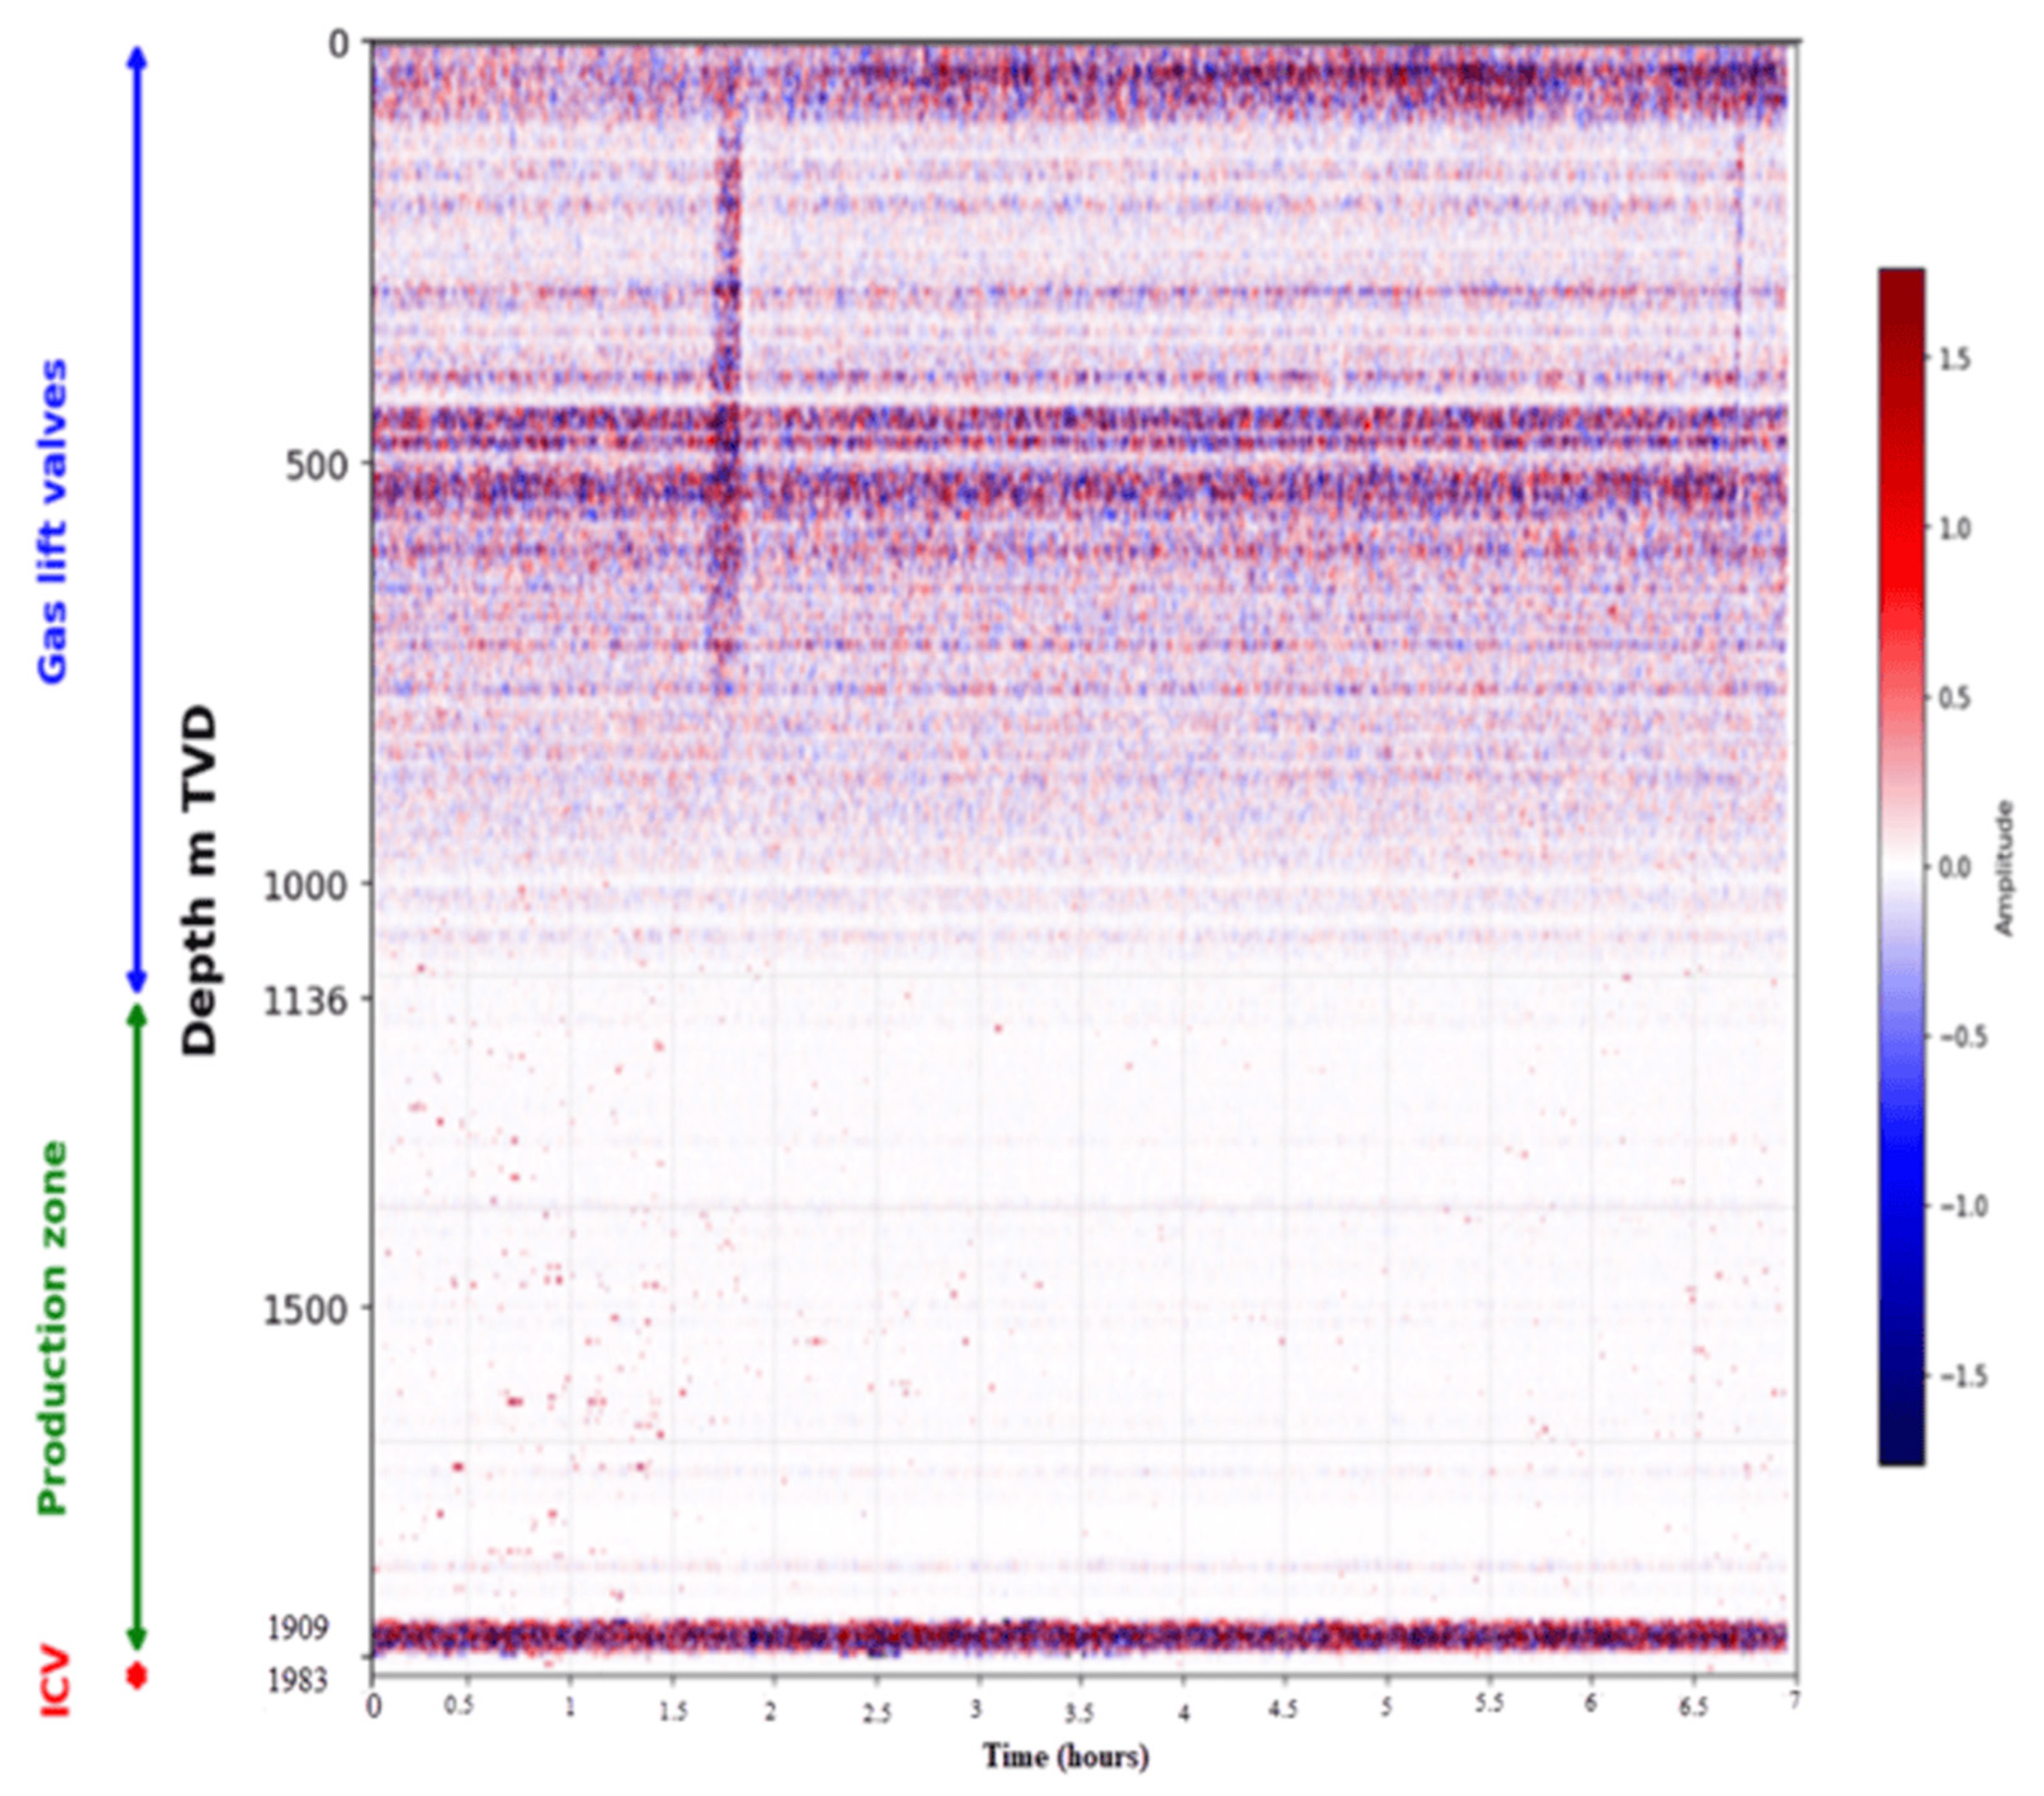
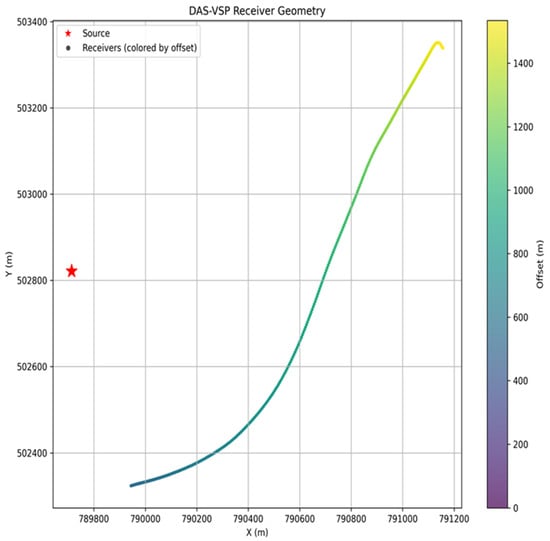
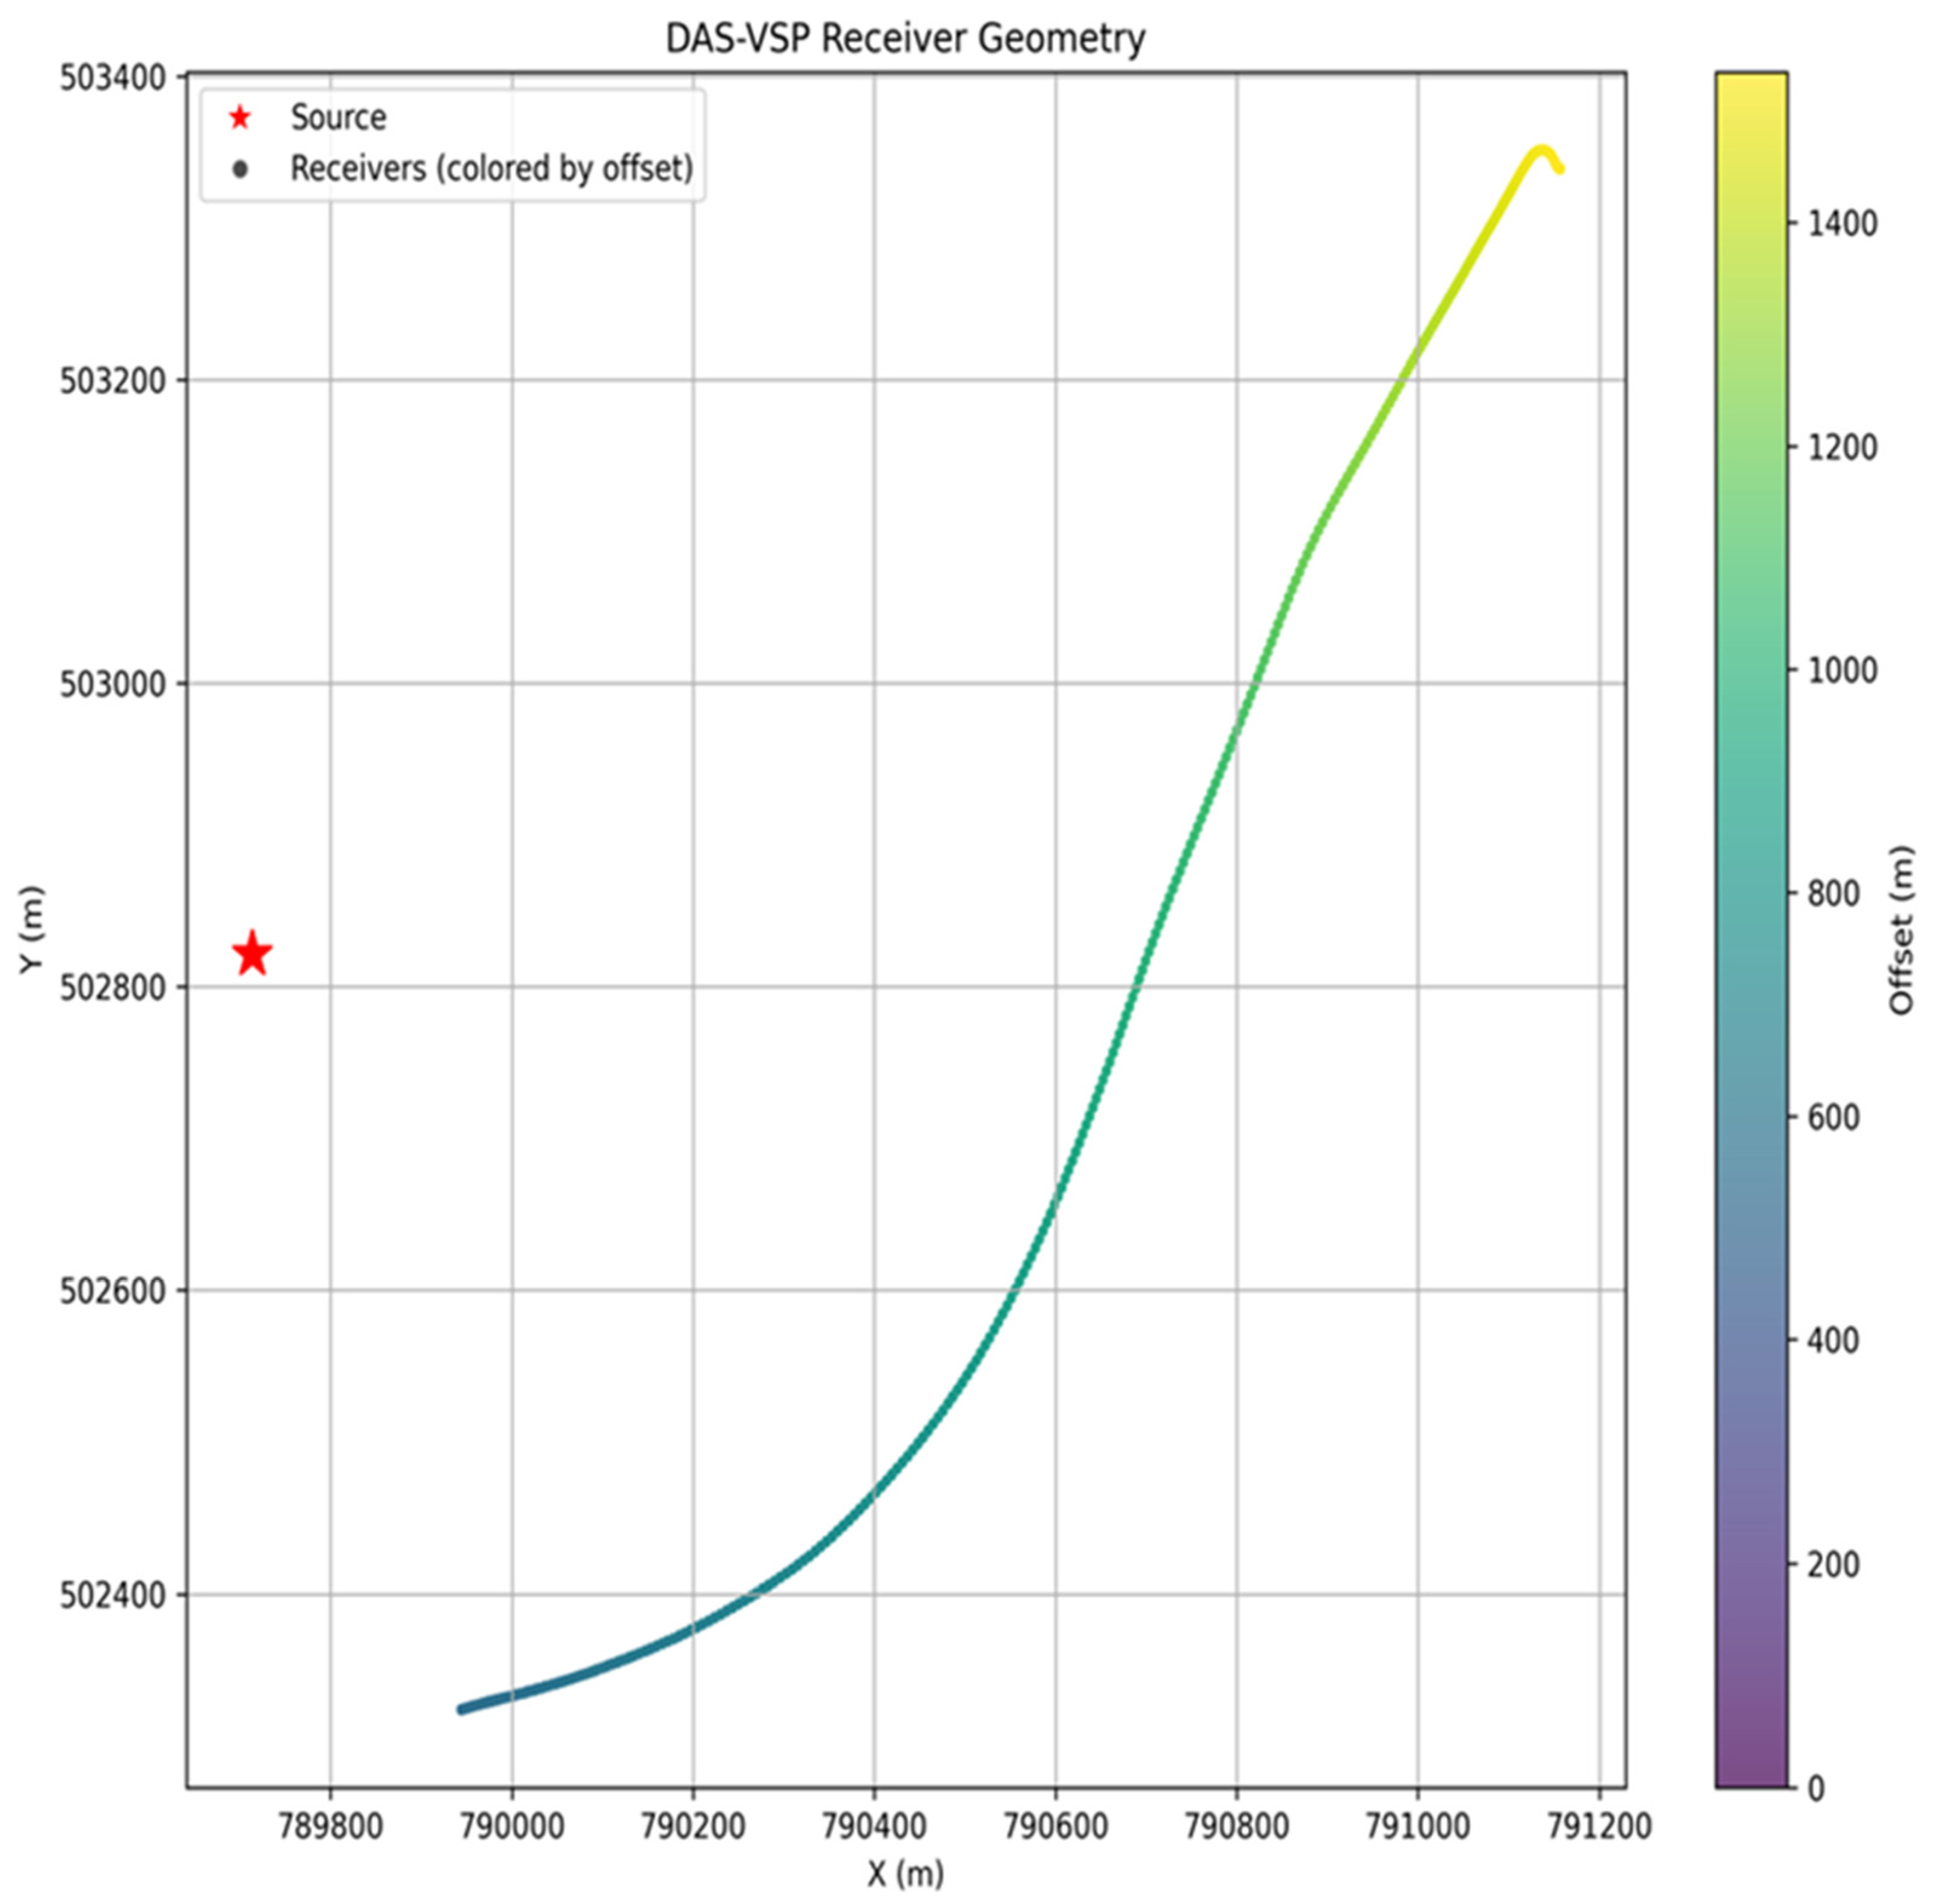
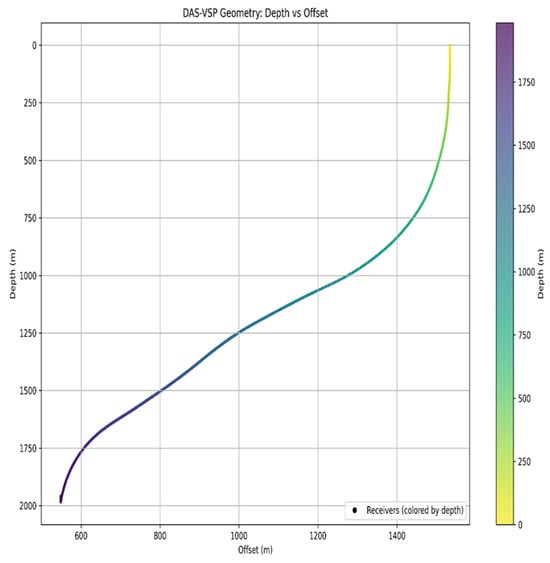
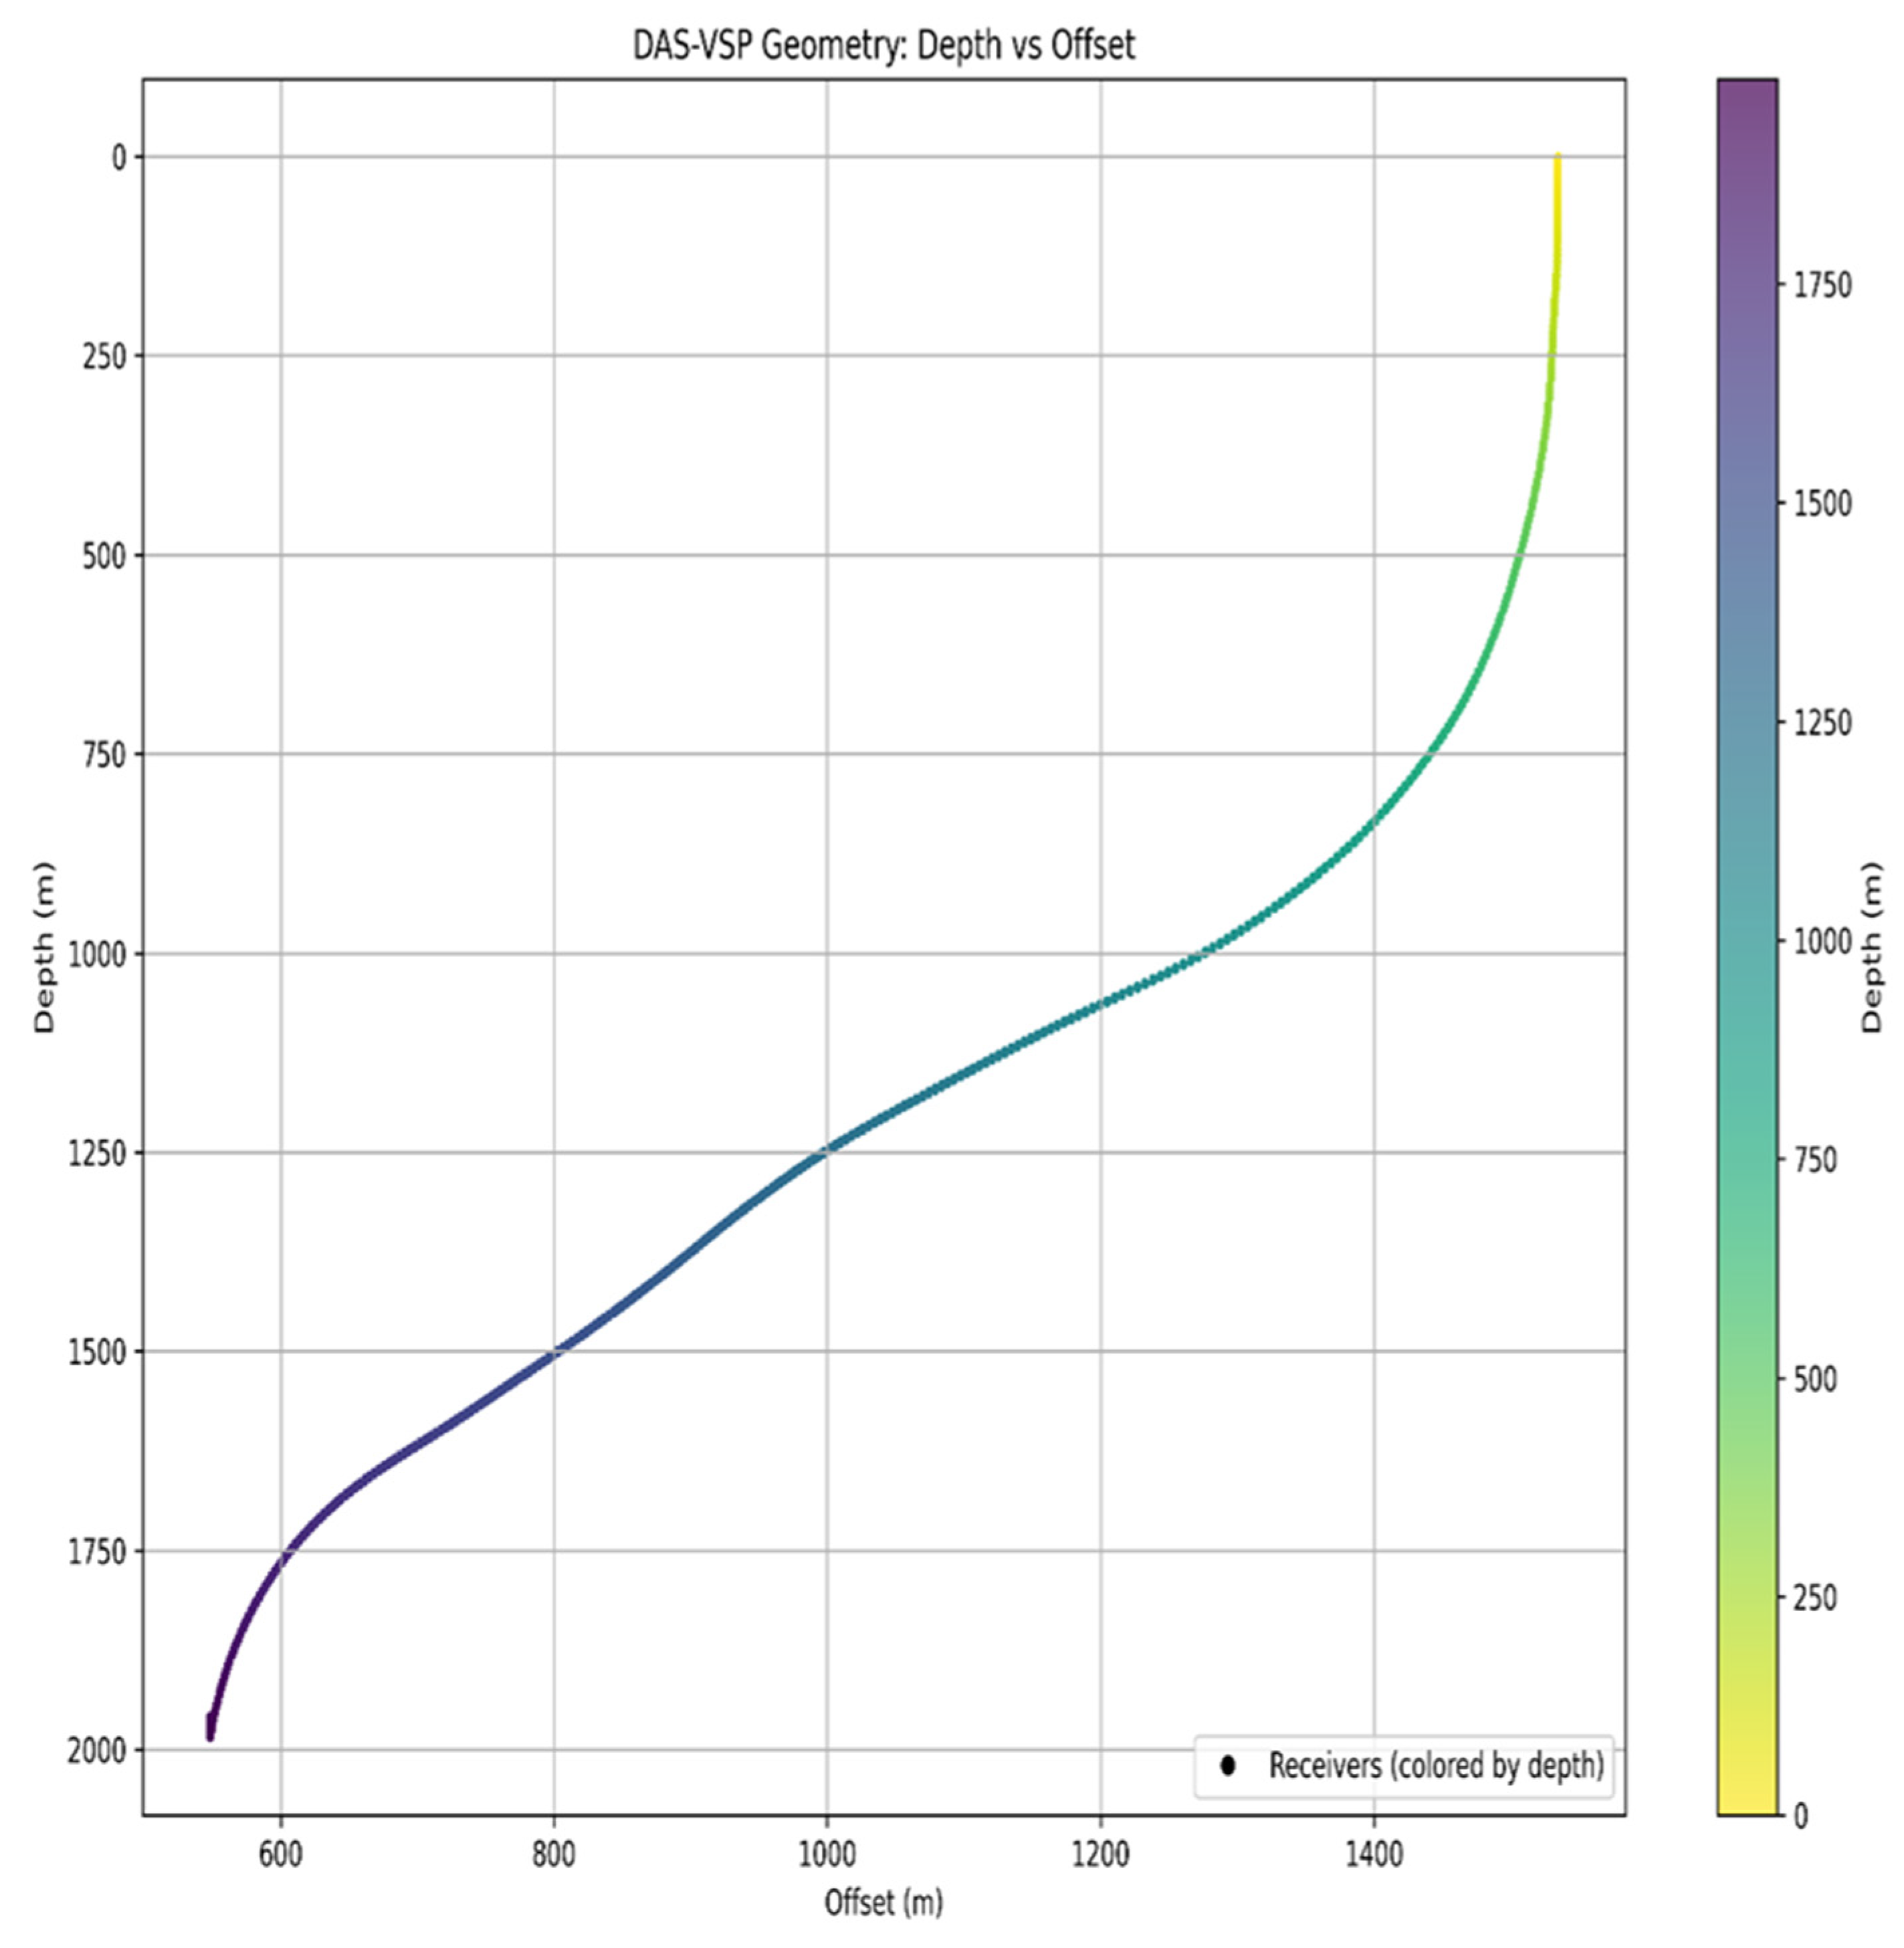
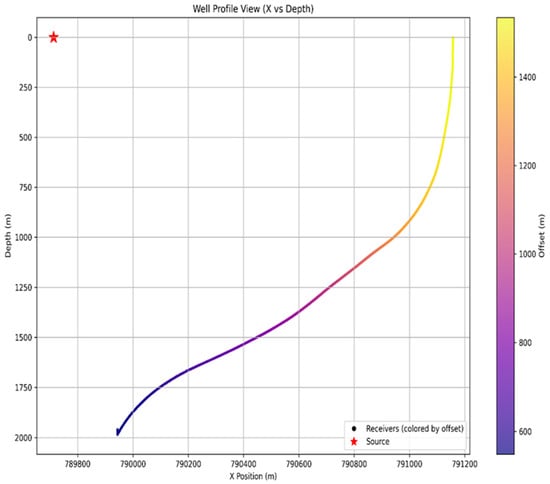
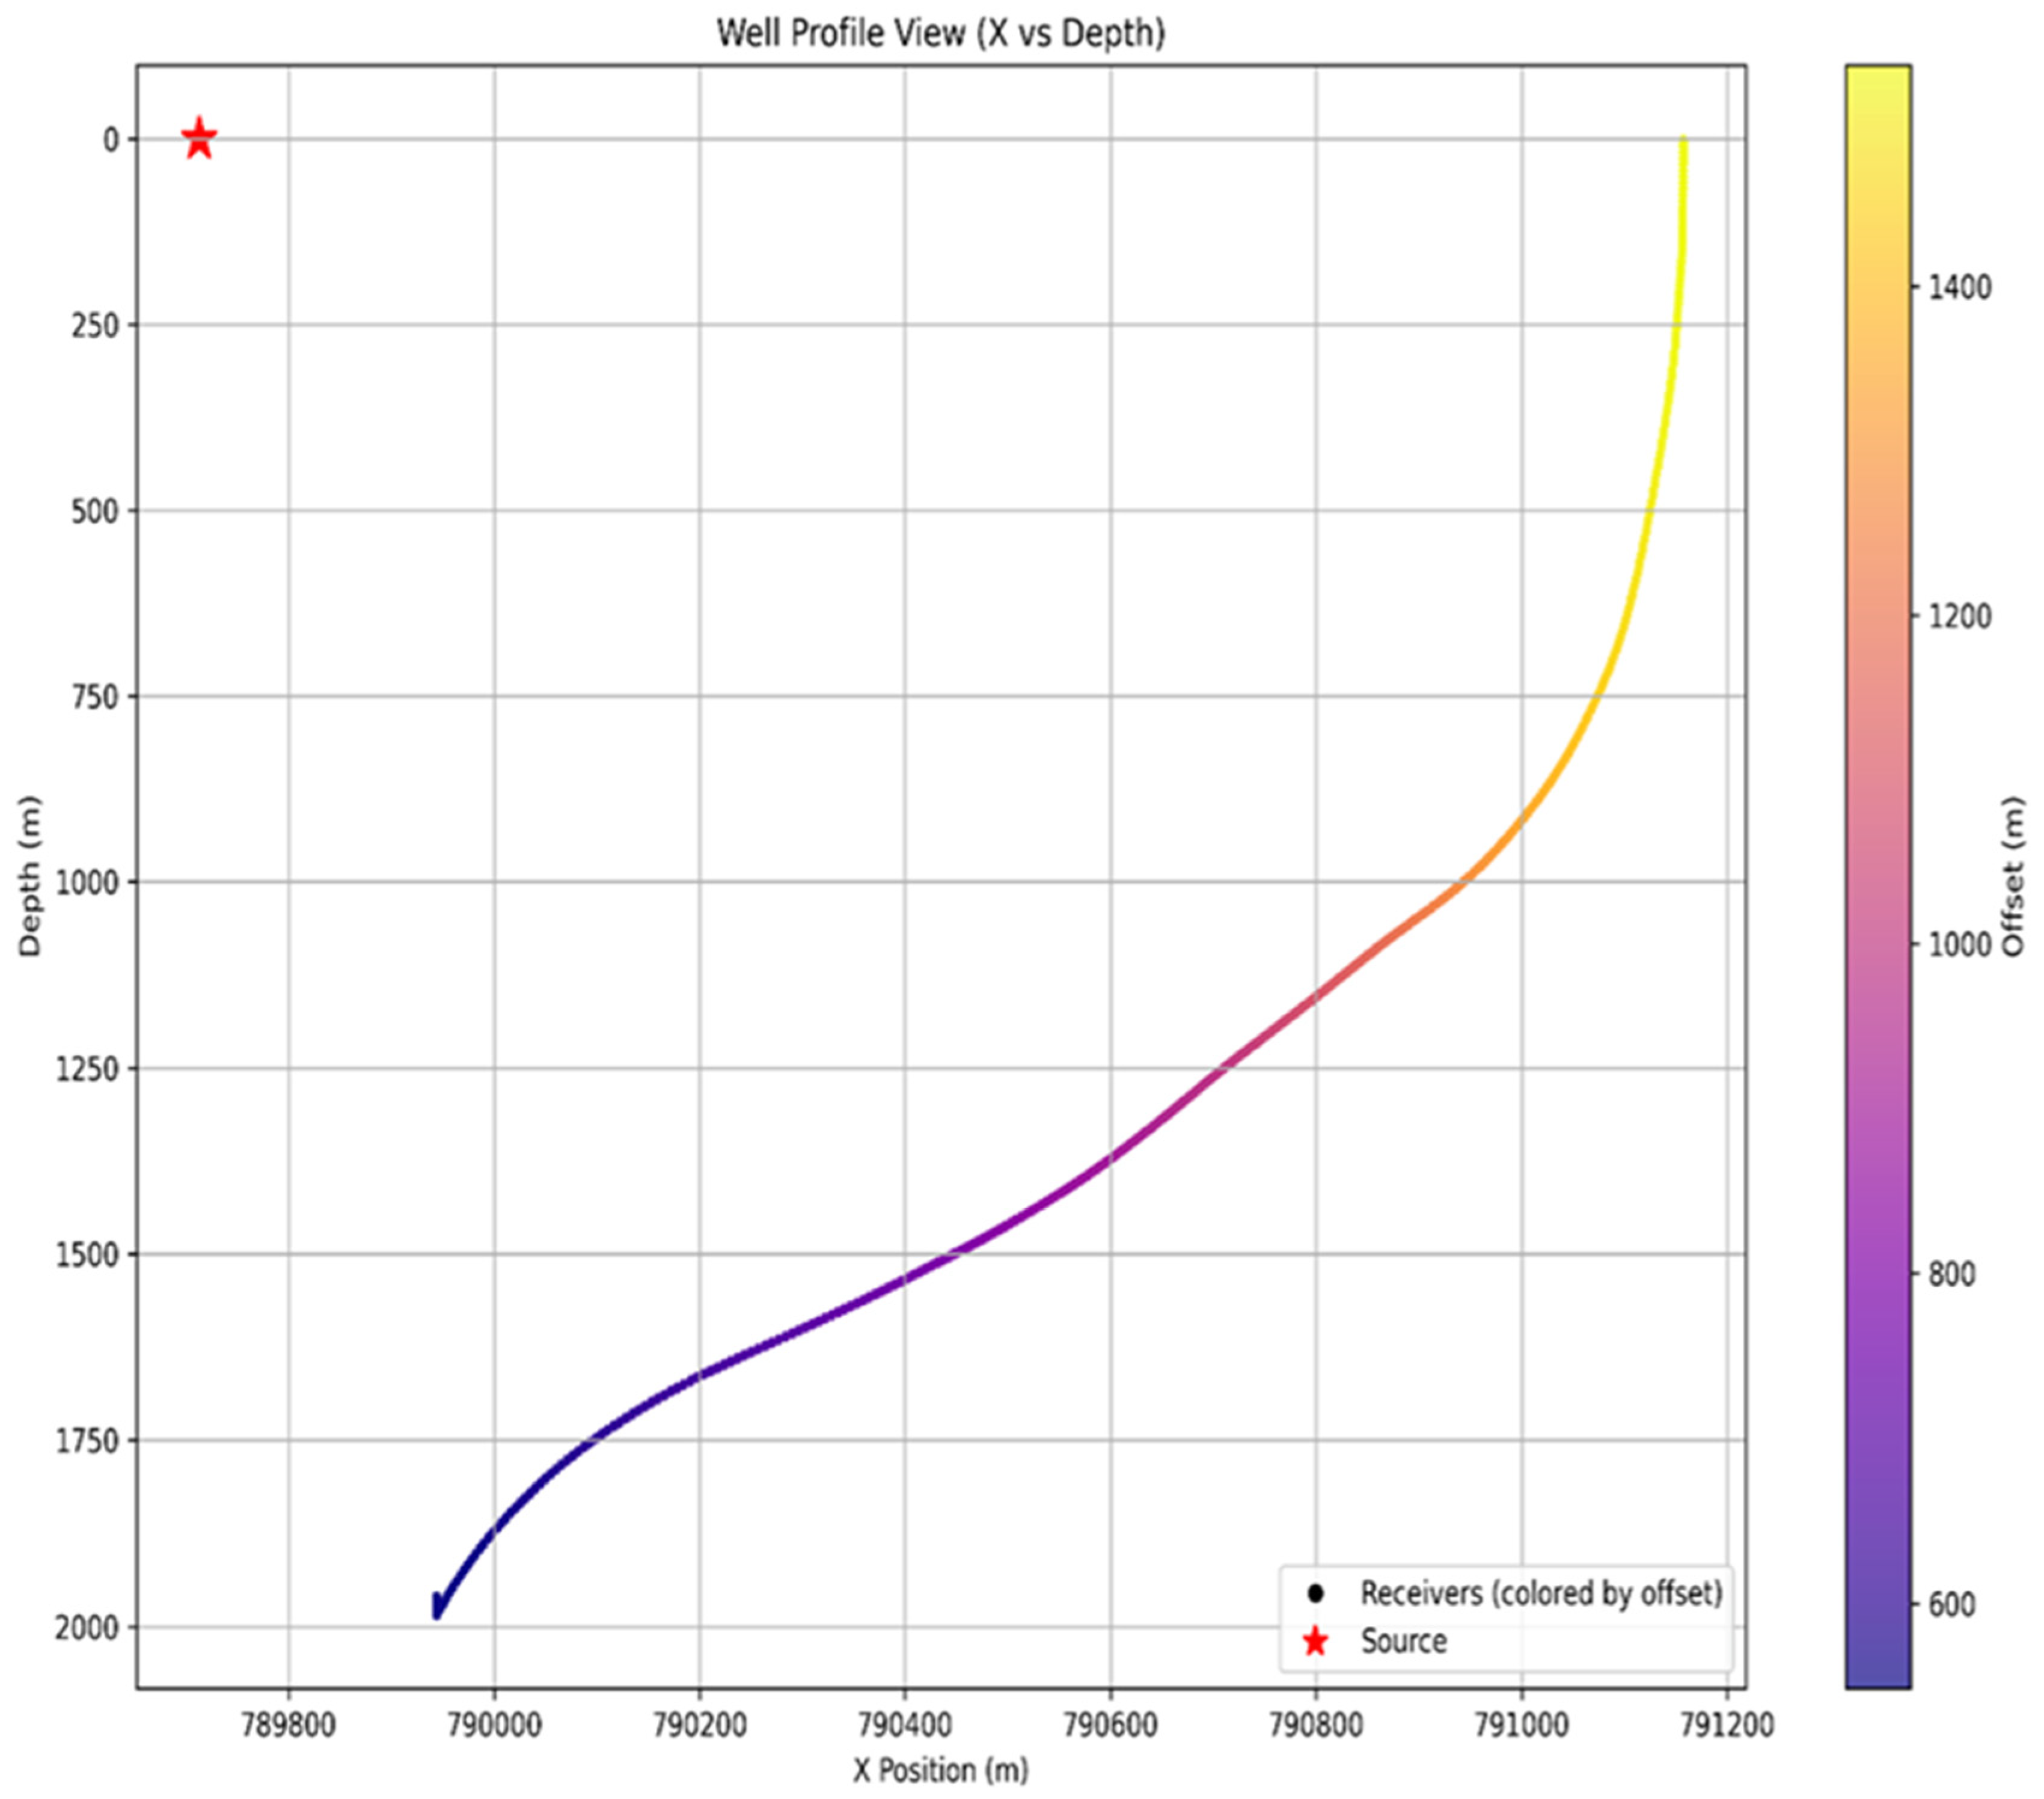
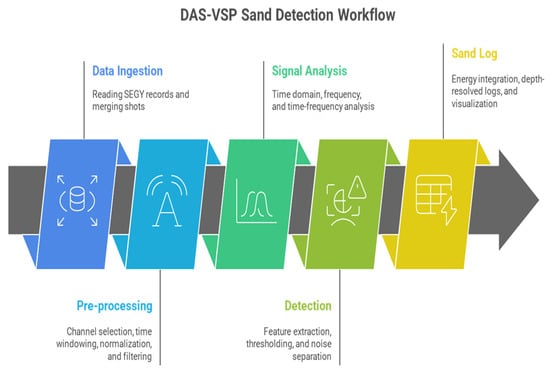
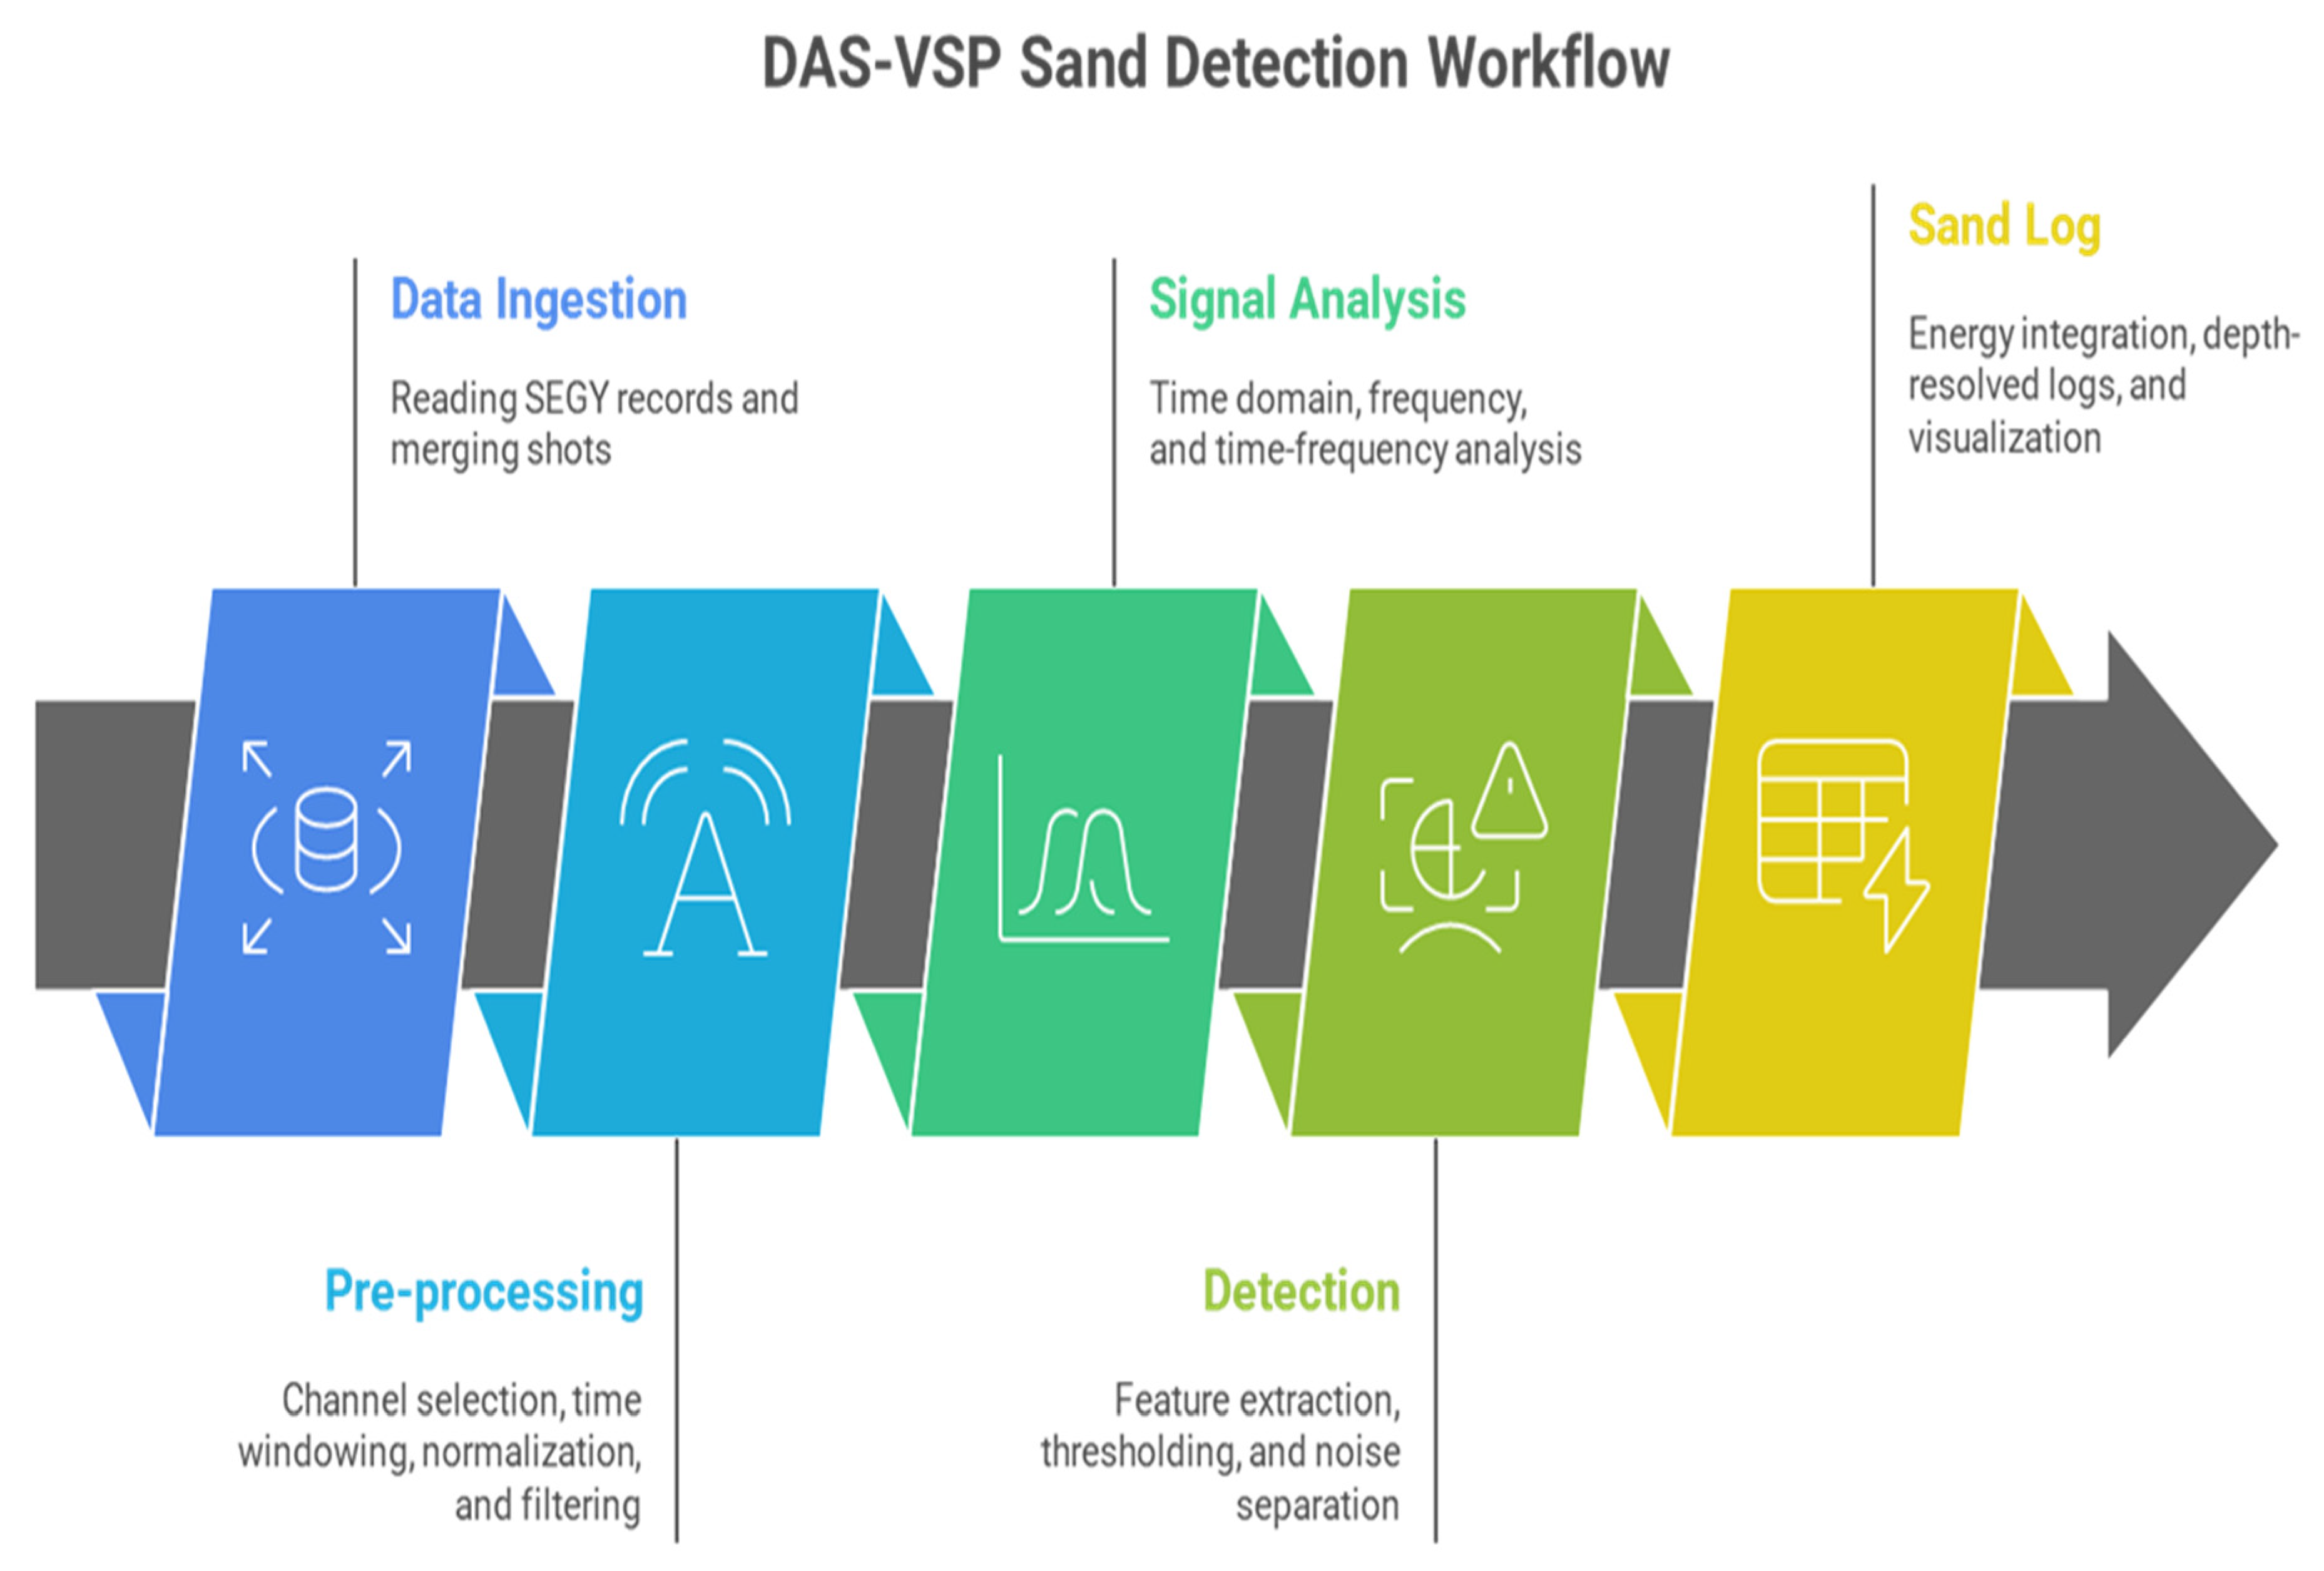
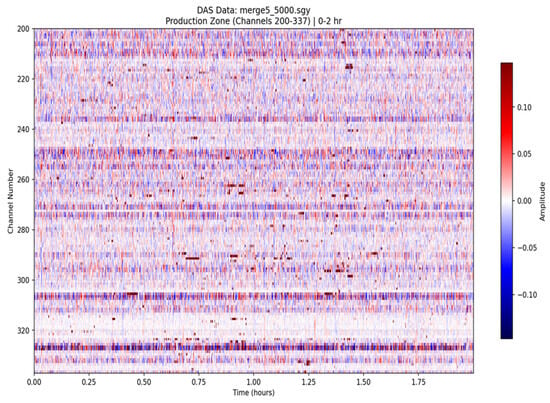
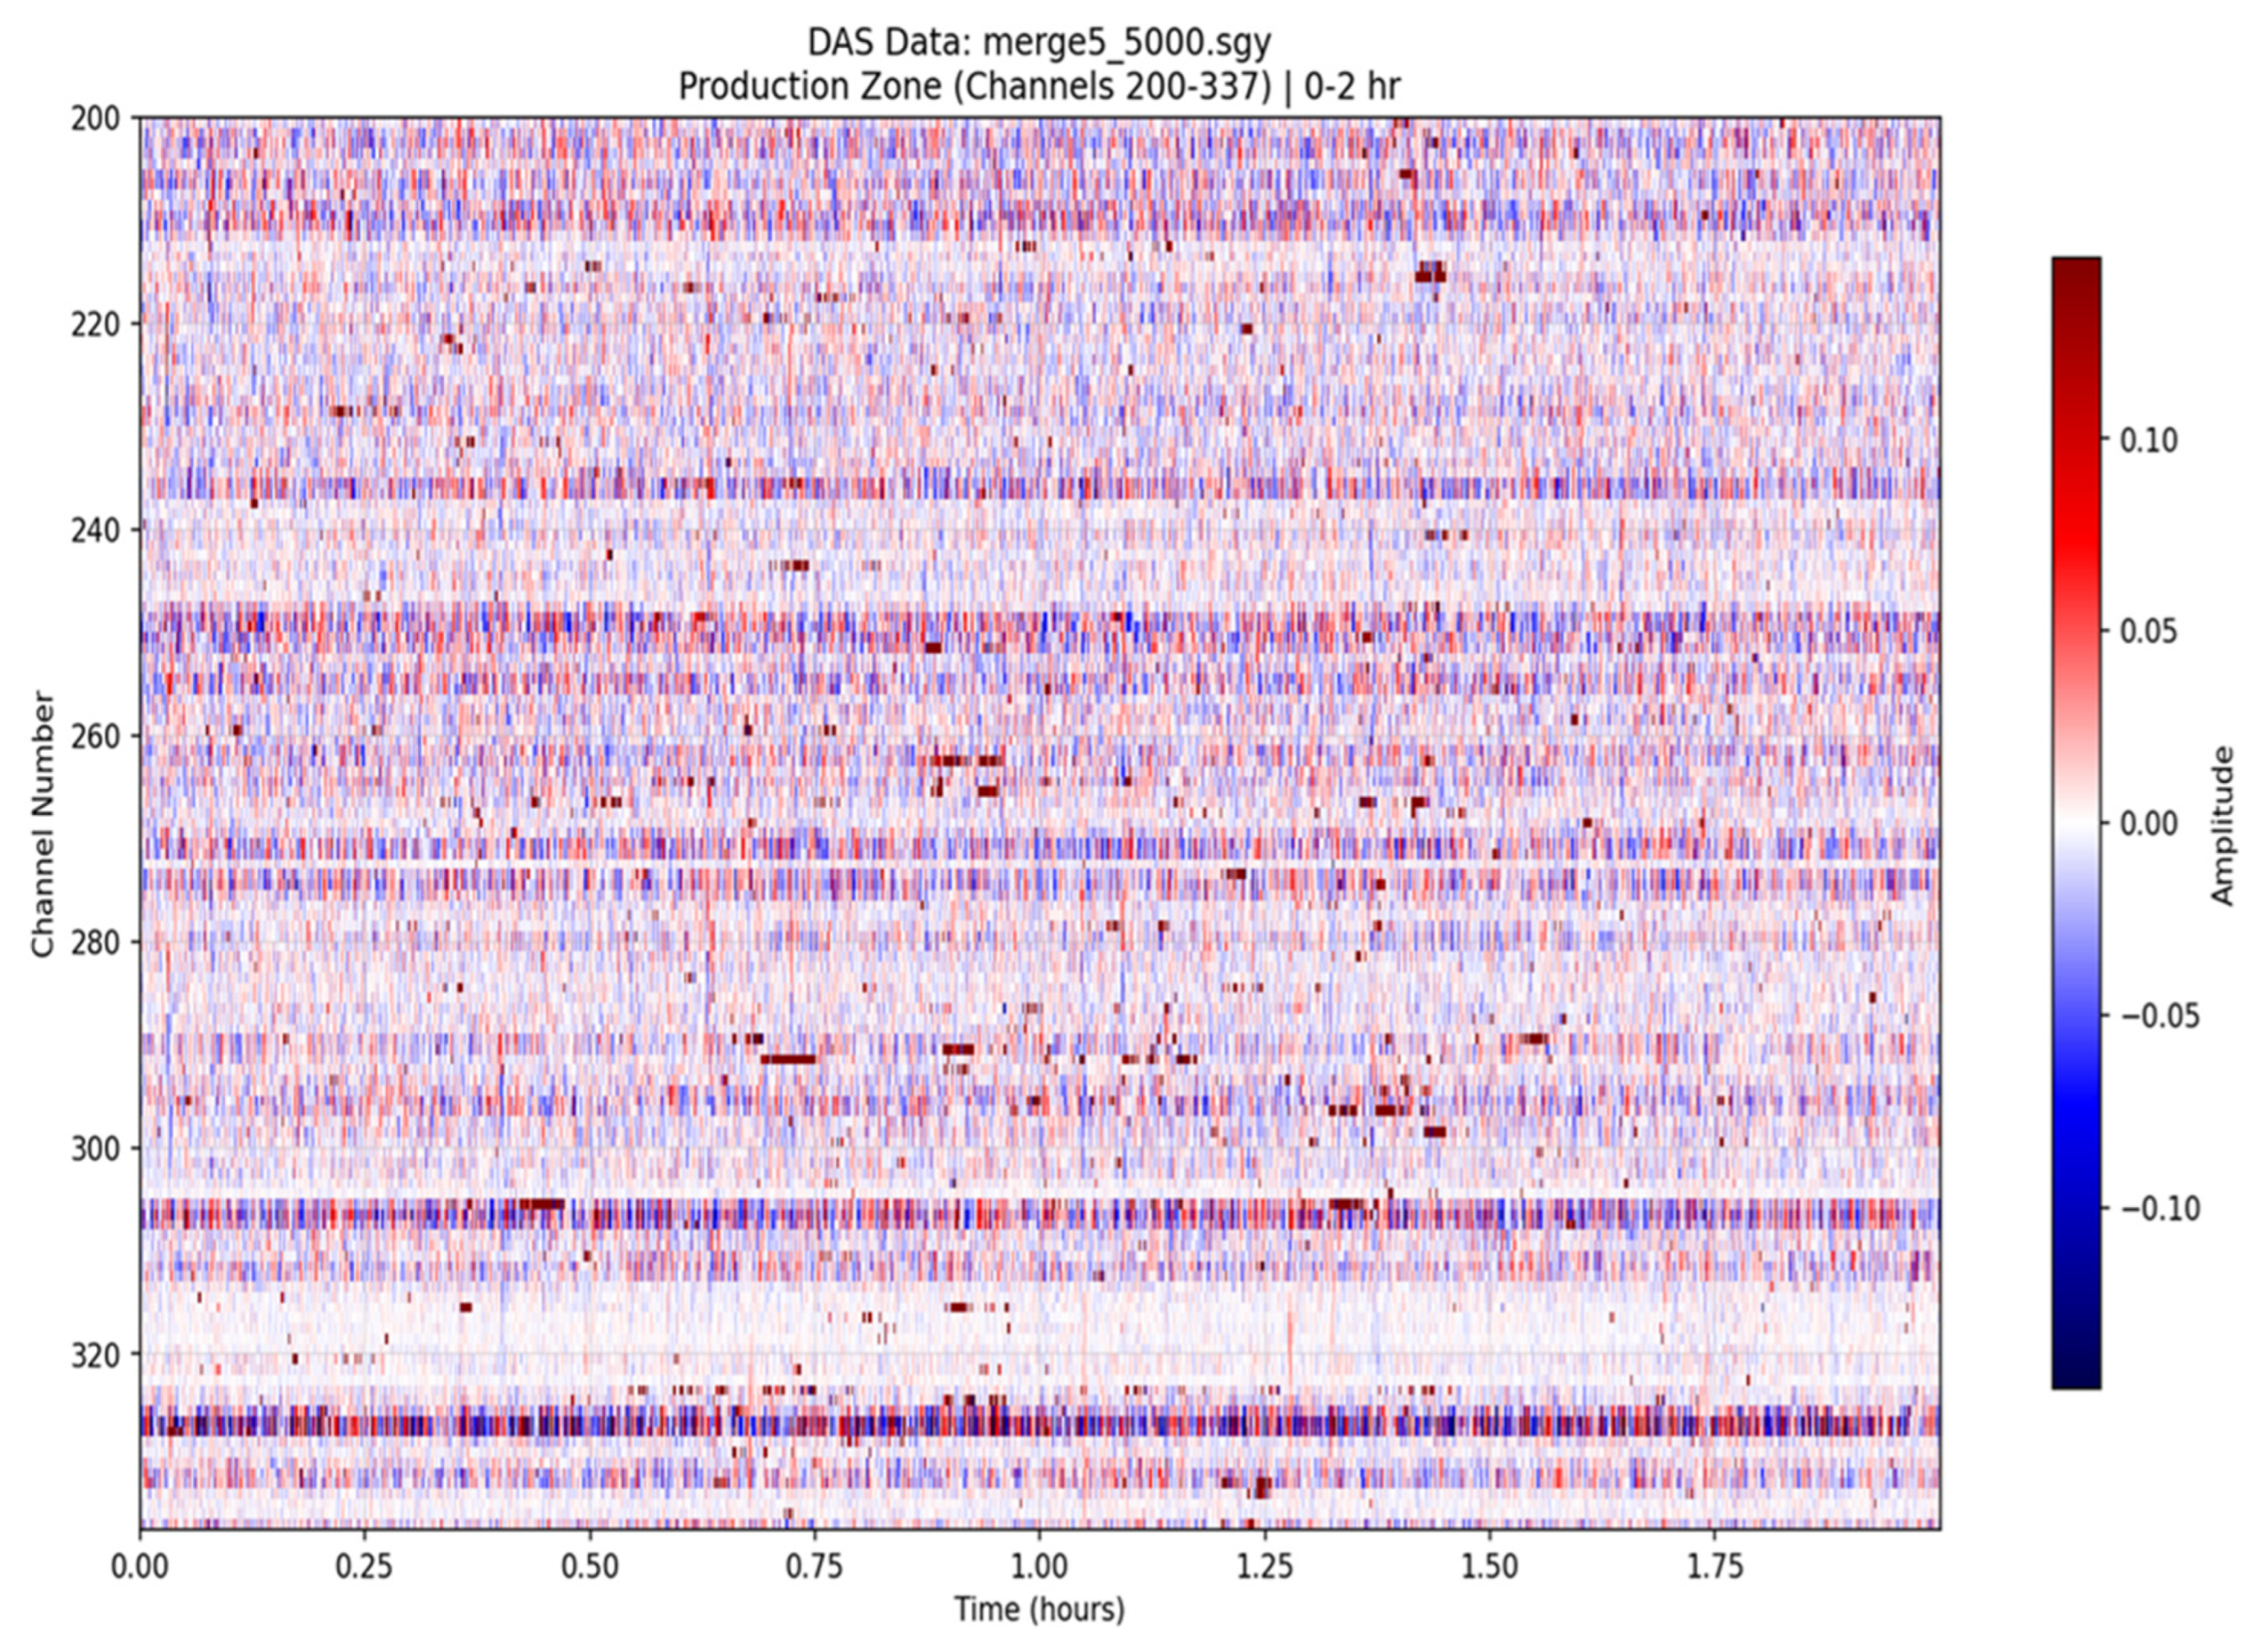
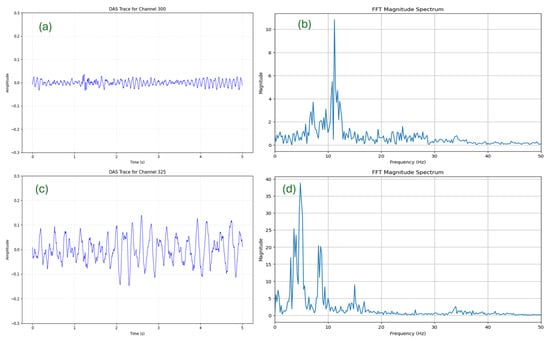
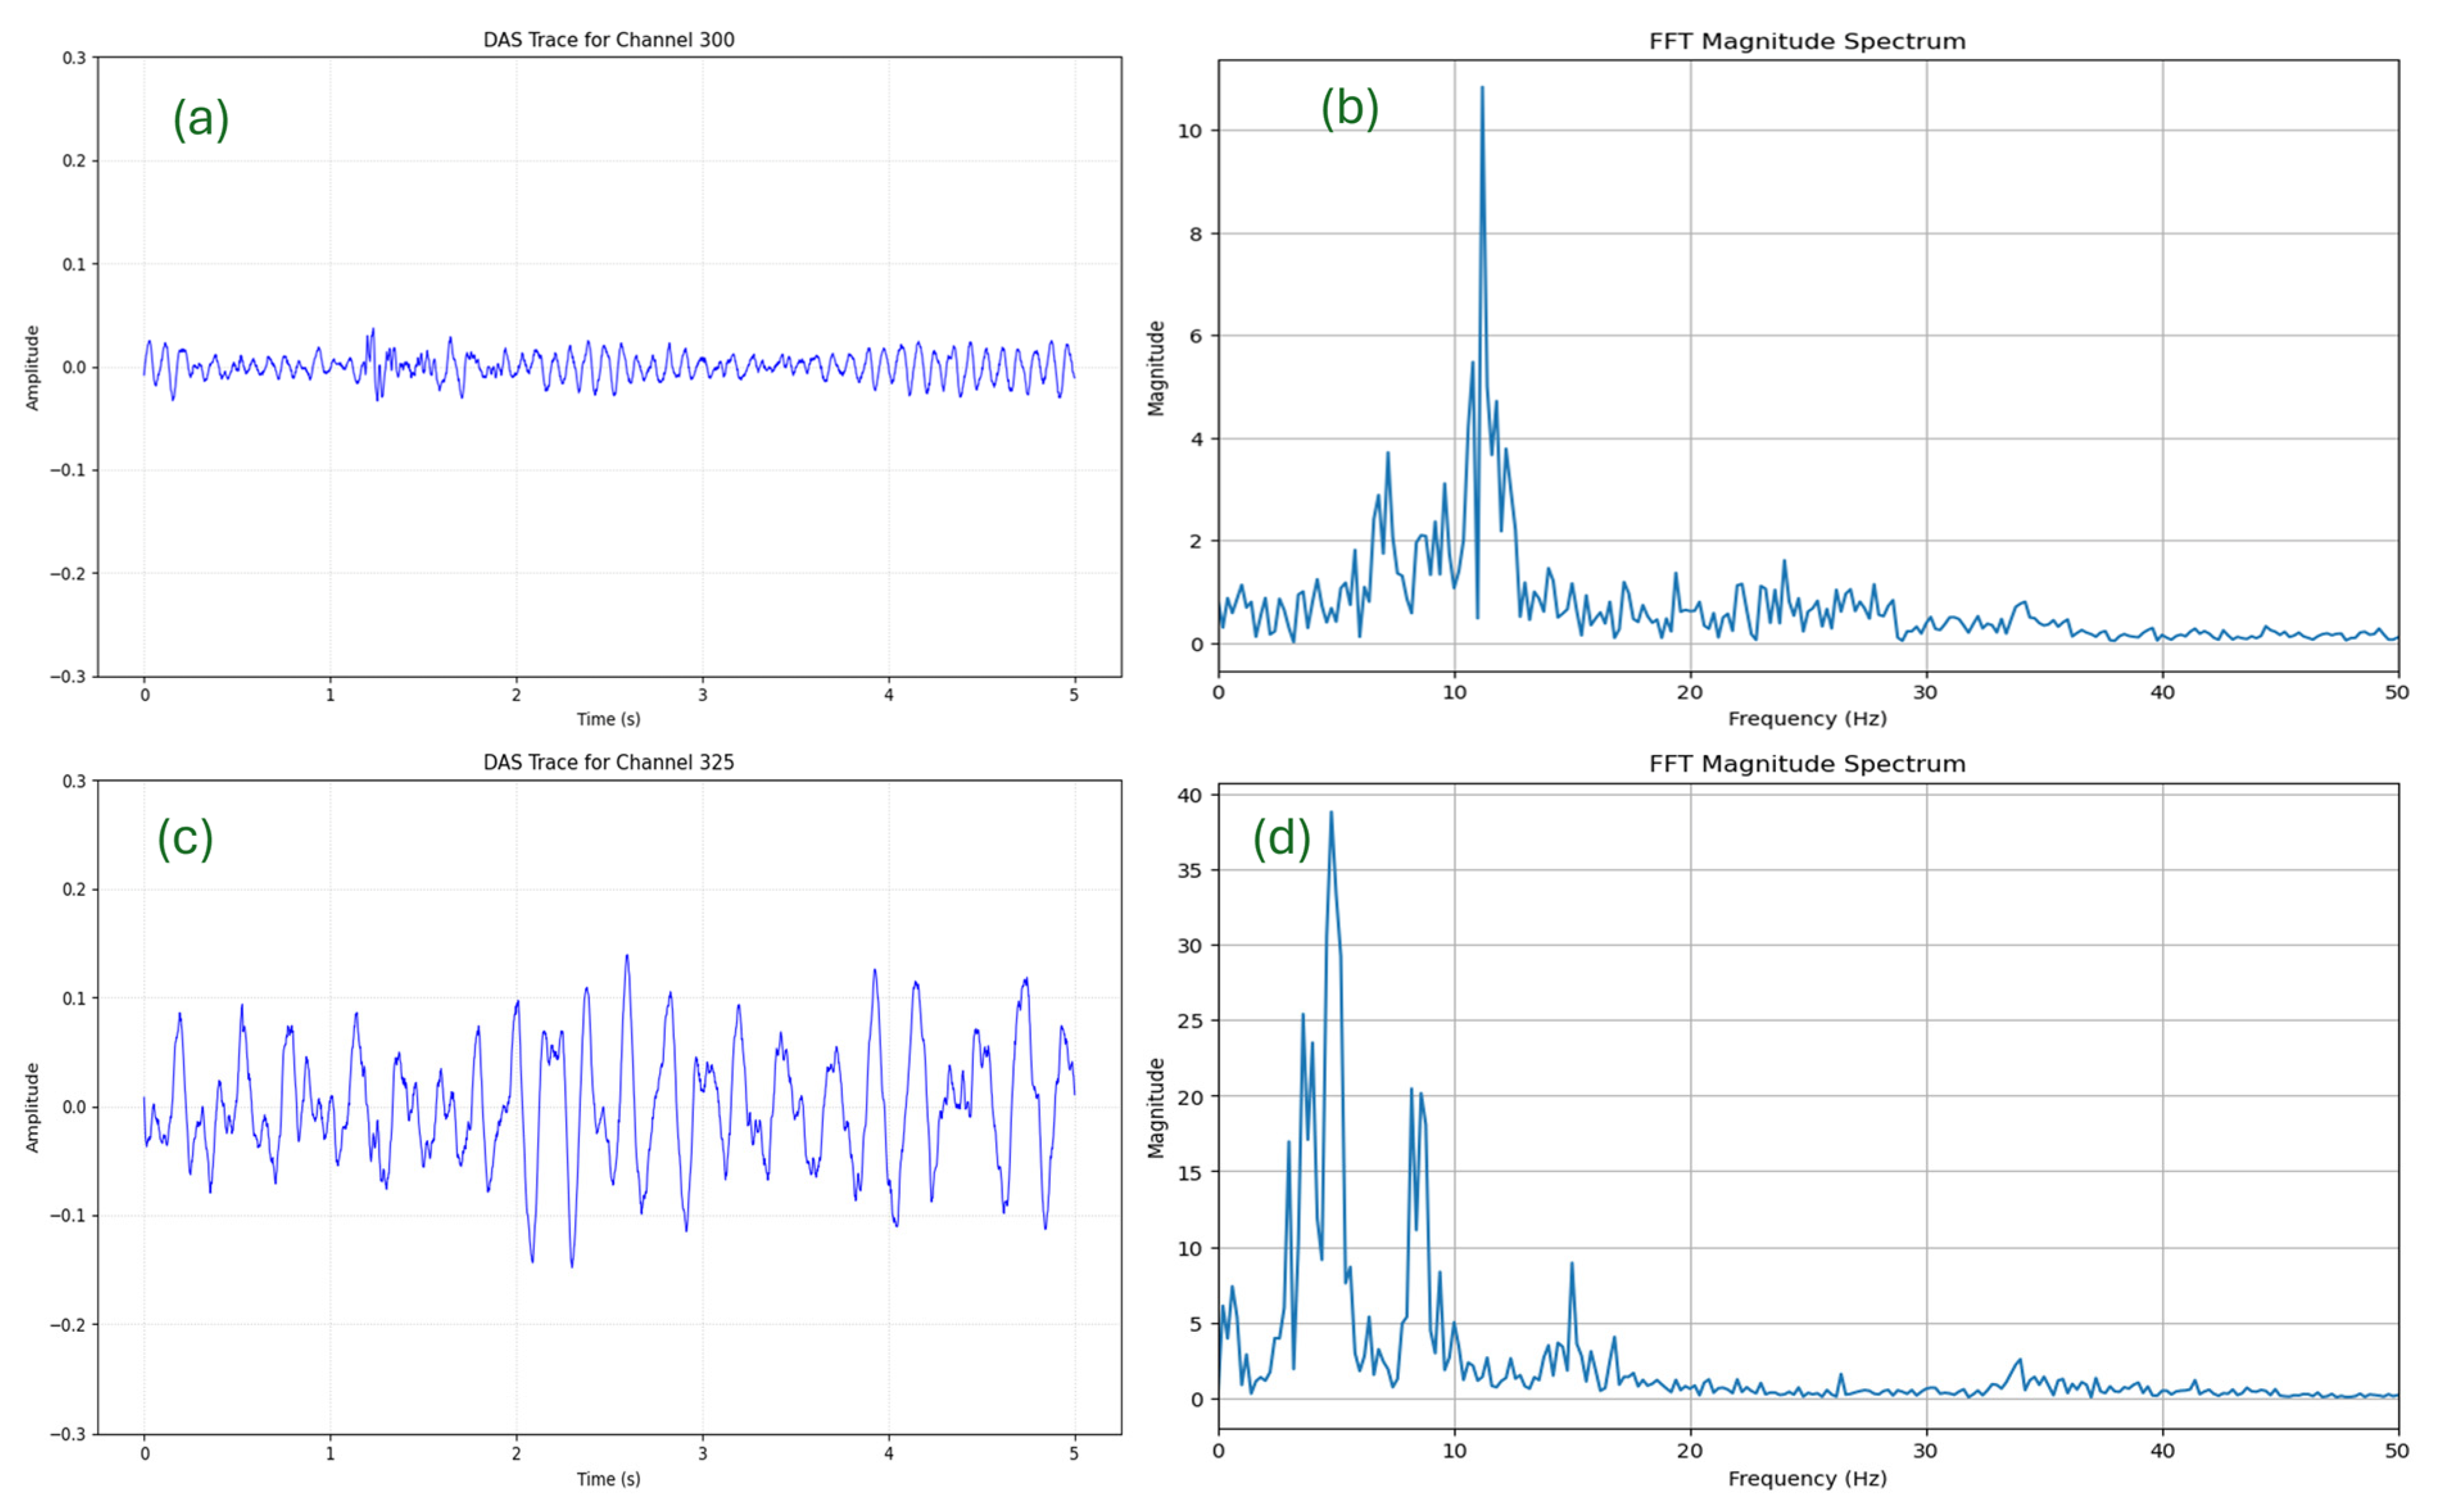
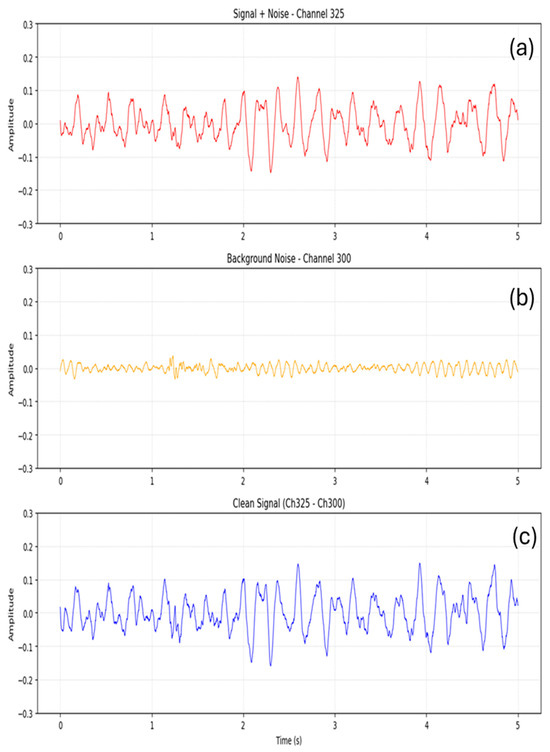
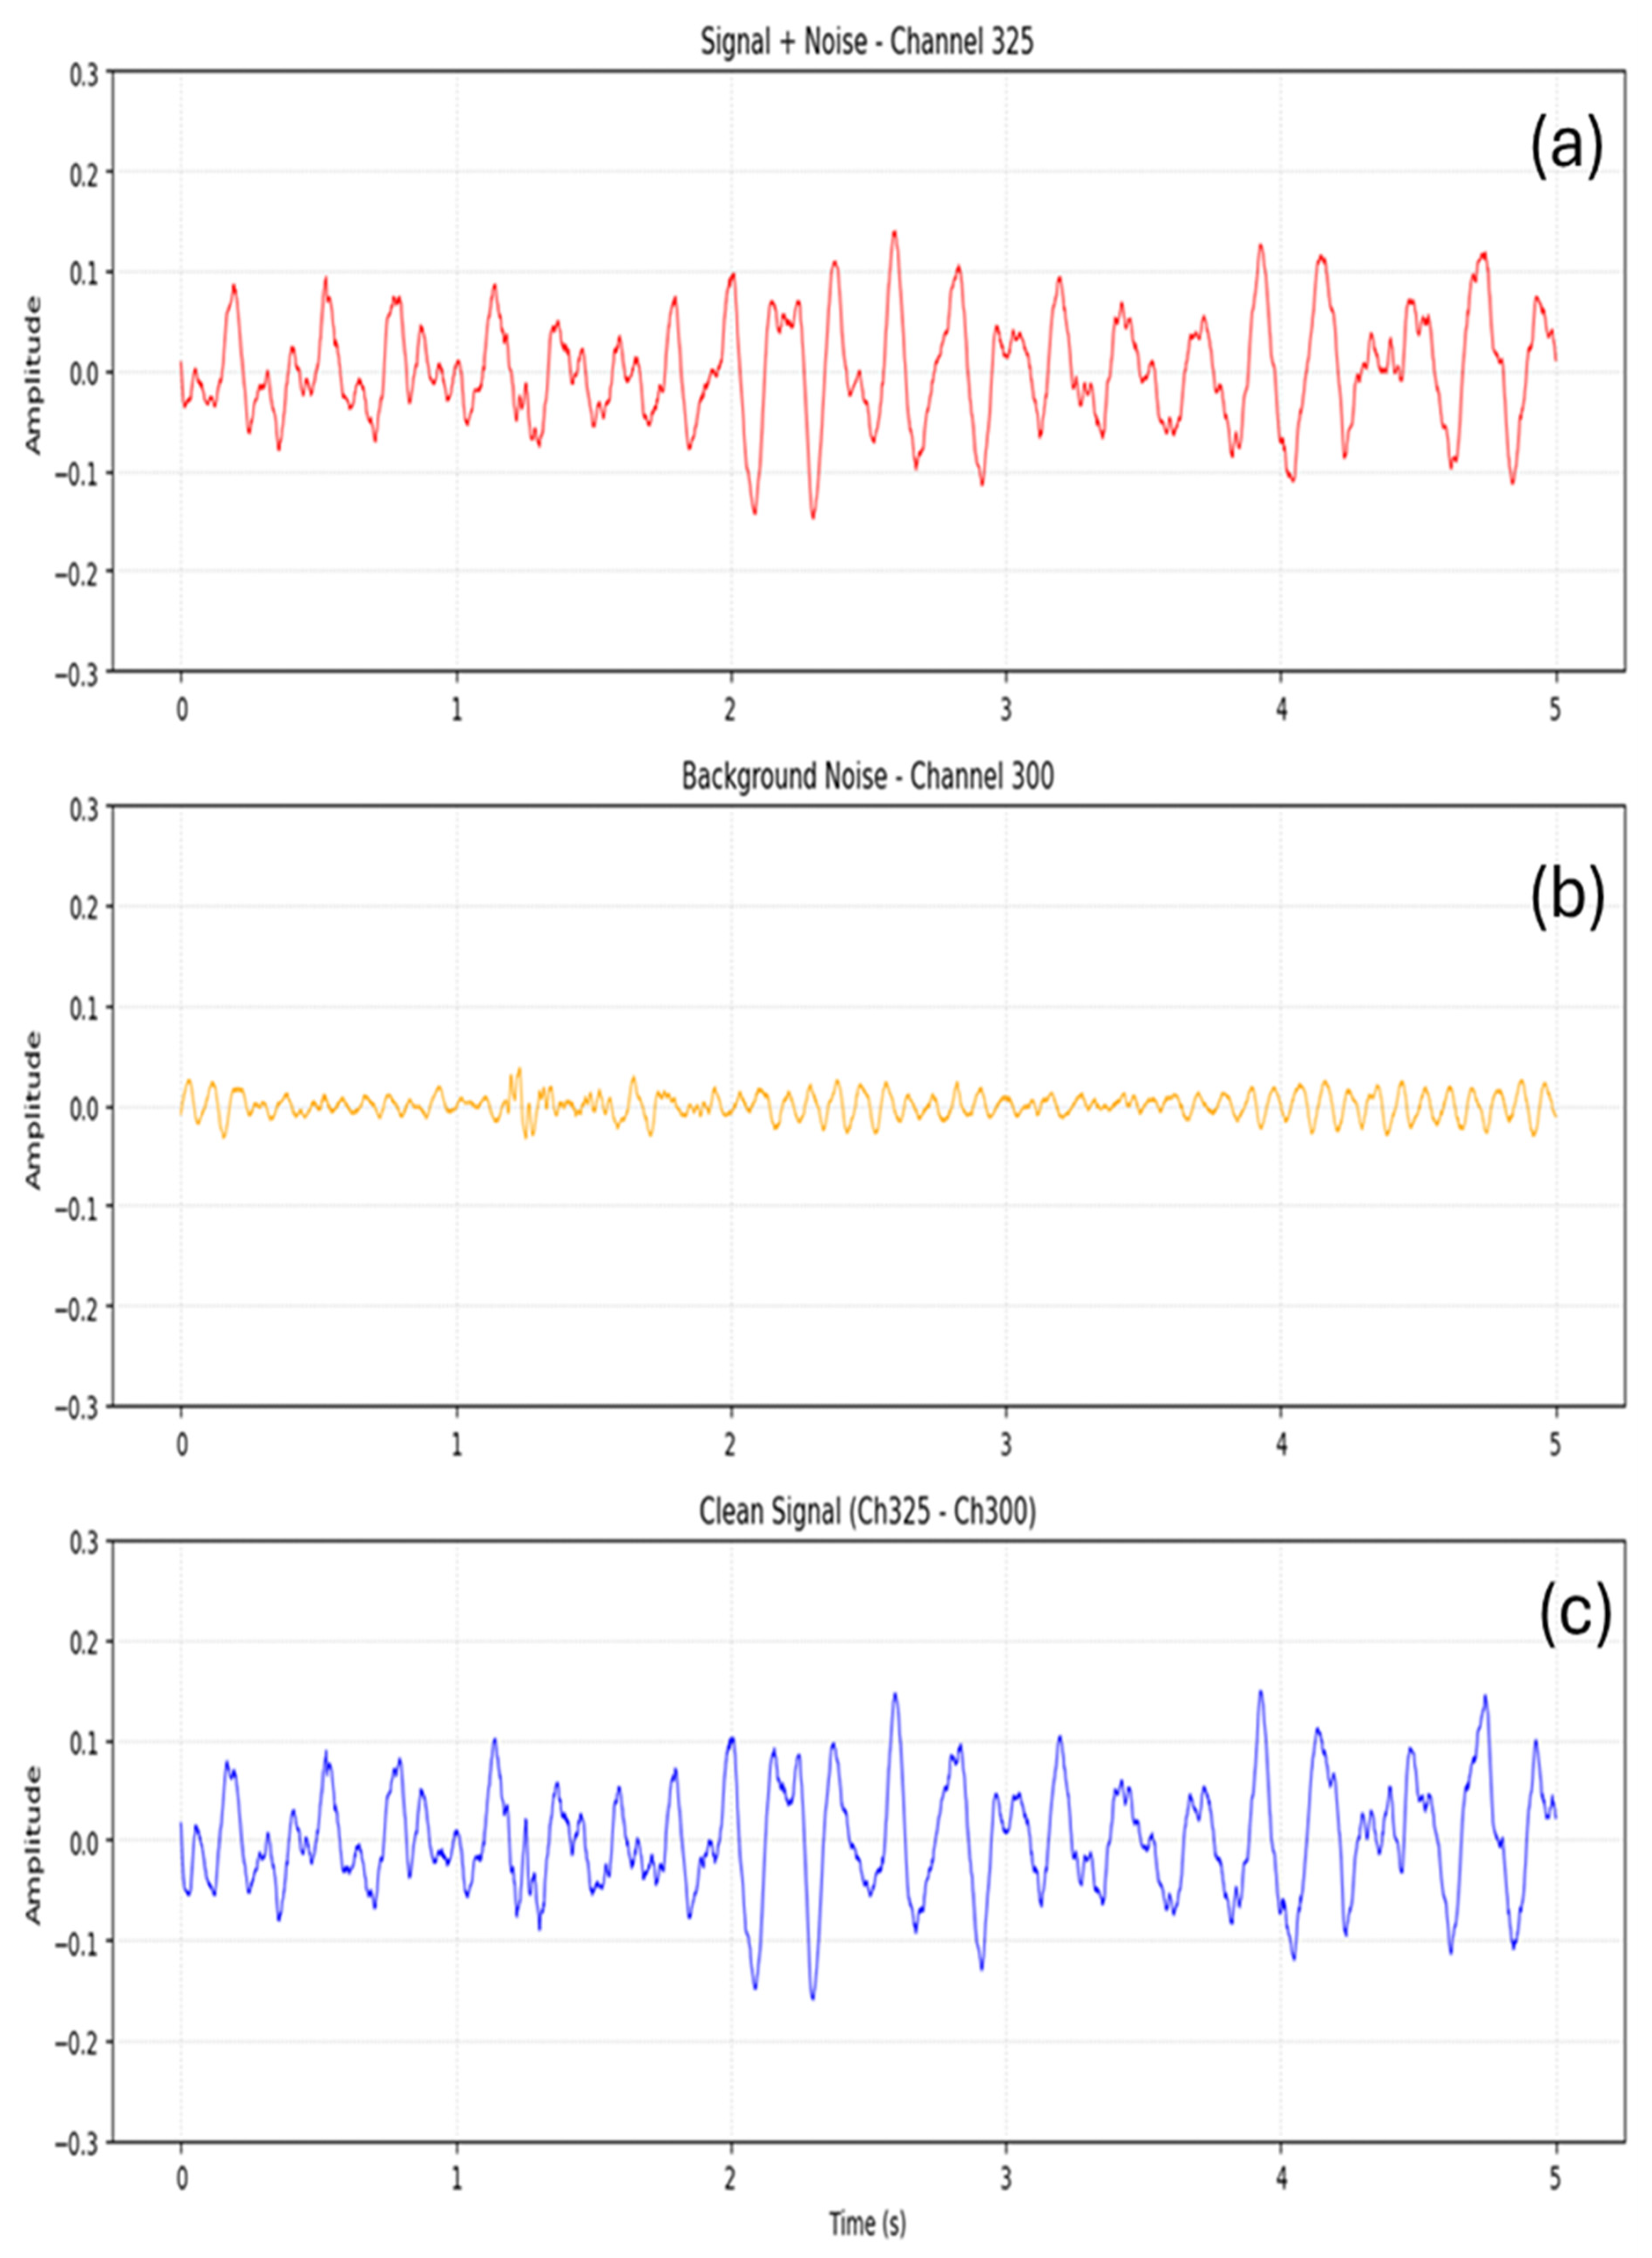
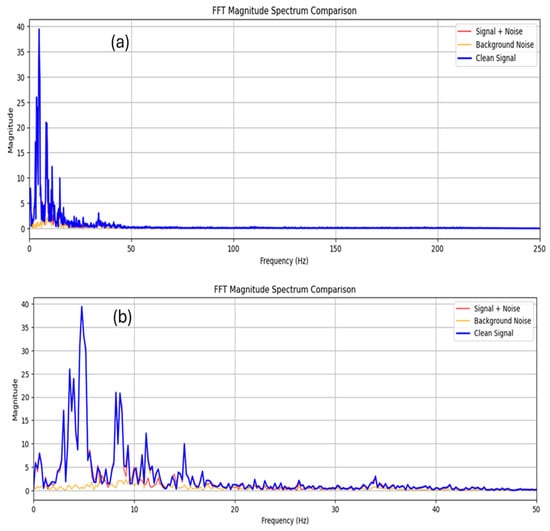
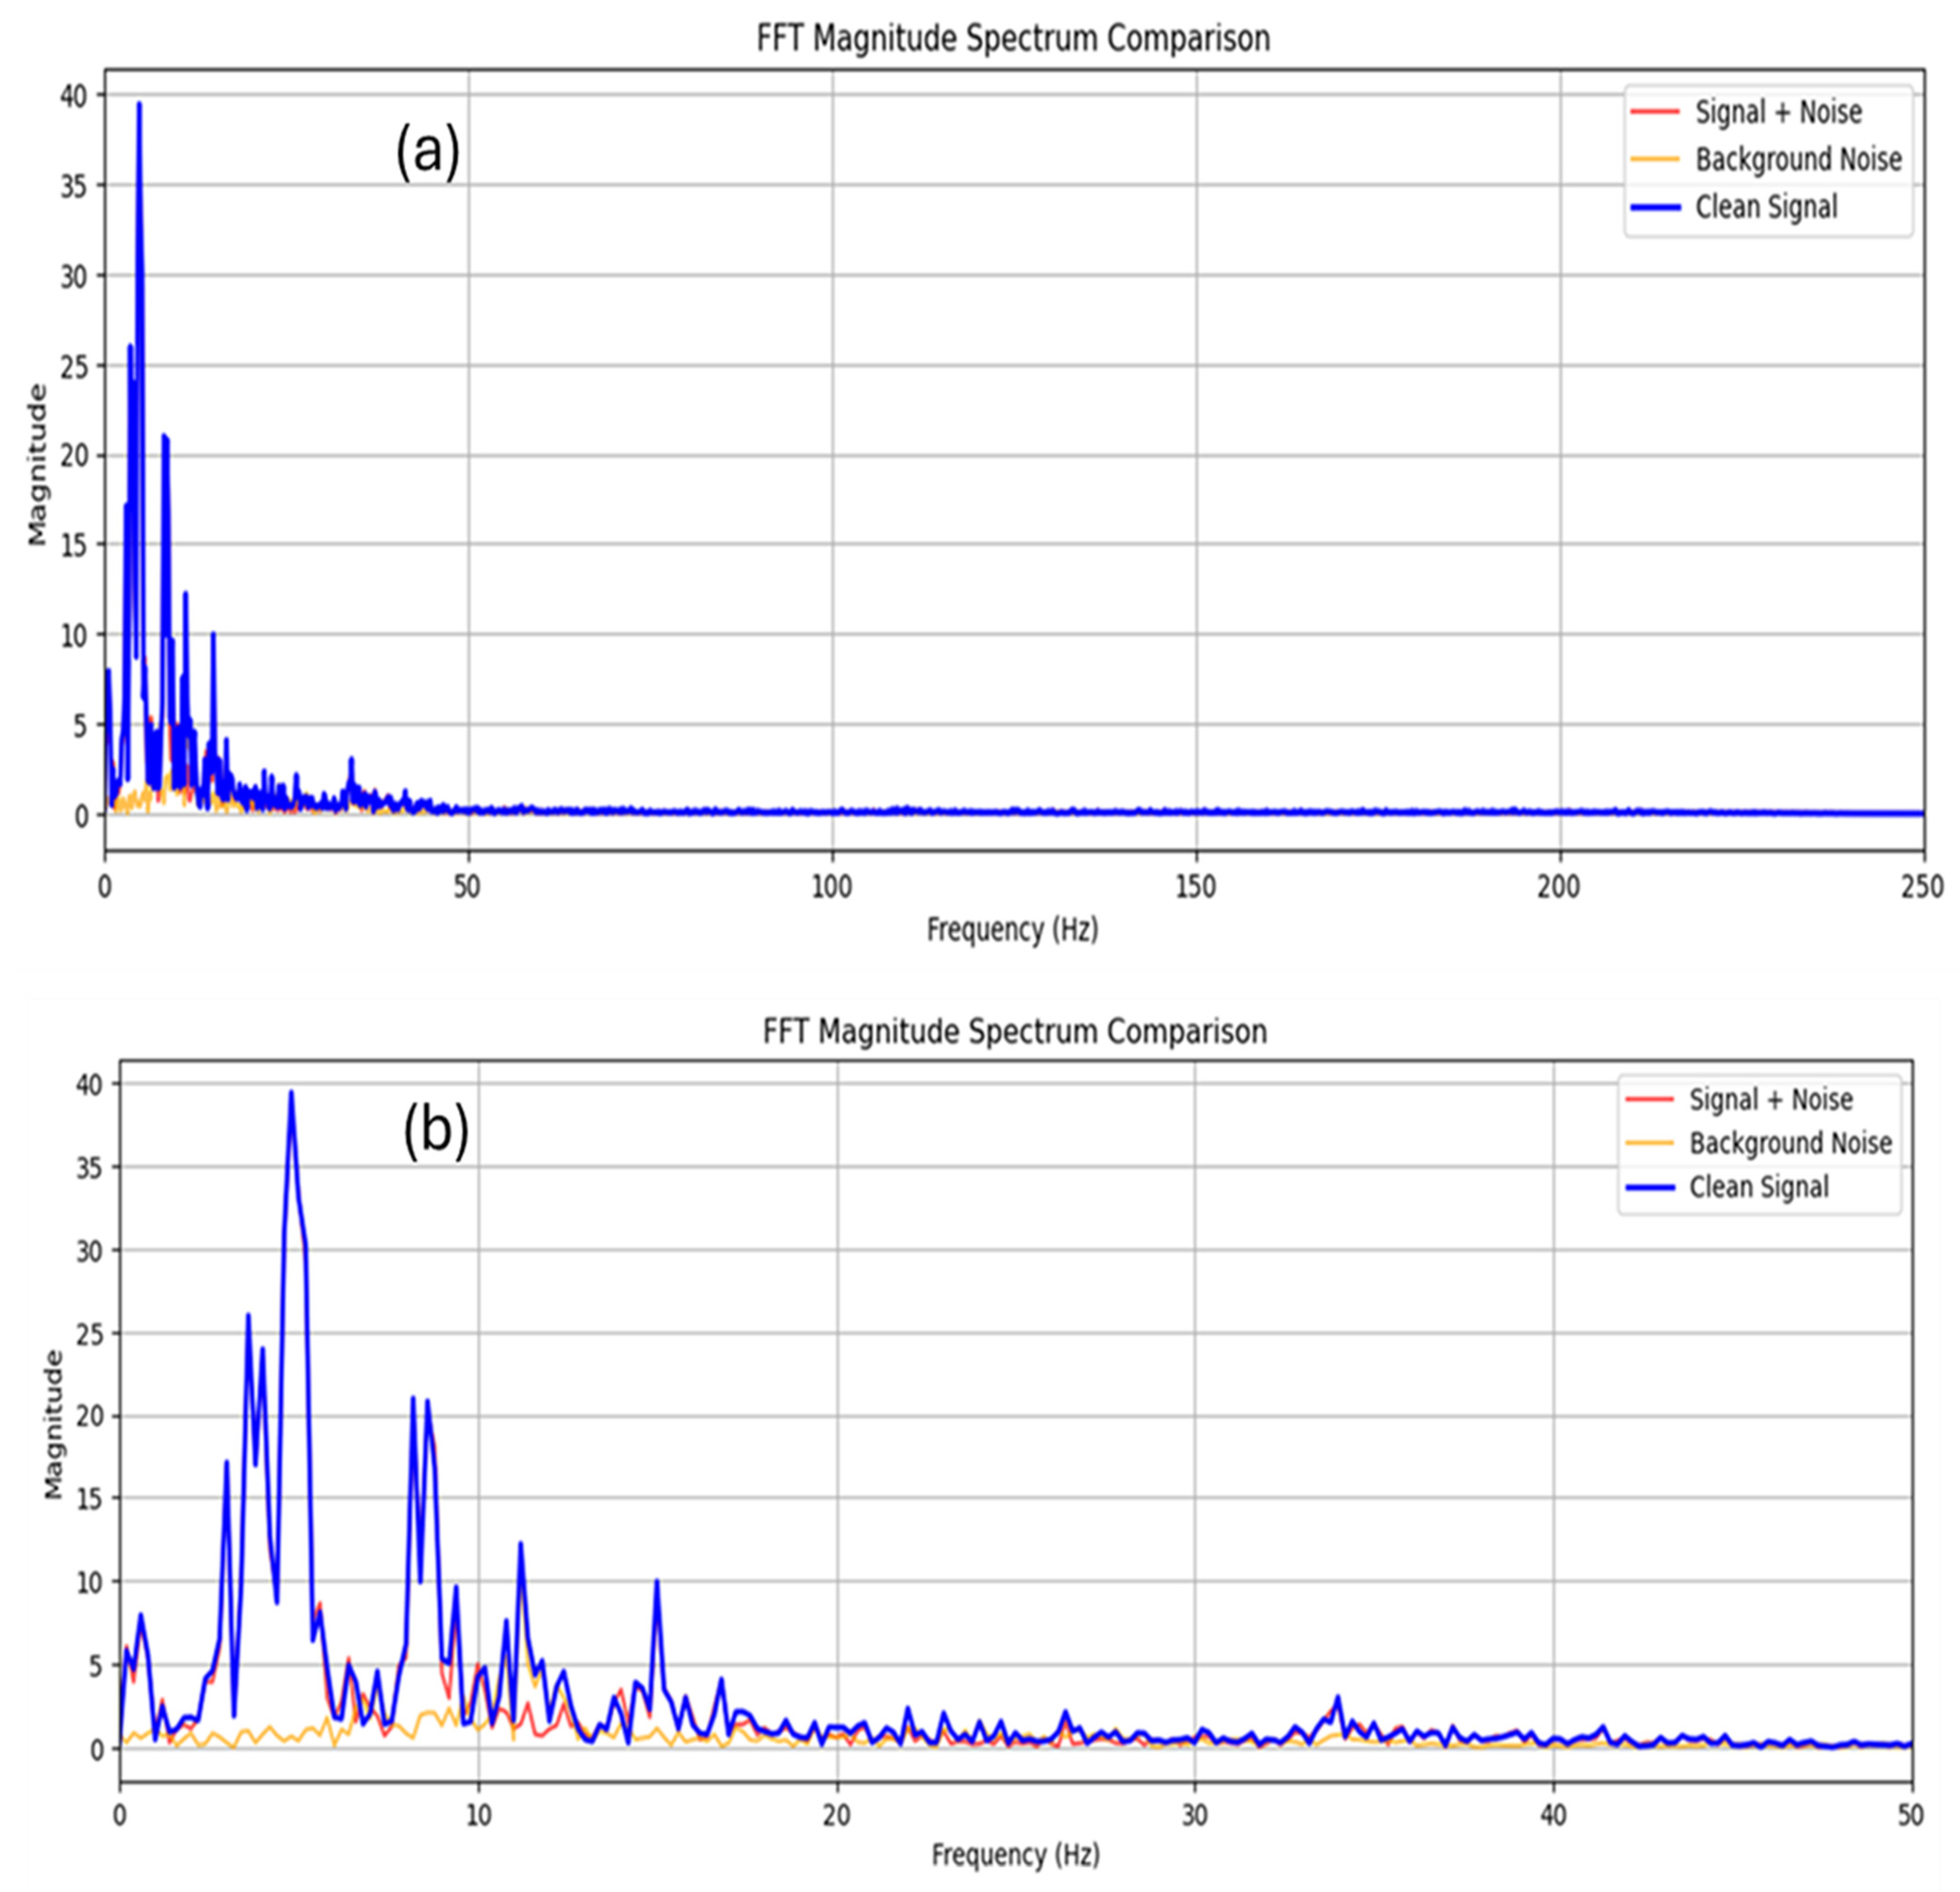
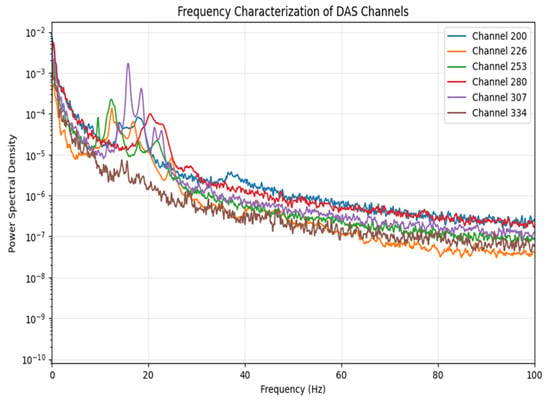
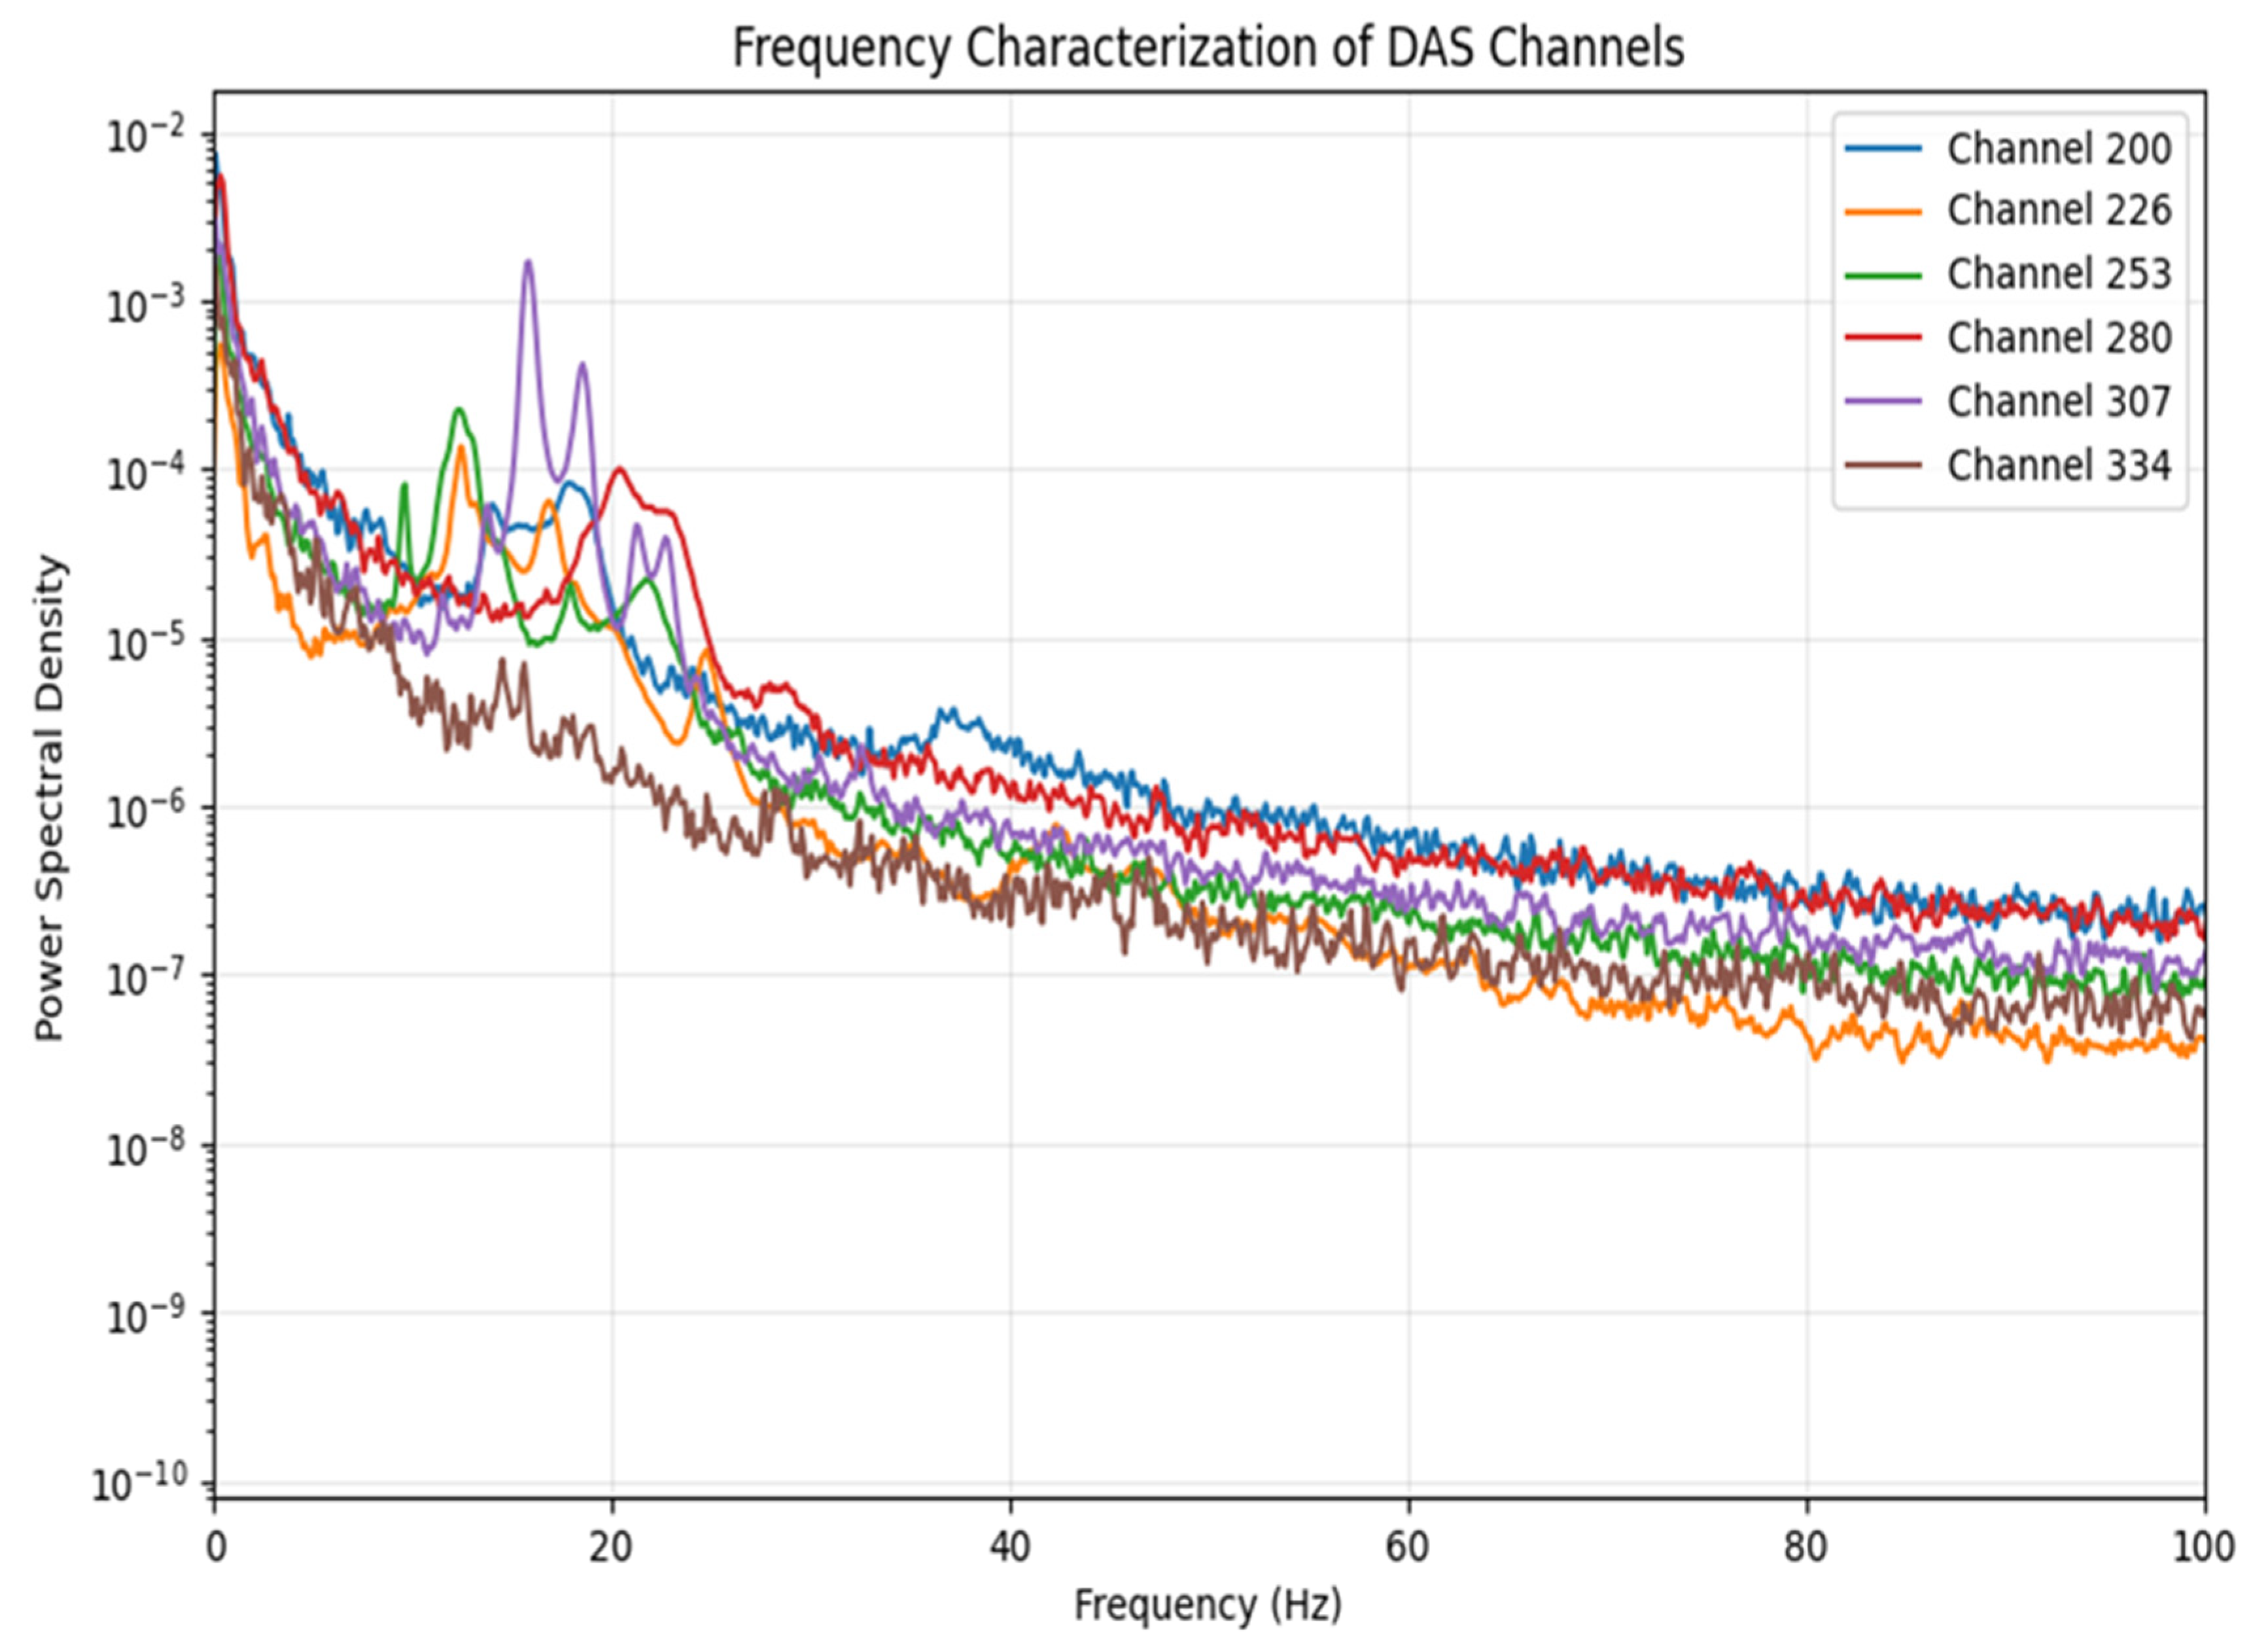
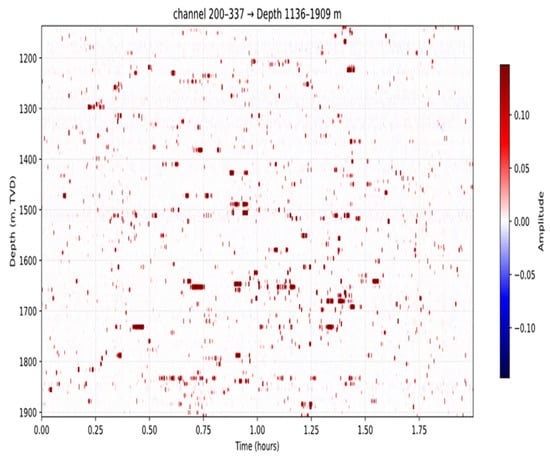
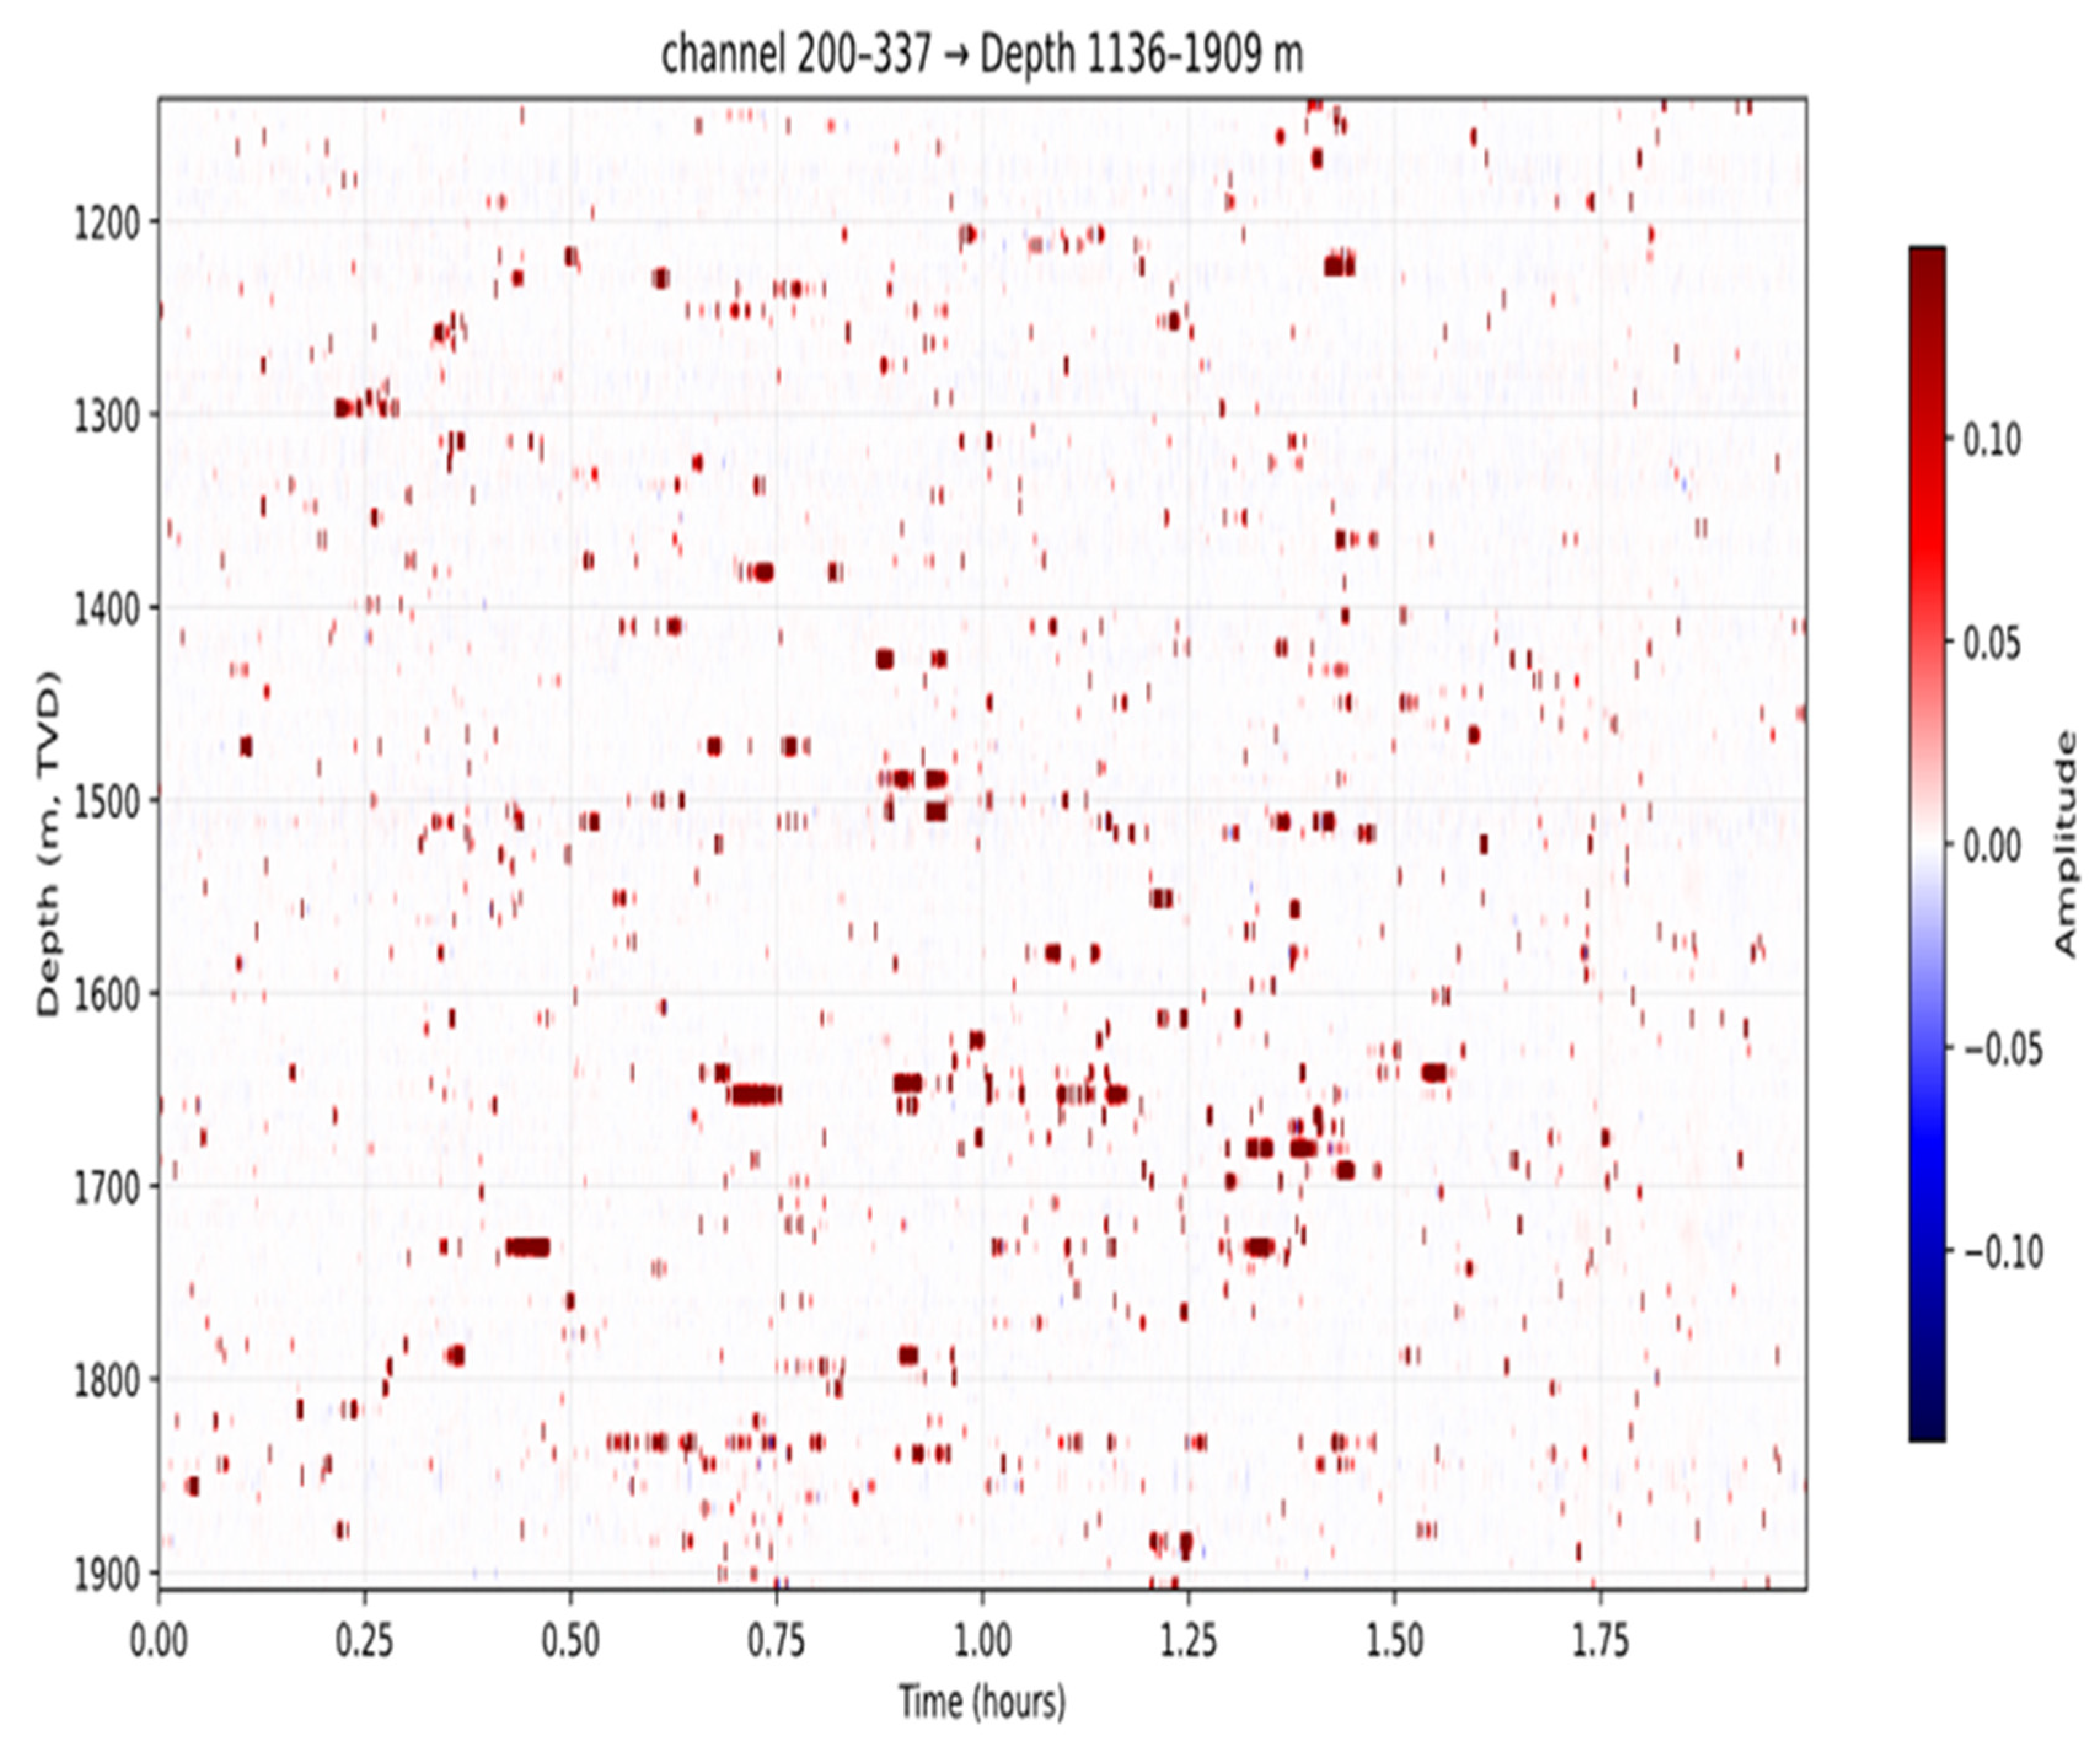
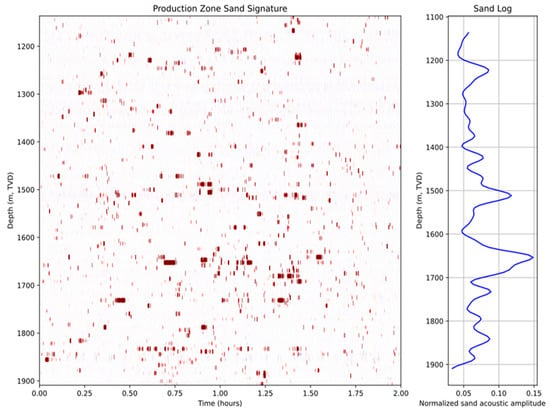
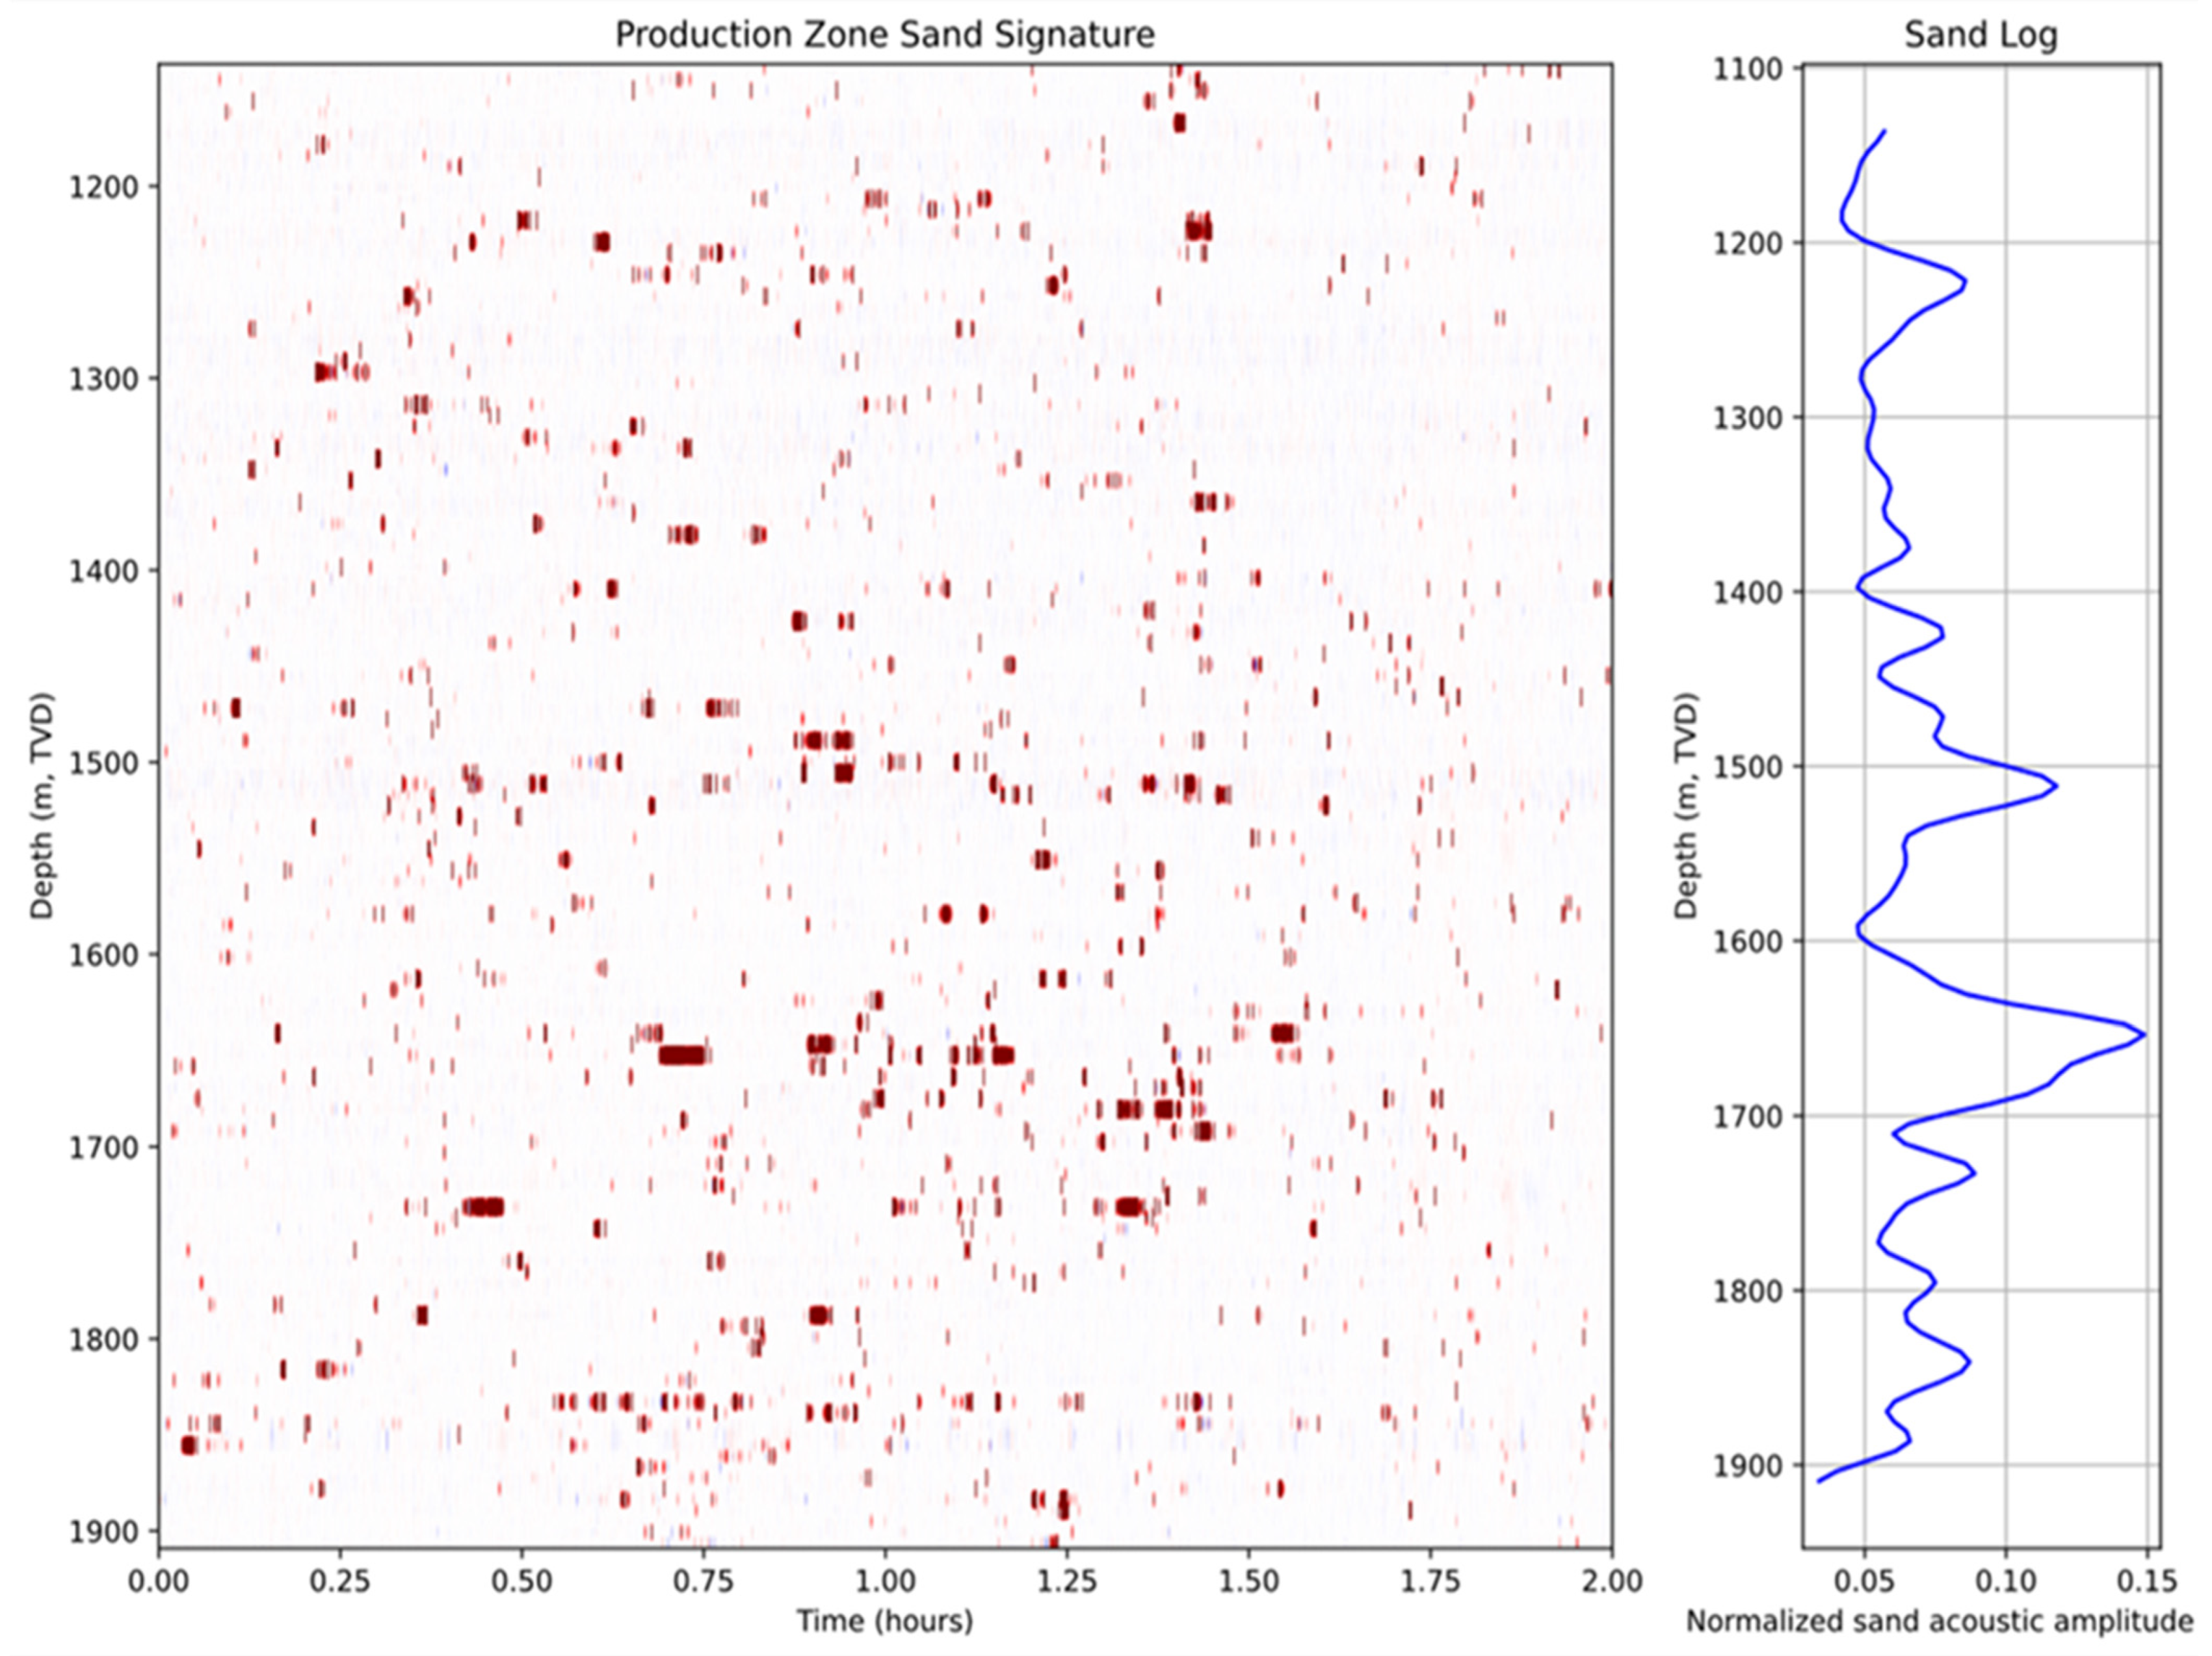
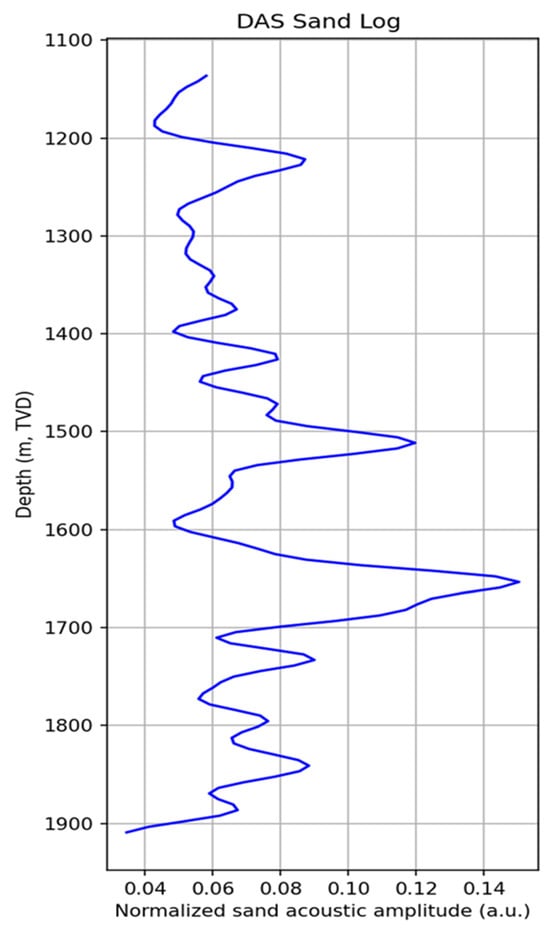
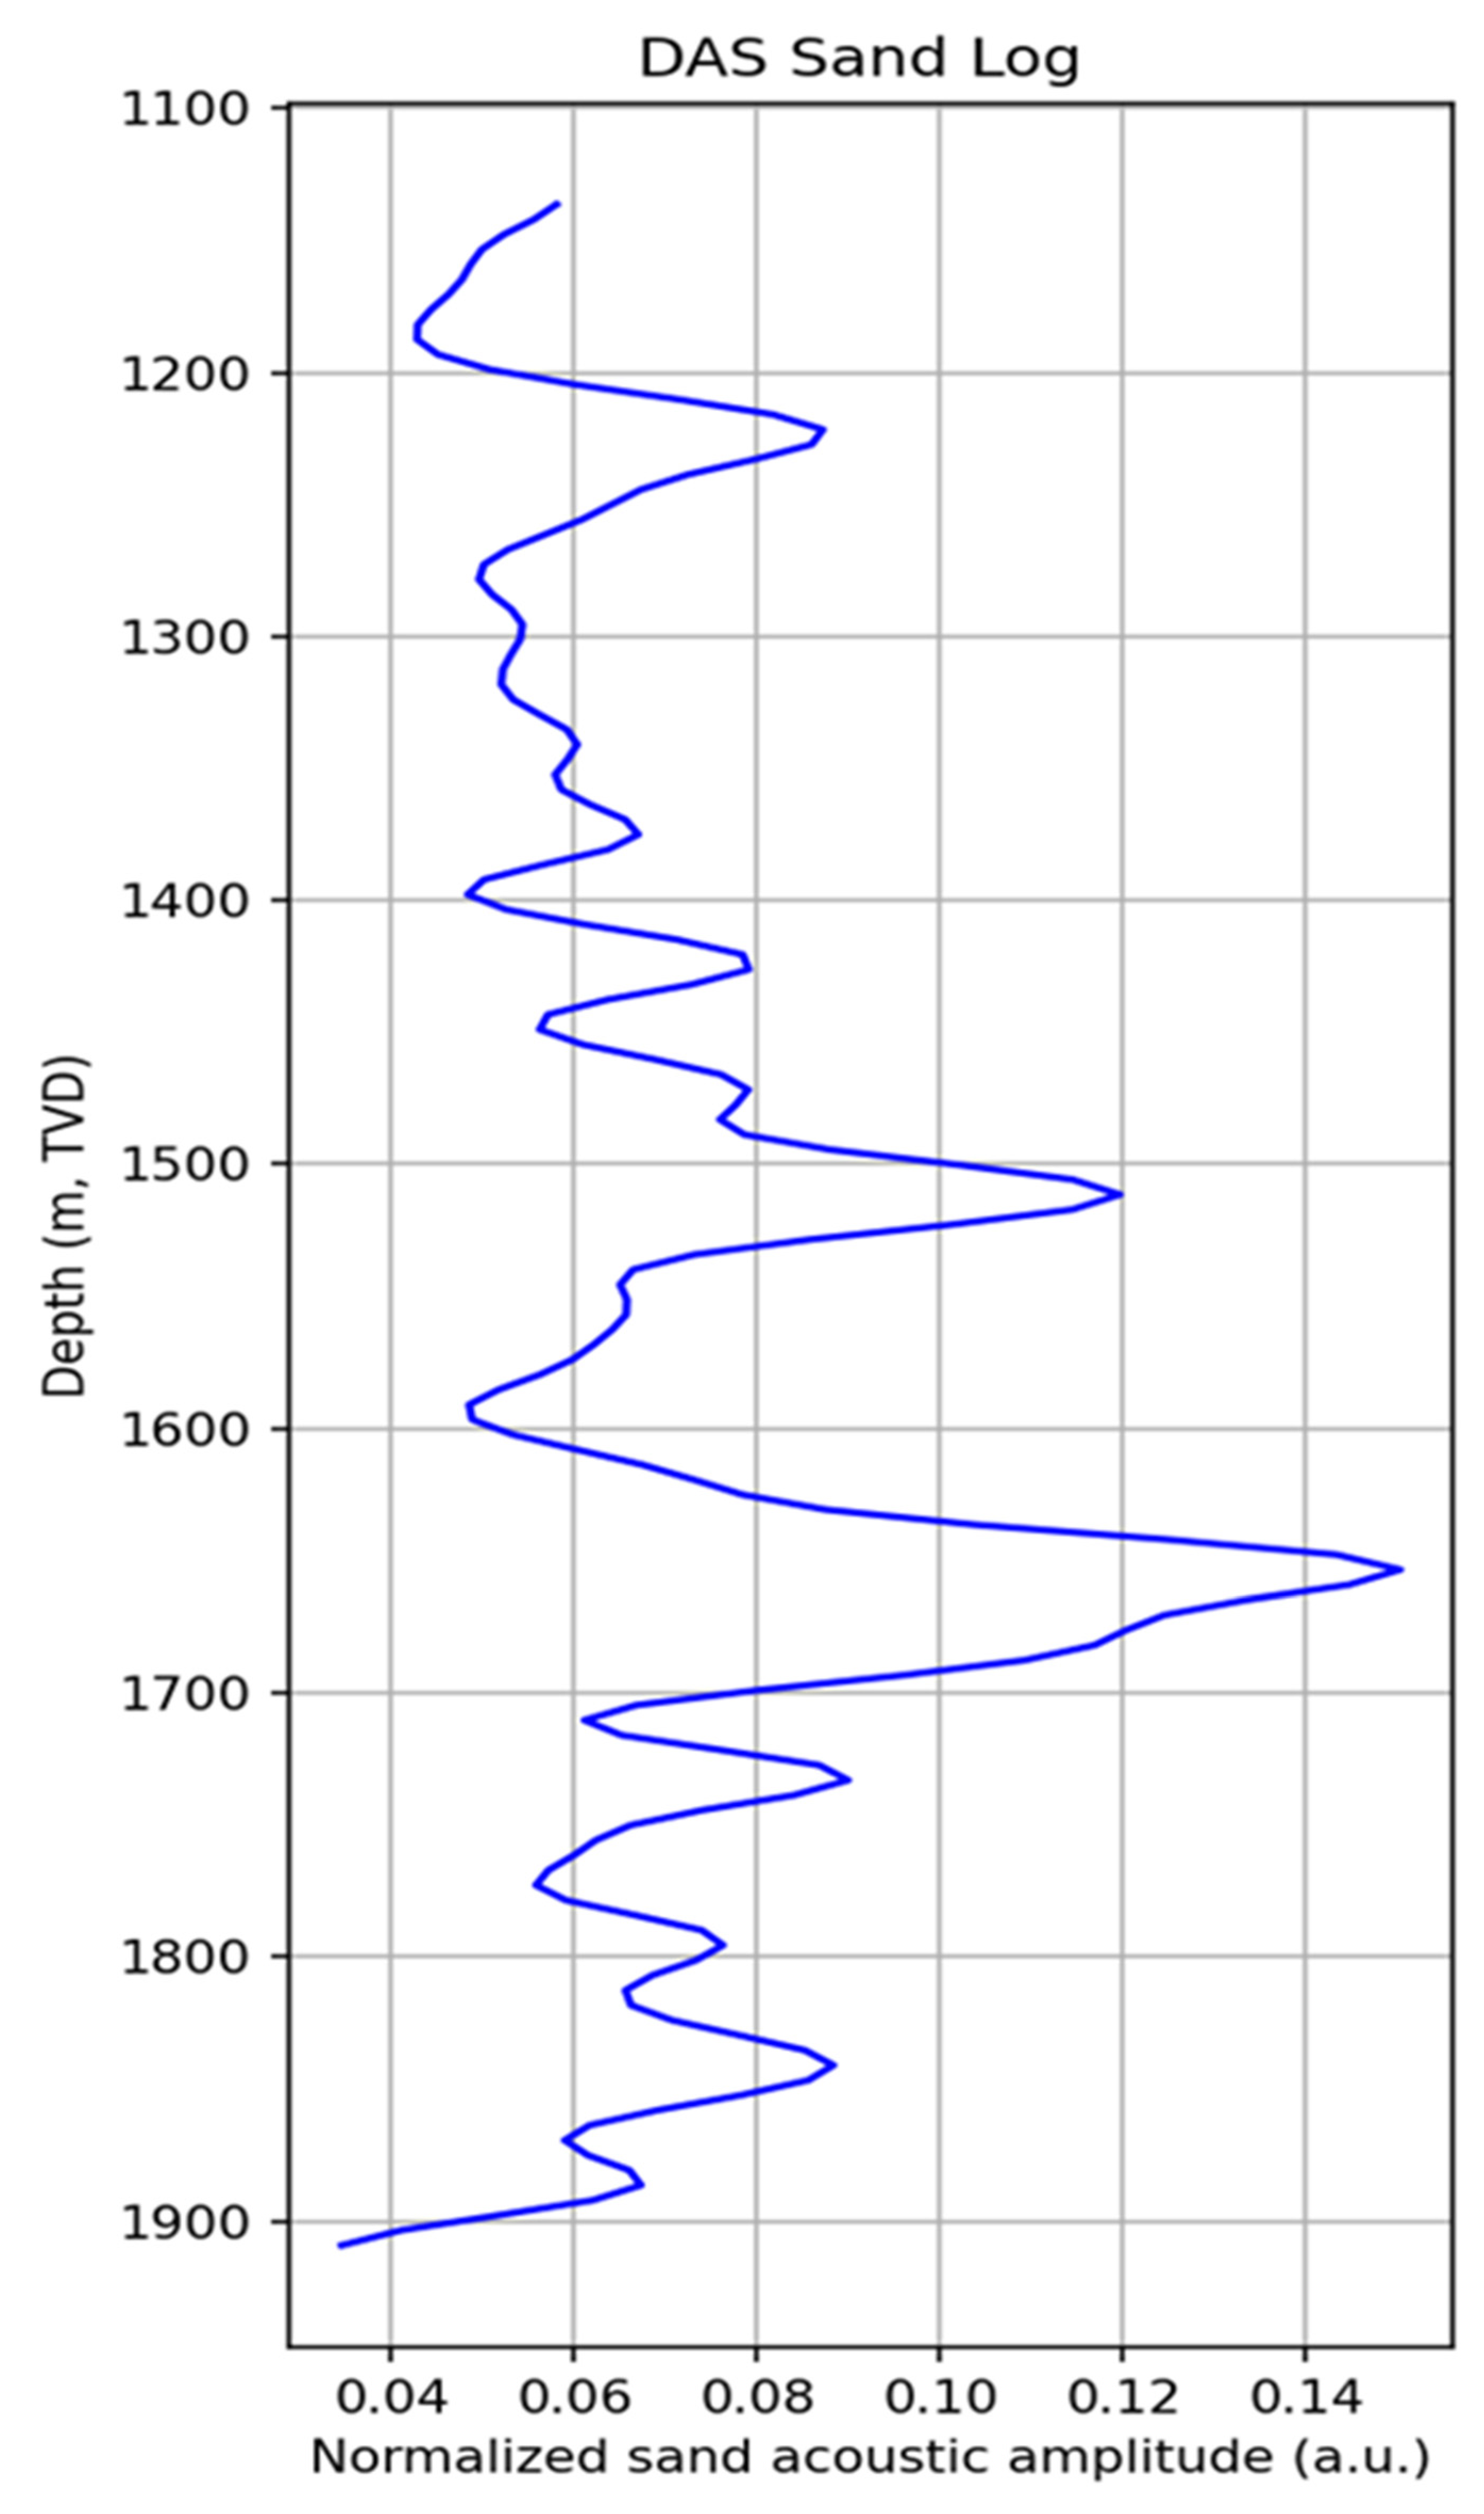

Disclaimer/Publisher’s Note: The statements, opinions and data contained in all publications are solely those of the individual author(s) and contributor(s) and not of MDPI and/or the editor(s). MDPI and/or the editor(s) disclaim responsibility for any injury to people or property resulting from any ideas, methods, instructions or products referred to in the content. |
© 2026 by the authors. Licensee MDPI, Basel, Switzerland. This article is an open access article distributed under the terms and conditions of the Creative Commons Attribution (CC BY) license.