


Abstract
This study presents Tail-Aware Residual Adaptation (TARA), a hybrid framework for supervised cross-dataset phishing URL detection designed to preserve ranking performance at low false-positive rates (FPRs). The evaluation employs 55 URL-derived features, chronological domain-disjoint partitions, and independent probability and threshold calibration. On a locked test set of 46,942 URLs from 33,428 domains, TARA achieved a ROC-AUC of 0.9443, standardized pAUC at FPR ≤ 1% of 0.8109, and TPR at FPR ≤ 0.1% of 0.4582. Three of 16 primary low-FPR comparisons remained statistically significant after Holm correction. TARA and TailTree-only achieved identical performance at FPR ≤ 0.1%, while TARA improved global ROC-AUC by 0.0140. In an additional temporal source-target configuration, TARA achieved a ROC-AUC of 0.9651 and pAUC at FPR ≤ 1% of 0.8040, although its advantage over TailTree-only was not statistically significant. Evaluation on a third, independently collected target dataset yielded a ROC-AUC of 0.9365 and a standardized pAUC at FPR ≤ 1% of 0.7206, without establishing a statistically significant low-FPR advantage over competing models. A nominal 0.1% FPR threshold yielded an observed FPR of 0.3178%, which weekly recalibration failed to reduce. These findings demonstrate the conditional benefits and operational limitations of TARA under temporal distribution shifts.
1. Introduction
Phishing remains a serious cybersecurity threat, as malicious actors constantly modify their malicious URLs, domain infrastructures, and deception strategies to bypass existing detection mechanisms. Phishing URLs serve as the starting point for credential theft, financial fraud, and unauthorized access to sensitive information; therefore, their timely identification is a critical component of modern cybersecurity systems. Existing detection technologies include methods based on blacklists, similarity analysis, traditional machine learning, and deep learning [1,2]. Recent reviews highlight significant progress in automated phishing detection, while also noting unresolved challenges such as the continuous evolution of attack schemes, the heterogeneity of data sources, feature representation, and the reliability of detection systems in real-world operational environments [3,4,5]. Consequently, creating accurate classifiers is no longer sufficient; it is equally important for models to maintain reliable performance even as the characteristics of incoming URLs change.
The effectiveness of phishing URL detection depends heavily on the characteristics and representativeness of the datasets used for training and evaluation. Prasad and Chandra [6] introduced PhiUSIIL, a large-scale dataset for phishing detection that incorporates various security indicators and information derived from similarity analysis. Subsequently, Dalton et al. [7] proposed PhreshPhish an extensive dataset and benchmarking framework designed to address limitations such as poor data quality, information leakage, and unrealistic evaluation conditions. These studies underscore the importance of dataset quality and sound experimental design. However, models evaluated using random splits of a single dataset may exploit patterns specific to that particular source patterns that may no longer hold if the data collection process, the composition of domains, or the observation period changes. Consequently, to assess the practical applicability of phishing detection models across diverse settings, it is essential to conduct evaluations on independent datasets and perform testing that incorporates temporal data splitting.
Traditional machine learning algorithms remain competitive for the task of classifying phishing URLs, especially when these URLs are represented as structured numerical features. Odeh et al. [8] compared CatBoost, XGBoost, and LightGBM, demonstrating the effectiveness of gradient boosting methods for phishing detection. Reyes-Dorta et al. [9] further explored machine learning techniques for identifying malicious URLs, while Yi et al. [10] investigated the classification of phishing URLs across various datasets, as well as the interpretability of decision tree-based models. These studies confirm that the use of custom-engineered URL features and ensemble learning methods remains highly relevant. Nevertheless, high classification performance on a specific dataset does not guarantee stable operation when data distributions shift over time or when there are strict constraints on the number of false positives.
Deep learning methods have enabled more flexible approaches to representing the lexical and structural characteristics of URLs. Zheng et al. [11] developed the HDP-CNN architecture, which integrates word-level and character-level representations using a hierarchical convolutional neural network. Bozkir et al. [12] proposed a method called GramBeddings, which utilizes learned vector representations (embeddings) of n-grams to detect phishing URLs, while Hussain et al. [13] introduced the CNN-Fusion approach, which extracts complementary patterns through multiple convolutional branches. Models based on the Transformer architecture capable of capturing dependencies within the sequences that make up URLs are also attracting increasing attention. Specifically, Maneriker et al. [14] proposed a model called URLTran and evaluated its effectiveness in detecting phishing while maintaining an extremely low false-positive rate. Their results demonstrate that differences in model performance can be decisive, particularly within the ranges of false-positive rates that are critical for real-world security systems.
Recent research has also explored hybrid architectures that combine complementary feature representations and learning mechanisms. Asiri et al. [15] proposed PhishTransformer, which integrates convolutional processing with Transformer-based representations for phishing detection. Do et al. [16] developed an integrated architecture combining deep learning classifiers with a pre-trained Transformer, while Liu et al. [17] introduced TransURL, which incorporates multi-layer Transformer encoding and multi-scale feature extraction. Other studies have extended detection capabilities beyond URL strings by integrating additional contextual or structural information. Yoon et al. [18] combined URL representations with HTML Document Object Model (DOM) graphs using graph convolutional networks and Transformer networks, whereas Remya et al. [19] proposed BGL-PhishNet, which integrates BERT, graph neural networks, and LightGBM. Although these architectures demonstrate the potential of hybrid learning, their complexity does not, in itself, guarantee improved adaptability to shifts in data distribution. Furthermore, approaches that require web page content or external information introduce dependencies that are not always suitable for offline, URL-only detection.
The relationship between tree-based and neural approaches is particularly relevant when phishing URLs are represented using numerical features. Gorishniy et al. [20] introduced FT-Transformer as a competitive architecture for tabular learning, while Grinsztajn et al. [21] demonstrated that tree-based methods often remain more effective than deep learning models on typical tabular datasets. These results demonstrate that tree-based ensembles and neural networks possess distinct inductive properties and can provide complementary information. However, unrestricted averaging or conventional fusion of estimates does not explicitly safeguard the ranking of complex legitimate observations the very cases that determine detection performance at extremely low false-positive rates. Consequently, a hybrid system may improve overall discrimination while simultaneously degrading performance in the operationally critical region of the ROC curve.
Another fundamental issue concerns the reliability of experimental evaluation. Arp et al. [22] demonstrated that inappropriate evaluation protocols in machine learning-based security research can lead to erroneous conclusions regarding the practical effectiveness of detection methods. Kapoor and Narayanan [23] also identified information leakage as a primary source of overly optimistic performance estimates and limited reproducibility. More broadly, the WILDS benchmark, introduced by Koh et al. [24], showed that natural distribution shifts can significantly reduce prediction accuracy compared to traditional in-distribution evaluation. In phishing detection, these issues are particularly relevant, as recurring URLs, shared registered domains, dataset-specific data collection characteristics, and temporal dependencies can create unintended similarities between training and test observations. Consequently, rigorous evaluation requires careful data preparation involving domain identification, the creation of non-overlapping domain splits, chronological partitioning, and strict isolation of the model development phase from final testing.
Beyond detection performance, operational phishing detection requires reliable probability estimates and well-defined decision thresholds. Silva Filho et al. [25] emphasized that classifier calibration is a property distinct from discrimination and should be assessed using appropriate probabilistic criteria. In security systems, this distinction is especially critical, as even a low false-positive rate can generate a large number of unnecessary alerts when processing high volumes of legitimate URLs. Therefore, metrics such as ROC-AUC, precision, and the F1-score may be insufficient to characterize performance in highly constrained application domains. Partial ROC-AUC and the true positive rate at specific false positive rate levels provide additional insight into the quality of a ranking. However, a strong ranking with a low false positive rate does not guarantee that a threshold calibrated on development data will maintain the same false positive rate following a shift in the temporal distribution. Consequently, probability calibration, ranking performance, and behavior at a fixed threshold should be evaluated separately.
Temporal distribution shifts remain a major challenge in malicious URL detection. Previous studies have investigated online learning [26,27], concept drift and dataset shift [28,29], temporally realistic security evaluation [30,31], and continual adaptation of phishing detectors [32,33,34,35]. However, these approaches do not jointly address supervised cross-dataset adaptation and low-FPR ranking preservation. Hard-example mining [36], Neyman–Pearson classification [37], and partial-AUC optimization [38,39] offer complementary strategies for controlling classification errors. Unlike conventional hard-example mining, TARA identifies difficult legitimate URLs through domain-grouped out-of-fold predictions and uses a deterministic ranking guard rather than directly optimizing partial AUC. Supervised transfer learning [40] commonly relies on fine-tuning pretrained models, although this may distort previously learned representations [41]. TARA instead freezes the source encoder and evaluates its contribution separately from additional model capacity. Conventional ensemble methods, including mixtures of experts [42], stacking [43], dynamic classifier selection [44], cascades [45], and weighted voting [46], employ learned selection or general fusion rules. Multimodal phishing detection additionally requires webpage information [47]. In contrast, TARA uses URL-only features and a parameter-free conditional ranking guard that preserves specialist ordering within a predefined high-score region. This structural guarantee does not imply stable operational FPR under distribution shifts.
Despite significant progress in detecting phishing URLs, a number of challenges remain inadequately addressed. Existing evaluation protocols often emphasize performance within a single dataset, failing to properly account for cross-dataset and temporal distribution shifts. Furthermore, high overall classification accuracy does not necessarily translate to robust detection with an extremely low FPR a scenario where the ranking of complex, legitimate URLs becomes particularly critical. Traditional ensemble methods may improve overall discriminative power, but they lack an explicit mechanism to maintain a critically low FPR during model adaptation. These limitations highlight the need for an approach that integrates the preservation of source-domain knowledge, target-specific learning, leakage-safe evaluation, and controlled ranking behavior in the presence of distribution shifts.
To address these issues, this study proposes TARA, a hybrid framework for supervised phishing URL detection across different datasets. The proposed approach combines a frozen source-domain residual encoder with a specialized ensemble comprising CatBoost and a source-aware FT-Transformer integrated via a deterministic, tail-aware ranking mechanism. The primary objective of TARA is to enhance discrimination at a low FPR when applied to target observations that are temporally distinct and domain-disjoint from the source data, all while preserving previously learned source representations. Unlike traditional, unconstrained fusion, TARA explicitly regulates the contribution of neural processing within a predefined protected ranking region.
In this study, cross-dataset adaptation is explicitly formulated as a supervised learning problem in which a representation pretrained on the PhiUSIIL source corpus is incorporated into a model adapted using labeled observations from the PhreshPhish target corpus. Therefore, the proposed framework does not represent zero-shot transfer to an unseen dataset. To assess whether the source-domain information contributes to target-domain performance, additional source-aware baseline models are introduced. These include direct source-only inference, pooled source-target training, augmentation with frozen source representations, and full fine-tuning of a source-pretrained neural network. These comparisons distinguish the contribution of source-domain knowledge from that of target-specific learning and the tail-aware ranking mechanism.
This study addresses four research questions. RQ1: Does TARA improve low-FPR ranking performance compared with conventional machine learning and neural models under a common evaluation protocol? This is examined using pAUC and TPR metrics with domain-level statistical inference. RQ2: What are the contributions of source pretraining, hard-negative weighting, ranking protection, and additional model capacity? These are assessed through component ablations and source-aware comparators. RQ3: Does supervised target adaptation preserve the original source-domain decision function? This is evaluated using source-route consistency checks and independent source-test results. RQ4: How do chronological changes and dataset composition affect detection performance and the stability of calibrated thresholds? This is examined through temporal error analysis and fixed-threshold evaluation.
The main contributions of this study can be categorized into four parts. First, a secure experimental protocol has been developed using PhiUSIIL and PhreshPhish, incorporating the isolation of source and target domains, chronological separation, and independent calibration procedures. Second, a hybrid adaptation framework has been devised, which integrates frozen source representations, domain-grouped hard-negative specialization (focusing on challenging misclassifications), and contextual neural learning. Third, TARA is systematically evaluated against classical machine learning models, gradient-boosted methods, neural architectures, and additional source-aware comparators, including source-only inference, pooled source-target training, source-representation augmentation, and source-pretrained network fine-tuning. The evaluation incorporates global discrimination, low-FPR metrics, domain-level bootstrap inference, and fixed operating thresholds. Fourth, to investigate the contributions and limitations of the proposed framework, the study includes ablation experiments, feature-unavailability tests, computational analysis, and an assessment of temporal error.
The methodological novelty lies in a tail-aware conditional ranking mechanism. This mechanism preserves the ordering established by a specialized tree-based ensemble within a predefined high-score region, while simultaneously enabling neural processing outside of that region. Combined with leakage-resistant “hard-negative” specialization and frozen source representations, this design allows for the controlled integration of additional predictive components, rather than relying on unconstrained score averaging. Thus, the contribution centers on the coordinated adaptation and preservation of ranking, rather than the invention of entirely new boosting algorithms, transformer architectures, or calibration techniques. Since the adaptation process utilizes labeled observations from the target domain, the findings are specific to the supervised cross-dataset environment under study; they do not imply universal generalization in the absence of prior training, nor do they guarantee a stable FPR under arbitrary distribution shifts.
The remainder of this paper is organized as follows: Section 2 describes the datasets, the leakage-proof preprocessing procedure, the experimental design, the baseline models, and the proposed TARA architecture. Section 3 presents the results of the comparative evaluation, including statistical analysis, probability calibration, performance at a fixed threshold, computational efficiency, ablation experiments, robustness assessment, and an analysis of temporal errors. Section 4 discusses the key findings, methodological implications, practical applicability, and limitations of the study. Finally, Section 5 summarizes the main conclusions and outlines directions for future research.
2. Materials and Methods
2.1. Datasets and Experimental Design
This study utilizes three independently collected datasets. The PhiUSIIL Phishing URL Dataset [6] serves as the source corpus, whereas PhreshPhish [7] and the independently collected dataset of Hannousse and Yahiouche [48] are used as target corpora. The primary experimental configuration employs PhiUSIIL and PhreshPhish, while the third dataset provides an additional evaluation of supervised cross-dataset generalization. This experimental separation allows for the evaluation of phishing URL detection performance in the presence of both cross-corpus and temporal data distribution shifts. The source dataset, PhiUSIIL, contains 235,795 URLs; after removing duplicates and entries with inconsistent labeling, a sample of 234,687 observations was obtained. These data were used for the pre-training of the source feature representation. The data were partitioned at the level of registered domains, ensuring no overlap between the experimental subsets.
The target dataset, PhreshPhish, consists of locally stored metadata shards containing 168,060 observations collected over 62 distinct dates. To prevent cross-corpus overlap, 5822 domains along with their associated 35,450 URLs were removed. Following a chronological split and a forward domain purging procedure, the final target sample comprised 103,532 URLs. From this set, the 46,942 most recent observations were reserved as an independent locked test set, which was excluded from all stages of training, model selection, and calibration. For both datasets, a unified feature space was constructed, consisting of 55 numerical characteristics extracted deterministically from the structure of the URLs themselves. HTML content, source and domain identifiers, timestamps, and indicators of experimental subset membership were excluded from the set of predictors. This ensures the comparability of input data across the pre-training, supervised adaptation, and independent evaluation phases of the proposed TARA model.
Table 1 presents the final structure of the study following all procedures for identity verification, domain intersection, and temporal purging. The source corpus is partitioned into independent domain groups designated for fit, selection, calibration, and testing. The primary source fit set contains 165,557 URLs from 138,395 domains; the other three sets comprise a comparable number of groups and remain inaccessible for the direct training of the source model.
Table 1.
Final distribution of source and target data across experimental roles.
The target portion has a fundamentally different organization. The adaptation phase spans the period from 8 September to 4 October 2025, and comprises 29,016 observations. The selection phase covers the following week, the calibration phase spans 12–23 October, and the locked test phase begins on 24 October and continues until 16 December 2025. Consequently, the test sample is not only domain-disjoint but also strictly subsequent to the development population in terms of time. A significant shift in prevalence is particularly evident in the test set: out of 46,942 URLs, 39,391 are classified as phishing, whereas in the adaptation phase, the positive class is represented by only 3847 observations. This structure incorporates both prevalence shifts and temporal shift into the evaluation process itself, precluding any interpretation of the final results as a standard in-sample validation. The temporal distribution of legitimate and phishing URLs within the target development period is illustrated in Figure S1. The variation in daily collection intensity and class composition further justifies the use of chronological partitioning rather than random, row-level splitting. To assess the effect of temporal variation in the target data, an additional temporal configuration (Configuration A) was evaluated. PhiUSIIL was retained as the source dataset, while an earlier PhreshPhish collection period (July–October 2024) was used as the alternative target population. The target data were partitioned chronologically into adaptation, selection, calibration, and locked-test subsets, with registered-domain isolation and independent probability and threshold calibration. The additional locked test comprised 29,187 URLs from 23,557 domains, including 15,768 phishing and 13,419 legitimate URLs. All models were retrained using the same experimental protocol and unchanged hyperparameters.
To evaluate generalization to an independently collected target corpus, a third experimental setting (Configuration C) was introduced. PhiUSIIL was retained as the source dataset, while the phishing website dataset compiled by Hannousse and Yahiouche [48] was used as the target dataset. This independently assembled collection includes phishing URLs obtained from PhishTank and OpenPhish and legitimate website URLs. Because reliable per-URL collection timestamps were unavailable, the target data could not be partitioned chronologically. Instead, registered domains overlapping with the PhiUSIIL source corpus were excluded, and the remaining target domains were assigned to adaptation, model selection, calibration, and locked testing using proportions of 45%, 10%, 20%, and 25%, respectively. The calibration population was further separated for probability and threshold calibration. The same 55 URL-derived features, predefined model configurations, and domain-level statistical evaluation procedures were retained. The final locked test contained 2348 URLs and was evaluated only after model development and calibration had been completed.
An additional evaluation was conducted using an expanded population of legitimate URLs to improve the statistical reliability of performance estimates in the extremely low-FPR region. This population was extracted from the earlier training portion of PhreshPhish version 1.0.1, covering the collection period from 31 July 2024 to 8 September 2025. It comprised 94,752 legitimate URLs from 72,560 registered domains and contained no phishing observations. The selected domains were absent from the PhiUSIIL source corpus and from the adaptation, selection, calibration, and locked-test subsets of the primary experimental configuration. Thus, the additional legitimate URLs had not been used for training, model selection, or calibration of the evaluated models. For this evaluation, the original 39,391 phishing URLs from the primary locked test set were retained, while the original 7551 legitimate test URLs were replaced with the expanded legitimate population. The resulting evaluation set comprised 134,143 URLs, including 39,391 phishing and 94,752 legitimate observations. All previously trained models, probability calibrators, and operational thresholds remained unchanged. This experiment provides an assessment of ranking performance and false-positive behavior on a larger, domain-disjoint legitimate population rather than an independent retraining experiment or a prospective temporal evaluation.
Data preparation was organized as a sequential, leakage-safe pipeline, in which entity identification, duplicate management, the assignment of independent roles, feature extraction, and numerical transformations were performed prior to model training and remained independent of any subsequent testing results. This sequence is crucial for a cross-corpus study: preprocessing statistics, sample composition, and the boundaries of time intervals were not adjusted based on classifier performance. Figure 1 illustrates six interconnected stages: unification of raw records and the target variable; URL identity verification and the isolation of source and target domains; assignment of fixed data roles; construction of a unified feature space; training of numerical transformations exclusively on permitted training subsets; and the creation of reproducible datasets fed directly into machine learning and deep learning algorithms.
Figure 1.
Data preparation and construction of a leakage-safe cross-corpus dataset for phishing URL detection.
Let an individual observation be defined by a quadruple (1):
where ui—original URL string, yi ∈ {0, 1}—binary target variable, di—domain being registered, ti—a timestamp available for the target corpus. Following the unification of class semantics, a single definition (2) was used in all subsequent stages:
For PhiUSIIL, the original labeling was transformed so that the positive class carried the same meaning as it did in the target data. This ensured that discrepancies in the original labeling conventions did not carry over into the model training process. The first step in verifying consistency involved constructing a canonical representation of the URL (3):
where operator C(⋅)—performed IDNA normalization and converted the hostname to lowercase, while removing the fragment and the default port; however, it preserved the case and order of the components in the path and query. An empty path was normalized to “/”. Notably, HTTP/HTTPS schemes and various forms involving www were not artificially merged. This policy was employed specifically for verifying the identity of records, rather than for transforming predictors. For each canonical entry, the registered domain was determined (4):
Entries with an invalid URL or an unresolvable domain structure were excluded. If the same source or canonical URL was associated with conflicting classes, the corresponding identity was removed entirely. In cases of consistent duplicates, the first entry determined by a stable ordering was retained; for the target dataset, this corresponded to the earliest observation. Domains containing both legitimate and phishing URLs were not removed, as the presence of mixed semantics across individual pages within a single domain is plausible and does not constitute a conflict for a specific URL identity. A detailed audit of exact and canonical URL duplicates, conflicting labels, and domains with mixed labels is provided in Table S1. These checks document the removal of ambiguous URL identities while preserving legitimate class heterogeneity at the domain level. A key element of the inter-corpus protocol was domain isolation. Let and denote the sets of permissible source and target domains, respectively. Before forming the target roles, all domains that appeared in the entire permissible source universe were excluded from the target corpus; thus, condition (5) was satisfied:
Consequently, the pre-training of source components could not directly utilize the domain identity of any object subsequently included in target adaptation, selection, calibration, or final testing. Following this control and a subsequent temporal filtering step, the final target cohort contained 103,532 URLs. For the source data, the roles were assigned based on registered domains, using a 70/10/10/10% split for the fit, selection, calibration, and test sets. For the target corpus, a chronological split was applied based on ordered unique dates, rather than on the number of rows (6):
Following the initial temporal distribution, a “forward domain purging” process was performed: a domain already present in an earlier role could not reappear in a later one. Formally, for any roles Ra and Rb, where Ra precedes Rb (7):
This restriction reduced the risk that performance in the later period might be driven by the memorization of domains observed earlier. The final locked-test set consisted of the 46,942 most recent URLs and remained inaccessible until the models and calibration rules were fully finalized. The impact of forward domain purging on the target adaptation, selection, calibration, and test subsets is quantified in Table S2. In addition, Table S3 reports 37 identity-overlap checks, all of which yielded zero overlap across the corresponding source and target experimental roles. These results provide further evidence of the integrity of the domain-disjoint evaluation protocol.
The overall calibration set was further subdivided by domain groups into two independent parts: 25% of the domains were used exclusively for probability calibration, and 75% were used exclusively for determining operational thresholds. Therefore,
This precluded the reuse of the same domain observations for two distinct stages of tuning the output solutions. The composition of the independent probability- and threshold-calibration subsets is detailed in Table S4. Table S5 summarizes the sample-size support for the nominal 1% and 0.1% FPR operating levels, whereas Table S6 specifies the predefined data-access restrictions for each experimental role. These materials document the separation of training, model selection, calibration, and final evaluation, without implying that calibrated FPR constraints will necessarily remain satisfied under temporal distribution shift. Once the samples were fixed, each valid URL was associated with a single vector of independently computed features (9):
where ϕ(⋅)—a deterministic extractor was used to derive numerical features representing the host, registrable base, path, query, and overall structure of each URL. The feature space excluded row_id, source identifier, date, partition role, target label, raw domain identity, and any characteristics requiring the loading of HTML content. Consequently, an identical set of 55 features was applied to both the source and target datasets. The complete set of 55 URL-derived features and their variability characteristics within the target adaptation dataset are documented in Table S7. Although some features were constant or nearly constant, the predefined feature space was maintained to ensure a consistent input representation across all evaluated models. For target adaptation, three OOF (out-of-fold) folds were established, also grouped by domain. For each fold k, the following (10) was ensured:
All preprocessing statistics within the OOF (out-of-fold) procedures were recomputed exclusively on the training portion of the corresponding fold. This is particularly important for subsequent hard-negative analysis: no data point should derive a feature from a model or transformation that was trained using that same data point. Numerical preprocessing began with a non-linear compression of non-negative features. For the j-th feature of observation i, the following was calculated (11):
This transformation reduced the influence of highly asymmetric ranges while preserving the monotonic ordering of the values. The distributional characteristics of 12 representative URL features are summarized in Table S8. The pronounced right skewness and extreme values observed for several structural indicators provide descriptive support for the adopted numerical compression procedure. For each feature, the median ηj was estimated exclusively from the corresponding training subsample, after which missing values were replaced as follows (12):
This matrix was used directly for tree-based models (13):
For neural network models, the training mean μj and standard deviation σj were also estimated. Numerically unstable scales were handled according to a fixed rule (14):
The standardized value was determined by expression (15):
At the same time, a binary accessibility matrix (16) was formed:
If a feature was absent, the corresponding zij was set to zero following standardization; information regarding its absence was stored separately in mij. The resulting neural network representation took the form (17):
Thus, the trees received 55 log-compressed and median-imputed values, whereas the neural network models used 55 standardized values along with 55 availability indicators. The source and target transformations were learned separately, and the estimated medians, means, or scales were never shared between them.
During the feature analysis phase, we evaluated distributions, heavy tails, missing values, duplicate feature vectors, linear and rank-based associations, mutual information, correlation-based redundancy, PCA structure, and nonlinear, tree-based informativeness. These procedures were performed exclusively on the permitted development data and served a diagnostic purpose; no outcome-driven feature removal based on the final test set was conducted. All 55 pre-defined features were retained in the overall framework. Additional feature diagnostics are reported in Tables S9–S11. Table S9 examines repeated numerical representations and conflicting feature-vector labels, while Table S10 presents a multicriteria assessment of the informativeness of representative URL features. Table S11 documents fold-specific preprocessing across the three domain-grouped out-of-fold partitions, confirming consistent input dimensionality and finite transformed values.
The described pipeline resulted in the creation of fixed, training-ready arrays, immutable identifiers for rows, domains, and folds, as well as specific numerical transformation parameters for each permitted training partition. Features for the locked test set remained uncomputed until the architecture was frozen. Consequently, subsequent model comparisons were conducted on a unified, pre-defined experimental foundation, ensuring that differences between algorithms could not be attributed to variations in data cleaning, partitioning, or test-derived preprocessing schemes. Figure S2 provides a complementary visualization of the class-conditioned distributions for host_length, path_length, query_length, and host_entropy. The observed overlap between legitimate and phishing URLs, combined with the presence of asymmetric feature distributions, illustrates the limitations of simple univariate discrimination and justifies the evaluation of nonlinear predictive models.
2.2. Baseline Models and TARA Architecture
Following the establishment of a fixed feature space and leakage-safe experimental roles, the original baseline models were trained on the same target-adaptation population to provide a controlled comparison of learning algorithms. TARA additionally incorporated a source-pretrained representation. To explicitly assess cross-dataset adaptation, the experimental framework was extended with source-aware comparator models that utilize labeled source-domain information through direct transfer, pooled training, representation augmentation, or fine-tuning.
Logistic Regression. A linear model was used as an interpretable baseline. The input consisted of a previously defined neural network representation , comprising 55 standardized values and 55 availability indicators. The probability of the positive class was determined by the standard logistic transformation (18):
where σ(⋅)—sigmoid function. The parameters used were C = 1, the lbfgs solver, a maximum of 2500 iterations, and random_state = 42. This model establishes a necessary linear baseline and makes it possible to determine the performance gains provided by non-linear methods, given the same input information.
Extra Trees. The ensemble of extremely randomized trees used 300 trees, with min_samples_leaf = 2, max_features = 1.0, and a seed of 42. For ensemble trees, the final estimate can be expressed as the average of the predictions from the individual trees (19):
Unlike neural network models, tree-based methods received 55 log-compressed features with training-local median imputation, without standardization.
HistGradientBoosting. Histogram-based gradient boosting is included as a more compact, classical boosting baseline. The configuration used a maximum of 400 iterations, 31 leaf nodes, a learning rate of 0.06, and an L2 = 1 regularization parameter of 1, with no built-in early stopping. Its inclusion is important for isolating the contribution of the boosting paradigm itself from the specific implementations found in CatBoost, XGBoost, and LightGBM.
Modern Tree-Based Competitors. For boosting models, the overall additive score can be expressed as follows (20):
where —log-compressed and locally imputed representation of a URL, fm—another tree, η—learning rate.
CatBoost. A depth of 8, a maximum of 700 iterations, a learning rate of 0.04, an L2 regularization parameter of 8, the Logloss objective, and a validation patience of 50 were used. In the final ensemble, three independent models were trained using different seeds: 42, 43, and 44.
XGBoost. The configuration included up to 700 trees, max_depth = 6, a learning rate of 0.04, reg_lambda = 8, subsample = 0.9, colsample_bytree = 0.9, and the histogram tree method. Early stopping was applied with a patience of 50.
LightGBM. Up to 700 boosting iterations were used, with num_leaves = 31, a learning rate of 0.04, L2 = 8, a deterministic column-wise mode, and a patience of 50. All three boosting families were evaluated using the same set of adaptation/selection observations, which ensures that the comparison depends on the algorithm rather than on differences in the samples.
MLP. The neural baseline had a structure of 110→96→96→1, with SiLU activation and a dropout rate of 0.10 between the hidden layers. In terms of Ui, its score can be expressed compactly as Equation (21):
where ϕ = SiLU, with dropout during training. AdamW was used with a learning rate of 0.001, weight decay of 10−4, a batch size of 256, a maximum of 22 epochs, a patience of 7, and gradient clipping of 5.
Specialized partial-AUC-optimized baselines. To provide a direct comparison with methods specifically designed for low false-positive-rate detection, additional baseline models were implemented using a one-sided partial-AUC optimization objective [38,49]. The objective employs a pairwise logistic surrogate loss between phishing URLs and the highest-scoring legitimate URLs within each training batch, thereby emphasizing negative observations that are most likely to generate false-positive predictions. The upper FPR boundary β was set to 1% and 0.1%, and the batch size was fixed at 2048 observations. The partial-AUC objective was applied to two types of classifiers. First, the original MLP ensemble, pretrained using binary cross-entropy, was further optimized using the partial-AUC surrogate at β = 1% and β = 0.1%. A linear scoring model initialized with the coefficients of the original Logistic Regression classifier was similarly fine-tuned at β = 1%. These fine-tuning experiments employed AdamW with a learning rate of 10−4. Second, the same MLP architecture was trained from random initialization using only the partial-AUC surrogate at β = 1%, with a learning rate of 10−3 and random seeds 42–44. All experiments used a weight decay of 10−4, a maximum of 22 training epochs, gradient clipping at 5, and early stopping with a patience of 7 epochs on the chronological selection partition. Platt calibration and operational threshold selection were performed using the same independent calibration partitions as the original baseline models. The locked test set was excluded from all training, model selection, and calibration procedures.
Neyman-Pearson threshold-based comparison. In addition to direct partial-AUC optimization, a Neyman–Pearson threshold selection procedure was evaluated following the umbrella algorithm described in [37]. For a specified nominal FPR α and tolerance δ = 0.05, the decision threshold was determined from an order statistic of legitimate observations in the independent threshold-calibration partition. Two variants were considered: URL-level threshold selection using individual legitimate URL scores and domain-level threshold selection using the maximum legitimate URL score within each registered domain. The procedure was applied to five ranking systems: TARA, TailTree-only, CatBoost, MLP, and partial-AUC-optimized MLP. The resulting thresholds were evaluated on the unchanged locked test set. The theoretical Neyman–Pearson error-control guarantee requires exchangeability between calibration and future legitimate observations and may therefore fail under temporal distribution shifts.
Standalone FT-Transformer. This competitor received only 55 target-scaled values and 55 masks; the source representation was intentionally excluded. Each numerical feature was transformed into a 16-dimensional token, followed by the addition of a CLS token. The architecture employed four attention heads, one Transformer layer, a feed-forward width of 32, GELU activation, pre-LayerNorm, and a dropout rate of 0. Both the standalone fine-tuning (FT) and the MLP were trained using three seeds (42–44) following an identical neural training protocol. Early stopping was determined via chronological selection, based on the lexicographical ordering of the metrics (pAUC@1%, TPR@0.1%, ROC-AUC).
TARA is the sole model proposed, integrating three functionally distinct components: a frozen source residual encoder, a TailTree specialist ensemble, and a source-informed Context FT-Transformer ensemble. Their outputs are not simply averaged; instead, they undergo selection-fitted tail normalization before being combined, followed by the application of a deterministic conditional ranking guard. The TARA configuration was fixed prior to final testing: the three TailTree and three Context FT components utilized seeds 42, 43, and 44, while the guard was set with q = 0.995, τ = 1, and equal lower-region weights of 0.5/0.5.
Table 2 summarizes the configurations of the original baseline models and the proposed TARA framework. These configurations provide a reproducible foundation for the initial comparison of classical, tree-based, and neural learning approaches. The original baseline models use the fixed target-adaptation protocol, whereas TARA additionally incorporates a frozen source-pretrained representation. To directly evaluate the contribution of source-domain information and model capacity, the experimental analysis is extended with source-aware comparators and component variants. Their configurations are provided in Supplementary Table S21.
Table 2.
Configuration of trained models and their role in the experimental comparison.
From a methodological standpoint, two levels of computational budget control are particularly important. First, for boosting models, the number of iterations was capped at 700, with a consistent validation patience of 50 applied whenever early stopping was used. Second, MLP and FT-Transformer models employed identical optimizer settings, maximum epoch counts, and early-stopping criteria. For the modern model families, three different seeds were used to assess sensitivity to initialization and training stochasticity; these seeds were not treated as independent dataset replications. For classical baselines, a fixed seed of 42 was used.
All models were evaluated using a consistent framework for adaptation to target data, involving a chronological split and a fixed test set. For classical baseline models, pre-defined configurations were used, whereas for modern model families, the subset designated for the chronological split was employed for early stopping during training. In the TARA method, this same subset was also used to estimate parameters for the affine normalization of individual scores (the components of the final result). The fixed test set was entirely excluded from the processes of training, model selection, score normalization, and calibration.
To explicitly assess the contribution of source-domain information and model capacity, additional control models were evaluated (Table S21). Four source-aware comparators were introduced: (i) a frozen source-trained encoder applied directly to the target dataset without target-label adaptation; (ii) CatBoost trained on the pooled source-fit dataset (165,557 URLs) and target-adaptation dataset (29,016 URLs); (iii) CatBoost incorporating both the 55 URL-derived features and a 64-dimensional frozen source representation; and (iv) a source-pretrained neural network fully fine-tuned on the target-adaptation dataset.
To control for model capacity, an additional ensemble combining three CatBoost models and three standalone FT-Transformers through equal averaging of normalized predictions was evaluated. A character-level convolutional neural network (CharCNN) was also trained directly on raw URL strings to assess the limitations of the numerical feature representation. The CharCNN processed URLs of up to 256 characters using 16-dimensional embeddings, convolutional kernels of sizes 3, 5, and 7 with 32 filters each, global max pooling, and a two-layer classification head. Furthermore, six TARA variants were evaluated to isolate the influence of individual components: removal of the source representation token, replacement with a randomly initialized frozen encoder, use of a target-trained frozen encoder, fine-tuning of the source encoder, removal of out-of-fold hard-negative weights, and simultaneous removal of the source token and hard-negative weights. All additional models followed fixed hyperparameter configurations, used random seeds 42–44 where applicable, and employed early stopping exclusively on the selection partition. Score normalization was fitted using legitimate observations from the selection partition, Platt scaling was performed on the independent probability-calibration partition, and operational thresholds were determined on the threshold-calibration partition. These supplementary experiments were conducted after the initial locked-test evaluation without modifying the original TARA architecture or its calibration. Accordingly, they are interpreted as post-evaluation transfer and component analyses rather than independent prospective validation.
The standalone FT-Transformer and the Context FT component within TARA differ primarily in the use of the source representation token. The standalone FT-Transformer receives only the 55 target-derived values and 55 availability masks, whereas the Context FT additionally receives a 64-dimensional frozen source representation as a separate token. The contribution of this representation pathway and the specific effect of source pretraining are evaluated using variants without the source token, with a randomly initialized frozen encoder, with a target-trained frozen encoder, and with a fine-tuned source encoder. Since TARA combines three CatBoost specialists and three contextual FT-Transformer branches, an additional capacity-matched ensemble is included to control for the number of predictive components. Each component is assigned a distinct functional role, while its empirical contribution is assessed through controlled experiments rather than assumed from the architecture alone.
Figure 2 illustrates the internal architecture of TARA and the complete path of a single URL from prepared numerical representations to a ranking score, a calibrated probability, and a score-based decision. The schema fundamentally distinguishes between source-fitted and target-fitted transformations. This is necessary because the source representation must reflect only the information acquired during source pretraining, whereas the target branch adapts to a new labeled context. Consequently, a single URL can be transformed by two independent neural preprocessing functions: for the frozen source encoder, and for the Context FT. The tree branch utilizes a separate vector .
Figure 2.
TARA—the internal architecture of the proposed model.
Frozen source residual encoder. The source encoder is pre-trained exclusively on the source-fit set and monitored via the source-selection set; the source-calibration and source-test sets play no role in the stopping criterion. In the primary experimental run, 165,557 source-fit URLs from 138,395 domains were used, after which the encoder parameters were completely frozen. The initial gated projection for the input uS is defined as Equation (22):
Next, two residual blocks are applied. For block k, the update is given by (23):
The residual map has a structure of 64→128→64, and dropout with a probability of 0.10 is applied only during source pretraining. The resulting representation obtained after pretraining remains fixed throughout all target updates. In the specific implementation, the SourceEncoder contains 56,129 parameters. The training and selection trajectories of the source residual encoder are presented in Figure S3. The recorded loss and discrimination curves document the source-only pretraining procedure and the selection of the checkpoint that was retained before freezing the encoder parameters.
TailTree: specialized processing of challenging legitimate URLs. The Tree branch model was not designed as just another standard CatBoost instance, but rather as a specialist for which the weights of complex, legitimate observations were determined in a leakage-safe manner. Three domain-grouped out-of-fold (OOF) prediction sets were constructed for this purpose. For legitimate URLs, the 99th percentile of the OOF scores was calculated; 252 out of 25,169 legitimate observations that fell into the top 1% in terms of complexity were assigned a weight of 5, while the remainder were assigned a weight of 1. Crucially, each such weight was derived from the predictions of a model that had not been trained on the domain to which the given observation belonged. The three domain-grouped out-of-fold partitions used for hard-negative mining are detailed in Table S12. Each partition ensured zero domain overlap between the training (fitting) and held-out subsets, thereby facilitating the leakage-safe identification of challenging legitimate URLs for training the specialist model. A weighted objective can be written as (24):
Following OOF mining, three CatBoost specialist models were trained using random seeds 42–44, a depth of 8, 700 trees, a learning rate of 0.04, and an L2 regularization parameter of 8. Their raw margins were averaged as follows (25):
Source-informed Context FT-Transformer. The neural branch receives target values/masks along with a frozen source representation. For each of the 55 features, a 16-dimensional token is constructed (26):
The source vector is linearly projected into 16 dimensions and added as a separate token. Together with a learnable CLS token, the sequence comprises 57 tokens. Subsequently, a single pre-LN Transformer layer is applied, featuring four attention heads, a feed-forward width of 32, a GELU activation function, and zero dropout. A scalar logit is derived from the CLS representation. Three independently initialized model instances yield an averaged neural score (27):
During target training, 3% random masking-corruption of features was applied; clean chronological selection was used for early stopping. This enhancement in stability pertains solely to the training procedure and should not be interpreted as a guarantee of adversarial robustness. The training dynamics of the three Context FT-Transformer members are shown in Figure S4. Differences in the chronological selection trajectories resulted in distinct retained epochs for the three random seeds, documenting the member-specific early-stopping procedure.
Normalization of branch scores. Since rT and rN have different original scales, directly averaging the raw scores would be methodologically incorrect. The predefined component configurations were additionally examined on the chronological development selection set. Their comparative ranking performance, including the unrestricted constant-fusion control, is reported in Table S13; these results were not used for post hoc modification of the architecture based on the locked test set. For each branch k ∈ {T, N}, the following were evaluated on the legitimate observations selection set (28):
after which (29):
This transformation places both branches on a common tail-oriented scale without using the final-test distribution. The selection-fitted normalization parameters for the TailTree and Context FT branches are provided in Table S14. Their different center and scale values reflect the heterogeneous distributions of the component scores and define the common scale used by the subsequent tail-aware ranking mechanism.
Tail-aware conditional ranking. A key aspect of TARA is not standard averaging, but rather the conditional preservation of specialist ordering. For the lower region, the following is calculated (30):
and the final ranking score is determined as (31):
For h ≥ 1, the ordering is strictly preserved; that is, the neural branch cannot alter the relative order of objects within the protected region. For h < 1, both branches contribute equally, yet the transformation guarantees s(x) < 1; consequently, an observation from the lower region cannot cross into the protected band. Furthermore, the lower mapping is strictly monotonic with respect to v, which ensures that the ordering of the combined scores within this region is maintained. These properties were explicitly verified via assertions prior to the model freeze.
An important consequence of the proposed ranking guard is that TARA cannot improve upon the TailTree specialist within the protected high-score region, because the specialist ordering is preserved by construction. Therefore, identical performance at extremely low FPR values represents an intended architectural property rather than evidence of an incremental detection improvement. The potential contribution of the contextual neural branch lies outside this protected region, where it can refine the ranking of target observations. To distinguish ranking preservation from actual predictive improvement, we additionally evaluate TARA against a standalone TailTree-only detector across a wider range of false-positive budgets, including FPR limits of 0.1%, 0.5%, 1%, 2%, and 5%.
The hyperparameters of the proposed ranking mechanism were fixed before the current evaluation run, based on earlier exploratory experiments involving the same corpora. These included the 99th percentile of out-of-fold legitimate scores for hard-negative selection, a hard-negative weight of 5, normalization quantiles of 0.95 and 0.995, a guard threshold of τ = 1, and an equal lower-region fusion weight of 0.5. Their sensitivity was subsequently examined on the target-calibration population (21,730 URLs), which was not used for model fitting, early stopping, or score normalization. The results (Tables S23 and S24; Figures S6 and S7) indicate that pAUC@1% varies by less than 0.001 around the selected guard and fusion settings, while TPR@0.1% remains unchanged within the corresponding protected region. Hard-negative weighting also improves the observed low-FPR metrics relative to uniform weighting across the evaluated configurations. However, because the parameter choices originated from earlier experiments involving the same datasets, the sensitivity analysis is descriptive and does not constitute independent evidence of optimal hyperparameter selection.
Calibrated output and actionable solutions. The TARA ranking score was not equated to a probability. A Platt transform with a positive slope was applied as a separate probability-calibration step (32):
The constraint a > 0 is necessary to preserve the ranking order after probability calibration. A working solution for a given nominal FPR α ∈ {0.01, 0.001} was developed separately (33):
Moreover, θα was estimated using only independent threshold-calibration domains. Thus, probability calibration and threshold calibration do not utilize the same sets of domains. The scientific and engineering novelty of TARA lies precisely in this organization of components: leakage-safe hard-benign specialization isolates the operationally difficult legitimate tail; a frozen source encoder transmits a previously learned representation without overwriting it; FT enables target-specific neural refinement; and a tail guard constrains the scope within which a neural branch can alter the ordering of specialists. Neither CatBoost, residual encoders, Transformers, nor Platt calibration are claimed as novel algorithms in their own right. The proposed mechanism consists of their evidence-bounded conditional integration for supervised cross-dataset adaptation, incorporating a protected rare-FPR ranking scheme. This positioning aligns with the model’s actual implementation and does not imply universal superiority over all other classifiers, nor does it guarantee the preservation of a specific FPR under arbitrary subsequent distribution shifts. Implementation-level consistency was verified through source-preservation and checkpoint-reloading checks, as summarized in Table S15. The reported zero-score differences confirm that the frozen source path remains unaltered and that the saved TailTree and Context FT components yield reproducible predictions at the stated numerical precision.
Statistical inference was based on 2000 paired bootstrap replicates of the locked test set, with registered domains used as the resampling units. In each replicate, 33,428 test domains were sampled with replacement, and all URLs belonging to a selected domain received the same multiplicity across models. Model differences were calculated using the same domain weights, with unadjusted 95% confidence intervals obtained from the 2.5th and 97.5th bootstrap percentiles and two-sided p-values calculated from centered bootstrap differences. Holm correction was applied to the predefined primary family of 32 comparisons involving ROC-AUC, pAUC@1%, TPR@0.1%, and Brier score across eight baseline models. Although pAUC@0.1% was an important descriptive endpoint, it was treated as secondary because its empirical estimate depends on at most seven false positives among 7551 legitimate URLs and substantially overlaps in information with TPR@0.1%. Accordingly, its eight pairwise comparisons were evaluated as a separate secondary family using Holm correction. Statistical significance was established only when the adjusted p-value was below 0.05 and the unadjusted confidence interval excluded zero in the corresponding direction. These intervals characterize uncertainty conditional on the fitted models and do not account for retraining variability. Temporal threshold recalibration was evaluated using a simulated weekly deployment protocol on the locked test sets of both configurations. Three strategies were compared: the original fixed threshold, cumulative recalibration using verified legitimate URLs from preceding weeks, and rolling-window recalibration based on the 14 most recent collection dates. Thresholds were updated using only previously observed legitimate URLs, without accessing current-week observations or phishing labels. The evaluation considered nominal FPR targets of 0.1% and 1% and compared aggregate FPR, weekly FPR, and TPR. When insufficient calibration domains were available for the domain-level Neyman–Pearson order-statistic rule, an empirical quantile was used without claiming a formal FPR guarantee.
To quantify the incremental contribution of the hybrid architecture, TARA was compared with a standalone TailTree-only detector comprising three hard-negative-weighted CatBoost specialists. The standalone detector used the average specialist score for ranking, independently fitted Platt calibration, and independently determined operating thresholds using the same calibration partitions as TARA. Since the tail-aware ranking guard preserves TailTree ordering within the protected high-score region, identical performance at extremely low FPR values is expected by construction. Therefore, the comparison was extended to ROC-AUC, average precision, standardized partial AUC at FPR limits of 0.1%, 0.5%, 1%, 2%, and 5%, TPR at FPR limits of 0.1%, 0.2%, 0.5%, 1%, 2%, and 5%, Brier score, LogLoss, and fixed-threshold performance. Statistical differences were estimated using 2000 paired bootstrap replicates with registered domains as resampling units and Holm correction across 19 performance measures. The evaluation included the original locked test set, an additional source–target configuration, and an expanded independent legitimate-URL population.
Domain-Level Temporal Distribution Analysis. To investigate the concentration of false-positive predictions following the 39-day collection gap, an additional post hoc analysis was conducted on legitimate URLs from the locked test set. The December collection batch was compared with the three preceding test weeks in terms of registered-domain concentration, URLs per domain, overlap with the earlier PhreshPhish training collection, and URL-derived feature distributions. Distributional differences were quantified using a classifier two-sample test [50]. A CatBoost classifier with a depth of 6 and 300 iterations was trained to distinguish the two legitimate-URL populations using the same 55 URL-derived features. Five-fold cross-validation grouped by registered domains was employed, and out-of-fold ROC-AUC was used to quantify distributional separability. A reference comparison between adjacent collection weeks without a prolonged gap was also performed. This analysis was conducted retrospectively for diagnostic purposes and did not affect TARA training, calibration, or model selection.
To further assess the contribution of source-domain pretraining, additional experiments were conducted by varying the frozen encoder while keeping the remaining TARA components unchanged. Three randomly initialized frozen encoders (seeds 42, 43, and 44) were compared with the original PhiUSIIL-pretrained encoder and an alternative encoder pretrained on an earlier PhreshPhish population. The alternative encoder followed the same architecture and training procedure (AdamW optimizer, learning rate of 10−3, weight decay of 10−4, batch size of 1024, maximum of 24 epochs, and early-stopping patience of seven epochs) and was subsequently frozen before target adaptation.
To investigate the influence of target-label availability, contextual branches were trained using 10%, 25%, and 100% of the target-adaptation domains. Four representation configurations were considered: no representation token, a randomly initialized frozen encoder, the PhiUSIIL-pretrained encoder, and the PhreshPhish-pretrained encoder. Each contextual branch was trained using three random seeds (42–44). The quality of the frozen representations was also assessed using logistic-regression linear probes (C = 1) trained on 1%, 5%, 25%, and 100% of the adaptation domains. All configurations were evaluated on the original locked test set. Statistical differences were estimated using 2000 paired domain-level bootstrap replicates, with Holm correction applied separately to the full-model and contextual-branch comparison families.
3. Results
3.1. Comparative Performance on the Locked Test Set
To evaluate the effectiveness of the proposed TARA model, a comparative test was conducted across nine families of machine learning and deep learning algorithms using a single, independent locked test set. This dataset comprised 46,942 URLs originating from 33,428 registered domains, consisting of 39,391 phishing URLs and 7551 legitimate URLs. The evaluation was performed only after the model architectures, preprocessing parameters, calibration procedures, and operational thresholds had been finalized with no subsequent adjustments made based on the test data. The comparison focused on global classification metrics and detection performance within the low-FP regime, which allowed for an assessment of how the models differ under conditions of temporal data distribution shift.
Presented below are only the comparative results between different models. Metrics such as Development-OOF and chronological-selection from earlier stages are omitted here, as they were used for diagnostic purposes and to guide the training process; final comparative conclusions must instead be based on a fixed, held-out test population. Similarly, this subsection excludes ablation experiments, feature-availability stress tests, analyses of individual TARA components, and source-holdout evaluations. The comparison is structured around various quality dimensions: global discrimination, performance in the low-FPR regime, the statistical significance of observed differences, probabilistic calibration, behavior at pre-fixed operating thresholds, and computational efficiency. This approach is essential because a higher ROC-AUC value does not necessarily imply superior performance at an FPR of ≤0.1%, nor does high ranking quality guarantee minimal calibration error or the maintenance of a target operating FPR following a temporal shift. Consequently, each set of results is interpreted strictly in the context of the specific model property it characterizes.
Table 3 presents the primary comparison of the nine originally specified models on the locked test set. Within this predefined comparison group, TARA achieved the highest observed values for five of the six reported criteria. Thus, the advantage of the point estimate is evident not only across the full ROC curve but also within the range of low false-positive rates a region of particular importance for this study. However, the results are not superior across every single criterion: for TPR at FPR ≤ 1%, the highest value was recorded by the MLP (0.743698), followed by the FT-Transformer (0.741819) and TARA (0.736006).
Table 3.
Comparison of models based on global and low-FPR metrics on a locked test set.
The nature of the results also highlights a distinction between global metrics and those focused on the tail (low-FPR region). While the FT-Transformer and MLP achieve an ROC-AUC comparable to that of TARA, their true positive rate (TPR) at an FPR of ≤0.1% is noticeably lower. Conversely, XGBoost despite having a lower overall ROC-AUC exhibits a relatively high TPR at an FPR of 0.1% (0.435607). This confirms that the overall ROC-AUC cannot serve as the sole criterion for a cybersecurity setting that requires a low FPR. Furthermore, the average precision (AP) must be interpreted with caution, given the high proportion of phishing cases in this locked test set; its value should not be directly extrapolated to an operational environment with a different prevalence.
Figure 3 illustrates the comparative performance of the five most significant models within an FPR range of 0% to 1%. Unlike a full ROC curve, this visualization zooms in on the specific region most critical to this research. The curves exhibit a distinct step-like pattern an expected outcome given the limited number of legitimate test observations where a single false positive significantly alters the empirical FPR, particularly near the 0.1% threshold.
Figure 3.
Frozen low-FPR comparison.
In the narrowest initial region, TARA demonstrates a higher detection rate than MLP and FT-Transformer. The neural network-based competitors start with a relatively low TPR and then show a sharp increase in their detection rate at an FPR of approximately 0.2–0.3%, whereas TARA, CatBoost, and XGBoost exhibit a smoother progression in this early stage. This is visually consistent with the results in Table 3, where TARA achieves the highest TPR@0.1% and pAUC@1%.
As we move further toward an FPR of approximately 1%, this advantage diminishes: the MLP and FT-Transformer models approach TARA and, in certain segments, even outperform it consistent with their higher TPR@1% values. Consequently, the figure does not show a single model consistently outperforming the others across the entire range. The key takeaway is that the shapes of the ROC curves differ within the low-FPR interval; the relative ranking of the models depends significantly on the allowable false-alarm budget. This is precisely why pAUC and TPR values at various FPR thresholds were used in combination, rather than relying on a single, aggregate ROC-AUC metric.
To extend the comparison beyond conventional classifiers, additional experiments were performed using models specifically optimized for low-FPR detection. These included MLP classifiers fine-tuned with a partial-AUC surrogate loss at FPR limits of 1% and 0.1%, a linear partial-AUC-optimized classifier, and an MLP trained from scratch using the partial-AUC objective. The specialized models were evaluated using the same locked test population and leakage-safe experimental protocol as the original baselines.
3.2. Statistical Significance of Model Comparisons
Table 4 presents paired statistical comparisons between TARA and eight baseline models across three low-FPR metrics. Differences were computed on the same locked test observations, with uncertainty estimated using 2000 paired bootstrap replicates at the registered-domain level. The pAUC@1% and TPR@0.1% comparisons belong to the predefined primary family of 32 tests, whereas pAUC@0.1% is evaluated as an additional secondary family of eight comparisons with a separate Holm correction. This distinction preserves the original inferential framework while providing explicit uncertainty estimates for the most restrictive partial-AUC metric.
Table 4.
Pairwise low-FPR differences for TARA relative to the models being compared.
Among the 16 primary low-FPR comparisons, three advantages of TARA remained statistically significant after Holm correction: pAUC@1% relative to Logistic Regression (Δ = +0.0862, 95% CI [0.0535, 0.1372]) and XGBoost (Δ = +0.0149, [0.0069, 0.0236]), and TPR@0.1% relative to Logistic Regression (Δ = +0.3692, [0.2019, 0.4361]). The remaining 13 primary low-FPR comparisons were inconclusive. In the secondary pAUC@0.1% family, TARA demonstrated one statistically confirmed advantage, relative to Logistic Regression (Δ = +0.1541, 95% CI [0.1156, 0.2008], Holm-adjusted p = 0.0040). Although the confidence intervals for Extra Trees, LightGBM, MLP, and FT-Transformer were positive, these differences did not remain significant after multiplicity correction. Because pAUC@0.1% and TPR@0.1% are determined by at most seven false positives among 7551 legitimate test URLs, the corresponding estimates are sensitive to individual domains. Therefore, numerical improvements should not be interpreted as established superiority when the corrected statistical comparisons remain inconclusive.
Table 5 compares probabilistic quality following independent probability calibration. In this context, the interpretation is the inverse of that for ranking metrics: lower values for Brier Score, LogLoss, ECE, and MCE indicate smaller errors. The results show that no single model performs best across all probabilistic calibration metrics. FT-Transformer achieved the lowest Brier Score and LogLoss, at 0.106814 and 0.321034, respectively. TARA performs very similarly, with a Brier Score of 0.107352 and a LogLoss of 0.323154. MLP also demonstrates comparable probabilistic quality, with a Brier Score of 0.108412.
Table 5.
Comparison of probabilistic model calibration on a locked test set.
In terms of Expected Calibration Error (ECE) across ten fixed bins, the MLP achieved the lowest value at 0.122890, followed by the FT-Transformer at 0.125133 and TARA at 0.130310. The lowest Maximum Calibration Error (MCE) was observed for Logistic Regression (0.375432), despite its significantly weaker performance on low-FPR ranking metrics. This discrepancy demonstrates that discrimination and calibration measure distinct properties of a predictive system. Consequently, the results in the table do not support the claim that TARA is the best model in terms of probabilistic calibration. Its advantage in the primary comparative experiment stems from its performance on ranking endpoints specifically in the low-FPR region whereas certain neural and linear competitors perform better according to specific calibration criteria. Furthermore, since ECE and MCE depend on the chosen binning strategy and the prevalence within the test population, they should be interpreted as descriptive metrics specific to this particular frozen evaluation.
Table 6 presents the results obtained using pre-fixed operating thresholds, calculated based on a nominal FPR of 1%. These metrics should not be equated with the ROC-swept TPR values shown in Table 3; in this case, each model employs a specific threshold determined solely on threshold-calibration domains, prior to the test phase. Thus, the table reflects both the quality of the model and the portability of its calibrated operating rule to a subsequent time period.
Table 6.
Cross-model comparison with a fixed nominal FPR of 1%.
Under this configuration, the MLP model achieved the highest TPR (0.744586), followed by FT-Transformer (0.742327) and TARA (0.733492). The MLP also yielded the best F2 and MCC scores 0.784350 and 0.557856, respectively while recording the lowest number of missed phishing URLs (10,061). TARA produced 10,498 false negatives (FN) alongside 74 false positives. The lowest observed FPR was achieved by HistGradientBoosting (0.009138), which also resulted in the fewest false positives (69) and the highest precision (0.997455). These results are significant for the proper interpretation of the proposed model: while TARA leads in key ROC-derived, low-FPR ranking metrics, the MLP demonstrates a higher detection rate when applying a frozen 1% operating threshold. ROC-derived metrics characterize ranking performance within specified FPR constraints, whereas fixed-threshold metrics evaluate detection performance at a single operating point calibrated before testing. For TARA, the achieved FPR is 0.009800 close to the nominal 1%, yet it does not demonstrate operational superiority across all decision metrics.
Table 7 examines a more stringent operating regime with a nominal FPR of 0.1%. It is here that the discrepancy between the ROC sweep result and the behavior of a threshold applied to a subsequent temporal distribution becomes particularly evident. All models exceeded the nominal level of 0.001; the lowest attained FPR was 0.002516 (observed for both Logistic Regression and ExtraTrees), which corresponds to approximately 0.252%. Consequently, none of the models in this table can be described as effectively maintaining a 0.1% FPR on the locked test set.
Table 7.
Cross-model comparison at a fixed nominal FPR of 0.1%.
In terms of detection-oriented metrics, TARA achieved the best results. Its TPR is 0.638369, corresponding to 25,146 true positives and 14,245 false negatives; the F2 score reaches 0.688049, and the MCC is 0.467966. In terms of TPR, the next closest models are HistGradientBoosting (0.631794), followed by LightGBM (0.620370) and ExtraTrees (0.619177). ExtraTrees exhibits the highest precision 0.999222 through its TPR is lower than that of TARA. It is particularly important not to conflate the TPR of 0.638369 from this table with the ROC-derived TPR@FPR ≤ 0.1% of 0.458226 found in Table 3. The former value was obtained using a frozen threshold, which resulted in an empirical FPR of 0.003178 on the test set, whereas the latter constrains the ROC operating region to an empirical FPR≤0.001. Consequently, a high TPR at a fixed threshold does not guarantee that the nominal constraint is maintained. This outcome highlights the phenomenon of temporal calibration drift and underscores the need for ongoing monitoring of operating thresholds following deployment.
Table 8 presents an additional cross-model characteristic: computational cost. This is essential for interpreting predictive improvements while accounting for differences in model capacity. Logistic Regression is the least computationally expensive system, with a training (fit) time of approximately 0.586 s and an inference time of 0.694 ms per 1000 pre-extracted URLs. CatBoost and MLP also demonstrate low inference latency approximately 1.48 ms and 1.76 ms per 1000 samples, respectively, though the MLP requires significantly more training time.
Table 8.
Comparison of the computational cost of trained models.
The FT-Transformer is notably more expensive: training an ensemble of three members took approximately 214.55 s, while inference required 202.74 ms per 1000 URLs. TARA is the most resource-intensive system among those examined. Accounting for target fitting, source pretraining, and hard-negative OOF (out-of-fold) mining, the total training time reached approximately 359.05 s; inference involving six target members and one frozen source encoder takes about 213.98 ms per 1000 pre-extracted URLs. The checkpoint state size is approximately 2.41 MB. TARA therefore incurred a higher computational cost than the individual boosting baselines. The reported inference times are hardware-specific and exclude feature extraction, which required approximately 73.47 ms per 1000 URLs. To assess the incremental computational cost of the proposed hybrid architecture, an additional matched inference benchmark was conducted for CatBoost, TailTree-only, and TARA. All models were evaluated in the same CPU environment using 10,000 URLs from the locked test set with pre-extracted features. The median inference times were 1.21 ms, 1.27 ms, and 206.2 ms per 1000 URLs for CatBoost, TailTree-only, and TARA, respectively. Thus, TARA required approximately 162 times more inference time than TailTree-only. The additional measurements were obtained in a separate standardized benchmarking session and therefore complement, rather than replace, the original computational results reported in Table 8.
Figure 4 compares the reliability of four models by displaying the mean predicted phishing probabilities alongside the actual observed proportion of the positive class across ten fixed probability bins. The diagonal line represents perfect calibration, where the predicted probability aligns with the observed frequency of phishing. Unlike ROC analysis, this plot characterizes the numerical interpretation of the predicted probabilities rather than the relative ranking of instances.
Figure 4.
Frozen reliability.
For all models, the most noticeable deviations from the ideal line occur in the low-to-medium probability range. A significant number of points lie above the diagonal, meaning the actual proportion of phishing cases is higher than the average predicted probability for the corresponding bin. This indicates a local underestimation of risk within certain ranges. As the predicted probability approaches one, the curves for all four models converge toward the diagonal. While TARA shows moderate deviations visually, the plot does not support the claim that it offers definitively superior calibration. The numerical results in Table 5 confirm this: the FT-Transformer achieves lower Brier Score and LogLoss values, while the MLP yields a lower ECE. CatBoost exhibits more pronounced deviations across several mid-range probability bins. It is important to note that the test set has a phishing prevalence of approximately 83.9%; therefore, the shape of the reliability curve is specific to this particular frozen population. Furthermore, both the ECE and the visual reliability plot depend on the chosen binning strategy. Consequently, this figure should be viewed as a descriptive supplement to the numerical calibration metrics, rather than as evidence that these probabilities would remain valid under a different operational prevalence.
Table 9 presents the primary ablation experiment conducted on the final, locked test set. Unlike the ablation studies performed during development, the results shown here were not used to modify the model; they therefore reflect the contribution of individual components after the architecture had been fully finalized. The complete TARA framework is compared against unrestricted constant fusion, an isolated protected-tree branch, and the neural body. The most significant differences emerge in the highly constrained low-FPR (false positive rate) regime. TARA achieves a pAUC@0.1% of 0.695943 and a TPR@0.1% of 0.458226, whereas constant fusion (without a guard mechanism) yields 0.579910 and 0.227793, respectively. Consequently, while simple averaging of the components maintains a high global ROC-AUC of 0.943733, it leads to a noticeable degradation in the ordering of the rare tail.
Table 9.
Ablation analysis of TARA components on a frozen, locked test set.
Table 9 presents an analysis of the impact of individual TARA components on a fixed test dataset. The full-featured model demonstrated the best performance: ROC-AUC (0.944295), AP (0.989070), and pAUC@1% (0.810872). At a false positive rate (FPR) of ≤0.1%, the performance of TARA and that of the isolated protected tree head were identical, with a pAUC of 0.695943 and a TPR of 0.458226. This confirms that the tail-aware mechanism preserves the ranking quality provided by the specialized component, even under the most stringent operating conditions. Disabling the tail guard module resulted in a decrease in pAUC@0.1% to 0.579910 and TPR@0.1% to 0.227793, while the global ROC-AUC remained at a comparable level (0.943733). A model variant utilizing only the neural network achieved the highest result for the TPR@1% metric (0.760631) but showed a significantly lower TPR@0.1% (0.039781). These results indicate that the tail-aware mechanism maintains high effectiveness within the range of extremely low FPR values, while the neural component provides further refinement, enhancing the model’s overall discriminative power.
When features are lost randomly, performance degrades gradually: the pAUC@1% drops from 0.8241 (with no distortions) to 0.8040, 0.7797, and 0.7520 as 10%, 20%, and 30% of features become unavailable, with the confidence intervals for adjacent levels overlapping. Structured feature loss has a different impact. The unavailability of host features has almost no effect on the pAUC@1% (0.8323), whereas the loss of “path” features reduces it to 0.5935 [0.5600; 0.6231] and the ROC-AUC to 0.7639; these declines are significantly larger than the estimation uncertainty. Removing the five most important expert-selected features maintains a high ROC-AUC (0.9408), but the TPR@0.1% falls to 0.0315, with an interval of [0.0210; 0.6417]. Since the subsample contains 1609 legitimate URLs, the TPR@0.1% metric allows for at most one false positive, resulting in wide confidence intervals; therefore, conclusions regarding robustness are based on the ROC-AUC and pAUC@1%, while the TPR@0.1% values are provided for descriptive purposes. These results characterize robustness under controlled, synthetic conditions and cannot be generalized to adversarial attacks or operational failures without further validation (Table 10).
Table 10.
TARA’s resilience against the unavailability and distortion of URL features.
To examine temporal variations in TARA’s detection performance, locked-test observations were grouped by calendar week and evaluated using the two previously calibrated operating thresholds (1% and 0.1% nominal FPR). Table 11 reports the numbers of phishing and legitimate URLs, false negatives (FN), false positives (FP), true-positive rates (TPR), false-positive rates (FPR), and overall error rates for each observed week. Reporting class-specific counts and error rates allows temporal changes in detection performance to be distinguished from variations in class composition. Weeks without observations are excluded from the table, and the gap between early November and mid-December is considered when interpreting the temporal results.
Table 11.
Temporal dynamics of TARA errors on the locked test.
Table 11 shows that the weekly variations in the overall error rate are driven primarily by the proportion of phishing cases and the true positive rate (TPR), rather than the false positive rate (FPR). At a 1% threshold, the TPR for weeks containing phishing instances is 0.7777, 0.7209, and 0.7347, while the FPR is 0.0094, 0.0068, and 0.0055. The final week (15–21 December) contains only 483 legitimate URLs from 59 domains; for this period, the FPR is 0.0414 at a 1% threshold and 0.0373 at a 0.1% threshold accounting for 18 of the 24 false positives observed at the latter threshold. During the first three weeks, the actual FPR at the 0.1% threshold was 0.0004, 0.0008, and 0.0027. Consequently, the deviation from the nominal operating FPR is primarily associated with the December batch of legitimate URLs collected after the 39-day gap. To distinguish changes in URL feature distributions from dataset collection effects, an additional domain-level comparison was conducted between this batch and the preceding test weeks. The analysis examined domain concentration, collection composition, repeated domains in earlier PhreshPhish records, and feature-distribution differences using classifier two-sample tests. Because the December batch is relatively small and concentrated within a limited number of domains, its interpretation is restricted to the observed collection population. To assess whether temporal recalibration could mitigate the observed FPR instability, the fixed-threshold strategy was compared with cumulative and rolling-window recalibration. At the nominal FPR of 0.1%, all three strategies produced the same aggregate FPR of 0.318% on the original locked test. The corresponding TPR values were 0.6384, 0.6405, and 0.6432, respectively. The failure was concentrated in the December batch following the 39-day collection gap, where all three strategies produced a weekly FPR of 3.73%. In Configuration A, the fixed threshold achieved an observed FPR of 0.089%, while cumulative and rolling-window recalibration yielded 0.075% and 0.089%, respectively. However, recalibration reduced TPR from 0.4355 to 0.4153 and 0.3977. Thus, periodic threshold recalibration did not consistently improve operational reliability. The results indicate that abrupt changes in the composition of legitimate URLs cannot necessarily be corrected through threshold updates based exclusively on previous observations. A detailed comparison is provided in Supplementary Table S35.
Figure 5 illustrates an ablation study conducted during the development phase, focusing on the low-FPR range (0% to 1%). Unlike the primary cross-model ROC visualization, this plot compares internal configurations of the proposed architecture rather than independent classifiers: the full TARA model, a TailTree-only variant, a version using only the FT context branch, and a standard constant fusion approach. This format makes it possible to directly observe which portion of the curve is determined by the specialist branch and where the neural refinement component begins to alter the ranking order. In the leftmost region, the TailTree and TARA curves are nearly identical, which aligns with the intended purpose of the protected region. The neural-only branch exhibited a lower detection rate at the smallest FPR values, while unrestricted constant fusion approached the specialist curve and slightly exceeded TARA in some development segments. The tail-guard parameters remained fixed and were not adjusted after inspection of these development results. As the FPR increases, the differences between the variants diminish. This indicates that the primary functional specialization of the components is concentrated at the beginning of the ROC curve, rather than across the entire range of thresholds.
Figure 5.
Development component comparison.
Figure 6 shows the dynamics of the standardized pAUC@1% as the proportion of artificially unavailable numerical features is increased sequentially from 0% to 30%. All curves are calculated using the same 10,000-URL stress subset; for the random missingness scenario, consistent corruption conditions were applied. For TARA, the pAUC@1% value decreases progressively from approximately 0.824 on clean data to 0.804, 0.780, and 0.752 as the proportion of unavailable features reaches 10%, 20%, and 30%, respectively.
Figure 6.
Common-cohort availability stress.
The shape of the TARA curve is nearly monotonic and does not exhibit a sharp drop-off at initial levels of random missingness. This contrasts with the structural outage path family not explicitly plotted on this axis which leads to significantly more severe degradation. Consequently, the figure should be interpreted specifically as a measure of sensitivity to the random, independent unavailability of individual numerical inputs, rather than as a generalized robustness guarantee. Figure 6 also presents the performance trajectories of CatBoost, LightGBM, and MLP under the same feature-missingness protocol, providing descriptive context for the robustness analysis of TARA. Across the entire displayed range, the decline in performance is gradual, though it becomes substantial by the time 30% of the data is missing. This underscores the value of using availability masks and training-time corruption, while simultaneously demonstrating that these techniques do not render a model immune to large-scale information loss.
3.3. Reliability of Low-FPR Performance and Cross-Dataset Transfer Analysis
The reliability of phishing detection at extremely low false-positive rates (FPR) depends on the number and distribution of legitimate entities within the evaluation dataset. The fixed test set contains 7551 legitimate URLs; this means that for an empirical FPR not exceeding 0.1%, no more than seven false-positive instances are permissible. Consequently, performance estimates at this operating point are highly sensitive to the specific set of legitimate URLs and registered domains present. To quantify this uncertainty, Table 12 provides data on the number of false-positive instances and the domains they affect at the ROC curve operating point corresponding to a given true-positive rate (TPR) at an FPR of 0.1%, along with the associated 95% confidence intervals. The table also presents the number of false-positive instances and the observed FPR values for thresholds calibrated to nominal FPR levels of 1% and 0.1%. TPR estimates for these fixed thresholds are provided in Table 7, while confidence intervals for the pairwise differences in partial area under the ROC curve (pAUC) values at an FPR of 0.1% are shown in Table 4. Thresholds were determined using an independent calibration sample consisting of 16,221 URLs, including 9087 legitimate URLs associated with 8572 legitimate registered domains. Threshold selection was performed at the domain level: for each domain, the maximum score assigned to any of its constituent legitimate URLs was considered, in accordance with Equation (33). The corresponding order statistics (positions in the ordered sequence) were 8502 for a nominal FPR level of 1% and 8569 for a nominal FPR level of 0.1%.
Table 12.
False-positive counts and confidence intervals in the low-FPR region on the locked test set (7551 legitimate URLs).
As shown in Table 12, the confidence intervals for TPR@0.1% overlap across all evaluated models, with observed interval bounds ranging from 0.0000 to 0.6486. The eight highest-scoring legitimate URLs of each model originate from only two to five domains. Therefore, the inclusion or exclusion of an influential domain during bootstrap resampling can substantially affect the estimated operating point. The distributions of the bootstrap estimates are presented in Figure S8. Standardized pAUC@1% provides a more stable summary of performance because it integrates detection behavior over a wider range of false-positive budgets. At the fixed nominal 0.1% threshold, all models exceeded the intended FPR level on the locked test set. For TARA, 24 false positives corresponded to an observed FPR of approximately 0.0032, with a 95% confidence interval of [0.0009, 0.0061]. These findings indicate that point estimates at FPR ≤ 0.1% should be interpreted cautiously and that claims of superiority should be restricted to statistically supported comparisons. Beyond the reliability of low-FPR estimates, an important question is whether the observed performance of TARA is attributable to cross-dataset transfer, the additional representation pathway, or the proposed ranking mechanism. The original baseline comparison primarily involved models trained on the target-adaptation dataset. To explicitly investigate the contribution of source-domain information, additional source-aware comparators and TARA component variants were evaluated using the same locked test set. The additional comparators include a source-only encoder, CatBoost trained on pooled source and target data, CatBoost augmented with frozen source representations, and a source-pretrained network fine-tuned on the target-adaptation dataset. A capacity-matched CatBoost and FT-Transformer ensemble and a character-level convolutional neural network were also evaluated. Detailed configurations are provided in Section 2.2 and Supplementary Table S21. Table 13 summarizes the results of the locked TARA model, six component variants, and six additional comparators. Paired differences relative to TARA were estimated using 2000 domain-level bootstrap replicates. Holm correction was applied separately to the family of TARA variants and the additional comparator family, with 24 comparisons in each family.
Table 13.
Performance of TARA component variants and additional comparator models on the locked target-test set.
Removing the source representation token reduced ROC-AUC by 0.0072 (95% CI: 0.0064–0.0081) and decreased TPR@1% from 0.7360 to 0.7056. However, the corresponding pAUC@1% difference was approximately 0.0015 and was not statistically confirmed (Figure 7a,b). The randomly initialized frozen encoder achieved nearly the same performance as the source-pretrained configuration, with a ROC-AUC difference of only 0.0019 (95% CI: 0.0012–0.0025). Its pAUC@1% was slightly higher than that of TARA (0.8110 versus 0.8109). The target-trained and fine-tuned source encoder variants also exhibited lower global ROC-AUC values than TARA. These observations indicate that much of the improvement in global discrimination is associated with the additional representation pathway, whereas the specific contribution of PhiUSIIL pretraining is relatively small. To further distinguish the effects of source-domain knowledge from those of additional model capacity, we evaluated multiple random encoder initializations, an alternative pretraining source, reduced target-label configurations, and linear probes of the frozen representations. The corresponding results are presented later in this section (Supplementary Tables S30–S32). At FPR ≤ 0.1%, the relevant encoder variants produced identical results because ranking within the protected region was determined by the specialist branch.
Figure 7.
Paired performance differences between TARA and its component variants or additional comparator models on the locked test set: (a) ROC-AUC; (b) standardized pAUC at FPR ≤ 1%; and (c) TPR at FPR ≤ 0.1%.
The source-aware comparators revealed substantial negative transfer. The source-only encoder achieved a ROC-AUC of 0.2410 on the target test set, indicating an inverted ranking of target observations. CatBoost trained on pooled source and target data achieved a ROC-AUC of 0.8576 and pAUC@1% of 0.5975, compared with 0.9443 and 0.8109 for TARA. The discrepancy between source and target datasets is further illustrated by the structural characteristics of their URL paths (Table S28). In the PhiUSIIL source-fit dataset, empty or root paths occurred in 100.00% of legitimate URLs and 74.04% of phishing URLs. In contrast, the corresponding proportions in the PhreshPhish target-adaptation dataset were 9.21% and 28.36%, respectively. These opposing relationships between URL structure and class labels provide a plausible explanation for the observed negative transfer. The fine-tuned source network achieved a pAUC@1% of 0.7712. Although this value was lower than TARA’s 0.8109, the paired difference of 0.0397 was inconclusive because its 95% confidence interval included zero [−0.0058, 0.1055]. By contrast, the fine-tuned network performed significantly worse at pAUC@0.1% (0.5321 versus 0.6959). The capacity-matched ensemble combining three CatBoost models and three FT-Transformers also underperformed TARA in ROC-AUC and pAUC@0.1%, while the pAUC@1% difference was inconclusive. The character-level CNN achieved the highest global ROC-AUC of 0.9759 and TPR@1% of 0.7619, but its pAUC@1% of 0.7287 and TPR@0.1% of 0.1095 were substantially below the corresponding TARA results. Therefore, the advantage of TARA is concentrated in the lowest-FPR region rather than in global ranking across all operating points. To further investigate the preservation of source-domain knowledge, the frozen source encoder and related model variants were evaluated on the independent PhiUSIIL source-test set containing 22,544 URLs. The test domains were excluded from source training, model selection, and calibration. Table 14 summarizes the corresponding source-test performance and changes in the source-route scores following target adaptation.
Table 14.
Source-route preservation and performance on the independent PhiUSIIL source-test set (22,544 URLs).
As shown in Table 14, the frozen source encoder achieved a ROC-AUC of 0.8947 and pAUC@1% of 0.8283 on the independent source-test set. Its source-route outputs remained unchanged after target adaptation, demonstrating that freezing preserved the original source-domain decision function. In contrast, fine-tuning the source encoder within the contextual branch modified the source-route outputs and reduced source-test ROC-AUC to 0.8567. Fully fine-tuning the source network resulted in a pronounced deterioration of source-test ranking performance, with ROC-AUC decreasing to 0.2629. Target-trained models, including TARA, also exhibited inverted ranking when evaluated directly on the source-test dataset. Pooled source–target CatBoost preserved relatively strong source-test performance (ROC-AUC = 0.8870), but this was accompanied by a substantial loss of target-test performance, as shown in Table 13. Taken together, these results distinguish three important aspects of the proposed framework. First, domain-level uncertainty must be explicitly considered when evaluating extremely low-FPR performance because a small number of legitimate domains can strongly influence the estimated operating point. Second, incorporating source-domain information does not necessarily improve target-domain detection, particularly when the relationships between URL characteristics and class labels differ across datasets. Third, the frozen encoder preserves the source-domain decision function, but this preservation alone does not establish the usefulness of the transferred representation for target-domain prediction. The main empirical contribution of TARA in the evaluated setting is therefore associated with supervised target adaptation and explicit protection of specialist ranking in the lowest-FPR region. Since the additional comparator experiments were performed after the initial locked-test evaluation, their results should be interpreted as supplementary explanatory analyses rather than independent prospective validation.
To further assess the methodological contribution of TARA, its performance was directly compared with a standalone TailTree-only detector. At FPR ≤ 0.1%, both models achieved identical pAUC (0.6959) and TPR (0.4582), confirming that the tail-aware ranking guard preserves the specialist ordering within the protected region. The same equivalence was observed at FPR ≤ 0.5%, where both models achieved TPR of 0.6744. However, the hybrid architecture provided measurable improvements beyond this region. The incremental performance differences across three evaluation populations are presented in Table 15. A detailed comparison of TARA and the standalone TailTree-only detector, including all 19 performance metrics, 95% confidence intervals, and Holm-adjusted p-values, is provided in Supplementary Table S29. The expanded legitimate-URL evaluation used 94,752 legitimate URLs from 72,560 registered domains, obtained from the earlier PhreshPhish training collection and excluded from all experimental roles of the primary configuration. The phishing class remained unchanged and comprised 39,391 observations from the original locked test set. Consequently, the expanded evaluation population contained 134,143 URLs. The additional experiment retained the original trained models and replaced only the legitimate evaluation population. Domain-level paired bootstrap resampling with 2000 replicates was used to assess performance differences. This design increases the number of legitimate observations supporting low-FPR estimates while preserving the original phishing evaluation samples.
Table 15.
Incremental Performance and Inference Cost of TARA Relative to TailTree-only across Three Evaluation Populations.
On the original locked test set, TARA achieved a ROC-AUC of 0.9443 compared with 0.9303 for TailTree-only, representing an improvement of 0.0140 (95% CI: 0.0123–0.0159). At FPR ≤ 2%, standardized pAUC increased by 0.0105 (95% CI: 0.0070–0.0142), while TPR improved by 0.0401 (95% CI: 0.0327–0.0485). At FPR ≤ 5%, the TPR improvement reached 0.0520 (95% CI: 0.0465–0.0566). The hybrid model also achieved better probability calibration, reducing the Brier score from 0.1288 to 0.1074. These improvements were statistically confirmed after Holm correction. The expanded legitimate-URL evaluation further demonstrated improvements in ROC-AUC (+0.0130) and pAUC at FPR ≤ 1% (+0.0066), both statistically confirmed. However, the independently trained second source-target configuration did not reproduce a statistically significant advantage over TailTree-only, with a ROC-AUC difference of only +0.0007 (95% CI: -0.0002 to 0.0018). These findings clarify that the methodological contribution of TARA does not consist of improving detection within the most restrictive FPR region, where the specialist ranking is intentionally preserved. Instead, the hybrid architecture enables neural refinement beyond the protected region, improving global discrimination, detection sensitivity at higher FPR levels, and probability calibration in the original configuration. Nevertheless, these additional benefits are dependent on the evaluated target population and should not be interpreted as universally reproducible improvements. The computational comparison further demonstrates that the incremental predictive benefit of TARA is accompanied by a substantial increase in inference cost. TailTree-only required only 1.27 ms per 1000 URLs, whereas the complete TARA architecture required 206.2 ms, representing an approximately 162-fold increase. Despite this computational difference, both models achieved identical TPR at FPR ≤ 0.1% (0.4582) and FPR ≤ 0.5% (0.6744). Therefore, the additional computational cost of the hybrid architecture is not justified for applications operating exclusively within the most restrictive FPR region, where TailTree-only provides equivalent detection performance at considerably lower inference cost.
The contribution of source-domain pretraining was further examined using alternative frozen representations. In addition to the original PhiUSIIL-pretrained encoder, we evaluated three randomly initialized frozen encoders, a target-trained frozen encoder, and an encoder pretrained on an earlier PhreshPhish population. The performance of the complete TARA framework and the contextual neural branch evaluated independently of TailTree is presented in Table 16.
Table 16.
Performance of TARA and Its Contextual Branch with Different Frozen Encoder Representations on the Locked Test Set.
The results demonstrate that source-domain pretraining provides measurable but limited improvements in global discrimination. For the full TARA framework, randomly initialized frozen encoders achieved ROC-AUC values ranging from 0.9403 to 0.9432, compared with 0.9443 for the PhiUSIIL-pretrained encoder and 0.9470 for the PhreshPhish-pretrained encoder. The ROC-AUC improvements of PhiUSIIL pretraining over the three random initializations ranged from 0.0011 to 0.0040 and were statistically confirmed after Holm correction. The PhreshPhish-pretrained encoder provided larger improvements of 0.0039–0.0067 relative to random initialization and exceeded the PhiUSIIL-pretrained encoder by 0.0028 (95% CI: 0.0020–0.0034). However, these improvements did not translate into statistically confirmed gains in the low-FPR ranking region. None of the 12 comparisons involving pAUC and TPR at FPR ≤ 1% between pretrained and randomly initialized encoders remained significant after Holm correction. At FPR ≤ 0.1%, all complete TARA variants produced identical results because ranking within the protected region was determined by TailTree. When evaluated separately, the contextual branch using the PhreshPhish-pretrained encoder achieved a ROC-AUC of 0.9483, compared with 0.9382–0.9416 for the randomly initialized alternatives and 0.9402 for the PhiUSIIL-pretrained encoder. The improvements over random initialization ranged from 0.0067 to 0.0101 and were statistically confirmed. These results indicate that the contribution of source pretraining depends strongly on source–target similarity and is more clearly observable in global discrimination than in the most restrictive low-FPR region. Detailed paired comparisons and confidence intervals are provided in Supplementary Table S30.
To assess whether source-domain representations become more beneficial when target supervision is limited, additional experiments were performed using reduced fractions of the target-adaptation domains. With 10% of the available domains (3783 URLs), the PhreshPhish-pretrained contextual branch achieved a mean ROC-AUC of 0.9109, compared with 0.8821 for the randomly initialized encoder, 0.8846 without a representation token, and 0.8789 for the PhiUSIIL-pretrained encoder. At 25% of adaptation domains (8549 URLs), the corresponding values were 0.9415, 0.9268, 0.9269, and 0.9237, respectively. Independent linear-probe experiments supported these findings. When trained on only 1% of adaptation domains, a linear classifier using the PhreshPhish-pretrained representation achieved a mean ROC-AUC of 0.9009, compared with 0.7357 for randomly initialized representations and 0.6511 for the PhiUSIIL-pretrained representation. However, no consistent advantage was observed for standardized pAUC at FPR ≤ 1%. These results indicate that related-source pretraining improves global discrimination under limited target supervision, whereas pretraining on the more dissimilar PhiUSIIL source provides substantially weaker transfer benefits. Complete reduced-label and linear-probe results are provided in Supplementary Tables S31 and S32. The sensitivity of TARA to changes in the target collection period was additionally assessed using temporal Configuration A. On the independent locked test, TARA achieved a ROC-AUC of 0.9651, standardized pAUC at FPR ≤ 1% of 0.8040, and TPR at FPR ≤ 0.1% of 0.4529. Five of the 16 primary low-FPR comparisons were statistically significant after Holm correction. However, the difference between TARA and TailTree-only was not statistically significant, indicating that the incremental benefit of the hybrid architecture depends on the target population. The comparative results are summarized in Table 17. The detailed dataset partitions and statistical comparisons for Configuration A are provided in Supplementary Tables S33 and S34, respectively.
Table 17.
Comparative Performance of TARA and Baseline Models in Temporal Configuration A (PhiUSIIL Source and Earlier PhreshPhish Target Collection).
Table 18 presents the comparative performance of TARA and baseline models on the independently collected Hannousse–Yahiouche target dataset (Configuration C). The evaluation was conducted on a locked test set comprising 2348 URLs, including 1261 legitimate and 1087 phishing samples. TARA achieved a ROC-AUC of 0.9365, a standardized pAUC at FPR ≤ 1% of 0.7206, and true positive rates of 0.5446 and 0.3689 at FPR thresholds of 1% and 0.1%, respectively. Among the evaluated models, TARA achieved the highest TPR at FPR ≤ 1%, the second-highest pAUC at FPR ≤ 1%, and the third-highest ROC-AUC. CatBoost demonstrated the highest overall ROC-AUC (0.9386), while LightGBM achieved the highest pAUC at FPR ≤ 1% (0.7228) and TPR at FPR ≤ 0.1% (0.3790). Notably, TARA and TailTree-only exhibited identical TPR values at FPR ≤ 0.1% (0.3689), indicating that the hybrid architecture did not provide an additional detection benefit in the most restrictive operating region. According to the reported domain-level bootstrap analysis with 2000 replicates and Holm correction, TARA significantly outperformed Logistic Regression, MLP, and FT-Transformer in terms of global ROC-AUC, whereas none of the primary low-FPR comparisons demonstrated statistically significant differences. These findings indicate that TARA maintains competitive predictive performance when adapted to an independently collected target dataset. However, the results do not establish consistent superiority over strong tree-based baselines, suggesting that the benefits of the hybrid architecture depend on the characteristics of the target data.
Table 18.
Comparative Performance of TARA and Baseline Models on the Locked Test of Independent Configuration C (2348 URLs).
Table 19 presents the performance of TARA and four classifiers explicitly optimized for partial ROC-AUC, together with their original binary cross-entropy-based counterparts. All models were evaluated on the same locked test set comprising 46,942 URLs. Statistical differences relative to TARA were assessed using 2000 paired bootstrap replicates at the registered-domain level, with Holm correction applied to a separate family of 20 comparisons.
Table 19.
Comparative Performance of TARA and Partial-AUC-Optimized Baseline Models on the Locked Test Set.
The results in Table 19 indicate that partial-AUC optimization provides measurable improvements over conventional binary cross-entropy training, although the magnitude of these improvements varies across evaluation metrics. For the MLP classifier, standardized pAUC at FPR ≤ 1% increased from 0.7753 to 0.7787 with β = 1% and to 0.7796 with β = 0.1%. The corresponding improvements of 0.0034 [95% CI: 0.0016–0.0051] and 0.0043 [95% CI: 0.0026–0.0059] were statistically significant. However, TPR at FPR ≤ 0.1% improved only marginally from 0.0871 to 0.0874. The linear partial-AUC-optimized classifier similarly demonstrated a small improvement in pAUC at FPR ≤ 1%, from 0.7246 to 0.7253. The MLP trained exclusively with the partial-AUC objective from random initialization achieved a lower ROC-AUC of 0.8525 and a standardized pAUC at FPR ≤ 1% of 0.7595, indicating that partial-AUC optimization was more effective as a fine-tuning strategy than as the sole training objective in the evaluated setting. Compared with the best specialized baseline in terms of pAUC at FPR ≤ 1% (MLP with β = 0.1%), TARA achieved a higher ROC-AUC (0.9443 versus 0.9383) and pAUC at FPR ≤ 1% (0.8109 versus 0.7796). Nevertheless, the difference in pAUC at FPR ≤ 1% was not statistically significant after Holm correction (difference: 0.0313; 95% CI: −0.0118 to 0.0967). These findings indicate that TARA remains competitive with specialized low-FPR methods but does not demonstrate statistically consistent superiority across all low-FPR metrics.
The Neyman–Pearson threshold-based comparison further examined the stability of low-FPR operation under temporal distribution shift. At a nominal FPR of 0.1%, both URL-level and domain-level Neyman–Pearson threshold selection produced the same number of false positives for each of the five evaluated ranking systems. The observed FPR ranged from approximately 0.30% to 0.32%, exceeding the nominal target. For TARA, both threshold-selection variants resulted in 24 false positives, an observed FPR of 0.3178%, and a TPR of 0.6384. These findings show that statistically motivated threshold selection does not necessarily preserve the desired operating FPR when the distribution of legitimate URLs changes between calibration and testing. Thus, partial-AUC optimization and Neyman–Pearson threshold selection address complementary aspects of low-FPR detection, but neither eliminates temporal threshold instability.
Figure 8 further illustrates the dependence of contextual branch performance on target-label availability. The advantage of PhreshPhish pretraining in ROC-AUC becomes more pronounced as the amount of labeled target data decreases. In contrast, the standardized pAUC curves overlap within the variability across random seeds, indicating that the improvements in global discrimination do not consistently extend to low-FPR ranking performance.
Figure 8.
Effect of Target-Label Availability on Contextual Branch Performance with Different Frozen Representations: (a) ROC-AUC across different adaptation-domain percentages (10%, 25%, and 100%); (b) partial area under the ROC curve at a 1% false-positive rate (pAUC at FPR ≤ 1%) across the same adaptation-domain percentages.
The substantial concentration of false-positive predictions in the final test week motivated an additional investigation of the December 2025 collection batch. As shown in Table 11, the nominal 0.1% FPR threshold produced 24 false positives across the original locked test, of which 18 occurred in the December batch following a 39-day collection gap. To determine whether this degradation was associated with changes in the distribution of legitimate URLs or characteristics of the dataset collection process, the December observations were compared with the three preceding test weeks at the registered-domain level. Table 20 summarizes the composition of the legitimate-URL populations and their false-positive characteristics. The December batch comprised 483 legitimate URLs from 59 registered domains, whereas the preceding three test weeks contained 7068 legitimate URLs from 6881 domains. The average number of URLs per domain increased from 1.03 in the preceding weeks to 8.19 in December. Furthermore, the largest domain accounted for 4.3% of December observations, compared with approximately 0.1% in the preceding population. These differences indicate that the December batch was substantially more concentrated within a smaller number of registered domains.
Table 20.
Domain-Level Distribution Characteristics and False-Positive Rates for Legitimate URLs during 15–21 December 2025 Compared with the Previous Three Test Weeks.
The 18 December false positives were concentrated within only five registered domains, with one domain accounting for 44.4% of these errors. This concentration indicates that the observed FPR increase was influenced by a limited number of domain groups rather than by uniform deterioration across the legitimate-URL population. To quantify distributional differences, classifier two-sample tests were performed using the 55 URL-derived features and domain-grouped cross-validation. The classifier distinguished December legitimate URLs from those collected during the preceding test weeks with an out-of-fold ROC-AUC of 0.7481 (95% CI: 0.6853–0.8094). In comparison, the reference test between adjacent collection weeks without a prolonged gap yielded a ROC-AUC of 0.5105 (95% CI: 0.4887–0.5316). The markedly greater separability of the December population provides evidence of an abrupt change in the observed input feature distribution.
Feature-level comparisons further characterized this difference. Relative to the preceding legitimate-URL population, the December observations exhibited shorter hostname labels and registered domains, with standardized mean differences of −0.81 for both characteristics. Path depth increased, with a standardized mean difference of +0.46 and an average of 2.24 path levels compared with 1.67 in the preceding weeks. The number of path keywords associated with login and account-management pages also increased from 0.06 to 0.28 per URL, corresponding to a standardized mean difference of +0.52. These structural differences are relevant because path-related features contribute substantially to the ranking behavior of the evaluated detectors.
The observed results indicate that the December batch differs from earlier legitimate-URL observations in both domain concentration and feature composition. The collection process itself also exhibits heterogeneous sampling characteristics: seven of the eighteen calendar months represented in the examined PhreshPhish training and test metadata contain observations from only one class. Consequently, the December batch is consistent with a collection-composition effect that introduces an abrupt covariate shift into the evaluation population.
However, the available metadata do not permit a definitive separation between genuine changes in the broader legitimate-web population and changes introduced by dataset collection practices. The analysis therefore supports the presence of an observable distribution shift associated with a distinct collection batch, rather than establishing gradual temporal concept drift. This distinction is important when interpreting the failure of threshold recalibration, since thresholds estimated from earlier observations cannot necessarily compensate for abrupt changes in the composition of incoming legitimate URLs.
4. Discussion
Within the evaluated PhiUSIIL–PhreshPhish source-target setting, TARA demonstrated competitive ranking performance at low false-positive rates. On the locked test set, it achieved a pAUC@1% of 0.8109 and a TPR@0.1% of 0.4582. However, only three of the 16 primary low-FPR comparisons remained statistically significant after Holm correction, indicating that numerical improvements do not establish consistent superiority over all baselines. Additional experiments showed that a character-level CNN achieved higher global ROC-AUC, while TARA performed better in the most restrictive FPR region. These findings highlight the importance of distinguishing global discrimination from low-FPR ranking performance. The proposed ranking guard preserves specialist ordering within a predefined region but does not guarantee stable operational FPR under temporal shifts. Ablation studies, in which individual components are removed, provide deeper insight into the mechanisms of the proposed architecture. Replacing the mechanism designed to handle tail (rare) features with an unrestricted constant score fusion step caused the partial ROC-AUC (at FPR ≤ 0.1%) to drop from 0.6959 to 0.5799, even though the global ROC-AUC remained virtually unchanged. The decision-tree component was instrumental in maintaining TARA’s high performance at extremely low FPR levels, though it performed less effectively overall; conversely, the neural network component, when used in isolation, proved significantly less effective within the most stringent FPR range. The additional source-pretraining experiments clarify the contribution of the frozen source encoder. Although PhiUSIIL pretraining produced statistically confirmed improvements in ROC-AUC over randomly initialized frozen representations, the magnitude of these improvements was small (0.0011–0.0040), and no consistent benefits were observed in the low-FPR region. More substantial improvements were obtained using the PhreshPhish-pretrained encoder, particularly when the availability of labeled target data was limited. These findings demonstrate that the effectiveness of source-domain pretraining depends on the similarity between source and target distributions. Therefore, source pretraining should be regarded as a source-dependent enhancement of global discrimination rather than the principal mechanism responsible for TARA’s low-FPR performance. It is important to note that these findings do not prove that each individual component, in isolation, improves prediction quality. Rather, they demonstrate the value of managing the interplay between complementary predictive mechanisms particularly in scenarios where maintaining the correct ranking order for complex legitimate URLs is critical. The additional evaluations provide complementary evidence regarding temporal variation and independent cross-dataset generalization. Configuration A examined changes in the target collection period within PhreshPhish, whereas Configuration C evaluated supervised adaptation to the independently assembled Hannousse–Yahiouche corpus. In Configuration C, TARA maintained competitive discrimination, achieving a ROC-AUC of 0.9365 and a standardized pAUC at FPR ≤ 1% of 0.7206. Nevertheless, the independent evaluation did not demonstrate a statistically significant low-FPR advantage over TailTree-only or the other evaluated baselines. The identical TPR at FPR ≤ 0.1% for TARA and TailTree-only further indicates that the contextual neural component did not provide a measurable benefit in the most restrictive operating region. These findings suggest that the contribution of the hybrid architecture depends on the characteristics of the target dataset. Moreover, the relatively small independent test population limits the precision of extremely low-FPR estimates. Further evaluation across additional independently collected datasets and source-domain configurations is therefore required before broader generalization claims can be made.
The comparison with specialized partial-AUC-optimized baselines provides additional evidence concerning the effectiveness and limitations of TARA in the low-FPR region. Fine-tuning the MLP using a partial-AUC surrogate improved its discrimination within the targeted FPR interval, confirming the relevance of explicitly optimizing operationally constrained ranking metrics. However, these improvements were modest, particularly at FPR ≤ 0.1%. Although TARA achieved higher numerical pAUC and TPR values in this restrictive region, most differences relative to the specialized baselines were not statistically significant after correction for multiple comparisons. Furthermore, the Neyman–Pearson threshold experiments demonstrated that neither URL-level nor domain-level threshold selection maintained the nominal FPR under temporal distribution shift. These observations emphasize the distinction between optimizing low-FPR ranking performance and guaranteeing the stability of a fixed operating threshold. Consequently, the proposed approach should be regarded as a competitive ranking-oriented framework rather than a method guaranteeing universally superior low-FPR performance.
The expanded legitimate-URL evaluation provides additional statistical support for assessing detection performance at extremely low false-positive rates. Unlike the original locked test, which contained 7551 legitimate URLs, the expanded evaluation included 94,752 legitimate URLs originating from 72,560 previously unused registered domains. This substantially increased the number of legitimate observations available for evaluating rare false-positive events. However, the additional population was derived from an earlier PhreshPhish collection, while the phishing observations and trained models were retained from the original experiment. Therefore, the expanded evaluation should not be interpreted as a fully independent cross-dataset replication or as evidence of prospective performance on a later collection period. Rather, it provides a complementary assessment of ranking stability and false-positive behavior under a substantially larger, domain-disjoint legitimate population.
A particularly significant finding concerns the distinction between ranking performance and the stability of an operational threshold. While TARA achieved competitive probability calibration, the FT-Transformer yielded slightly better Brier Score and LogLoss values, and the MLP achieved a lower Expected Calibration Error. More importantly, a threshold calibrated for a nominal FPR of 0.1% resulted in an actual FPR of approximately 0.318% on a subsequent test sample. This discrepancy demonstrates that maintaining a low FPR in a ranking context does not guarantee that a pre-established operational threshold will remain valid when the underlying distribution shifts. This also underscores the practical importance of decoupling probability calibration, threshold selection, and final decision evaluation a practice consistent with established principles for classifier calibration [25]. Consequently, TARA should be viewed as an adaptive, ranking-oriented framework rather than a system that guarantees fixed false positive rates under changing conditions.
Robustness experiments revealed both beneficial properties and critical vulnerabilities. Performance degraded gradually under scenarios involving independent, random feature unavailability, suggesting that representations which account for feature availability provide some resilience against partial information loss. However, the removal of an entire family of path-related features or several highly informative, specialized features led to a substantial decline in detection performance at low false positive rates, even when global discriminative power remained relatively strong. These results indicate that robustness against random data omissions cannot be generalized to structured feature failures or adversarial manipulations. Furthermore, temporal analysis revealed significant fluctuations in error rates throughout the observation periods, suggesting that aggregated testing metrics may mask meaningful shifts in model behavior over time.
From a practical standpoint, the choice between TARA and TailTree-only should consider both predictive performance and computational efficiency. The matched inference benchmark showed that TailTree-only required 1.27 ms per 1000 URLs, compared with 206.2 ms for TARA, corresponding to an approximately 162-fold increase in inference time. When the common feature extraction cost of 71.5 ms per 1000 URLs is included, the total processing time increases from approximately 72.8 ms for TailTree-only to 277.7 ms for TARA, reducing the relative overhead to approximately 3.8 times. However, the additional neural components do not improve detection performance at FPR ≤ 0.5%, where both models achieve identical results. Although TARA provides statistically significant improvements in global discrimination and detection sensitivity at higher FPR levels in the original configuration, these benefits are not consistently reproduced across target configurations. Consequently, TailTree-only represents a more computationally efficient choice for applications requiring extremely low false-positive rates. The full TARA architecture may be justified when improvements in global discrimination, broader operating ranges, or probability calibration outweigh the additional computational cost.
The temporal recalibration experiments demonstrated that neither cumulative nor rolling-window threshold updates resolved the observed FPR instability in the original configuration. The additional domain-level analysis provides further insight into this behavior. The December collection batch exhibited substantially greater domain concentration than the preceding test weeks, with an average of 8.19 URLs per domain compared with 1.03, and accounted for 18 of the 24 false positives at the nominal 0.1% FPR threshold. The classifier two-sample test also identified a measurable shift in URL feature distributions, achieving a ROC-AUC of 0.7481 compared with 0.5105 for adjacent weeks without a collection gap. These findings suggest that the observed threshold instability was associated with an abrupt change in the composition of the collected legitimate-URL population rather than a gradual temporal deterioration. Nevertheless, because the available metadata do not fully characterize the underlying collection procedure, collection effects cannot be conclusively separated from genuine temporal changes in legitimate URLs. Accordingly, the observed degradation should not be interpreted as definitive evidence of general temporal concept drift. Future evaluations should incorporate continuous collection periods, collection-source metadata, and domain-level distribution monitoring to distinguish dataset-specific sampling effects from genuine changes in deployment populations.
Future research should explore adaptation to additional independent datasets and longer observation periods, investigate methods for maintaining calibrated operating thresholds amidst shifting class distributions, and evaluate computationally efficient alternatives to the current hybrid architecture. Further experiments, incorporating realistic URL manipulations and structured feature degradation, would also help establish the practical robustness of ranking mechanisms, particularly with regard to the long tail of the distribution. Overall, these findings indicate that explicit control of ranking with a low FPR during supervised adaptation is a promising approach for phishing URL detection, while also highlighting that predictive ranking, calibration, and deployment reliability should be assessed as distinct properties.
5. Conclusions
This study presents TARA, a hybrid framework for detecting phishing URLs in scenarios involving cross-dataset analysis and temporal distribution shifts. The proposed approach combines frozen source representations, CatBoost-based expert models that account for hard negatives, and contextual neural learning via a deterministic, tail-aware ranking mechanism. Its primary methodological contribution lies in the controlled integration of complementary predictive components, which preserves the ranking provided by expert models within a protected high-score region, while simultaneously allowing for neural processing in other areas. Experimental evaluation using the PhiUSIIL and PhreshPhish datasets demonstrated the effectiveness of this approach under a protocol designed to prevent data leakage, ensuring non-overlapping domains and chronological separation. On a held-out test set of 46,942 URLs, TARA achieved an ROC-AUC of 0.9443, an average precision of 0.9891, and a standardized partial ROC-AUC of 0.6959 at an FPR ≤ 0.1%. Ablation studies confirmed the importance of tail-aware ranking, as unrestricted fusion reduced the corresponding partial ROC-AUC to 0.5799. An additional evaluation on the independently collected Hannousse–Yahiouche dataset further examined the transferability of the proposed framework beyond PhreshPhish. In this configuration, TARA achieved a ROC-AUC of 0.9365 and a standardized pAUC at FPR ≤ 1% of 0.7206. Although the results confirmed competitive predictive performance, they did not establish a statistically significant advantage of the hybrid architecture in the low-FPR region. Thus, the evidence supports supervised adaptation across the evaluated target datasets but does not demonstrate universal cross-dataset generalization.
The results also revealed significant operational limitations. A threshold calibrated for a nominal FPR of 0.1% yielded an actual FPR of 0.3178% on later test data, demonstrating that improved ranking does not guarantee threshold stability in the presence of distribution shifts. Furthermore, structured feature loss significantly reduced detection performance at low FPR, while the hybrid architecture required greater computational resources than individual boosting models.
The computational evaluation demonstrated that TARA required approximately 162 times more batch inference time than TailTree-only under matched benchmarking conditions. Since both models achieved identical detection performance at FPR ≤ 0.5%, the additional computational cost was not justified within the most restrictive operating region. Although TARA improved global discrimination and detection sensitivity at higher FPR levels in the original configuration, these benefits were dependent on the target population. Therefore, the practical selection between TARA and TailTree-only should be guided by the operating FPR requirements, computational constraints, and independently validated performance improvements.
Overall, TARA represents a promising framework for supervised adaptation in URL-based phishing detection, particularly when performance at low false-positive rates is critical. Future research will focus on evaluation using additional independent datasets, adaptive threshold recalibration, computational optimization, and robustness against realistic URL manipulations by malicious actors. Such developments are essential for assessing the framework’s suitability for reliable deployment within the ever-evolving cybersecurity landscape.
Supplementary Materials
The following supporting information can be downloaded at: https://www.mdpi.com/article/10.3390/technologies14110766/s1, Figure S1: Development Collection Intensity; Figure S2: Class-Conditioned Feature Distributions in Target Adaptation; Figure S3: Source Encoder Loss and Discrimination; Figure S4: Context FT Loss and Discrimination; Figure S5: Feature Attribution for the Tree Specialist (SHAP) and Neural Branch (Input Gradients); Figure S6: Sensitivity of Ranking Performance to the Protected-Region Threshold and Lower-Region Neural Weight; Figure S7: Sensitivity of TARA to Hard-Negative Selection Parameters; Figure S8: Distributions of 2000 Paired Domain-Level Bootstrap Replicates on the Locked Test Set; Table S1: Results of the Check for Duplicates and Conflicting URL Identities; Table S2: Impact of Forward Domain Purging on the Chronological Roles of Target Data; Table S3: Comprehensive Audit of the Absence of Informational Overlap between Experimental Roles; Table S4: Division of the Calibration Population into Independent Functional Roles; Table S5: Statistical Support for Specified Low-FPR Operating Levels; Table S6: Fixed Protocol for Access to Experimental Roles; Table S7: Audit of the Accessibility and Variability of the Shared Space of URL Attributes; Table S8: Descriptive Statistics and Tail Properties of URL Features on the Target-Adaptation Population; Table S9: Repeatability of Numerical URL Representations in Development Populations; Table S10: Multi-Criteria Evaluation of the Informativeness of URL Features; Table S11: Fold-Local Validation of Numerical Preprocessing for Target-Adaptation Data; Table S12: Domain-Grouped Out-of-Fold Procedure for Hard-Negative Specialist Training; Table S13: Developmental Ablation of Individual Components and the TARA Integration Mechanism; Table S14: Normalization Parameters for TARA Score Components; Table S15: Verification of Frozen Source Preservation and Checkpoint Reload Consistency in TARA; Table S16: Pairwise Statistical Testing of TARA Ablation Effects; Table S17: Verification of Deterministic Invariants of the TARA Tail-Aware Ranking Mechanism; Table S18: Sensitivity of TARA’s Projected Operational Performance Metrics to Phishing Prevalence; Table S21: Configurations of TARA Variants and Additional Comparator Models; Table S23: Sensitivity of TARA to Branch-Normalization Quantiles on the Target-Calibration Partition; Table S24: Sensitivity of TailTree and TARA to Hard-Negative Selection Quantiles and Weights on the Target-Calibration Partition; Table S28: URL Structure by Class in the Source and Target Development Partitions; Table S29: Performance Comparison of TARA and the Standalone TailTree-Only Detector on the Original Locked Test Set; Table S30: Paired ROC-AUC Differences between Pretrained and Randomly Initialized Frozen Encoders on the Locked Test Set; Table S31: Branch Performance under Reduced Target-Label Availability; Table S32: Linear Probes of Frozen Representations on a Held-Out Test Set; Table S33: Dataset Composition and Experimental Partitions of the Additional Source–Target Configuration; Table S34: Paired Statistical Comparisons of TARA and Baselines in Configuration A; Table S35: Comparison of Fixed and Temporally Recalibrated Thresholds at a Nominal FPR of 0.1%.
Author Contributions
Conceptualization, N.G., A.A. and G.D.; methodology, N.G., Z.S. and Z.B.; software, Z.S., G.T. and M.A.; validation, A.A., G.D. and S.Z.; formal analysis, N.G., Z.B. and Z.M.; investigation, Z.S., G.T. and M.A.; resources, Z.M. and S.Z.; data curation, G.T., Z.M. and M.A.; writing—original draft preparation, N.G., A.A. and Z.S.; writing—review and editing, G.D., Z.B., Z.M. and S.Z.; visualization, G.T. and M.A.; supervision, A.A., G.D. and Z.B.; project administration, A.A. and G.D. All authors have read and agreed to the published version of the manuscript.:.
Funding
This research received no external funding.
Data Availability Statement
The datasets used in this study are publicly available. The PhiUSIIL Phishing URL Dataset [6] is accessible through the UCI Machine Learning Repository (Dataset ID: 967) at https://archive.ics.uci.edu/dataset/967/phiusiil+phishing+url+dataset (accessed on 10 October 2026). The PhreshPhish dataset [7] is available at https://huggingface.co/datasets/phreshphish/phreshphish (accessed on 10 October 2026). The experiments employed PhreshPhish version 1.0.1 (repository revision: eabec4b7a66324b79cc8a0ad856d1731dc26fe1a). The independently collected dataset of Hannousse and Yahiouche [48] was used for the additional cross-dataset evaluation.
Acknowledgments
During the preparation of this manuscript, the authors employed OpenAI ChatGPT (GPT-5.5) exclusively to improve the language quality, readability, and clarity of the English text. The tool was not involved in generating scientific findings, conducting data analysis, designing algorithms, interpreting experimental results, or drawing conclusions. All scientific contributions were independently developed, carefully reviewed, and verified by the authors, who assume full responsibility for the accuracy, integrity, and final content of the manuscript.
Conflicts of Interest
The authors declare no conflicts of interest.
Abbreviations
The following abbreviations are used in this manuscript:
| TARA | Tail-Aware Residual Adaptation |
| URL | Uniform Resource Locator |
| FPR | False Positive Rate |
| TPR | True Positive Rate |
| ROC-AUC | Area Under the Receiver Operating Characteristic Curve |
| pAUC | Partial Area Under the ROC Curve |
| AP | Average Precision |
| OOF | Out-of-Fold |
| FT-Transformer | Feature Tokenizer Transformer |
| MLP | Multilayer Perceptron |
| ECE | Expected Calibration Error |
| MCC | Matthews Correlation Coefficient |
References
- Zieni, R.; Massari, L.; Calzarossa, M.C. Phishing or not phishing? A survey on the detection of phishing websites. IEEE Access 2023, 11, 18499–18519. [Google Scholar] [CrossRef] [Scilit]
- Li, W.; Manickam, S.; Chong, Y.W.; Leng, W.; Nanda, P. A state-of-the-art review on phishing website detection techniques. IEEE Access 2024, 12, 187976–188012. [Google Scholar] [CrossRef] [Scilit]
- Kavya, S.; Sumathi, D. Staying ahead of phishers: A review of recent advances and emerging methodologies in phishing detection. Artif. Intell. Rev. 2024, 58, 50. [Google Scholar] [CrossRef] [Scilit]
- Tian, Y.; Yu, Y.; Sun, J.; Wang, Y. From past to present: A survey of malicious URL detection techniques, datasets and code repositories. Comput. Sci. Rev. 2025, 58, 100810. [Google Scholar] [CrossRef] [Scilit]
- Kustiawan, Y.A.; Ghauth, K.I. Feature engineering for phishing website detection using machine learning: A systematic review. IEEE Access 2025, 13, 192080–192104. [Google Scholar] [CrossRef] [Scilit]
- Prasad, A.; Chandra, S. PhiUSIIL: A diverse security profile empowered phishing URL detection framework based on similarity index and incremental learning. Comput. Secur. 2024, 136, 103545. [Google Scholar] [CrossRef] [Scilit]
- Dalton, T.; Gowda, H.; Rao, G.; Pargi, S.; Khodabakhshi, A.H.; Rombs, J.; Jou, S.; Marwah, M. Phreshphish: A real-world, high-quality, large-scale phishing website dataset and benchmark. arXiv 2025, arXiv:2507.10854. [Google Scholar] [CrossRef] [Scilit]
- Odeh, A.; Al-Haija, Q.A.; Aref, A.; Taleb, A.A. Comparative study of CatBoost, XGBoost, and LightGBM for enhanced URL phishing detection: A performance assessment. J. Internet Serv. Inf. Secur. 2023, 13, 1–11. [Google Scholar] [CrossRef] [Scilit]
- Reyes-Dorta, N.; Caballero-Gil, P.; Rosa-Remedios, C. Detection of malicious URLs using machine learning. Wirel. Netw. 2024, 30, 7543–7560. [Google Scholar] [CrossRef] [Scilit]
- Yi, L.; Omotosho, A.; Balogun, H. Phishing URL detection and interpretability with machine learning: A cross-dataset approach. Secur. Priv. 2026, 9, e70175. [Google Scholar] [CrossRef] [Scilit]
- Zheng, F.; Yan, Q.; Leung, V.C.; Yu, F.R.; Ming, Z. HDP-CNN: Highway deep pyramid convolution neural network combining word-level and character-level representations for phishing website detection. Comput. Secur. 2022, 114, 102584. [Google Scholar] [CrossRef] [Scilit]
- Bozkir, A.S.; Dalgic, F.C.; Aydos, M. GramBeddings: A new neural network for URL based identification of phishing web pages through n-gram embeddings. Comput. Secur. 2023, 124, 102964. [Google Scholar] [CrossRef] [Scilit]
- Hussain, M.; Cheng, C.; Xu, R.; Afzal, M. CNN-Fusion: An effective and lightweight phishing detection method based on multi-variant ConvNet. Inf. Sci. 2023, 631, 328–345. [Google Scholar] [CrossRef] [Scilit]
- Maneriker, P.; Stokes, J.W.; Lazo, E.G.; Carutasu, D.; Tajaddodianfar, F.; Gururajan, A. Urltran: Improving phishing url detection using transformers. In Milcom 2021–2021 IEEE Military Communications Conference (Milcom); IEEE: Piscataway, NJ, USA, 2021; pp. 197–204. [Google Scholar] [CrossRef] [Scilit]
- Asiri, S.; Xiao, Y.; Li, T. Phishtransformer: A novel approach to detect phishing attacks using url collection and transformer. Electronics 2023, 13, 30. [Google Scholar] [CrossRef] [Scilit]
- Do, N.Q.; Selamat, A.; Fujita, H.; Krejcar, O. An integrated model based on deep learning classifiers and pre-trained transformer for phishing URL detection. Future Gener. Comput. Syst. 2024, 161, 269–285. [Google Scholar] [CrossRef] [Scilit]
- Liu, R.; Wang, Y.; Guo, Z.; Xu, H.; Qin, Z.; Ma, W.; Zhang, F. TransURL: Improving malicious URL detection with multi-layer Transformer encoding and multi-scale pyramid features. Comput. Netw. 2024, 253, 110707. [Google Scholar] [CrossRef] [Scilit]
- Yoon, J.H.; Buu, S.J.; Kim, H.J. Phishing webpage detection via multi-modal integration of HTML DOM graphs and URL features based on graph convolutional and transformer networks. Electronics 2024, 13, 3344. [Google Scholar] [CrossRef] [Scilit]
- Remya, S.; Pillai, M.J.; Aparna, B.S.; Subbareddy, S.R.; Cho, Y.Y. BGL-PhishNet: Phishing website detection using hybrid model-BERT, GNN, and LightGBM. IEEE Access 2025, 13, 47552–47569. [Google Scholar] [CrossRef] [Scilit]
- Gorishniy, Y.; Rubachev, I.; Khrulkov, V.; Babenko, A. Revisiting deep learning models for tabular data. Adv. Neural Inf. Process. Syst. 2021, 34, 18932–18943. Available online: https://proceedings.neurips.cc/paper/2021/hash/9d86d83f925f2149e9edb0ac3b49229c-Abstract.html (accessed on 10 October 2026).
- Grinsztajn, L.; Oyallon, E.; Varoquaux, G. Why do tree-based models still outperform deep learning on typical tabular data? Adv. Neural Inf. Process. Syst. 2022, 35, 507–520. [Google Scholar] [CrossRef] [Scilit]
- Arp, D.; Quiring, E.; Pendlebury, F.; Warnecke, A.; Pierazzi, F.; Wressnegger, C.; Cavallaro, L.; Rieck, K. Dos and don’ts of machine learning in computer security. In 31st USENIX Security Symposium (USENIX Security 22); USENIX Association: Berkeley, CA, USA, 2022; pp. 3971–3988. Available online: https://www.usenix.org/conference/usenixsecurity22/presentation/arp (accessed on 10 October 2026).
- Kapoor, S.; Narayanan, A. Leakage and the reproducibility crisis in machine-learning-based science. Patterns 2023, 4, 100804. [Google Scholar] [CrossRef] [Scilit]
- Koh, P.W.; Sagawa, S.; Marklund, H.; Xie, S.M.; Zhang, M.; Balsubramani, A.; Hu, W.; Yasunaga, M.; Phillips, R.L.; Gao, I.; et al. Wilds: A benchmark of in-the-wild distribution shifts. In International Conference on Machine Learning; PMLR: London, UK, 2021; pp. 5637–5664. Available online: https://proceedings.mlr.press/v139/koh21a.html (accessed on 10 October 2026).
- Silva Filho, T.; Song, H.; Perello-Nieto, M.; Santos-Rodriguez, R.; Kull, M.; Flach, P. Classifier calibration: A survey on how to assess and improve predicted class probabilities. Mach. Learn. 2023, 112, 3211–3260. [Google Scholar] [CrossRef] [Scilit]
- Ma, J.; Saul, L.K.; Savage, S.; Voelker, G.M. Identifying Suspicious URLs: An Application of Large-Scale Online Learning. In Proceedings of the 26th Annual International Conference on Machine Learning (ICML 2009), Montreal, QC, Canada, 14–18 June 2009; pp. 681–688. [Google Scholar] [CrossRef] [Scilit]
- Ma, J.; Saul, L.K.; Savage, S.; Voelker, G.M. Learning to Detect Malicious URLs. ACM Trans. Intell. Syst. Technol. 2011, 2, 30. [Google Scholar] [CrossRef] [Scilit]
- Gama, J.; Žliobaitė, I.; Bifet, A.; Pechenizkiy, M.; Bouchachia, A. A Survey on Concept Drift Adaptation. ACM Comput. Surv. 2014, 46, 44. [Google Scholar] [CrossRef] [Scilit]
- Moreno-Torres, J.G.; Raeder, T.; Alaiz-Rodríguez, R.; Chawla, N.V.; Herrera, F. A unifying view on dataset shift in classification. Pattern Recognit. 2012, 45, 521–530. [Google Scholar] [CrossRef] [Scilit]
- Pendlebury, F.; Pierazzi, F.; Jordaney, R.; Kinder, J.; Cavallaro, L. TESSERACT: Eliminating Experimental Bias in Malware Classification across Space and Time. In Proceedings of the 28th USENIX Security Symposium (USENIX Security 19), Santa Clara, CA, USA, 14–16 August 2019; pp. 729–746. Available online: https://www.usenix.org/conference/usenixsecurity19/presentation/pendlebury (accessed on 3 November 2026).
- Jordaney, R.; Sharad, K.; Dash, S.K.; Wang, Z.; Papini, D.; Nouretdinov, I.; Cavallaro, L. Transcend: Detecting Concept Drift in Malware Classification Models. In Proceedings of the 26th USENIX Security Symposium (USENIX Security 17), Vancouver, BC, Canada, 16–18 August 2017; pp. 625–642. Available online: https://www.usenix.org/conference/usenixsecurity17/technical-sessions/presentation/jordaney (accessed on 3 November 2026).
- Sánchez-Paniagua, M.; Fidalgo, E.; Alegre, E.; Al-Nabki, W.; González-Castro, V. Phishing URL Detection: A Real-Case Scenario Through Login URLs. IEEE Access 2022, 10, 42949–42960. [Google Scholar] [CrossRef] [Scilit]
- Ejaz, A.; Mian, A.N.; Manzoor, S. Life-long phishing attack detection using continual learning. Sci. Rep. 2023, 13, 11488. [Google Scholar] [CrossRef] [Scilit]
- Menon, A.G.; Gressel, G. Concept Drift Detection in Phishing Using Autoencoders. In Machine Learning and Metaheuristics Algorithms, and Applications (SoMMA 2020); Thampi, S.M., Piramuthu, S., Li, K.-C., Berretti, S., Wozniak, M., Singh, D., Eds.; Communications in Computer and Information Science; Springer: Singapore, 2021; Volume 1366, pp. 208–220. [Google Scholar] [CrossRef] [Scilit]
- Mehta, P.A.; Degadwala, S. A Review of Feature Optimization and Explainable AI for Phishing URL Detection. Int. J. Sci. Res. Artif. Intell. Mach. Learn. 2026, 2, 71–80. [Google Scholar] [CrossRef] [Scilit]
- Shrivastava, A.; Gupta, A.; Girshick, R. Training Region-Based Object Detectors with Online Hard Example Mining. In Proceedings of the 2016 IEEE Conference on Computer Vision and Pattern Recognition (CVPR), Las Vegas, NV, USA, 27–30 June 2016; pp. 761–769. [Google Scholar] [CrossRef] [Scilit]
- Tong, X.; Feng, Y.; Li, J.J. Neyman-Pearson classification algorithms and NP receiver operating characteristics. Sci. Adv. 2018, 4, eaao1659. [Google Scholar] [CrossRef] [Scilit]
- Narasimhan, H.; Agarwal, S. A Structural SVM Based Approach for Optimizing Partial AUC. In Proceedings of the 30th International Conference on Machine Learning (ICML 2013), Atlanta, GA, USA, 17–19 June 2013; Dasgupta, S., McAllester, D., Eds.; PMLR: London, UK, 2013; Volume 28, pp. 516–524. Available online: https://proceedings.mlr.press/v28/narasimhan13.html (accessed on 3 November 2026).
- McClish, D.K. Analyzing a Portion of the ROC Curve. Med. Decis. Mak. 1989, 9, 190–195. [Google Scholar] [CrossRef] [Scilit]
- Pan, S.J.; Yang, Q. A Survey on Transfer Learning. IEEE Trans. Knowl. Data Eng. 2010, 22, 1345–1359. [Google Scholar] [CrossRef] [Scilit]
- Kumar, A.; Raghunathan, A.; Jones, R.M.; Ma, T.; Liang, P. Fine-Tuning can Distort Pretrained Features and Underperform Out-of-Distribution. In Proceedings of the 10th International Conference on Learning Representations (ICLR 2022), Virtual, 25–29 April 2022; Available online: https://openreview.net/forum?id=UYneFzXSJWh (accessed on 3 November 2026).
- Jacobs, R.A.; Jordan, M.I.; Nowlan, S.J.; Hinton, G.E. Adaptive Mixtures of Local Experts. Neural Comput. 1991, 3, 79–87. [Google Scholar] [CrossRef] [Scilit]
- Wolpert, D.H. Stacked generalization. Neural Netw. 1992, 5, 241–259. [Google Scholar] [CrossRef] [Scilit]
- Cruz, R.M.O.; Sabourin, R.; Cavalcanti, G.D.C. Dynamic classifier selection: Recent advances and perspectives. Inf. Fusion 2018, 41, 195–216. [Google Scholar] [CrossRef] [Scilit]
- Viola, P.; Jones, M. Rapid Object Detection Using a Boosted Cascade of Simple Features. In Proceedings of the 2001 IEEE Computer Society Conference on Computer Vision and Pattern Recognition (CVPR 2001), Kauai, HI, USA, 8–14 December 2001; Volume 1, pp. I-511–I-518. [Google Scholar] [CrossRef] [Scilit]
- Melendrez, A.; Goncalves, H.; Alomari, Z.; Shao, Y. Boosted Ensemble Voting for Intrusion Detection: A SHAP-Driven Analysis of XGBoost and CatBoost. In Proceedings of the 2025 IEEE International Conference on Service Operations and Logistics, and Informatics (SOLI), Singapore, 28–30 September 2025; pp. 25–32. [Google Scholar] [CrossRef] [Scilit]
- Patil, D.; Gedam, M.; Dhavale, C. Adversarially Robust and Semantically Aware Phishing Detection using Calibrated Multimodal Learning. Res. Sq. 2026. preprint (Version 1). [Google Scholar] [CrossRef] [Scilit]
- Hannousse, A.; Yahiouche, S. Towards Benchmark Datasets for Machine Learning Based Website Phishing Detection: An Experimental Study. Eng. Appl. Artif. Intell. 2021, 104, 104347. [Google Scholar] [CrossRef] [Scilit]
- Zhu, D.; Li, G.; Wang, B.; Wu, X.; Yang, T. When AUC Meets DRO: Optimizing Partial AUC for Deep Learning with Non-Convex Convergence Guarantee. In Proceedings of the 39th International Conference on Machine Learning (ICML 2022), Baltimore, MD, USA, 17–23 July 2022; PMLR: London, UK, 2022; Volume 162, pp. 27548–27573. Available online: https://proceedings.mlr.press/v162/zhu22g.html (accessed on 10 November 2026).
- Lopez-Paz, D.; Oquab, M. Revisiting Classifier Two-Sample Tests. In Proceedings of the 5th International Conference on Learning Representations (ICLR 2017), Toulon, France, 24–26 April 2017; Available online: https://arxiv.org/abs/1610.06545 (accessed on 10 November 2026).
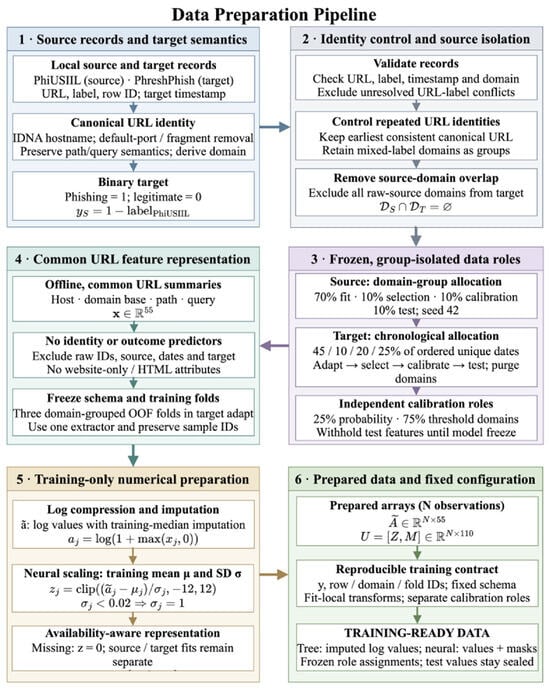
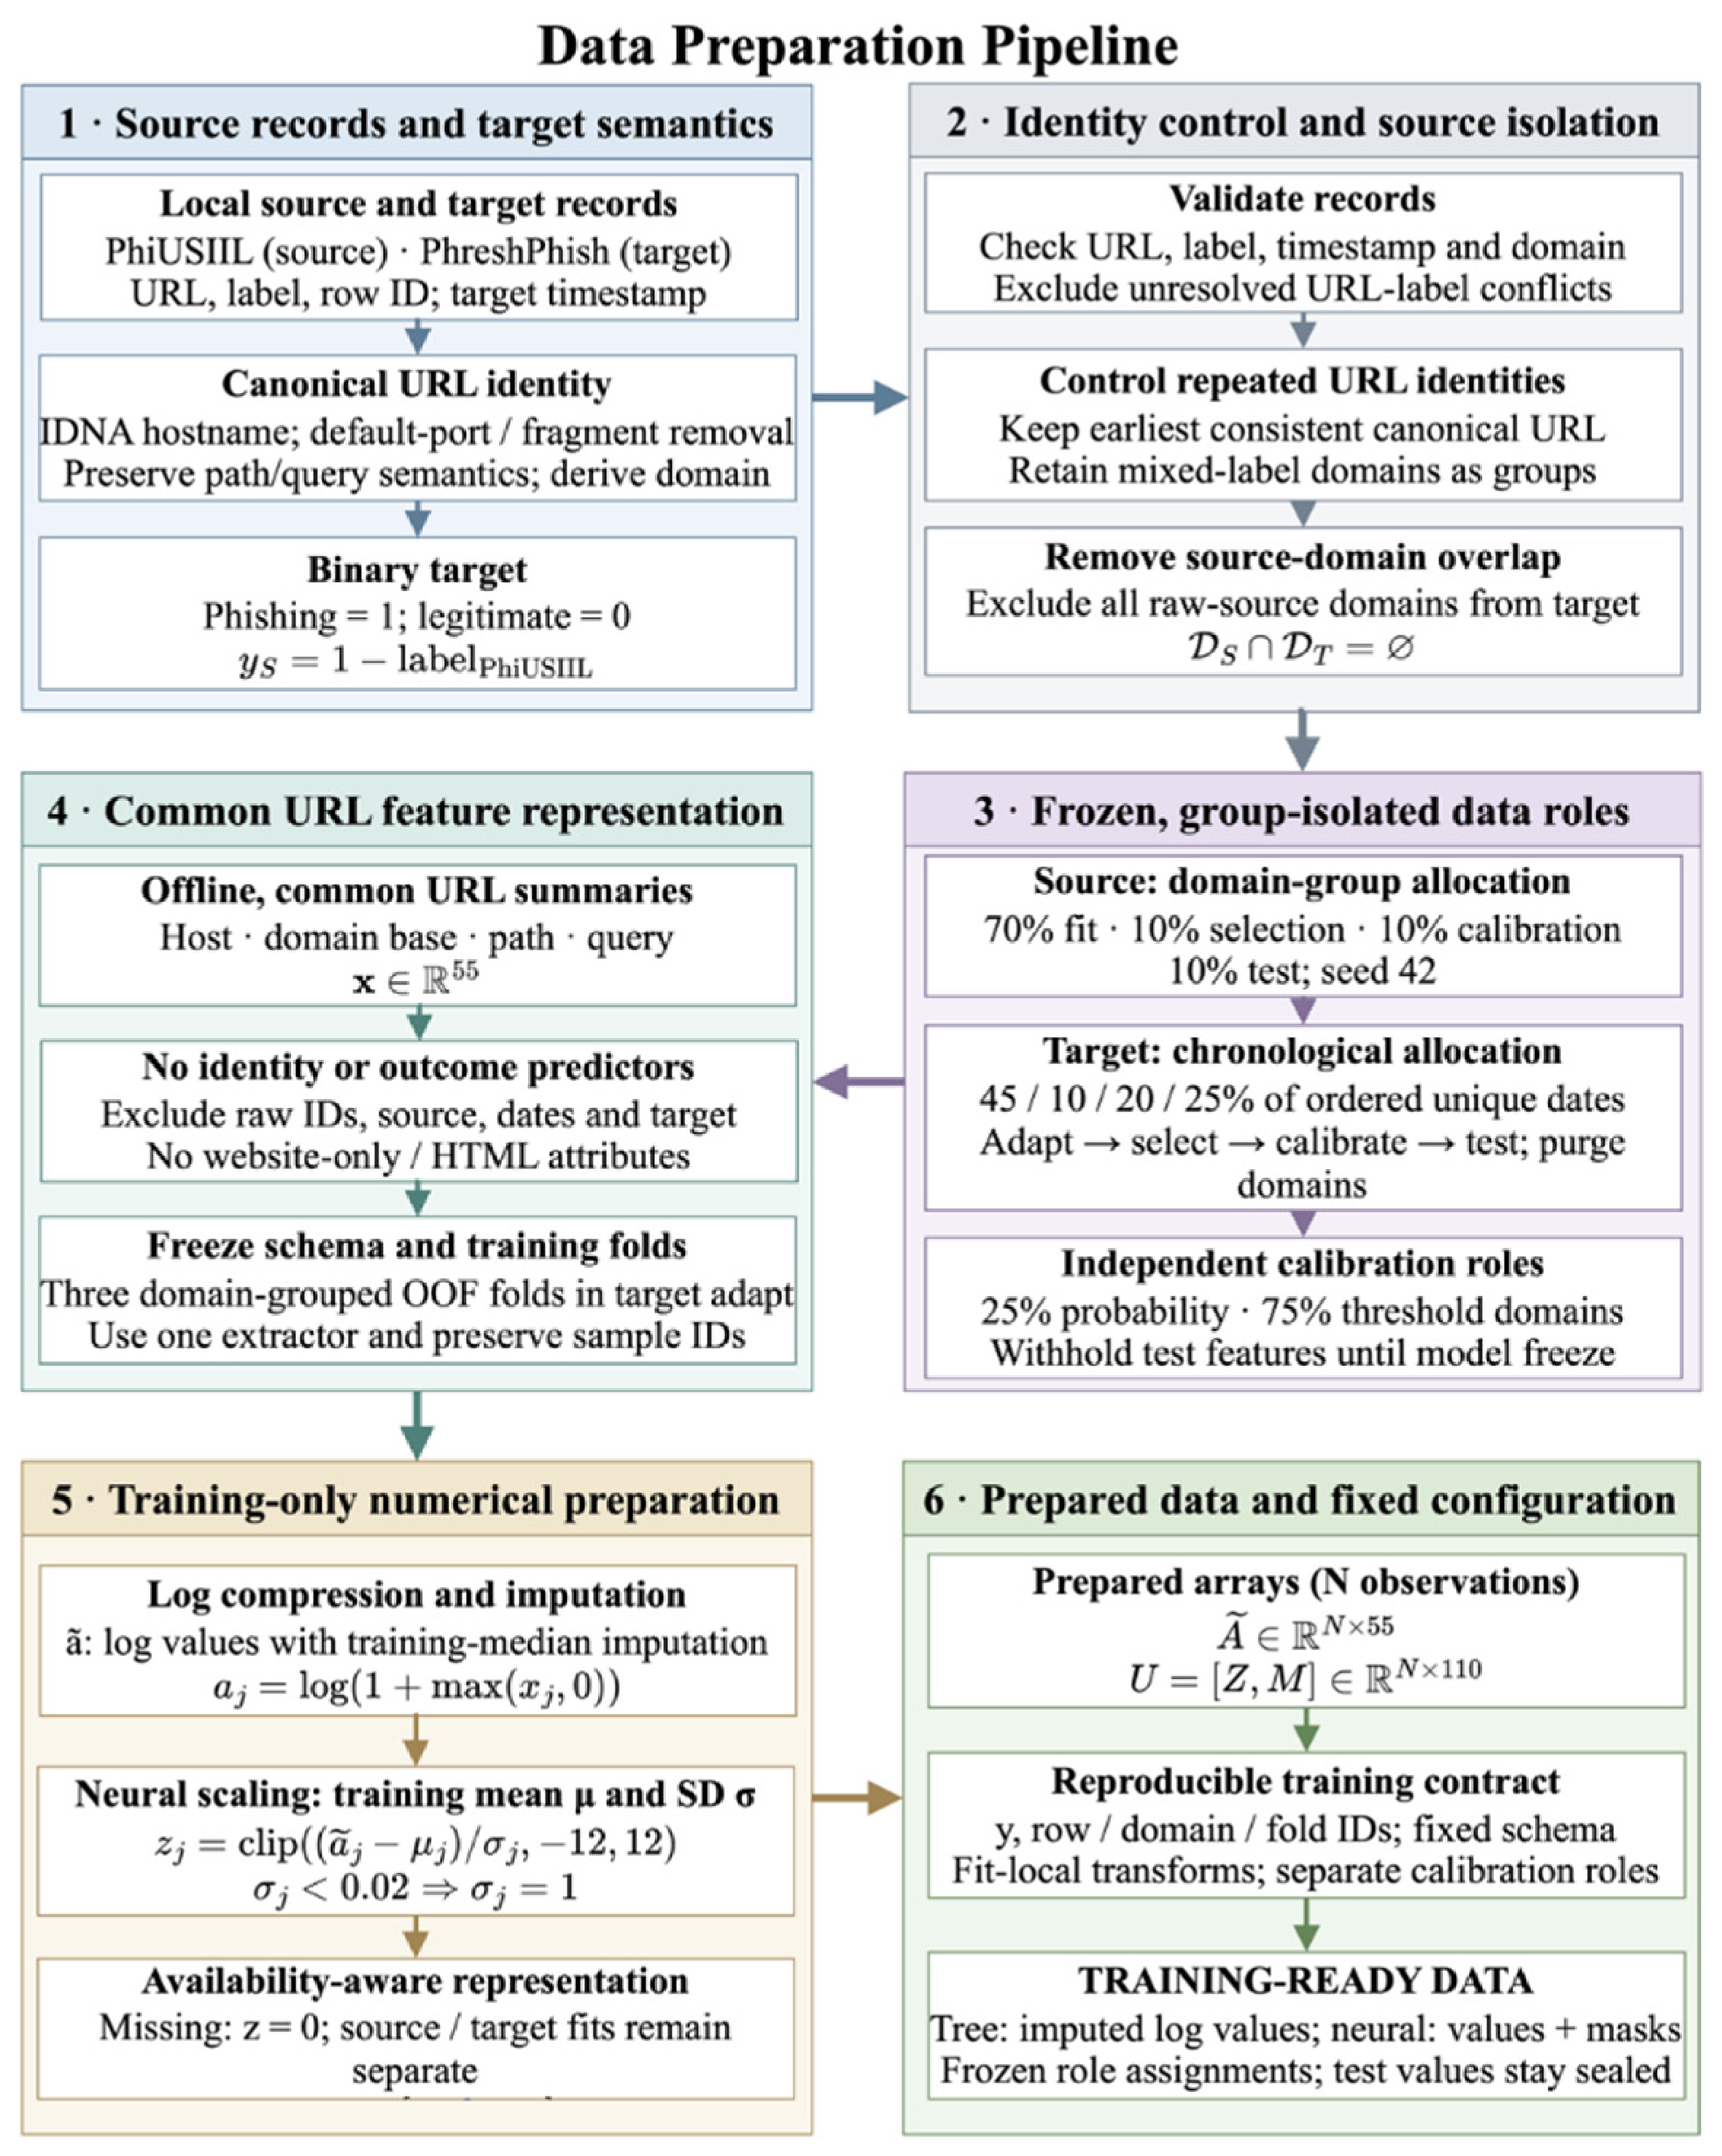
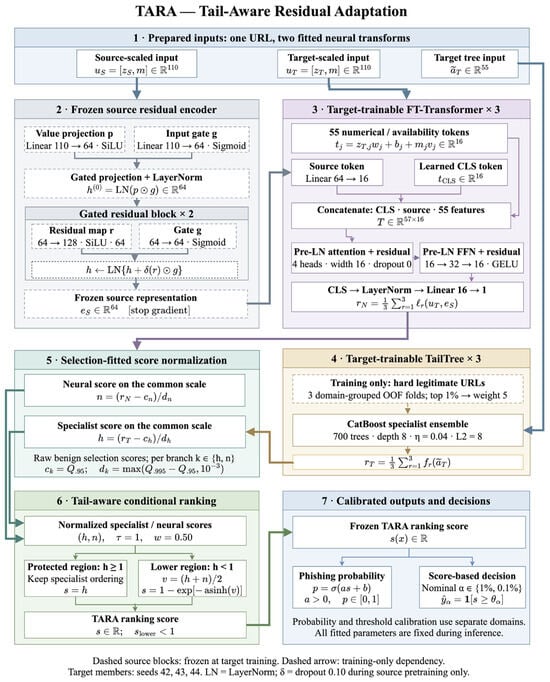
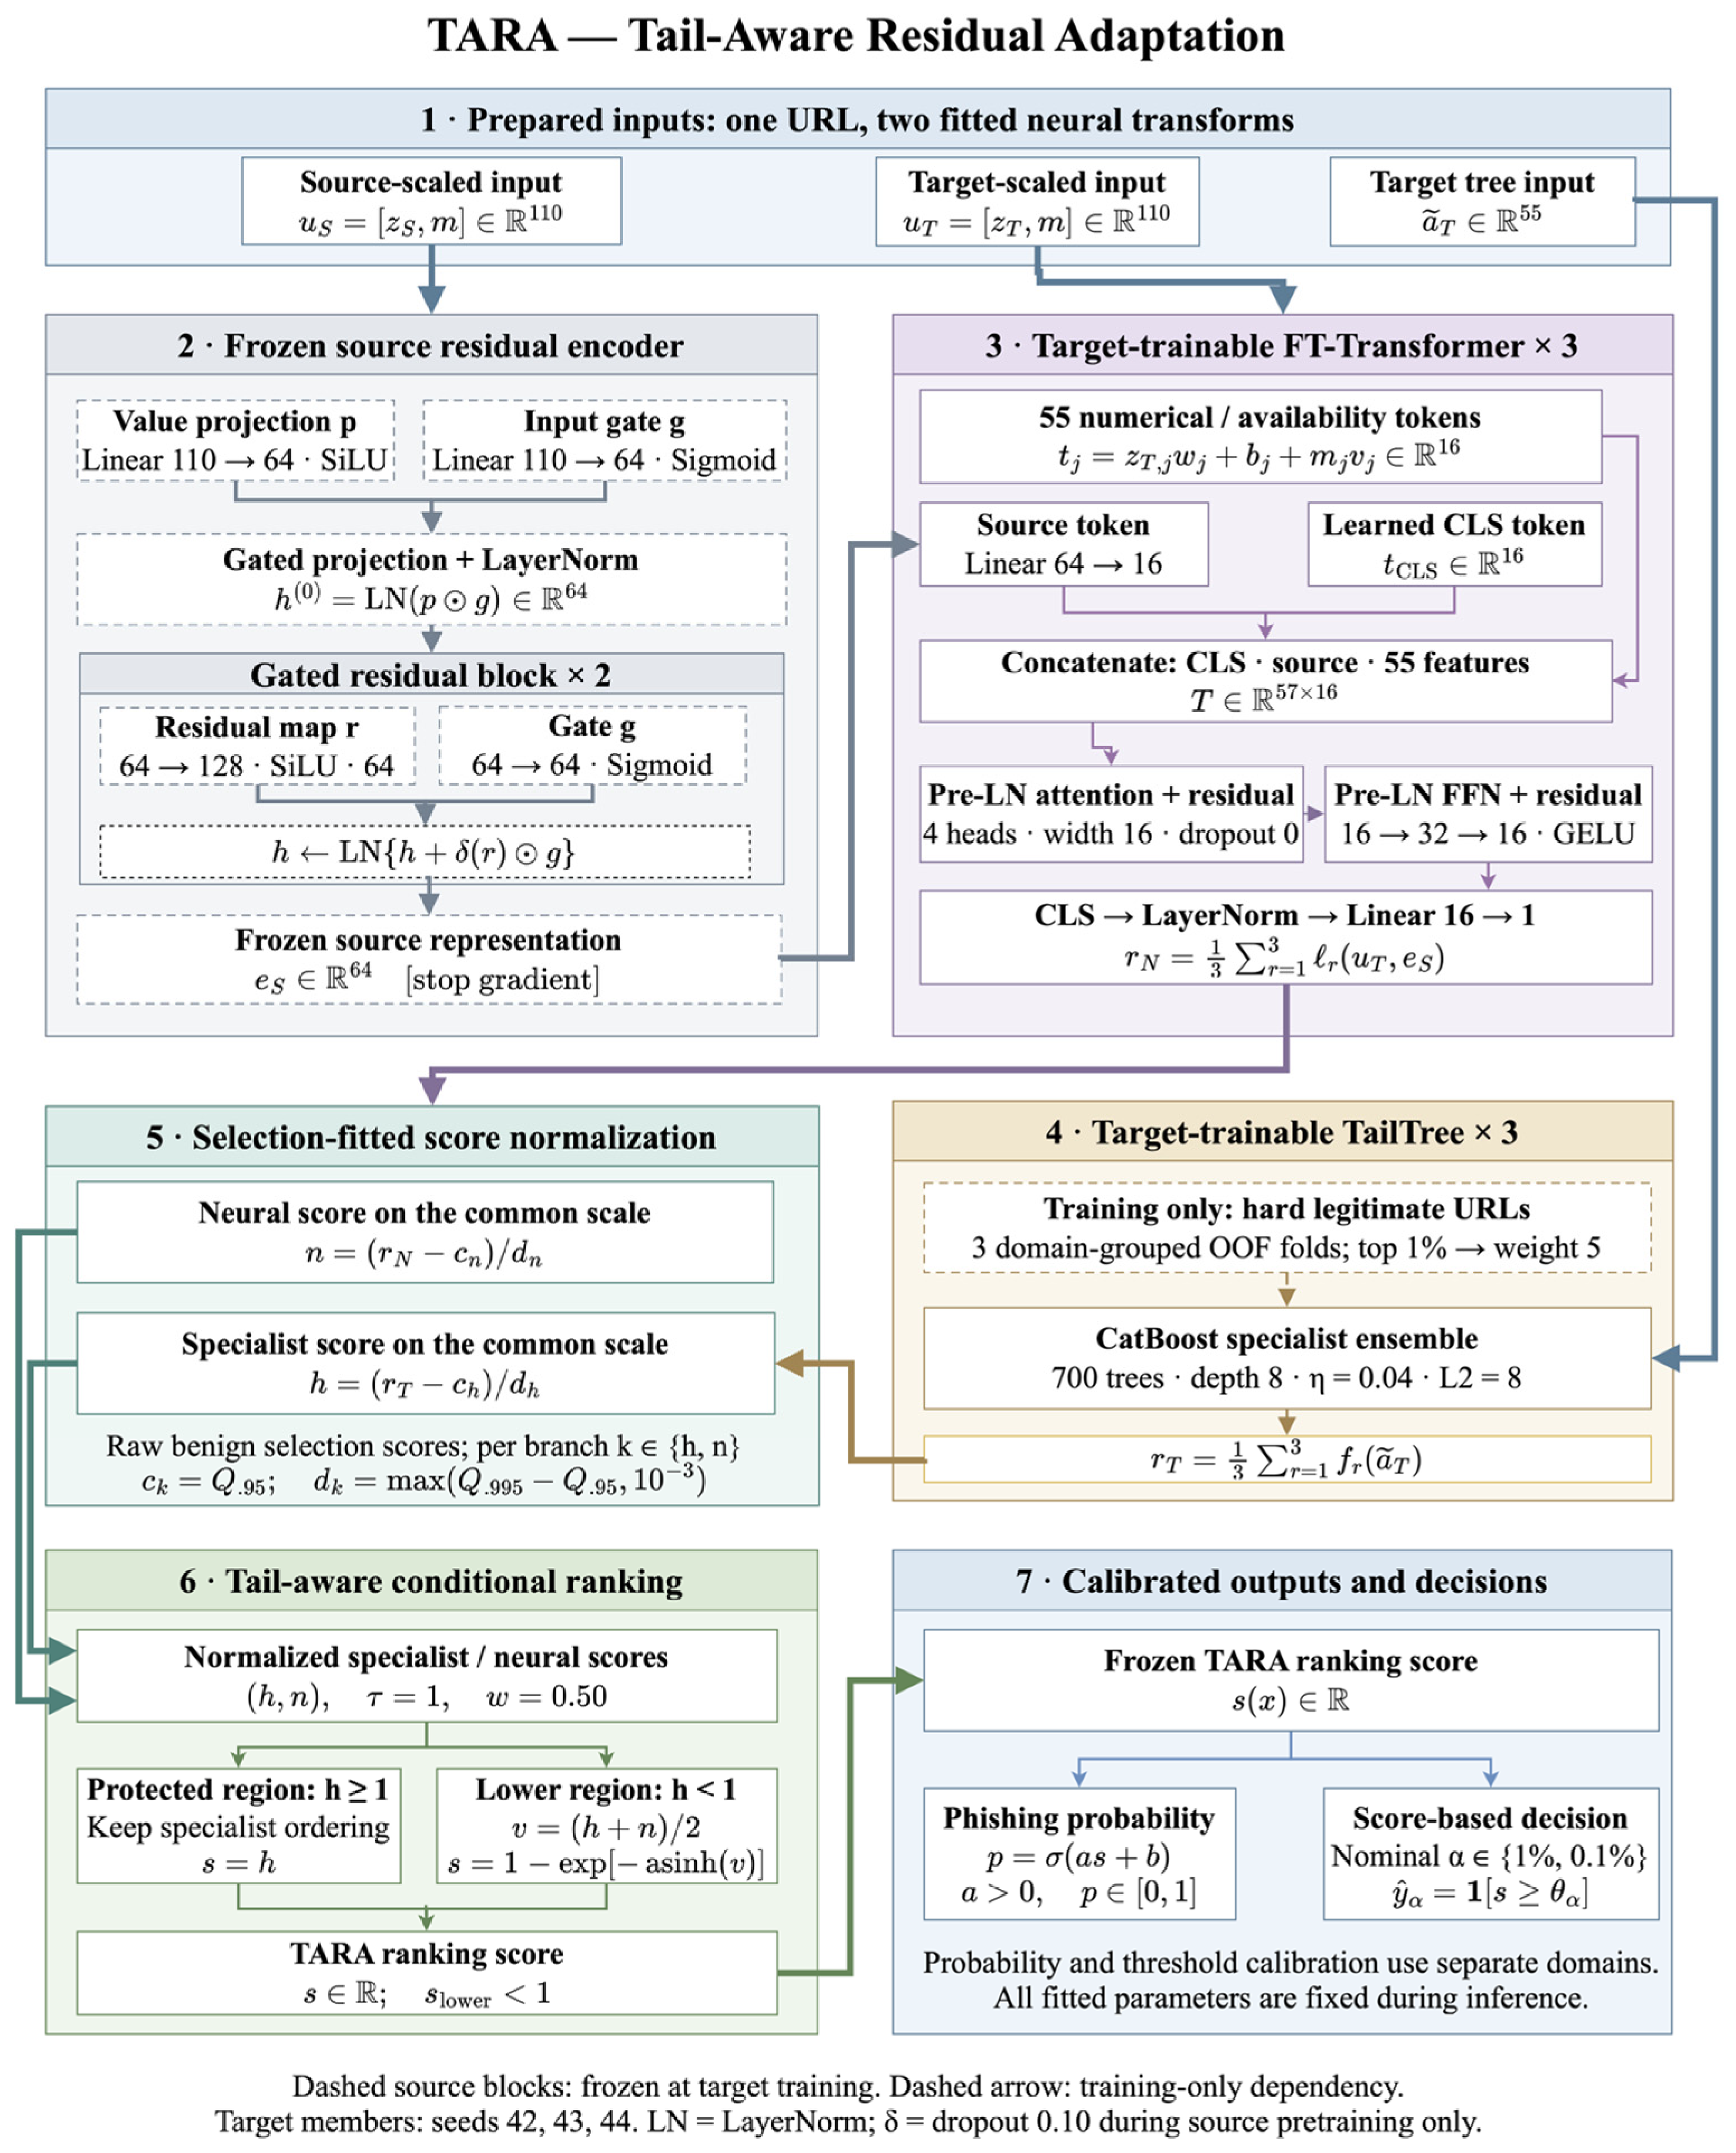
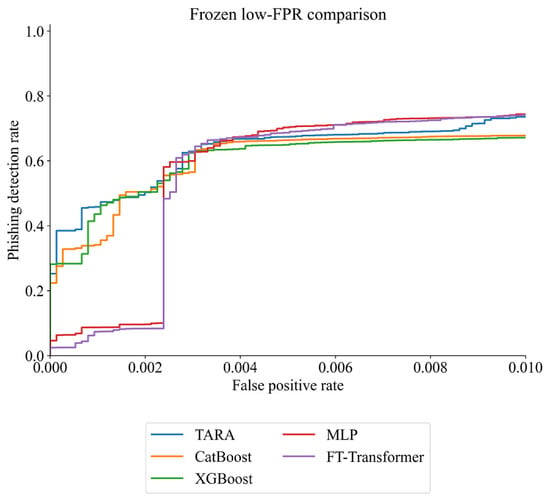
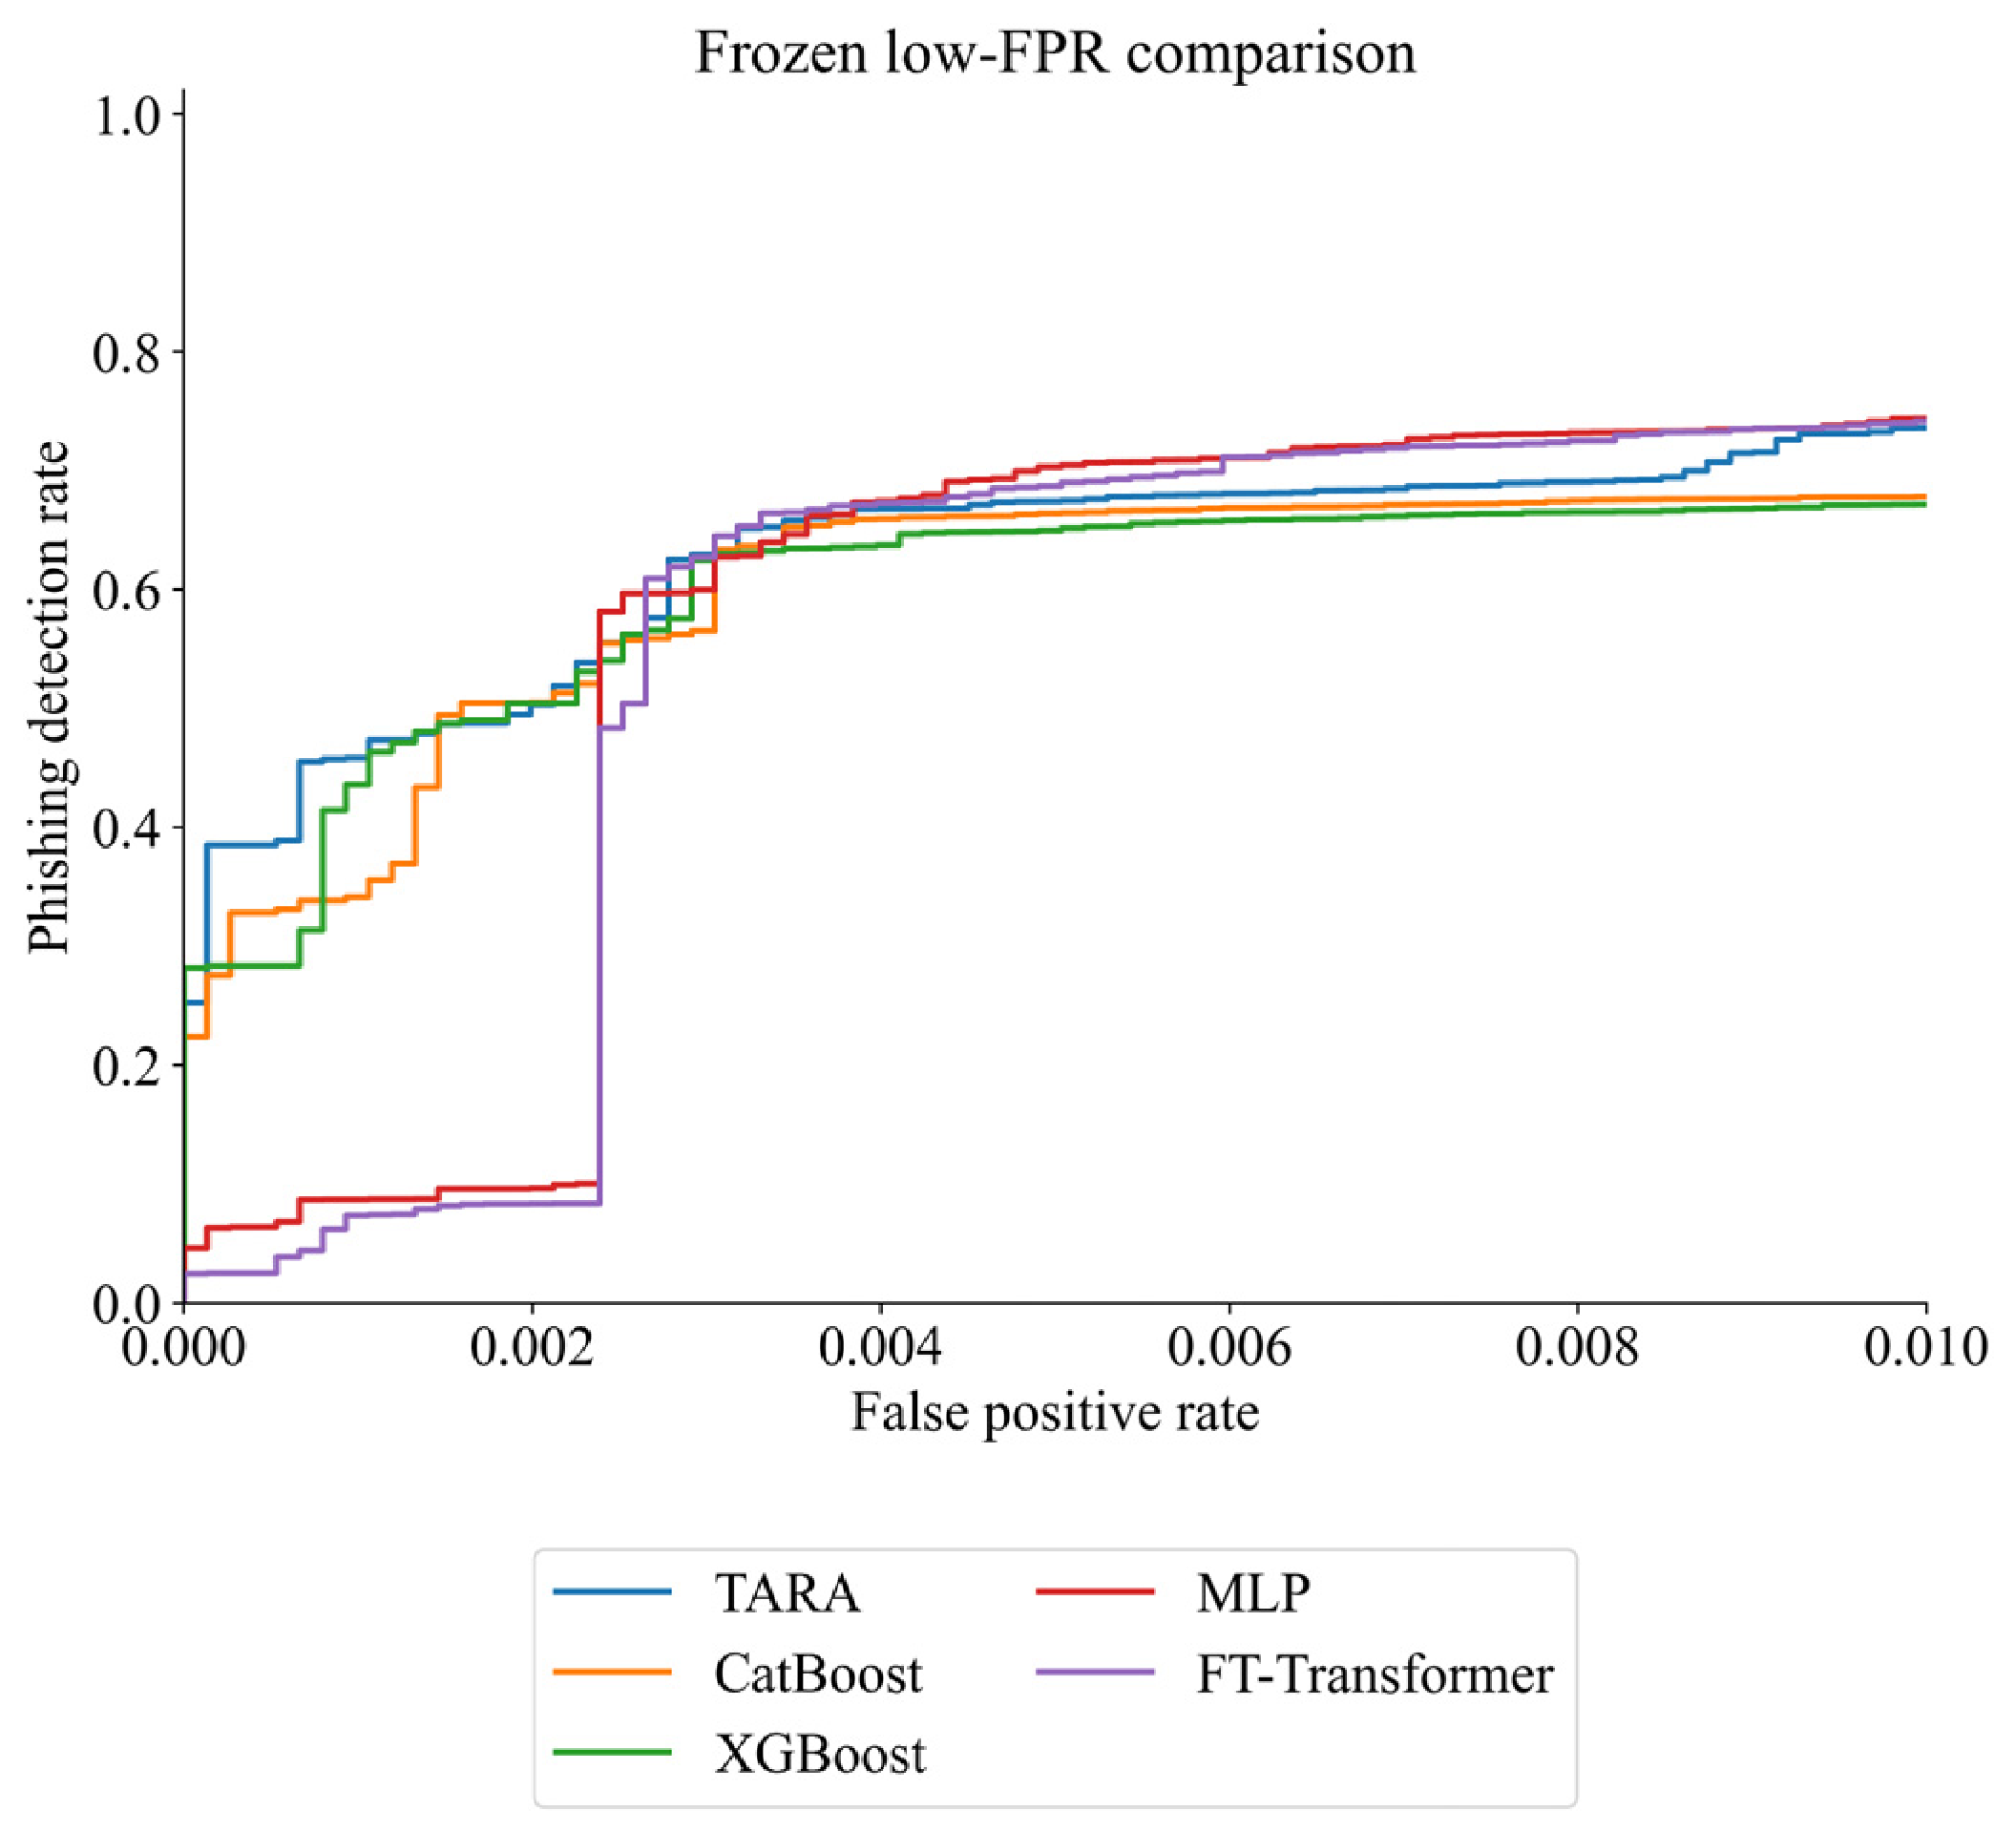
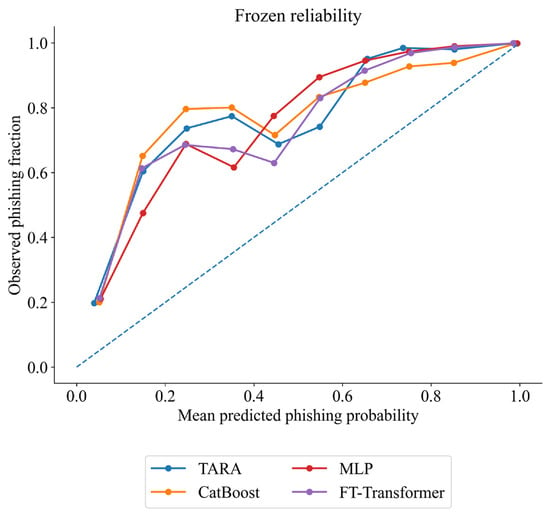
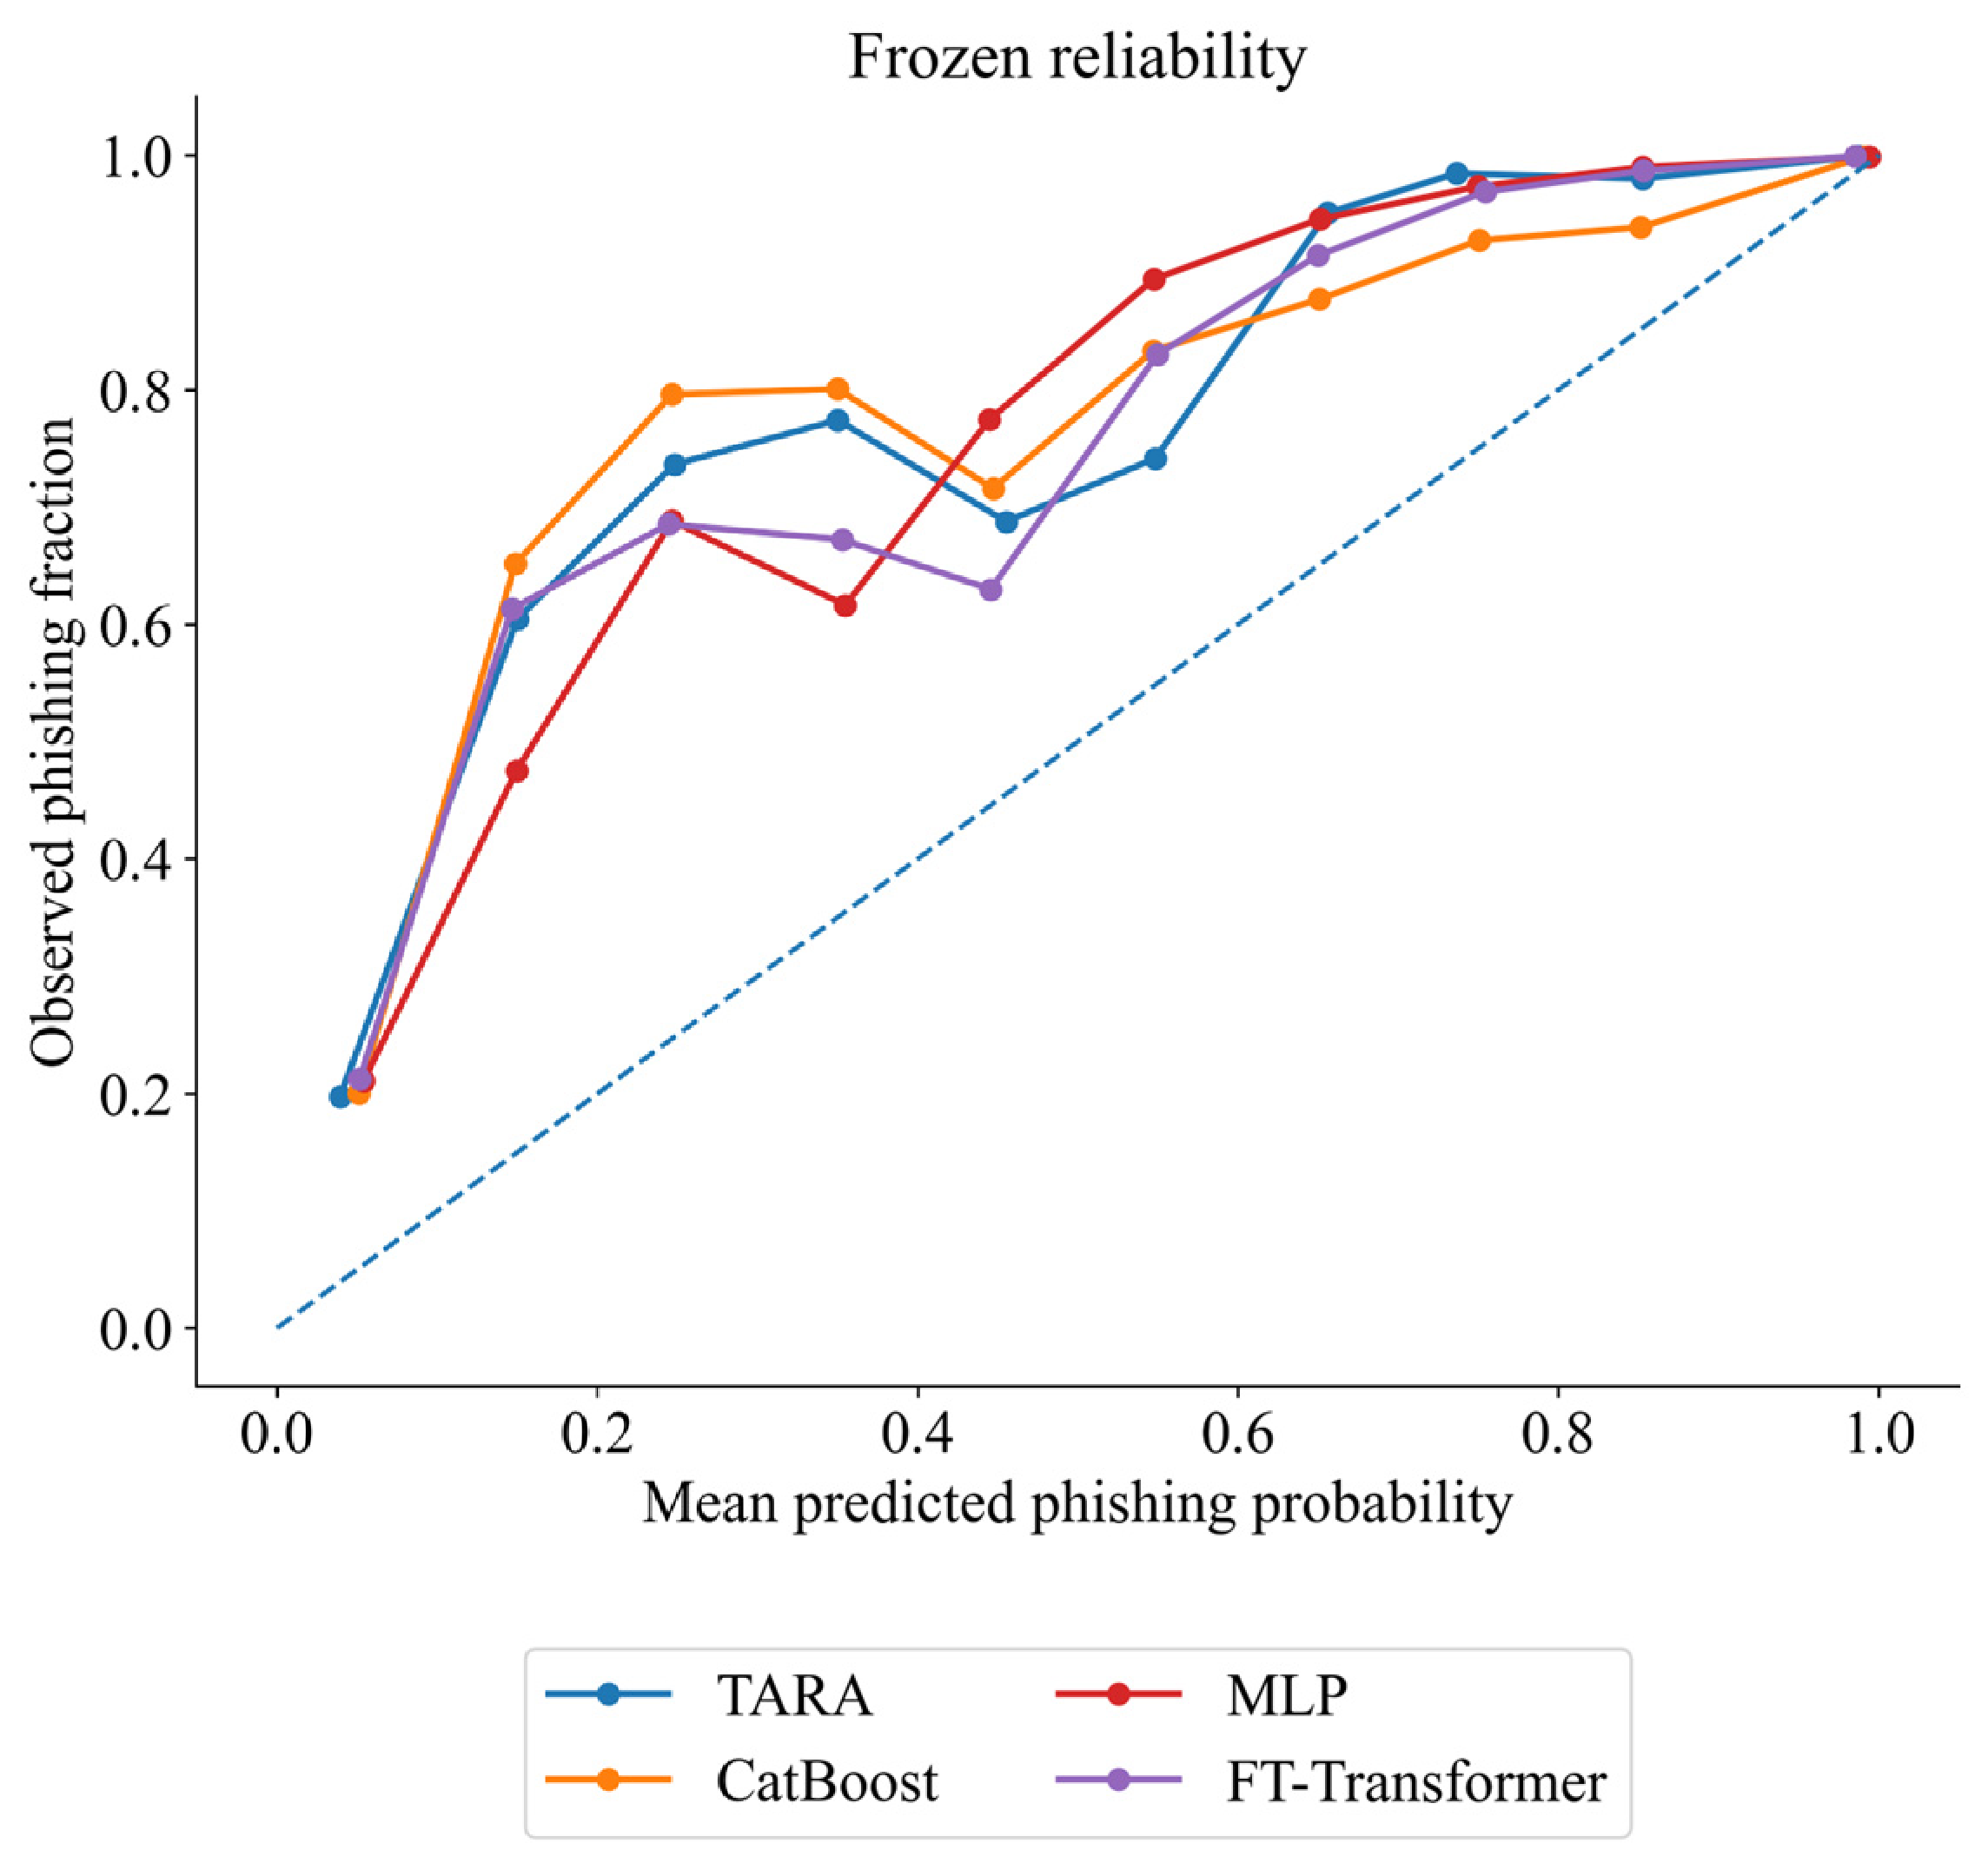
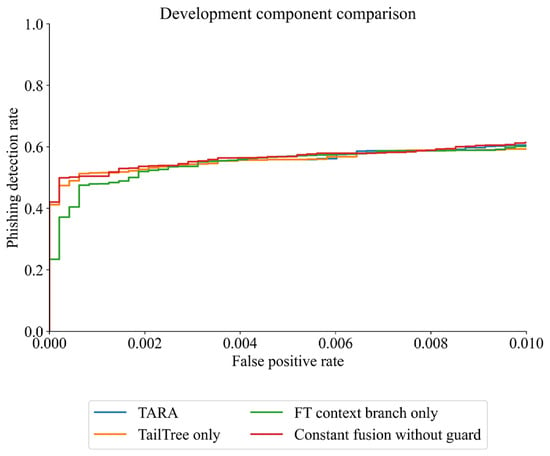
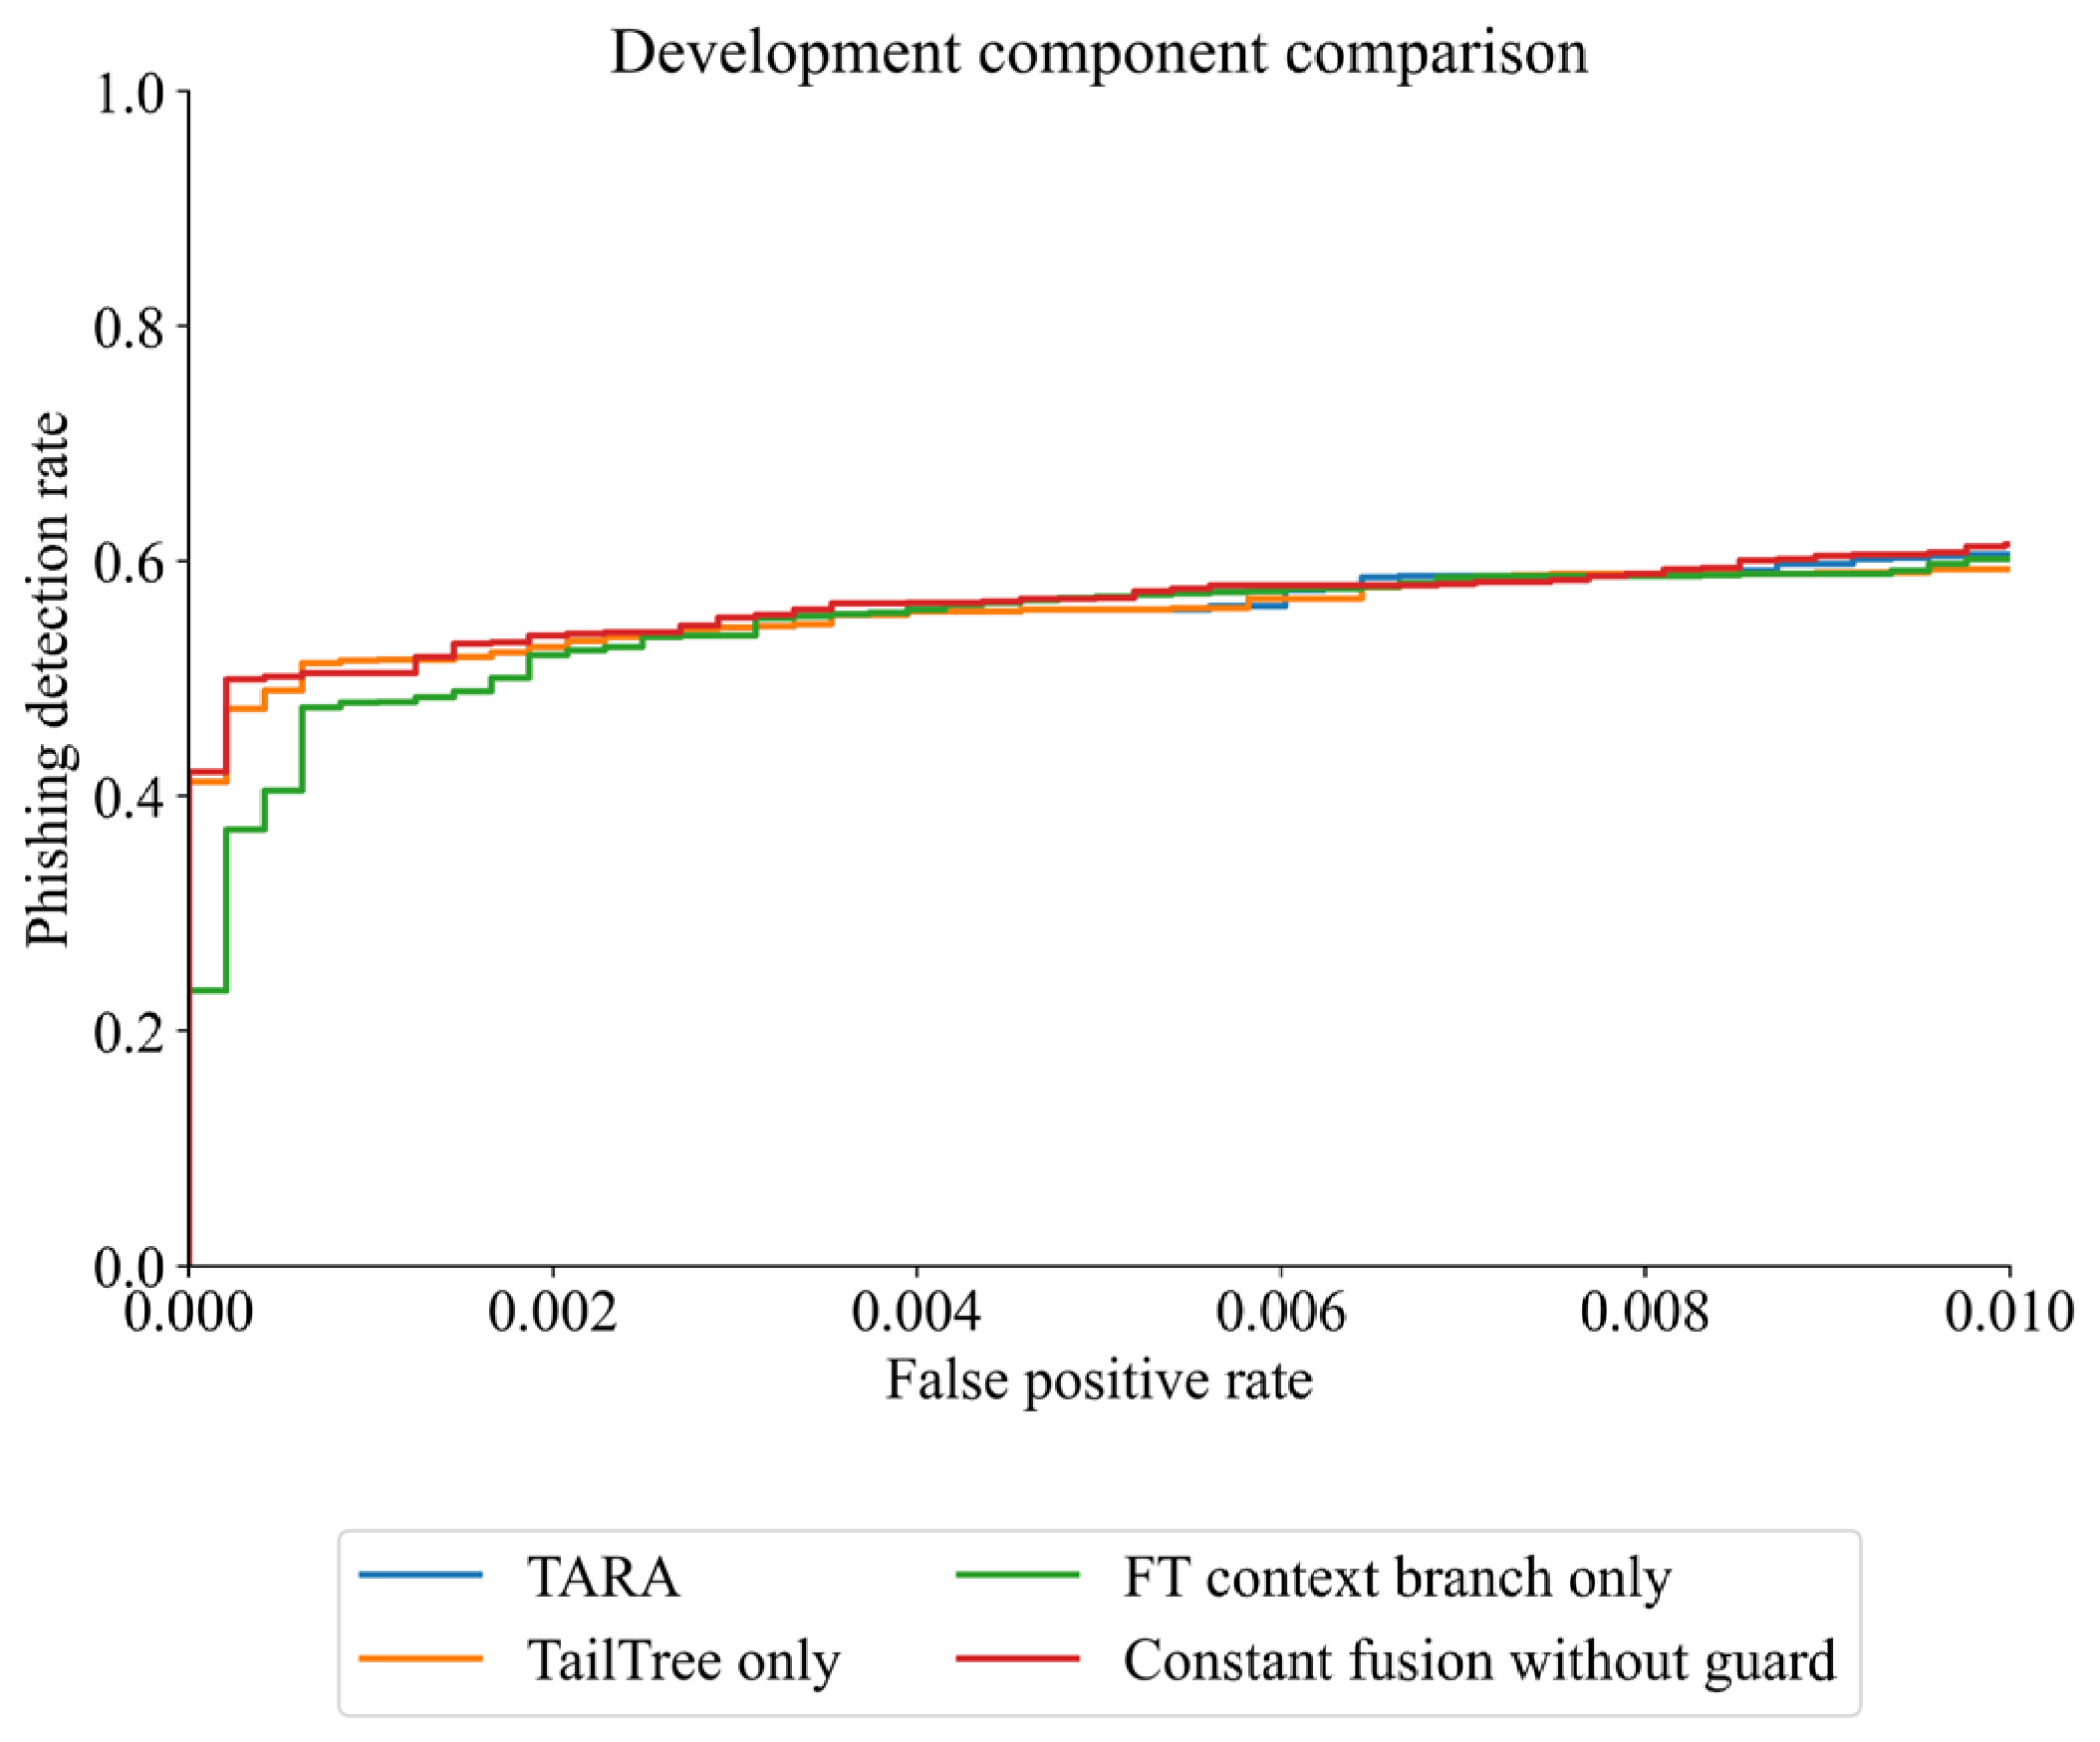
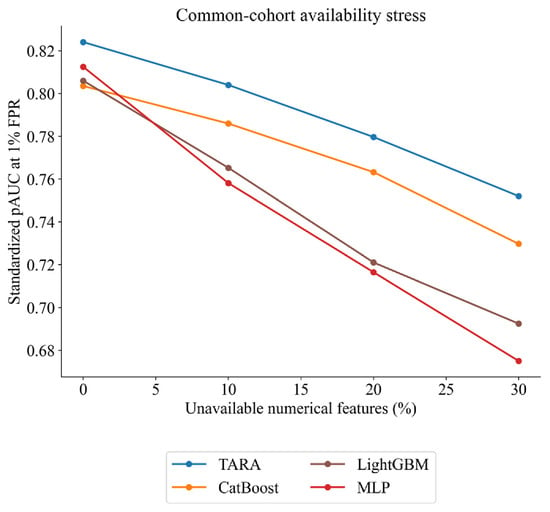
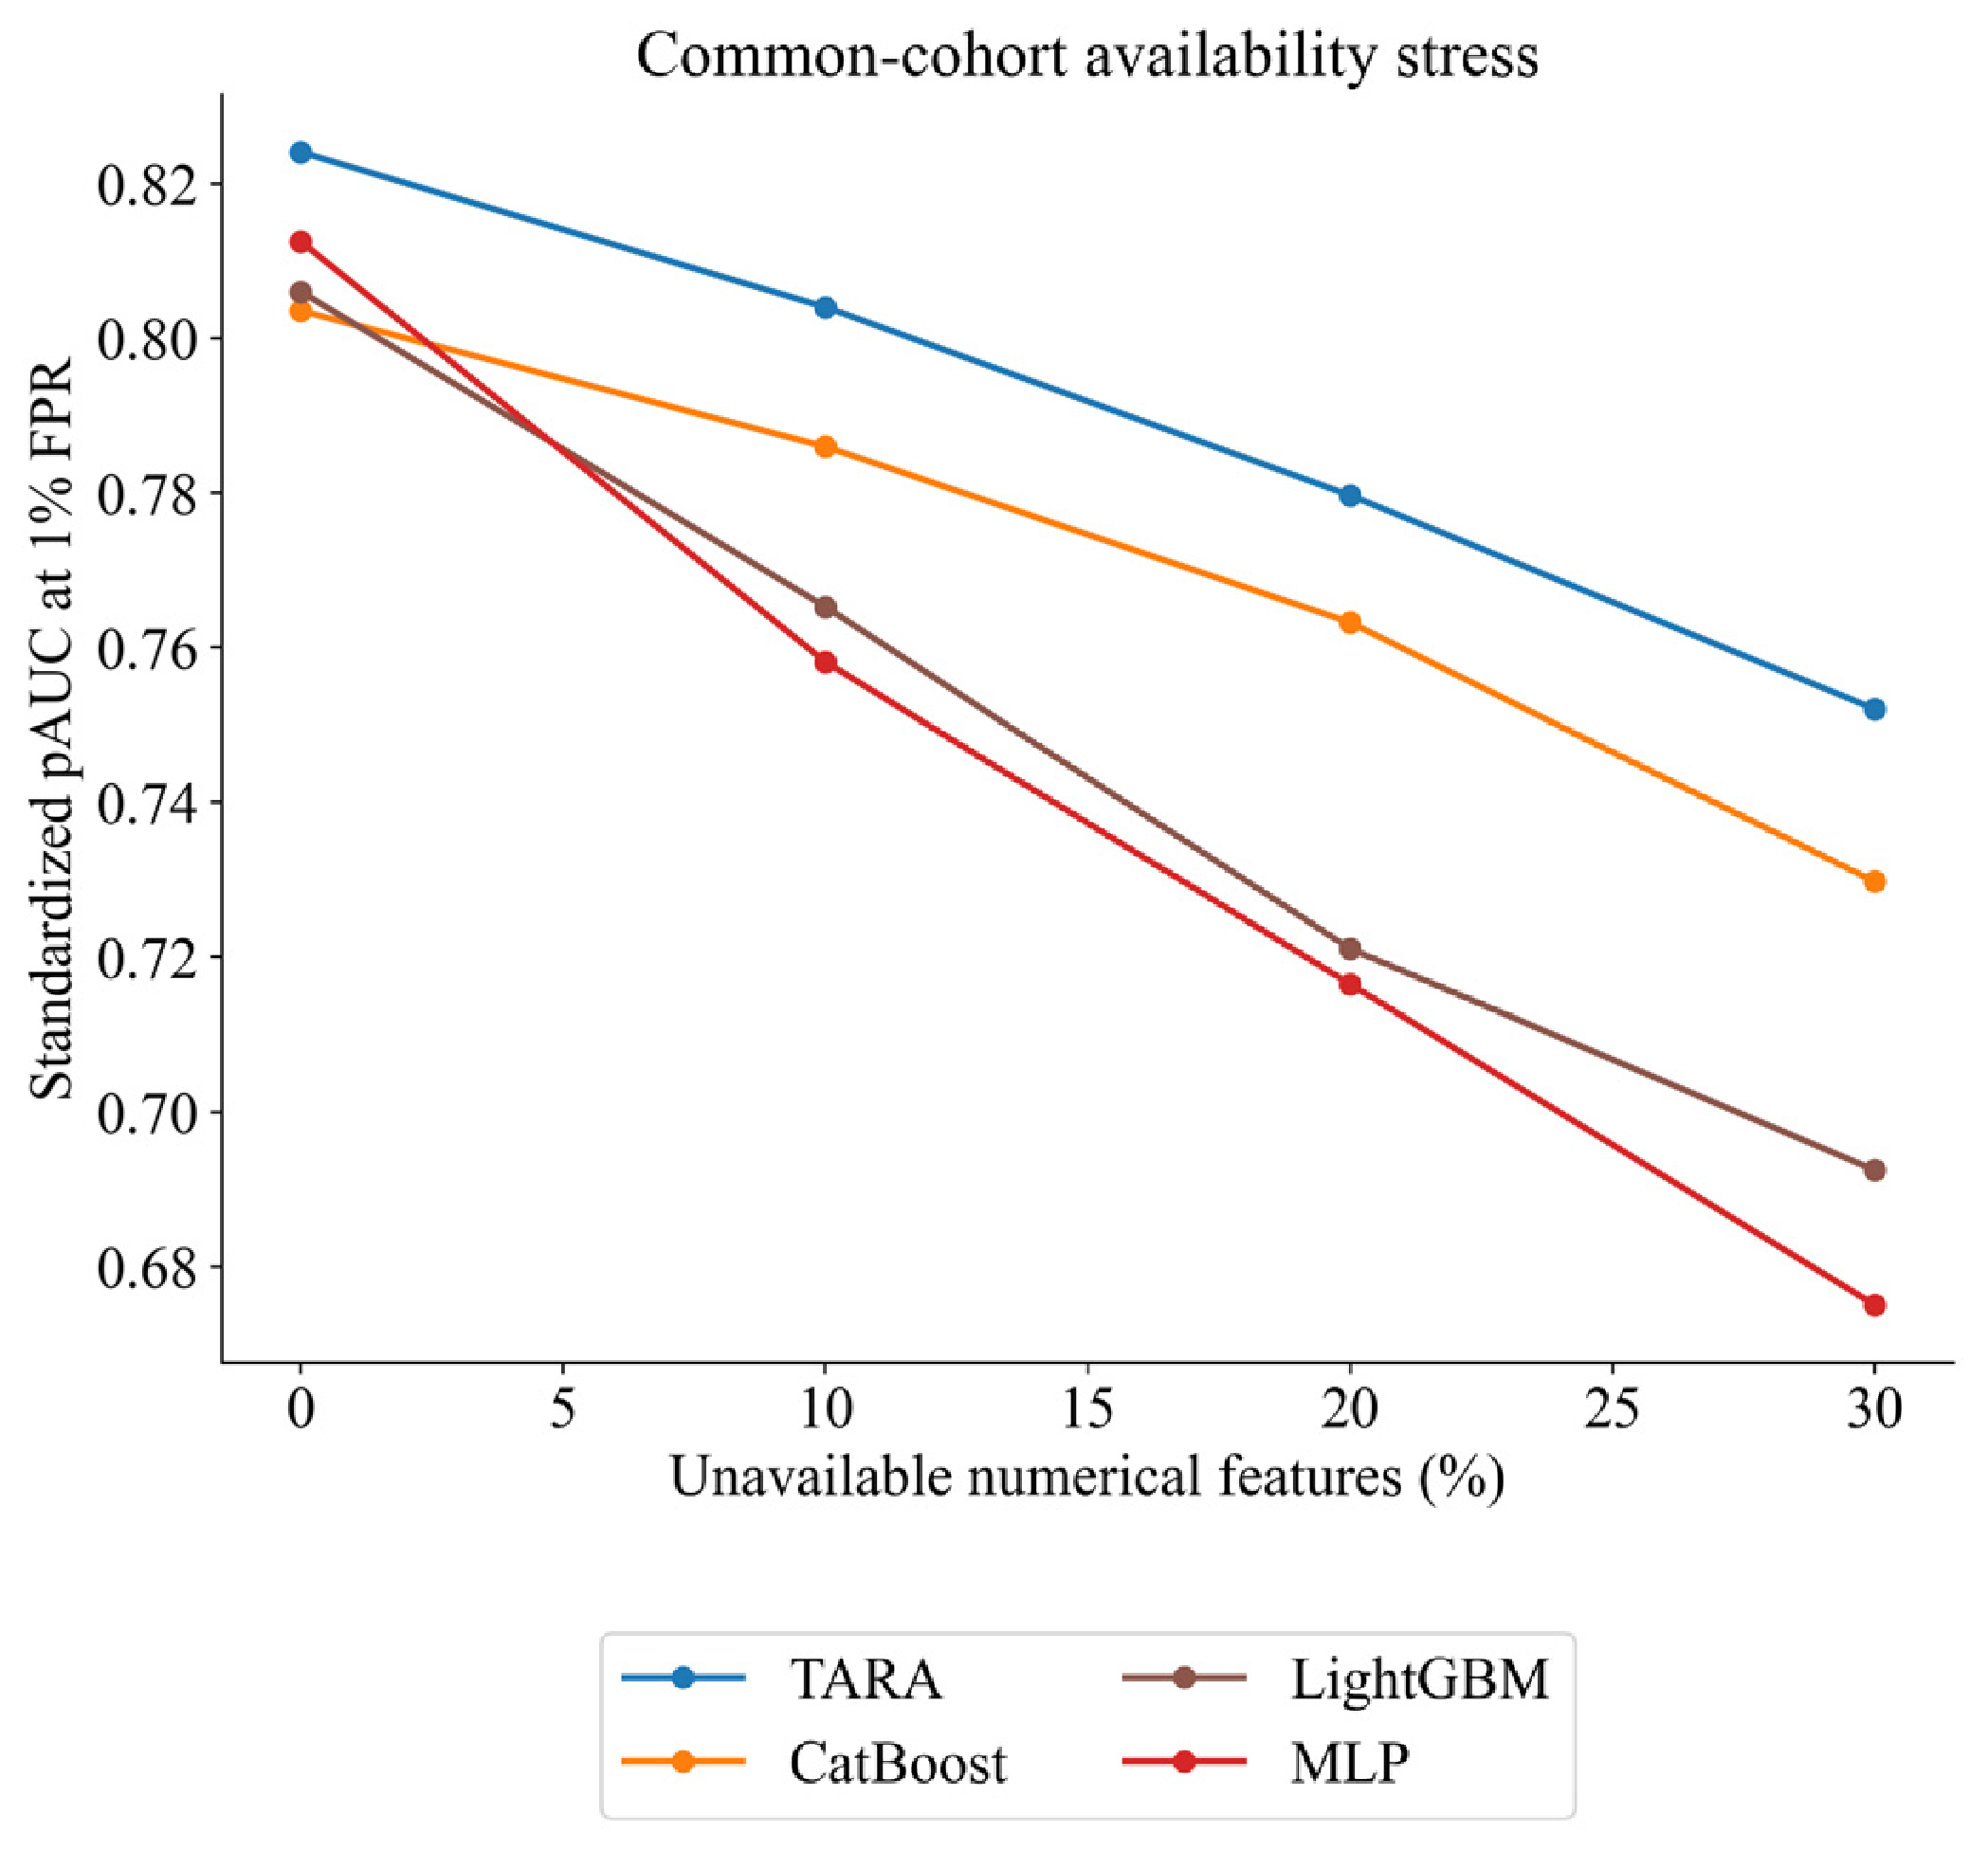
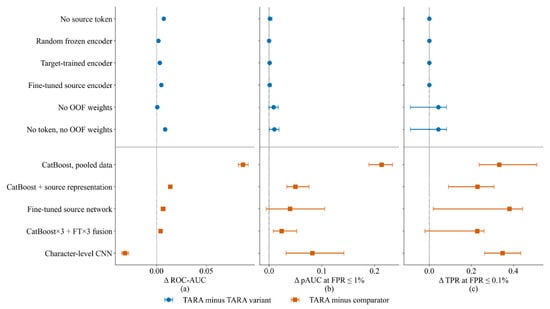
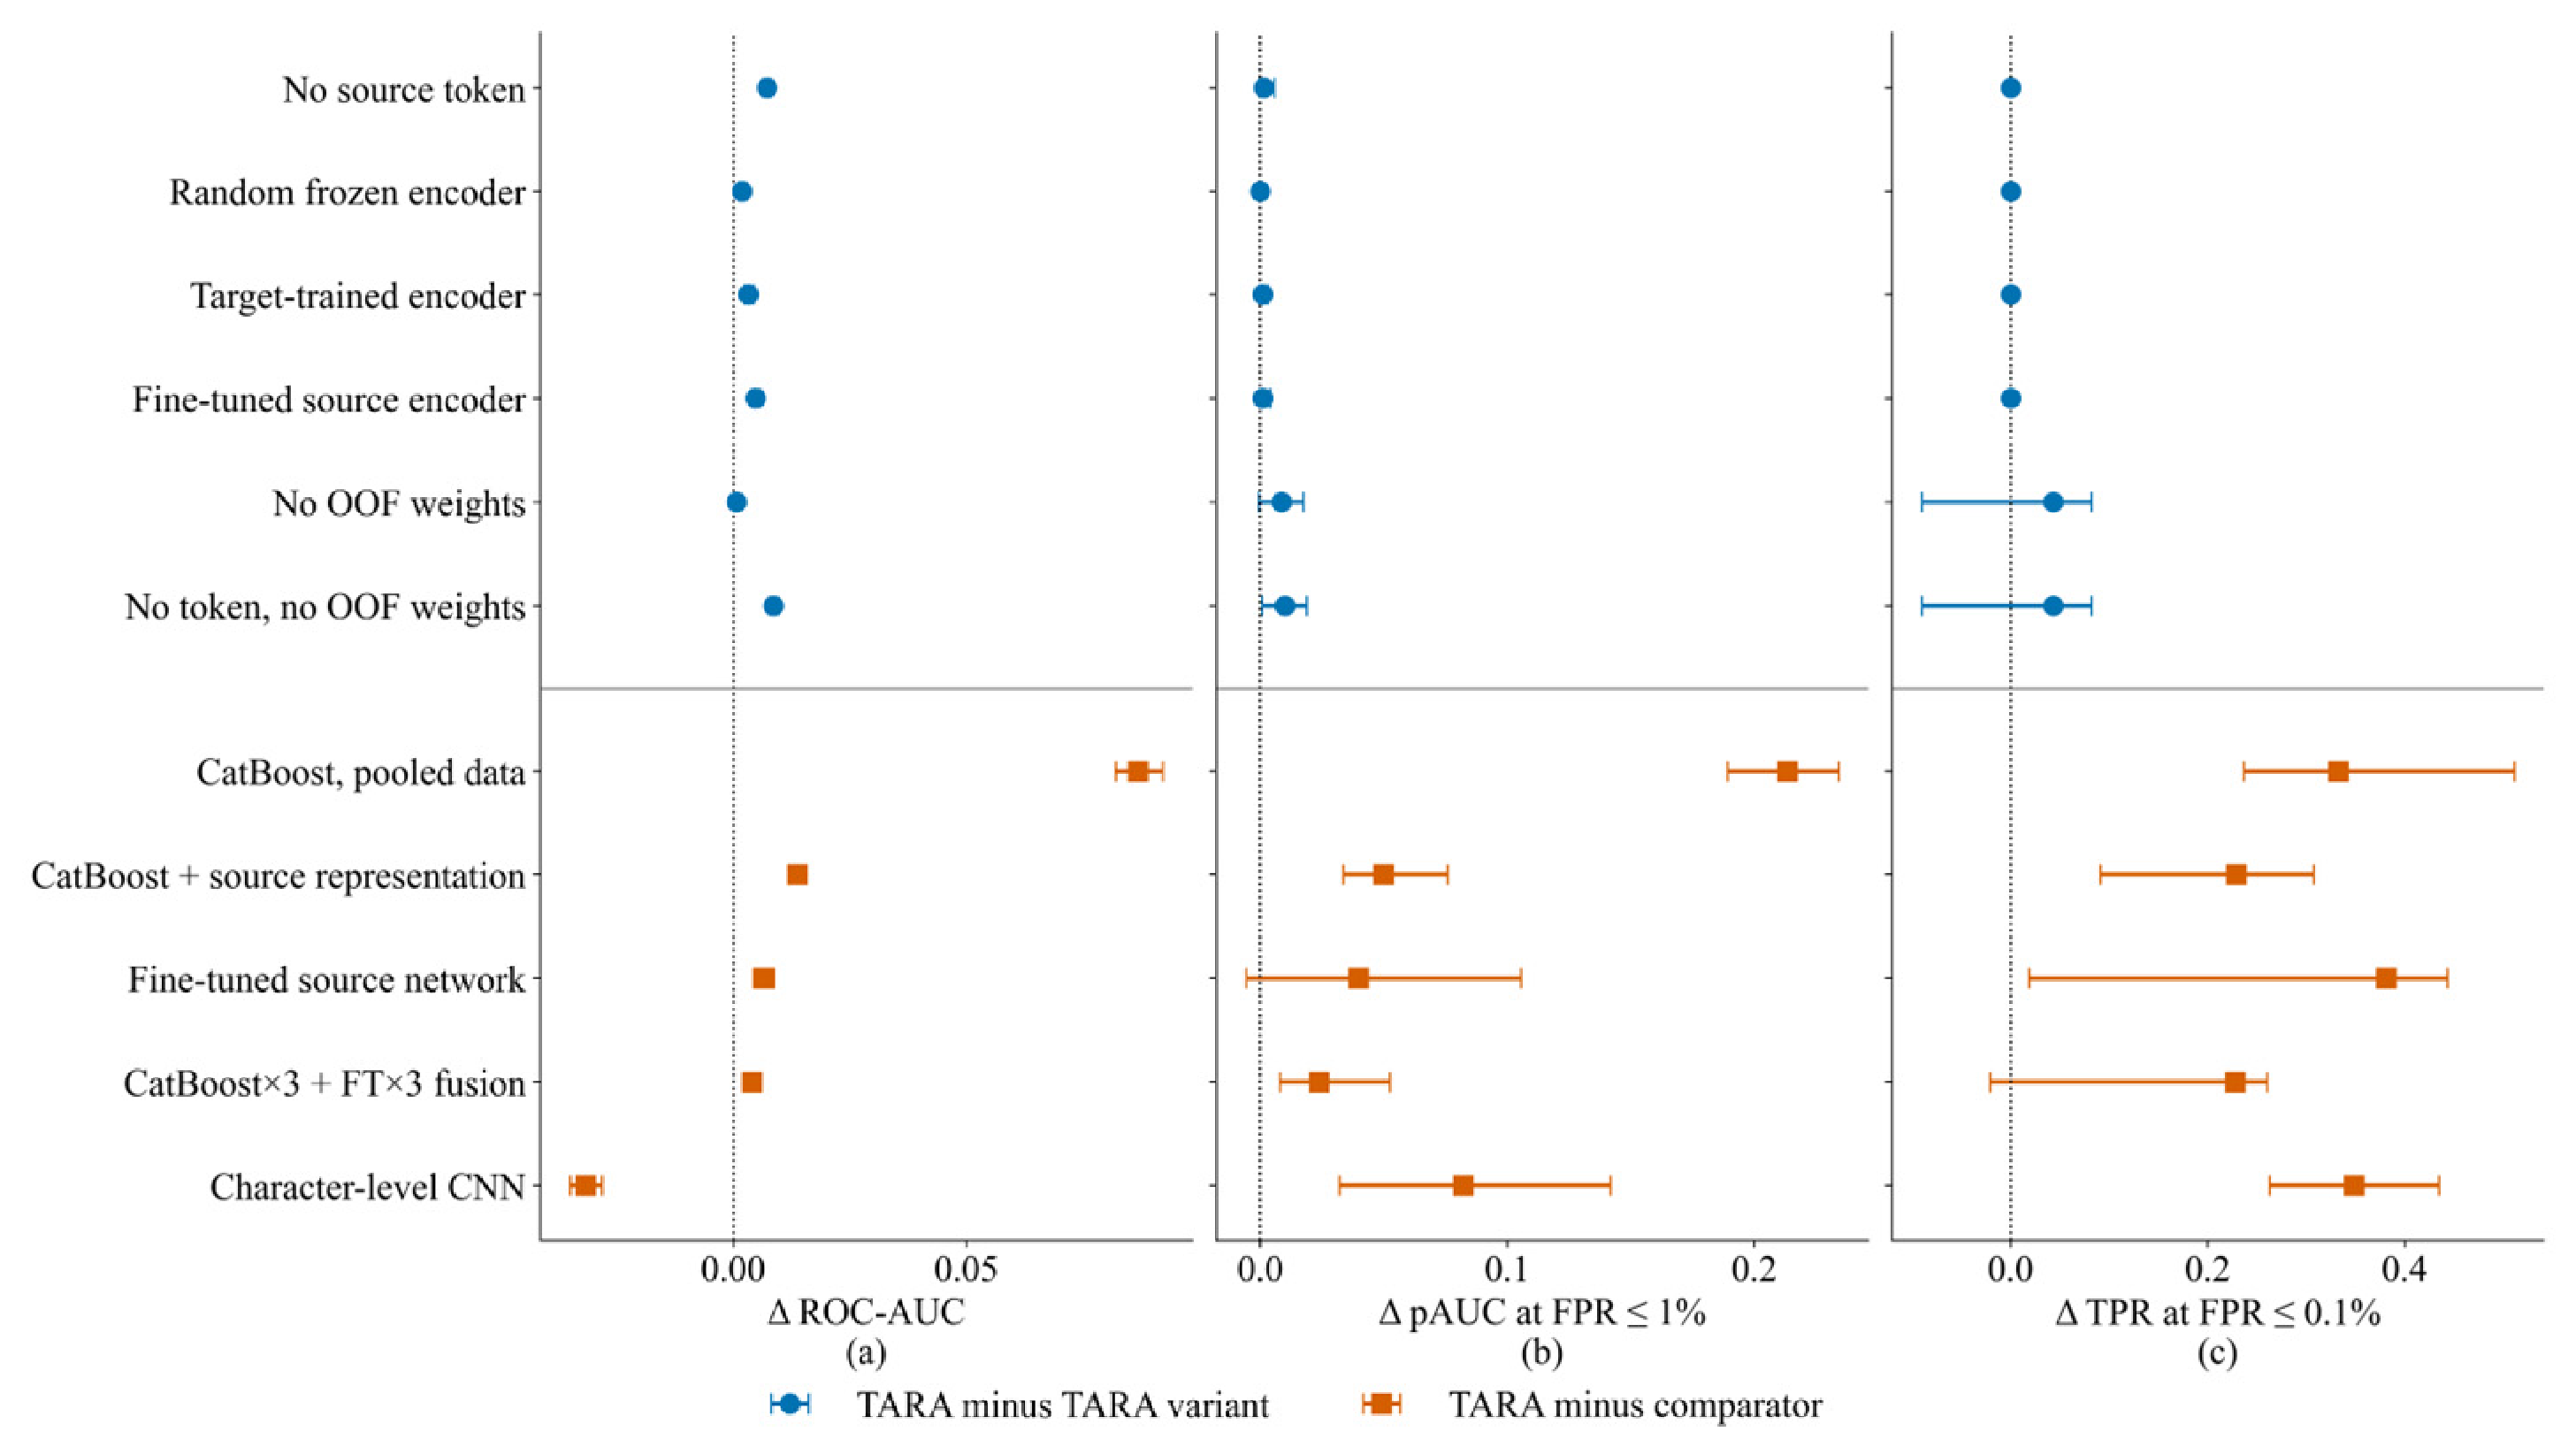
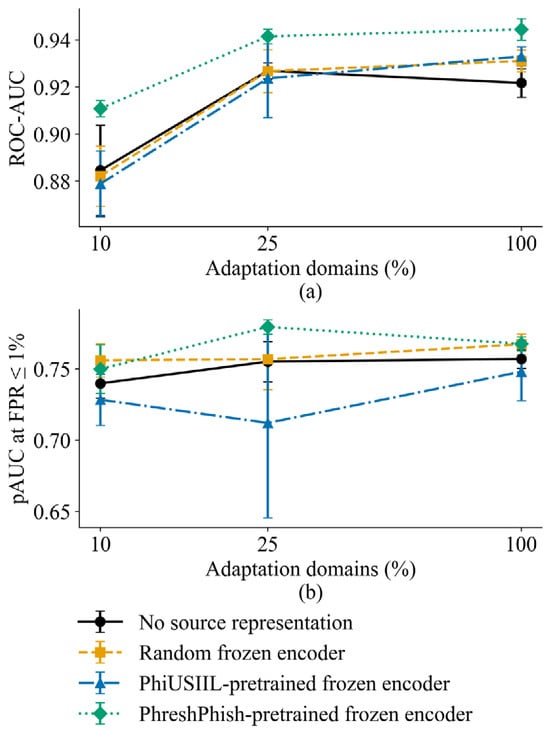
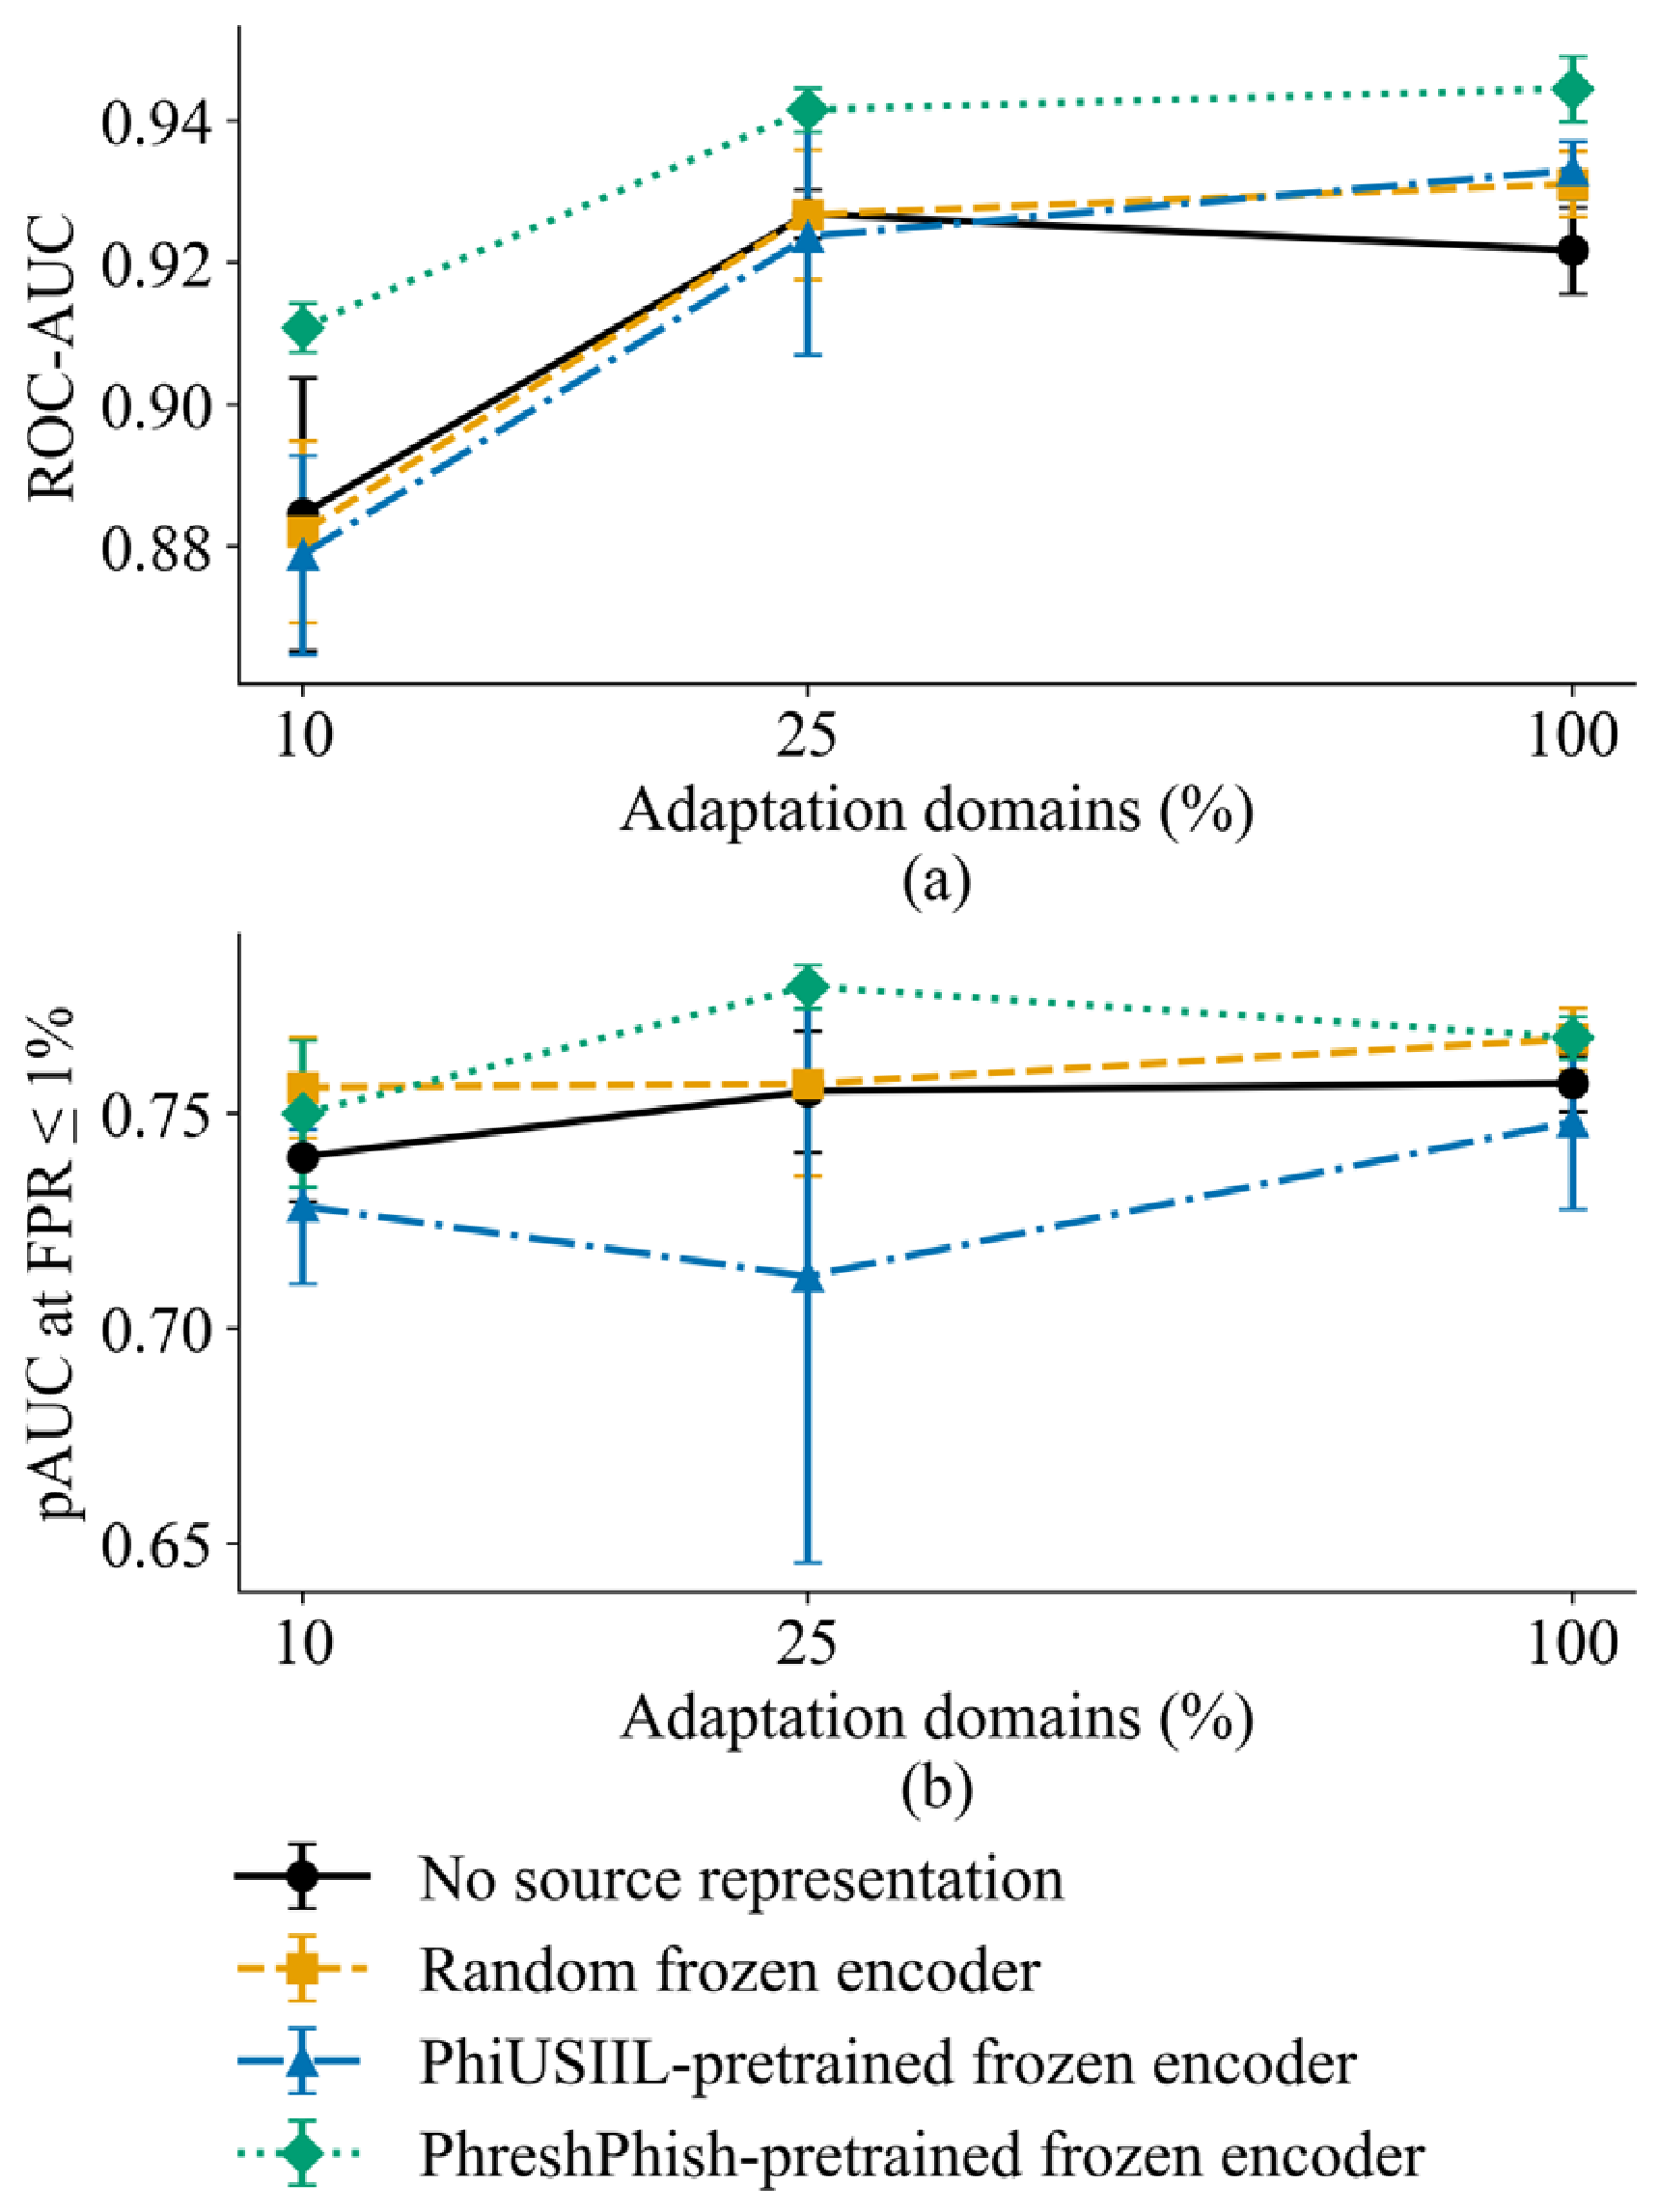

Disclaimer/Publisher’s Note: The statements, opinions and data contained in all publications are solely those of the individual author(s) and contributor(s) and not of MDPI and/or the editor(s). MDPI and/or the editor(s) disclaim responsibility for any injury to people or property resulting from any ideas, methods, instructions or products referred to in the content. |
© 2026 by the authors. Licensee MDPI, Basel, Switzerland. This article is an open access article distributed under the terms and conditions of the Creative Commons Attribution (CC BY) license.