


Abstract
Dual-layer recording doubles the effective areal density of bit-patterned magnetic media, but because both layers are sensed by a common reader, interlayer interference (ILI) is the dominant impairment. This paper presents a two-reader detection method for staggered, dual-layer bit-patterned magnetic recording at 4.0 Tb/in2, in which both layers are read in a single pass by oversampling the outputs of each reader at half the bit period. Detection proceeds in two stages. The log-likelihood ratios from a between-track reader and an on-track reader, with the latter equalized by a fractionally spaced equalizer (FSE), are first combined by a sum soft-information technique to recover the bottom layer. The enhanced soft information then reconstructs and cancels the ILI that corrupts the top layer, where a convolutional neural network (CNN) predicts the residual interference left by a fixed-weight reconstruction. The FSE lowers the bottom-layer bit-error rate (BER) by more than an order of magnitude, combining soft-information gains of about 2 dB SNR at the same BER, and the CNN cancellation adds a further 2 dB. Under 10% media noise, a fixed-weight canceller develops an error floor, whereas the CNN does not, without retraining. This gives the bottom layer larger islands than the top layer, lowering the overall BER from 7.5 × 10⁻⁷ to below 10−7 at 18 dB SNR.
1. Introduction
The volume of data generated worldwide continues to grow rapidly, with most of it stored in large-scale data centers rather than on client devices. Although solid-state storage offers far higher throughput, magnetic hard disk drives (HDDs) remain the lowest-cost medium per unit of stored capacity by a wide margin, and they continue to store the bulk of mass and nearline storage. Because the cost advantage of an HDD is determined largely by how much data a single drive can hold, the areal density (AD) of the recording medium must keep increasing to sustain this advantage. The AD is increased by shrinking the area allocated to each recorded bit, so the ultimate limit depends on the stability of the recording medium.
In conventional granular perpendicular recording, each bit is not a single magnetic entity, but consists of a cluster of magnetic grains with random shapes and sizes, so the signal-to-noise ratio (SNR) depends on the number of grains per bit. Increasing the AD whilst maintaining SNR requires smaller grains, but they must also be large enough to remain thermally stable and writable by the field a recording head can supply. Researchers have studied the trade-off among these three requirements since the earliest projections of terabit-per-square-inch recording (Tbit/in2) [1], and balancing it has been remarkably successful: granular media have sustained decades of areal density growth, and energy-assisted recording has extended this growth further still, into current commercial products. The balance, nonetheless, becomes harder to strike as the bit cell shrinks.
Bit-patterned magnetic recording (BPMR) [2] approaches the same trade-off from a different direction. Rather than reducing the size of the grains, it defines each bit as a single lithographically patterned magnetic island so that thermal stability is set by the island volume rather than by the grain, and the SNR no longer depends on the number of grains per bit. Patterning also reduces transition and track-edge noise and simplifies tracking, since the position of every bit is fixed by the medium rather than by the write process. The advantages of BPMR are not free, however: recorded data can be corrupted by media noise arising from fluctuations in the size and position of the bit-islands introduced during patterning, and this noise does not average out as grain noise does [3].
To obtain a higher AD in BPMR, the bit period and the track pitch must both be reduced, bringing the bit-islands closer together. Two-dimensional (2-D) interference then increases unavoidably. This consists of inter-symbol interference (ISI) along the down-track direction, where the reader senses neighboring islands on the same track, and inter-track interference (ITI) along the cross-track direction, where it senses islands on adjacent tracks. At the densities of interest, the reader footprint spans more than one island in both directions, so the readback waveform is a superposition of several recorded bits rather than a sequence of isolated pulses, and a detector that ignores this structure performs poorly [4,5]. Consequently, mitigating 2-D interference through signal processing, rather than by relaxing the geometry, has become central to BPMR research.
The first approach is equalization. Reading with an array of heads combined with 2-D equalization has been shown to suppress ITI effectively [6], and a 2-D variable equalizer has been applied to the same problem in BPMR [7]. Equally important is the target to which the channel is equalized: rather than imposing a fixed partial-response polynomial, the equalizer and its target can be jointly designed under a monic constraint using a minimum mean-squared error criterion, which produces a generalized partial response target matched to the measured channel response [8]. When the readback signal is oversampled, a fractionally spaced equalizer (FSE) can operate at the sample rate while equalizing at the symbol rate, avoiding the aliasing that occurs when the signal is downsampled before equalization [9,10].
A second approach is to read more than one track at a time and to exchange soft information among the resulting sequences so that the interference itself becomes a source of information rather than only an impairment. A coded dual-track dual-head scheme has been proposed to suppress ITI in BPMR [11], and an iterative ITI cancellation method has been developed for multi-head multi-track systems [12]. This idea is particularly effective in staggered BPMR, where the bit-islands of adjacent tracks are deliberately offset by half a bit period so that a reader placed between tracks samples the two tracks alternately at different instants. In such systems, mutual information has been used to enhance the log-likelihood ratios (LLRs) obtained from three readers over a single track [13], and a two-reader/three-track detection scheme has been used to raise the achievable AD [14]. The oversampling technique that makes this possible, in which a single reader collects twice the required number of samples so that two tracks are read from one pass, was introduced for single-reader/two-track reading in staggered BPMR [15].
All of these approaches increase AD by packing the islands more tightly within a single recording layer, and each eventually meets the same limit. An alternative is to record on multiple layers. Multi-layer magnetic recording stores data on two or more vertically stacked media layers that are read by the same reader, multiplying the AD without further reducing in-plane island spacing [16]. The cost is a new impairment: inter-layer interference (ILI), in which the readback signal is a superposition of contributions from both layers. Because the layers lie at different distances from the reader, their contributions differ in amplitude but overlap in time, and ILI rather than ITI becomes the dominant impairment. For double-layered systems, mutual soft-information techniques have been applied to improve detection of the lower layer [17], a multilayer perceptron decoder has been used for single-reader/two-track reading [18], and the arrangement of the bit-islands of the two layers has been studied as a means of separating their contributions [19].
Learning-based detection has attracted considerable attention for these channels because the residual interference left after conventional equalization is structured but difficult to model in closed form. Deep neural networks have been used for detection and partial-response equalization in multilayer recording [20,21], and turbo-detection schemes combining a neural-network equalizer with a media-noise predictor have been reported for both multilayer recording and two-dimensional magnetic recording (TDMR) in the presence of write/read track mis-registration [22,23]. Recurrent architectures have likewise been employed as adaptive decoders in BPMR [24]. These results share one thing in common: a network trained on the channel can capture impairments that a fixed linear model calibrated for a nominal geometry cannot.
In this paper, we propose a two-reader detection method for a staggered dual-layer BPMR (DL-BPMR) system operating at a total AD of 4.0 Tb/in2. Both layers are read simultaneously in a single pass by oversampling each reader output at half the bit period so that the samples of the top and bottom layers appear at the odd and even positions of the oversampled sequence, respectively. Detection is carried out in two stages. In the first stage, the LLR sequence obtained from the reader placed between two tracks and the LLR sequence obtained from the reader placed at the track center, the latter equalized by an FSE, are combined using a sum soft-information (SSI) technique to detect the bottom-layer bits. In the second stage, the enhanced soft information is used to reconstruct and subtract the ILI component from the first reader’s readback signal, with a convolutional neural network (CNN) predicting the residual interference that a fixed-weight reconstruction cannot capture, thereby enabling reliable detection of the top-layer bits.
Combining mutual soft-information has previously been applied to the lower layer of a double-layered system [17]. The present work differs in three respects. First, both layers are read simultaneously from a single pass by oversampling, rather than being resolved by separate reader passes. Second, the two reader paths are equalized differently so that the soft information entering the combination is matched to the sampling geometry of each reader. Third, and principally, the combined soft information is not the end product: it drives a learned cancellation of the ILI corrupting the upper layer so that both layers benefit from the combination. In addition, the bit-islands of the two layers are given unequal diameters by design, and we show that strengthening the readback contribution of the weaker layer improves not only its own detection but also the quality of the ILI cancellation applied to the other layer.
The rest of this paper is organized as follows. Section 2 describes the staggered DL-BPMR media geometry and channel model. Section 3 explains the proposed two-stage detection method, including the design of the two equalizers, the SSI technique, and the CNN-enhanced ILI subtraction. Section 4 presents the performance evaluation, and Section 5 concludes the paper.
2. System Model
2.1. Media Geometry and Structure
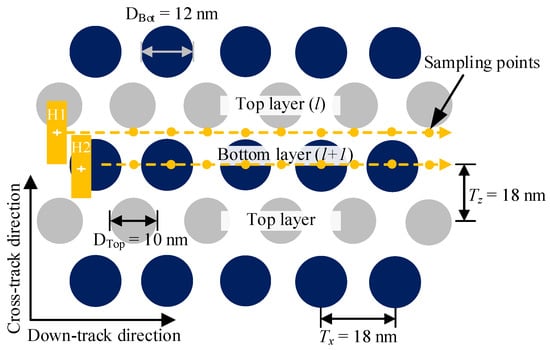
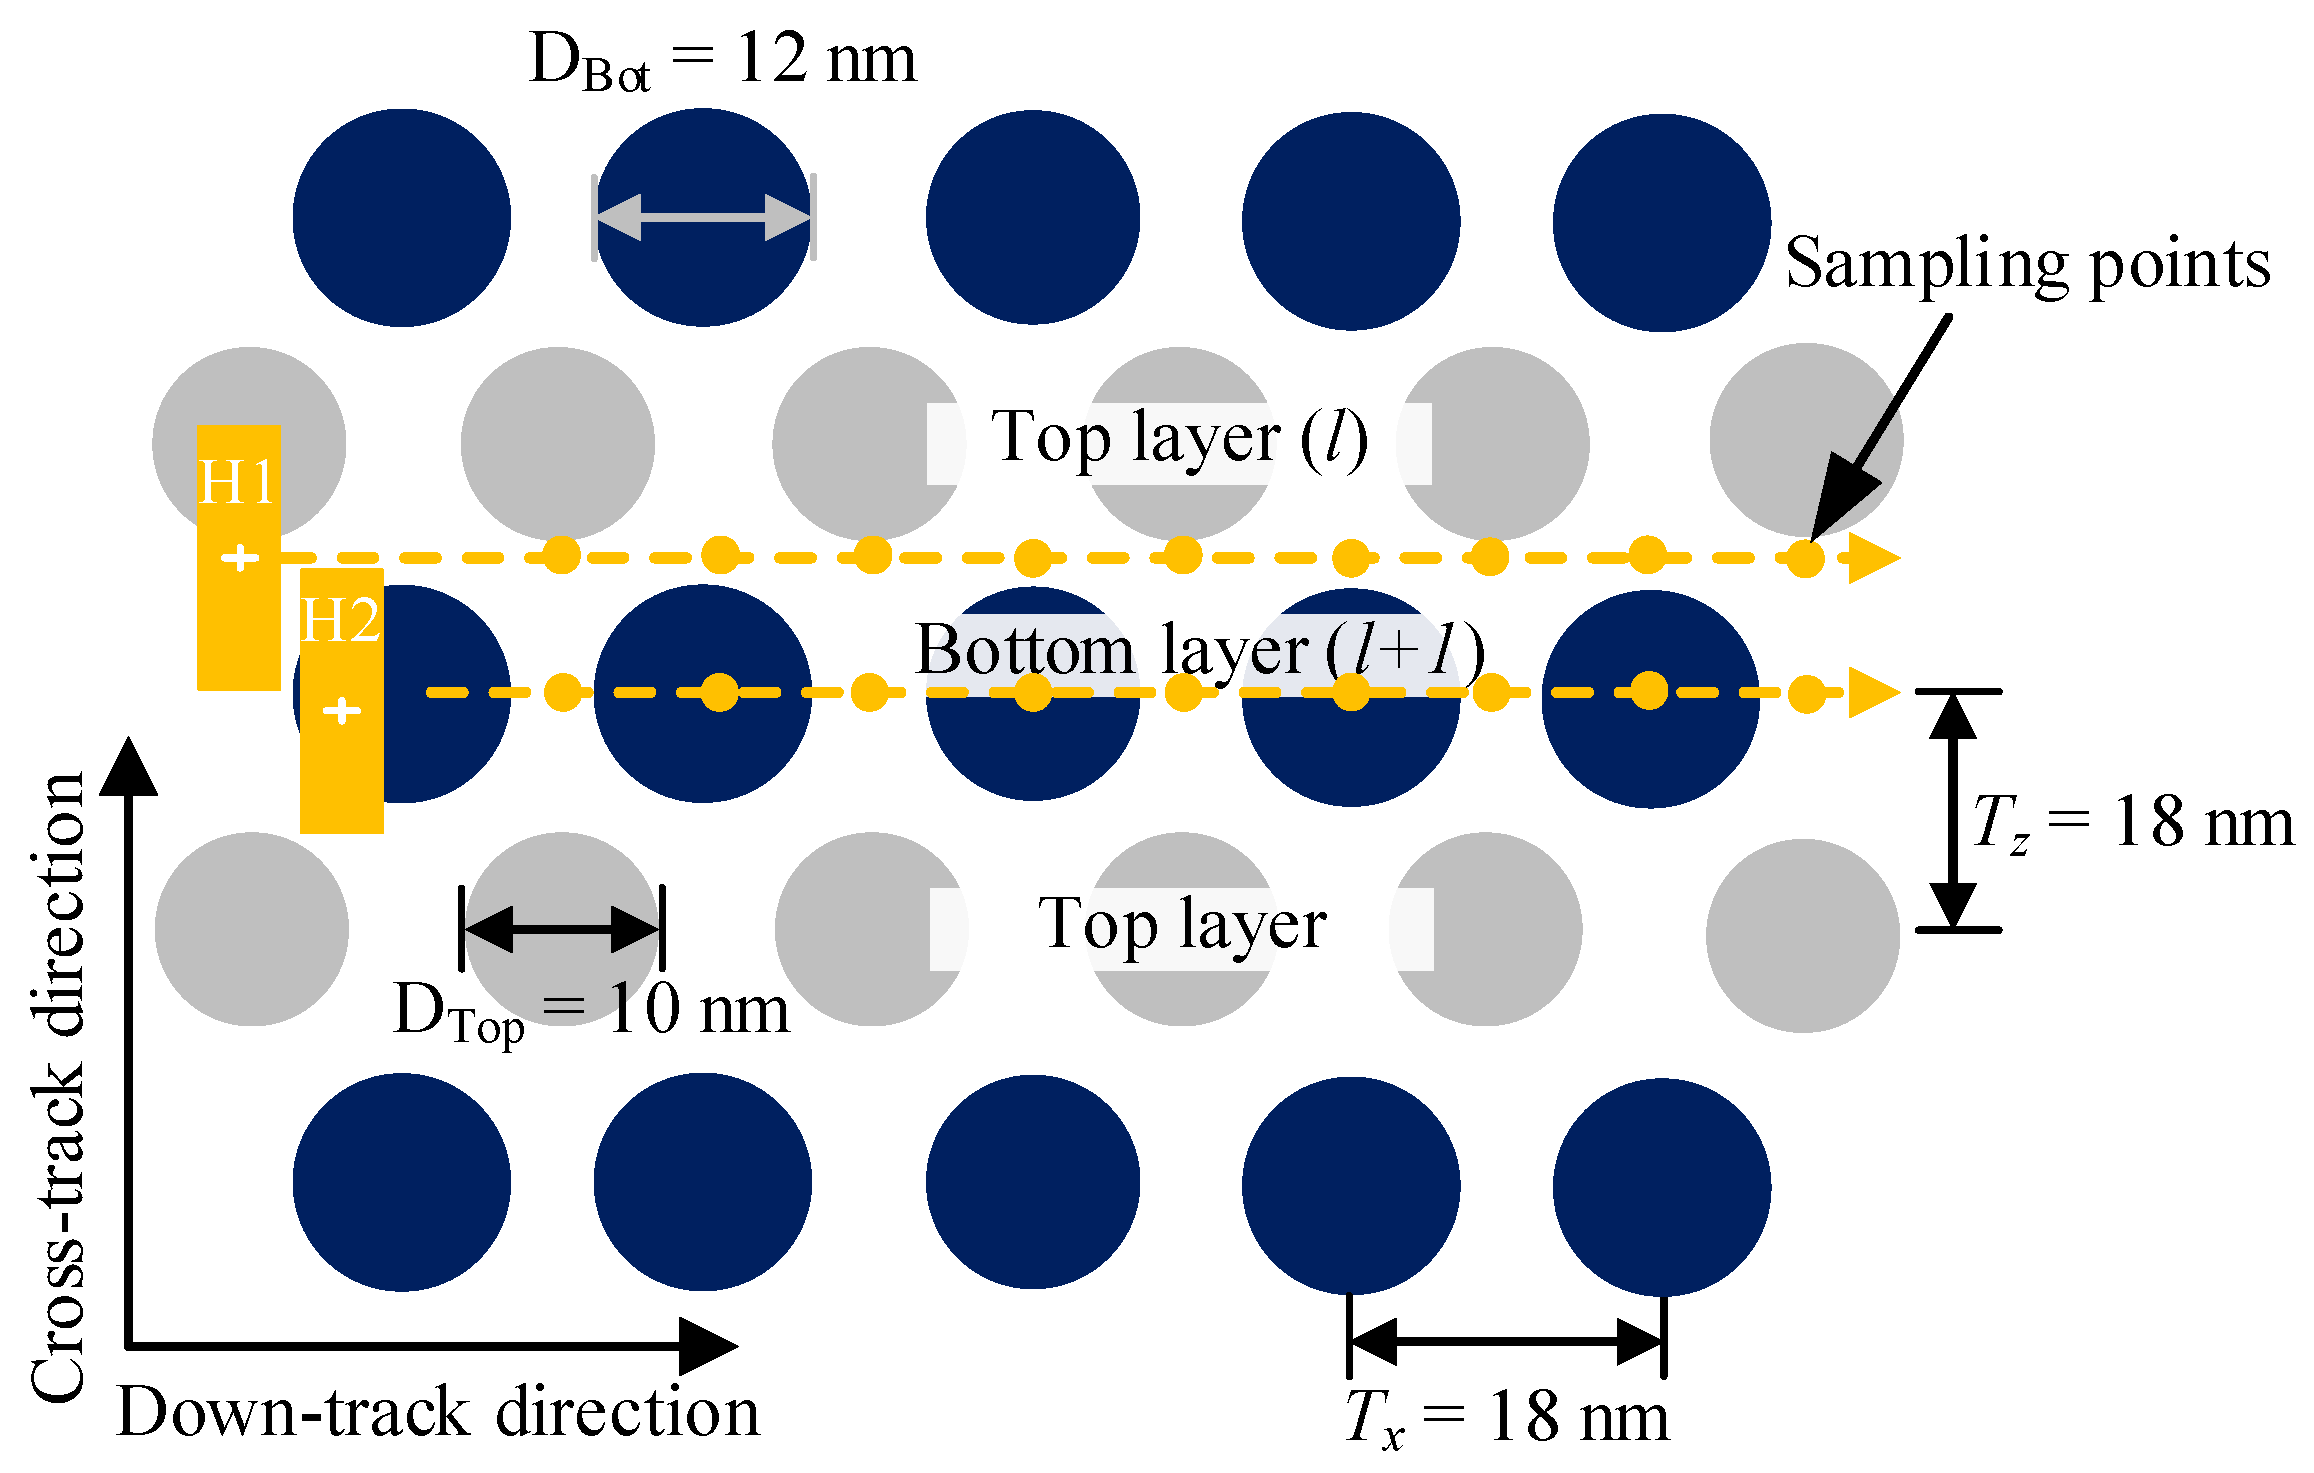
This study uses a staggered DL-BPMR system with a bit period equal to the track pitch . Both values are set to 18 nm, corresponding to an AD of 4.0 Tb/in2 (2.0 Tb/in2 per layer). Similar to staggered single-layer BPMR (SL-BPMR) [13,14], the bit-islands in the top layer are offset by half a bit period in the down-track direction. The bit-islands of the top layer have a diameter of DTop = 10 nm, while those of the bottom layer have a larger diameter of DBot = 12 nm. A larger island diameter produces a greater magnetic flux, which in turn results in a stronger readback signal from that layer. Therefore, the bottom-layer islands are larger so that their contribution to the readback signal is dominant and distinguishable from that of the top layer. This characteristic is exploited in the detection process, where the stronger bottom-layer signal enables more reliable estimation of the inter-layer interference (ILI) component, which is subsequently used to improve top-layer detection. The benefit of this unequal-diameter design is demonstrated in Section 4. The bit-island arrangements of both layers, along with the reader positions, are illustrated in Figure 1.
Figure 1.
Illustration of the bit-island arrangement, sampling points, and readers’ placement over the two considered tracks, consisting of the top layer and bottom layer tracks.
Size and position fluctuations of the islands were included and modeled as media noise [3]. The size fluctuation percentage, is defined as
where is the standard deviation of the bit-island diameter, defined as a Gaussian distribution, and D is the diameter of the ideal bit-islands, which was set to 10 nm for the top layer and 12 nm for the bottom layer. The position fluctuation percentage, can be defined as
where is the standard deviation of the center-to-center distance between neighboring bit-islands, which follows a Gaussian distribution, and is the center-to-center distance between ideal bit-islands. In the writing process, we assume that all bit-islands are perfectly written, meaning that the magnetization of all bit-islands is consistent with the recorded bit pattern.
2.2. Channel Model
In multi-layer recording, the data stored on two vertically stacked layers are sensed by the same reader so that the readback signal contains contributions from both recording layers [16,18,19]. The user bits recorded on the top layer l and the bottom layer l + 1 are denoted by and , respectively, where k is the down-track bit index. During readback, two readers are employed to simultaneously sense the magnetic responses from both recording layers. The first reader, H1, is positioned between two considered tracks, while the second reader, H2, is positioned at the center of one of the two considered tracks. The readback signal of the j-th reader is expressed as the superposition of the contributions from both recording layers:
where is the reader index; x and y are the reader positions in the down-track and cross-track directions, respectively. The term is the island magnetization as a function of the down-track and cross-track directions, and , respectively. The term is the reader sensitivity function of the j-th reader [3], and is the electronic noise that corrupts the readback signal of the j-th reader, modeled as additive white Gaussian noise (AWGN) with zero mean and variance . The SNR is defined as:
in decibels (dB), where A = 1 is the normalized peak amplitude of the readback signal.
Since the reader position is fixed on the y-axis, the x-axis can be expressed in terms of time t. Therefore, the readback signal can be considered as a continuous-time readback signal . To obtain the discrete-time readback signal of the j-th reader at the -th sample, , the continuous-time readback signal is oversampled at a period of 0.5 × according to the following equation:
The bit-islands in the top layer are offset by half a bit period in the down-track direction. As a result, when the continuous-time readback signal is oversampled at a period of 0.5 × , the data samples from the top layer appear at the odd positions, of each oversampled sequence, while the data samples from the bottom layer appear at the even positions , as illustrated in Figure 1. The number of data samples collected at each reader is therefore twice the number of bits recorded per layer. This oversampling technique, introduced for single-reader/two-track reading in staggered BPMR [15] and later applied to multi-reader detection [14], allows a single reader to read both layers simultaneously. Here, we refer to the even-indexed samples of H1 and H2 as the mutual data. For each bottom-layer bit, there are two sources, one from each reader, so the two datasets describe the same bit from two sources. These samples contain contributions from both layers and are jointly utilized to improve the reliability of bottom-layer detection.
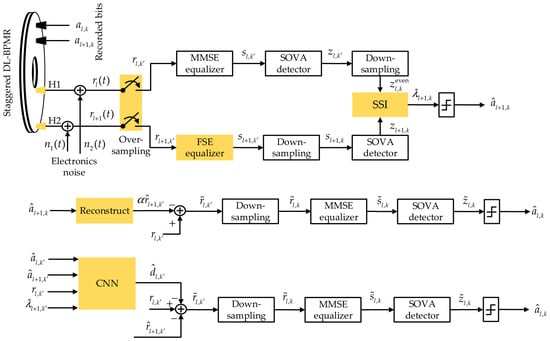
As shown in Figure 2, the oversampled readback sequences, and , are produced by H1 and H2, respectively, and are sent to equalizers to suppress ISI and ITI. For the H1 path, is processed by an MMSE equalizer to produce the equalized sequence , which is then detected by a soft-output Viterbi algorithm (SOVA) detector to generate the LLR sequence . This LLR sequence is downsampled to retain only the even-indexed samples , corresponding to the bottom-layer bit positions. For the H2 path, is processed by an FSE to produce, , which is then downsampled to before being detected by a SOVA detector to generate the LLR sequence, . The two LLR sequences, and , are then combined using the SSI technique to produce the enhanced LLR, , which is passed to a threshold detector to produce the estimated bottom-layer bits, .
Figure 2.
Block diagram of the proposed detection scheme for the staggered DL-BPMR system.
In the second stage, the estimated bottom-layer bits, , are used to reconstruct and subtract the ILI component from the H1 readback signal to get the estimated top-layer bits, . As illustrated in Figure 2, this is carried out in two passes. In the first pass, is upsampled and convolved with the channel response to form the reconstructed ILI signal, which is scaled by a weighting factor and subtracted from . The result is downsampled, equalized by an MMSE equalizer, and detected by a SOVA detector to give a preliminary estimate of the top-layer bits, . In the second pass, a CNN predicts the residual interference, that remains after the first pass, using four input channels: , , and the preliminary estimate of the top-layer bits, . The predicted residual and the reconstructed ILI signal are then subtracted from to produce the cleaned signal, . No weighting factor is applied in this pass. The cleaned signal is downsampled to , equalized by an MMSE equalizer to produce , and detected by a SOVA detector to produce the final estimated top-layer bits, . Section 3 provides details of each processing block.
3. Proposed Detection Method
In this section, we describe the proposed detection method for the staggered DL-BPMR system. The detection process is divided into two stages. In the first stage, the bottom-layer bits, , are detected using the mutual data, i.e., the even-indexed samples as defined in Section 2.2, obtained from both readers, H1 and H2. In the second stage, the detected bottom-layer information is used to reconstruct and subtract the ILI component from the H1 readback signal, enabling reliable detection of the top-layer bits, .
The subtraction in the second stage cannot be performed directly. The ILI is reconstructed by convolving the detected bottom-layer bits with the channel response of H1, but the amplitude of this reconstruction does not match the ILI that is actually present in the readback signal, since the bottom layer lies farther from the reader. A weighting factor, determined by simulation, is therefore applied before subtraction. This removes some of the ILI, but not all of it. The reconstruction is built from hard decisions, which discard the reliability information carried by the soft output of the first stage, and a single weighting factor cannot follow the variation in the residual along the sequence. A CNN is therefore used in a second pass to predict what the weighted subtraction leaves behind. Because the network observes the readback signal and the enhanced soft information directly, it estimates the residual, and this refinement produces the final top-layer decisions. The two stages are described in Section 3.1, Section 3.2 and Section 3.3.
3.1. Bottom Layer Detection
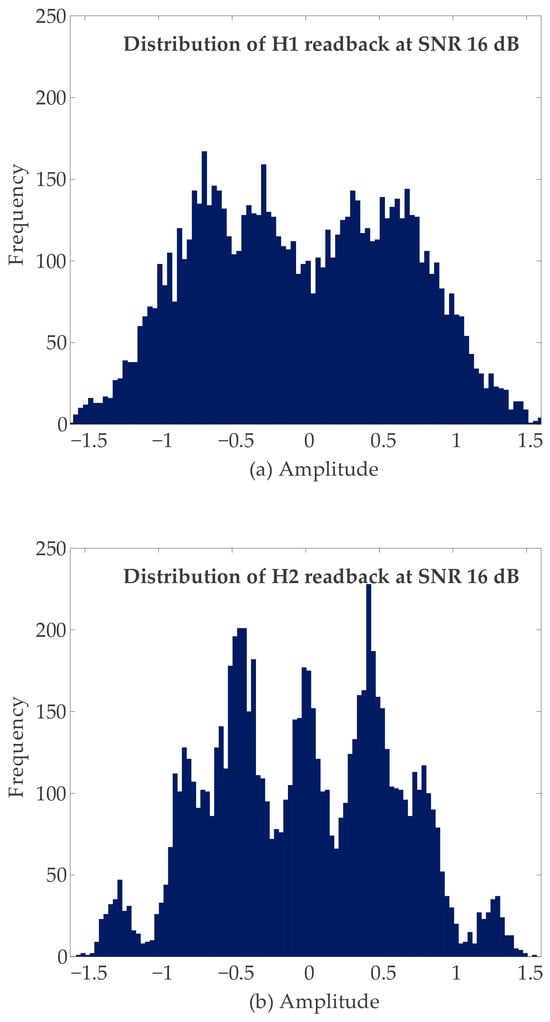
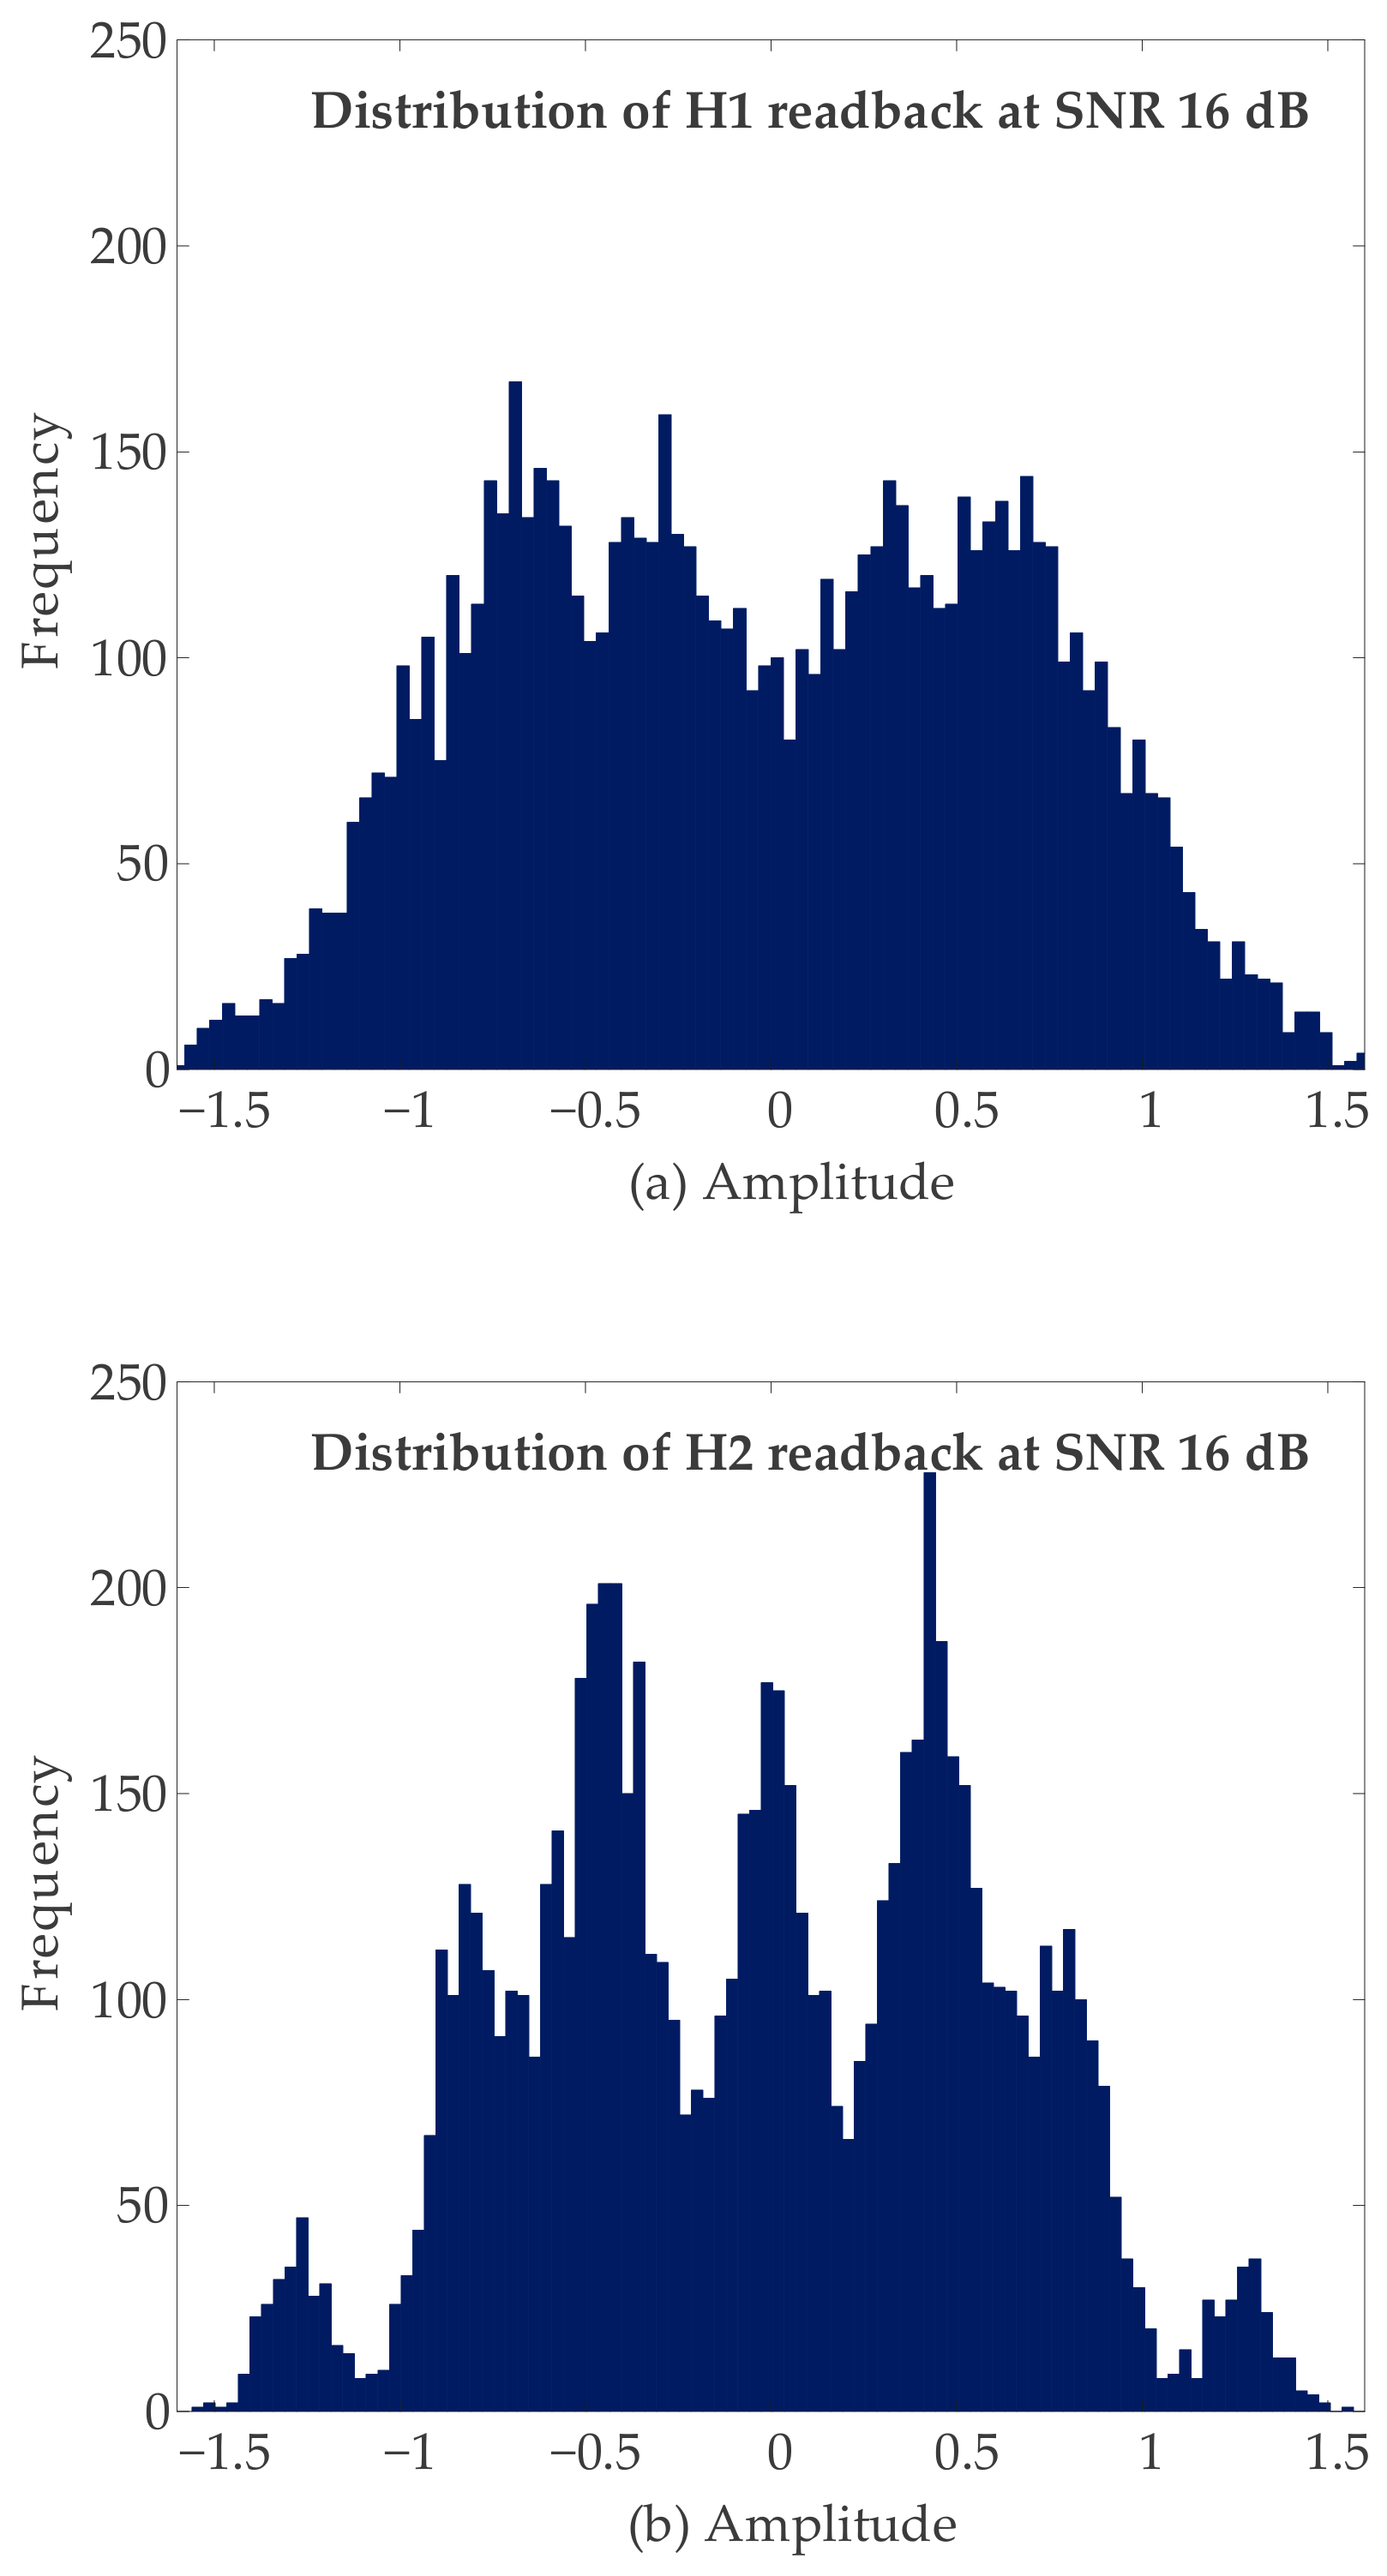
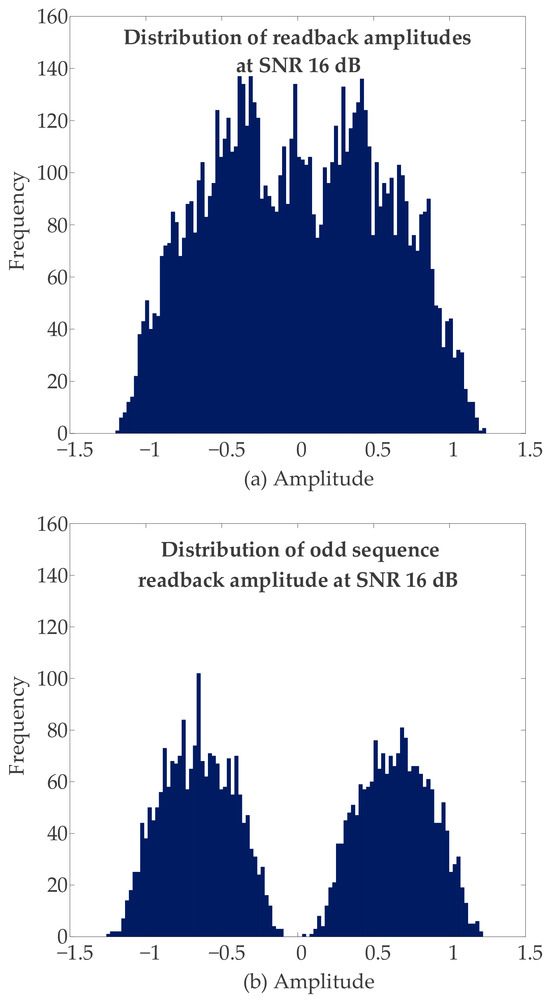
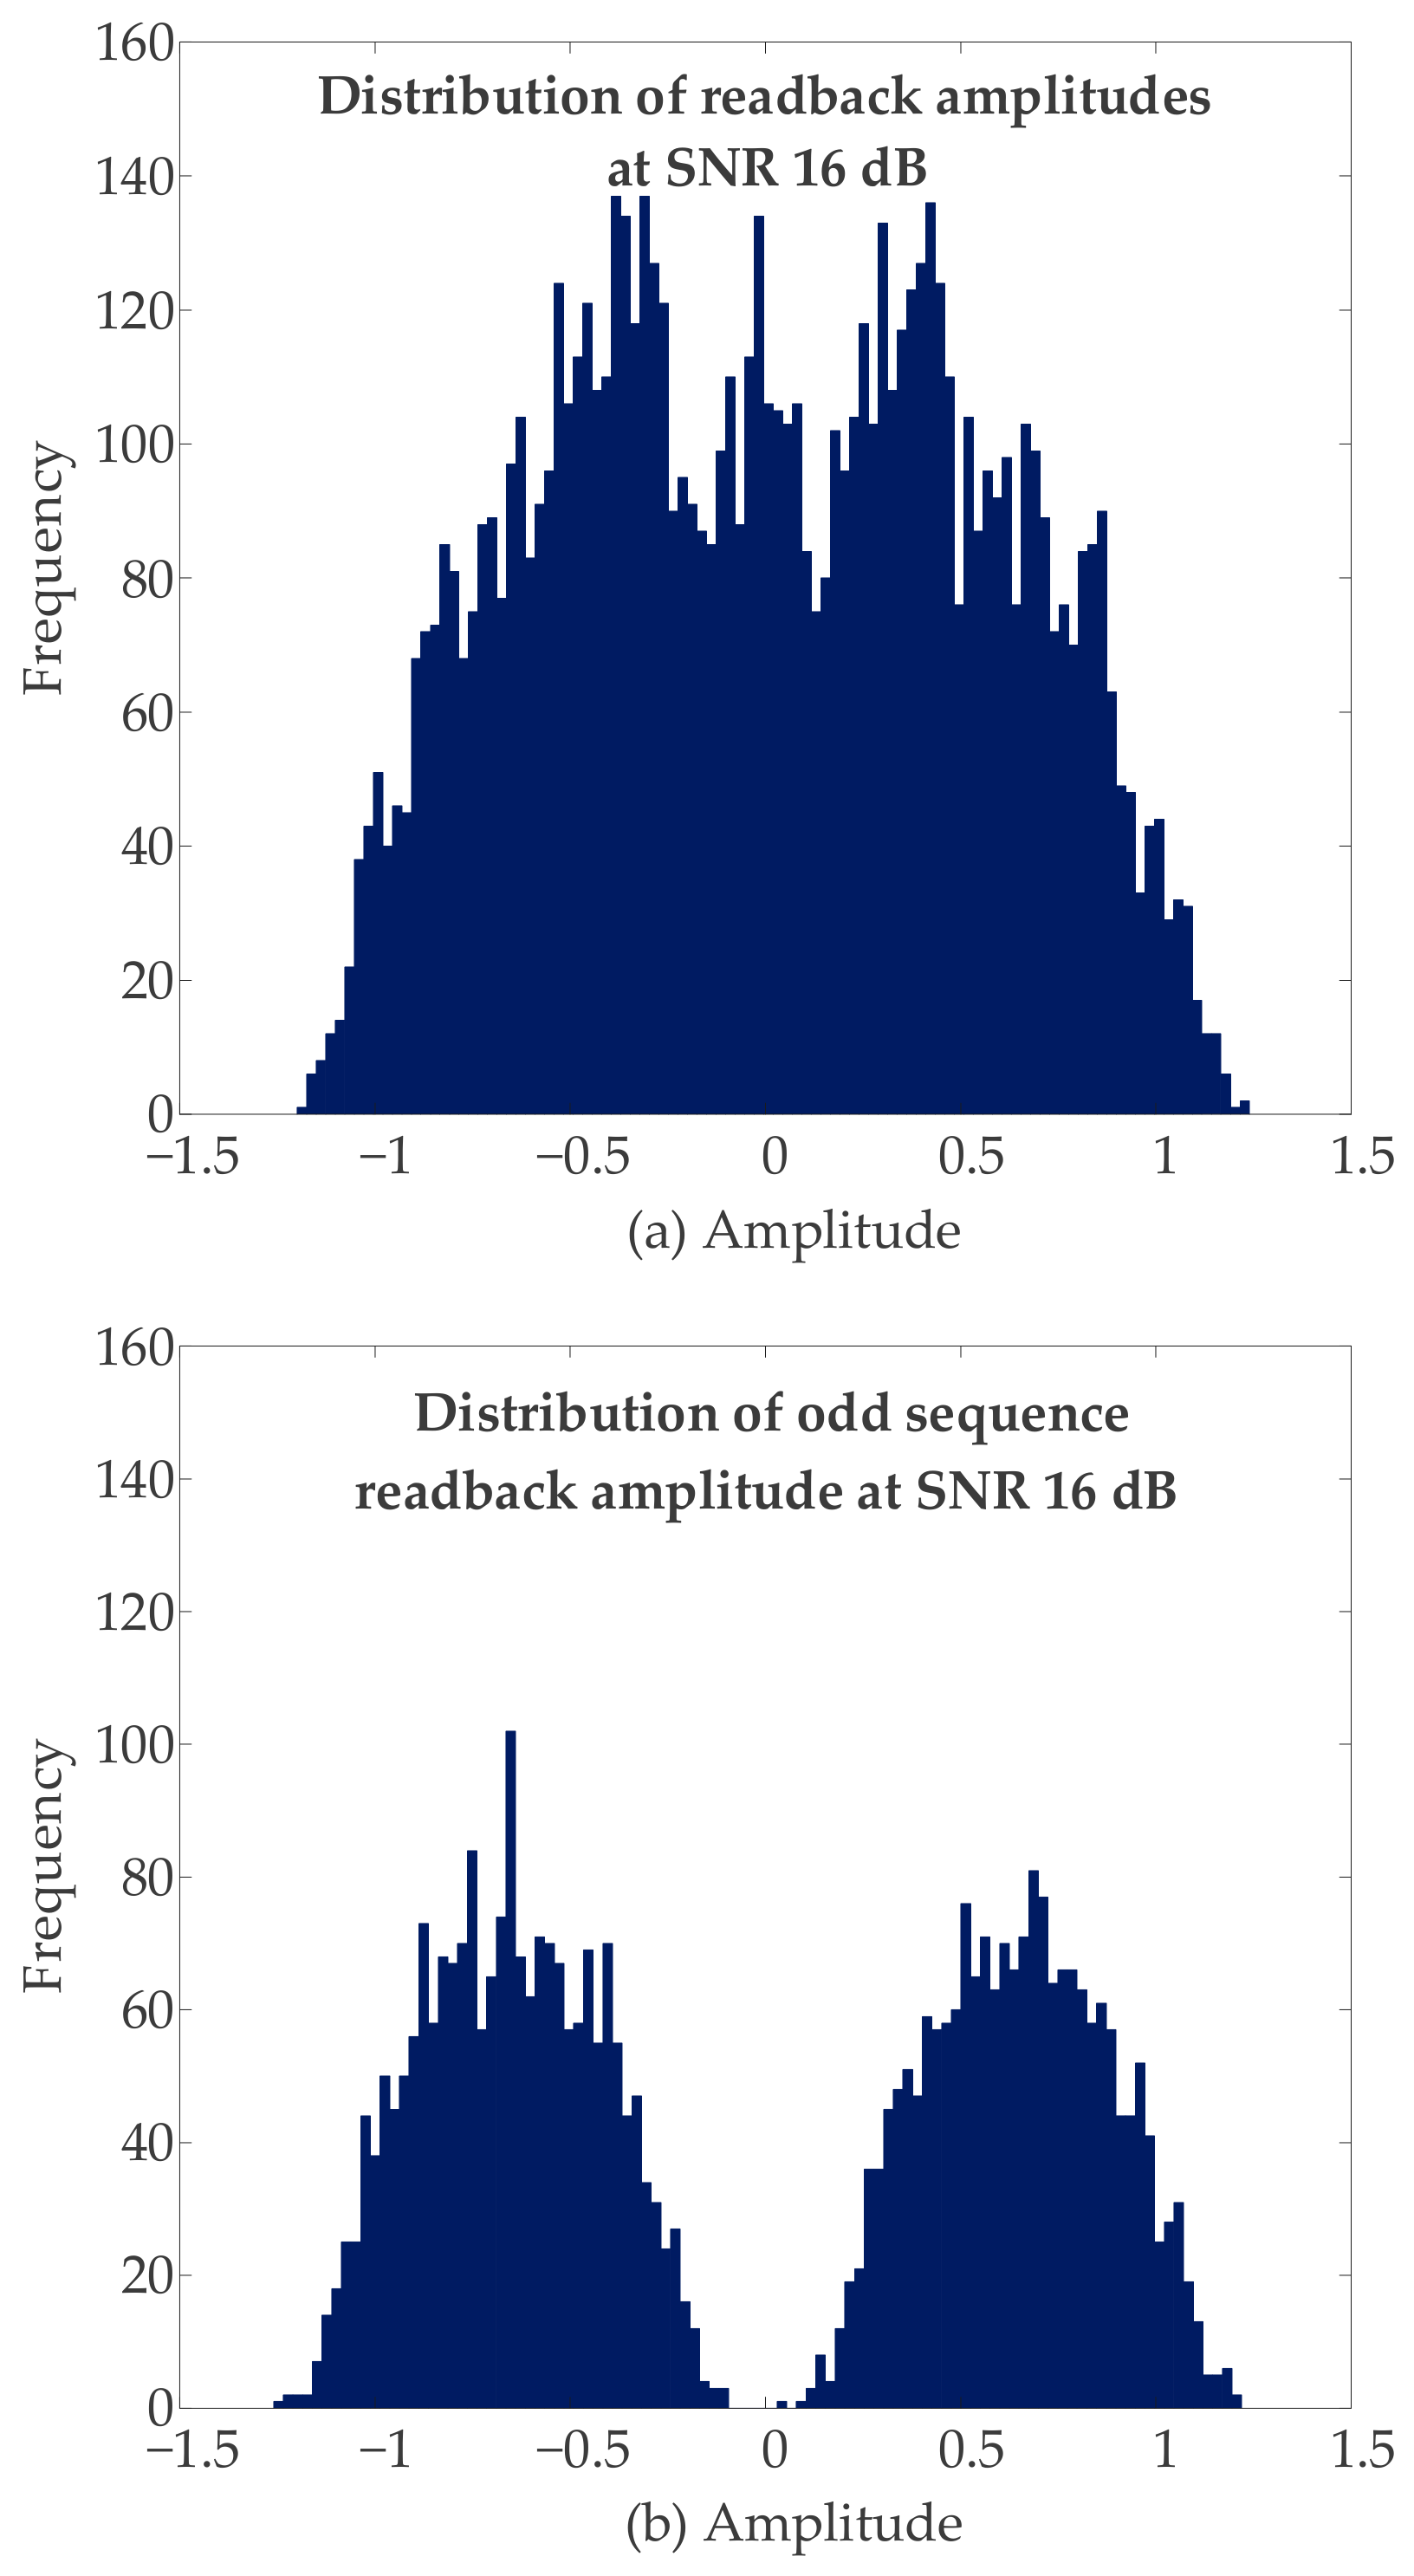
In the first stage, the oversampled readback sequences, and , from H1 and H2, respectively, are processed to detect the bottom layer bits, . As shown in Figure 3a,b, the readback signals from both readers exhibit a multi-peak amplitude distribution due to the superposition of contributions from both the top and bottom layers, reflecting the severity of ILI in the DL-BPMR channel. To suppress ISI and ITI, the two readback sequences are therefore processed by separate MMSE-designed equalizers [8].
Figure 3.
Distributions of the readback signal amplitude at an SNR of 16 dB from (a) reader H1 and (b) reader H2.
For the H1 path, the oversampled readback sequence, , contains interleaved samples from both the top and bottom layers. The recorded bit sequence used for equalizer design is therefore constructed as an interleaved sequence, , which captures the contributions from both layers at each oversampled position. Here, both the input sequence, , and the target sequence, , have equal length at the oversampled rate. The MMSE equalizer for H1 is designed using the monic constraint, fixing the first target coefficient, g0 = 1, and the equalizer and target coefficients are obtained by minimizing the expected squared error:
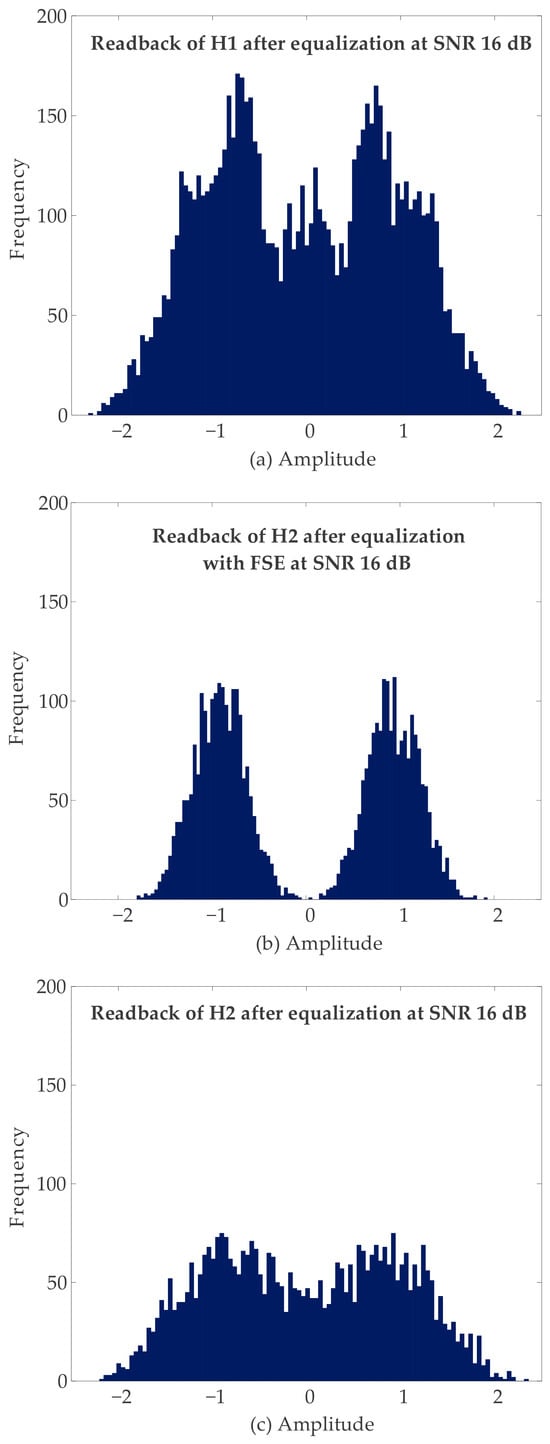
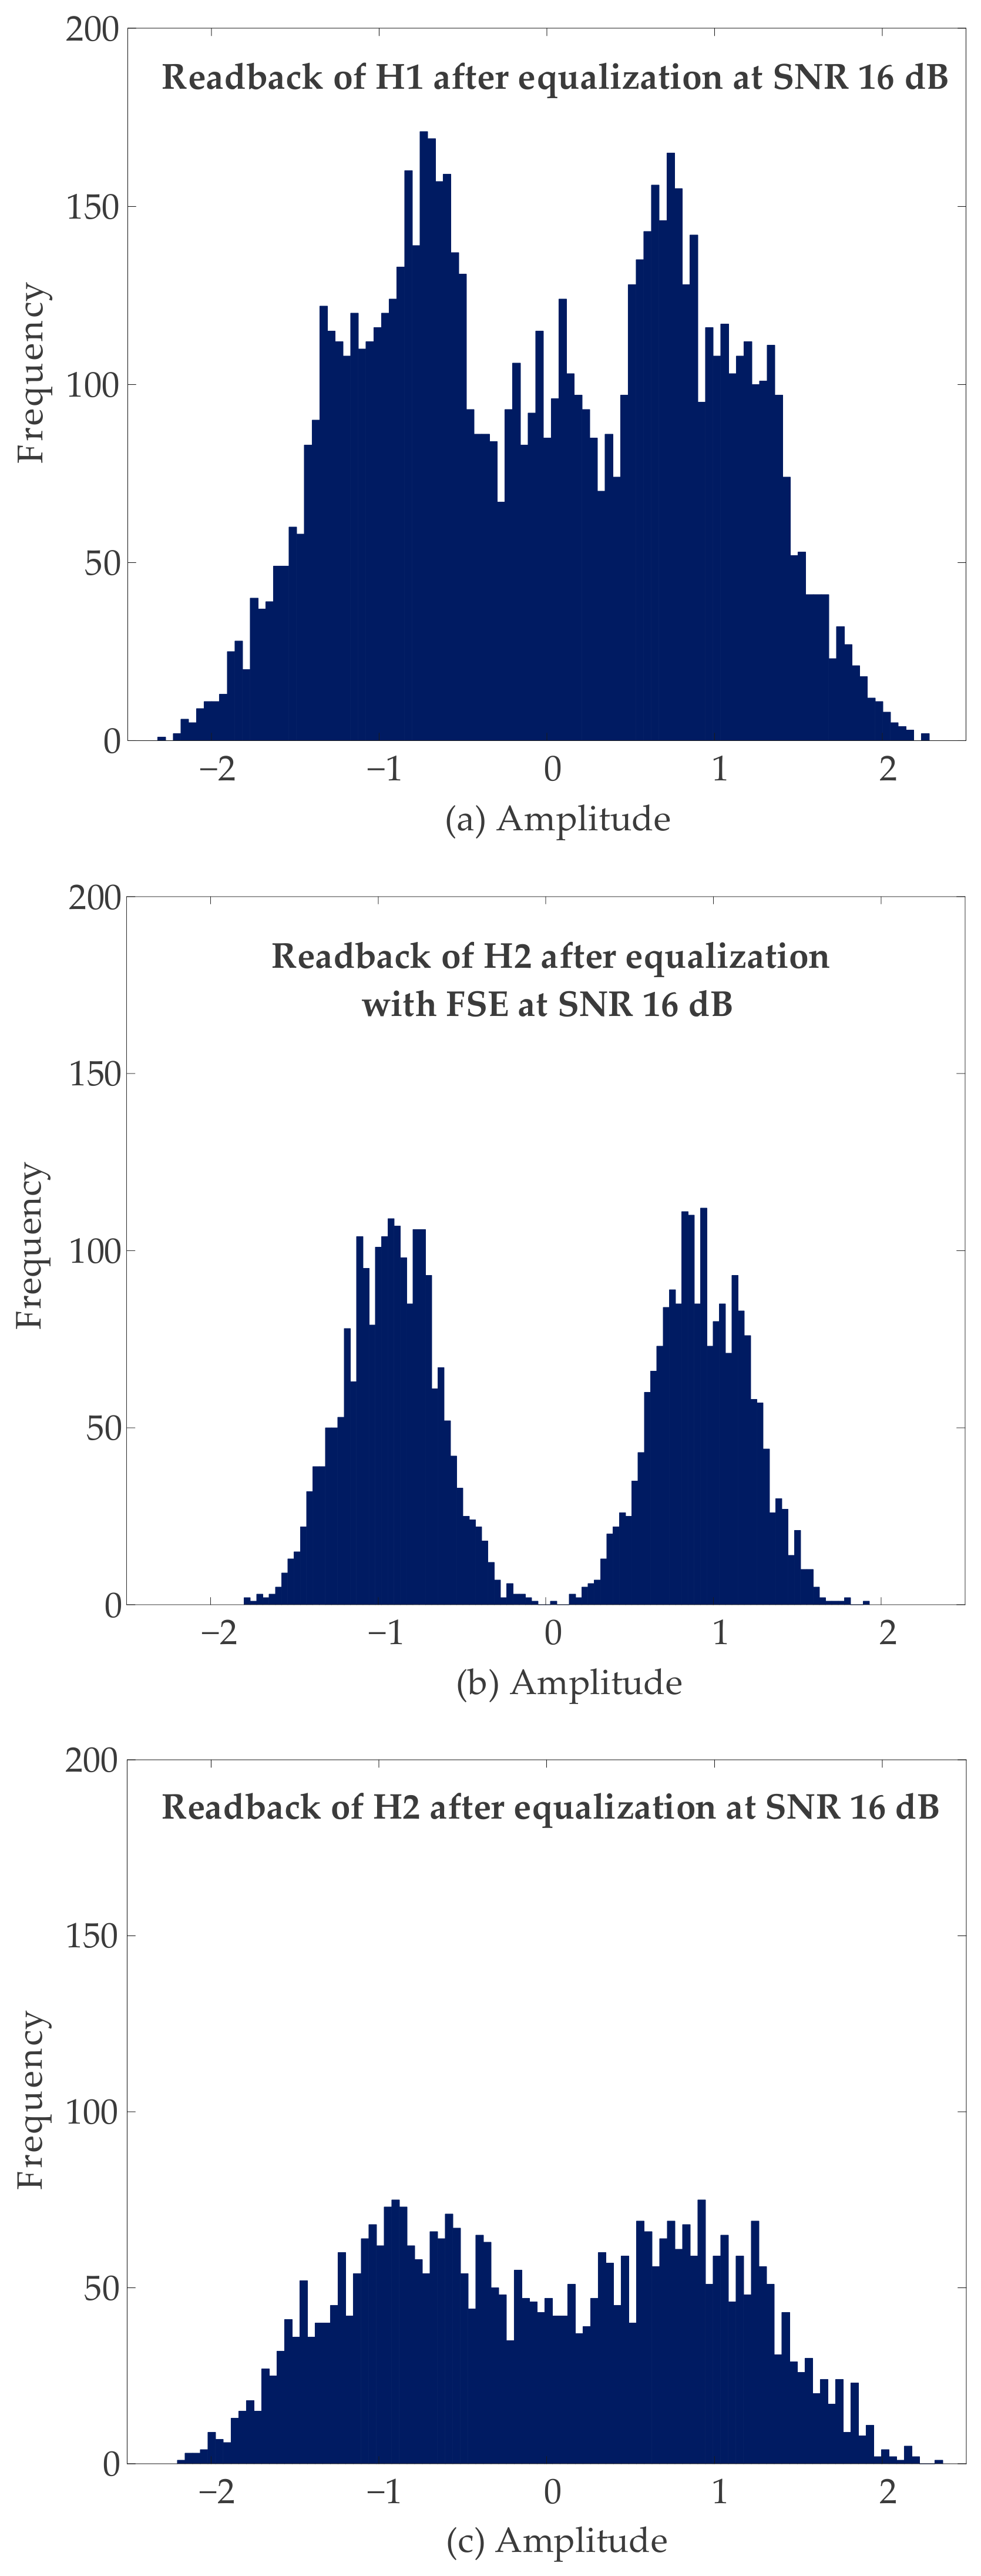
where denotes the convolution operator, is the difference (error) between the equalizer output and the desired output, is the equalizer coefficient vector of length 2K + 1 = 11 taps with K = 5, and is the target coefficient vector of length L = 3. The equalized sequence is obtained by convolving with the designed equalizer coefficients, . As shown in Figure 4a, the equalized signal exhibits a cleaner three-peak amplitude distribution compared to the raw readback signal in Figure 3a, indicating effective suppression of ISI and ITI.
Figure 4.
Distributions of the equalized signal amplitude for (a) the H1 path using the MMSE equalizer, (b) the H2 path using the FSE, and (c) the H2 path using the MMSE equalizer.
For the H2 path, an FSE is employed to process the oversampled readback sequence, [9,10]. Unlike the MMSE equalizer on the H1 path, where the input and target sequences have equal length at the oversampled rate, the FSE on the H2 path operates on an input sequence at twice the rate of the target sequence. Specifically, the input is at the oversampled rate of 8000 samples, while the target is defined at the bit rate of 4000 samples, corresponding to the bottom-layer bits only. This fractional spacing allows the FSE to equalize directly to the symbol rate without the aliasing effects that would occur if downsampling were applied before equalization. Both equalizers use the monic constraint g0 = 1. The FSE uses a target of length L = 3, with an equalizer tap length of 2KFSE + 1 = 7 taps, and is designed by minimizing the expected squared error:
where is the difference (error) between the equalizer output and the desired output, is the FSE coefficient vector operating at the oversampled rate, and is the target bit sequence at the bit rate. After the FSE equalizes to the symbol rate, the signal distribution is simplified to a cleaner two-peak distribution, as shown in Figure 4b. In contrast, Figure 4c shows the equalized signal when a standard equalizer is used for H2, where the signal distribution remains less well-separated, confirming the advantage of the FSE. The output of the FSE is downsampled to produce at the bit rate.
In this paper, we focus on a monic constraint based on an MMSE [25] because it provides the best performance when compared with other constraints. Given that G = [g0 g1 g2]T denotes the target and F = [f−k … f0 … fk]T denotes the 1-D equalizer, gk and fk are the target and equalizer coefficients, respectively, and [•]T is the transpose operation. For the monic constraint, g0 is given a value of 1 to avoid the trivial solutions of G = F = 0. Therefore, if we minimize (6) and (7) according to the monic constraint, we obtain [8]
where is the Lagrange multiplier, I = [1 0 0]T, A is the 3 × 3 autocorrelation matrix of the user data sequence, R is the autocorrelation matrix of the readback data sequence, and P is the cross-correlation matrix of the two sequences. For the H1 path, the numbers of target and equalizer coefficients are fixed to 1 × 3 and 1 × 11 taps, respectively, so that R and P are of sizes 11 × 11 and 11 × 3, respectively. The H2 path is designed according to the same procedure with 1 × 3 and 1 × 7 taps, where R and P are formed from the oversampled sequence at twice the target rate. Note that the MMSE equalizer and target length for the H1 path are 11 and 3 taps, respectively, following our previous work [14]. The FSE length for the H2 path is 7 taps, spanning 3-bit periods, which is shorter than the 15-tap equalizer used for conventional BPMR in [10] to limit the complexity of the staggered structure.
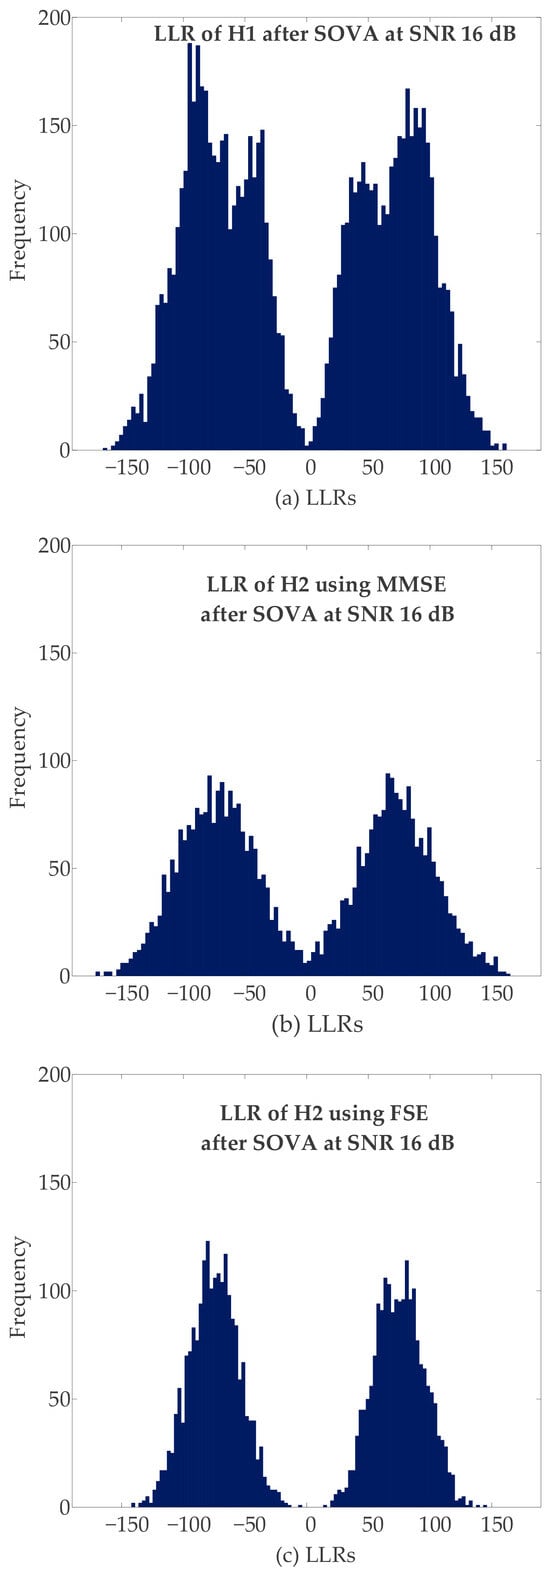
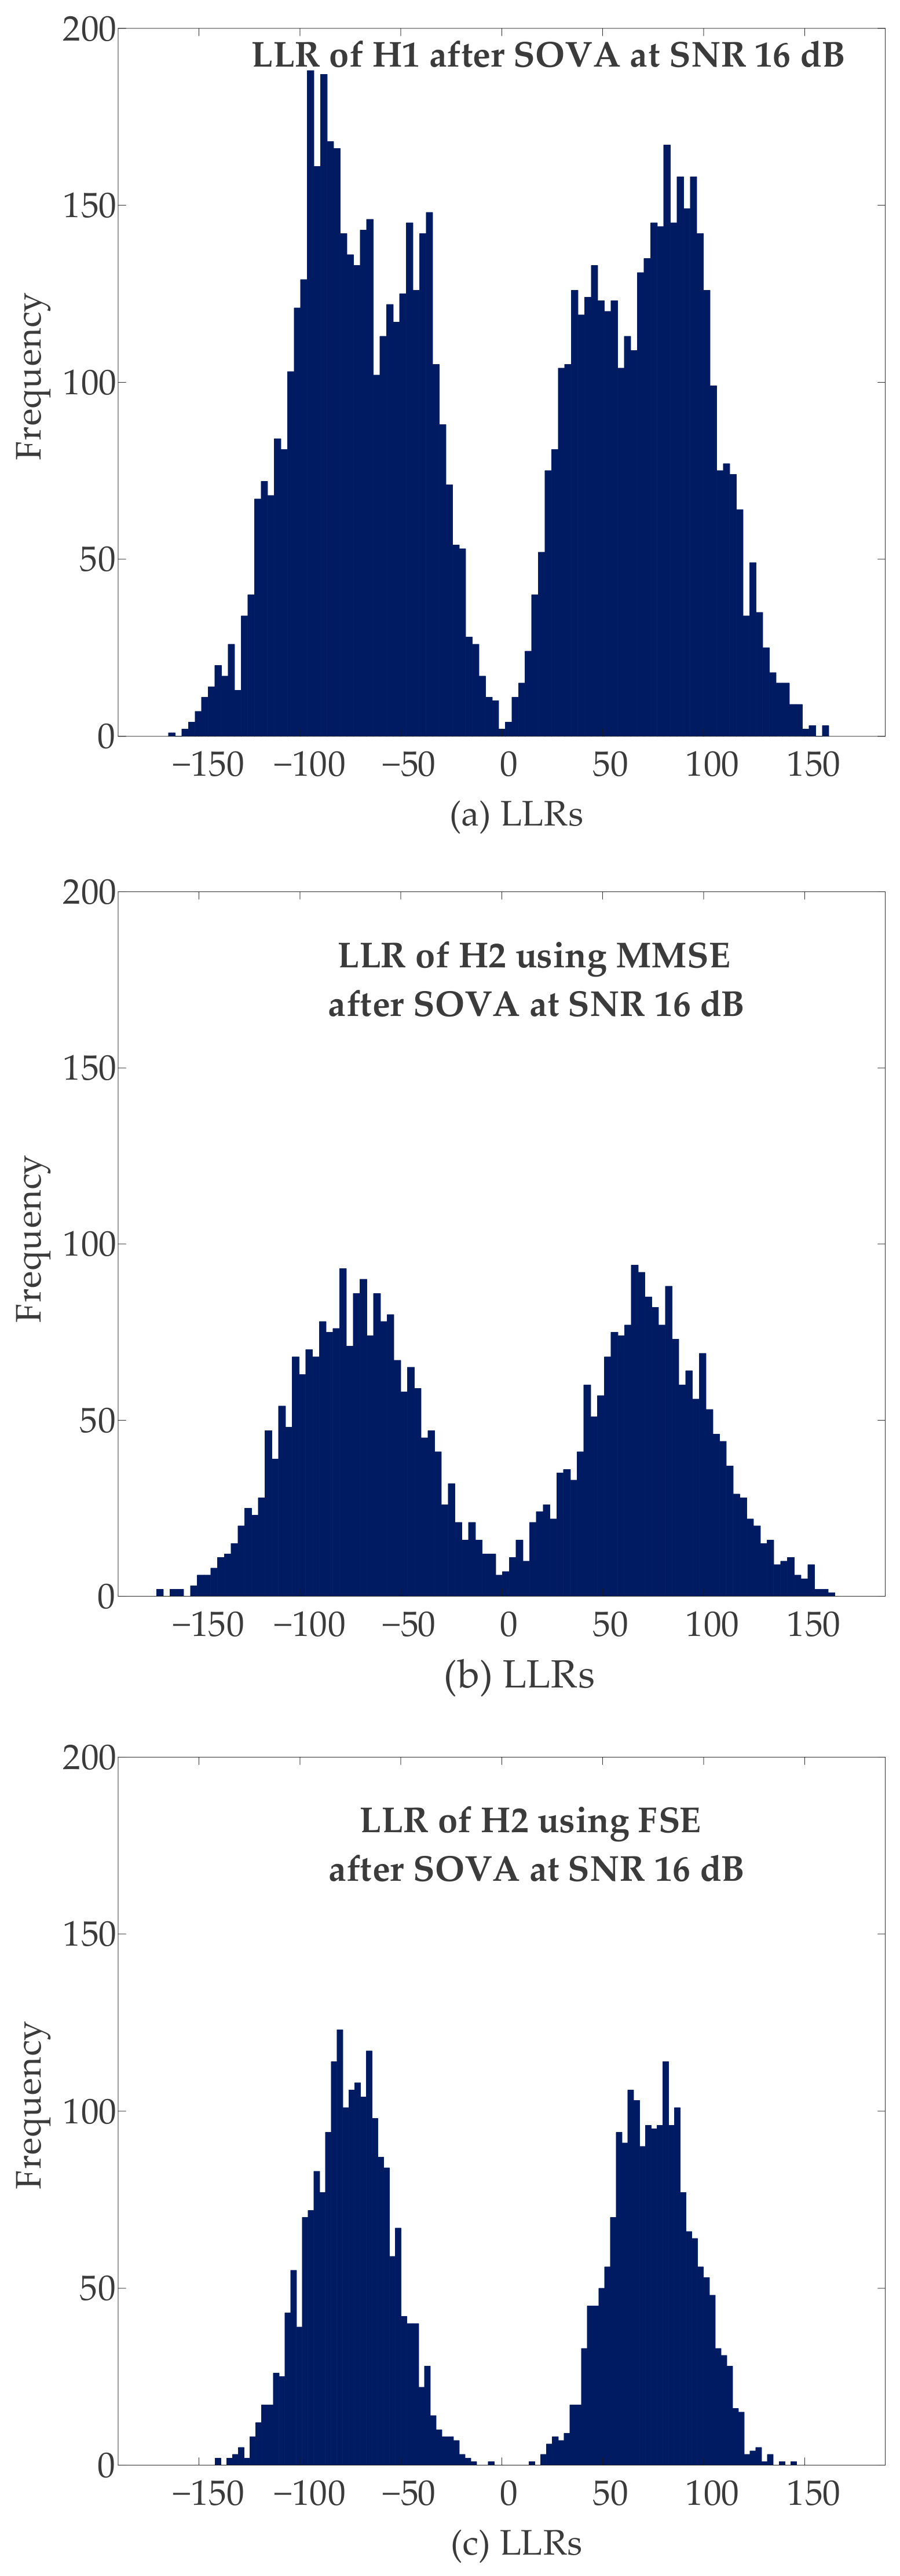
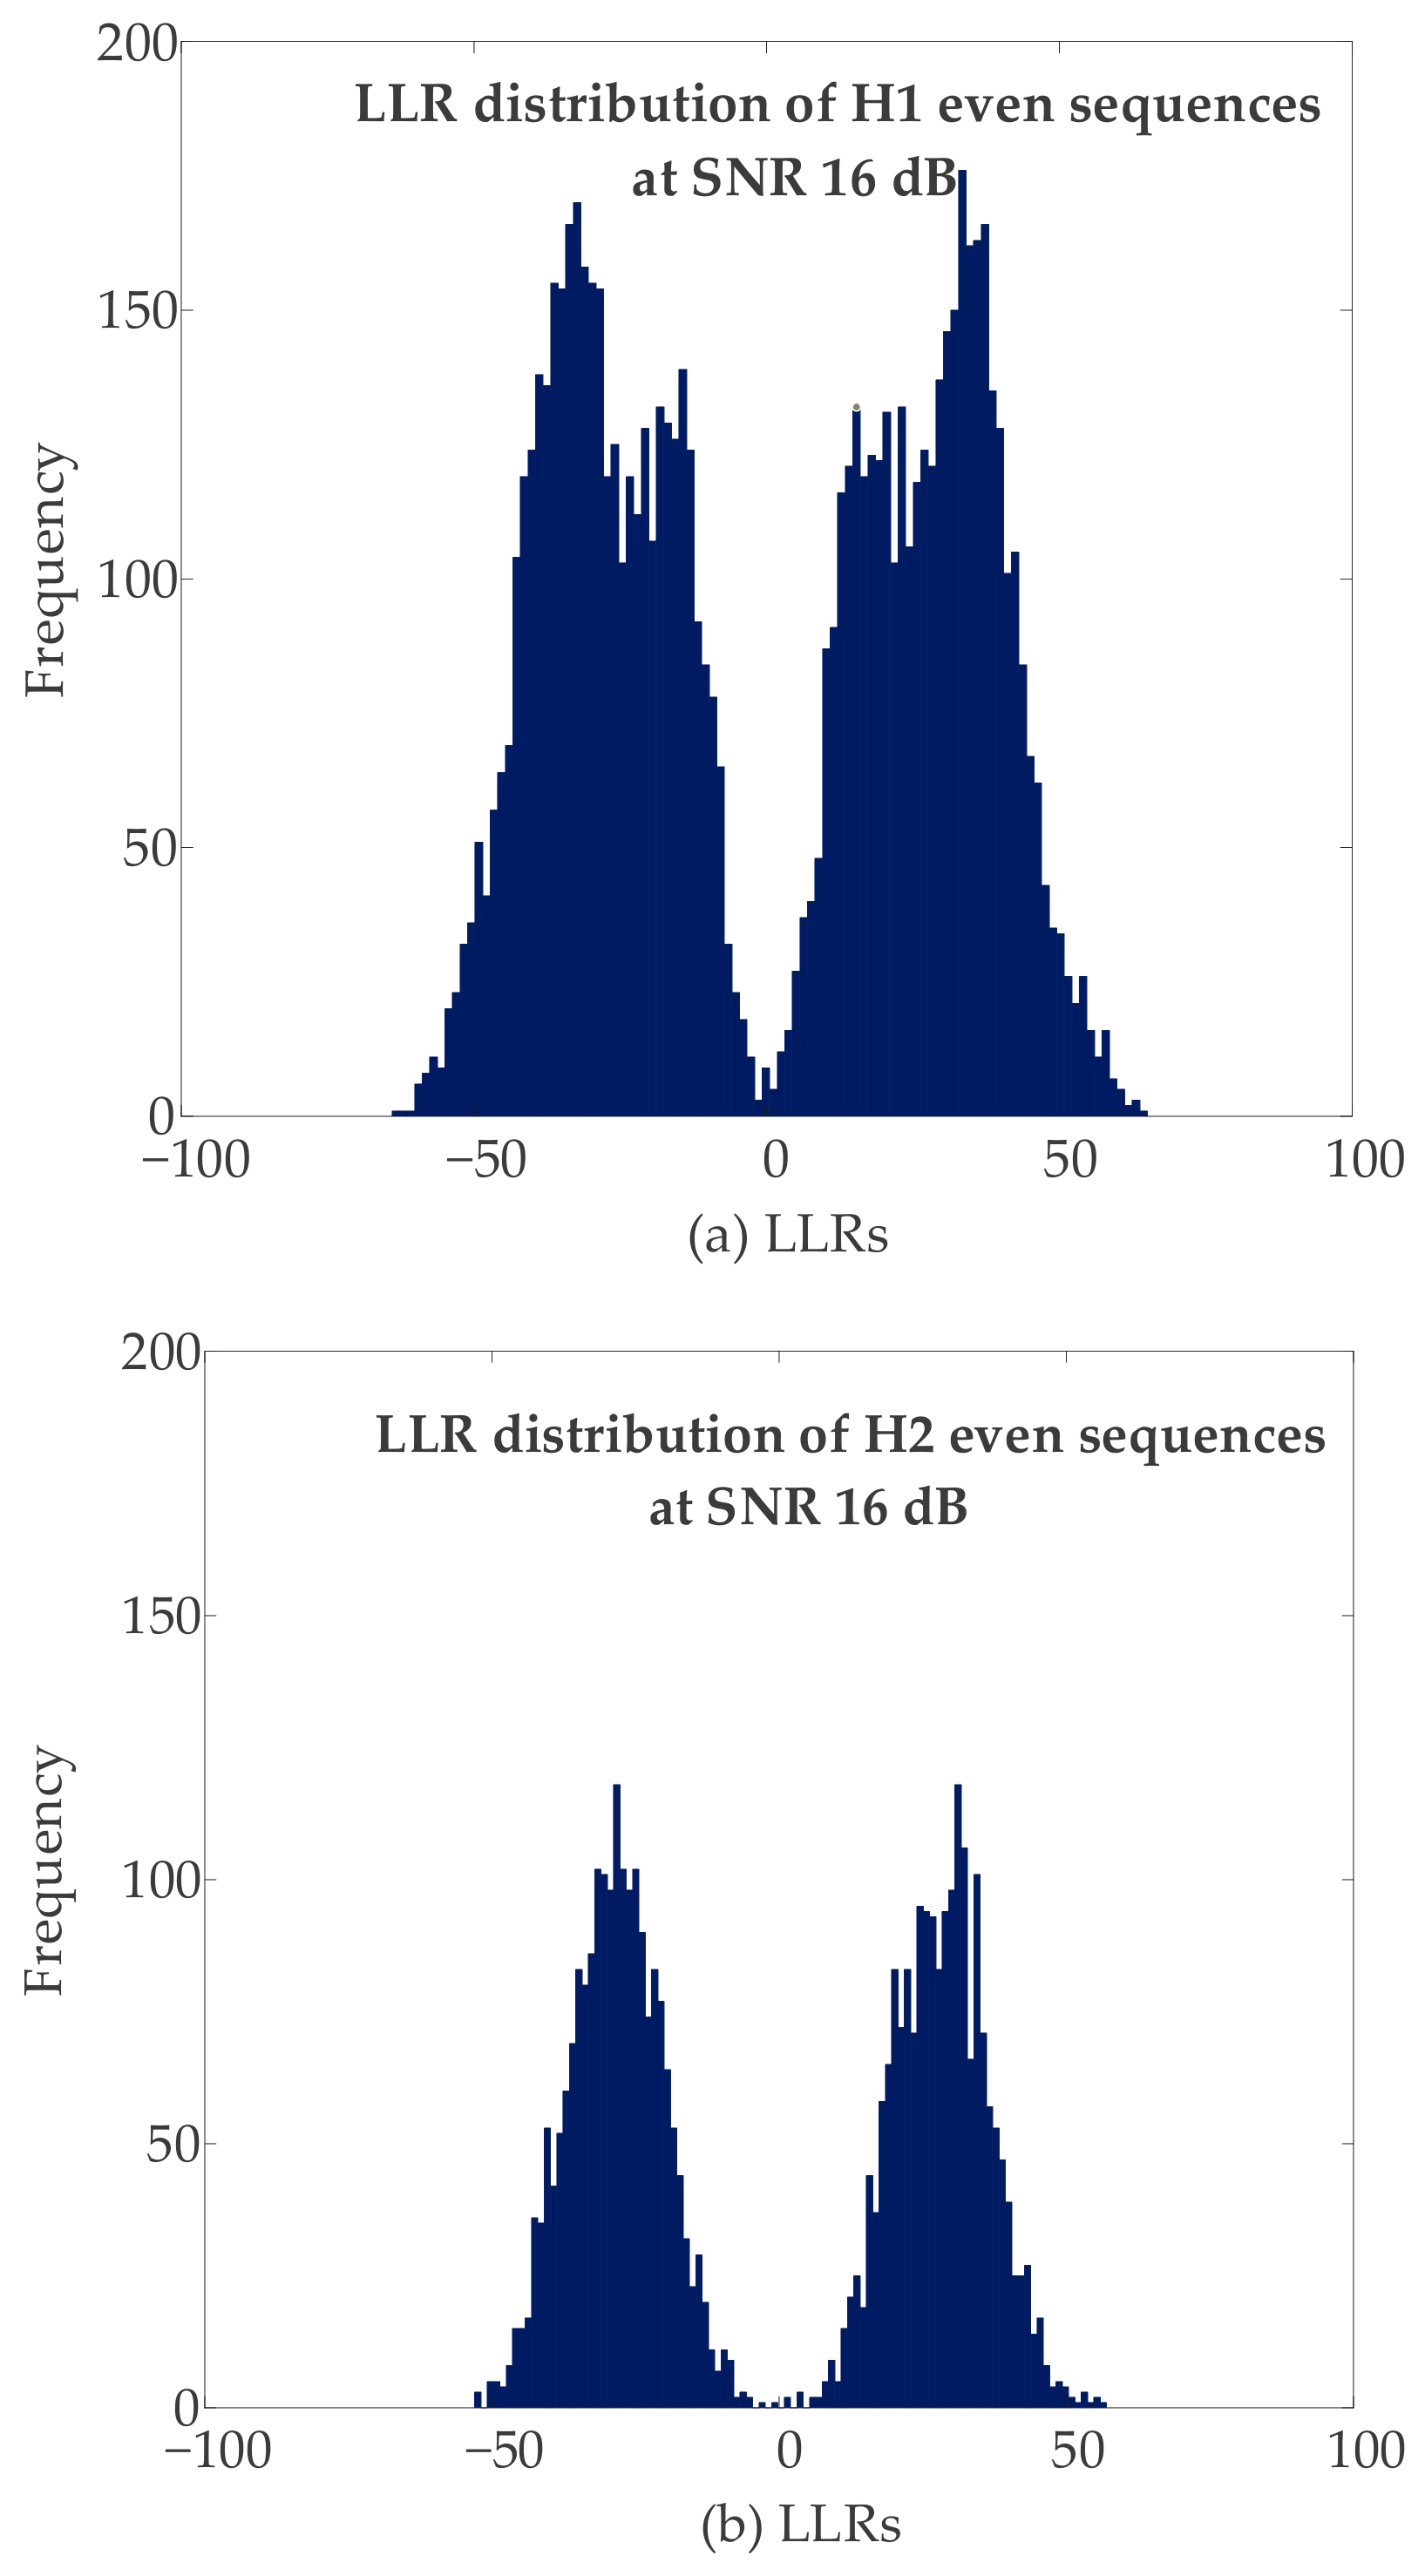
The FSE operates at the oversampled rate but is designed against a bit-rate target, so its output is downsampled by a factor of two to give at the bit rate before detection. On the H1 path, the target is defined at the oversampled rate, so is detected as it stands. Both are then processed by SOVA detectors [5] to generate the LLR sequences, and , respectively. The SOVA detector produces soft decisions in the form of LLRs, where the magnitude reflects the reliability of the corresponding bit decision and the sign indicates the detected bit value. The LLR distributions from H1 and H2 are shown in Figure 5a,b. As shown in Figure 5c, the distribution obtained using the FSE for the H2 path exhibits better separation than that obtained using the standard equalizer, further demonstrating the benefit of the FSE. The LLR sequence, from H1 is then downsampled to retain only the even-indexed samples, , corresponding to the bottom-layer bit positions, so that both LLRs cover the same 4000 bottom-layer bits. The two sequences, and , are then passed to the SSI technique described in the next subsection.
Figure 5.
Distributions of the LLRs after SOVA detection for (a) the H1 path, (b) the H2 path using the MMSE equalizer, and (c) the H2 path using the FSE.
3.2. Sum Soft-Information (SSI) Technique
After obtaining the LLR sequences, and , from H1 and H2, respectively, the SSI technique is applied to combine them and produce an enhanced LLR for the bottom layer. Combining soft information from multiple readers in this way has been shown to improve detection in staggered SL-BPMR [13] and in the lower layer of double-layered systems [17]. Here the same principle is applied to the bottom layer of the staggered DL-BPMR channel, where the two LLR sequences are obtained from readers at different cross-track positions rather than from repeated passes. The motivation for this combination is that both and represent soft information about the same bottom-layer bits, , obtained from two independent reader positions. By summing these two LLR sequences, the mutual information from both readers is exploited to improve the reliability of the bottom-layer bit decisions. The enhanced LLR, , is defined as
where is the downsampled even-indexed LLR sequence from H1 and is the LLR sequence from H2. The sign of is then passed to a threshold detector to produce the estimated bottom-layer bits:
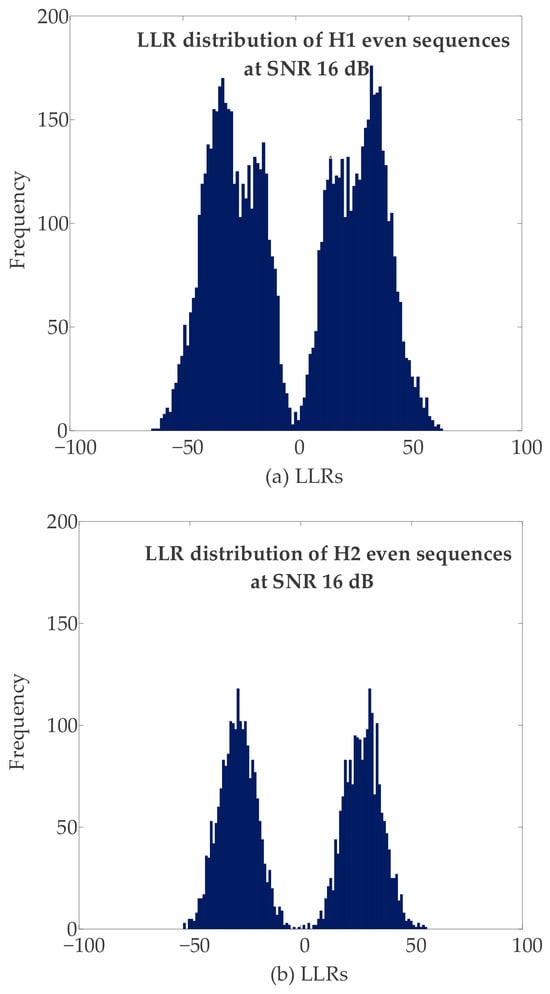
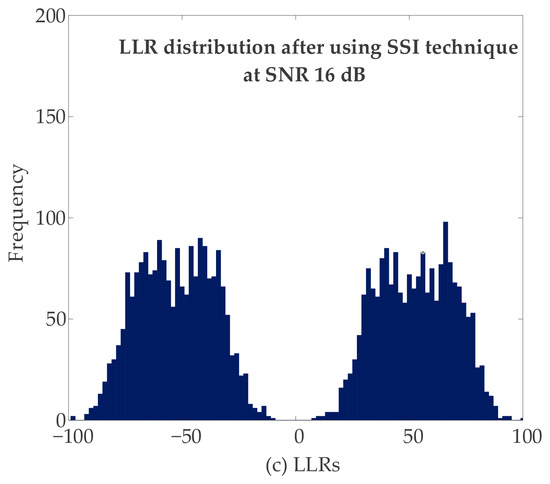
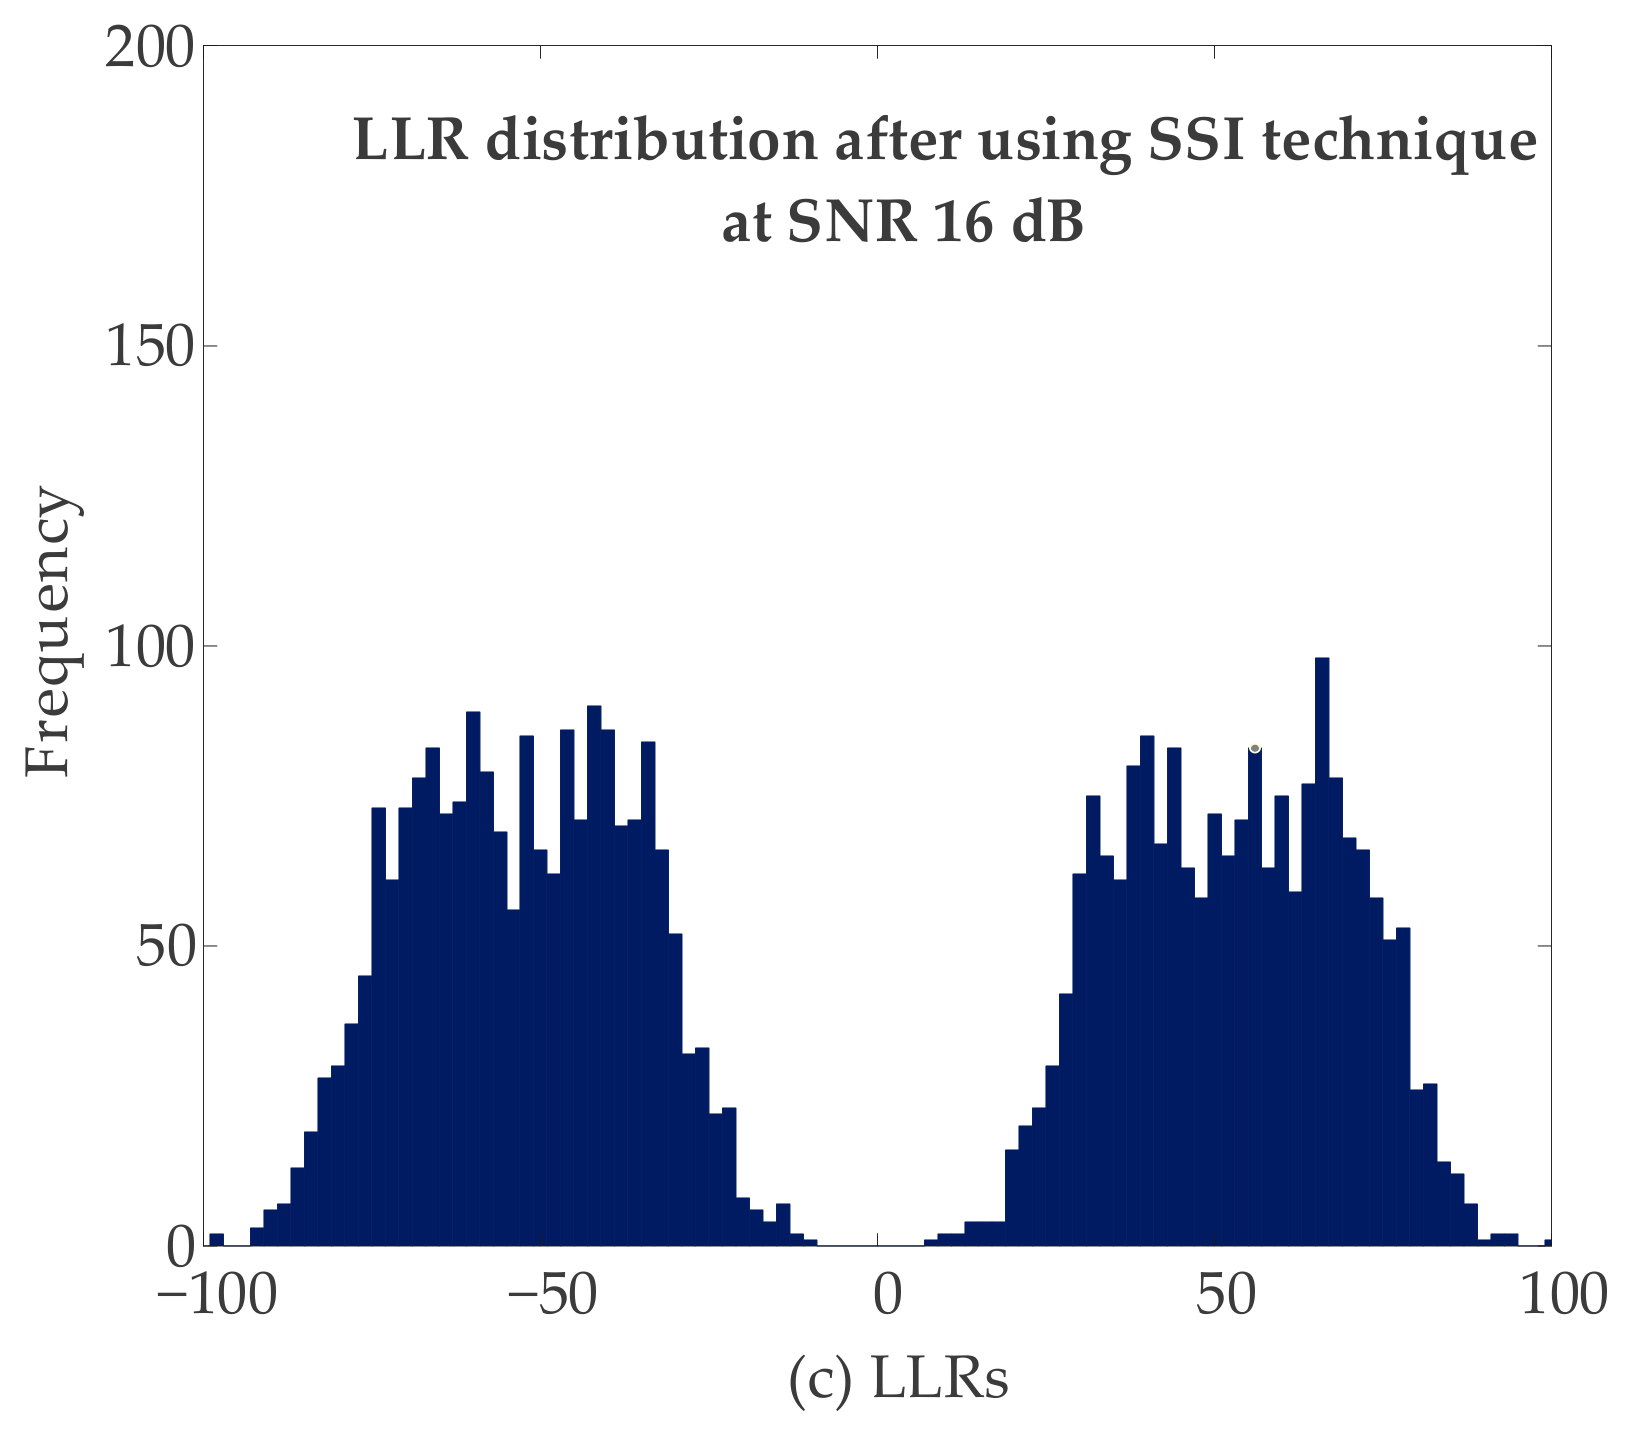
Figure 6a and Figure 6b shows the LLR distributions of and before applying the SSI technique, respectively. The overlapping area in the center of each distribution represents the region of uncertainty, where the detector cannot reliably distinguish between bit ‘−1’ and bit ‘+1’. A larger overlapping area implies a higher probability of bit error. Figure 6c shows the LLR distribution of after applying the SSI technique. It is evident that the overlapping area is significantly reduced relative to the individual LLR distributions, demonstrating that the SSI technique effectively enhances the reliability of the bottom-layer soft decisions. This improvement in LLR reliability directly translates to a lower BER for the bottom-layer detection, and the enhanced LLR, , subsequently serves as the key input for the top-layer ILI subtraction stage described in the next subsection.
Figure 6.
Distributions of the LLRs (a) from H1 at the even-indexed positions, (b) from H2, and (c) after combining both by the SSI technique.
3.3. Top-Layer Detection via ILI Subtraction
After obtaining the estimated bottom-layer bits, , and the enhanced LLR, , from the SSI technique, the next stage is to detect the top-layer bits, . Since the H1 readback signal, , contains a superposition of contributions from both the top and bottom layers, the ILI component contributed by the bottom layer must be reconstructed and subtracted from before the top-layer bits can be reliably detected. The top-layer bits are detected in two steps. A baseline weighted subtraction first removes the bulk of the ILI, producing a preliminary estimate of the top-layer bits; a CNN-enhanced subtraction then refines that estimate by predicting the residual interference left after the first step. We describe both steps below, and we also evaluate the baseline separately in Section 4 for comparison. The reconstruct-and-subtract approach adopted here follows the interference-cancellation techniques developed to suppress ITI in multi-head multi-track BPMR [11,12] and applies them to ILI rather than ITI.
3.3.1. Baseline Weighted Subtraction
The estimated bottom-layer bit sequence, , is first upsampled by padding zeros at the odd positions to form , which aligns the bottom-layer bit positions with the oversampled sequence. The reconstructed ILI signal is then obtained by convolving with the channel response coefficients h:
where h is the channel response coefficient vector obtained by sampling the reader sensitivity function of H1. In this work, h is represented as a 1 × 5 tap vector:
h = [h−2 h−1 h0 h1 h2] = [0.0106 0.1037 0.2731 0.1037 0.0106].
To achieve optimal ILI cancellation, a weighting factor, , is applied to the reconstructed signal before subtraction, since the reconstructed amplitude, , does not perfectly match the actual ILI amplitude present in . The cleaned signal, , is obtained from
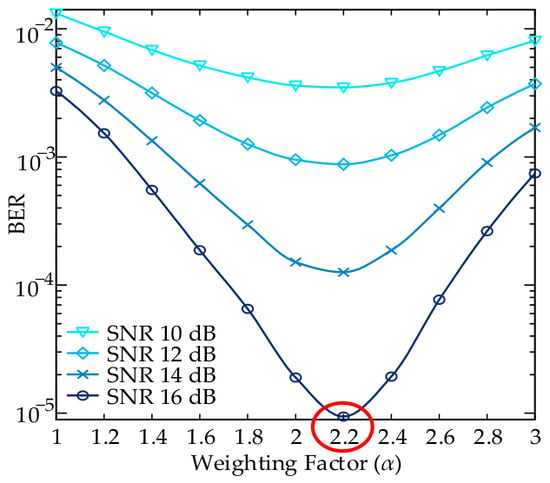
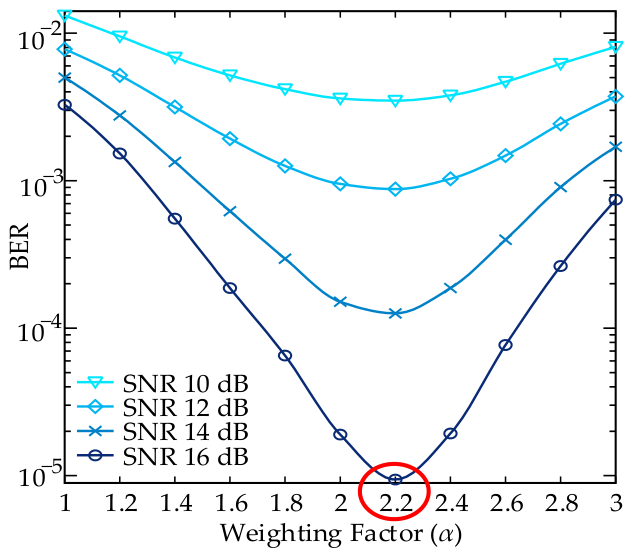
where is the weighting factor determined through simulation. Figure 7 shows the BER performance versus the weighting factor, , at SNR levels of 10, 12, 14, and 16 dB. The results indicate an optimal value of , which consistently minimizes the BER across all tested SNR levels, demonstrating that the optimal weighting factor is largely independent of the SNR. This value of is therefore used for the remainder of this study. Note that corresponds to the unweighted reconstruction used in the CNN-based scheme of Section 3.3.2, so the BER at in Figure 7 represents the unweighted baseline without the CNN.
Figure 7.
BER performance versus the weighting factor, , at SNR levels of 10, 12, 14, and 16 dB.
Figure 8a shows the distribution of the cleaned signal, , obtained after applying the weighted subtraction, which exhibits a distribution closer to a two-peak structure compared to the original mixed readback signal in Figure 3a, indicating that a substantial portion of the ILI has been removed. The cleaned signal, , is then downsampled to retain only the top-layer bit positions, producing . Figure 8b shows the distribution of after downsampling, which exhibits a more clearly separated two-peak structure than before downsampling. This is because downsampling removes the interleaved bottom-layer sample positions, leaving only the top-layer samples that were the direct target of the ILI subtraction process. This sequence is then equalized using an MMSE equalizer to produce , which is processed by a SOVA detector to produce the estimated top-layer bits, .
Figure 8.
Distributions of the cleaned signal after weighted subtraction, (a) at the oversampled rate and (b) after downsampling to the top-layer bit positions.
3.3.2. CNN-Enhanced Subtraction
Although the baseline weighted subtraction in Equation (15) can effectively remove a large portion of the ILI component, the bottom layer reconstructed signal, , is generated from the hard-decision bits, , which discard the soft reliability information available in . Moreover, the fixed channel response, h, used in Equation (13) does not account for residual noise and imperfect equalization after SSI combination. As a result, the baseline subtraction leaves a residual interference component that limits further BER improvement.
To address this limitation, we employ a CNN to predict the residual interference that baseline subtraction cannot capture. Neural networks have been used in a similar role in multilayer and TDMR, where a network estimates the media noise or the residual channel response left by a fixed linear model [22,23]. Unlike the baseline method, which relies on the hard-decision sequence, , the CNN directly observes the raw readback signal, , together with the soft LLR sequence, , allowing it to make a more accurate estimate of the ILI component, including the effects of noise that propagate through the hard-decision-based reconstruction.
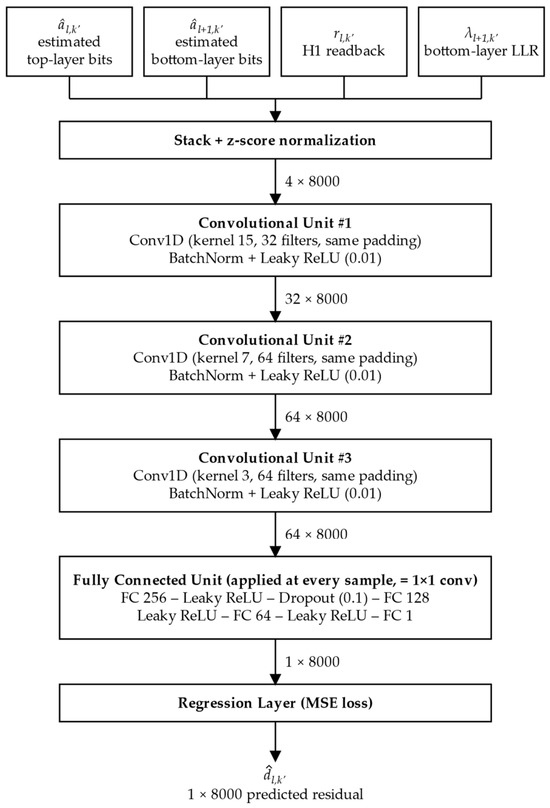
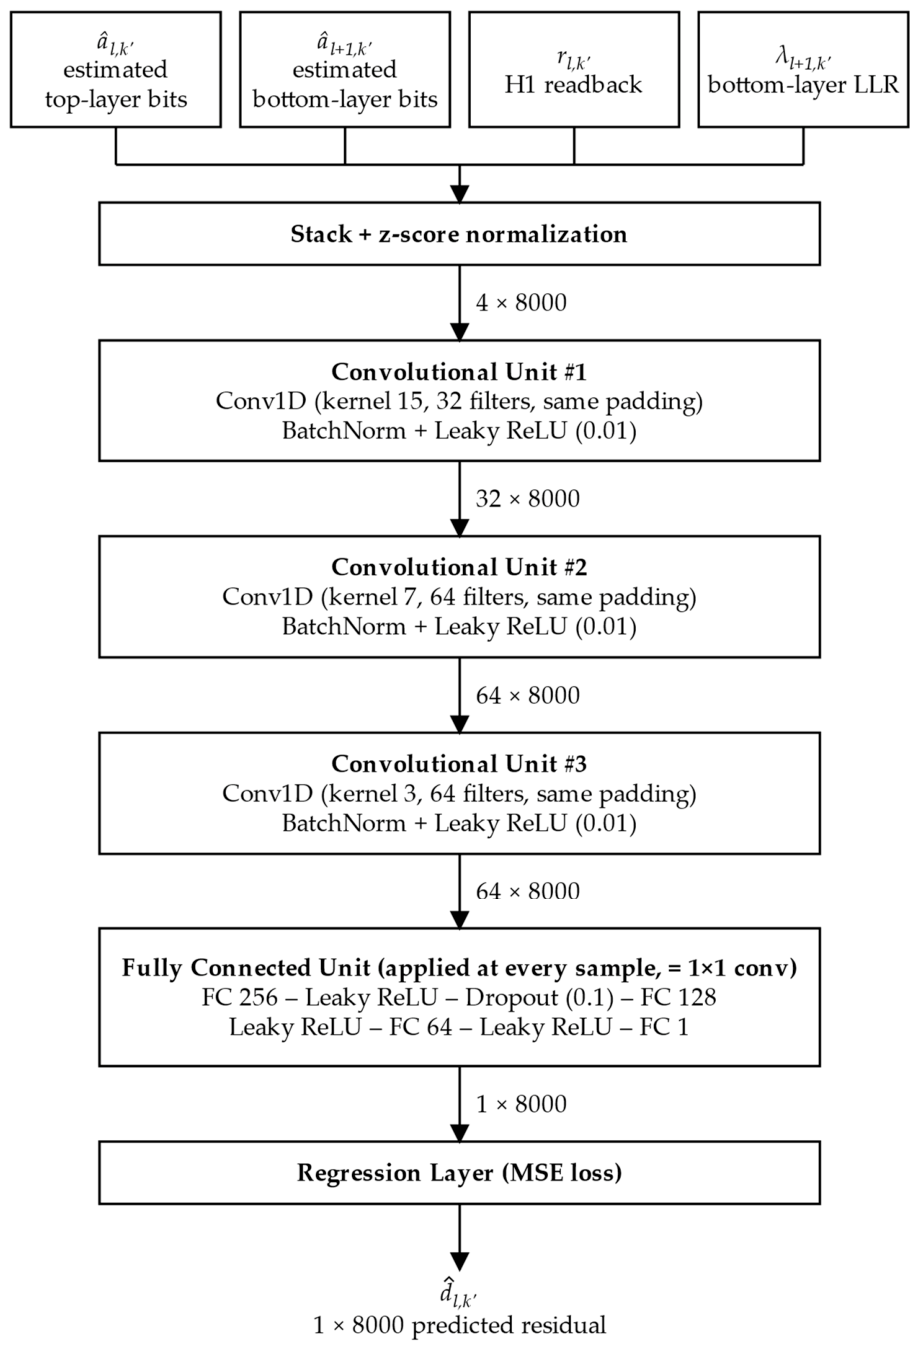
Figure 9 illustrates the proposed CNN architecture. The network takes four input channels, each of length 8000 samples, so that all four share the oversampled readback signal. The first channel is the raw readback signal, , which is already at the oversampled rate. The other three are bit-rate sequences of length 4000 and are therefore upsampled by a factor of two before use. Each value is written to the oversampled index at which the corresponding bit-island is sampled, and all remaining positions are set to zero. Because of the staggered geometry, the bottom-layer enhanced LLR, , and the estimated bottom-layer bits, occupy the even positions, while the estimated top-layer bits, , occupy the odd positions. Since the training dataset is generated at an SNR of 16 dB, where the BER of both layers is already very low, the estimated bit sequences, and , closely match the true recorded bits and can therefore be reliably used as training inputs. The estimated bottom-layer sequence is taken from the SSI stage of Section 3.2, and the estimated top-layer sequence from the baseline subtraction of Section 3.3.1; no recorded bit sequences are used at inference, and replacing the estimates with the true sequences leaves the BER essentially unchanged. The four input channels are stacked and z-score normalized. As shown in Figure 9, the network architecture consists of three 1-D convolutional layers with kernel sizes of 15, 7, and 3, and 32, 64, and 64 filters, respectively, each followed by batch normalization and a leaky rectified linear unit (Leaky ReLU) activation. The convolutional layers are followed by three fully connected layers of sizes 256, 128, and 64, each with a Leaky ReLU activation, and a dropout layer with rate 0.1 after the first fully connected layer to reduce overfitting. The final output layer is a single fully connected node that produces the predicted residual interference, , at each sample position. The convolutional layers use the same padding, so the sequence length of 8000 samples is preserved. The fully connected layers are applied independently at every time step with weights shared across time, so they are equivalent to 1 × 1 convolutions. They map the 64 feature channels at each sample to a single output value. The network therefore outputs a 1 × 8000 residual sequence aligned with the readback samples.
Figure 9.
Architecture of the proposed CNN.
The CNN is trained to predict the residual signal defined as the difference between the ideal bottom-layer contribution and the baseline reconstruction in (13), that is, the portion of the ILI that the baseline weighted subtraction fails to remove. The training dataset is generated at an SNR of 16 dB and consists of 500 realizations of 4000-bit sequences. The network is trained to minimize the mean-squared error between the predicted and target residual sequences, using the Adam optimizer with an initial learning rate of 0.005, which is reduced by a factor of 0.2 every 10 epochs, over a maximum of 40 epochs with a mini-batch size of 32. An L2 regularization factor of 0.0001 is applied to encourage the network output to approach zero at high SNR, where little residual interference remains.
During inference, the predicted residual, , is subtracted together with the baseline reconstruction from the H1 readback signal without weighting to obtain the CNN-enhanced cleaned signal:
The CNN-cleaned signal, , is still at the oversampled rate and contains samples at both the odd and even positions. Since the ILI contributed by the bottom layer has now been removed, the sequence is downsampled to retain only the odd positions, giving at the bit rate. As this cleaned signal differs from the original readback signal, because its interference component has been subtracted, the equalizer and target have to be newly designed. A new 1 × 11-tap equalizer and 1 × 3-tap target are consequently designed from under the same monic constraint of Equations (8)–(10), producing the equalized sequence . This sequence is processed by a SOVA detector to produce the LLR sequence , whose sign gives the estimated top-layer bits, . The same downsampling, equalization, and detection chain is used in the baseline method of Section 3.3.1. The two schemes differ in the predicted residual term in Equation (16) and in the weighting factor applied in Equation (15). The BER of the baseline method at in Figure 7 separates these two effects, so the gain of the proposed scheme over that point is attributable to the CNN, which also compensates for the amplitude mismatch that corrects in Equation (15).
4. Simulation Results
This section evaluates the BER performance of the proposed detection framework for the staggered DL-BPMR system described in Section 2 and Section 3. Because the bottom-layer and top-layer bits are detected through different processing stages, we examine their performance separately. For each SNR point in this study, we simulated 10,000 blocks of 4000 bits (4 × 107 bits), so the smallest non-zero BER we can observe is 2.5 × 10⁻⁸ (one error). BER values above about 2.5 × 10⁻⁷ correspond to at least 10 observed errors and are statistically reliable; lower values are indicative only, and where no errors were observed, the BER is stated as below 10−7. For clarity, the evaluated schemes are abbreviated as follows:
- -
- H2-BOT-MMSE, bottom-layer detection using the reader H2 signal downsampled to the bit rate and equalized by a conventional 1 × 11-tap MMSE equalizer designed under the same monic constraint, in place of the proposed FSE.
- -
- H2-BOT-FSE, bottom-layer detection using the reader H2 signal equalized by the proposed FSE, prior to combination with H1.
- -
- BOT-SSI, the proposed bottom-layer detection scheme, combining the reader H1 and reader H2 LLRs using the SSI technique.
- -
- H1-TOP-MMSE, top-layer detection directly obtained from the MMSE-equalized H1 signal, without ILI subtraction.
- -
- TOP-Sub, top-layer detection after ILI cancellation using the baseline weighted subtraction method, which also serves as the first step of the proposed scheme.
- -
- TOP-CNN-sub, the proposed top-layer detection scheme, in which ILI cancellation is enhanced using the CNN-based residual predictor.
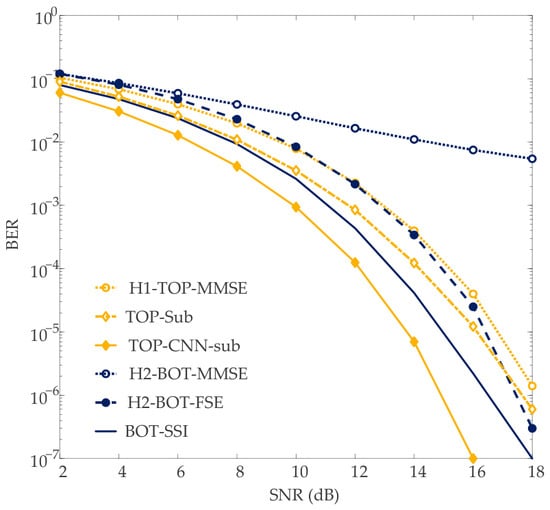
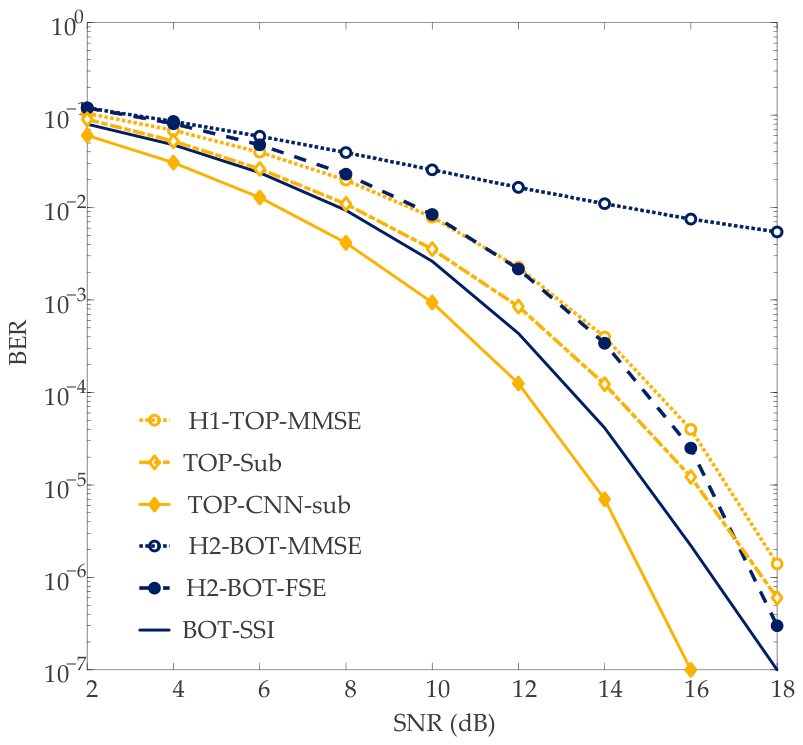
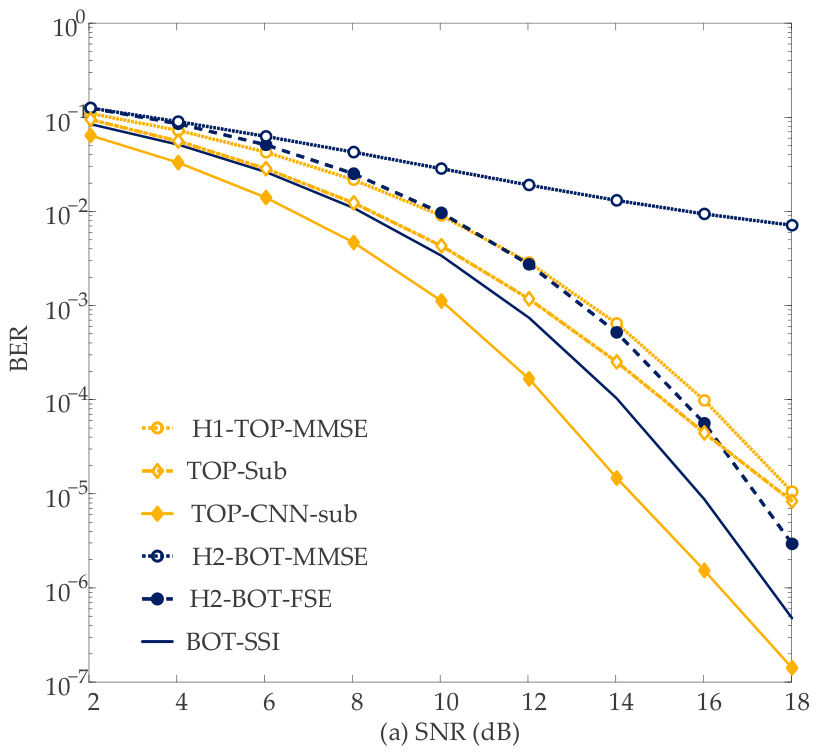
As shown in Figure 10, for bottom-layer detection, H2-BOT-MMSE consistently shows the weakest performance among all six schemes, with its BER decreasing only gradually as SNR increases and remaining above 4 × 10⁻² even at the highest SNR of 18 dB. This confirms, as already anticipated from the equalized-signal distributions in Figure 4c, that a conventional equalizer cannot adequately resolve the multi-peak amplitude distribution caused by the two-layer signal superposition. Replacing the conventional equalizer with the FSE (H2-BOT-FSE) reduces the BER by more than an order of magnitude at a given SNR, e.g., from 1.1 × 10⁻² to 3.4 × 10⁻⁴ at an SNR of 14 dB. Combining the LLRs from FSE-equalized H2 and H1, which are mutually dependent, using the proposed SSI technique shows that BOT-SSI provides an additional SNR gain of approximately 2 dB at a BER of 10−5 over H2-BOT-FSE alone, confirming that the two readers carry complementary information that the SSI technique successfully exploits.
Figure 10.
BER versus SNR at a total AD of 4.0 Tb/in2 with 4 × 107 bits per layer per SNR point. Bottom layer: H2-BOT-MMSE and H2-BOT-FSE (H2 with the conventional MMSE and proposed FSE equalizers, respectively) and BOT-SSI (SSI of H1 and H2). Top layer: H1-TOP-MMSE (no ILI subtraction), TOP-Sub (baseline weighted subtraction), and TOP-CNN-sub (CNN-enhanced subtraction).
For top-layer detection, detecting the top-layer bits directly from the MMSE-equalized H1 signal without ILI cancellation (H1-TOP-MMSE) performs comparably to uncombined H2-BOT-FSE, since the ILI from the bottom layer continues to corrupt the top-layer decision when left unaddressed. Applying the baseline weighted subtraction (TOP-Sub) removes a substantial portion of this interference, providing an SNR gain of approximately 1 dB at a BER of 10−4 over H1-TOP-MMSE. Replacing the baseline subtraction with the proposed CNN-enhanced subtraction (TOP-CNN-sub) provides a further gain of approximately 2 dB at the same BER, since the CNN is able to predict the residual ILI component that the fixed-weight baseline subtraction fails to capture. Compared with the unweighted baseline, i.e., in Figure 7, which uses the same reconstruction as the CNN-based scheme, TOP-CNN-sub lowers the BER from approximately 2 × 10⁻³ to approximately 10−7 at an SNR of 16 dB, confirming that the improvement comes from the CNN-predicted residual rather than the weighting factor.
Overall, TOP-CNN-sub achieves the best performance among all six schemes, reaching its simulated BER floor at an SNR of 16 dB, roughly 2 dB earlier than BOT-SSI reaches the same floor near 18 dB. Relative to H2-BOT-FSE alone, the proposed bottom-layer scheme (BOT-SSI) provides a consistent SNR gain of approximately 2 dB across the BER range of 10−4 to 10−5, confirming that the SSI combination yields a stable improvement beyond what either single reader can achieve. These results demonstrate that combining the dual-reader SSI technique for bottom-layer detection with the CNN-enhanced ILI subtraction for top-layer detection yields substantial and consistent BER improvements over their respective baselines for both recording layers of the staggered DL-BPMR system.
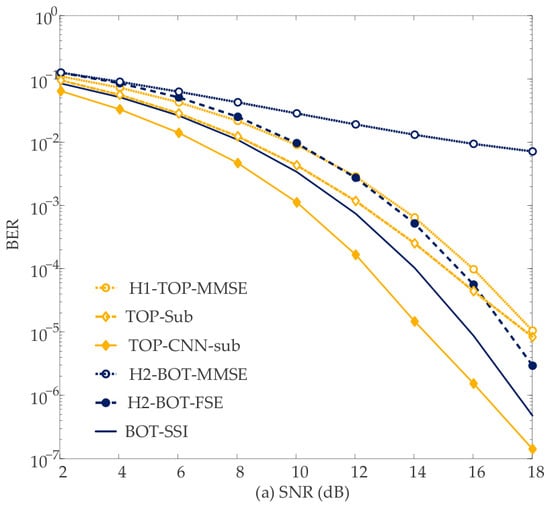
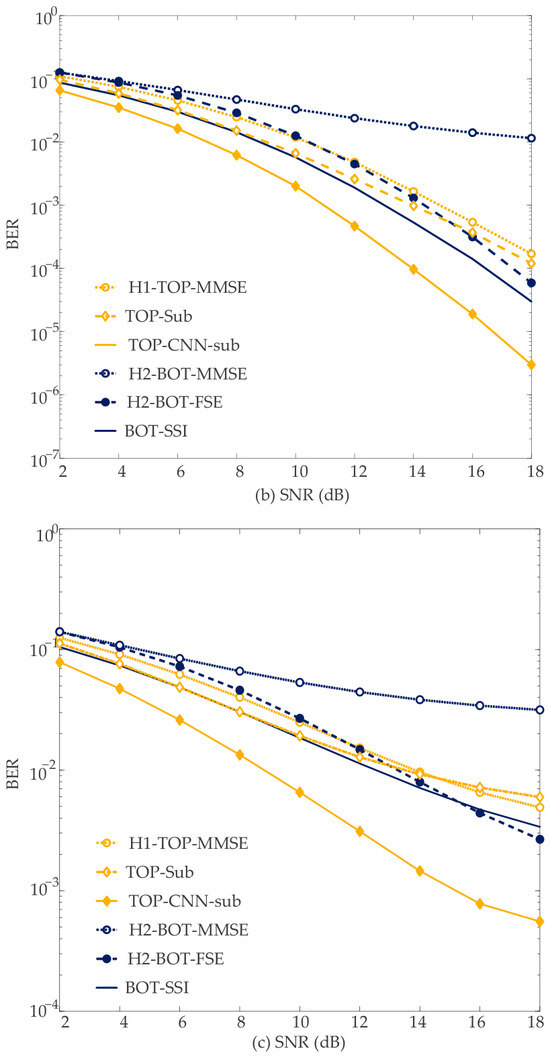
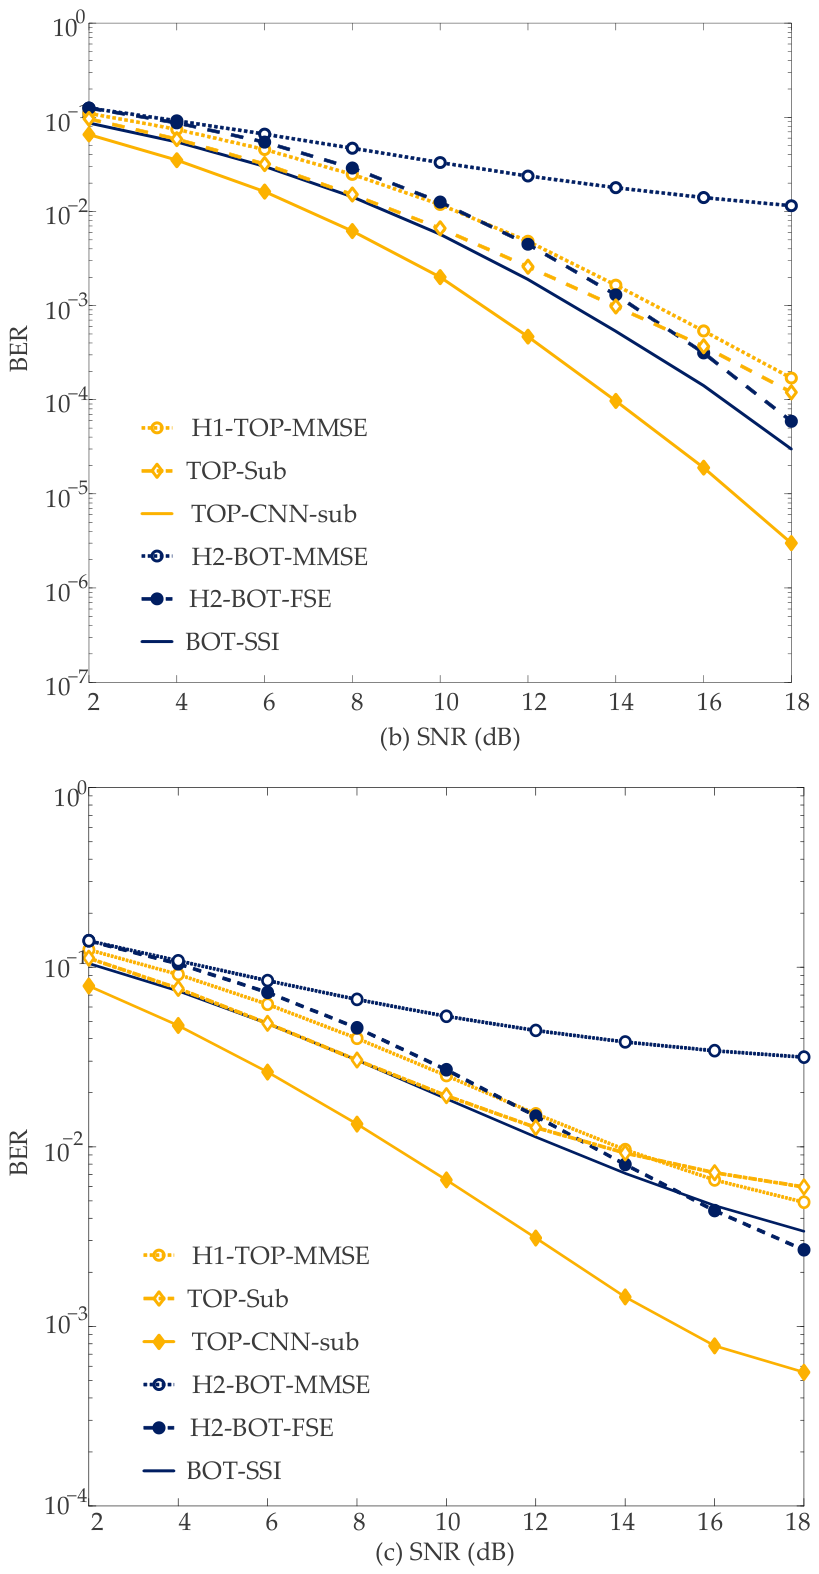
Figure 11 shows BER performance with 5%, 10%, and 20% media noise, including fluctuations in both the size and position of the bit islands according to the model described in Section 2. As expected, all schemes require a higher SNR to achieve a given BER than in the noise-free case.
Figure 11.
BER versus SNR at a total AD of 4.0 Tb/in2 in the presence of (a) 5%, (b) 10%, and (c) 20% media noise, with 4 × 107 bits per layer per SNR point. Bottom layer: H2-BOT-MMSE and H2-BOT-FSE (H2 with the conventional MMSE and proposed FSE equalizers, respectively) and BOT-SSI (SSI of H1 and H2). Top layer: H1-TOP-MMSE (no ILI subtraction), TOP-Sub (baseline weighted subtraction), and TOP-CNN-sub (CNN-enhanced subtraction). The CNN is trained at 16 dB without media noise.
For bottom-layer detection, the schemes remain in the same relative order. H2-BOT-MMSE remains the weakest, with its BER decreasing slowly and remaining near 10−2 at an SNR of 18 dB, again confirming that a conventional equalizer cannot resolve the multi-peak amplitude distribution produced by the two-layer superposition. H2-BOT-FSE continues to provide a substantial improvement over H2-BOT-MMSE across the entire SNR range, and BOT-SSI maintains a comparable advantage, reaching a BER of approximately 3 × 10⁻⁵ at 18 dB. This indicates that the benefit of combining the two readers’ mutual soft information is retained in the presence of media noise.
For top-layer detection, the behavior of the baseline weighted subtraction changes noticeably in the presence of media noise. While TOP-Sub still improves upon H1-TOP-MMSE at low and moderate SNR, its BER curve flattens above 18 dB and saturates near 1.5 × 10⁻⁴. This behavior arises because the baseline reconstruction in Equation (13) relies on a fixed channel response, h, and a fixed weighting factor, , both of which are calibrated for the ideal island geometry. When island sizes and positions fluctuate, the true ILI contribution deviates from this fixed model, so the subtraction introduces its own reconstruction error. At low SNR, this error is masked by the dominant electronic noise, but at high SNR it becomes the limiting impairment and produces the observed error floor.
The proposed CNN-enhanced subtraction does not exhibit this limitation. TOP-CNN-sub achieves the lowest BER among all schemes across the entire SNR range and continues to improve up to 18 dB, reaching approximately 4 × 10⁻⁶. Its advantage over TOP-Sub is considerably larger than in the noise-free case, since the CNN estimates the residual interference directly from the readback signal and enhanced soft information rather than relying on a fixed channel model, and can therefore accommodate deviations introduced by island fluctuations. The CNN used here is the same model trained at an SNR of 16 dB without media noise; no retraining was performed for the media-noise case. The CNN therefore remains effective for media-noise levels of 5%, 10%, and 20%, although it was trained without media noise. To assess sensitivity to the media-noise level, we also evaluated the same CNN at 5% and 20% media noise in Figure 11a–c. At an SNR of 18 dB, TOP-CNN-sub reaches a BER of 1.5 × 10⁻⁷ at 5% and 5.5 × 10⁻⁴ at 20%, compared with 8 × 10⁻⁶ and 5 × 10⁻³ for TOP-Sub. We did not retrain the model because we assume the receiver does not know the media-noise level in practice.
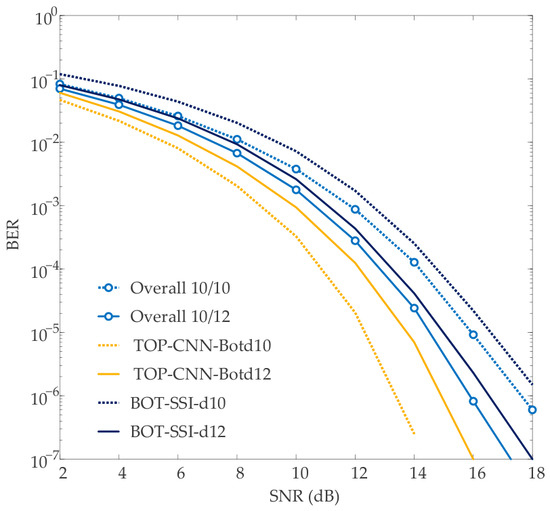
To assess the impact of the unequal island-diameter design, the system was also simulated with both layers using an identical island diameter of 10 nm (10/10) and compared with the proposed 10/12 configuration. In both cases, the same reader is used, so the channel response coefficients, h, remain unchanged, while the equalizer and target coefficients are redesigned for each geometry. For each geometry, we trained the CNN on data generated with that geometry. Figure 12 shows the results, where the overall BER is the average of the bottom- and top-layer BERs.
Figure 12.
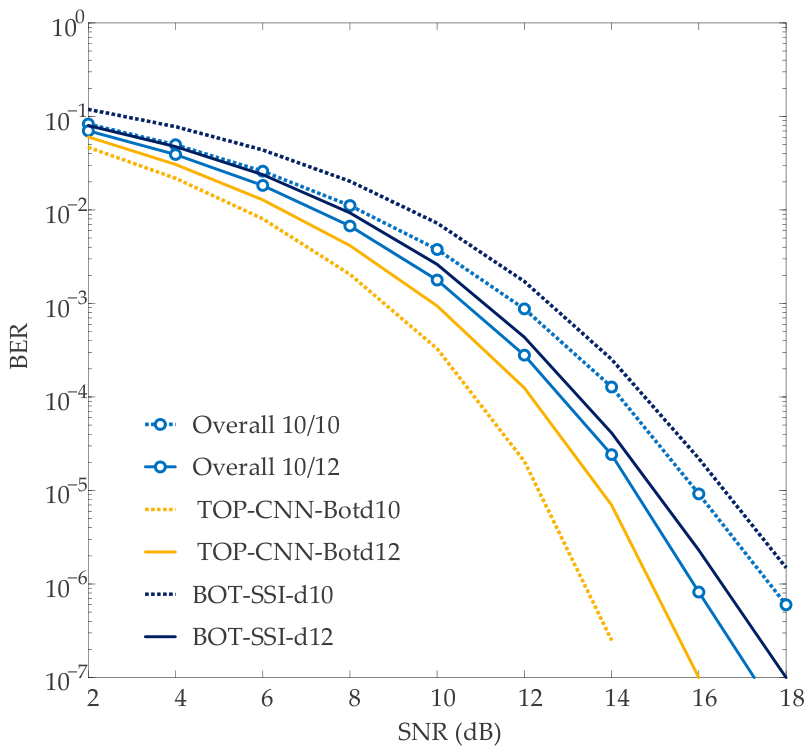
BER versus SNR at a total AD of 4.0 Tb/in2 with 4 × 107 bits per layer per SNR point, for bottom-layer island diameters of 10 nm (10/10) and 12 nm (10/12). BOT-SSI-d10 and BOT-SSI-d12: bottom layer with SSI of H1 and H2; TOP-CNN-Botd10 and TOP-CNN-Botd12: top layer with CNN-enhanced subtraction; and Overall: average BER of the two layers.
Enlarging the bottom-layer islands from 10 nm to 12 nm improves detection on the bottom layer; BOT-SSI-d12 achieves an SNR gain of approximately 1.5 dB over BOT-SSI-d10 at a BER of 10−5, consistent with the larger islands producing a stronger readback signal and thereby compensating for the greater reader-to-layer distance. In contrast, the TOP-CNN-Botd12 underperforms TOP-CNN-Botd10 by approximately 1 dB at a BER of 10−5, since the larger bottom islands give a stronger ILI component into the H1 readback signal. Because the bottom layer’s 1.5 dB gain outweighs the top layer’s 1 dB loss, the overall 10/12 configuration achieves an SNR improvement of approximately 1.25 dB over the 10/10 configuration at a BER of 10−5.
Because the gain achieved on the bottom layer outweighs the top layer’s degradation, the overall system performance follows this improvement. The 10/12 configuration drops below 10−7 beyond 17 dB, compared with approximately 7.5 × 10⁻⁷ for the 10/10 configuration at 18 dB, achieving nearly an order-of-magnitude reduction in overall error rate. These results confirm the design rationale described in Section 2: strengthening the readback contribution of the weaker layer improves not only its own detection but also the quality of the ILI cancellation applied to the stronger layer.
Finally, to evaluate the computational cost of the proposed scheme, we counted the elementary arithmetic operations required to process one detected bit, following the convention of [14]. These include the multiplications and additions in the equalizers, SOVA detectors, interference reconstruction and subtraction, and the CNN, as summarized in Table 1. The equalizers and SOVA detectors require about 200 operations per bit for BOT-SSI and about 310 for TOP-Sub, whereas the CNN adds about 172,000 multiplications and 172,000 additions per top-layer bit. The CNN therefore dominates the proposed system’s complexity, and its additional gain of about 2 dB, maintained even under media noise, comes at this added cost.
Table 1.
Computational complexity per detected bit of the equalizers, detectors, reconstruction and interference subtraction, and CNN.
5. Conclusions
This paper has presented a two-reader detection framework for staggered dual-layer bit-patterned magnetic recording at an areal density of 4.0 Tb/in2, in which both layers are read simultaneously by oversampling each reader output at half the bit period. One reader, H1, is placed between the tracks, and the other, H2, is at the center of the adjacent track. Detection is carried out in two stages: the bottom layer is recovered first from the mutual data available at both readers, and the resulting soft information is then used to cancel the inter-layer interference that corrupts the top layer.
For the bottom layer, replacing the conventional equalizer on the H2 path with a fractionally spaced equalizer allows the oversampled readback sequence to be equalized directly at the bit rate, eliminating the aliasing that arises when downsampling precedes equalization and reducing the BER by more than an order of magnitude. Combining the resulting LLR sequence with the even-indexed LLRs from H1, using the sum soft-information technique, narrows the overlap region of the LLR distribution and yields an additional SNR gain of approximately 2 dB at a BER of 10−5. For the top layer, reconstructing the bottom-layer contribution from the enhanced LLR and subtracting it from the H1 readback signal with a fixed weighting factor improves the BER by approximately 1 dB at a BER of 10−4. Replacing this fixed reconstruction with the proposed CNN-enhanced subtraction, in which a convolutional network predicts the residual interference that the fixed-weight model fails to capture, provides a further SNR gain of approximately 2 dB at the same BER. The advantage of the CNN-enhanced subtraction becomes more pronounced once media noise is introduced. With 10% fluctuations in island size and position, the baseline subtraction introduces an error floor near 1.5 × 10⁻⁴ because its fixed channel response and weighting factor are calibrated to the ideal island geometry and no longer match the fluctuating one. The CNN-enhanced subtraction, using the same network trained at 16 dB without media noise and without any retraining, exhibits no such floor and reaches a BER of approximately 4 × 10⁻⁶, indicating that the network has learned a representation of the residual interference that generalizes beyond its training conditions.
Finally, we assessed an unequal island-diameter design by comparing the proposed 10/12 configuration with an equal-diameter 10/10 configuration. Enlarging the bottom-layer islands improves detection on both layers: the bottom-layer detection improves by approximately 1.5 dB SNR at a BER of 10−5. Although the larger islands introduce stronger ILI that leads to a 1 dB penalty on the top layer, the bottom-layer gain dominates, resulting in an overall SNR improvement of approximately 1.25 dB at a BER of 10−5. Consequently, the overall BER for the 10/12 configuration drops below 10−7 beyond 17 dB, compared with approximately 7.5 × 10⁻⁷ for the 10/10 configuration at 18 dB. This confirms the design rationale of Section 2: strengthening the readback contribution of the weaker bottom layer provides an overall performance benefit that successfully elevates the entire dual-layer recording system. In this work, we did not examine the CNN’s robustness to reader-position offsets and channel-response mismatch, which is an interesting challenge; this remains a future direction.
Author Contributions
Conceptualization, C.W.; methodology, S.T.W., P.L., and N.R.; software, S.T.W., P.L., and S.J.G.; validation, C.W., K.K., and S.J.G.; formal analysis, N.R., K.K., and C.W.; investigation, C.W., K.K., and N.R.; writing—original draft preparation, S.T.W., P.L., and N.R.; writing—review and editing, C.W. and S.J.G.; supervision, C.W. and K.K. All authors have read and agreed to the published version of the manuscript.
Funding
This work was financially supported by King Mongkut’s Institute of Technology Ladkrabang [2569-02-23-005].
Data Availability Statement
The original contributions presented in this study are included in the article. Further inquiries can be directed to the corresponding author.
Conflicts of Interest
The authors declare no conflicts of interest.
References
- Wood, R. The feasibility of magnetic recording at 1 Terabit per square inch. IEEE Trans. Magn. 2000, 36, 36–42. [Google Scholar] [CrossRef] [Scilit]
- Richter, H.J.; Dobin, A.; Heinonen, O.; Gao, K.; Veerdonk, R.V.; Lynch, R.; Xue, J.; Weller, D.; Asselin, P.; Erden, M.; et al. Recording on bit-patterned media at densities of 1 Tb/in2 and beyond. IEEE Trans. Magn. 2006, 42, 2255–2260. [Google Scholar] [CrossRef] [Scilit]
- Nabavi, S.; Vijaya Kumar, B.V.K.; Bain, J.A. Two-dimensional pulse response and media noise modeling for bit-patterned media. IEEE Trans. Magn. 2008, 44, 3789–3792. [Google Scholar] [CrossRef] [Scilit]
- Chan, K.S.; Radhakrishnan, R.; Eason, K.; Elidrissi, M.R.; Miles, J.J.; Vasic, B.; Krishnan, A.R. Channel models and detectors for two-dimensional magnetic recording. IEEE Trans. Magn. 2010, 46, 804–811. [Google Scholar] [CrossRef] [Scilit]
- Karakulak, S.; Siegel, P.H.; Wolf, J.K.; Bertram, H.N. Joint-track equalization and detection for bit patterned media recording. IEEE Trans. Magn. 2010, 46, 3639–3647. [Google Scholar] [CrossRef] [Scilit]
- Nakamura, Y.; Suzuto, R.; Osawa, H.; Okamoto, Y.; Kanai, Y.; Muraoka, H. Suppression of ITI by array head reading and 2D-equalization. AIP Adv. 2017, 7, 056509. [Google Scholar] [CrossRef] [Scilit]
- Wang, Y.; Vijaya Kumar, B.V.K. Inter-track interference mitigation with two-dimensional variable equalizer for bit patterned media recording. AIP Adv. 2017, 7, 056521. [Google Scholar] [CrossRef] [Scilit]
- Kovintavewat, P.; Ozgunes, I.; Kurtas, E.; Barry, J.R.; McLaughlin, S.W. Generalized partial-response targets for perpendicular recording with jitter noise. IEEE Trans. Magn. 2002, 38, 2340–2342. [Google Scholar] [CrossRef]
- Kovintavewat, P.; Erden, M.F.; Kurtas, E.; Barry, J.R. Employing fractionally-spaced equalizers (FSE) for magnetic recording channels. In Proceedings of the Joint NAPMRC 2003, Digest of Technical Papers, Monterey, CA, USA, 6–8 January 2003; p. 43. [Google Scholar] [CrossRef] [Scilit][Green Version]
- Koonkarnkhai, S.; Kovintavewat, P.; Keeratiwintakorn, P. Study of fractionally spaced equalizers for bit-patterned media recording. IEEE Trans. Magn. 2015, 51, 3001604. [Google Scholar] [CrossRef] [Scilit]
- Koonkarnkhai, S.; Warisarn, C.; Kovintavewat, P. A novel ITI suppression technique for coded dual-track dual-head bit-patterned magnetic recording systems. IEEE Access 2020, 8, 153077–153086. [Google Scholar] [CrossRef] [Scilit]
- Koonkarnkhai, S.; Kovintavewat, P. An iterative ITI cancellation method for multi-head multi-track bit-patterned magnetic recording systems. Digit. Commun. Netw. 2021, 7, 107–112. [Google Scholar] [CrossRef] [Scilit]
- Rueangnetr, N.; Koonkarnkhai, S.; Kovintavewat, P.; Greaves, S.J.; Warisarn, C. Enhancing log-likelihood ratios with mutual information on three-reader one-track detection in staggered BPMR systems. Appl. Sci. 2025, 15, 2329. [Google Scholar] [CrossRef] [Scilit]
- Rueangnetr, N.; Wattanaphol, S.T.; Kankhunthod, K.; Greaves, S.J.; Warisarn, C. Signal processing techniques for enhancing an areal density in two-reader/three-track detection of staggered bit-patterned magnetic recording systems. Appl. Syst. Innov. 2026, 9, 66. [Google Scholar] [CrossRef] [Scilit]
- Warisarn, C. Mitigating the effects of track mis-registration in single-reader/two-track reading BPMR systems. IEEE Trans. Magn. 2019, 55, 3001106. [Google Scholar] [CrossRef] [Scilit]
- Chan, K.S.; Aboutaleb, A.; Sivakumar, K.; Belzer, B.; Wood, R.; Rahardja, S. Data recovery for multilayer magnetic recording. IEEE Trans. Magn. 2019, 55, 6701216. [Google Scholar] [CrossRef] [Scilit]
- Khametong, A.; Greaves, S.J.; Warisarn, C. Mutual soft-information improvement techniques for lower layer performance improvement in double-layered magnetic recording systems. IEEE Trans. Magn. 2025, 61, 3000505. [Google Scholar] [CrossRef] [Scilit]
- Rueangnetr, N.; Koonkarnkhai, S.; Kovintavewat, P.; Warisarn, C. Double-layer magnetic recording with multilayer perceptron decoder for single-reader/two-track reading in BPMR systems. AIP Adv. 2023, 13, 035104. [Google Scholar] [CrossRef] [Scilit]
- Sawangarom, V.; Buajong, C.; Kankhunthod, K.; Warisarn, C. Bit-island arrangement and signal processing in double-layer magnetic recording technology. AIP Adv. 2024, 14, 025114. [Google Scholar] [CrossRef] [Scilit]
- Aboutaleb, A.; Sayyafan, A.; Sivakumar, K.; Belzer, B.; Greaves, S.; Chan, K.S.; Wood, R. Deep neural network-based detection and partial response equalization for multilayer magnetic recording. IEEE Trans. Magn. 2021, 57, 3101012. [Google Scholar] [CrossRef] [Scilit]
- Aboutaleb, A.; Sayyafan, A.; Sivakumar, K.; Belzer, B.; Greaves, S.; Chan, K.S.; Wood, R. A perspective on deep neural network-based detection for multilayer magnetic recording. Appl. Phys. Lett. 2021, 119, 010502. [Google Scholar] [CrossRef] [Scilit]
- Sayyafan, A.; Aboutaleb, A.; Belzer, B.J.; Sivakumar, K.; Greaves, S.; Chan, K.S. Turbo-detection for multilayer magnetic recording using deep neural network-based equalizer and media noise predictor. IEEE Trans. Magn. 2022, 58, 3200611. [Google Scholar] [CrossRef] [Scilit]
- Sayyafan, A.; Aboutaleb, A.; Belzer, B.J.; Sivakumar, K.; Greaves, S.; Chan, K.S.; James, A. Convolutional neural network-based media noise prediction and equalization for TDMR turbo-detection with write/read TMR. IEEE Trans. Magn. 2023, 59, 3001011. [Google Scholar] [CrossRef] [Scilit]
- Chantakit, T.; Buajong, C.; Warisarn, C. Long-short term memory-based application on adaptive cross-platform decoder for bit patterned magnetic recording. IEEE Access 2020, 8, 155248–155259. [Google Scholar] [CrossRef] [Scilit]
- Moon, J.; Zeng, W. Equalization for maximum likelihood detectors. IEEE Trans. Magn. 1995, 31, 1083–1088. [Google Scholar] [CrossRef] [Scilit]

Disclaimer/Publisher’s Note: The statements, opinions and data contained in all publications are solely those of the individual author(s) and contributor(s) and not of MDPI and/or the editor(s). MDPI and/or the editor(s) disclaim responsibility for any injury to people or property resulting from any ideas, methods, instructions or products referred to in the content. |
© 2026 by the authors. Licensee MDPI, Basel, Switzerland. This article is an open access article distributed under the terms and conditions of the Creative Commons Attribution (CC BY) license.