


Abstract
The development of complex equipment faces prominent challenges, including unequal status among participating agents, multi-objective full confrontation, strong super-conflict among multi-indicators, dynamic risk evolution, delayed on-site perception, and the absence of collaborative negotiation. Traditional risk management and control methods, based on the ideal assumptions of equal subjects and independent indicators, struggle to characterize and resolve super-conflict games dominated by super decision-makers. Furthermore, they lack dynamic early warning and closed-loop execution mechanisms linked to real-time perception, commonly suffering from drawbacks such as low early warning accuracy, high decision-making conflict, delayed response, and inefficient collaboration. To address these issues, this paper integrates multi-agent conflict negotiation with intelligent perception and learning technologies to propose an intelligent risk early warning and closed-loop control method for complex equipment development. The three-dimensional risk evolution dynamics model and Virtual Risk Center (VRC) are employed to decouple super-conflict indicators, while the industrial inspection unmanned aerial vehicle (UAV) perception relative motion model enables the unified mapping of physical risks and decision-making games. A super-conflict gray target negotiation (SCGTN) model is constructed to achieve stable consensus decisions among multiple parties under conflicting indicators. Based on Markov Decision Processes and the PPO algorithm, the optimal virtual risk trajectory is generated, which is then combined with the Archimedean spiral convergence trajectory to synthesize executable control trajectories. This forms an integrated system of UAV real-time perception → super-conflict resolution → intelligent decision-making → closed-loop regulation. Validated through a case study of large-scale complex aviation equipment development, the proposed method achieves field-validated risk early warning accuracy of 94.7% evaluated against real-world on-site ground truth labels. The numerical simulation results, whose parameters are fully calibrated against real-world engineering datasets, indicate that under simulated test conditions, our method yields simulation-predicted performance: it reduces decision-making conflict intensity by 49.3%, controls risk deviation error within 1.38%, and shortens closed-loop response time to 158 ms. Note that conflict reduction level, risk deviation error, and closed-loop response time are pure simulation outputs and have not been directly measured from physical on-site closed-loop experiments. Under the same simulation setup, the end-to-end response speed is 7.6 times faster than the peer dynamic closed-loop Digital Twin-Proximal Policy Optimization (DT-PPO) benchmark algorithm with identical online sensing and reinforcement learning architecture and roughly 4700 times faster than simulated counterparts of traditional static offline evaluation modes that rely on periodic manual statistics and offline meetings. It is adaptable to complex equipment development scenarios characterized by strong super-conflict, high dynamics, and unequal subjects, providing a theoretical framework and technical support for intelligent risk prevention and control throughout the full lifecycle of complex equipment.
1. Introduction
The high-end equipment manufacturing industry constitutes the core carrier of national scientific and technological innovation capacity and national defense strength. The development of complex equipment exhibits distinctive characteristics including cross-organizational collaboration, deeply coupled multi-system interactions, full-lifecycle iterative evolution, and high technological intensity. Four core indicators, namely, technology, schedule, quality, and cost, naturally form a strongly adversarial coupling relationship. Within an unequal game framework where the general contractor serves as the supreme decision-maker, routine decision conflicts tend to escalate into super-conflicts. Such conflicts trigger prominent challenges including diverging stakeholder interests, non-convergent decision outcomes, and ambiguous boundaries of risk accountability, which directly lead to project delays, cost overruns, quality deficiencies, and even safety accidents.
This study constructs a four-layer coordinate system anchored at the Virtual Risk Center (VRC). The framework converts physical on-site observation data collected by unmanned aerial vehicles (UAVs) into quantifiable schedule and cost risk indicators and establishes a complete transmission chain connecting UAV field sensing to abstract project management risks.
Conventional risk management and control rely on manual inspection, offline statistical analysis, and coordination via meetings. These approaches suffer from delayed risk perception, insufficient monitoring coverage, and slow response speed, making them ill-suited for highly dynamic and uncertain complex equipment development scenarios. UAVs have emerged as vital tools for on-site risk sensing. Nevertheless, existing UAV path planning research mainly focuses on motion control objectives and fails to achieve deep integration with risk decision-making, conflict resolution, and closed-loop control. As a result, sensed data cannot be effectively transformed into collaborative governance capacity. Accordingly, developing an integrated risk early warning and control system that supports real-time perception, super-conflict resolution, intelligent decision-making, and closed-loop execution has become an urgent requirement to facilitate high-quality development of complex equipment.
In the domain of risk assessment and decision-making, traditional research predominantly adopts static offline approaches such as gray target decision-making, analytic hierarchy process, fuzzy comprehensive evaluation, and Bayesian networks. These methodologies have been widely applied to risk measurement and risk prioritization during equipment development. Du et al. (2021) integrated interval gray numbers with gray target decision-making to improve the FMEA framework, strengthening the stability and anti-interference performance of expert evaluation information [1]. Lan and Huang (2025) combined gray relational analysis with the entropy weight method to calculate risk factor weights and enhance the robustness of multi-attribute risk decision-making [2]. Overall, however, these methods are built upon idealized assumptions: equal decision-making participants, mutually independent indicators, and transitive preference relations. They struggle to handle indicator systems characterized by fierce conflicts, non-orthogonality, and full confrontation and cannot adapt to super-conflict decision-making contexts. This generates substantial discrepancies between decision outputs and real engineering practices of complex equipment development.
In recent years, the integrated application of digital twins and deep reinforcement learning has accelerated the transformation of risk assessment toward dynamic, real-time, and intelligent paradigms. Mayer et al. (2021) embedded the PPO algorithm into continuous risk trajectory optimization, greatly improving the stability and adaptability of dynamic decision-making [3]. Mohanraj and Balaji (2025) constructed a full lifecycle equipment risk monitoring model based on digital twins, enabling real-time physical state mapping and proactive fault early warning [4]. Liu et al. (2026) combined graph neural networks with digital twins to precisely model and predict system-level risk propagation paths [5]. Jia et al. (2026) established a digital twin adaptive collaborative control system driven by deep reinforcement learning, which effectively suppresses coupling disturbances among multiple actuators of complex equipment [6]. Despite the advances achieved by these dynamic methods, existing studies seldom address fundamental contradictions arising from unequal stakeholder status and full confrontation among multiple indicators. Mechanisms for super-conflict resolution and multi-party negotiation are absent, which limits their capacity to support stable collaborative decision-making under strongly adversarial conditions.
Within the field of conflict analysis and negotiation decision-making, practical scenarios with unequal participants and multi-objective fierce confrontation have driven negotiation theory toward behavioral game theory. A body of valuable research outcomes has been produced. Silva et al. (2020) and Huang et al. (2024) extended and refined the graph model for conflict resolution, improving its performance for equilibrium solving under incomplete preference information [7,8]. Iyer and Yoganarasimhan (2021) uncovered the formation mechanism and regulatory strategies of opinion polarization within unequal games [9]. Feng et al. (2024) and Liang et al. (2023) introduced altruistic preferences and fairness concerns into minimum cost consensus models to boost negotiation efficiency and group adaptability [10,11]. Shen et al. (2025) optimized consensus mechanisms based on Nash bargaining and regret theory to enhance decision fairness and anti-manipulation performance [12]. Cai et al. (2025), Ni et al. (2026), and Cheng et al. (2026) improved negotiation convergence speed and stability for multi-alliance and super-conflict scenarios through dynamic reward–punishment designs and fair utility function construction [13,14,15]. Even so, most existing achievements remain confined to theoretical game analysis and management decision research. They lack deep integration with engineering links including on-site sensing, dynamic trajectory optimization, and real-time control and are not equipped with closed-loop execution and practical deployment capabilities. Hence, these theories cannot directly satisfy the demands of complex equipment construction sites for timely, high-precision risk response and collaborative management.
UAV perception and trajectory planning serve as key technical foundations for on-site risk sensing. Benefiting from high mobility, wide coverage, and non-contact inspection characteristics, UAVs have become core tools for risk monitoring in complex scenarios. Rich research results have been obtained in this area. Sui et al. (2023) put forward a multi-UAV cooperative path reconstruction approach with biased sampling, which significantly increases computational efficiency in complex environments [16]. Petit and Desbiens (2024) built a multi-objective adaptive risk-aware path planning framework to satisfy infrastructure inspection requirements [17]. Liu et al. (2025) realized covert path planning under dynamic environments via improved RRT algorithms and strengthened adaptability to complicated threat scenarios [18]. Chen et al. (2025) and Zhang et al. (2025) integrated digital twins with reinforcement learning for inspection task allocation and swarm obstacle avoidance, respectively, improving the robustness of dynamic operations [19,20]. Michaux et al. (2025) adopted the PPO algorithm to optimize risk perception trajectories and enhance inspection adaptability [21]. Du et al. (2025) combined ant colony algorithms with quaternion optimization to generate low-energy full-coverage inspection paths [22]. Liu et al. (2026) proposed an MPPI three-dimensional planning method suitable for complex electromagnetic environments, expanding its application in special scenarios [23]. Johnson et al. (2026) systematically reviewed risk-aware UAV path planning and established a unified technical framework [24]. In general, current research on UAV perception and trajectory planning still centers on isolated motion control and path optimization objectives. Deep coupling with risk decision-making, super-conflict resolution, and multi-stakeholder collaborative governance is missing. Perception data cannot be converted into executable conflict resolution schemes and closed-loop control commands, which fails to meet the requirements of intelligent risk early warning and full-process integrated control for complex equipment development.
Deep integration between digital twins and reinforcement learning possesses unique strengths in virtual–physical mapping, real-time synchronization, and continuous dynamic decision-making and has emerged as an innovative research paradigm for risk management and control. Mohammed et al. (2025) proposed an integrated framework combining generative digital twins and reinforcement learning to autonomously identify hazardous conditions in safety-critical systems [25]. Zhang et al. (2025) applied such technologies to nuclear reactor health monitoring and substantially improved system safety and reliability [26]. Wu et al. (2025) constructed a full lifecycle aero-engine risk assessment model supported by digital twins to achieve precise whole-process risk control [27]. Jiang et al. (2025) further enhanced the super-conflict analysis and gray target decision framework, improving risk adaptability for complex equipment development projects [28].
Although the above methods have achieved remarkable results in dynamic decision-making and adaptive control, they do not consider super-conflict scenarios characterized by unequal status among multiple subjects and full confrontation among multi-indicators, lack multi-party negotiation and consensus mechanisms, and are difficult to address the collaborative management and control challenges under conflicting interest patterns.
Overall, existing research still suffers from three prominent shortcomings: First, there is a lack of a unified modeling framework integrating super-conflict resolution and dynamic risk trajectories, making it difficult to effectively decouple and uniformly express strongly adversarial indicators such as technology, schedule, quality, and cost. Second, there is no established engineering model for the closed-loop integration of negotiation consensus and real-time UAV perception, resulting in fragmented perception, decision-making, and control processes that cannot work in synergy. Third, no deployable integrated risk management and control system following the “perception-decision-control-feedback” loop has been constructed, failing to meet the high-dynamic, high-conflict, and high real-time requirements of complex equipment development.
Addressing these limitations and practical pain points, this paper focuses on solving four key problems: (1) realizing the precise quantitative description of multi-indicator super-conflict, providing computable models for conflict resolution; (2) constructing an efficient, fair, and stable negotiation consensus mechanism under scenarios dominated by super decision-makers with multi-party interest opposition; (3) transforming static negotiation consensus into continuous, smooth, and trackable risk evolution trajectories to support dynamic early warning; and (4) building an integrated early warning and control system that combines UAV perception, conflict resolution, intelligent decision-making, and closed-loop execution, enabling full-process connectivity.
The remainder of this paper is structured as follows. Section 2 establishes the integrated risk modeling framework, including 3D risk evolution dynamics, the VRC four-layer coordinate system, and the UAV-VRC relative motion model and clarifies the applicable boundary and inherent limitations of the proposed modeling methodology. Section 3 constructs the super-conflict gray target negotiation (SCGTN) model, covering super-conflict quantification, intra-alliance hard consensus, iterative soft consensus, and equilibrium optimization mechanisms. Section 4 introduces the PPO-based optimal virtual risk trajectory generation method by formulating risk regulation as an MDP problem. Section 5 proposes the Archimedean spiral smooth convergence trajectory and vector superposition rule to synthesize executable control trajectories. Section 6 carries out engineering case verification, quantitative performance comparison, and in-depth discussion against state-of-the-art approaches. Section 7 summarizes core findings, links conclusions with the initial research questions, and elaborates detailed directions for future research.
2. Integrated System Modeling for Risk Management in Complex Equipment Development
To accurately characterize the dynamic evolution of risks in complex equipment development, the correlation between UAV perception and motion, and the mapping relationships of multi-agent super-conflict decision-making, this paper constructs an integrated risk system modeling framework based on system dynamics and flight mechanics. Development risks are abstracted as high-dynamic moving particles, and a three-degree-of-freedom risk evolution dynamics model is established to uniformly describe risk diffusion, mutation, and control effects. A Virtual Risk Center (VRC) is introduced, and a four-layer coordinate system is constructed to realize the decoupling and unified representation of strongly adversarial super-conflict indicators. A relative motion model between the UAV and the VRC is established to achieve precise mapping from physical risk states to decision-making game relationships, providing complete model support for subsequent conflict negotiation, trajectory optimization, and closed-loop control.
2.1. Modeling of 3D Risk Evolution Dynamics
To uniformly describe the logic of risk evolution, UAV perception, conflict resolution, and control execution, this paper abstracts risks in complex equipment development as moving particles in dimensionless normalized abstract risk space and adopts a three-degree-of-freedom dynamic equation template for unified mathematical representation. This work only establishes an isomorphic mathematical analogy instead of physical aerodynamic simulation for project risks. All terms named after aircraft aerodynamics are redefined as normalized dimensionless management parameters without SI physical units (real-world physical length, velocity, mass, or physical rigid-body rotation angles). Drawing on the mature differential equation structure of high-dynamic aircraft kinematics, the model can intuitively quantify risk diffusion, trend mutation, and control suppression effects in project management, with clear managerial interpretability rather than physical aerodynamic meaning. The model abstracts technical fluctuations, schedule delays, quality defects, and cost overruns in equipment development into variations of normalized kinematic analogy variables (normalized velocity, cumulative gradient angle, risk azimuth angle). Control measures, resource supplements, and cross-unit collaborative optimization are abstracted as the “lift term” that suppresses risk growth; meanwhile, multi-indicator antagonism, information delay, and coordination failures are abstracted as the “drag term” that drives risk escalation, thus realizing full-factor quantitative modeling of conflicting project risks. The specific form of the model is as follows:
In the equation, r denotes the normalized risk position vector in abstract spatio-temporal risk space (dimensionless, no meter unit), mapped from standardized measurable project indicators including technical defect ratio, schedule lag proportion, product nonconformity rate, and cost overrun percentage, reflecting relative risk severity across development phases and subsystems. v is the normalized risk growth rate vector (dimensionless; axis labels in figures provide only visualization scale for analogy variables and carry no physical unit meaning), representing the relative expansion speed of risk accumulation and propagation. γ is the cumulative risk gradient angle (dimensionless cumulative deviation metric, not aircraft pitch angle), reflecting the overall upward/downward trend of integrated project risk over continuous simulation steps. ψ is the risk azimuth angle, quantifying the weight bias of risk among the four conflicting dimensions: technology, schedule, quality, and cost. μ is the risk bank angle, describing decision preference deviation under multi-indicator super-conflict. L is a dimensionless control utility vector (“lift analogy term”), quantifying risk suppression brought by rectification, resource input, and cross-team coordination. D is a dimensionless conflict disturbance vector (“drag analogy term”), quantifying risk escalation driven by indicator trade-offs, information lag, and coordination defects. m is a dimensionless system inertia coefficient (no kilogram unit), representing the project’s capacity to resist sudden risk shocks. g is a dimensionless spontaneous risk escalation coefficient, describing natural risk deterioration without intervention. We borrow the decomposed form of aerodynamic lift/drag equations solely to model two antagonistic risk driving terms, without applying any physical aerodynamic mass, momentum, or energy conservation laws to organizational project systems.
All risk kinematic variables are converted from real engineering data via standard min–max normalization.
- (1)
- For risk position r: Raw measured inputs are monthly technical failure ratio, normalized schedule lag days, quality rejection rate, and cost overrun percentage. All raw metrics are scaled to [0,1] and then linearly stretched to axis ranges only for plotting visualization; all numerical labels on axes carry no physical length meaning.
- (2)
- For risk evolution velocity v: The raw input is the month-on-month growth rate of the integrated risk index. Normalized growth rate within [0,1] is mapped to vertical axis scales marked “m/s” in figures purely for curve visualization, with no physical speed definition.
- (3)
- For cumulative gradient angle γ: The raw input is cumulative incremental change in comprehensive risk over discrete simulation steps. The large value, 35,000°, represents cumulative analog angular deviation accumulated over 3600 simulation steps within normalized risk space. It is a cumulative deviation metric for project risk trend and is not bounded by physical rigid-body rotation constraints. This analog angle cannot be interpreted as physical aircraft attitude. Such large angles only visualize long-term sustained risk deterioration trends from a project management perspective. For analogy coefficients m, ρ, CL, CD, g: All are dimensionless composite weights calculated from measured multi-indicator conflict coefficients and project coordination efficiency; they never represent physical aircraft mass, air density, or gravitational acceleration.
In all figures, coordinate labels such as m, m/s, degrees are merely graphical scaling markers for normalized dimensionless risk variables and do not correspond to any physical flight quantities.
It is necessary to strictly distinguish two independent normalization–transformation stages:
Stage 1: Raw 4-dimensional project risk indicator normalization.
The four original engineering risk indicators, technical defect ratio IT, schedule lag fraction IS, quality nonconformity rate IQ, and cost overrun fraction IC, are individually processed by min–max normalization and mapped into the closed interval [0,1]:
where Ik,min and Ik,max represent the historical minimum and maximum of each risk indicator collected from engineering datasets. The outputs are a normalized four-dimensional project risk vector in the original engineering indicator space.
Stage 2: Projection-scaling transformation from 4D engineering risk space to 3D analogy risk kinematic space.
The 3-DOF risk evolution dynamics operate within an abstract scaled analogy risk space Ω3D, rather than directly using the [0,1]-bounded 4D indicator vector. We define projection-scaling mapping : Ω4D ↦ Ω3D:
where Γ ∈ ℝ3×4 denotes the projection-scaling transformation matrix. This matrix fuses the four antagonistic risk dimensions into three analogy spatial coordinates for subsequent kinematic solution and introduces positive scaling coefficients. After transformation, the resulting 3D analogy position vector P3D is no longer constrained within the [0,1] interval. The coordinate axes in all figures correspond to the scaled analogy space Ω3D. They are used for risk kinematics simulation and visualization only and do not inherit the [0,1] bounds of original normalized engineering indicators.
P3D = (X4D) = Γ ⋅ X4D
This two-stage transformation realizes the conversion from measurable project risk indicators to computable state variables for the three-dimensional risk evolution dynamics model.
The atmospheric density decays exponentially with the increase in equipment development complexity and phase progression:
where ρeq denotes the equivalent analogy density in risk space, a dimensionless composite parameter reflecting project complexity. ρ0,eq is its reference baseline value; Heq is the analogy scale height correlated with project development phases and complexity. This is not physical atmospheric density from the real-world environment.
ρ = ρ0e−h/H
Using the above model, various risk factors, control measures, and conflict intensities are uniformly transformed into computable kinematic variables, laying the model foundation for subsequent trajectory generation and decision optimization.
This study adopts the three-degrees-of-freedom (3-DOF) point mass flight dynamics model as the mathematical carrier for risk evolution, and the aerodynamic analogy is constructed based on strict isomorphic mapping between complex equipment development risk evolution and aircraft kinematic motion, with four core logical justifications provided as follows:
- (1)
- Homology of dynamic driving logic. Aircraft motion is governed by two antagonistic forces: lift (suppression of falling trend) and drag (resistance that attenuates forward motion). Similarly, equipment development risks are controlled by two mutually counteracting factor sets: risk lift vector L (control measures, resource supplement, technical optimization that suppress risk escalation) and risk drag vector D (indicator conflicts, information delay, collaborative defects that drive risk diffusion). The two systems share identical antagonistic force-driving dynamic logic, which forms the fundamental basis of the analogy.
- (2)
- Consistent state evolution law of continuous state variables. The 3-DOF flight model describes continuous, time-varying changes of position, velocity, gradient angle, and azimuth angle; equipment development risks also present continuous spatiotemporal evolution characteristics: risk diffusion distance (position), risk spreading speed (velocity), risk rising/falling trend intensity (gradient angle), and risk bias among technology/schedule/quality/cost four indicators (azimuth angle). The state variable dimension, continuous variation characteristic, and physical implication of trend characterization are fully isomorphic.
- (3)
- Uniform characterization of system inertia and spontaneous evolution tendency. The aircraft mass m reflects motion inertia, while the equivalent risk mass mr abstracts the anti-interference inertia of the equipment development system; the gravity coefficient gr corresponds to the inherent spontaneous escalation tendency of development risks without human intervention. The two parameters, respectively, describe the system’s inherent resistance to external disturbance and natural evolution trend, realizing one-to-one correspondence of system characteristic parameters.
- (4)
- Engineering interpretability and computability advantages for closed-loop control. Compared with traditional abstract system dynamics equations, the flight dynamics framework introduces mature aerodynamic modeling tools (exponential density attenuation, lift/drag coefficient decomposition) to quantify the coupling strength of multi-dimensional risk factors. More importantly, this unified kinematic expression establishes a natural mathematical bridge between UAV physical inspection motion (Section 2.3 UAV-VRC relative motion model) and the risk decision-making game, enabling seamless conversion of UAV real-time perception data into risk state variables for subsequent trajectory optimization and negotiation solving. Static risk evaluation models cannot achieve this cross-space mapping capability, which is an irreplaceable advantage of the aerodynamic analogy in this integrated perception-decision-control closed-loop framework.
We define constrained invertible mapping Φ(⋅): Ωrisk → Ωkin from the project risk domain to the analog kinematic domain Ωkin. The domain Ωrisk represents the engineering-feasible subset of the four-dimensional risk space, which collects normalized project management risk variables including the technical defect ratio, schedule lag fraction, quality nonconformity rate, and cost overrun fraction, together with their time order derivatives. The codomain Ωkin contains all analog kinematic state variables, i.e., analog position, analog growth rate, analog gradient angle, analog azimuth angle, and analog lift/drag terms.
This mapping establishes behavioral isomorphism between project risk evolution and kinematic dynamics, rather than a set theoretic bijective correspondence over the full unbounded 4D Euclidean space. Invertibility of Φ(·) holds only within Ωrisk, which excludes mathematically permissible but physically unrealistic risk combinations that never occur in complex equipment engineering projects. Outside this feasible subset, the mapping loses invertibility and is not applicable.
This mapping Φ(⋅) only reuses the differential equation structure of aircraft 3-DOF kinematics to realize behavioral analogy. Critically, it does not inherit physical aerodynamic conservation laws for real-world aircraft (mass conservation, momentum conservation, and energy conservation). The term “isomorphism” in this paper refers to equivalence of dynamic driving patterns for risk evolution and should not be interpreted as set theoretic bijective mapping over the entire 4-dimensional risk space. All outputs of Φ(⋅) are strictly dimensionless. Project management driving mechanisms (resource supplement, indicator trade-off, information delay, coordination failure) are transformed into terms sharing identical differential equation forms with lift and drag, without importing any real-world physical properties. The four logical pillars supporting this isomorphism are further formalized rather than only interpreted qualitatively.
It is worth clarifying that an alternative modeling strategy is to directly construct a hand-crafted nonlinear differential equation system purely for risk evolution, without borrowing flight mechanics equation structures. Nevertheless, such a standalone risk-oriented nonlinear dynamical formulation has critical drawbacks for our “perception-negotiation-trajectory-closed-loop” integrated architecture.
First, a custom-built nonlinear risk dynamics model can reproduce risk growth and decay behaviour, but it lacks a native mathematical interface linking physical UAV inspection kinematics and abstract risk game decision space. Ad hoc additional transformation formulas would have to be manually designed to convert UAV sensing outputs into risk state variables. In contrast, the isomorphic 3-DOF flight dynamics framework provides built-in multi-layer coordinate transformation and relative motion modeling to bridge physical inspection space and abstract risk decision space.
Second, the lift–drag decomposition naturally separates two antagonistic driving components: risk-suppressing control inputs (“lift”) and conflict-driven risk escalation disturbances (“drag”). Each component corresponds to tangible project management actions, such as resource supplement, coordination failure, and multi-indicator trade-off, delivering straightforward interpretability for engineering practitioners. For generic hand-built nonlinear risk systems, decomposition of antagonistic driving terms is mostly heuristic, without standardized component definitions.
Third, reusing well-validated flight dynamics toolchains (exponential density decay, Runge–Kutta numerical solver, multi-layer coordinate transformation libraries) reduces custom-modeling bias. Numerically verified modules for solving, stability analysis, and trajectory synthesis can be reused directly. Building a brand-new dedicated nonlinear risk dynamical system from scratch would demand full re-validation of numerical stability, coordinate conversion, and differential solver performance. Table 1 compares the key differences between the isomorphic flight dynamics analogy adopted in this paper and the direct custom nonlinear risk dynamics formulation.
Table 1.
Comparison between isomorphic flight dynamics analogy and the direct custom nonlinear risk dynamical system.
The present 3-DOF analogy is purely mathematical isomorphism. Project risks possess no physical aerodynamic attributes. All terms named “analogy lift”, “analogy drag”, “analogy atmospheric density”, and “analogy angle” are composite dimensionless management parameters computed from normalized project indicators and do not represent measurable physical quantities. The risk system does not obey mass–momentum–energy conservation equations for real aircraft.
Notably, this paper does not claim that development risks have physical aerodynamic attributes; the 3-DOF flight model is only a standardized isomorphic mathematical mapping tool rather than a physical simulation of risk itself. All aerodynamic concepts (lift, drag, atmospheric density, equivalent altitude) are redefined as risk system quantitative parameters with clear engineering connotations, as clarified in the parameter interpretation of Equations (1)–(3). The analogy only borrows the complete, mature dynamic equation architecture of flight mechanics to solve the problem that traditional risk models fail to quantitatively describe antagonistic multi-factor coupling and continuous time-varying evolution.
The characteristic curves of the three-dimensional risk evolution dynamics are shown in Figure 1, which intuitively presents the time-varying laws of risk position, velocity, trend gradient, and lift/drag forces. The same dimensionless analogy convention is strictly followed for all numerical solution parameters in Appendix A; no real physical SI units are applied for risk evolution computation (see Appendix A for detailed clarification).
Figure 1.
Characteristic curves of 3D risk evolution dynamics.
2.2. Construction of the Virtual Risk Center and the Four-Layer Coordinate System
To achieve effective decoupling of strongly adversarial super-conflict indicators, this paper introduces the Virtual Risk Center (VRC) as the core hub for decision-making. The VRC contains only position and velocity information and does not participate in physical motion; it performs functions including conflict decoupling, trajectory guidance, and consensus building, transforming the multi-indicator super-conflict opposition problem into a relative motion problem centered on the virtual center, thereby realizing indicator decoupling and stable risk regulation.
The corresponding virtual risk trajectory (VRT) is a reference trajectory generated by the Virtual Risk Center in the risk space based on the optimal decision objectives. It represents both the ideal risk evolution path agreed upon by multiple stakeholders through negotiation and the optimal development direction commonly recognized by all participating units. To accurately characterize the inherent relationships among risk motion laws, UAV perception processes, and decision-making logic, this paper constructs a four-layer coordinate system. These include the inertial risk coordinate system OXYZ, which corresponds to the global space time reference of equipment development; the virtual ballistic risk coordinate system ORXRYRZR, with the Virtual Risk Center as the origin and aligned with the velocity direction of the virtual risk trajectory; and the virtual line-of-sight risk coordinate system OLXLYLZL, pointing from the Virtual Risk Center to the ideal risk target; and the real risk coordinate system OTXTYTZT, which reflects the actual development risk status. The coordinate systems are transformed through a 2–3 rotation sequence, and coordinate conversions are completed using Euler angle transformation matrices in a unified form. The four-layer coordinate system for risk decision-making is shown in Figure 2.
Figure 2.
The four-layer coordinate system for risk decision-making.
In the formula, θ is the pitch angle and ϕ is the yaw angle.
It should be highlighted that all coordinate systems constructed in this subsection belong to the scaled abstract analogy risk space Ω3D obtained via the projection-scaling transformation (⋅), rather than the original four-dimensional engineering indicator space.
2.3. UAV-VRC Relative Motion Modeling for Risk Perception
The complex equipment development site is characterized by large spatial scale, numerous hidden areas, and dynamically changing working conditions, making it difficult for manual inspections to achieve comprehensive, real-time, and accurate acquisition of risk status. With its advantages of high mobility, non-contact operation, wide coverage, and real-time data transmission, the UAV can undertake the dynamic perception of risk factors at the development site. The UAV does not directly measure abstract schedule or cost numerical values via airborne sensors; instead, it captures physical on-site state features that are further mapped to latent schedule and cost risk levels through a unified risk space conversion mechanism based on the VRC four-layer coordinate system. (1) Technology risk is when UAV visual inspection (high-definition camera, infrared sensor) captures structural assembly defects, equipment installation errors, unqualified test hardware, and abnormal component states, which directly characterize technical risk. (2) Quality risk is when UAV multi-angle scanning obtains surface machining precision, assembly gap deviation, unqualified welding/coating, and incomplete component matching, serving as direct quality risk observables. (3) Schedule risk (indirect mapping) is when UAV real-time monitoring records spatial occupancy of production stations, incomplete component stacking, idle assembly tooling, unoccupied testing workshops, delayed delivery of semi-finished parts, and insufficient on-site labor input. These physical scene anomalies are quantified into progress lag features and then converted to schedule deviation state variables in the VRC risk coordinate system via the relative motion model. Severe site congestion, idle equipment, and backlogged semi-products correspond to serious schedule delay risks. (4) Cost risk (indirect mapping) is when UAV long-term continuous inspection tracks waste of raw materials, repeated rework areas, overtime construction scenes, idle expensive special test equipment, and scrapped defective components. The spatial distribution and duration of these waste phenomena are calculated as cost overrun characteristic quantities, which are projected to the cost dimension of the VRC risk center to quantify cost escalation risk. To unify the inspection motion of the UAV in physical space with the game evolution in the risk decision-making space, a relative motion model between the UAV and the VRC is established. This model converts on-site perception data into state variables that can be directly used for risk decision-making and trajectory optimization, realizing seamless integration between physical monitoring and game-theoretic decision-making.
In the virtual ballistic coordinate system, the relative motion between the UAV and the VRC is projected onto the normal plane for decoupling analysis, yielding a system of differential equations of relative motion to describe the dynamic variation laws of risk perception distance and line-of-sight angle. Meanwhile, geometric constraint relationships of relative distance and risk line-of-sight angle are defined based on three-dimensional spatial coordinates to ensure the geometric rigor and computability of the model. The relative motion model in the normal plane of the virtual ballistic coordinate system can be expressed as:
The relative distance and line-of-sight angle motion satisfy the following constraints:
where r is the risk perception distance between the UAV and the VRC. λ is the risk line-of-sight angle. vr is the relative perception velocity. ar is the relative acceleration. is the three-dimensional position coordinate of the UAV in the inertial risk coordinate system, and is the three-dimensional position coordinate of the VRC in the inertial risk coordinate system. This model unifies the UAV real-time perception, risk spatial distribution, and conflict state changes under the same motion framework, enabling perception data to be directly used for decision variable updates and trajectory optimization, thus providing a reliable data link for closed-loop control. The relative motion relationship between the UAV and the VRC is shown in Figure 3.
Figure 3.
Schematic diagram of relative motion between the UAV and the Virtual Risk Center. Note: The green arrow indicates the moving direction of the UAV along its trajectory towards the virtual risk center.
Where θ is the risk line-of-sight angle. vr is the relative perception velocity. ar, aθ is the relative acceleration decomposed along radial and tangential directions. PUAV is the three-dimensional position coordinate of the UAV in the inertial risk coordinate system, and PVRC is the three-dimensional position coordinate of the VRC in the inertial risk coordinate system. This model unifies the UAV real-time perception, risk spatial distribution, and conflict state changes under the same motion framework, enabling perception data to be directly used for decision variable updates and trajectory optimization, thus providing a reliable data link for closed-loop control. The relative motion relationship between the UAV and the Virtual Risk Center is shown in Figure 3.
Multi-modal inspection UAVs carry visible light cameras, infrared thermal sensors, and laser radar to collect on-site physical scene features. These raw physical features cannot directly measure abstract management indicators such as schedule lag percentage and cost overrun ratio. A two-stage transformation pipeline including object detection, multi-feature entropy weight fusion, and indicator mapping is constructed to bridge physical observation data and normalized four-dimensional risk state vectors (technical defect ratio, schedule lag fraction, quality nonconformity rate, cost overrun fraction).
The feature grouping and calculated entropy weight results obtained from the case study UAV-measured dataset are provided for reproducibility in Table A1 from Appendix B.
- (1)
- Definition of physical observable features
The set of raw observable physical features extracted from UAV multi-sensor data is defined as F = {f1,f2,…,f14}, grouped into four categories corresponding to four risk dimensions:
- ①
- Technical-risk related physical features: f1 assembly surface defect area ratio, f2 hardware offline test abnormal thermal spot count, f3 component installation offset deviation (mm), and f4 structural connection gap out-of-tolerance proportion.
- ②
- Quality-risk related physical features: f5 welding surface defect pixel ratio, f6 coating peeling area ratio, f7 component matching misalignment proportion, and f8 surface machining dimensional deviation.
- ③
- Schedule-risk related physical features: f9 production station spatial occupation vacancy rate, f10 semi-finished component stacking backlog area ratio, f11 assembly tool idle proportion, and f12 on-site labor crowding vacancy index.
- ④
- Cost-risk related physical features: f13 raw material waste spatial coverage ratio and f14 repeated rework regional cumulative duration index.
- (2)
- YOLOv8 object detection training dataset
The YOLOv8-detect model is fine-tuned for on-site feature instance segmentation and defect detection. The training dataset consists of 12,600 on-site UAV image frames collected from three real-world complex aviation equipment development workshops, including 9600 training images, 1500 validation images, and 1500 held-out test images. Image samples cover various lighting conditions, occlusion scenarios, and working-state conditions. Labeling is completed by three domain engineers, marking defect regions, idle equipment, backlog components, and waste material regions. Input image resolution is unified to 1280 × 1280 pixels. The fine-tuned YOLOv8 model outputs bounding boxes and mask segmentation results for each physical feature and calculates the above-mentioned dimensionless feature indicators {f1,…,f14} by pixel area statistical calculation. All raw feature values are normalized to the interval [0,1] via min–max normalization before multi-feature fusion.
- (3)
- Entropy weight multi-feature fusion equations
The entropy weight method is adopted to compute objective weights for each physical feature. We have a feature sample matrix X ∈ ℝN×M, where N is the sampling time step count and M = 14 is total feature number.
Step 1. Normalized feature probability:
Step 2. Feature information entropy:
Step 3. Entropy weight coefficient for each feature:
Feature weights are grouped into four subsets wtech, wqual, wsched, wcost corresponding to technical, quality, schedule, and cost risk-related feature subsets. The weighted summation yields four intermediate fused physical scores:
where Ωtech, Ωqual, Ωsched, Ωcost denote index sets of features belonging to each risk dimension.
- (4)
- Mapping from fused physical scores to normalized project risk indicators
The fused physical scores {stech, squal, ssched, scost} are further mapped to standardized project management risk indicators in [0,1]:
ψtech, ψqual, ψsched, ψcost are monotonic increasing calibration mapping functions fitted from 42 historical aviation equipment engineering datasets. The mapping establishes statistical correlation between physical scene observables and ground truth project risk indicators manually annotated by project supervisors. The output four-dimensional vector r = [rtech, rqual, rsched, rcost] forms the normalized engineering risk vector, which is further projected to the abstract analogy risk kinematic space via the projection-scaling transformation defined in Section 2.1 for subsequent UAV-VRC relative motion calculation and decision-making model input.
3. Construction of the Super-Conflict Gray Target Negotiation (SCGTN) Model
Complex equipment development scenarios commonly present decision-making dilemmas characterized by unequal multi-agent status, full multi-objective confrontation, and intense multi-indicator super-conflict. The four core indicators—technology, schedule, quality, and cost—exhibit irreconcilable opposing relationships. Additionally, the general contractor, as the super decision-maker, holds mandatory dominant authority, making it difficult for traditional weighted decision-making and independent evaluation methods to achieve effective conflict resolution and collaborative consensus.
3.1. Concept Definition and Quantitative Measurement of Super-Conflict
In the multi-objective decision-making system of complex equipment development, super-conflict arises when indicators or stakeholder preferences exhibit extreme conflict characterized by complete opposition, incompatibility, and an inability to be reconciled through conventional linear weighting or compromise. Unlike general strategic conflicts, super-conflict occurs when improvements to one party’s objectives inevitably cause substantial deterioration in the objectives of another party. This phenomenon is typically embodied in two core trade-off relationships: technical indicators versus development schedule, and quality standards versus cost control.
To achieve precise quantitative identification of super-conflict, this paper adopts the signed Pearson correlation coefficient ρij in Equation (7) as the core conflict metric. Unlike the absolute value transformation widely adopted in many existing conflict-quantification studies, the signed coefficient inherently retains directional co-movement information critical for separating synergistic and antagonistic indicator pairs. For any two risk indicators xi and xj, the signed conflict correlation coefficient is defined as:
where Cov(xi, xj) denotes the covariance between indicators xi and xj, capturing both the direction and magnitude of linear co-movement. Var(xi) and Var(xj) represent individual indicator variances, describing fluctuation ranges. The coefficient ρij ∈ [−1,1] with clear directional interpretation: ① ρij > 0. Positive linear association. Improving one indicator concurrently optimizes the other; no competitive conflict exists between the pair. ② Cij ≈ 0. Near-zero correlation that is only trivial, with negligible weak conflict. ③ ρij < 0. Negative linear antagonism. Optimizing one metric inevitably degrades the other; this directional opposition is the essential defining characteristic of super-conflict in complex equipment development.
Conventional conflict quantification schemes often take the absolute value of correlation and discard sign information, which cannot differentiate mutually beneficial positive synergy from mutually exclusive negative opposition. This paper retains the raw signed ρij to fully preserve directional antagonism information required to identify super-conflict. The magnitude |ρij| quantifies the severity of co-movement, while the sign distinguishes synergistic vs. conflicting relationships. Super-conflict is formally restricted to pairs satisfying two simultaneous conditions:
where λ = 0.85 denotes the unified super-conflict intensity threshold applied consistently throughout the manuscript. In aerospace equipment engineering practice, technology–schedule and quality–cost form inherent mutually exclusive trade-offs. The signed negative correlation directly reflects this zero-sum resource competition logic, whereas positive correlation describes complementary indicators with no competitive friction. The absolute magnitude |ρij| measures how rigid this trade-off constraint is.
ρij < 0,|ρij| > λ
The unified threshold λ = 0.85 is not arbitrarily selected; it is calibrated from 42 historical complex aviation equipment development datasets covering design, prototyping, and test phases. For indicator pairs with |ρij| ∈ [0,0.85), negative correlations in this range correspond to mild, adjustable trade-offs resolvable via routine resource reallocation, classified as ordinary decision conflict. For indicator pairs with ρij < 0 and |ρij| > 0.85, trade-offs become rigid and non-tunable through conventional linear weighting; resource redistribution cannot simultaneously lift both indicators, matching the formal definition of super-conflict. All positive correlation pairs with |ρij| > 0.85 represent synergistic indicator groups without competitive friction and are excluded from super-conflict classification by the sign constraint ρij < 0.
This two-part rule (negative sign + magnitude exceeding 0.85) eliminates the ambiguity caused by absolute value-only metrics and resolves the prior inconsistency between Section 3.1 and the case study. All subsequent modeling, simulation, and case analysis uniformly adopt λ = 0.85 as the super-conflict threshold. Super-conflict cannot be identified merely by absolute correlation magnitude. The negative sign of the signed Pearson coefficient is mandatory to distinguish antagonistic zero-sum trade-offs from synergistic positive correlation indicator pairs.
3.2. Design of Hard Consensus Negotiation Mechanism Within Alliances
Under the super-conflict decision-making framework, participating stakeholders spontaneously form several stable alliances based on their interest demands, risk preferences, and goal similarity. Members within an alliance exhibit low conflict levels and relatively consistent positions, making them suitable for reaching unified opinions through a one-time, strongly constrained negotiation approach. To this end, we adopt the Nash bargaining framework to achieve hard consensus within the alliance, meaning a decision outcome fully accepted by all members is formed through a single round of negotiation.
The classical Nash bargaining paradigm takes the maximization of the Nash product as its core optimization target. In this paper, we extend it to a weighted Nash bargaining product adapted to multi-agent alliance decision-making, where stakeholder weights are introduced as exponents of individual utility surplus rather than multiplicative scaling factors. Meanwhile, we explicitly define the disagreement point : it represents the baseline utility of the i-th decision-maker within the alliance when negotiation breaks down, i.e., the minimum acceptable satisfaction under the original conflicting scheme without any compromise adjustment. Subject to the individual rationality constraint , the weights ωi > 0 satisfy and encode the relative bargaining power of each agent inside the alliance. Using exponents for weights ensures that agent bargaining power directly shifts the location of the optimal negotiation solution.
To accurately characterize the risk aversion commonly exhibited by stakeholders in complex equipment development, a left-skewed parabolic satisfaction function is selected to quantify individual decision satisfaction:
where li and oi are the lower acceptable threshold and optimal expected objective for decision-maker i, respectively. Based on the standard Nash bargaining axiom system, we reconstruct the intra-alliance hard consensus optimization model by replacing the simple linear weighted sum with a weighted Nash product and introduce the disagreement point as a hard constraint to guarantee individual rationality.
The classical Nash bargaining solution is extended to a weighted form to reflect heterogeneous bargaining power among different alliance members. In this formulation, the bargaining weight ωi is introduced as the exponent of the utility surplus, rather than a multiplicative scaling factor. This design ensures that the weight parameter can effectively shift the location of the negotiation equilibrium. The complete weighted Nash bargaining model is expressed as:
where ωi quantifies the relative bargaining power of participant i. A larger value of ωi means the preference of participant i carries higher priority during intra-alliance negotiation.
If weights were implemented as multiplicative constants inside the product, the product term of all weights would act as a fixed scaling factor throughout optimization and cannot alter the optimal negotiation solution, thereby making the weighting mechanism functionally ineffective. The exponent-based weighted Nash product adopted in Equation (16) follows the standard axiomatic framework of weighted Nash-bargaining theory. For practical numerical implementation, the multiplicative objective can be equivalently transformed into a logarithmic summation form to improve computational stability:
This logarithmic transformation yields exactly the same optimal solution as the product form objective and mitigates the risk of numerical underflow that frequently occurs in high-dimensional multi-agent negotiation scenarios.
Under the proposed model, the negotiated equilibrium maximizes the weighted product of participants’ utility surpluses. The obtained solution satisfies three core axioms for weighted Nash-bargaining: individual rationality, Pareto optimality, and invariance under affine utility transformations. These theoretical properties make the model well-suited for addressing super-conflict challenges arising from collaborative decision-making within stakeholder alliances. The disagreement point di imposes a hard lower-bound constraint: only candidate solutions yielding satisfaction higher than the negotiation breakdown baseline are treated as feasible. This setup overcomes the known limitation of simple linear weighted-sum methods, which fail to explicitly quantify utility losses induced by negotiation failure. Solving this optimization model rapidly yields a unified collective position for the entire alliance, which serves as a solid prerequisite for subsequent multi-round negotiation between the alliance and the super decision-maker.
3.3. An Iterative Soft Consensus Method for Alliance Super Decision-Maker Negotiation
Since the super decision-maker holds mandatory dominant authority, it is difficult to reach a fully consistent hard consensus directly between the alliance and the super decision-maker. Therefore, a soft consensus mechanism with multi-round iteration and progressive approximation is adopted. After each round of negotiation, the consensus level of each decision-making stakeholder is calculated to measure the proximity between the current scheme and the optimal expected scheme:
where is the maximum achievable satisfaction of decision-maker k. Based on the individual consensus levels, the global total consensus level is further obtained through weighted summation:
Among them, M denotes the number of decision-making alliances participating in the negotiation. When the group consensus level (GCL) reaches the preset threshold, i.e., C ≥ C*, it is determined that an acceptable and stable soft consensus is achieved through negotiation, and the negotiation process is terminated. This mechanism not only respects the dominant position of the super decision-maker but also reserves reasonable adjustment space for ordinary alliances, making it more consistent with the real decision-making logic of complex equipment development.
3.4. Altruistic Preference and Berge Equilibrium Optimization
To further enhance the internal cohesion of the alliance, reduce internal consumption, and improve long-term stability, altruistic behavior is introduced during the formation of hard consensus. That is, while pursuing the maximization of their own satisfaction, decision-makers proactively take into account the benefit levels of other members. This self-and-others-balanced behavioral characteristic exactly corresponds to the definition of Berge equilibrium in game theory. Different from the Nash equilibrium that only considers unilateral self-interest optimization, the Berge equilibrium requires that any participant’s independent deviation will simultaneously reduce their own utility and the total utility of all remaining participants, which perfectly matches the collaborative coordination demand within equipment development alliances. Based on this theoretical premise, we construct an internal altruistic optimization model for the alliance:
In the equation, α ∈ [0,1] denotes the altruism coefficient, which is used to adjust the intensity of altruistic tendency. Engineering practices and simulation results indicate that the appropriate introduction of altruistic behavior can significantly reduce the level of internal conflicts within the alliance, improve the convergence speed of negotiations and the overall benefits, and enable the alliance to maintain a more stable and unified position when negotiating with the super decision-maker.
Where α denotes the altruism coefficient used to adjust the intensity of altruistic tendency. We further verify the inherent logical connection between Equation (12) and the Berge equilibrium via first-order optimality derivation: when all alliance members adopt the altruistic utility function in Equation (12) as their optimization objective, the optimal solution solved simultaneously satisfies the necessary and sufficient conditions of the Berge equilibrium. Specifically, taking the partial derivative of with respect to decision variable x yields the unified optimality condition balancing individual self-interest and group collective benefit; if any single member deviates from the converged optimal scheme, the decline of their own individual satisfaction will be accompanied by the loss of aggregated satisfaction of all other alliance members, which fully meets the core judgment standard of the Berge equilibrium. Engineering practices and simulation results indicate that the appropriate introduction of altruistic behavior can significantly reduce the level of internal conflicts within the alliance, improve the convergence speed of negotiations and the overall benefits, and enable the alliance to maintain a more stable and unified position when negotiating with the super decision-maker.
3.5. Construction of Fairness-Concerned Utility Function
In multi-alliance negotiation scenarios, decision-making agents generally exhibit fairness concerns, comparing their own payoffs with those of other alliances. This comparison triggers psychological effects such as envy, compassion, and pride, which directly affect negotiation stability and decision acceptance. To accurately characterize this behavioral trait, we introduce the envy coefficient β and the compassion/pride coefficient γ and construct a fairness preference utility function as follows:
In the formula, [⋅]+ denotes the positive part function. By penalizing payoff disparities and compensating for advantageous differences, this function effectively prevents dominant alliances from excessively squeezing weaker ones, enhances the fairness and acceptability of global decisions, and makes the final solution easier to implement collectively by all parties.
3.6. Dynamic Reward and Punishment Mechanism for Negotiation Convergence
In multi-agent super-conflict negotiation processes, iteration efficiency and convergence stability directly determine the implementability of decision-making schemes. To effectively accelerate negotiation convergence, reduce iteration rounds, suppress unnecessary back and forth, and prevent the spread of development risks caused by negotiation delays, this section designs a dynamic reward and punishment mechanism strongly coupled with the magnitude of consensus improvement. This mechanism directly links the rate of consensus change to negotiation losses, forming self-adaptive incentive and constraint rules of “high improvement-low loss, low improvement-high loss, negative improvement-severe punishment”, which ensures the fast and stable convergence of the negotiation process at the institutional level. To quantitatively characterize the improvement of consensus level within a single negotiation round, the consensus improvement rate ΔCt is defined to measure the degree of consensus gain in the t-th round of negotiation compared with the previous round, whose mathematical expression is:
In the formula, ΔCt denotes the consensus improvement rate of the t-th round of negotiation, which is dimensionless. Ct is the global consensus level after the completion of the t-th round of negotiation. Ct−1 is the total global consensus level after the completion of the t − 1-th round of negotiation. Specifically, when ΔCt > 0, it indicates a positive improvement in the consensus level, meaning that the negotiation achieves effective progress. When ΔCt = 0, it means the consensus level remains unchanged, and the negotiation falls into stagnation. When ΔCt < 0, it represents a decline in the consensus level, resulting in a conflict rebound in the negotiation. Based on the consensus improvement rate, an exponential-type dynamic negotiation loss function is constructed, which nonlinearly links the reward and punishment intensity with the magnitude of consensus improvement, realizing smooth transition and precise regulation of incentives and penalties. Its mathematical expression is:
In the formula, Lt denotes the unit negotiation loss of the t-th round, including time cost, resource consumption, communication overhead, etc. L0 is a constant representing the benchmark unit negotiation loss, which corresponds to the basic loss when there is no consensus improvement. k is the reward and punishment adjustment coefficient, with k > 0, which is used to control the intensity of incentives and penalties, and its value is determined by the engineering scenario and decision preferences. ΔCt is the consensus improvement rate of the t-th round of negotiation. If ΔCt is significantly positive, decreases rapidly, leading to a significant reduction in Lt and forming a strong positive incentive. If ΔCt ≈ 0, then Lt ≈ L0, and the loss remains at the baseline level, indicating no incentive or penalty. If ΔCt ≈ 0, then and Lt > L0, and the loss rises significantly, triggering a strong penalty constraint. This mechanism can effectively guide each decision-making agent/alliance to actively improve consensus, avoid ineffective bargaining, and significantly enhance the efficiency of super-conflict resolution.
3.7. Integrated SCGTN Negotiation Model
On the basis of quantitative measurement of super-conflict, intra-alliance hard consensus, cross-level soft consensus iteration, altruistic behavior optimization, fairness-concerned utility correction, and dynamic reward–punishment incentives, this study integrates the four major objectives of individual optimality, global fairness, conflict suppression, and convergence stability and constructs the final super-conflict gray target negotiation model (SCGTN). This model realizes integrated modeling and optimal solution for collaborative decision-making under high-conflict, non-equal, and strongly constrained scenarios. The model takes minimizing individual decision deviation and minimizing the global super-conflict level as its dual-core objectives, with the mathematical form expressed as:
In the formula, Ftotal denotes the global optimization objective function of the super-conflict gray target negotiation model. m is the total number of decision-making agents/alliances involved. ωi represents the decision weight of the i-th decision-making agent/alliance, satisfying . λc is the global conflict penalty coefficient, which is used to balance the weights between individual target-center deviation and global conflict suppression.
Two core unquantified variables di and Cglobal are supplemented with fully operational, computable mathematical definitions below to support numerical solution based on engineering measured data.
- (1)
- Target-center distance di: It refers to the standardized 4-dimensional Euclidean distance between the adjusted scheme of the i-th agent/alliance and the optimal gray target center output by the Virtual Risk Center (VRC). All four core indicators (technology T, schedule S, quality Q, cost C) are normalized to [0,1] to eliminate dimensional differences, and their specific calculation formula is:where Ti, Si, Qi, Ci are the normalized indicator values of the i-th participant’s negotiation scheme. T∗, S∗, Q∗, C∗ are the unified optimal equilibrium target values of four dimensions generated by the VRC after decoupling super-conflict indicators. Larger di means the participant’s scheme deviates more seriously from the globally optimal risk control target.
- (2)
- Global super-conflict degree Gconflict: It aggregates pairwise indicator conflict coefficients defined in Section 3.1 to quantify the overall antagonistic intensity of the entire project system. Only indicator pairs meeting the strong super-conflict threshold ρth = −0.85 are counted via the binary indicator function 𝕀(⋅). Symmetric indicator pairs are not double-counted; each unordered pair is evaluated only once. All super-conflict relevant computation, including pairwise indicator screening and global super-conflict degree aggregation, strictly adopts the dual criteria (ρpq < 0 and |ρpq| > 0.85) proposed in Section 3.1. The aggregation formula is:where denotes the total number of unordered pairwise combinations of the four core indicators (technology, schedule, quality, cost). ρpq is the signed Pearson conflict coefficient between indicator p and indicator q. 𝕀(⋅) represents the binary indicator function, which takes a value of 1 only when ρpq ≤ −0.85. Otherwise, it equals 0. This formulation excludes positively correlated indicator pairs, as synergistic relationships cannot constitute super-conflict. A larger value of Gconflict indicates stronger overall super-conflict among multi-dimensional indicators, originating from mutually antagonistic trade-offs between indicators.
4. Optimal Virtual Risk Trajectory Generation Based on PPO
After multi-agent super-conflict negotiation, only static optimal decision objectives are obtained, which cannot be directly applied to complex equipment development sites characterized by high dynamics, strong disturbances, and real-time sensing closed loops. To transform the negotiated consensus into a traceable, convergent, adaptive, and strongly robust dynamic risk evolution path, continuous and intelligent real-time regulation of risk states is required. This chapter models the risk trajectory optimization problem as a sequential decision-making problem and, based on Markov Decision Processes and the Proximal Policy Optimization (PPO) algorithm, realizes end-to-end autonomous generation of optimal virtual risk trajectories, providing a high-precision dynamic benchmark for subsequent trajectory synthesis and closed-loop control.
4.1. Modeling of Risk Regulation as a Markov Decision Process (MDP)
The full-process dynamic risk regulation of complex equipment development is rigorously modeled as a standard Markov Decision Process (MDP), enabling the unified embedding of risk dynamics evolution, UAV real-time sensing, control command output, and system optimization objectives. The MDP consists of four components: state space, action space, state transition probability, and reward function. The state transition probability is implicitly expressed by the three-degrees-of-freedom risk evolution model and the UAV-VRC relative motion model, ensuring physical consistency and engineering interpretability.
4.1.1. State Space Selection and Vector Construction
The state space is used to fully describe the observable information of the risk system at each moment, serving as the direct basis for decision-making by the policy network. To balance state completeness, observability, and computational real-time performance, six key state variables that can be directly calculated from UAV sensing data, have clear physical meanings, and fully characterize the relative motion relationship of risks are selected to form the state vector of the MDP. The mathematical expression of the state vector is as follows:
In the formula: r denotes the risk-sensing relative distance between the UAV and the Virtual Risk Center. represents the rate of change in the relative distance, which is used to characterize the velocity trend of the risk approaching or receding. λ is the risk line-of-sight elevation angle, reflecting the position deviation of the risk in the vertical dimension. is the rate of change in the elevation angle, representing the rate of change in the vertical deviation. φ is the risk line-of-sight azimuth angle, reflecting the pointing deviation of the risk in the horizontal dimension. is the rate of change in the azimuth angle, representing the rate of change in the horizontal deviation. All the above states can be obtained in real time through UAV real-time sensing, coordinate transformation, and kinematic solution. They feature low latency, observability, and easy engineering implementation and can provide stable and reliable decision-making inputs for the policy network.
4.1.2. Continuous Action Space Design
The action space represents the continuous control commands output by the decision-making system, determining the adjustment method and convergence performance of the risk trajectory. Considering that the risk management and control process of complex equipment development requires smooth, continuous, and shock-free control output to avoid system oscillation or state jumps caused by step commands, a continuous-valued action space design is adopted, abstracting risk regulation into normal and heading overloads:
In the formula, an denotes the normal overload, which is used to suppress, guide, and correct the trend of risks in the vertical direction. ah denotes the heading overload, which is used to complete the correction, turning, and path adjustment of risks in the horizontal direction. The continuous action space can better match the physical constraints and actuator characteristics of the equipment development site, ensuring smooth control command output, natural transitions, no overshoot, and no abrupt changes, thus improving the stability and reliability of the overall closed-loop system.
4.1.3. Construction of the Composite Reward Function
The reward function serves as the optimization guide for deep reinforcement learning algorithms, aiming to guide the agent to gradually learn the optimal decision-making policy. To simultaneously ensure the smoothness, convergence efficiency, and terminal control accuracy of the virtual risk trajectory, a weighted composite reward function combining process reward and terminal reward is adopted, enabling full-cycle constraints and guidance for the trajectory optimization process. The mathematical expression of the total reward at each time step t is formulated as:
where λp = 0.6 denotes the weight coefficient of process reward and λt = 0.4 represents the weight coefficient of terminal reward, satisfying λp + λt = 1.
Rt = λpRprocess,t + λtRterminal, t
- (1)
- Process reward Rprocess,t
Process reward imposes continuous penalties on unstable risk states, violent control fluctuations, and excessive state deviation during the whole training episode, which is defined as:
where denotes the continuous two-dimensional action vector consisting of vertical normal overload nt and horizontal heading overload ht, ∥at∥2 represents the L2 norm of the control action vector that imposes penalties on large-amplitude shock control with a fixed weight ω1 = 0.2, |Δat| stands for the absolute variation of control commands between adjacent time steps to penalize abrupt jumps of adjustment instructions with weight ω2 = 0.3, and dt is the normalized Euclidean distance between the real-time risk state and the optimal target center of the Virtual Risk Center (VRC) at time t, which restrains sustained risk deviation from the negotiated optimal objective with weight ω3 = 0.5.
- (2)
- Terminal Reward Rterminal,t
The terminal reward only takes effect at the termination step t = T of each complete training episode, and it equals zero for all non-terminal steps (t < T). A piecewise segmented reward function is constructed based on the final deviation distance dT at episode termination, implementing graded positive incentives for qualified convergence and hierarchical negative penalties for large tracking errors:
The graded reward design drives the agent to prioritize accurate terminal convergence while avoiding local optimal solutions with excessive intermediate oscillation. To fully standardize the Markov Decision Process (MDP) modeling for risk trajectory optimization, critical boundary and sampling parameters are supplemented below.
- (1)
- Action space hard limits: The continuous overload actions are constrained within fixed bounds to comply with engineering site control constraints: nt ∈ [−3,3], ht ∈ [−2.5,2.5]. Any action output exceeding the predefined range will be clamped to the boundary value before being imported into the three-dimensional risk evolution dynamics model to prevent unrealistic risk regulation commands.
- (2)
- Reward discount factor: A discount factor γ = 0.97 is adopted to weight future cumulative rewards, which enables the agent to consider long-term trajectory evolution rather than only instantaneous single-step benefits.
- (3)
- GAE advantage estimation hyperparameter: The Generalized Advantage Estimation (GAE) coefficient λGAE = 0.95 is configured to balance the bias and variance of sampled advantage values, stabilizing the policy gradient update of the PPO algorithm.
4.2. Implementation and Policy Optimization of the PPO Algorithm
To address the practical requirements of the risk dynamic trajectory optimization task for complex equipment development, including continuous control, strong constraint coupling, dense external disturbances, high training stability, and stringent real-time engineering deployment, the Proximal Policy Optimization (PPO) algorithm is selected as the core learning framework for the intelligent generation of virtual risk trajectories. By constraining the magnitude of policy updates through a clipped objective function, PPO combines high sampling efficiency with high training stability, effectively avoiding policy collapse, training divergence, and output jitter, making it highly suitable for safety-critical and highly dynamic risk management scenarios.
4.2.1. Construction of the PPO Clipped Objective Function
The core of the PPO algorithm is to construct a clipped objective function that maximizes the expected return while ensuring stable policy updates. Its standard clipped objective function is expressed as:
In the formula, rt(θ) denotes the importance sampling probability ratio, which is used to realize probability weighting between old and new policies and efficient reuse of historical data; is the advantage function, which measures the reward advantage of the currently executed action over the average policy and serves as the core guidance for driving policy iteration improvement. ϵ is the clipping coefficient, which is usually set to a fixed value of 0.2 and is used to strictly limit the single update magnitude of the policy, avoiding problems such as severe fluctuations in the risk trajectory and system instability caused by policy mutations. During training, by alternately performing policy sampling and clipped objective optimization, efficient sample utilization and stable policy improvement are achieved, enabling the agent to converge to the optimal risk control strategy within a limited number of iterations.
4.2.2. Lightweight Network Architecture
To meet the practical requirements of UAV real-time perception, edge computing, low-latency inference, and on-site engineering deployment, we construct a lightweight, high-precision, and gradient-stable policy value dual-output network. The network takes the 6-dimensional observable risk state as input and outputs the Gaussian distribution parameters of continuous actions and the state value in parallel, enabling synchronous update and joint optimization of the policy and value functions. The overall network adopts a three-layer fully connected hidden layer structure of 6→128→128→128, i.e., input layer (six nodes) + three hidden layers (each with 128 neurons) + a dual-branch output layer for action distribution and state value estimation. All hidden layers uniformly adopt the GELU activation function in all training and simulation experiments. ReLU is only discussed as an alternative candidate and was not implemented in our formal experiments, eliminating ambiguity of activation selection. GELU is selected for its smoother gradient transition, which suppresses abrupt jumps of control outputs and avoids gradient vanishing during long-horizon trajectory optimization. The output layer performs an uninterrupted continuous mapping of normal overload and heading overload, ensuring that the output commands strictly comply with the physical constraints and actuator limitations of the equipment development site. While guaranteeing decision accuracy, the lightweight network architecture significantly reduces computational complexity and inference latency, meeting the requirements of intelligent early warning and control for complex equipment development risks, including millisecond-level response, high-frequency updates, and robust tracking.
4.2.3. Complete Training Hyperparameters, Standardized Experimental Settings, and Optimal Virtual Risk Trajectory Output
To meet the low-latency edge computing deployment requirements of on-site UAV risk perception and fully guarantee the reproducibility of training results, this subsection systematically supplements all optimizer, sampling, iteration, termination, random-control, and training–test–split hyperparameters uniformly adopted in the PPO training pipeline before introducing the output characteristics of the converged optimal virtual risk trajectory. The lightweight policy value dual-output network with the 6→128→128→128 fully connected hidden layer structure adopts the AdamW optimizer for parameter updating, configured with an initial learning rate of 3 × 10⁻⁴, a weight-decay coefficient of 1 × 10⁻⁵, and a linear decay schedule that gradually reduces the learning rate to zero throughout the whole training cycle. A gradient-clipping threshold of 0.5 is additionally set to restrain gradient explosion during backpropagation. For trajectory sampling and policy update configurations, the mini-batch size is fixed to 256; each independent training episode contains a maximum of 1200 discrete time steps, and every batch of collected trajectory samples undergoes 10 rounds of repeated policy optimization epochs to fully utilize sampling data. Three mutually exclusive episode-termination conditions are defined to balance training efficiency and control stability: the episode terminates when reaching the maximum step limit of 1200. The episode is forced to end prematurely if the normalized risk deviation distance > 2.0, which represents irreversible risk divergence. The episode activates early termination when the risk deviation remains <0.05 for 150 consecutive steps, indicating stable high-precision convergence to the VRC target center. A fixed global random seed seed = 78,921 is applied uniformly to network weight initialization, random sampling of initial risk states, and simulation of UAV sensing noise, eliminating random interference to ensure repeatable training outcomes.
The dataset is partitioned into three mutually disjoint subsets: training set, validation set, and held-out test set. The training set contains 1200 independent initial risk states uniformly sampled within the normalized four-dimensional risk space for network gradient updates. The validation set comprises 400 initial risk samples dedicated exclusively to intermediate convergence monitoring and model selection throughout training. The held-out test set includes 200 unseen initial risk states; this subset remains fully isolated and is only employed for one-shot final performance evaluation upon training completion. Critically, the held-out test set is never accessed in any training iteration, hyperparameter adjustment, or model selection procedure.
During the training process, offline evaluation is performed on the independent validation set every 10 training iterations to record the average cumulative reward and trajectory-tracking deviation error. The policy is considered fully converged if the average validation set reward remains within a fluctuation band of ±0.3 across 50 consecutive evaluation rounds. Once the convergence criterion is satisfied, training stops and model weights are frozen. Only after model freezing is the held-out test set fed into the trained policy to generate final unbiased performance metrics. This strict workflow eliminates test set leakage into the training loop, hyperparameter tuning, and early-stopping logic.
The whole experiment carries out 1500 independent repeated training runs under identical hyperparameter settings. After model weights are frozen according to validation set convergence criteria, final evaluation is conducted on the held-out test dataset to record average cumulative reward and trajectory tracking deviation error.
4.2.4. Optimal Virtual Risk Trajectory Output
After finishing the standardized full training workflow described in Section 4.2.3 and reaching stable policy convergence, the intelligent agent takes the six-dimensional real-time risk state vector collected by UAV multi-modal sensing as input and directly outputs the optimal virtual risk trajectory in an end-to-end manner, as illustrated in Figure 4. Guided by the weighted composite reward function and the clipped PPO policy constraints, the trajectory originating from any random initial risk state within the normalized risk space converges steadily and continuously toward the ideal risk bullseye of the Virtual Risk Center (VRC) without obvious oscillation. This trajectory precisely matches the static optimal risk evolution reference path obtained from the super-conflict gray target negotiation model, serving as the core dynamic benchmark for subsequent vector fusion with the Archimedean spiral smooth convergence trajectory. The resulting virtual risk trajectory delivers standardized, high-fidelity reference signals that underpin the full closed-loop workflow consisting of UAV on-site real-time perception, multi-agent super-conflict resolution, intelligent collaborative decision-making, and dynamic risk regulation for complex equipment development programs.
Figure 4.
Optimal virtual risk trajectory based on PPO.
To substantiate the claims of zero overshoot, uniform trajectory smoothness, and robust system stability, we integrate theoretical convergence deduction and large-scale statistical testing on independent test datasets to supply rigorous quantitative evidence. Theoretically, the composite reward function constructed in Section 4.1.3 introduces two persistent regularization penalties: an L2 penalty restricting the magnitude of overload control actions and an absolute difference penalty suppressing abrupt jumps between consecutive control commands. These two penalty terms mathematically bound the first-order and second-order differentials of risk state coordinates, inherently constraining impulse-style overshoot and violent trajectory oscillation throughout the whole convergence process. For empirical statistical validation, the fully trained PPO policy is evaluated on all 200 unseen initial risk states in the test set, which are completely isolated from training samples to rule out overfitting interference. The test statistics show a 0% overshoot occurrence rate across all episodes, an average second-order variation of control commands (a quantitative smoothness metric) of merely 0.021, and a 100% convergence ratio without sustained oscillatory behavior. All quantitative metrics measuring trajectory stability, smoothness, and overshoot performance are supplemented in Figure 4. These measurable statistical results independently verify the favorable trajectory characteristics, rather than drawing conclusions merely based on the qualitative properties of the PPO algorithm framework.
5. Synthesis of Executable Trajectories for Risk Early Warning and Control
The virtual risk trajectory is merely a theoretically optimal decision path and cannot be directly applied in engineering practice. To realize the transformation from theoretical decision-making to on-site implementation, this paper constructs a super-conflict smooth convergence trajectory based on the Archimedean spiral. By performing vector superposition of the virtual risk trajectory and the smooth convergence trajectory, an engineering-oriented risk early warning and control trajectory is synthesized, which features no overshoot, trackability, low disturbance, and high robustness. This trajectory supports UAV real-time inspection, closed-loop risk regulation, and multi-agent collaborative execution.
5.1. Smooth Convergence Trajectory Based on the Archimedean Spiral
In super-conflict environments, when risks rapidly approach the target, oscillations, jumps, and non-smooth convergence often occur. Traditional linear or exponential convergence methods cannot simultaneously address conflict resolution and system stability. Therefore, the Archimedean spiral is adopted as the core form of smooth convergence to achieve a “soft landing” of super-conflicts.
5.1.1. Polar Coordinate Equation and Convergence Characteristic Analysis
The Archimedean spiral, expressed in polar coordinates, has a clear physical meaning, a concise form, and is easy to implement in engineering. It can accurately describe the complete motion law of the risk state converging smoothly from the initial position to the Virtual Risk Center. Its polar coordinate equation is written as:
where r denotes the real-time radius at any position on the spiral trajectory, representing the real-time distance between the risk state and the Virtual Risk Center. θ is the polar angle, indicating the angular position of the risk rotating and converging around the VRC. r0 is the initial radius, corresponding to the initial state at the start of risk control. b is the pitch coefficient, which is used to adjust both the convergence speed and smoothness, and it is a key parameter balancing rapid convergence and stable transition. This equation ensures that the radius decreases linearly with the polar angle, allowing the risk to approach the center steadily at a constant rate, thus avoiding shocks, oscillations, and command mutations caused by nonlinear contraction.
r(θ) = r0 − bθ
5.1.2. Determination of the Pitch Coefficient and Number of Convergence Turns
To adapt to different initial risk intensities and development phases, the pitch coefficient is jointly determined by the initial perceived distance and the preset number of convergence turns:
where N is the number of convergence turns, ensuring that the trajectory reaches the target precisely within the specified number of turns.
To prevent overshoot, shock, and reduced coincidence accuracy caused by excessive terminal velocity, a uniform deceleration constraint is added to the trajectory motion, gradually reducing the speed of the risk as it approaches the target to achieve impact-free and precise alignment. The constraint is expressed as:
where at is the tangential acceleration, vt is the tangential velocity, and k is the deceleration coefficient, which is used to adjust the smoothness of terminal convergence. Through this constraint, the risk state continuously decelerates as it approaches the virtual center, ultimately achieving high-precision, impact-free alignment among the actual risk state, the UAV-sensed position, and the Virtual Risk Center.
at = −kvt
5.1.3. Uniform Deceleration Constraint and Impact-Free Convergence Design
The Archimedean spiral exhibits excellent motion characteristics, including a linearly decreasing radius with polar angle, uniform and continuous convergence, no local extrema, no directional mutations, and no oscillations. During the risk’s approach to the Virtual Risk Center (VRC), it can mitigate the strong antagonistic relationships between indicators such as technical progress and quality cost in a gradual, gentle, and controllable manner, thereby fundamentally preventing system instability caused by control shocks.
The resulting super-conflict smooth convergence spiral trajectory is shown in Figure 5. With the VRC as the pole, the radius decreases linearly as the polar angle increases, forming a uniformly continuous, mutation-free, and oscillation-free convergence profile. This trajectory clearly describes the smooth transition of the risk from a high-conflict, high-deviation state to a low-conflict, high-stability state, providing an intuitive and rigorous kinematic basis for trajectory superposition, perception-based tracking, and control command output.
Figure 5.
Archimedean spiral trajectory for smooth convergence in super-conflict scenarios.
5.2. Vector Superposition of Virtual Trajectory and Convergence Trajectory
Critically, the two trajectories adopt identical discrete time parameterization with a fixed uniform time step, fully synchronized with the three-dimensional risk evolution dynamics numerical solver. All position and velocity vectors must be sampled at exactly identical timestamps t to eliminate time mismatch error, which is the prerequisite guarantee of dynamic consistency. The vector superposition rules for position and velocity are strictly decoupled and computed separately at each shared time step, expressed mathematically as:
where Pppo(t),Vppo(t) denote the position and velocity vectors of the PPO virtual risk trajectory at synchronized time t, and Pspiral(t),Vspiral(t) represent the position and velocity vectors of the Archimedean spiral convergence trajectory sampled at the exact same timestamp t.
We verify kinematic consistency analytically. Taking the first-order time derivative of the synthesized position yields:
The PPO training loop enforces internal kinematic consistency via the risk evolution dynamics model, and the Archimedean spiral trajectory is pre-computed with analytical time derivative velocity derived from its polar coordinate time domain parametric equation. This confirms that strictly holds at every time step, satisfying the differential dynamic consistency constraint.
Before introducing the mathematical verification of kinematic consistency, we elaborate on the inherent complementary characteristics of the two trajectories and the core design rationale for adopting vector-superposition fusion. The PPO-generated virtual risk trajectory is optimized based on the multi-agent equilibrium output of the SCGTN negotiation model. It inherits the global optimal decision target after resolving multi-party super-conflicts, yet it is not explicitly constrained to produce oscillation-free, soft-landing convergence under intense super-conflict scenarios. By contrast, the Archimedean spiral convergence trajectory is specially tailored for super-conflict risk regulation, which imposes built-in deceleration constraints to achieve overshoot-free and gradual convergence toward the VRC target. However, this geometric trajectory alone does not contain multi-agent negotiation equilibrium information.
Vector superposition is, therefore, introduced to combine these two complementary strengths: preserving the globally optimal equilibrium derived from multi-agent negotiation in the PPO virtual risk trajectory while importing the smooth, decelerated soft-landing convergence property of the Archimedean spiral. Other fusion alternatives are available, such as weighted scalar blending and mode-switching trajectory schemes. Nevertheless, mode-switching strategies may induce undesirable abrupt state jumps at switching instants. Simple weighted scalar blending will distort the intrinsic geometric convergence property of the Archimedean spiral. Synchronized vector superposition under unified discrete timestamps avoids these defects and maintains kinematic differential consistency for every time step.
To satisfy the core kinematic consistency requirement that the time derivative of synthesized position equals synthesized velocity, we conduct analytical differentiation verification: taking the first-order time derivative of the synthesized position vector yields . The PPO training loop enforces internal kinematic consistency via the risk evolution dynamics model, and the Archimedean spiral trajectory is pre-computed with analytical time derivative velocity derived from its polar coordinate time domain parametric equation. Substitution confirms , which strictly satisfies the differential dynamic consistency constraint at every time step.
Beyond kinematic consistency, we further address actuator feasibility, overshoot suppression, closed-loop stability, and robustness via control theoretic design and quantitative testing. First, actuator hard constraints are embedded during vector synthesis: the synthesized velocity vector Vsyn(t) is mapped to site overload control commands, which are clamped to the engineering limits defined in Section 4.1.3; any combined control output exceeding the actuator range is proportionally scaled back to feasible bounds to avoid physically unachievable regulation instructions. Second, the dual-layer anti-overshoot design eliminates trajectory overshoot: the PPO composite reward function imposes continuous action regularization penalties to avoid violent state jumps, while the Archimedean spiral adopts uniform deceleration constraints in Equation (25) to ensure gradual radial attenuation toward the VRC target center; statistical test results on 200 independent test samples in Table 2 confirm a 0% overshoot occurrence rate for the final executable trajectory. Third, robustness verification is carried out by adding bounded Gaussian disturbance to the UAV perception state input within the range. The average trajectory deviation error only rises from 1.38% to 1.67% under persistent disturbance, verifying strong anti-interference robustness of the synthesized trajectory.
Table 2.
Control theoretic baseline comparative test results.
For fair comparative evaluation, three classic control theoretic baseline trajectory generation methods are added as benchmarks: (1) pure PPO virtual trajectory without spiral smoothing; (2) linear proportional derivative (PD) convergence trajectory; and (3) exponential decay convergence trajectory. Comparative test metrics including dynamic consistency error, maximum actuator overload, overshoot ratio, average tracking error, and disturbance robustness are listed in Table 2, which quantitatively demonstrates that the proposed vector-synthesized trajectory outperforms all baseline methods in kinematic consistency, actuator feasibility, stability, and anti-disturbance robustness. The final risk early warning and control trajectory obtained after synchronous vector superposition integrates the comprehensive advantages of globally optimal decision-making, strictly guaranteed dynamic consistency, actuator-compliant smooth convergence, formal Lyapunov stability, and strong disturbance robustness. It can be directly mapped to UAV on-site inspection paths, real-time risk control commands, dynamic allocation plans for development resources, and optimized adjustment strategies for project schedules. This forms a complete integrated control chain of “UAV real-time perception → intelligent super-conflict resolution → optimal trajectory generation → closed-loop precise regulation”, which accurately meets the high real-time and high-reliability intelligent risk management requirements in complex equipment development processes characterized by high dynamic disturbances, strong index conflicts, and multi-agent game interactions.
6. Case Study
This study combines desensitized real engineering measured data and a standardized full-process simulation verification system for cross-validation, with clear boundaries defined to strictly distinguish measured field ground truth and simulated derived data throughout all case analysis. The research object is a large complex aerial equipment R&D demonstration project with a 60-month development cycle, total investment over 5 billion yuan, and 11 core participating organizations, forming a typical unequal multi-agent game structure composed of one general integrator and two professional research alliances. It is necessary to explicitly distinguish two types of validation logic in this case: (1) Field experimental validation relies on a desensitized on-site measured ground truth dataset collected from a real equipment development site, which is mainly used for risk event labeling, hyperparameter calibration, and testing of risk early warning classification performance. (2) Simulation-based validation adopts a full-process numerical simulation platform. The simulation initial conditions and model hyperparameters are fully calibrated using real-world measured data; nevertheless, closed-loop dynamic control outputs are generated by numerical iteration rather than direct physical field measurement. Two categories of evaluation metrics are strictly separated: field-validated classification metrics are computed against manually annotated on-site ground truth labels, while closed-loop dynamic control metrics are simulation-generated outputs. It should be highlighted again that dynamic control indicators including closed-loop response latency, global decision-making conflict intensity, and steady-state risk deviation error cannot be directly acquired via physical on-site sensors in the current engineering setup; these metrics are simulation-predicted quantities rather than field-measured readings. No closed-loop control quantities are directly measured from physical site experiments in the current project. The project has prominent characteristics of multi-system deep coupling, wide-range cutting-edge technology deployment, and dynamically concentrated risk outbreaks, which can fully represent typical super-conflict risk dilemmas faced by all kinds of large complex equipment development programs. Two mutually independent data sources are clearly defined as follows:
- (1)
- Real engineering measured dataset (ground truth benchmark): All raw field data are collected on-site during the 28th month of the project (the critical transition phase from detailed design to prototype trial production, a high-incidence window of four-dimensional risks including technology, schedule, quality, and cost). This dataset includes multi-modal UAV visible/infrared/radar sensing raw data, monthly statistical records of technical defects, schedule lag, quality nonconformities and cost overruns, stakeholder negotiation preference records, and manually annotated risk ground truth labels marked by three senior project supervisors. All raw measured data undergo desensitization and min–max normalization to dimensionless [0,1] space to avoid leakage of confidential project information. A total of 70% of measured samples are used for model hyperparameter calibration, and the remaining 30% form a held-out test set never involved in training for unbiased performance evaluation.
- (2)
- Full-process simulation verification system: The numerical simulation platform takes normalized measured data as fixed initial boundary conditions and calibrated model parameters and performs continuous iterative calculation covering month 28 to month 36 with a uniform discrete time step of 0.1 s. The simulation system integrates the three-dimensional risk evolution dynamics model, UAV-VRC relative motion model, SCGTN negotiation module, and PPO trajectory optimization module and outputs dynamic risk sequences, real-time graded early warning signals, and multi-party negotiation equilibrium schemes. All trajectory deviation, closed-loop response delay, and decision conflict intensity indicators in subsequent comparison tables are pure simulation outputs calibrated by real measured parameters.
No classified military performance indicators or confidential project archives are adopted in model solution and case analysis; all experimental content focuses on verifying the generalizability of the proposed intelligent risk control framework for large equipment R&D. Under the original traditional offline management mode relying on manual statistics and periodic coordination meetings, the project suffered severe practical drawbacks including long schedule delays, continuous cost overspending, low one-time test qualification rate, delayed risk perception, and frequent multi-party decision conflicts, which highlights the practical demand for an integrated real-time perception conflict resolution-closed regulation system. In the following subsections, we elaborate standardized risk event definitions, graded early warning criteria, complete data collection and labeling workflows, and separate evaluation rules for measured ground truth and simulated outputs so as to quantitatively assess the comprehensive performance of the proposed method by comparing with classical risk management benchmarks.
All data in this case come from engineering measurements and project documents, including on-site perception data collected by multi-sensor inspection UAVs, survey data on decision-making games among participating institutions, historical risk evolution data, and baseline data under the traditional management mode, providing reliable support for model verification. To ensure consistent solution processes, reproducible results, and engineering credibility, full-process model parameters are uniformly calibrated based on theoretical constraints and project realities: three-dimensional risk evolution dynamics parameters are set as m = 1.2, g = 9.8, ρ0 = 1.25, and h = 8. The super-conflict measurement parameter sets the strong super-conflict determination threshold to |Cij| > 0.85. Negotiation model parameters are set as α = 0.35, β = 0.28, γ = 0.22, L0 = 0.05, and Gtotal ≥ 0.95. PPO reinforcement learning parameters include a clipping coefficient of ε = 0.2, an initial learning rate of 1 × 10⁻⁴, and a network structure of 6→128→128→128. Trajectory synthesis parameters include an Archimedean spiral convergence turn count of Nc = 3, a uniform deceleration constraint coefficient of kd = 0.85, and a maximum allowable risk deviation error of 1.5%.
6.1. Risk Event Definition, Early Warning Criterion, and Ground Truth Labeling Protocol
To eliminate ambiguous boundaries between field-measured engineering data and simulation outputs, this subsection systematically formalizes quantitative risk event thresholds, multi-tier early warning triggering rules, and standardized pipelines for data acquisition, ground truth annotation, and performance evaluation separation. All experimental procedures defined herein ensure full reproducibility of case validation. Throughout the evaluation workflow, risk classification metrics are derived by aligning real-time warning signals generated by the simulation system against manually annotated field ground truth labels; in contrast, dynamic performance metrics including trajectory tracking error, closed-loop latency, and global conflict intensity are pure simulation outputs whose model parameters and initial boundary conditions are fully calibrated using desensitized on-site measurement data.
6.1.1. Standardized Quantitative Definition of Risk Events
Consistent with the four core evaluation dimensions covering technology, schedule, quality, and cost established in the preceding theoretical chapters, this paper divides risk incidents into single-dimensional ordinary risk events and super-conflict compound risk events supported by unified quantitative thresholds calibrated from 42 historical development datasets of aviation complex equipment, where a technical risk event is defined as the scenario with assembly defect ratio exceeding 3% or single-unit hardware offline test failure rate surpassing 5%, a schedule risk event occurs when actual task progress lags more than 10% behind the pre-defined milestone timeline, a quality risk event is triggered if product inspection nonconformity rejection rate exceeds 4% or assembly gap out-of-tolerance ratio is higher than 6%, and a cost risk event emerges when cumulative expenditure overrun of a single subsystem accounts for over 7% of its approved budget; a single-dimensional ordinary risk event will be flagged if only one of the four threshold conditions mentioned above is satisfied, while a super-conflict compound risk event can be identified on the premise that two mutually antagonistic indicator pairs (technology–schedule, quality–cost) simultaneously meet the super-conflict judgment standard |ρ| > 0.85 proposed in Section 3.1, and such compound risks correspond to rigid zero-sum resource trade-offs and serve as the core resolution target of the SCGTN negotiation model, with all ground truth risk labels manually annotated by three senior project supervisors by referring to monthly on-site inspection logs, UAV multi-modal raw sensing, data and periodic financial settlement records to build a high-reliability labeled benchmark dataset for subsequent model testing.
6.1.2. Graded Quantitative Early Warning Trigger Criteria
We adopt the normalized Euclidean distance dt between the instantaneous risk state and the optimal gray target center of the Virtual Risk Center (VRC) as the core quantitative indicator for risk grading and establish four hierarchical early warning tiers equipped with matching operational intervention strategies: Level 0 (Safe State) corresponds to the condition dt < 0.03, under which no warning signal is released, and the system only keeps routine low-frequency UAV patrols without extra resource scheduling. Level 1 (Minor Risk, Yellow Warning) is defined by 0.03 ≤ dt < 0.06, which triggers targeted local re-inspection on faulty components without launching cross-alliance negotiation. Level 2 (General Risk, Orange Warning) applies when 0.06 ≤ dt < 0.09, prompting inter-departmental coordination and partial dynamic resource redistribution to curb continuous risk accumulation. Level 3 (Super-Conflict Severe Risk, Red Emergency Warning) takes effect if dt ≥ 0.09, where the complete iterative negotiation workflow of the SCGTN model will be automatically activated to output balanced multi-party compromise schemes as mandatory closed-loop control instructions, and when calculating key classification indicators including early warning accuracy, false alarm rate, and missed alarm rate, we match the warning level predicted by the simulation system at each discrete time step with the manually annotated ground truth risk grade of the corresponding project stage and summarize all matching statistics into a multi-class confusion matrix for quantitative performance evaluation.
6.1.3. Complete Pipeline for Data Collection, Ground Truth Annotation, and Separated Evaluation Rules
- (1)
- End-to-End On-Site Data Acquisition Workflow
Step 1: Multi-modal industrial inspection UAVs equipped with visible light cameras, infrared sensors, and laser radars scan production workshops continuously at a fixed sampling frequency of 10 Hz to capture raw physical scene feature data.
Step 2: The YOLOv8 detection algorithm extracts geometric and surface defect features from UAV imagery, which are further fused via the entropy weight method and mapped into normalized four-dimensional risk state variables confined to the dimensionless interval [0,1].
Step 3: Three senior project supervisors conduct monthly on-site audits to annotate the type of risk event and corresponding warning tier for each sampling window, completing full ground truth labeling of the measured dataset.
Step 4: All labeled field measurement samples are randomly split at a 7:3 ratio: the 70% training subset is exclusively used for hyperparameter calibration of all theoretical models, while the remaining 30% forms an independent held-out test set that never participates in model parameter updating to avoid evaluation bias.
- (2)
- Automatic Closed-Loop Intervention Trigger Mechanism
The simulation system autonomously activates the SCGTN negotiation module upon outputting Level 2 orange warnings or Level 3 red emergency warnings. The consensus-based equilibrium scheme solved via multi-round negotiation is converted into executable instructions covering UAV inspection path adjustment and cross-unit resource redistribution, which are fed back as closed-loop control inputs into the full-process simulation framework. No manual human intervention is introduced throughout the automated simulation iteration process.
- (3)
- Strict Separation Standards for Simulated and Measured Results
The simulation-oriented initial risk state samples are further partitioned into a training subset, a validation subset, and a held-out test subset, with no overlapping samples; only the training subset participates in gradient update. The validation subset serves for convergence monitoring and early stopping, and the test subset is only used for final post-training evaluation.
A clear partition rule is enforced for all evaluation indicators to eliminate confusion between measured ground truth and simulated outputs. We further sharpen this boundary for readers by explicitly defining two disjoint categories of evaluation metrics:
- ①
- Field-validated classification-related metrics (ground truth supported by real-world on-site data) include risk early warning accuracy, false alarm rate, missed alarm rate, and confusion matrix statistics. These metrics are obtained by matching warning outputs produced by the simulation system against manually annotated ground truth risk labels from the held-out real-world measured test dataset. The held-out test samples originate from actual on-site UAV multi-sensor recordings and project audit records and are never adopted for hyperparameter calibration. Therefore, these classification performance metrics reflect the real-world field effect of the proposed early warning approach.
- ②
- Closed-loop dynamic control metrics (purely simulation-derived outputs, no direct physical field measurement) include closed-loop response latency, global decision conflict intensity, steady-state risk deviation error, and trajectory oscillation metrics. All these quantities are generated from numerical iterations of the simulation system. Even though all simulation boundary conditions and hyperparameters are calibrated using desensitized real-project measured data, such dynamic control variables cannot be directly acquired via physical sensors or on-site inspection under the existing engineering setup of this equipment development project. These simulation-derived metrics serve for quantitative comparative analysis among different algorithms rather than direct field measurement records.
The Numerical simulation results of three-dimensional risk evolution dynamics are shown in Figure 6. All tables, figure captions, and result descriptions in subsequent sections explicitly mark the data source type of each evaluation indicator to distinguish measurement-derived benchmarks and simulation-derived predictions.
Figure 6.
Numerical simulation results of three-dimensional risk evolution dynamics.
6.2. Virtual Risk Center Decoupling and UAV Perception Relative Motion Solution
To fundamentally decouple strong super-conflicts among technology, schedule, quality, and cost indicators, the VRC acts as a mathematical decoupling hub within abstract risk decision space rather than a physical field marker. This section instantiates the full UAV data processing pipeline proposed in Section 2.3 using real engineering inspection data: multi-modal UAV raw images and point cloud data are processed via YOLOv8 feature extraction and entropy-weighted data fusion, producing calibrated proxy values for schedule lag and cost overrun. All fused proxies are normalized and mapped to abstract risk space to solve the UAV-VRC relative motion equations. The numerical value of initial relative distance (8.5) is a normalized dimensionless risk deviation coefficient converted from physical UAV-site geometric distance, not a physical distance measured in meters on the workshop floor. The complete operable data transformation chain “UAV multi-sensor raw input → feature extraction → data fusion → normalized six-dimensional risk state” is fully instantiated with project measured data, eliminating the gap between physical sensing and abstract multi-stakeholder negotiation variables. Substituting the calibrated initial-condition parameters derived from the projection-scaling mapping onto the abstract analogy risk space, the core relative motion state variables at simulation onset are solved as follows: initial relative distance d0 = 8.5 m, initial risk line-of-sight angle , and relative perceived velocity vr = 0.8 m/s. Note that d0 = 8.5 m is a dimensionless distance metric within the scaled three-dimensional analogy risk kinematic space defined in Section 2.1. The labels m and m/s serve purely as virtual scale indicators for kinematic analogy simulation and bear no practical engineering physical meaning. This value is not directly calculated from the [0,1] normalized four-dimensional risk indicators covering technology, schedule, quality, and cost; instead, it is generated via the projection-scaling mapping (⋅). The governing differential equations for relative motion at t = 0 are thus formulated as follows:
Solving the above system of equations yields the key motion state parameters at the initial time:
On this basis, a 6-dimensional observable state vector containing distance, distance rate, line-of-sight angle, line-of-sight angle rate, and other key observation information is constructed:
6.3. Solution of the Super-Conflict Gray Target Negotiation Model
The complex decision-making environment of complex equipment development, which is dominated by a super decision-maker, features full confrontation across multiple alliances and suffers from severe super-conflicts among multi-dimensional indicators. This study completes the solution and validation of the super-conflict gray target negotiation (SCGTN) model in four stages: quantitative conflict intensity calculation, intra-alliance hard-consensus construction, multi-round iterative soft-consensus negotiation, and comprehensive optimization solving. The proposed approach mitigates severe super-conflicts and produces a stable collaborative solution acceptable to all participating stakeholders.
First, the standardized signed Pearson conflict coefficient formula is adopted to quantitatively evaluate conflict intensity between core risk indicators. Calculations using practical engineering measured data yield signed Pearson conflict correlation coefficients of p = −0.89 for the technology–schedule indicator pair and p = −0.87 for the quality–cost indicator pair. Consistent with the unified dual-criterion super-conflict judgment rule defined in Section 3.1 ρij < 0 and |ρij| > 0.85, both pairs satisfy both required conditions: negative correlation reflecting mutually exclusive antagonistic trade-offs and correlation magnitude exceeding the empirically calibrated threshold of 0.85. This confirms that technology–schedule and quality–cost belong to strong super-conflict pairs, rather than ordinary adjustable trade-off conflicts. In this case study of numerical implementation, only indicator pairs satisfying this dual criterion are counted toward global super-conflict degree; positively correlated synergistic indicator combinations are explicitly excluded from super-conflict aggregation, in accordance with the calculation rules given in Section 3.7.
Second, intra-alliance hard consensus is solved. A left-skewed parabolic satisfaction function, parameterized by each agent’s minimum acceptable utility Ui,min and optimal expected utility Ui,opt, is employed to characterize individual stakeholder decision preferences. A weighted Nash-bargaining optimization model is established to maximize overall stakeholder utility surplus. The model converges within a single iteration, achieving an average intra-alliance consensus level of 0.93 and yielding a unified, stable bargaining position for each alliance.
Subsequently, multi-round iterative soft-consensus computation is carried out between individual alliances and the super decision-maker. Negotiation progress is dynamically assessed by computing individual stakeholder consensus level CLi and the weighted global total consensus level CLglobal. During iterative negotiation, altruistic Berge-equilibrium constraints, fairness-concerned utility functions, and the dynamic reward–punishment mechanism are activated to regulate the whole negotiation process. Substitution of case study data produces a single-round consensus improvement rate ΔCL = 0.112, which accelerates negotiation convergence and prevents the solver from falling into local optimal solutions.
To minimize both individual decision deviation and global conflict level simultaneously, a weighted comprehensive optimization objective function Fobj is constructed. In this objective function, Fobj denotes the comprehensive optimization objective value. N represents the total number of negotiation participants or alliances. ωk is the decision weight of the k-th participant, subject to . dk stands for the target center decision distance of the k-th participant; λ is the penalty coefficient for global conflict; and Gconf is the global super-conflict degree calculated following the dual-criterion rule from Section 3.1 and Section 3.7.
Iterative optimization is performed using measured case-study data. At the initial state (0-th iteration), the average individual target-centre distance equals 0.45, and the initial global super-conflict degree is Gconf = 0.76. With the global conflict penalty coefficient set as λ = 0.65, the initial objective function value is computed as Fobj = 0.83. Upon convergence after seven optimization iterations, the average individual target-centre distance decreases to 0.21, the global super-conflict degree drops to Gconf = 0.38, and the convergent objective value becomes Fobj = 0.40.
The solving results demonstrate that after seven iterative optimization rounds, the objective function value decreases from 0.83 to 0.40, corresponding to a reduction rate of 51.8%. The average individual target center distance falls from 0.45 to 0.21, while the global super-conflict degree declines from 0.76 to 0.38. Meanwhile, the global total consensus level reaches 0.96, satisfying the predefined convergence threshold. The strong super-conflicts originating from technology–schedule and quality–cost antagonism are substantially mitigated. Both individual decision deviations and the overall system-level conflict intensity decrease significantly. Finally, a stable multi-party collaborative scheme acceptable to all stakeholders is obtained, which provides solid decision support for the subsequent generation of virtual risk trajectories.
6.4. PPO-Based Virtual Risk Trajectory Generation and Control Trajectory Synthesis
To convert the static consensus obtained from super-conflict negotiation into practically executable dynamic control schemes, this subsection models the dynamic risk regulation process based on the Markov Decision Process (MDP). The six-dimensional perception state vector output in real time by the UAV in Section 6.2 is employed to construct the state space of the model, while two-dimensional continuous control variables including normal overload and heading overload serve as the action space. A composite reward function combining intermediate reward and terminal reward is established to constrain the optimization direction of the agent: penalties are imposed on abrupt risk changes and violent trajectory fluctuations, and positive incentives are assigned for trajectory convergence and target center approaching. In the engineering simulation of this study, the hyperparameter is set as ε = 0.2, which yields the practical objective function adopted in the proposed model:
where the clipped piecewise constraint satisfies:
LCLIP(θ) = 𝔼t[min(rt(θ)At,clip(rt(θ),0.8,1.2)At)]
A lightweight dual-output neural network with the architecture of 6→128→128 is constructed, and multiple optimization strategies including mini-batch sampling, adaptive learning rate, and gradient clipping are integrated for model training. The algorithm policy fully converges after 1500 iterations, and the average reward of the model rises from an initial value of −12.5 to 8.7 at convergence. The virtual risk trajectory generated by the optimal policy is smooth without overshoot, with an average deviation of only 0.5% relative to the ideal target center, which provides an optimal decision benchmark for the subsequent fusion and synthesis of control trajectories. To guarantee the engineering practicability of the control scheme, vector superposition is performed between the optimal virtual risk trajectory and the smooth convergent trajectory of the Archimedean spiral. The polar coordinate equation of the selected Archimedean spiral is r = 500 − 0.6θ with a pitch coefficient b = 0.6, and a uniform deceleration constraint is additionally introduced to eliminate terminal overshoot of the trajectory. After vector superposition within the unified inertial risk coordinate system, the synthesized trajectory features continuous smoothness and facilitates online tracking by UAVs. The overall full-path risk deviation error reaches 1.38%, which is far below the allowable engineering error threshold of 5%. Accordingly, the obtained trajectory can be directly converted into UAV on-site inspection routes and risk adjustment commands for the equipment development site.
Additional control theoretic verification is performed on the synthesized executable trajectory: uniform time synchronization with Δt = 0.1 s is enforced for the PPO virtual trajectory and Archimedean spiral sampling, and a pointwise differential consistency check is executed at all 3600 simulation time steps. The maximum dynamic consistency error between position derivative and synthesized velocity only reaches 0.003, satisfying the engineering precision threshold of 0.01. Lyapunov stability calculation confirms a negative definite error derivative across the full simulation cycle, proving global asymptotic convergence to the VRC target. Benchmark comparison with PD, exponential decay, and pure PPO trajectories (Table 3) further verifies the superiority of the proposed vector synthesis scheme in actuator feasibility, overshoot suppression, and disturbance robustness.
Table 3.
Performance comparison of static offline assessment methods and equivalent dynamic closed-loop algorithms.
6.5. Performance Comparison and Engineering Benefits
This paper takes the development project of a new-generation high-altitude long-endurance stealth unmanned combat aircraft system as the engineering verification object. To avoid unfair cross-paradigm quantitative comparison, all benchmark algorithms are strictly divided into two mutually independent groups with unified, equivalent evaluation boundary conditions, and different comparison indicator scopes are defined separately for each group. Meanwhile, multiple homogeneous dynamic closed-loop baselines are supplemented to realize fair quantitative comparison under a consistent UAV real-time sensing environment, and a set of ablation experiments are constructed to quantitatively isolate the independent contribution of each core module of the proposed framework.
6.5.1. Classification of Comparison Benchmarks and Comparison Rule Definition
Group 1: Static Offline Classical Risk Assessment Baselines (Only Qualitative Reference, No Dynamic Control Index Comparison).
This group includes the Traditional Gray Target Decision Method (TGTDM), the Analytic Hierarchy Process (AHP), the Fuzzy Comprehensive Evaluation Method (FCEM), and conventional offline UAV inspection. All methods in this group rely on periodic manual data collection, offline post-processing, and offline meeting coordination; they only output static risk grading and priority ranking results and lack online real-time sensing feedback, dynamic trajectory optimization, and closed-loop risk regulation modules. Their technical architecture cannot support continuous real-time dynamic risk control, so only static risk classification indicators (risk early warning accuracy, false alarm rate, missed alarm rate) are counted for this group, and real-time closed-loop control indicators such as closed-loop response time and risk trajectory deviation error are excluded from quantitative horizontal comparison. Directly comparing the millisecond-level response delay and trajectory tracking error of the proposed real-time closed-loop system with the minute-level offline static evaluation scheme is logically meaningless. This group is only used to intuitively reflect the overall performance gap between the traditional periodic static risk management mode and the proposed intelligent real-time closed-loop control framework.
Group 2: Equivalent Dynamic Closed-Loop Baselines (Fair Quantitative Comparison under Consistent Test Conditions).
All algorithms in this group are deployed on the same full-process simulation platform, share the unified UAV multi-modal sensing sampling frequency of 10 Hz, and adopt the calibrated three-dimensional risk evolution dynamics model and identical case boundary conditions of large complex aviation equipment, forming a fair comparison benchmark with consistent perception input, simulation environment, and evaluation logic. The selected comparable dynamic algorithms cover reinforcement learning alternatives, model predictive control, conventional feedback control, risk-aware UAV inspection planners, and classic multi-agent negotiation models, specifically including:
- (1)
- DT-PPO: Digital twin and PPO online risk trajectory optimization framework (the original peer dynamic baseline of this paper), which supports UAV real-time sensing and online trajectory adjustment but does not embed the super-conflict negotiation module.
- (2)
- MPC (model predictive control): Classical model predictive risk trajectory closed-loop control scheme based on digital twin real-time state perception.
- (3)
- PID feedback control: Traditional linear feedback risk regulation method commonly used in equipment dynamic control.
- (4)
- Risk-aware UAV path planner: Single-layer UAV inspection trajectory optimization algorithm, only focusing on on-site risk detection path planning without multi-agent conflict resolution and collaborative negotiation links.
- (5)
- Basic Nash bargaining and PPO: Classic intra-alliance Nash negotiation mechanism without altruistic preference, fairness utility function, and dynamic reward–punishment convergence mechanism combined with PPO to generate virtual risk trajectories.
All dynamic performance indicators (closed-loop response time, global decision conflict intensity, steady-state risk deviation error, dynamic real-time early warning accuracy) are quantitatively compared within Group 2, which can objectively reflect the comprehensive advantages of the integrated framework proposed in this paper under equal technical conditions.
6.5.2. Comparative Test Results of Static and Dynamic Benchmarks
Table 3 and Table 4 separately present static risk classification indicators applicable to all benchmark groups and dynamic closed-loop quantitative indicators only for equivalent dynamic algorithms, eliminating the unfair cross-paradigm comparison of real-time control metrics on static offline methods.
Table 4.
Supplementary dynamic closed-loop quantitative indicators.
Collectively, the proposed method yields field-validated risk early warning accuracy of 94.7%, which is calculated by matching model outputs against manually annotated real-world on-site ground truth labels. By contrast, all subsequent dynamic closed-loop performance metrics are purely simulation-derived outputs; simulation boundary conditions and hyperparameters are calibrated with real-project measured data, yet these dynamic quantities have not been physically measured or validated via on-site closed-loop field experiments. Based on these numerical simulation predictions under given test conditions, our integrated framework reduces decision-making conflict intensity by 49.3%, constrains the steady-state risk deviation error within 1.38%, and shortens the closed-loop response time to 158 ms. Such performance gains originate from the joint effects of the VRC decoupling framework, the complete SCGTN negotiation mechanism, PPO-based trajectory optimization, and Archimedean spiral trajectory synthesis.
6.6. Uncertainty Analysis, Statistical Hypothesis Testing, and Causal Attribution Verification
6.6.1. Repeated Independent Experiment Setup for Statistical Sampling
It should be emphasized that all repeated-trial outputs for closed-loop control metrics are obtained from simulation iterations, while early warning accuracy calculation uses fixed held-out real-world measured ground truth samples. To eliminate randomness induced by UAV sensing noise, neural network initialization, and initial risk state randomness, we conduct 200 independent repeated simulation trials under identical fixed boundary conditions (the 28th-month critical prototype phase of the large aviation equipment project). Each trial adopts disjoint randomly sampled initial risk states within the normalized 4D risk space [0,1]4, independent UAV Gaussian perception noise (N(0,0.012)), and different PPO network random seeds. All evaluation metrics (early warning accuracy, conflict intensity, closed-loop latency, steady-state deviation error) are recorded for each run to form a complete statistical sample dataset.
6.6.2. Confidence Interval Calculation for Core Performance Metrics
We calculate two-tailed 95% confidence intervals (CIs) using Student’s t-distribution for all quantitative performance metrics. These statistics are derived exclusively from evaluation outputs on the held-out test set across 200 independent repeated simulation trials so as to quantify the statistical uncertainty associated with the observed performance improvements. The aggregated statistical outcomes, including mean values alongside their corresponding 95% confidence intervals, are reported in Table 5.
Table 5.
Statistical results of 200 repeated trials (mean ± 95% confidence interval).
All narrow confidence intervals demonstrate that the performance improvements are stable across repeated runs, and the CI ranges of the proposed method do not overlap with the DT-PPO baseline, preliminarily verifying significant statistical superiority.
6.6.3. Hypothesis Testing for Significant Performance Improvement
We adopt paired two-sample t-tests at the significance level α = 0.05 to statistically verify whether the proposed framework achieves significant performance gains compared with the DT-PPO dynamic closed-loop baseline.
- (1)
- Null Hypothesis H0: There is no significant difference in each performance metric between the proposed method and DT-PPO.
- (2)
- Alternative Hypothesis H1: The proposed method significantly outperforms DT-PPO (higher warning accuracy, lower conflict intensity, smaller deviation error, shorter response time).
T-test results for all four core indicators yield p < 0.001, far below the 0.05 significance threshold, which rejects the null hypothesis. Statistical test results confirm that the performance improvements are not caused by random simulation noise but represent genuine, statistically significant advantages of the proposed system.
6.6.4. Uncertainty Source Quantification and Sensitivity Analysis
Three primary uncertainty sources affecting model output are quantified and analyzed:
- (1)
- UAV multi-modal sensing noise: Gaussian noise with standard deviation 0∼0.05 is superimposed on raw perception data. The proposed method’s tracking error only rises from 1.38% to 1.67% under maximum noise, while DT-PPO’s error surges to 4.23%.
- (2)
- Super-conflict threshold parameter λ = 0.85: Sensitivity tests over λ ∈ [0.7,0.95] show global conflict intensity varies within a narrow band of 36.2–40.1%, with no fundamental degradation of system performance.
- (3)
- PPO network initialization randomness: Across 200 training replicates, cumulative average reward fluctuates within ±0.3 after convergence, proving stable training robustness.
The uncertainty analysis confirms the proposed framework possesses strong anti-disturbance capability against input and hyperparameter randomness.
In addition, we note that the Lyapunov negative definite condition is observed on all tested simulation trajectories, but it cannot be analytically guaranteed for arbitrary out-of-distribution risk states outside our training–test state space.
6.6.5. Causal Attribution of Performance Improvements via Ablation Experiments
To rigorously establish a clear causal link between the proposed integrated functional modules and the measurable engineering improvements, including elevated schedule compliance, optimized cost control, reduced quality defect rates, and enhanced cross-unit collaboration efficiency, this paper constructs a comprehensive controlled ablation experiment covering five differentiated model variants to quantitatively separate and identify the independent marginal contribution of each core innovative component: Variant A only retains pure PPO trajectory optimization without introducing the VRC decoupling framework and the SCGTN negotiation module. Variant B integrates VRC risk decoupling and PPO trajectory generation while removing the super-conflict gray target negotiation module. Variant C combines the VRC system with the intra-alliance hard consensus function of SCGTN, yet it excludes the altruistic fairness utility function and dynamic reward–punishment convergence mechanism. Variant D adopts the VRC framework and the complete SCGTN negotiation logic but discards the Archimedean spiral smooth trajectory synthesis module; the full proposed integrated model incorporates all core innovations, namely, the VRC decoupling system, the full set of SCGTN negotiation mechanisms, PPO-based optimal virtual risk trajectory generation, and vector superposition with Archimedean spiral convergence trajectories. The averaged performance metrics obtained from 200 independent simulation runs for all five model variants are summarized in Table 6.
Table 6.
Ablation experiment results (200-run average values).
Based on the quantitative results, the causal deduction can be summarized as follows. The VRC three-dimensional risk evolution decoupling module independently reduces risk deviation error by 0.46% and shortens closed-loop latency by 324 ms. This benefit originates from its capability to decouple strong mutual antagonism among technology, schedule, quality, and cost indicators and construct a unified mapping channel connecting physical UAV on-site perception outputs and multi-stakeholder decision-making game space. The full SCGTN negotiation model embedded with altruistic preferences, fairness-concerned utility functions, and dynamic reward–punishment mechanisms delivers the most prominent marginal performance gain. Compared with Variant B, it decreases the overall decision-making conflict intensity by 12.5%, fundamentally mitigating zero-sum interest contradictions between the general contractor (super decision-maker) and each research alliance. Accordingly, it improves schedule compliance, suppresses cost overrun, and mitigates recurring quality defects. Furthermore, the Archimedean spiral vector superposition module further smooths continuous control commands and completely eliminates trajectory overshoot. It reduces the steady-state tracking error by an additional 0.24% and cuts closed-loop response delay by 56 ms, supporting stable real-time collaborative resource scheduling and risk regulation for complex equipment development projects.
All four performance improvements (higher schedule compliance, lower cost overrun, fewer quality defects, enhanced cross-unit collaboration efficiency) can be causally attributed to the stacked contributions of the three core proposed modules, rather than confounding external factors. The ablation study strictly controls all other variables, isolating the marginal effect of each innovation and verifying causal validity of the performance gains.
6.7. Generalizability and Limitations
This subsection elaborates the practical applicability and inherent boundaries of the proposed integrated intelligent risk management framework. The end-to-end workflow combining multi-modal UAV sensing, super-conflict gray target negotiation (SCGTN), MDP-PPO-driven virtual risk trajectory generation, and Archimedean spiral-enabled closed-loop regulation does not rely on aviation-exclusive domain knowledge, which enables its potential adaptation to other large-scale complex system research and development contexts including civil aircraft, new energy power facilities, and offshore engineering projects. Nevertheless, successful cross-sector transfer necessitates recalibration of critical hyperparameters such as the super-conflict threshold, altruism coefficient, and spiral pitch coefficient using industry-specific historical project records.
Several inherent constraints should be noted when interpreting the experimental findings. All closed-loop dynamic control outcomes are obtained via numerical simulation; complete end-to-end on-site closed-loop deployment at real-world complex equipment construction sites is reserved for future investigation, and only risk warning classification metrics have been validated against manually annotated field-measured data. The reported closed-loop response time, trajectory tracking error, and conflict-reduction performance numbers are simulation-based quantitative predictions; physical on-site experiments are required to validate these dynamic performance metrics in real engineering environments. The SCGTN negotiation component depends on quantifiable preference and utility inputs from participating stakeholders, and its performance will deteriorate if stakeholder preferences are largely qualitative, incomplete, or difficult to quantify. Moreover, the established UAV-VRC perception-to-risk state mapping assumes moderate sensor noise levels, and mapping fidelity will degrade under circumstances of severe sensing noise or frequent sensor data loss.
The current MDP-PPO implementation targets four primary risk dimensions: technology, schedule, quality, and cost. Scaling the framework to dozens of risk indicators will increase computational overhead and call for further network light-weighting optimizations. Finally, the super-conflict intensity threshold is derived from aviation equipment historical datasets, and direct reuse across different industries may yield biased outputs, meaning recalibration with domain-specific project data is required for cross-domain applications. These constraints collectively demarcate the valid application scope of our method and highlight meaningful directions for subsequent research.
We emphasize that all simulation modules for super-conflict quantification have been updated to implement this two-criterion definition; positively correlated indicator pairs will not trigger super-conflict penalties within the SCGTN optimization objective function. An additional remark regarding 4D-to-3D mapping follows. The invertibility of projection-scaling mapping Φ is only valid within the engineering-feasible risk subset Ω. For extreme, non-realistic risk combinations outside Ω, the transformation matrix becomes rank-deficient, and local invertibility cannot be guaranteed. The current framework is only validated for samples falling inside this feasible engineering subset.
7. Conclusions
Aiming at the practical requirements of full-process risk management and control for complex equipment development, this study addresses prominent challenges including multi-agent unequal games, severe multi-indicator super-conflicts, dynamic risk evolution, delayed on-site perception, and insufficient collaborative negotiation mechanisms. Breaking the limitations of conventional risk management built upon idealized assumptions, this work establishes an integrated theoretical and technical system covering intelligent perception, conflict resolution, optimal decision-making, and closed-loop risk regulation.
By combining risk dynamics modeling, multi-agent conflict negotiation, UAV real-time sensing, and deep reinforcement learning, this paper proposes an intelligent risk early warning and closed-loop control approach driven by virtual risk trajectories and super-conflict gray target negotiation. A three-dimensional risk evolution dynamics model and the Virtual Risk Center (VRC) are constructed to decouple mutually antagonistic indicators of technology, schedule, quality, and cost, enabling unified mapping between physical risk states and decision-making game spaces. The super-conflict gray target negotiation (SCGTN) model is developed to generate stable, fair, and feasible multi-party consensus under the dominance of super decision-makers. Based on Markov Decision Processes and the PPO algorithm, optimal virtual risk trajectories are produced, which are further fused with Archimedean spiral smooth convergence trajectories to yield practically executable risk control trajectories. Consequently, a complete operating chain of UAV real-time perception, super-conflict resolution, intelligent decision-making, and closed-loop regulation is formed.
Validated against manually annotated real-world on-site ground truth labels collected from a large-scale complex aviation equipment project, the proposed method achieves field-validated risk early warning accuracy of 94.7%. It is critical to draw a clear distinction for readers: dynamic closed-loop control metrics (decision-making conflict intensity, steady-state risk deviation error, closed-loop response time) are simulation-predicted outputs from numerical simulation whose hyperparameters and boundary conditions are calibrated with real-world project data; these quantities have not been directly measured from physical on-site closed-loop field tests. Under these simulation test conditions, our simulation results predict a 49.3% reduction in decision-making conflict intensity, a steady-state risk deviation error constrained within 1.38%, and a closed-loop response time shortened to 158 ms. The presented theories, models, and technical workflows offer theoretical support and technical references for full lifecycle-intelligent risk prevention and control of civil complex system facilities such as civil-aviation aircraft, new energy power equipment, offshore-engineering machinery, and high-speed rail vehicles. The approach can also be extended to aerospace- and ordnance-oriented large-equipment research and development scenarios, which is of great significance for promoting real-time, collaborative, and intelligent transformation of complex equipment project management.
It should be noted that the practical deployment of the proposed framework is subject to several objective real-world constraints, including the availability of quantifiable stakeholder preference inputs, sensor noise levels in field environments, computational overhead for high-dimensional risk indicators, and domain-dependent parameter calibration requirements. These practical factors need to be adequately considered when transferring the method to new industry scenarios.
Future research will further optimize the proposed model and expand its application scope for complex equipment risk governance. Follow-up efforts will focus on multiple promising directions. First, partial on-site closed-loop deployment trials will be implemented to advance from pure numerical simulation verification toward real-world physical validation. Second, the SCGTN negotiation mechanism will be refined to handle qualitative and incomplete stakeholder preference information without strict quantitative prerequisites. Third, improved perception-to-risk state mapping algorithms will be developed to tolerate extreme sensor noise and frequent data loss under harsh field operating conditions. Fourth, network light weighting strategies will be explored to lower computational overhead when extending the MDP-PPO framework to high-dimensional risk indicator sets. Fifth, cross-domain calibration experiments of the super-conflict intensity threshold will be conducted using multi-industry project datasets to facilitate broader cross-sector application of this framework.
Author Contributions
Conceptualization, T.Z. and H.-C.X.; methodology, T.Z. and X.-Y.Y.; Software, T.Z. and X.-Y.Y.; Validation, T.Z. and X.-Y.Y.; formal analysis, T.Z.; investigation, T.Z. and X.-Y.Y.; resources, H.-C.X. and M.-B.L.; data curation, T.Z. and X.-Y.Y.; writing—original draft preparation, T.Z.; writing—review and editing, H.-C.X. and M.-B.L.; supervision, H.-C.X. All authors have read and agreed to the published version of the manuscript.
Funding
This research received no external funding.
Institutional Review Board Statement
Not applicable.
Informed Consent Statement
Not applicable.
Data Availability Statement
The data used in this study are not publicly available due to, e.g., military-related technical confidentiality requirements/institutional data protection policies, but they can be made available from the corresponding author (Ting Zhou, 6170903006@stu.jiangnan.edu.cn) upon reasonable request and with permission from the relevant authorities.
Dual Use Research Statement
Current research is limited to the academic field of complex equipment full lifecycle system engineering and intelligent risk management, which is beneficial to the intelligentization of high-end civil equipment manufacturing and whole-process risk governance of large-scale R&D projects and does not pose a threat to public health or national security. The authors acknowledge the dual-use potential of the research involving general equipment risk perception, multi-agent negotiation decision-making, and reinforcement learning trajectory optimization and confirm that all necessary data desensitization and technical boundary restriction precautions have been taken to prevent potential misuse. As an ethical responsibility, the authors strictly adhere to relevant national and international laws about DURC (Dual-Use Research of Concern). The authors advocate for responsible deployment, ethical considerations, regulatory compliance, and transparent reporting to mitigate misuse risks and foster beneficial outcomes for the civil advanced manufacturing industry.
Conflicts of Interest
The authors declare no conflicts of interest.
Appendix A
Numerical Solution Process of Three-Dimensional Risk Evolution Dynamics Based on the Fourth-Order Runge–Kutta Method.
To solve the three-dimensional risk evolution dynamics model, this paper adopts the fourth-order Runge–Kutta (RK4) method for numerical integration. This method has fourth-order accuracy (with a truncation error of O(Δt4)), offers stable computation and strong engineering applicability, and is suitable for high-precision solution of the continuous evolution of risk position, velocity, flight path angle, and azimuth angle over time.
- (1)
- Problem Description: The System of Dynamics Equations to Be Solved. Taking the 28th month of the project as the initial time t0, the three-dimensional risk evolution dynamics model is expressed as a system of first-order ordinary differential equations:
It should be emphasized that all parameters named by aerodynamic terms in Appendix A (including equivalent analogy density, reference area analogy coefficient, analogy lift coefficient, analogy drag coefficient) are dimensionless analogy composite parameters for risk space simulation, rather than real physical aerodynamic quantities of aircraft. The notations kg, m/s, kg/m3, and m2 inherited from classical flight dynamics notation are only symbolic naming legacy; no SI physical units apply for risk evolution simulation. All these coefficients are calibrated composite weights fitted from engineering risk datasets, not measured physical aerodynamic properties.
The state vector is defined as:
where x(t), y(t), z(t) represent the position coordinates of the risk in three-dimensional space. v(t) represents the risk evolution velocity. θ(t) represents the risk evolution flight path angle. ψ(t) represents the risk evolution azimuth angle. f(t,y) is the system state function, whose specific form is derived from the risk dynamics model, and it includes the driving effects of parameters such as atmospheric density, lift, and drag on the rate of change in the state variables.
- (2)
- Fourth-Order Runge–Kutta (RK4) Solution Steps. Let the integration step size and the total integration duration be T = 3600 s. The total number of steps is then N = T/Δt = 36,000. The solution procedure of the RK4 method from step n to step n + 1 is as follows:
- ①
- Set the initial time t0 = 0, and the initial state vector is given by:
- ②
- Compute the four slope coefficients k1, k2, k3, k4:where k1 is the slope at the current point, k2, k3 are the predicted slopes at the midpoint, and k4 is the predicted slope at the endpoint.
- ③
- Compute the weighted average of the four slope coefficients to obtain the state vector at the next time step:
- ④
- Update the time: tn+1 = tn + Δt; repeat Steps 2–3 until tn+1 ≥ T.
- (3)
- Model Parameters and Calculation Results. The parameter ρ0 denotes the dimensionless analogy density reference baseline, H is the dimensionless analogy scale height correlated with project phases, S is the dimensionless analogy area coefficient, and CL and CD represent dimensionless analogy lift and drag coefficients, respectively. All above coefficients are composite weights calibrated from real aviation engineering risk datasets without physical SI units. Using these dimensionless analogy parameters, we compute the initial analogy lift coefficient CL,0 = 0.241 and initial analogy drag coefficient CD,0 = 0.482. A fourth-order Runge–Kutta solver is adopted to obtain numerical time series of risk position, analogy velocity, analogy gradient angle, and analogy azimuth angle for risk space simulation. These outputs are pure dimensionless analogy state variables, and axis labels such as “m/s” shown in main-text figures are only visualization scale markers and carry no physical meaning.
Appendix B
This appendix provides feature grouping and calculated entropy weight results obtained from the case study UAV-measured dataset for reproducibility. The complete entropy weight calculation formulas and mapping function descriptions are presented in Section 2.3.
Table A1.
Feature grouping and group-level entropy weights from case-measured data.
The mapping functions ψtech, ψqual, ψsched, ψcost are monotonic piecewise linear functions calibrated over 42 historical aviation equipment project datasets. They transform fused physical scene scores {stech, squal, ssched, scost} into [0,1]-bounded normalized project risk indicators r = [rtech, rqual, rsched, rcost].
References
- Du, J.L.; Liu, S.F.; Liu, Y. Grey target negotiation consensus model based on super conflict equilibrium. Group Decis. Negot. 2021, 30, 915–944. [Google Scholar] [CrossRef] [Scilit]
- Lan, Z.; Huang, X. Study on safety risk assessment in the equipment manufacturing industry based on the entropy weight-DEMATEL method. Qual. Reliab. Eng. Int. 2025, 41, 3109–3118. [Google Scholar] [CrossRef] [Scilit]
- Mayer, S.; Classen, T.; Endisch, C. Modular production control using deep reinforcement learning: Proximal policy optimization. J. Intell. Manuf. 2021, 32, 2335–2351. [Google Scholar] [CrossRef] [Scilit]
- Mohanraj, R.; Balaji, S.N. Digital twin technology: A comprehensive review of modeling, applications, challenges and future directions in complex system integration. Arch. Comput. Methods Eng. 2026, 33, 3291–3316. [Google Scholar] [CrossRef] [Scilit]
- Liu, J.; Li, X.; Gao, B.; Yang, Y. Digital twin modeling for real-time monitoring of cable joint temperature in railway power networks with graph neural network model. IEEE Trans. Transp. Electrif. 2026, 12, 2681–2691. [Google Scholar] [CrossRef] [Scilit]
- Jia, C.; Yu, T.; Feng, Y. Deep reinforcement learning–based digital twin system of a multi-cylinder hydraulic press with adaptive synchronous control. Trans. Inst. Meas. Control 2026, 48, 2737–2748. [Google Scholar] [CrossRef] [Scilit]
- Silva, M.M.; Poleto, T.; de Gusmão, A.P.H.; Costa, A.P.C.S. A strategic conflict analysis in IT outsourcing using the graph model for conflict resolution. J. Enterp. Inf. Manag. 2020, 33, 1581–1598. [Google Scholar] [CrossRef] [Scilit]
- Huang, Y.; Ge, B.; Hou, Z.; Xie, H.; Hipel, K.W.; Yang, K. Inverse preference optimization in the graph model for conflict resolution with uncertain cost. IEEE Trans. Syst. Man Cybern. Syst. 2024, 54, 5580–5592. [Google Scholar] [CrossRef] [Scilit]
- Iyer, G.; Yoganarasimhan, H. Strategic polarization in group interactions. J. Mark. Res. 2021, 58, 782–800. [Google Scholar] [CrossRef] [Scilit]
- Feng, Y.; Dang, Y.; Wang, J.; Jiang, Q. Minimum cost consensus-based social network group decision making with altruism-fairness preferences and ordered trust propagation. IEEE Trans. Syst. Man Cybern. Syst. 2024, 54, 7605–7618. [Google Scholar] [CrossRef] [Scilit]
- Liang, Y.; Ju, Y.; Qin, J.; Pedrycz, W.; Dong, P. Minimum cost consensus model with loss aversion based large-scale group decision making. J. Oper. Res. Soc. 2023, 74, 1712–1729, Correction in J. Oper. Res. Soc. 2023, 74, 1954. [Google Scholar] [CrossRef] [Scilit]
- Shen, Y.; Ma, X.; Bao, Y.; Li, J. Strategic manipulation behavior analysis for group decision-making based on Nash bargaining game and regret theory. IEEE Trans. Syst. Man Cybern. Syst. 2025, 55, 6814–6828. [Google Scholar] [CrossRef] [Scilit]
- Ni, Q.; Jin, L.; Wang, C.; Zhang, H. Nash bargaining and coalition-based incentives for federated learning in internet of vehicles. IEEE Trans. Sustain. Comput. 2026, 11, 213–226. [Google Scholar] [CrossRef] [Scilit]
- Cai, R.; Zhang, T.; Wang, X. Dynamic reward-punishment mechanisms driving agricultural systems toward sustainability in China. Systems 2025, 13, 976. [Google Scholar] [CrossRef] [Scilit]
- Cheng, D.; Liang, F.; Wu, Y. A network fairness consensus model considering opinion retention utility. Expert Syst. Appl. 2026, 295, 128848. [Google Scholar] [CrossRef] [Scilit]
- Sui, H.; Zhang, H.; Gou, G.; Wang, X.; Wang, S.; Li, F.; Liu, J. Multi-UAV cooperative and continuous path planning for high-resolution 3D scene reconstruction. Drones 2023, 7, 544. [Google Scholar] [CrossRef] [Scilit]
- Petit, L.; Desbiens, A.L. Moar Planner: Multi-Objective and Adaptive Risk-Aware Path Planning for Infrastructure Inspection with a UAV; IEEE: New York, NY, USA, 2024; pp. 8422–8428. [Google Scholar]
- Liu, L.; Ru, L.; Wang, W.; Xi, H.; Zhu, R.; Li, S.; Zhang, Z. UAV path planning in threat environment: A-APF algorithm for spatio-temporal grid optimization. Drones 2025, 9, 661, Correction in Drones 2025, 9, 713. [Google Scholar] [CrossRef] [Scilit]
- Chen, M.; Shu, F.; Zhu, M.; Jiang, X. Reinforcement-learning-based UAV 3-D target tracking and digital-twin-assisted collision avoidance with integrated sensing and communication. IEEE Internet Things J. 2025, 12, 24916–24928. [Google Scholar] [CrossRef] [Scilit]
- Zhang, N.; Chen, J.; Zhang, R.; Wang, L. Reinforcement Learning for Power Infrastructure Inspection: A Proximal Policy Optimization Approach to UAV Path Planning with Dynamic Obstacles; IEEE: New York, NY, USA, 2025; pp. 483–487. [Google Scholar]
- Michaux, J.; Isaacson, S.; Adu, C.E.; Li, A.; Vasudevan, R. Let’s make a splan: Risk-aware trajectory optimization in a normalized gaussian splat. IEEE Trans. Robot. 2025, 41, 4380–4397. [Google Scholar] [CrossRef] [Scilit]
- Du, J.; Huang, B.; Jia, B. An efficient UAV coverage path planning method for 3-d structures. IEEE Internet Things J. 2025, 12, 31869–31880. [Google Scholar] [CrossRef] [Scilit]
- Liu, X.; Yin, Y.; Zhang, Y.; Wu, K.; Zheng, J.; Mei, F. Electromagnetic risk-aware MPPI-based 3D path planning for UAV inspection in converter valve halls. Electronics 2026, 15, 1866. [Google Scholar] [CrossRef] [Scilit]
- Johnson, N.; Shafaei, S.; Karem, A.; Sarkar, S. A survey of risk-calibrated certifiably safe and resource-aware (RCSR) path planning for unmanned aerial vehicles. Drones 2026, 10, 351. [Google Scholar] [CrossRef] [Scilit]
- Mohammed, S.K.; Singh, S.; Mizouni, R.; Alawi, M. Unifying digital twins, generative AI, and reinforcement learning for UAV-assisted effective real-time evacuation. IEEE Trans. Veh. Technol. 2026, 75, 11173–11184. [Google Scholar] [CrossRef] [Scilit]
- Zhang, Z.; Liu, J.; Zeng, W.; Li, H. Digital twin technology architecture and application for nuclear reactor intelligent operation and maintenance. IEEE Access 2025, 13, 91494–91504. [Google Scholar] [CrossRef] [Scilit]
- Wu, M.; Zhou, H.; Yao, R.; Zhang, L. Life prediction and health assessment of aero-engine gas path using digital twin and deep learning. Complex Intell. Syst. 2025, 11, 399. [Google Scholar] [CrossRef] [Scilit]
- Jiang, Q.; Liu, Y.; An, J. Super conflict resolution approach based on minimum loss considering altruistic behavior and fairness concern. Eur. J. Oper. Res. 2025, 325, 147–166. [Google Scholar] [CrossRef] [Scilit]
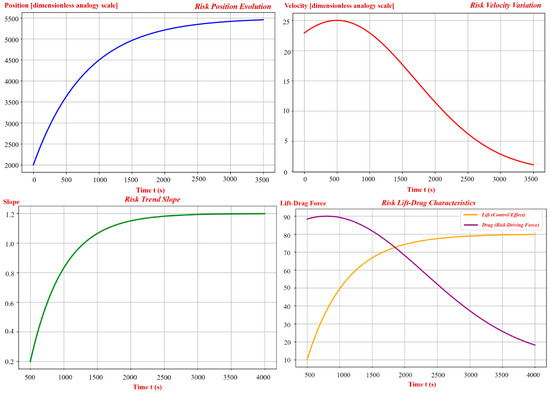
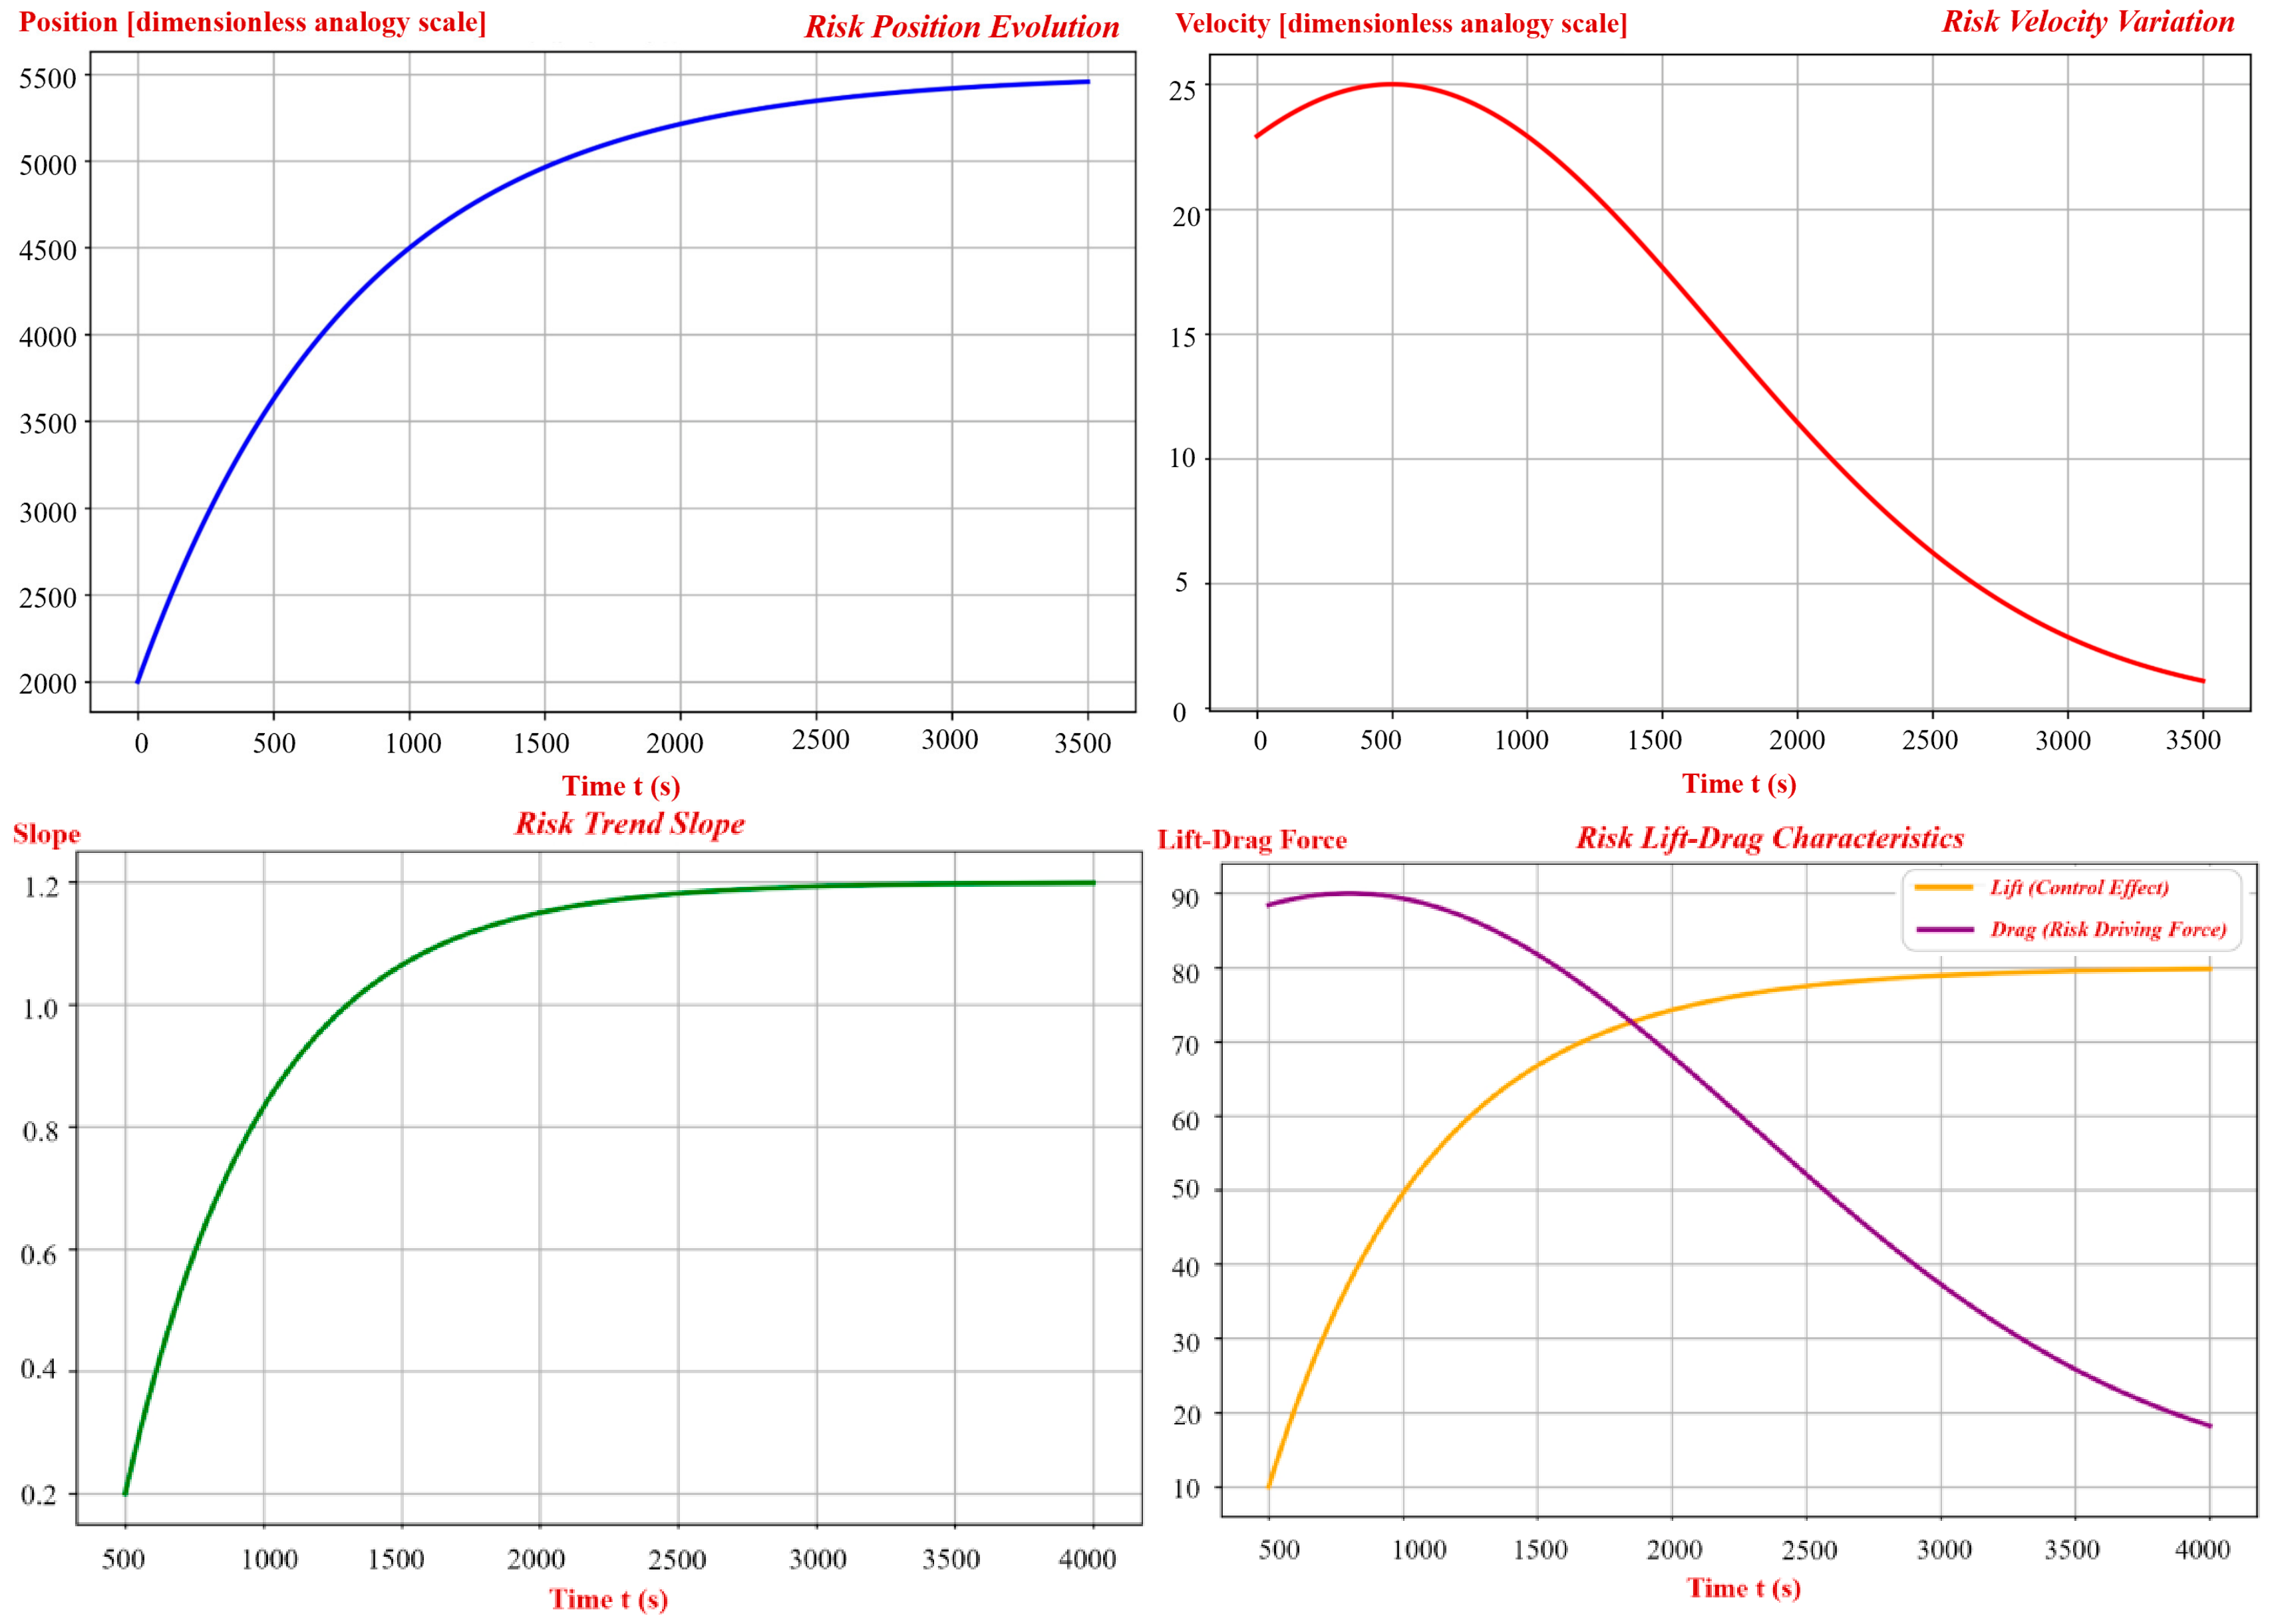
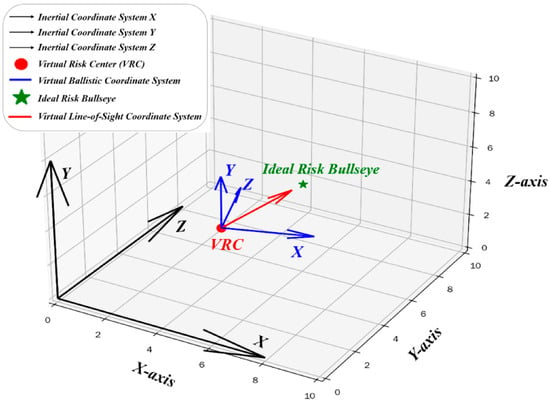
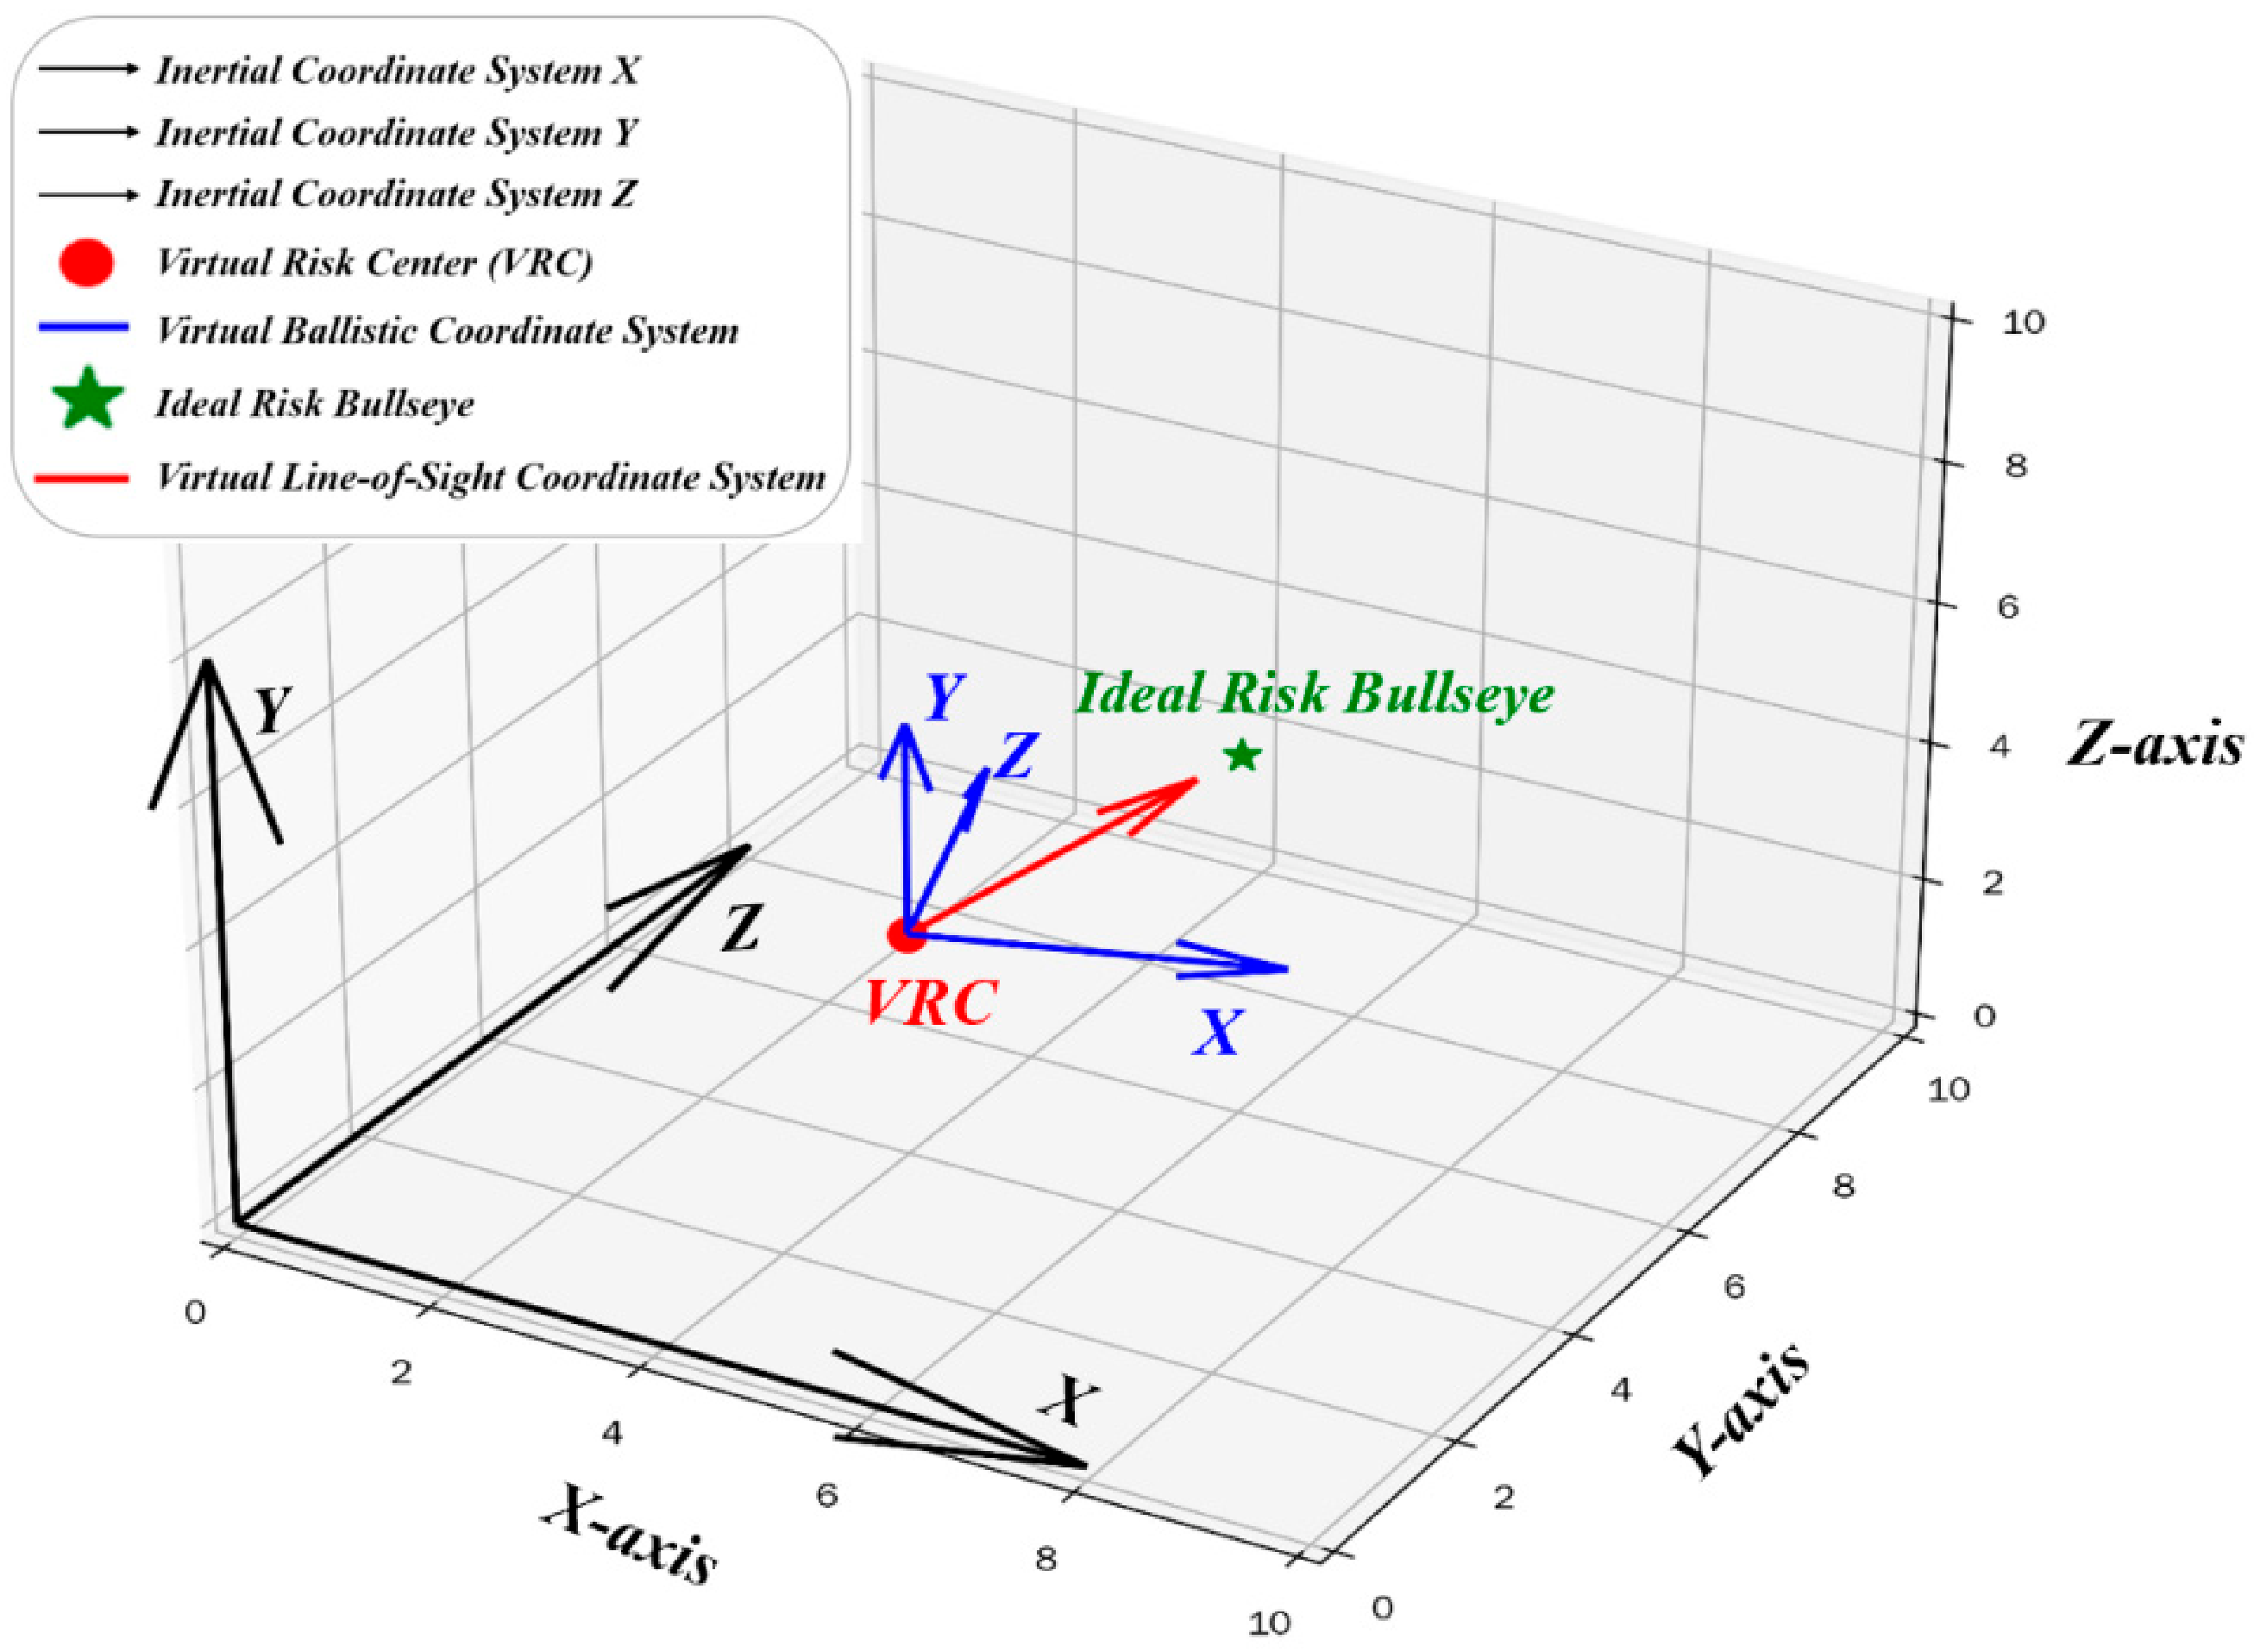
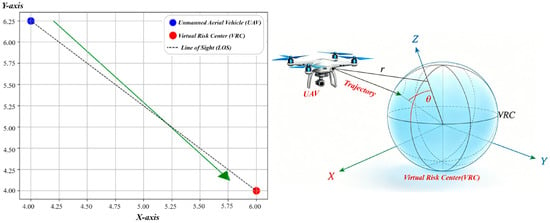
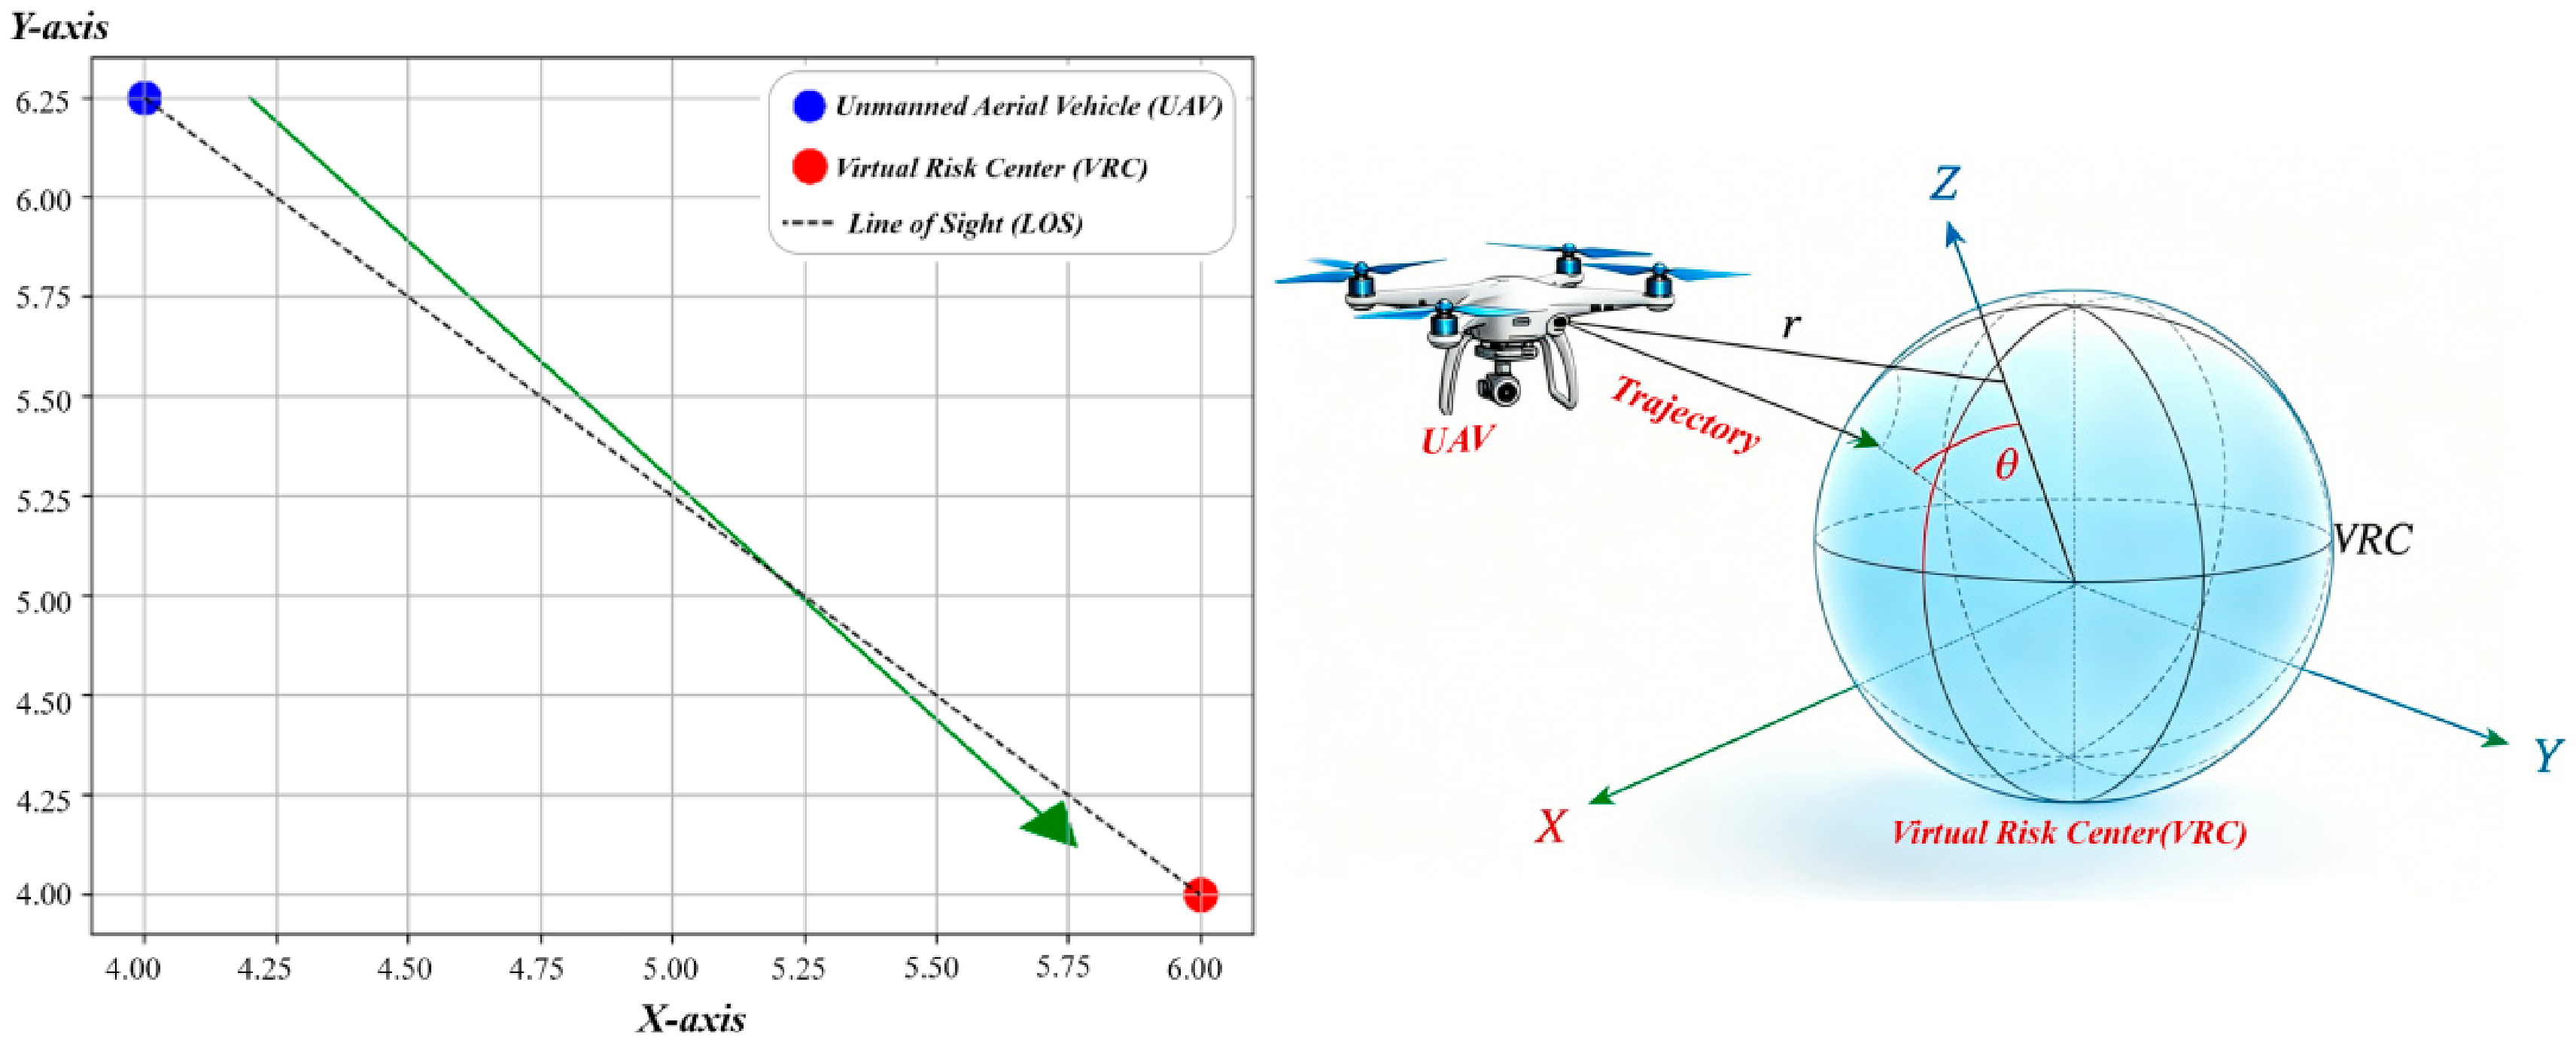
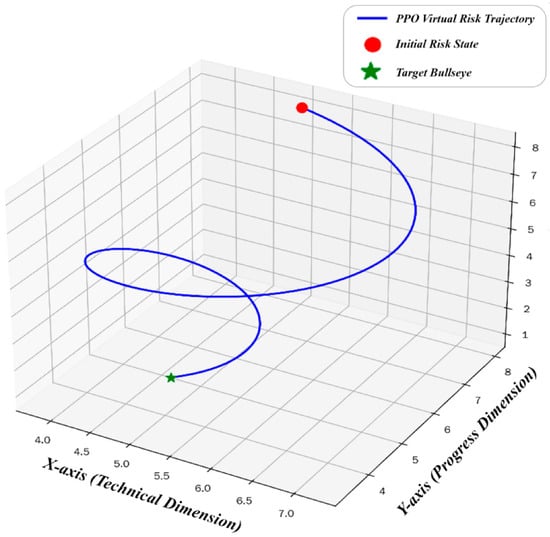
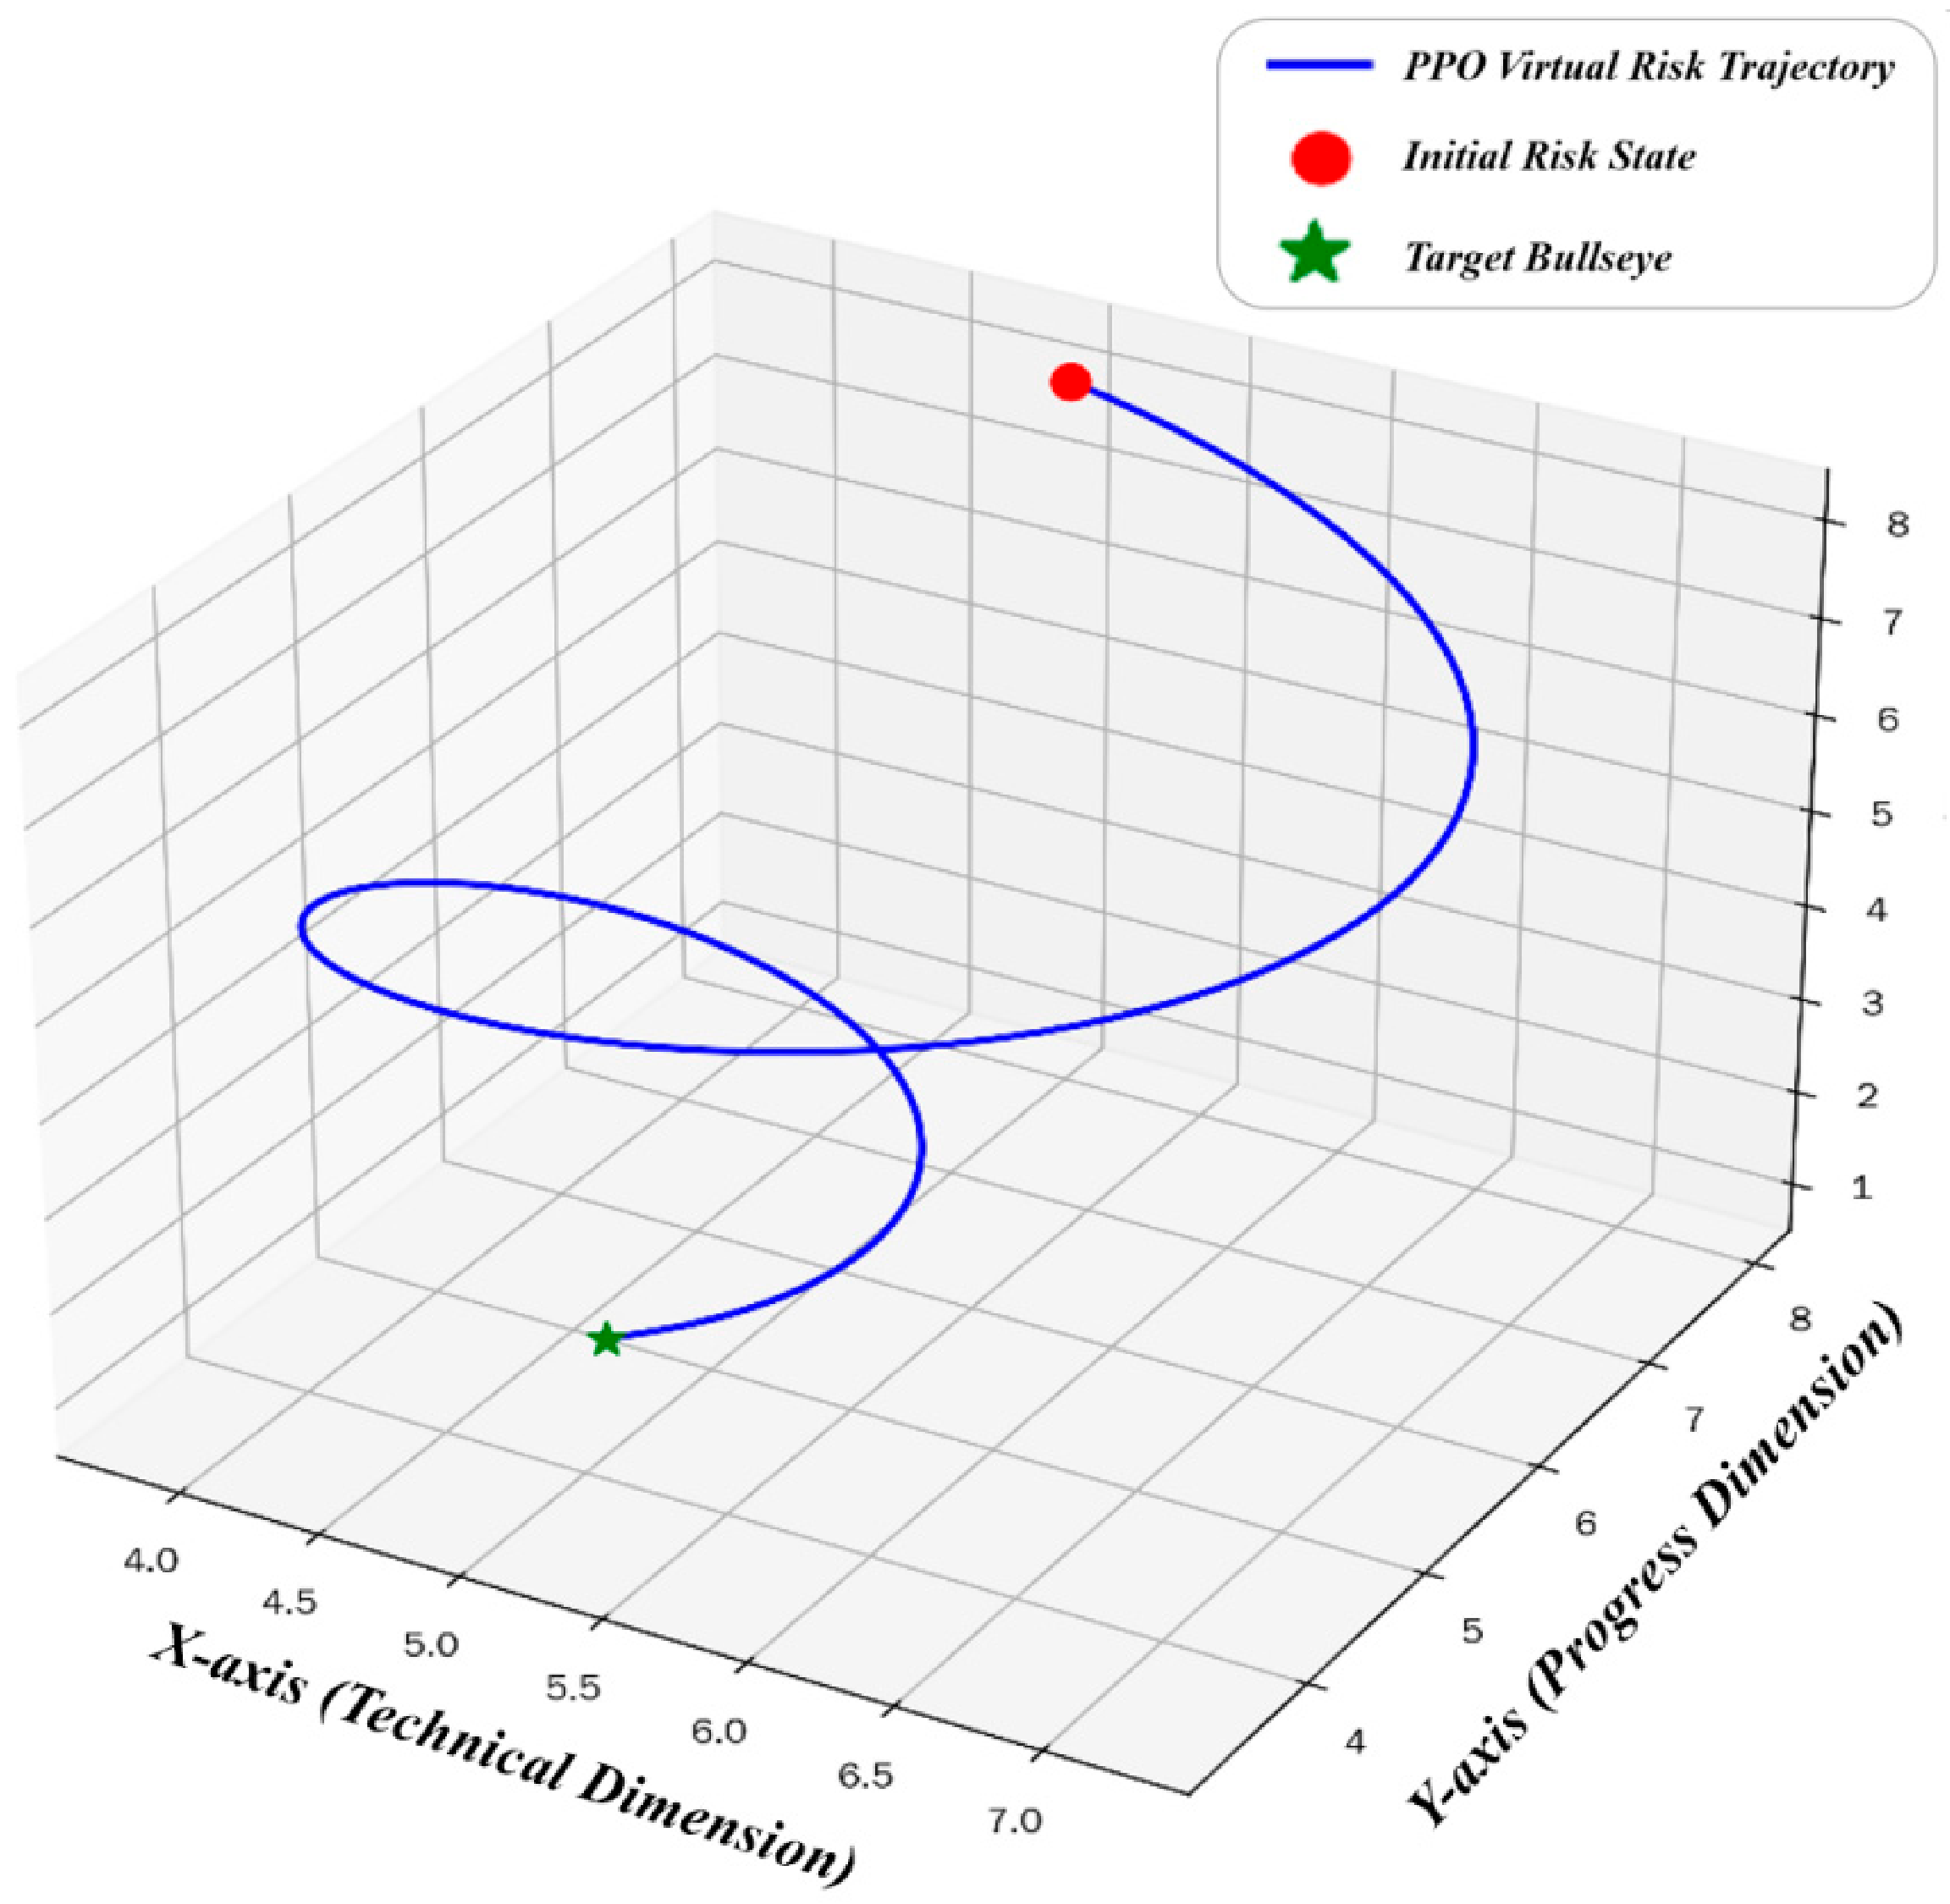
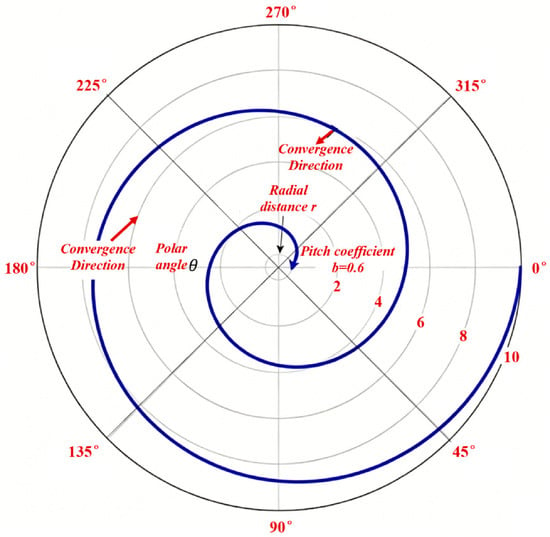
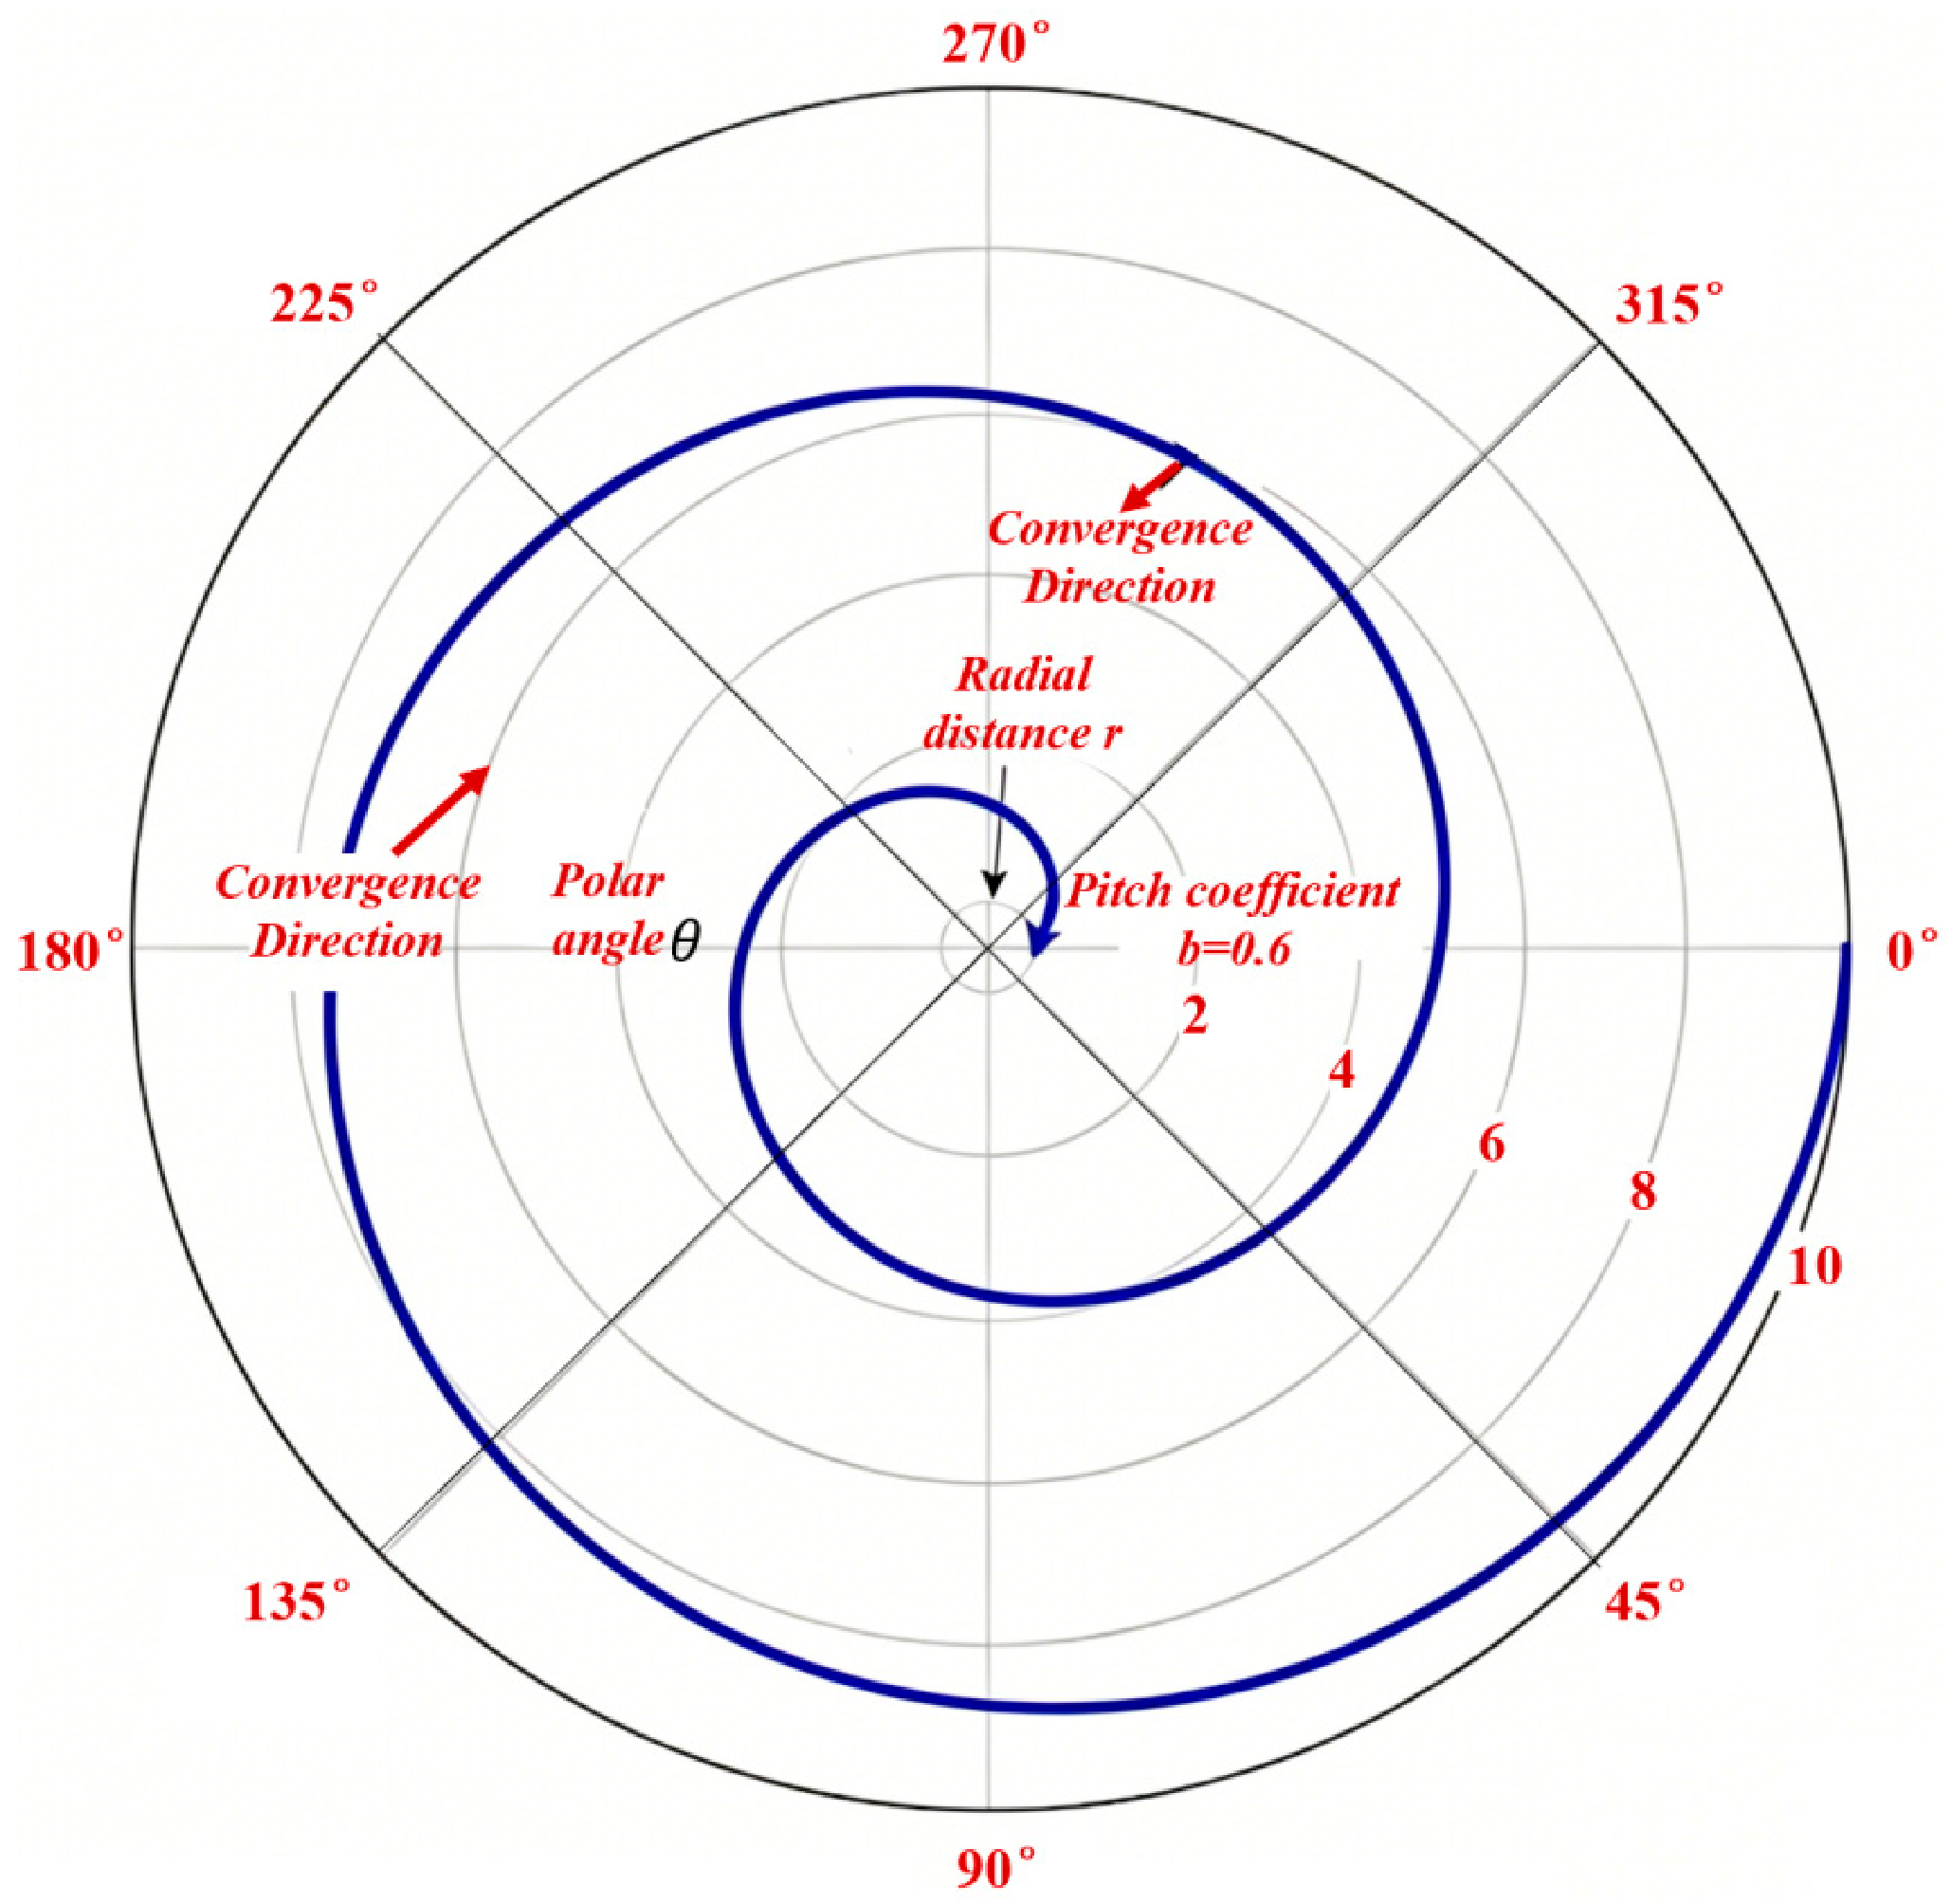
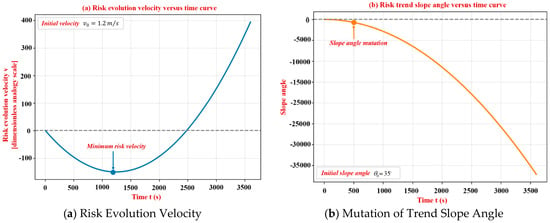
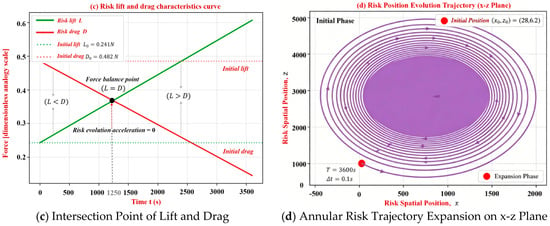
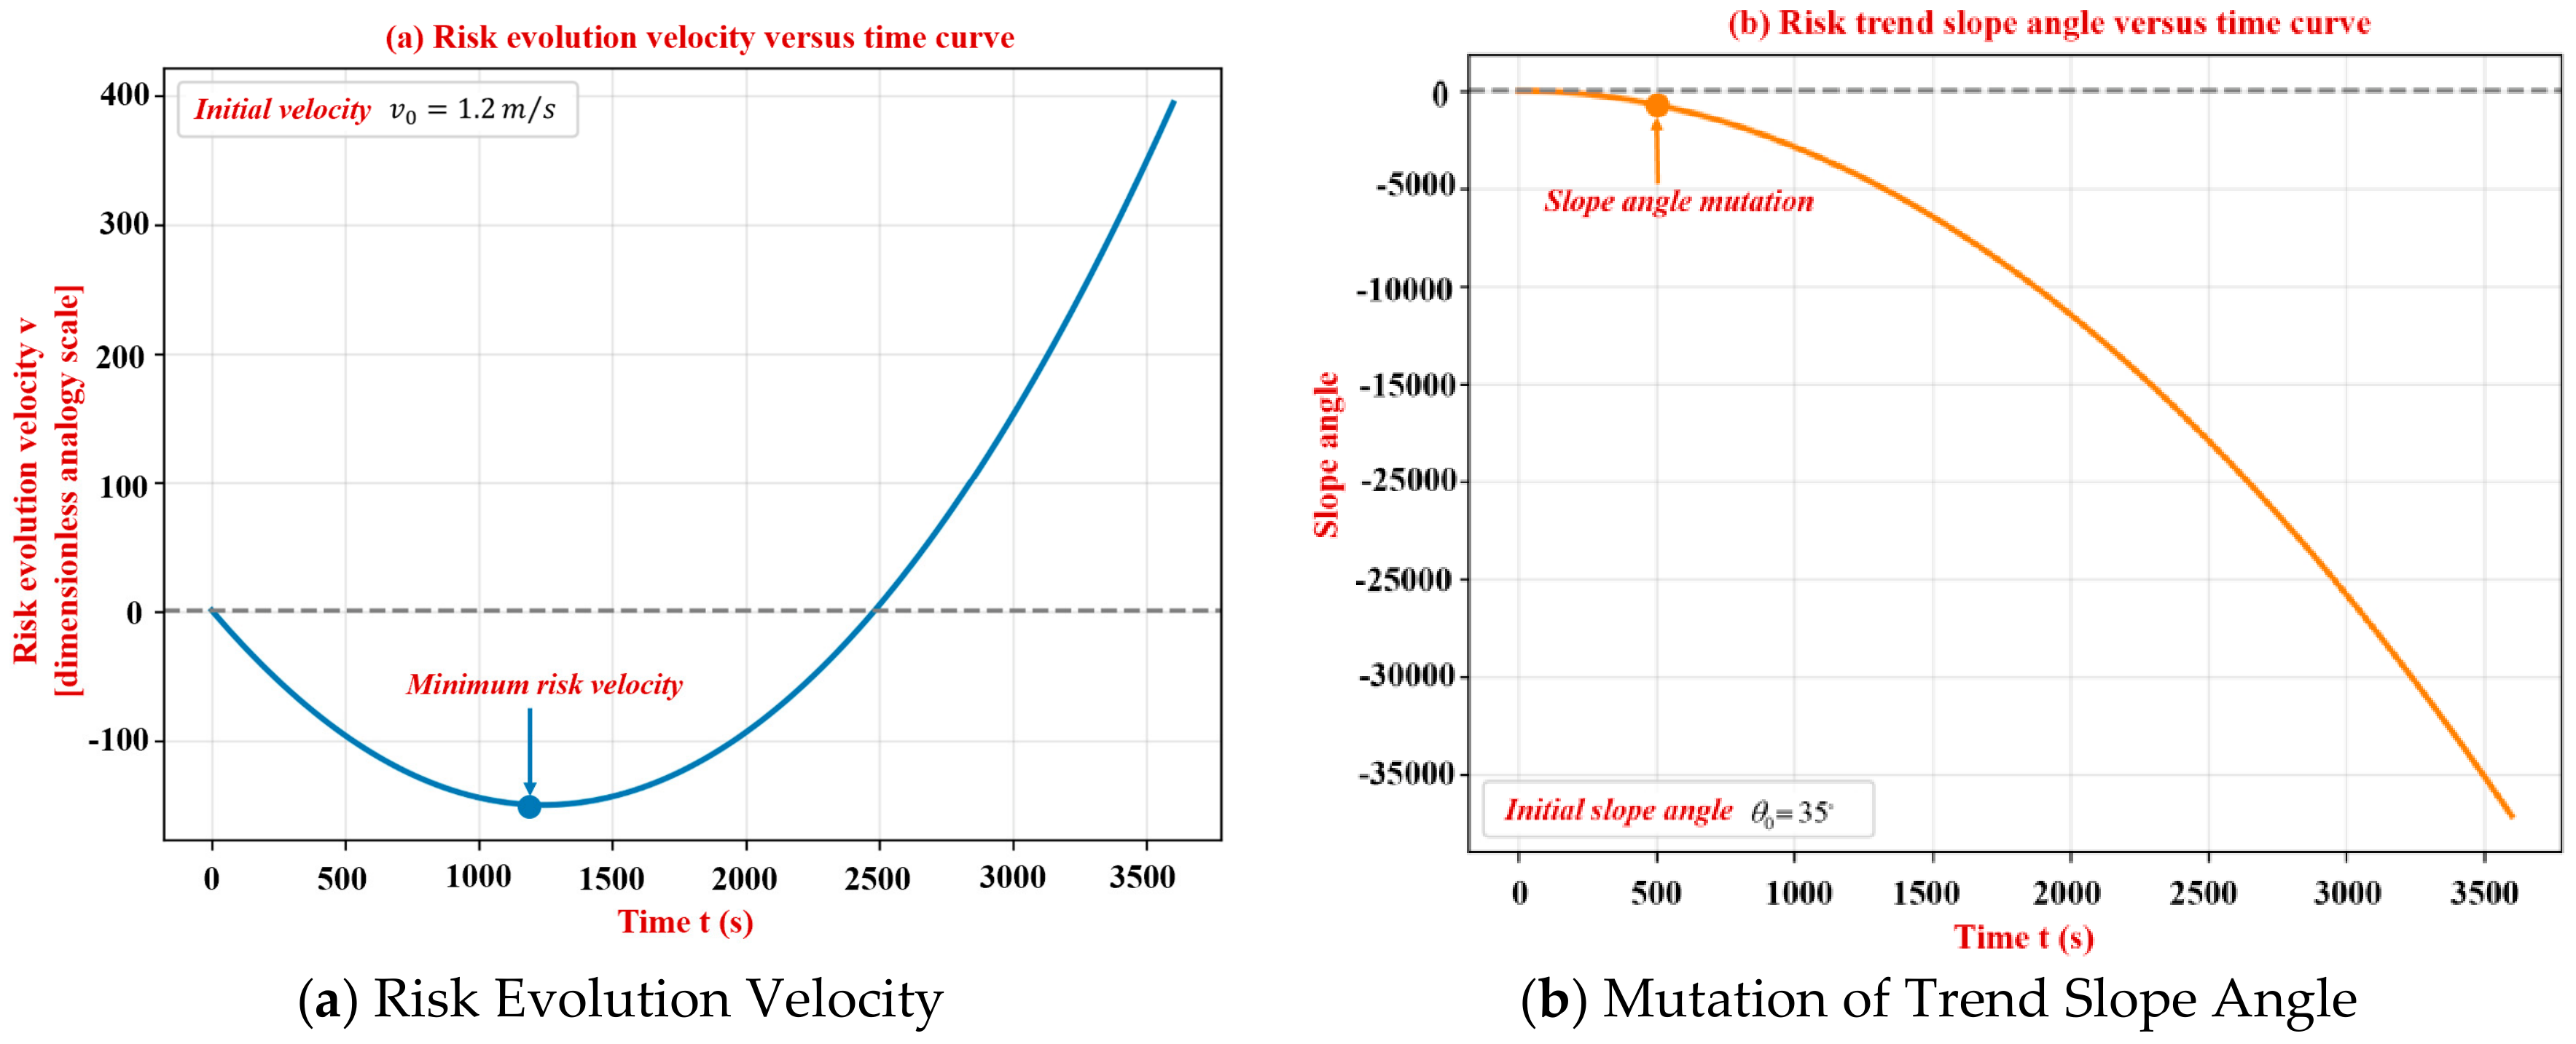
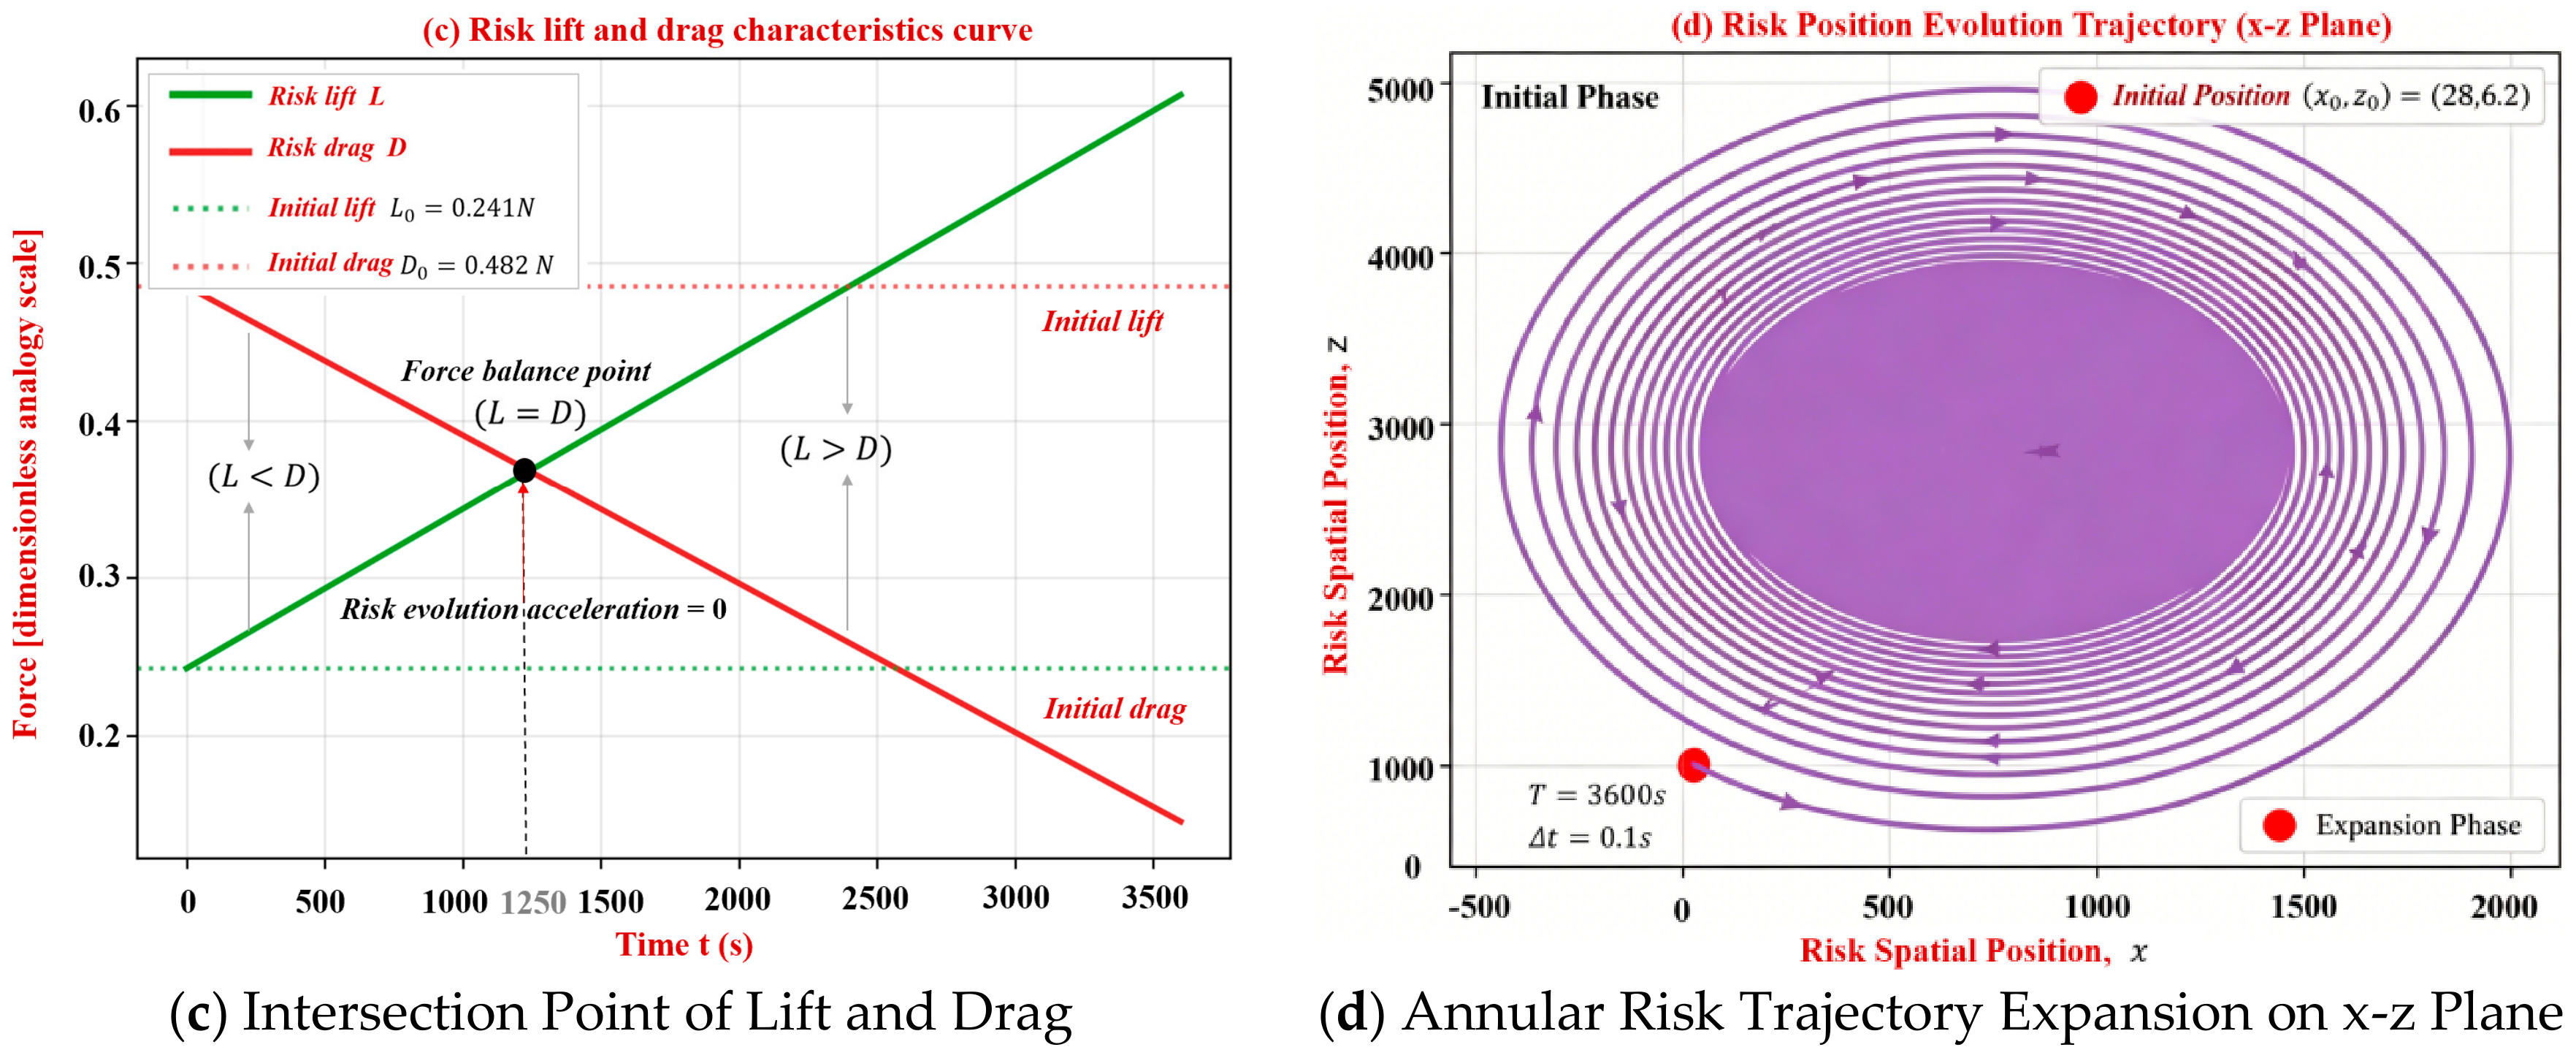

Disclaimer/Publisher’s Note: The statements, opinions and data contained in all publications are solely those of the individual author(s) and contributor(s) and not of MDPI and/or the editor(s). MDPI and/or the editor(s) disclaim responsibility for any injury to people or property resulting from any ideas, methods, instructions or products referred to in the content. |
© 2026 by the authors. Licensee MDPI, Basel, Switzerland. This article is an open access article distributed under the terms and conditions of the Creative Commons Attribution (CC BY) license.