


Abstract
Bike-Sharing Systems (BSS) are increasingly viewed as a sustainable and flexible component of urban mobility, particularly in rapidly growing cities such as Casablanca. The effectiveness of such systems depends, critically, on strategic planning decisions, most notably the number and location of stations. This study proposes a spatially explicit modeling framework to support the design of a BSS network based on urban demand characteristics. Ten categories of urban attractors are identified and grouped into four main criteria: socioeconomic activities; education, culture, and health; leisure spaces; and public mobility hubs. A modified Huff model is used to estimate the spatial distribution of potential demand and to identify candidate locations for bike-sharing stations. Walking accessibility is represented by shortest-path distances on the pedestrian network. Building on these demand estimates, the station deployment problem is formulated as a minimum set covering location problem whose objective is to determine the smallest number of stations required to cover a predefined proportion of total mobility demand within a 1000 m walking-network distance. Coverage is constrained separately for each arrondissement, while stations located near administrative boundaries may serve demand in neighboring arrondissements. At the baseline , the model selects 45, 70, and 154 stations for coverage targets of 60%, 80%, and 100%, respectively. The proposed approach provides a systematic and data-driven basis for BSS planning and helps integrate bike sharing into a more efficient, environmentally sustainable, and multimodal urban mobility system in Casablanca.
1. Introduction
In many developing and rapidly urbanizing cities, demand for daily travel and goods’ movement has grown rapidly due to population growth, spatial expansion, economic activity, and the need to access jobs, education, and essential services. This growth often exceeds the capacity of public transport systems, which may remain underdeveloped, fragmented, or unable to provide a reliable and inclusive service. Residents, consequently, rely on inefficient or carbon-intensive modes, contributing to congestion, longer travel times, road-safety concerns, and unequal access to mobility. Soft mobility, including walking, cycling, and shared micromobility, is, therefore, an important means of improving accessibility and reducing dependence on private vehicles.
Bike-Sharing Systems (BSS) are among the most promising and scalable shared-mobility solutions. Shared mobility provides short-term, as-needed access to transport resources and can support more sustainable and efficient urban transport [1]. BSS combine affordability, flexibility, and efficient use of urban space. They can encourage physical activity and provide an alternative to motorized travel in congested, high-density urban areas, where cycling may reduce delays caused by traffic bottlenecks [2,3].
By supporting last-mile connections and short trips in dense urban areas, BSS can improve accessibility under infrastructure constraints. Their relevance is particularly strong in developing cities, where demand for accessible and efficient transport is growing rapidly. The global expansion documented by the Meddin Bike-Sharing World Map further illustrates their increasing role in contemporary urban mobility [4].
This relevance also corresponds to mobility priorities in Morocco. The Moroccan “Conseil économique, social et environmental” (CESE), in its report on sustainable and accessible transport, emphasizes the need to improve accessibility, reduce dependence on private vehicles, and promote sustainable alternatives [5]. Although the report does not explicitly address BSS, they reflect the eco-friendly, space-efficient, and socially inclusive solutions promoted in national policy. Their potential is also relevant as Morocco prepares to co-host the 2030 FIFA World Cup, which is expected to increase pressure on urban mobility systems. A well-designed BSS could support flexible last-mile mobility, reduce pressure on existing networks, and improve resilience during periods of high demand.
Beyond passenger mobility, BSS also offer potential applications in urban logistics, particularly for last-mile delivery. The growth of e-commerce and crowdshipping has increased the need for flexible, low-emission delivery solutions [6]. Integrating BSS into logistics chains for small-parcel delivery may provide a sustainable alternative for short-distance urban distribution. This dual role in personal mobility and goods’ movement positions BSS as a versatile component of urban mobility ecosystems.
2. Bike-Sharing Systems
Bike-Sharing Systems (BSS) have become a defining component of contemporary urban mobility. According to the Meddin Bike-Sharing World Map, more than 2245 active systems and 76 additional planned networks are recorded worldwide, representing a fleet of over 10 million bicycles as of July 2026 [4]. This rapid and continuous expansion highlights the growing global demand for flexible, low-carbon, and space-efficient mobility solutions.
The development of BSS is commonly described through four successive technological generations. The first generation began in Amsterdam in 1965 with the “White Bike” program, a free-access system that ultimately failed due to theft and vandalism. The second generation, emerging in the 1990s, introduced coin-deposit mechanisms and fixed docking stations, offering improved security but limited operational visibility. A major shift occurred with the third generation, characterized by smart cards, GPS tracking, digital interfaces, and automated stations enabling user identification, billing, and real-time fleet monitoring. This technological leap marked the transition from symbolic community bicycles to scalable mobility services. Today, fourth-generation systems leverage real-time data, Artificial Intelligence, connectivity, and IoT technologies for dynamic rebalancing, predictive maintenance, and seamless multimodal integration [7,8]. The emergence of electric bicycles and dockless tracking further reinforces the sophistication and versatility of current systems.
Today, two dominant operational paradigms coexist. Dockless Bike-Sharing Systems (DBSS) allow bikes to be parked anywhere within a designated zone, offering maximum spatial flexibility. Station-Based Bike-Sharing Systems (SBSS) rely on fixed docking stations distributed strategically across the city, enabling controlled operations, accurate monitoring, and more predictable user flows. SBSS facilitate short urban trips and are especially useful for last-mile connections from public transport. They remain the focus of this study because their structured architecture supports demand modeling, optimization, and strategic station placement.
The effectiveness of an SBSS depends heavily on the placement of its stations, which constitute the backbone of the system. Proximity to residential areas, activity locations, and public transport directly affects accessibility, convenience, and potential ridership. Poor placement can increase walking times, reduce service attractiveness, and exacerbate imbalances between full and empty stations. However, identifying optimal station locations is challenging. In many cities—especially in developing contexts—historical bike-sharing ridership records are unavailable. This absence creates uncertainty for planners attempting to estimate potential demand and identify priority areas.
Demand for bike-sharing services is shaped by multiple contextual variables. Eren et al. (2020) [9] categorize these determinants into six main factors: weather, built environment, land use, public transport connectivity, station-level characteristics, socio-demographics, and temporal/safety aspects. Numerous studies show that demand is strongly influenced by proximity to residential areas, public transport nodes, and points of interest [2,10]. As noted by Revelle et al. (1970), optimal facility location is essential to ensuring accessibility, operational efficiency, and user satisfaction [11].
These insights reinforce the necessity of adopting rigorous analytical and optimization frameworks capable of incorporating heterogeneous demand determinants, operational constraints, and budget limitations. In this perspective, the present study concentrates on the strategic design of a Station-Based Bike-Sharing System for Casablanca, Morocco—where such a system is being developed for the first time. The objective is to determine optimal station locations that enhance accessibility, foster user adoption, and support efficient system performance within the city’s specific urban morphology. To this end, we identify context-relevant demand drivers, establish suitable selection criteria and spatial attractors, and implement a comprehensive, data-informed methodology tailored to local constraints.
Building on these considerations, the next section reviews the academic literature on station placement, demand modeling, and optimization, which provides the basis for the methodological approach adopted in this study.
The remainder of the paper is organized as follows. Section 3 reviews the relevant literature, Section 4 presents the methodology, Section 5 formulates the location–allocation model, Section 6 applies the approach to Casablanca, Section 7 and Section 8 present and discuss the results, and Section 9 concludes the paper.
3. Overview of the Relevant State of the Art
Planning and expanding a station-based bike-sharing system requires addressing several operational and strategic challenges. The literature usually distinguishes between two main decision problems: station network design and bicycle rebalancing. The first concerns long-term planning decisions, such as where stations should be located, how many stations should be installed, what capacity each station should have, and how many bicycles should be deployed in the system. These decisions determine the overall structure and scale of the network.
The second problem concerns the operational redistribution of bicycles among stations. Since demand is spatially and temporally uneven, some stations may become empty while others may become full. Rebalancing operations are, therefore, required to maintain service availability and avoid shortages or saturation [12].
In this paper, we focus on the strategic station-location problem. This choice is motivated by the fact that station placement is a fundamental design decision and represents a necessary first step for planning a station-based bike-sharing system in Casablanca. Research on BSS station location can be organized into five complementary methodological streams: (1) spatial planning using geographic information systems (GIS), (2) multi-criteria decision-making (MCDM), (3) demand and built-environment modeling, (4) mathematical optimization, and (5) gravity-based accessibility modeling. Hybrid studies combine two or more of these streams. A first stream relies on spatial and GIS-based planning approaches, where land use, density, accessibility, and urban morphology are used to identify suitable station locations. Loidl et al. [13] propose a spatial framework based on morphology and accessibility indicators, while Banerjee et al. [14] combine GIS-based location–allocation with a Huff gravity model to identify potential stations in Baltimore. Similarly, Wuerzer et al. [15] have developed a GIS suitability model for Downtown Boise using indicators such as population density, employment, transit access, bicycle infrastructure, and urban amenities.
A second stream uses multi-criteria decision-making methods to rank candidate locations according to urban, demographic, operational, and infrastructural criteria. Çetinkaya [16] combines fuzzy AHP and TOPSIS for station siting in Gaziantep, whereas Kabak et al. [17] integrate GIS preprocessing with AHP and MOORA to evaluate candidate locations in Karşıyaka, Izmir.
A third stream focuses on demand modeling and built-environment effects. These studies relate potential bike-sharing demand to public transport accessibility, socio-demographic characteristics, land use, and urban density. For instance, Faghih-Imani et al. [18] show that bicycle-sharing flows are associated with bicycle infrastructure, land-use characteristics, and urban form.
A fourth stream formulates the station-location problem as an optimization model. Frade and Ribeiro [19] propose a linear optimization model for Coimbra, Portugal, that jointly determines station locations, capacities, and fleet size while considering demand coverage and return on investment. Nikiforiadis et al. [20] have developed a multi-objective model for Thessaloniki that accounts for coverage, demand capture, rebalancing needs, spatial constraints, and budget limitations.
Finally, gravity-based and accessibility models estimate potential demand as a function of activity intensity and travel impedance. Building on spatial interaction theory [21,22], Lin and Yang [23], García-Palomares et al. [24], and Yang et al. [25] illustrate the relevance of these approaches for bike-sharing station planning. In the Moroccan context, Benhlima et al. [26] propose attractiveness metrics based on land-use intensity, functional diversity, and accessibility to support facility-location decisions in Casablanca.
Overall, existing studies show that bike-sharing station location is a multidimensional problem involving spatial structure, accessibility, demand potential, and operational constraints. However, most approaches focus on mature urban contexts or treat attractiveness through a limited set of indicators. This paper addresses this gap by developing a station-location framework for Casablanca that combines GIS-based candidate-site construction, differentiated urban attractor categories, gravity-based attractiveness, and mathematical optimization.
Collectively, these contributions confirm that the station-location problem is multidimensional, requiring the integration of user behavior, urban structure, demand forecasting, and operational constraints. They also highlight that data scarcity remains one of the main challenges for BSS planning in emerging cities, where gravity-based and GIS–MCDM hybrid models provide robust and practical alternatives. Table 1 offers a comparative perspective on the main methodological families used to address the station-location problem in Bike-Sharing Systems (BSS). It highlights the diversity of approaches and the way each contributes to solving different dimensions of the design problem.
Table 1.
Positioning of the present study with respect to differentiated features in the BSS station-location literature.
Our research evaluates station suitability from an attractiveness perspective based on population distribution and the spatial structure of urban activities. More specifically, we extend the existing literature in several ways. First, while earlier studies often relied on a narrow set of criteria to identify potential station locations, our approach incorporates a comprehensive taxonomy of urban attractors, including socioeconomic activities, education–culture–health facilities, leisure spaces, and public mobility hubs. These categories reflect the multifaceted drivers of urban movement and better capture the spatial logic of Moroccan cities. Second, unlike most prior studies that implicitly treat all criteria as equally important, we assign differentiated weights to each attractor to account for their varying influence on potential bicycle demand. Overall, our contribution lies in combining (i) spatially explicit and context-sensitive attractiveness indicators, (ii) weighted urban attractors tailored to Casablanca’s morphology, and (iii) an optimized Huff-type interaction model for bike-sharing station planning.
4. Methodology
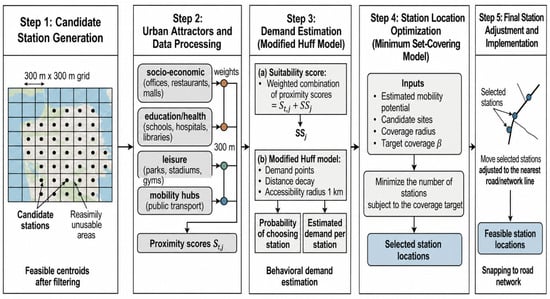
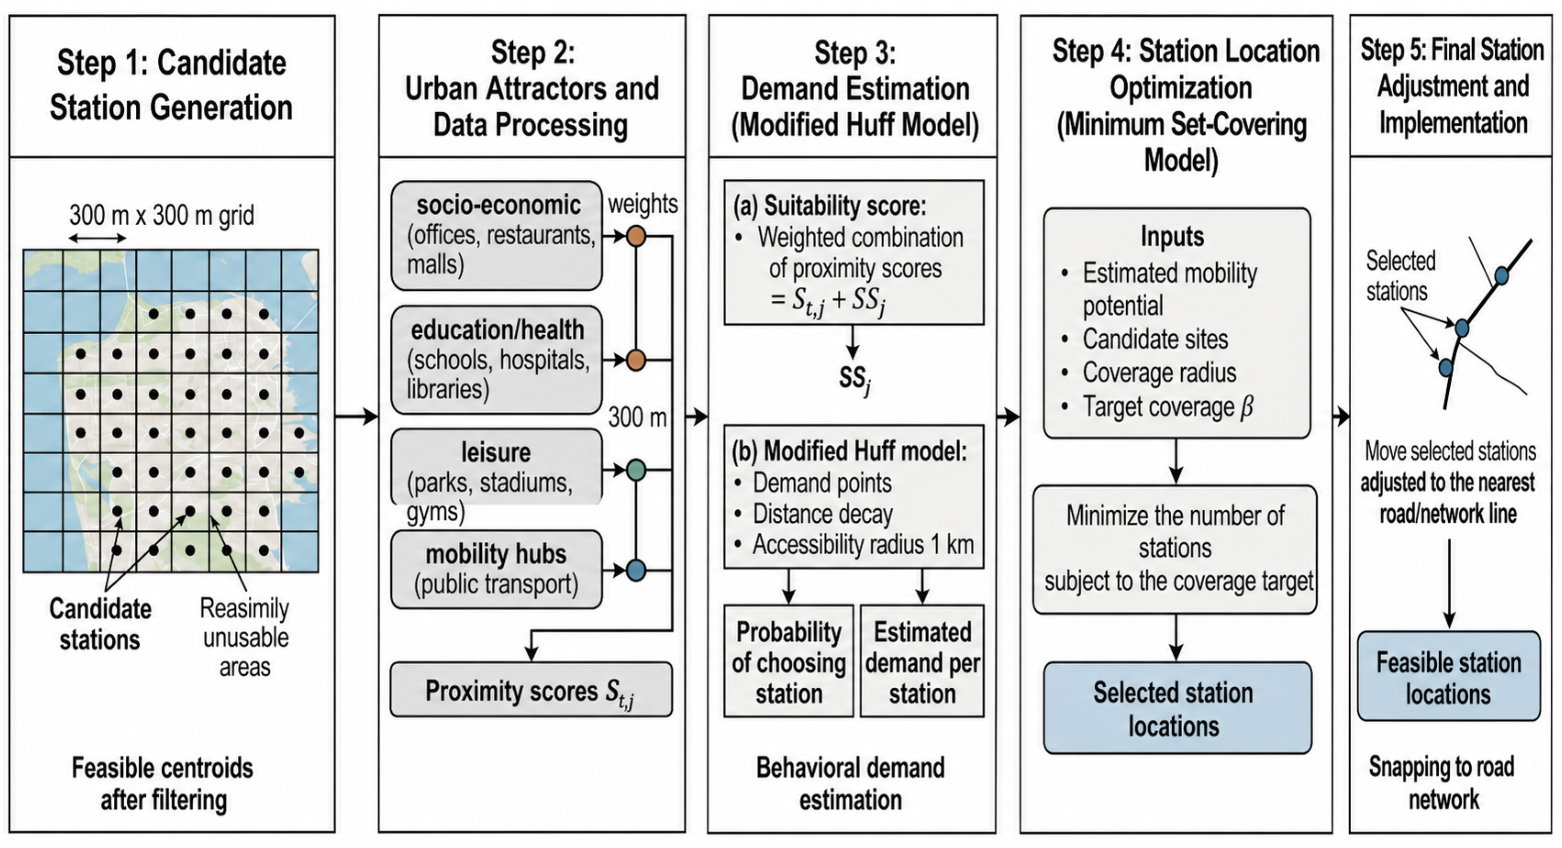
The proposed methodological framework consists of five steps. Step 1 identifies the set J of potential station locations using a grid-based approach. Following previous studies, a spacing of approximately 300 m is considered appropriate to ensure pedestrian accessibility [6,23,25]. A 300 m × 300 m grid is, therefore, applied to the study area; centroids falling in non-usable zones (sea, vacant land, or undevelopable areas) are removed, and the remaining centroids are retained as candidate stations.
Step 2 consists of selecting the attractor categories and the associated datasets. Attractors are activity nodes that generate or draw movement and, therefore, provide a spatial basis for estimating potential demand. Their selection follows land-use–transport research [27,28] and local evidence from the Plan de Déplacements Urbains du Grand Casablanca (PDGC), the Schéma Directeur d’Aménagement Urbain (SDAU), and the “Conseil économique, social et environnemental” (CESE). We identified ten attractor types that best represent the functional opportunities shaping short-distance mobility in the city. These categories include office buildings, restaurants, shopping malls, universities and schools, libraries, hospitals, parks, stadiums, gyms, and public transport nodes, as illustrated in Figure 1. They represent locations associated with high concentrations of daily activities, recurrent trip purposes, and multimodal connections. As such, they provide a basis for estimating how each candidate station interacts with the surrounding urban opportunities.
Figure 1.
Bike-sharing station-location methodology.
Step 3 formulates the modified Huff model used to estimate the attractiveness of each candidate station. The traditional Huff model [21,22] assumes that the probability of a user located at point i choosing facility j is proportional to the attractiveness of facility j and inversely proportional to the distance between i and j. This probability is expressed as follows:
where denotes the probability that an individual located at i chooses facility j, represents the attractiveness of facility j, and is the distance between location i and facility j. The parameter controls the sensitivity of the model to facility attractiveness, while captures the distance-decay effect. The term n denotes the total number of facilities considered in the choice set.
The parameters and determine the relative influence of attractiveness and distance. In the original formulation, Huff considered and [22]. A higher value of increases the influence of facility attractiveness, whereas a higher value of reinforces the penalizing effect of distance. Consequently, even highly attractive facilities may have a low probability of being selected if they are located too far from the user.
In this study, a suitability score is incorporated into the modified Huff model to represent the attractiveness of each potential station based on its proximity to the identified attractors. Let denote the set of attractor types considered. In our case, this set is defined as follows:
To evaluate the potential of each candidate station zone, we introduce a spatial interaction-based measure that quantifies how strongly surrounding opportunities influence bicycle activity within that zone. Conceptually, this measure captures the local opportunity field of a station. A zone is not attractive in isolation; rather, its potential to generate or attract bicycle trips depends on the intensity, relevance, and spatial proximity of the functional activities located within its immediate surroundings.
At short distances, urban opportunities exert a stronger mobility pull, which is consistent with gravity-based theories and empirical evidence showing that short-distance access is a key driver of active mobility. Conversely, as distance increases, the influence of these opportunities decreases due to travel impedance, particularly for walking access to bike-sharing stations.
To operationalize this construct, each candidate station j is associated with a set of proximity scores reflecting its spatial relationship to the relevant attractor types. For each attractor type , the score quantifies the extent to which the nearest opportunity of type t contributes to the local opportunity field of station j. The score is bounded within , ensuring comparability across attractors with heterogeneous scales and functions. A 300-m threshold is adopted to represent the spatial range within which opportunities are assumed to effectively support walking access to bike-sharing stations, in line with previous studies on bike-sharing station accessibility and walking-distance thresholds [14,29]. This proximity is measured by shortest-path distance on the pedestrian-accessible OpenStreetMap network.
The proximity score is defined as follows:
where is the proximity score of candidate station j with respect to attractor type t, and denotes the shortest walking-network distance between candidate station j and the nearest attractor of type t. Candidate stations and attractors were attached to their nearest pedestrian-network nodes before shortest paths were calculated. Motorways, motorway links, trunk roads, trunk links, and busways were excluded from the pedestrian network.
This transformation converts the qualitative urban landscape, composed of schools, offices, parks, hospitals, commercial areas, and other urban opportunities, into a set of comparable quantitative indicators. These indicators reflect the functional richness and accessibility of each candidate station zone and are, subsequently, used to estimate station attractiveness within the modified Huff model.
To combine the proximity scores across attractor types, the overall suitability score of candidate station j is computed as a weighted sum,
where denotes the overall suitability score of candidate station j, is the proximity score of station j with respect to attractor type t, and is the weight associated with attractor type t. The weights satisfy
The complete weight vector used in the analysis is reported in Appendix A, Table A1. These weights are planning assumptions informed by the relative role of each attractor category; they are not presented as empirically calibrated behavioral parameters.
Let and . Min–max normalization, including the constant-score case, is defined by
where is the normalized suitability score of station j.
As a result, stations located closer to highly weighted attractors obtain higher suitability values, with scores approaching 1. Conversely, stations located farther from relevant attractors receive lower suitability scores. The normalized suitability score is then used as an attractiveness measure in the modified Huff model.
Once the local potential of each candidate zone has been quantified through the suitability score, this measure is incorporated into a probabilistic spatial choice model to determine the effective attractiveness of each station. This step bridges the gap between structural opportunity and behavioral response. The suitability score captures what a zone offers through its surrounding activities, while the Huff model translates this potential into a behaviorally meaningful estimate of user preference by accounting for distance decay and spatial competition among candidate stations.
In this framework, the attractiveness of a candidate station is not treated as an intrinsic property of the zone alone. Rather, it reflects the ability of the station to attract users from surrounding demand areas. A zone with multiple high-value opportunities, represented by a high normalized suitability score , exerts a stronger spatial pull and, therefore, increases the probability that users will walk to this location to access a bicycle if a station is installed. The suitability score, thus, represents the structural potential of a zone to generate or attract bicycle-related flows, while the Huff model formalizes how this potential is translated into user choices under spatial competition and distance decay.
To operationalize this mechanism, two complementary spatial scales are considered. First, the 300-m threshold used in the computation of the proximity scores captures the micro-scale environment of the station. It reflects the quality of the immediate surroundings and the extent to which nearby opportunities can stimulate short-distance walking access to a bike-sharing station. This threshold, therefore, governs the intrinsic attractiveness of the candidate zone.
Second, the 1000-m threshold used in the Huff model represents the macro-scale accessibility radius within which users are assumed to be willing to walk from a demand point to reach a station. This threshold governs the behavioral feasibility of choosing a candidate station, independently of its internal opportunity structure.
The modified Huff model integrates these two mechanisms. Here, is the shortest walking-network distance between demand point i and candidate station j. For each demand point i, let , with , and . The probability of selecting station j is
Here, is the distance-decay parameter. The uniform fallback covers the constant zero-suitability case, and probabilities are normalized only across stations reachable within 1 km.
This formulation captures the dual mechanism driving station choice. First, a higher intrinsic attractiveness, represented by , increases the probability that station j is selected. Second, the 1 km accessibility constraint ensures that only realistically reachable stations are considered in the choice set.
The total potential demand attracted to station j is then computed as follows:
where denotes the population associated with demand point i.
The candidate-grid centroids subsequently serve as the weighted demand zones of the location model. Thus, the Huff output is not a separate descriptive result: it becomes the mobility-potential weight of the corresponding grid centroid in the coverage model. To distinguish the location-model demand-zone index from the original population-point index, the same value is denoted in the next section; for corresponding grid centroids,
Consequently, attractor suitability, walking-network distance, and the distance-decay parameter influence station selection through the weighted coverage constraint: covering a grid zone with a larger Huff-derived contributes more to attainment of the target .
This formulation highlights how a station’s ability to attract users emerges from the interplay between its functional environment, encoded in , and its spatial accessibility, encoded in distance constraints and the decay parameter . Together, these elements yield a behaviorally consistent estimate of potential ridership, firmly grounded in spatial interaction theory and gravity-based modeling traditions.
This version of the Huff model integrates two complementary walking-network distances. First, the suitability score captures network proximity between stations and key attractors, rewarding stations that are closer to more valuable locations. Second, the network distance between demand points and stations, constrained by a 1 km catchment, reflects the maximum distance people are assumed willing to walk. The parameter governs how rapidly station-choice probability decreases with walking-network distance. Since the bike-sharing system has not yet been implemented in the study area, neither historical usage records nor user survey data are available; consequently, cannot be empirically calibrated from observed behavior in the present study.
For the network calculations, candidate centroids, population centroids, and attractors are first attached to their nearest pedestrian-network nodes. After identifying the final station locations, a post-processing step is retained because a grid centroid can still represent a vacant plot, building, or otherwise unsuitable installation site. Each selected location must, therefore, be checked and adjusted to a nearby operationally feasible point on the road or cycle-path network. The mapped coordinates represent model-selected planning locations rather than field-validated installation points.
5. Optimizing Station Placement Through a Location–Allocation Model
While the modified Huff model allocates population-based potential demand to the candidate-grid centroids, it does not select which stations should be installed. A prescriptive planning step is, therefore, required to determine the smallest station configuration that covers the Huff-derived mobility potential while guaranteeing a minimum level of service across the study area. To this end, we formulate the station siting problem as a Minimum Set Covering Location Model whose objective is to identify the smallest number of stations needed to cover a predefined proportion of total mobility demand within a 1000-m walking radius.
For the location model, denotes the Huff-derived mobility potential assigned to candidate-grid demand zone i through the relationship defined above, and is its walking distance to candidate station j.
To encode accessibility feasibility, we define the binary coverage indicator as follows:
We introduce two binary decision variables. The variable indicates whether a station is installed at candidate site , while indicates whether demand zone is covered by at least one installed station:
The station-location problem is then formulated as follows:
The objective function (11a) minimises the number of installed stations. Constraints (11b) and (11c) jointly force to equal one if and only if at least one selected candidate covers zone i. In Constraint (11d), A is the set of arrondissements and is the set of demand zones belonging to arrondissement a. The constraint requires coverage of at least a proportion of the mobility potential in every arrondissement. Candidate stations are not restricted to covering demand in the arrondissement where they are located: any station within the 1000 m walking-network distance can provide coverage across an administrative boundary. The application evaluates , , and .
6. Application to Casablanca
This section applies the proposed framework to Casablanca. It defines the spatial extent of the case study, documents the datasets and preprocessing operations used to construct the population, attractor, candidate-site, and network layers, and explains how these layers enter the suitability, demand-estimation, and location–allocation stages.
6.1. Study Area
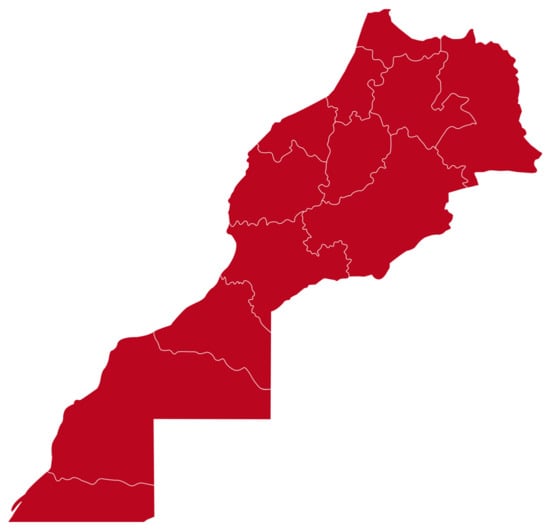
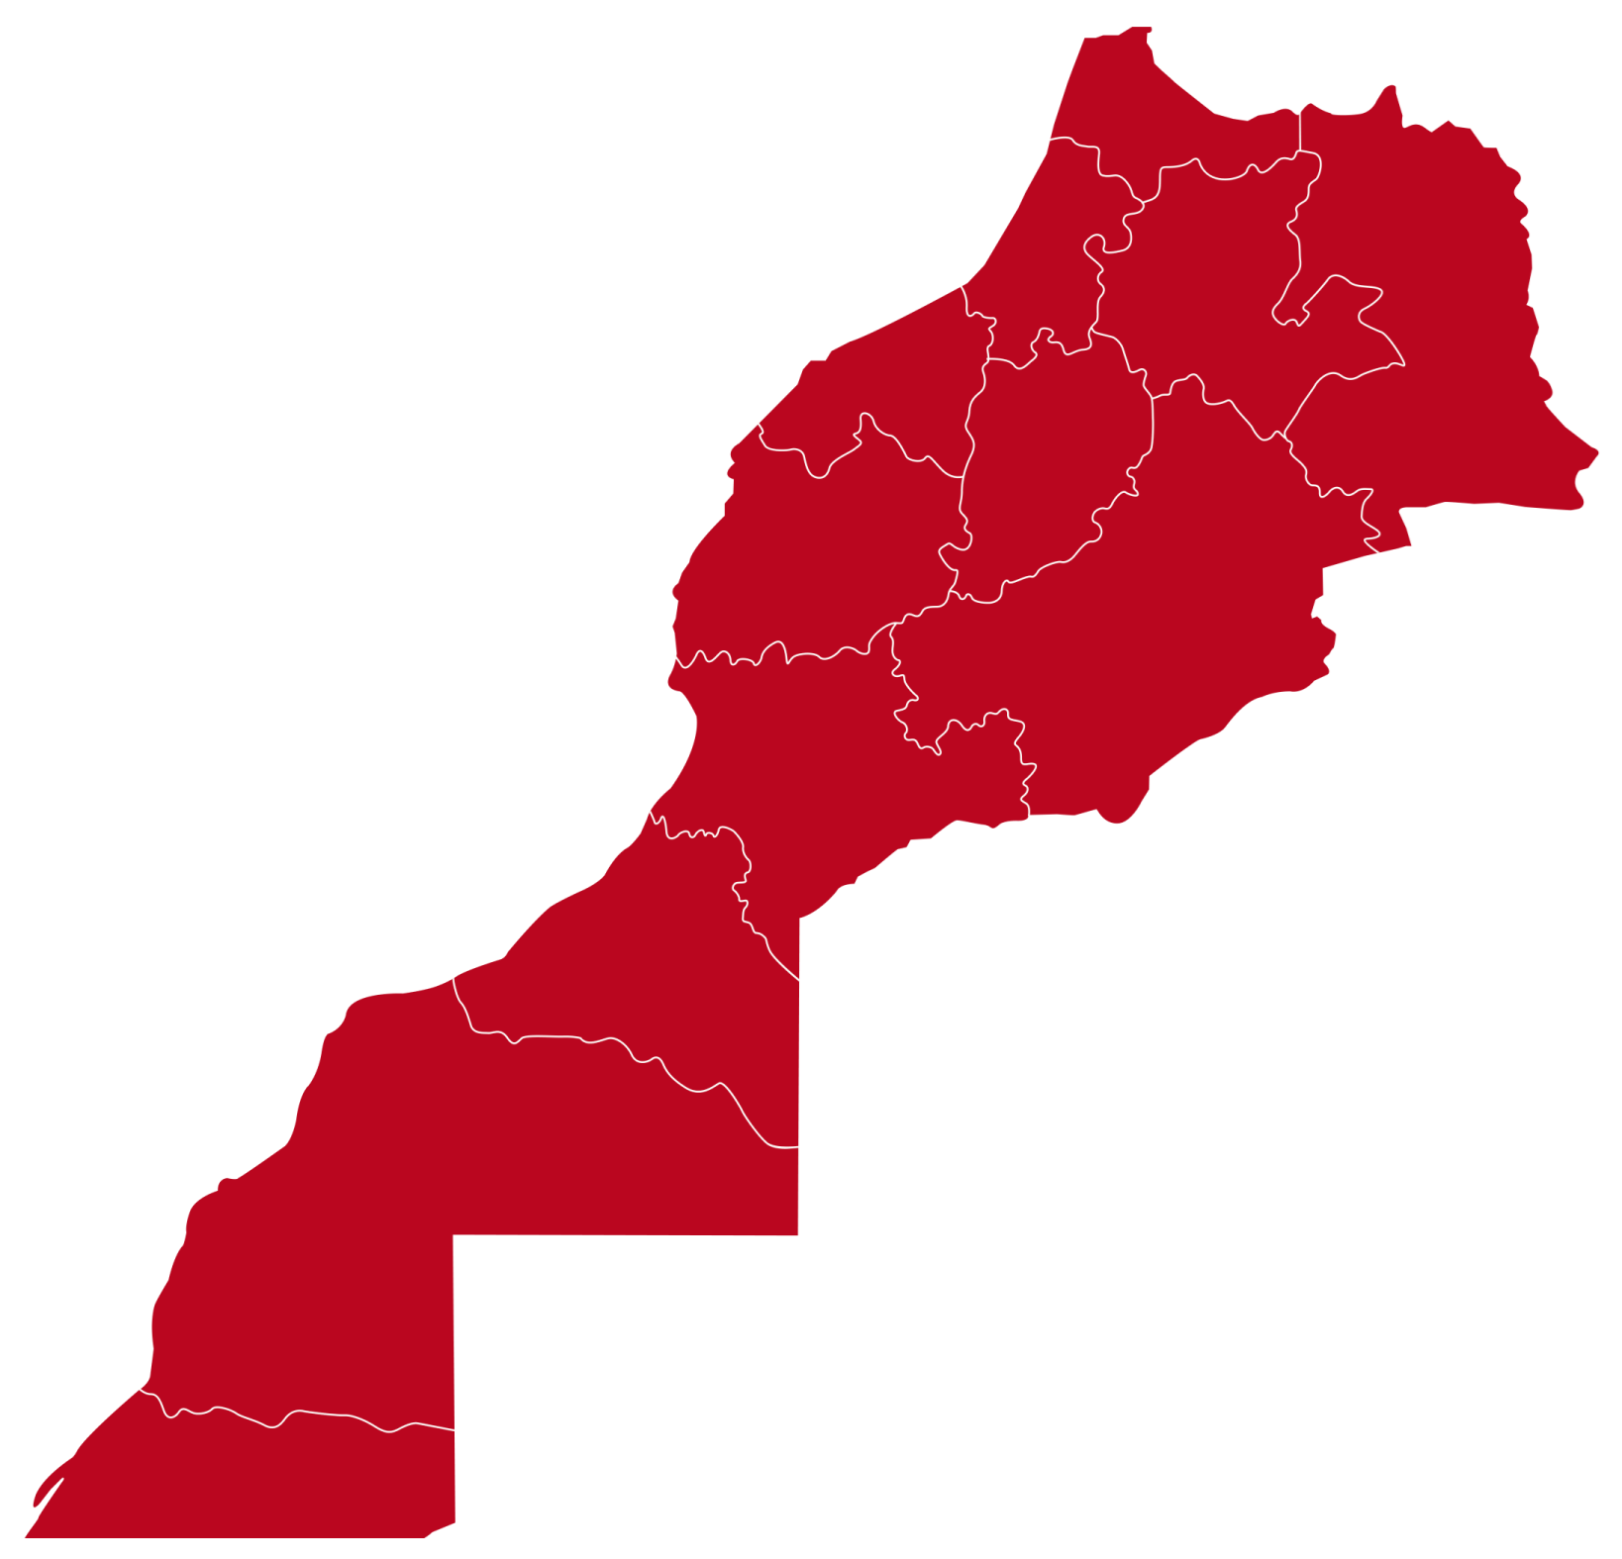
Casablanca is located on Morocco’s Atlantic coast and is the country’s largest urban and economic center. Its concentration of residents, employment, services, educational institutions, commercial activity, and public-transport connections creates diverse short-distance travel needs. These characteristics make the city an appropriate case for testing a station-based bike-sharing planning framework where historical bike-sharing demand data are not available. Figure 2 presents the administrative divisions of Morocco.
Figure 2.
Administrative divisions of Morocco.
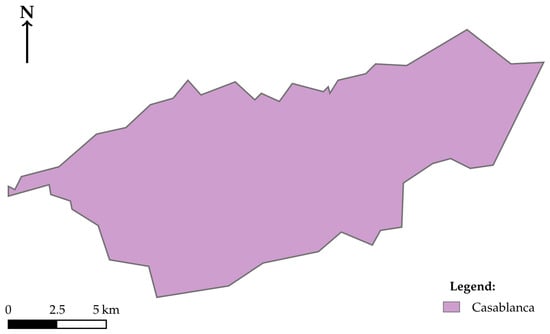
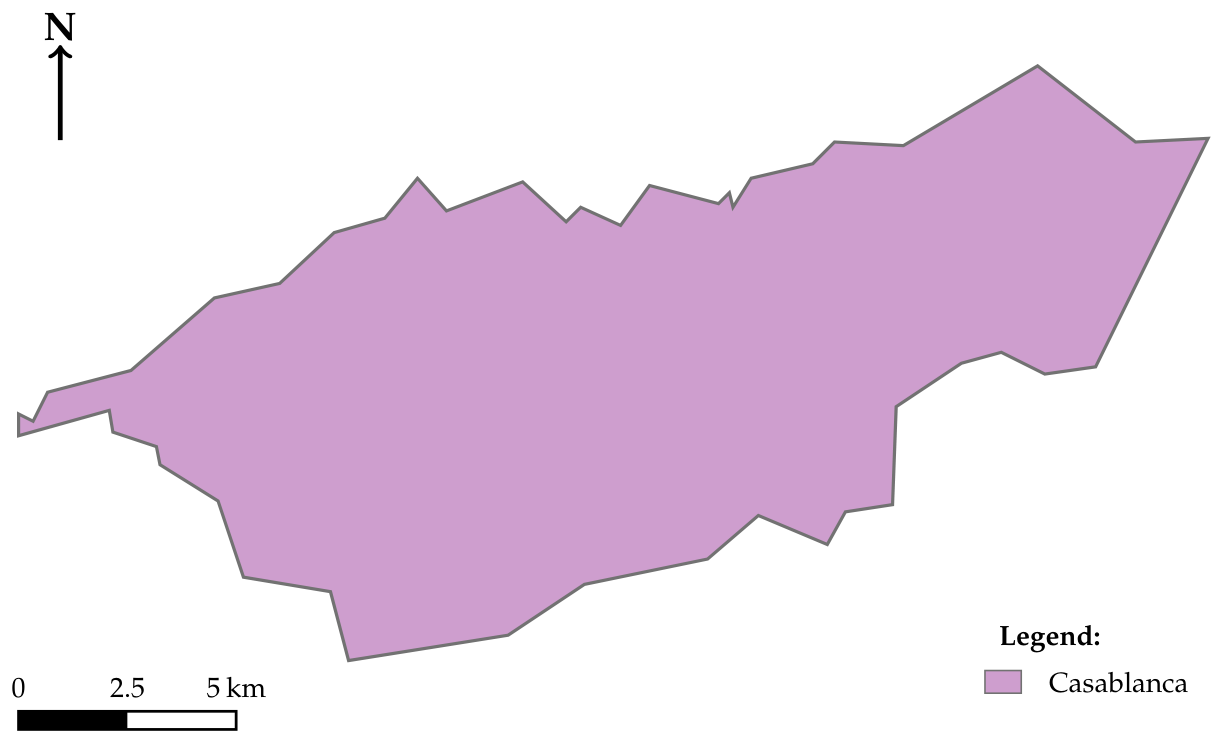
The study area lies approximately between 33.45° and 33.65° N and 7.45° and 7.75° W. The 2024 census reports 3,199,416 inhabitants in the Prefecture of Casablanca, approximately 8.7% of Morocco’s population [30]. The projected administrative extent used in the spatial analysis covers approximately 386.14 km2. The study-area boundary is shown in Figure 3.
Figure 3.
Casablanca study area.
6.2. Data Sources and Preprocessing
The analysis combines administrative, demographic, land-use, and transport-network information. Table 2 summarizes the role of each dataset. Attractor locations and the road and cycling network were extracted from OpenStreetMap (OSM) [31]. Overpass Turbo was used for structured queries, while QGIS quick queries and Nominatim supported name-based searches and coordinate verification. WorldPop’s 2018 gridded population surface [32] was clipped to the Casablanca boundary and aggregated to a 1 km × 1 km grid. After excluding cells outside the study area, 304 cell centroids were retained as population demand points. The 2024 HCP figure is used only to describe the current demographic scale of the city; it is not treated as interchangeable with the 2018 gridded population layer. The administrative-boundary, attractor, population-point, and candidate-centroid source files are provided in the Supporting Information.
Table 2.
Datasets used in the Casablanca application.
After filtering and retaining the largest connected pedestrian component, the walking graph contained 206,003 nodes and 238,630 undirected edges. The median attachment distance was 28.95 m for candidate locations and 26.88 m for population points; the corresponding 95th percentiles were 146.69 m and 149.53 m. These diagnostics are reported because network completeness and point-to-network attachment can affect accessibility estimates.
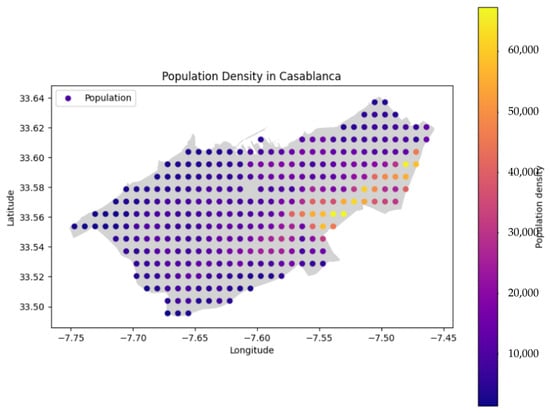
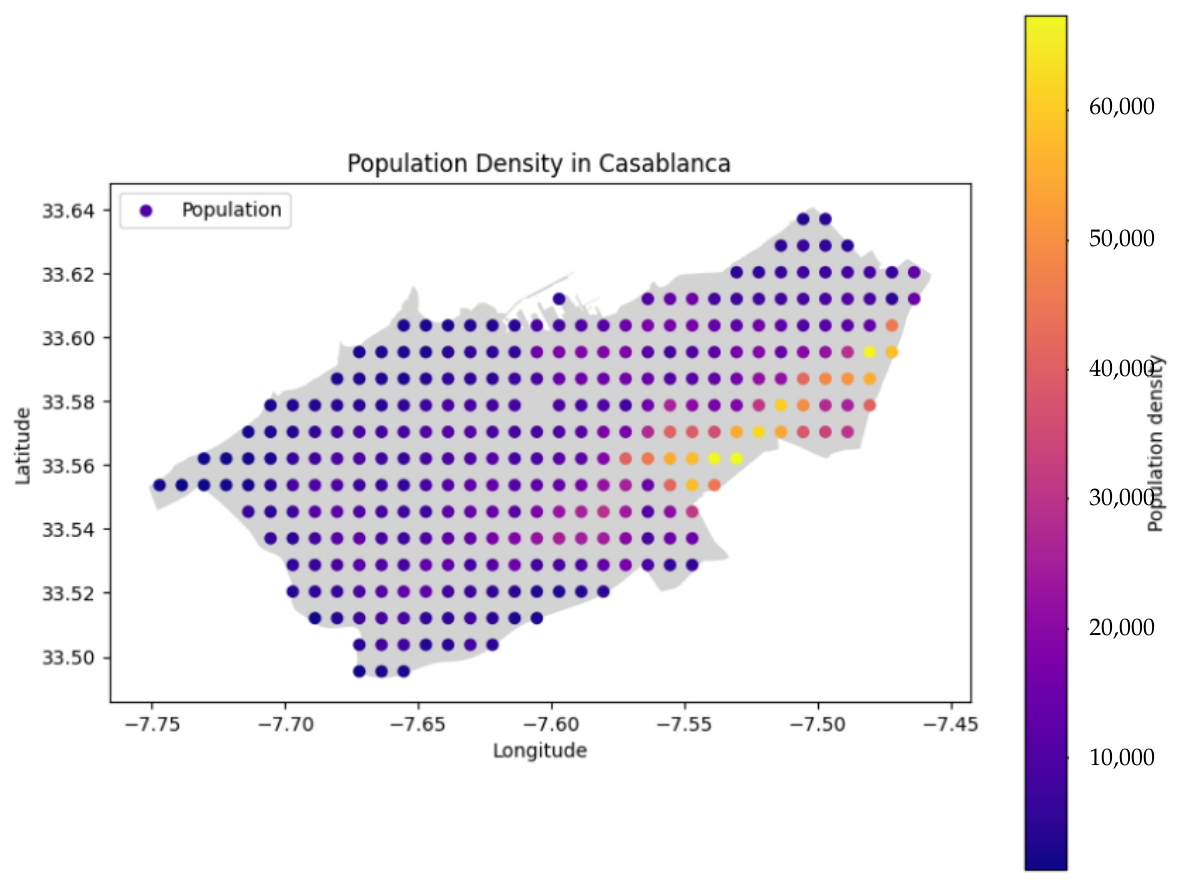
All spatial layers were transformed to a common coordinate reference system before distance calculations. The point datasets were exported to comma-separated value files and cleaned in Python 3.12 by standardizing category names, removing duplicate records, and excluding observations with missing identifiers, coordinates, or unusable geometry. Each of the 304 population points carries the WorldPop value of its grid cell and, therefore, represents the population component of mobility potential at that location. Figure 4 shows a marked concentration of population in eastern Casablanca.
Figure 4.
Population distribution in Casablanca.
Spatial Distribution of Urban Attractors
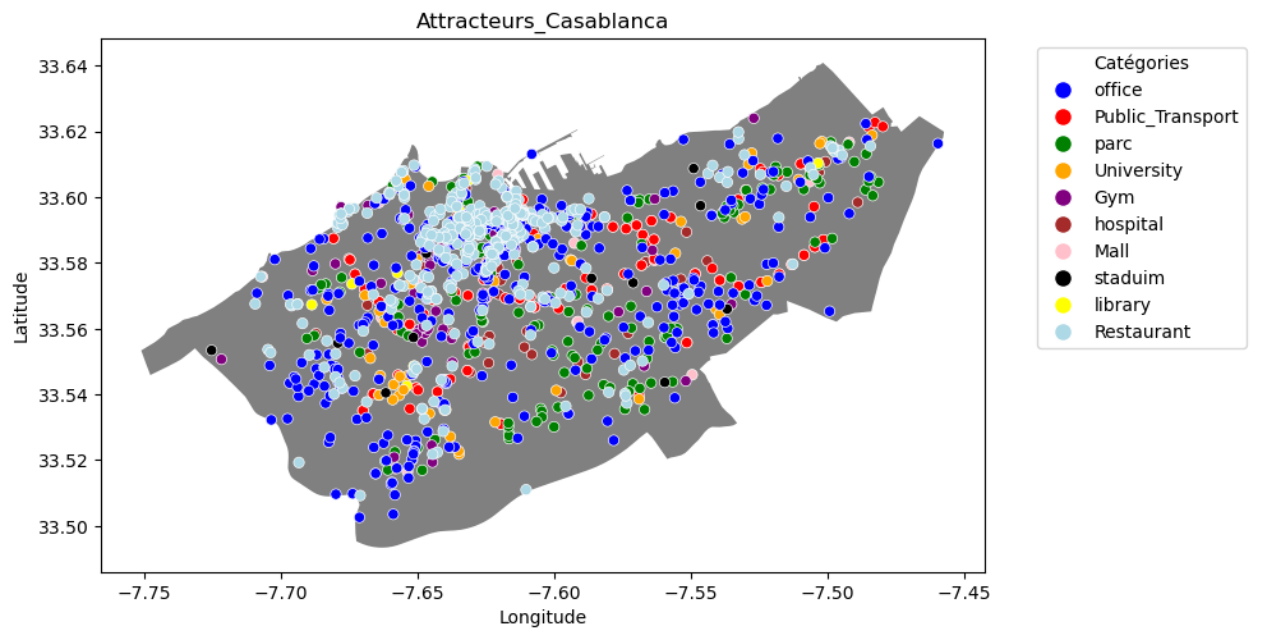
After cleaning, the attractor dataset contained 1340 records: 433 office buildings, 417 restaurants, 164 public-transport features, 154 parks, 53 universities or schools, 43 gyms, 36 hospitals, 19 shopping malls, 13 stadiums, and 8 libraries. Reporting both the total and category-specific counts makes the composition of the opportunity layer transparent and facilitates later sensitivity analysis of the category weights. Figure 5 reveals a heterogeneous spatial pattern. Attractors are distributed across the city, but visible clusters occur in the more functionally dense parts of the urban area, while several peripheral zones contain fewer mapped opportunities. The Figure represents model inputs rather than predicted demand or final station locations.
Figure 5.
Urban attractors in Casablanca.
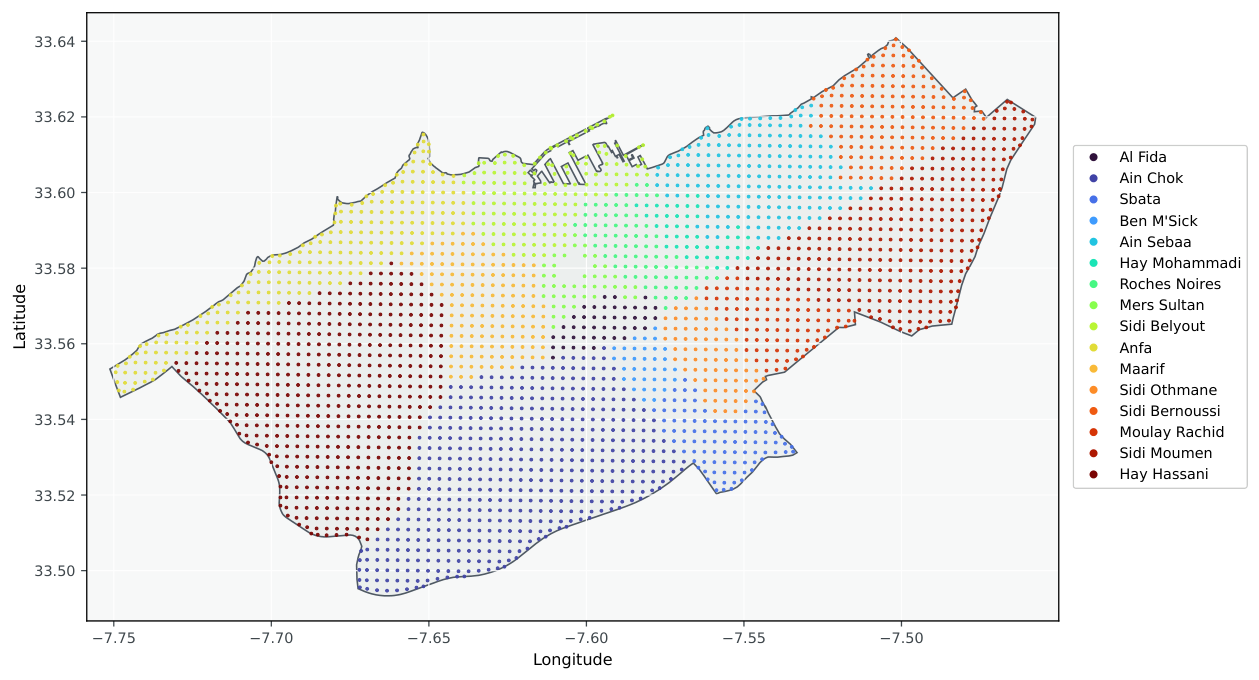
The first methodological stage generated a 300 m × 300 m grid and retained 2596 feasible centroids as potential station locations. Of these, 2584 had complete arrondissement identifiers and entered the optimization. Casablanca contains 16 arrondissements, and each retained candidate was assigned to its arrondissement. Figure 6 displays the generated candidate locations rather than stations selected by the optimization model.
Figure 6.
Candidate station locations by arrondissement.
6.3. Visualization and Spatial Scenario-Exploration Interface
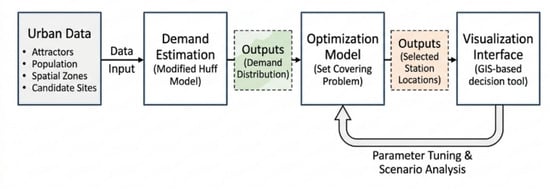
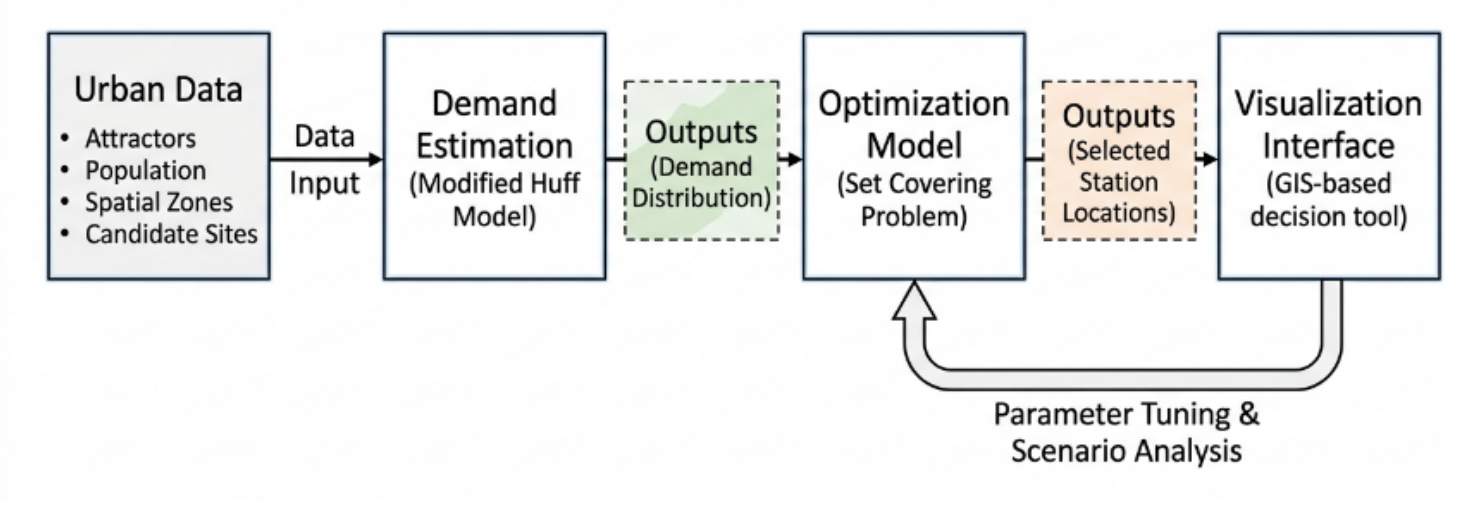
To support preliminary spatial planning, a geographic scenario-exploration interface was developed to integrate spatial inputs, model parameters, and optimization outputs. As shown in Figure 7, the system links four components: urban data preparation, modified-Huff demand estimation, set-covering optimization, and GIS-based visualization. The interface also provides a feedback path from the mapped outputs to the optimization model, allowing alternative assumptions and planning scenarios to be evaluated without changing the underlying analytical workflow. It does not constitute an economic appraisal or an empirically validated ridership-forecasting tool: capital and operating costs, fleet requirements, and observed local mobility data are not included in the present analysis.
Figure 7.
Spatial scenario-exploration framework.
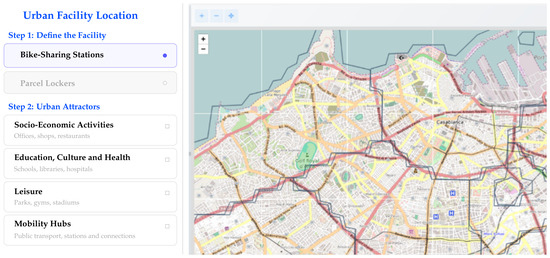
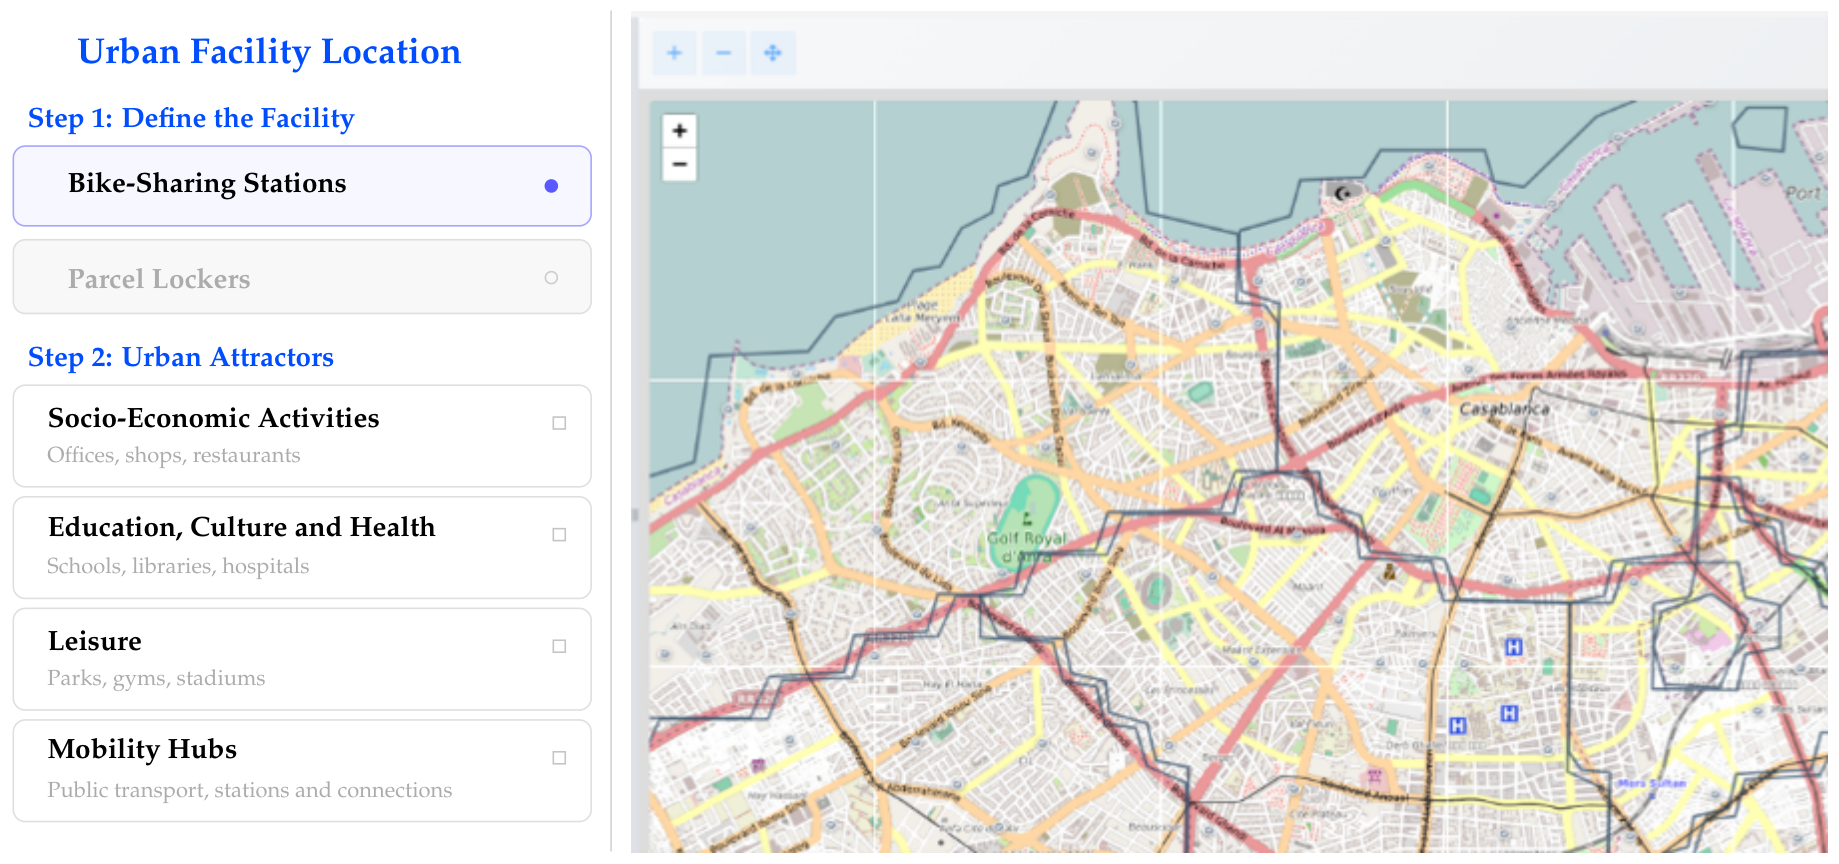
The interface enables users to choose the type of urban facility to be located, activate relevant attractor families, adjust parameters such as attractor weights, coverage radius, and target coverage, and visualize the corresponding demand and candidate-site layers. Figure 8 illustrates the map-centered interface. Model outputs can then be compared through their mapped station configuration, achieved mobility-potential coverage, and distribution among arrondissements. The interface, therefore, supports comparison of preliminary spatial scenarios; implementation decisions require subsequent economic evaluation, local mobility validation, and field assessment.
Figure 8.
Spatial scenario-exploration interface.
6.4. Model Implementation
The cleaned layers enter the model in six stages. First, the 300 m grid is clipped to the study boundary and candidate centroids in unusable areas are removed. Second, candidates, attractors, and population centroids are attached to the pedestrian network; shortest-path distances from each retained candidate to the nearest feature in every attractor category are then converted to 300 m proximity scores. Third, the weighted scores are aggregated and normalized. Fourth, population cells are allocated probabilistically to candidates reachable within 1000 m on the walking network through the modified Huff model, producing candidate-grid mobility potentials. Fifth, the same network-distance catchments enter the location–allocation model, which selects the smallest network satisfying . Finally, selected grid centroids are checked and moved, where necessary, to nearby operationally feasible road or cycling-network locations.
Because the population inputs are strongly concentrated in eastern Casablanca, the same minimum weighted-coverage requirement is imposed separately in each of the 16 arrondissements. All candidate stations are, nevertheless, considered together, and a station may cover any weighted demand zone located within its 1000-m walking-network radius, including a zone across an administrative boundary. This preserves territorial balance without duplicating stations near arrondissement borders. In the reported experiments, is used as the baseline, whereas takes values of 0.6, 0.8, and 1.0. The sensitivity design evaluates from 0 to 2 in increments of 0.05. Each attractor weight is also varied independently by , after which the complete vector is renormalized to sum to one. These tests assess robustness to modeling assumptions and do not constitute empirical calibration.
7. Results
7.1. Coverage-Constrained Station Requirements
Table 3 summarizes the station requirements and achieved mobility-potential coverage for the three policy targets. Detailed arrondissement-level results are reported in Appendix A.2, Table A2. The model meets or exceeds the prescribed target in every arrondissement. Because station decisions are binary and a selected station covers all eligible demand points within its catchment, achieved coverage can exceed the threshold.
Table 3.
Coverage-constrained station-siting outcomes using walking-network distances, a 1000-m access radius, and .
Using shortest-path walking-network distances, the scenario requires 45 stations across the 16 arrondissements, equivalent to 2.81 stations per arrondissement on average. Achieved coverage ranges from 60.42% to 75.57%, with an unweighted mean of 63.38%. The overshoot in some arrondissements results from discrete station decisions: a selected station covers all eligible demand points reachable within its 1000-m network catchment, including demand located across an administrative boundary.
Raising the target to increases the network to 70 stations, or 4.38 stations per arrondissement. This adds 25 stations relative to the 60% scenario. Achieved coverage ranges from 80.07% to 85.89%, with a mean of 82.26%.
Full coverage requires 154 stations, adding 84 stations relative to the solution and corresponding to an average of 9.63 stations per arrondissement. The largest numbers of selected stations occur in Ain Chok (33 stations), Hay Hassani (28), and Sidi Moumen (21). The sharp increase arises where the final uncovered demand points are spatially dispersed and cannot share a 1000-m walking-network catchment. The full-coverage solution is, therefore, interpreted as a theoretical upper bound rather than an operational recommendation.
7.2. Sensitivity to Distance Decay and Attractor Weights
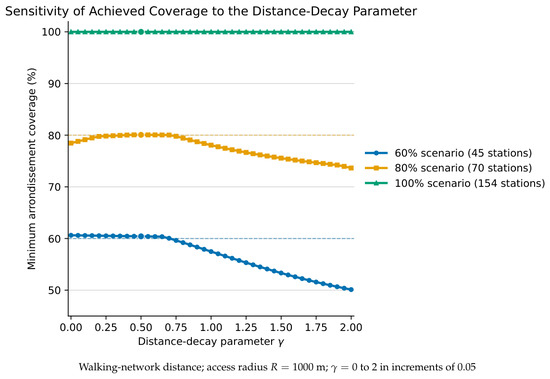
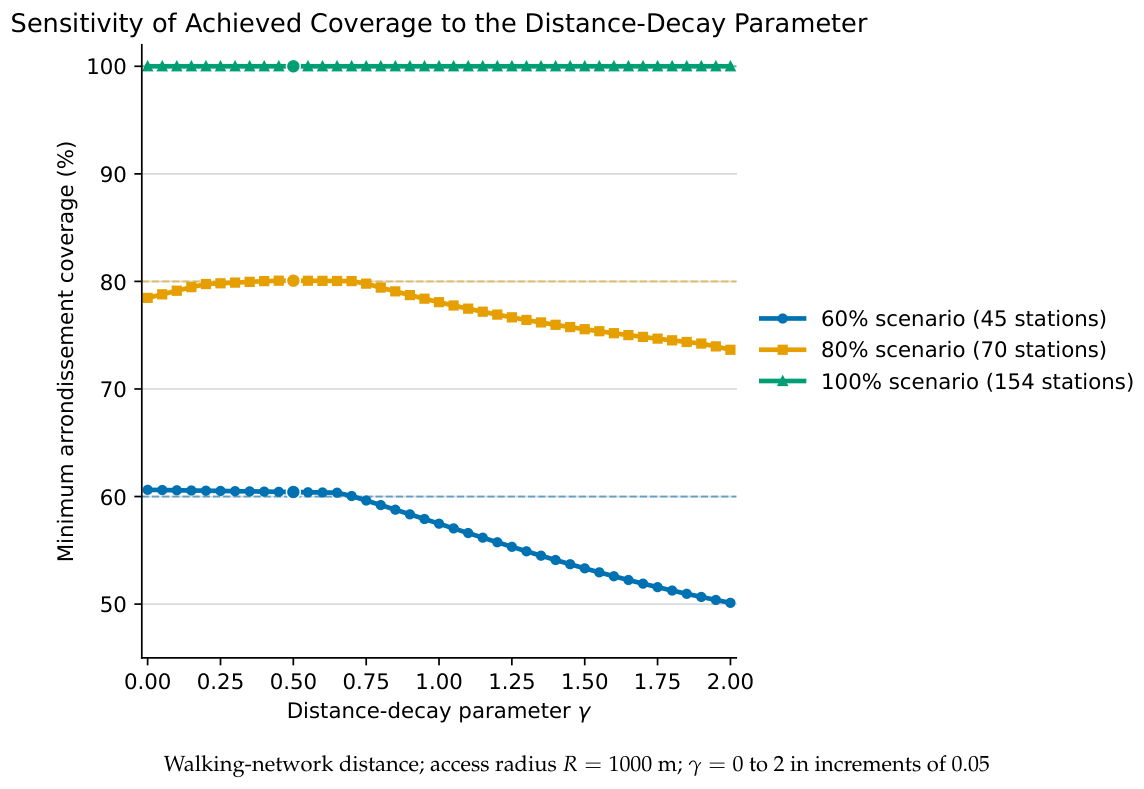
The distance-decay parameter was varied from to 2 in increments of 0.05 while holding the 300-m attractor threshold, the 1000-m walking-network access radius, the attractor weights, and all other inputs constant. Figure 9 evaluates the final station configurations under the resulting mobility-potential distributions. Across the tested values, minimum arrondissement coverage ranges from 50.12% to 60.63% for the 45-station scenario and from 73.65% to 80.07% for the 70-station scenario, while the 154-station configuration maintains 100% coverage. At the baseline , every arrondissement satisfies its prescribed target. These results show that the selected spatial configuration is more sensitive to than the aggregate number of stations alone and reinforce the need for calibration with local observations.
Figure 9.
Sensitivity to the distance-decay parameter.
Weight robustness was examined by independently decreasing and increasing each attractor weight by 20%, followed by renormalization of the complete vector. Across the 20 perturbations, Spearman correlation between baseline and perturbed candidate-suitability rankings ranges from 0.99985 to 1.00000. The overlap in the highest-suitability decile ranges from 94.6% to 100%. These results indicate local robustness to moderate one-at-a-time weight changes; they do not replace empirical calibration using observed travel or pilot-use data.
7.3. Spatial Pattern of the 60% Scenario
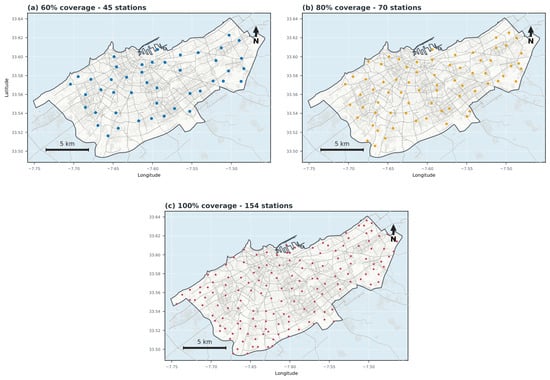
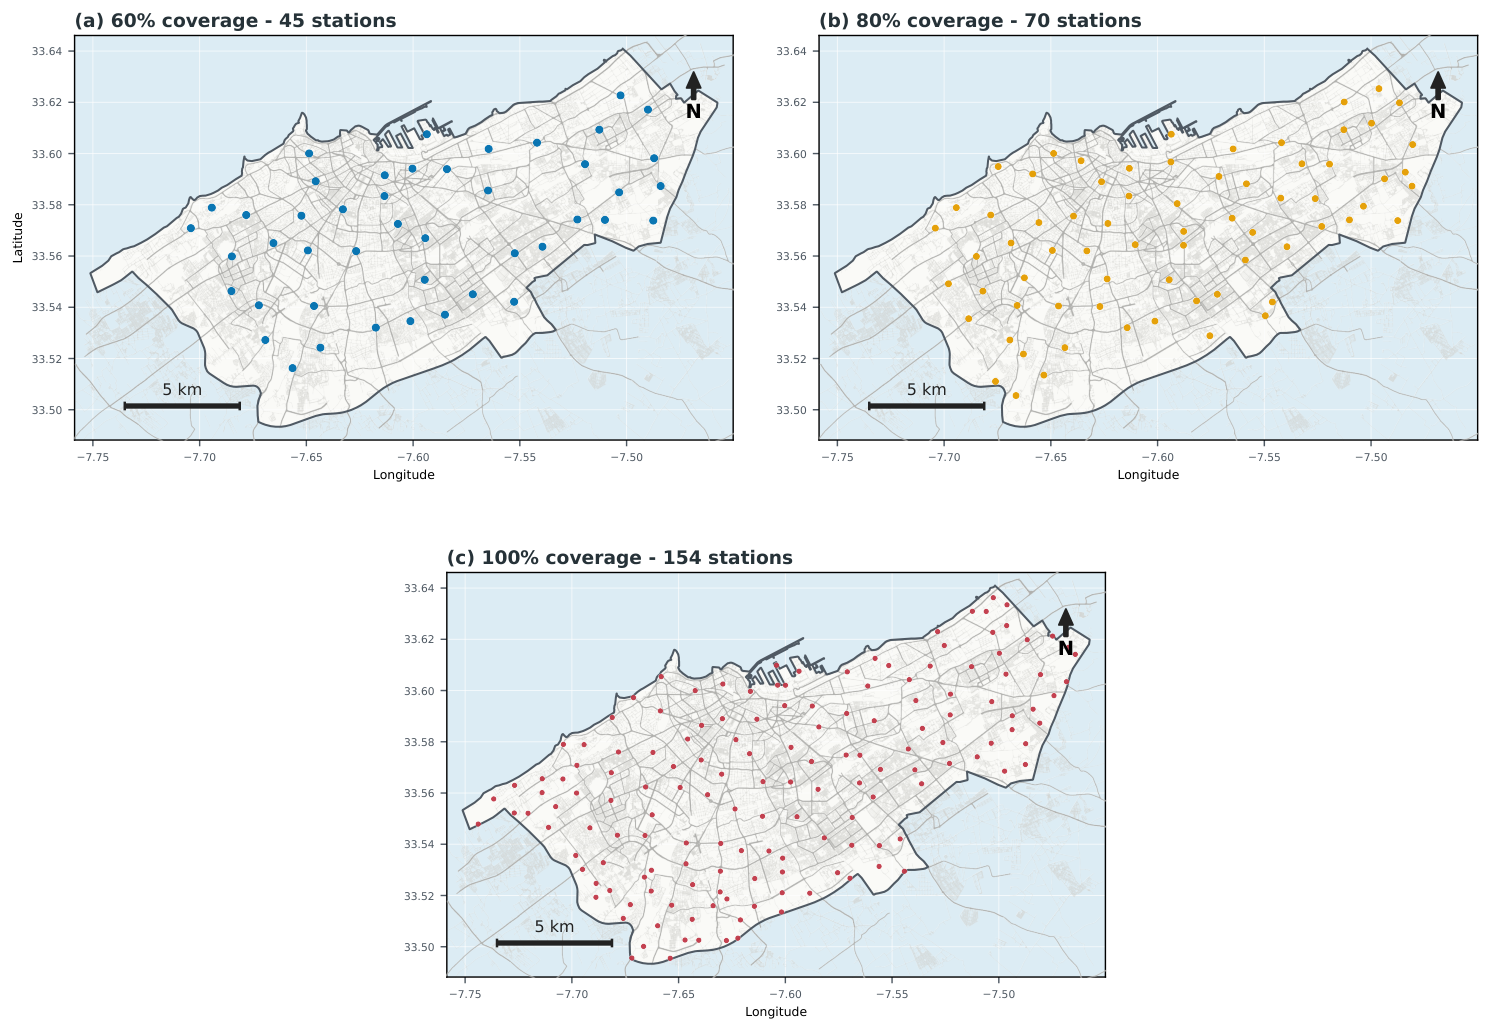
The solution is non-uniform across arrondissements. The set-covering objective favours candidates that cover the greatest mobility potential per installed station. Ben M’Sick reaches 62.46% coverage through stations located in neighboring arrondissements and, therefore, does not require a station within its own boundary. Al Fida, Hay Mohammadi, Mers Sultan, Moulay Rachid, and Sbata each contain one selected station, whereas Ain Chok and Hay Hassani each contain seven and Sidi Moumen contains six. The minimum-coverage constraints preserve territorial balance, while allowing stations near boundaries to serve demand on both sides. Figure 10 maps the complete selected-station configurations for the three coverage targets. The mapped points are model-selected candidate locations subject to field validation.
Figure 10.
Selected station locations by coverage target.
8. Discussion
8.1. Planning Implications
The Casablanca application illustrates why station planning should combine population distribution with the functional geography of the city. Population identifies where potential users are located, whereas attractors describe where recurrent activities and intermodal exchanges are concentrated. A population-only design could overlook activity locations that generate substantial daytime or transfer-related demand; conversely, an attractor-only design could favor activity clusters without adequately serving residential demand. The modified Huff formulation links these complementary dimensions while accounting for distance decay and competition among candidate stations.
The scenario comparison reveals a strongly nonlinear infrastructure–coverage relationship. Moving from 60% to 80% coverage adds 25 stations, whereas closing the final 20 percentage points adds 84 more. The 80% solution of 70 stations is, therefore, a more defensible medium-term planning scenario than the 154-station full-coverage solution, which is a theoretical service-equity bound under the model assumptions. Choosing a preferred target still requires explicit information on capital cost, operating cost, bicycle fleet size, and the social value of serving low-potential peripheral demand. Coverage overshoot also shows why the achieved percentage should be reported alongside the nominal target.
Imposing the minimum coverage requirement separately for each arrondissement prevents eastern population concentrations from dominating the allocation and guarantees the same minimum service requirement throughout Casablanca. At the same time, allowing a station to cover nearby demand across an administrative boundary avoids unnecessary duplication near arrondissement borders. This provides territorial balance without requiring equal station counts. The objective remains efficiency-oriented and does not guarantee uniform access among neighborhoods or population groups.
8.2. Limitations and Validation Priorities
The results depend on the completeness and positional accuracy of volunteered OSM data. Categories with relatively few observations, such as libraries, stadiums, and shopping malls, may reflect both the actual urban structure and differences in mapping completeness. The sensitivity tests show that minimum arrondissement coverage changes across the tested values of , whereas candidate-suitability rankings remain stable under the one-at-a-time weight perturbations. Neither the category weights nor the baseline should be interpreted as universally or empirically calibrated values. Local surveys, observed pedestrian flows, or pilot bike-sharing data remain necessary for behavioral calibration. The exact weight vector is disclosed in Appendix A, Table A1, and the processed data and code are identified in the Data Availability Statement.
The demographic layers refer to different years and functions: the 2018 WorldPop raster provides a spatial allocation surface, whereas the 2024 HCP total provides current descriptive context. The 304-point, 1 km population grid may conceal substantial within-cell variation. The results remain sensitive to OSM network completeness, permitted road classifications, and the attachment of off-network points to network nodes. The walking network represents access to stations; a cycling network would be more appropriate for modeling bicycle trips between origin and destination stations when reliable flow data become available. Before implementation, shortlisted locations require field verification of space, visibility, safety, land ownership, and compatibility with public-transport operations.
Administrative boundaries are used only to impose the minimum coverage requirement in each arrondissement. They do not restrict a station’s 1000-m walking-network catchment, which may cover nearby demand in a neighboring arrondissement. This treatment reduces duplication near district edges while preserving the intended geographic balance.
Because Casablanca does not yet provide historical station-based bike-sharing observations for calibration, the framework estimates potential rather than observed demand. Validation should, therefore, proceed through comparison with household travel surveys or other local mobility observations where accessible; sensitivity tests for weights, thresholds, and ; expert review by local transport authorities; and monitoring data from a pilot deployment.
9. Conclusions
This study presents an attractor-based framework for planning station-based bike sharing. The approach combines 304 gridded population demand points, 1340 functional urban attractors, 2584 retained candidate locations, a modified Huff model, and a minimum set-covering formulation. A separate minimum-coverage constraint for each of Casablanca’s 16 arrondissements prevents the city’s eastern population concentration from dominating the allocation, while stations may serve demand across administrative boundaries.
With shortest-path walking-network distances and a 1000-m access radius, the model selects 45 stations for , 70 for , and 154 for full coverage at the baseline . Sensitivity tests over –2 show that minimum arrondissement coverage changes with the assumed distance decay, while moderate one-at-a-time weight perturbations preserve the candidate-suitability ranking. The 154-station result should be viewed as a theoretical upper bound; the 45- and 70-station solutions provide more realistic phased planning scenarios. The principal contribution is both methodological and empirical: commonly available spatial data are converted into transparent potential-demand measures and linked to a station-location model that exposes the trade-off between network size, territorial balance, and coverage. Future work should calibrate the model using local mobility observations and field-validate the selected locations.
As a future extension, the framework could incorporate an origin–destination (OD) matrix to represent passenger flows between spatial zones. Each matrix cell would record the number of passenger trips from one zone to another during a defined period. If reliable flow data become available, they could complement the population and attractor layers, support calibration of the demand model, and help evaluate whether proposed stations serve the main passenger movements between residential areas, public-transport hubs, and activity locations. This extension would allow station placement to reflect both the intensity and direction of passenger flows.
Supplementary Materials
The following supporting information can be downloaded at https://www.mdpi.com/article/10.3390/technologies14100605/s1: Dataset S1, Casablanca administrative-boundary shapefile; Dataset S2, urban-attractor source data (1344 records, of which 1340 remained after cleaning); Dataset S3, population-point source data (305 records, of which 304 were retained after spatial filtering); and Dataset S4, candidate-centroid source data (2596 feasible centroids, of which 2584 had complete arrondissement identifiers and entered the optimization).
Author Contributions
Conceptualization, O.D. and F.R.; methodology, O.D.; software, O.D.; validation, S.B. and F.R.; formal analysis, O.D.; investigation, O.D.; resources, F.R.; data curation, O.D.; writing—original draft preparation, O.D.; writing—review and editing, S.B., F.R. and A.A.E.C.; visualization, O.D.; supervision, F.R. and A.A.E.C.; project administration, F.R. All authors have read and agreed to the published version of the manuscript.
Funding
This research was supported by the MILEX Project (Mobilité Intelligente et Logistique Urbaine Durable pour une Meilleure Expérience des Usagers de la Ville), supported within the APRD framework by Fondation OCP and Université Mohammed VI Polytechnique (UM6P), and by the PHC Toubkal Programme, a Morocco–France mobility and collaboration programme administered by Campus France (project no. 50000NF).
Institutional Review Board Statement
Not applicable. This study uses aggregate and publicly available geospatial data and does not involve human or animal participants.
Informed Consent Statement
Not applicable.
Data Availability Statement
The source data used in this study are publicly available from OpenStreetMap and WorldPop. The full attractor-weight vector is reported in Appendix A, Table A1. The processed administrative, attractor, population, and candidate layers; the processed pedestrian graph and metadata; selected-station coordinates; and sensitivity outputs are provided with the resubmission as Supplementary Materials. The analysis code is available from the corresponding author upon reasonable request.
Acknowledgments
The authors gratefully acknowledge the support of the MILEX Project and thank Hafsa Hdoufane for her contribution during her internship.
Conflicts of Interest
The authors declare no conflicts of interest.
Abbreviations
The following abbreviations are used in this manuscript:
| BSS | Bike-Sharing System |
| DBSS | Dockless Bike-Sharing System |
| SBSS | Station-Based Bike-Sharing System |
| GIS | Geographic Information System |
| MCDM | Multi-Criteria Decision-Making |
| APRD | Appel à Projets de Recherche et Développement |
| OSM | OpenStreetMap |
| OD | Origin–Destination |
| PDGC | Plan de Déplacements Urbains du Grand Casablanca |
| SDAU | Schéma Directeur d’Aménagement Urbain |
| CESE | Conseil économique, social et environnemental |
| HCP | Haut-Commissariat au Plan |
Appendix A. Supporting Model Details and Arrondissement-Level Results
Appendix A.1. Attractor Weights
Table A1 reports the complete weight vector used to calculate candidate-station suitability.
Table A1.
Attractor weights used to calculate candidate-station suitability.
Appendix A.2. Detailed Arrondissement-Level Station-Siting Results
Table A2 provides the complete arrondissement-level results underlying the summary reported in Table 3.
Table A2.
Arrondissement-level station-siting outcomes with minimum-coverage constraints, using walking-network distances, a 1000-m access radius, and .
References
- Shaheen, S.A.; Bansal, A.; Chan, N.; Cohen, A. Mobility and the Sharing Economy: Industry Developments and Early Understanding of Impacts. In Low Carbon Mobility for Future Cities: Principles and Applications; Institution of Engineering and Technology: Stevenage, UK, 2017; pp. 213–240. [Google Scholar] [CrossRef] [Scilit]
- Sun, Y.; Mobasheri, A.; Hu, X.; Wang, W. Investigating Impacts of Environmental Factors on the Cycling Behavior of Bicycle-Sharing Users. Sustainability 2017, 9, 1060. [Google Scholar] [CrossRef] [Scilit]
- Heinen, E.; Van Wee, B.; Maat, K. Commuting by Bicycle: An Overview of the Literature. Transp. Rev. 2010, 30, 59–96. [Google Scholar] [CrossRef] [Scilit]
- The Meddin Bike-Sharing World Map. 2026. Available online: https://bikesharingworldmap.com/ (accessed on 20 July 2026).
- Commission Chargée de l’Environnement et du Développement Durable. Avis sur la Mobilité Durable: Vers des Moyens de Transport Durables et Accessibles; Technical Report; Conseil Economique, Social et Environnemental: Rabat, Morocco, 2021. [Google Scholar]
- Pourrahmani, E.; Jaller, M. Crowdshipping in Last Mile Deliveries: Operational Challenges and Research Opportunities. Socio-Econ. Plan. Sci. 2021, 78, 101063. [Google Scholar] [CrossRef] [Scilit]
- DeMaio, P. Bike-sharing: History, Impacts, Models of Provision, and Future. J. Public Transp. 2009, 12, 41–56. [Google Scholar] [CrossRef] [Scilit]
- Fishman, E. Bikeshare: A Review of Recent Literature. Transp. Rev. 2016, 36, 92–113. [Google Scholar] [CrossRef] [Scilit]
- Eren, E.; Uz, V.E. A Review on Bike-Sharing: The Factors Affecting Bike-Sharing Demand. Sustain. Cities Soc. 2020, 54, 101882. [Google Scholar] [CrossRef] [Scilit]
- Liu, J.; Li, Q.; Qu, M.; Chen, W.; Yang, J.; Xiong, H.; Zhong, H.; Fu, Y. Station Site Optimization in Bike Sharing Systems. In Proceedings of the 2015 IEEE International Conference on Data Mining, Atlantic City, NJ, USA, 14–17 November 2015; pp. 883–888. [Google Scholar] [CrossRef] [Scilit]
- ReVelle, C.S.; Swain, R.W. Central Facilities Location. Geogr. Anal. 1970, 2, 30–42. [Google Scholar] [CrossRef] [Scilit]
- Bahadori, M.S.; Gonçalves, A.B.; Moura, F. A Systematic Review of Station Location Techniques for Bicycle-Sharing Systems Planning and Operation. ISPAS Int. J.-Geo-Inf. 2021, 10, 554. [Google Scholar] [CrossRef] [Scilit]
- Loidl, M.; Witzmann-Müller, U.; Zagel, B. A Spatial Framework for Planning Station-Based Bike Sharing Systems. Eur. Transp. Res. Rev. 2019, 11, 9. [Google Scholar] [CrossRef] [Scilit]
- Banerjee, S.; Kabir, M.M.; Khadem, N.K.; Chavis, C. Optimal Locations for Bikeshare Stations: A New GIS Based Spatial Approach. Transp. Res. Interdiscip. Perspect. 2020, 4, 100101. [Google Scholar] [CrossRef] [Scilit]
- Wuerzer, T.; Mason, S.; Youngerman, R. Boise Bike Share Location Analysis. In Community and Regional Planning; Boise State University: Boise, ID, USA, 2012; pp. 1–13. [Google Scholar]
- Çetinkaya, C. Bike Sharing Station Site Selection for Gaziantep. Sigma J. Eng. Nat. Sci. 2017, 35, 535–543. [Google Scholar]
- Kabak, M.; Erbaş, M.; Çetinkaya, C.; Özceylan, E. A GIS-Based MCDM Approach for the Evaluation of Bike-Share Stations. J. Clean. Prod. 2018, 201, 49–60. [Google Scholar] [CrossRef] [Scilit]
- Faghih-Imani, A.; Eluru, N.; El-Geneidy, A.M.; Rabbat, M.; Haq, U. How Land-Use and Urban Form Impact Bicycle Flows: Evidence from the Bicycle-Sharing System (BIXI) in Montreal. J. Transp. Geogr. 2014, 41, 306–314. [Google Scholar] [CrossRef] [Scilit]
- Frade, I.; Ribeiro, A. Bike-Sharing Stations: A Maximal Covering Location Approach. Transp. Res. Part A Policy Pract. 2015, 82, 216–227. [Google Scholar] [CrossRef] [Scilit]
- Nikiforiadis, A.; Aifadopoulou, G.; Grau, J.M.S.; Boufidis, N. Determining the Optimal Locations for Bike-Sharing Stations: Methodological Approach and Application in the City of Thessaloniki, Greece. Transp. Res. Procedia 2021, 52, 557–564. [Google Scholar] [CrossRef] [Scilit]
- Huff, D.L. A Probabilistic Analysis of Shopping Center Trade Areas. Land Econ. 1963, 39, 81–90. [Google Scholar] [CrossRef] [Scilit]
- Huff, D.L. Parameter Estimation in the Huff Model. ArcUser, October–December 2003; pp. 34–36.
- Lin, J.R.; Yang, T.H. Strategic Design of Public Bicycle Sharing Systems with Service Level Constraints. Transp. Res. Part E Logist. Transp. Rev. 2011, 47, 284–294. [Google Scholar] [CrossRef] [Scilit]
- García-Palomares, J.C.; Gutiérrez, J.; Latorre, M. Optimizing the Location of Stations in Bike-Sharing Programs: A GIS Approach. Appl. Geogr. 2012, 35, 235–246. [Google Scholar] [CrossRef] [Scilit]
- Yang, L.; Chau, K.W.; Szeto, W.Y.; Cui, X.; Wang, X. Accessibility to Transit, by Transit, and Property Prices: Spatially Varying Relationships. Transp. Res. Part D Transp. Environ. 2020, 85, 102387. [Google Scholar] [CrossRef] [Scilit]
- Benhlima, O.; Riane, F.; Puchinger, J.; Bahi, H. Assessment of Spatial Accessibility to Public Hospitals in Casablanca by Car. Transp. Res. Procedia 2023, 72, 2976–2983. [Google Scholar] [CrossRef] [Scilit]
- Handy, S.L.; Niemeier, D.A. Measuring Accessibility: An Exploration of Issues and Alternatives. Environ. Plan. A 1997, 29, 1175–1194. [Google Scholar] [CrossRef] [Scilit]
- Ewing, R.; Cervero, R. Travel and the Built Environment. J. Am. Plan. Assoc. 2010, 76, 265–294. [Google Scholar] [CrossRef] [Scilit]
- Yang, Y.; Diez-Roux, A.V. Walking Distance by Trip Purpose and Population Subgroups. Am. J. Prev. Med. 2012, 43, 11–19. [Google Scholar] [CrossRef] [Scilit] [PubMed]
- Haut-Commissariat au Plan. Population Légale Selon les Résultats du Recensement Général de la Population et de l’Habitat 2024: Préfecture de Casablanca. 2024. Available online: https://www.hcp.ma/reg-casablanca/attachment/2863464/ (accessed on 21 July 2026).
- OpenStreetMap Contributors. OpenStreetMap. Data Licensed Under the Open Data Commons Open Database License. 2026. Available online: https://www.openstreetmap.org/copyright (accessed on 21 July 2026).
- WorldPop; Center for International Earth Science Information Network. Global High Resolution Population Denominators Project: Morocco, 2018. Available online: https://hub.worldpop.org/doi/10.5258/SOTON/WP00651 (accessed on 21 July 2026).

Disclaimer/Publisher’s Note: The statements, opinions and data contained in all publications are solely those of the individual author(s) and contributor(s) and not of MDPI and/or the editor(s). MDPI and/or the editor(s) disclaim responsibility for any injury to people or property resulting from any ideas, methods, instructions or products referred to in the content. |
© 2026 by the authors. Licensee MDPI, Basel, Switzerland. This article is an open access article distributed under the terms and conditions of the Creative Commons Attribution (CC BY) license.